Embed Size (px)
Citation preview

THE LIE DETECTORTHE LIE DETECTOR
Tim FleckTim Fleck
Mike GruenerMike Gruener
Brian HalaburkaBrian Halaburka
Chris MoskaitesChris Moskaites
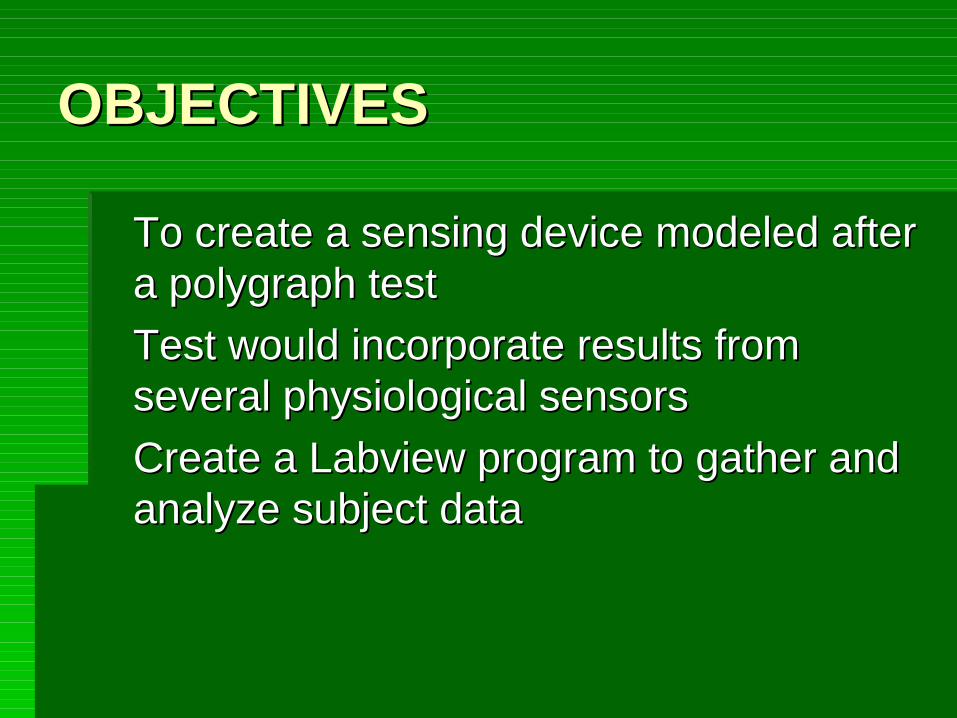
OBJECTIVESOBJECTIVES
To create a sensing device modeled after To create a sensing device modeled after a polygraph testa polygraph test
Test would incorporate results from Test would incorporate results from several physiological sensorsseveral physiological sensors
Create a Labview program to gather and Create a Labview program to gather and analyze subject dataanalyze subject data

POLYGRAPH THEORYPOLYGRAPH THEORY
Polygraphs measure:Polygraphs measure:Heart rateHeart rateRespiratory rateRespiratory rateBlood pressureBlood pressureArm and leg motionArm and leg motionElectrodermal activityElectrodermal activity

INITIAL IDEASINITIAL IDEAS
Use real world polygraphs as design Use real world polygraphs as design modelsmodels
Assemble a polygraph which monitors Assemble a polygraph which monitors heart rate, breathing rate and heart rate, breathing rate and electrodermal activityelectrodermal activity
Create a Labview program which would Create a Labview program which would self-analyze data and “detect” deceptive self-analyze data and “detect” deceptive behaviorbehavior

FINAL LIE DETECTORFINAL LIE DETECTOR
Incorporates two physiological sensors Incorporates two physiological sensors detecting two phenomenondetecting two phenomenon
1)electrodermal activity1)electrodermal activity
2)motion2)motion
Self analyzes received dataSelf analyzes received data

DETECTOR LOGICDETECTOR LOGIC
Subject
Electrodermal Sensor/Motion Sensor
DAQ New Data
LABVIEW/CPU
Display Results

SENSORSSENSORS
Electrocardiogram or EKGElectrocardiogram or EKG
Galvanic Skin Response SensorGalvanic Skin Response Sensor

ELECTROCARDIOGRAMELECTROCARDIOGRAM
Measures the Measures the electrical activity of electrical activity of the heartthe heart
Determines hearts Determines hearts rate and rhythmrate and rhythm
Our project used it to Our project used it to measure motionmeasure motion

GALVANIC SKIN RESPONSE GALVANIC SKIN RESPONSE SENSORSENSOR
Senses moisture Senses moisture
Stand-alone unitStand-alone unit
Produces noiseProduces noise
Frequency was too Frequency was too fast for the DAQ fast for the DAQ

CREATED SKIN SENSORCREATED SKIN SENSOR
Based off the idea Based off the idea that skin resistance that skin resistance decreases with decreases with moisturemoisture
Used a voltage Used a voltage difference circuitdifference circuit
Amplified the voltage Amplified the voltage difference to obtain difference to obtain obvious resultsobvious results

LABVIEW LOGIC (EKG)LABVIEW LOGIC (EKG)
Take initial readings visually from the Take initial readings visually from the waveform graphwaveform graphCalibrate the high and low end of the Calibrate the high and low end of the threshold based on the initial readingsthreshold based on the initial readingsEvery question after will be compared to Every question after will be compared to the thresholdthe thresholdIf a person’s motions go above the If a person’s motions go above the threshold, a LED goes on, indicating a liethreshold, a LED goes on, indicating a lie

LABVIEW LOGIC (GSR)LABVIEW LOGIC (GSR)
Takes voltage readings of subject’s fingers Takes voltage readings of subject’s fingers until button is pusheduntil button is pushedThen it computes and displays and average Then it computes and displays and average voltage for the given time periodvoltage for the given time periodDisplays a waveform chart showing how much Displays a waveform chart showing how much the subject’s voltage is increasing from the the subject’s voltage is increasing from the average as resistance decreasesaverage as resistance decreasesIf the in average increase goes above a certain If the in average increase goes above a certain predetermined value, a light goes on, indicating predetermined value, a light goes on, indicating a lie a lie

DATADATA
Thresholds were determined by Thresholds were determined by analyzing results gathered from group analyzing results gathered from group testingtesting
Normalized against predetermined Normalized against predetermined valuesvalues
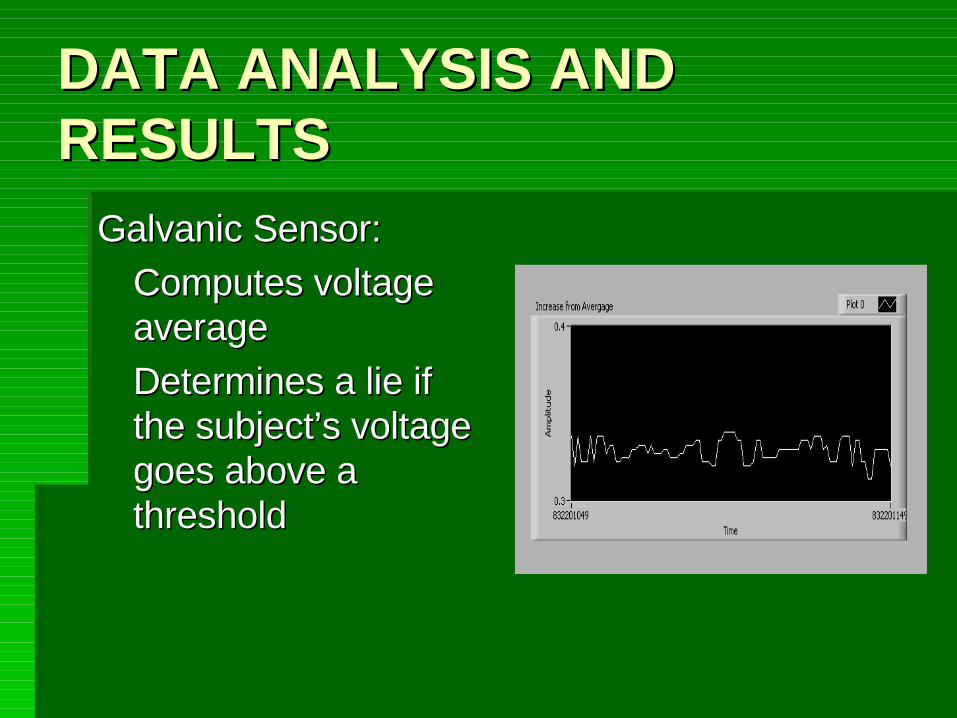
DATA ANALYSIS AND DATA ANALYSIS AND RESULTSRESULTS
Galvanic Sensor:Galvanic Sensor:
Computes voltage Computes voltage averageaverage
Determines a lie if Determines a lie if the subject’s voltage the subject’s voltage goes above a goes above a thresholdthreshold
DATA ANALYSIS AND DATA ANALYSIS AND RESULTSRESULTS
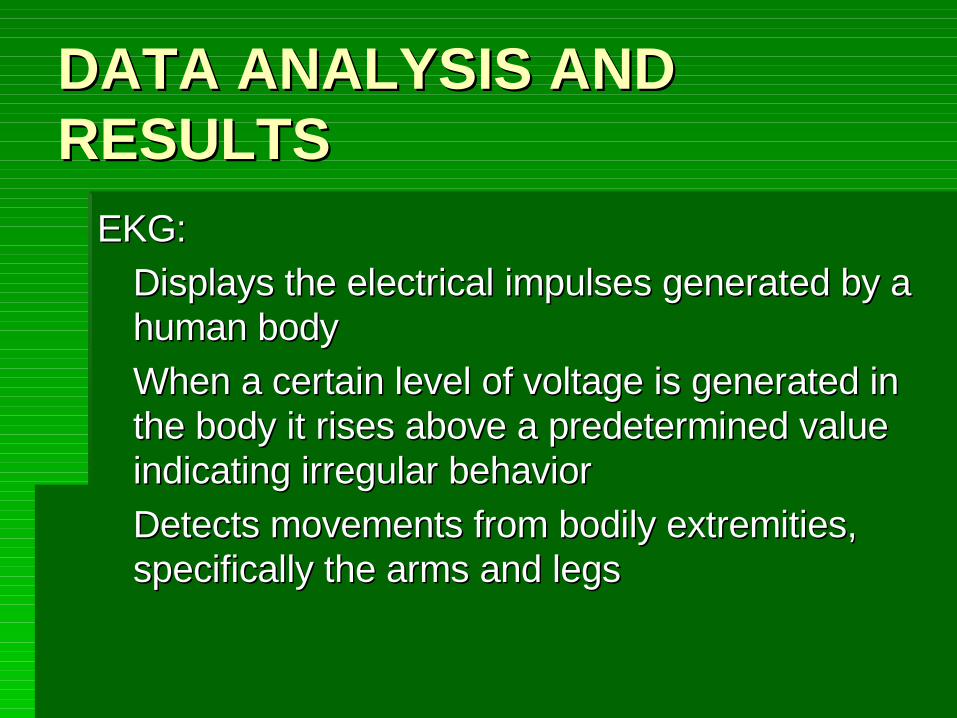
EKG:EKG:
Displays the electrical impulses generated by a Displays the electrical impulses generated by a human bodyhuman body
When a certain level of voltage is generated in When a certain level of voltage is generated in the body it rises above a predetermined value the body it rises above a predetermined value indicating irregular behaviorindicating irregular behavior
Detects movements from bodily extremities, Detects movements from bodily extremities, specifically the arms and legsspecifically the arms and legs
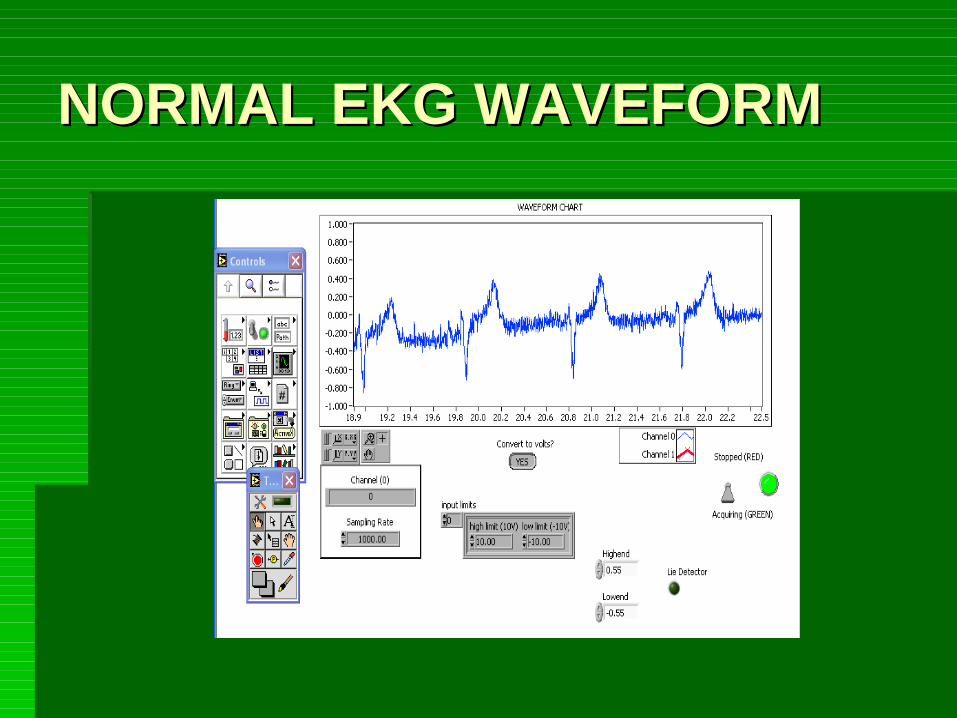
NORMAL EKG WAVEFORMNORMAL EKG WAVEFORM

DECEPTIVE WAVEFORMDECEPTIVE WAVEFORM

SOURCES OF ERRORSOURCES OF ERROR
Nervousness of test subjectNervousness of test subject
Calibration errorsCalibration errors

DifficultiesDifficulties
Heart Rate MonitorHeart Rate Monitor
Galvanic Skin ResponseGalvanic Skin Response
LABVIEWLABVIEW
Lab SetupLab Setup

CONCLUSIONSCONCLUSIONS
““Simple” circuitry increases in complexity Simple” circuitry increases in complexity once work beginsonce work begins
Check and recheck components before Check and recheck components before and after assemblyand after assembly
Start earlyStart early
Be flexible and constantly improveBe flexible and constantly improve