Embed Size (px)
Citation preview
The Liability of Foreignness in International Equity Investments:
Evidence from the U.S. Stock Market
Bok Baik, Jun-Koo Kang, Jin-Mo Kim, and Joonho Lee*
This draft: February 2013
* Baik is from the College of Business, Seoul National University, South Korea, Tel.: 82-2-880-2524, E-mail: [email protected]. Kang is from the Nanyang Business School, Nanyang Technological University, Singapore, Tel.: 65-6790-5662, E-mail: [email protected]. Kim is from the Rutgers Business School, Rutgers University, NJ, U.S.A., Tel.: 732-445-4236, E-mail: [email protected]. Lee is from the School of Accountancy, Singapore Management University, Singapore, Tel.: 65-6828-0984, E-mail: [email protected]. We thank two anonymous referees, Young Soon Cheon, and David Reeb (the editor) for many detailed and helpful comments. Baik, Kang, Kim, and Lee acknowledge financial supports from Seoul National University, Nanyang Technological University Academic Research Fund Tier 1, Rutgers Business School, and SMU School of Accountancy Research Center (SOAR), respectively.
The Liability of Foreignness in International Equity Investments: Evidence from the U.S. Stock Market
ABSTRACT Using foreign institutional ownership data in the U.S. from 1990 to 2007, we examine whether foreign institutional investors face liabilities of foreignness (LOF) in the U.S. stock market. We find that foreign institutional investors prefer low information asymmetry stocks more than domestic institutional investors and this preference for low information asymmetry stocks is particularly strong among foreign institutional investors from countries with high LOF. More important, we find that a change in foreign institutional ownership is negatively related to future returns, while this relation does not exist for domestic institutional ownership. The negative relation between the change in foreign institutional ownership and future returns is more pronounced when investors face a greater LOF in the U.S. stock market, for instance, when they are from countries with higher institutional distance, information asymmetry, unfamiliarity, and cultural differences. The negative effect of country-specific LOF factors on the return forecasting power of foreign institutional investors is more evident when they trade stocks with higher information asymmetry. Overall, these findings suggest that foreign institutional investors face significant LOF costs in the U.S. stock market, resulting in their poor ability to forecast returns. JEL Classification: G12, G14, G15, F21 Keywords: Foreign institutional ownership, Domestic institutional ownership, Liability of foreignness, Return predictability, Information asymmetry.
1
I. Introduction
The importance of foreign equity ownership in the U.S. has increased substantially in recent
years. For example, a 2008 Congressional Research Service report shows that in the U.S.,
foreign investors hold about 50% of publicly traded Treasury securities, 25% of corporate bonds,
and 12% of corporate stocks. Despite the importance of foreign equity ownership in the U.S.,
foreign investors’ investment behavior is not fully understood, possibly because of the lack of
data on security-level equity holdings by foreign investors. In particular, we know little about
what types of U.S. stocks foreign investors prefer, whether they face a disadvantage in trading
stocks in the U.S. market compared with domestic investors, and how this disadvantage, if it
exists, affects their stock-picking ability.
International business research documents that firms operating outside of their home
countries face significant disadvantages relative to local firms in the host countries due to high
costs associated with being foreign in host country markets, that is, due to the ‘liability of
foreignness’ (hereafter LOF) (Zaheer 1995; O'Grady and Lane 1996; Mezias 2002; Mata and
Freitas 2012). However, these studies focus mainly on LOF in product markets, paying little
attention to LOF in capital markets.1
In this paper, we attempt to fill this gap in the literature by examining LOF in host country
stock markets. We build upon previous research on LOF and extend the LOF literature to
international equity investments. Specifically, we examine the extent to which foreign
institutional investors face LOF in the host country stock market, the effects of LOF on foreign
1 Despite extensive evidence on the existence and sources of LOF in host country product markets, we are unaware of any research that examines the LOF of foreign institutional investors in host country stock markets. One notable exception is Bell, Filatotchev, and Rasheed (2012), who extend the LOF theory to foreign capital markets. They argue that since capital markets are more information sensitive than product markets, and capital market participants can rely on endorsements by third parties such as investment bankers and investment analysts for information production, the nature of LOF could be different between product and capital markets.
2
institutional investors’ stock-picking ability and stock holdings in such markets, and the main
sources of LOF costs in international equity investments. To address these questions, we use U.S.
equity holdings reported in the CDA/Spectrum Institutional 13F and examine whether the return
forecasting power of foreign institutional investors is affected by the LOF costs that they face in
the U.S. stock market, as measured by institutional distance, information asymmetry,
unfamiliarity, and cultural differences (Bell, Filatotchev, and Rasheed 2012).
The U.S. stock market has several advantages in studying LOF associated with international
equity investments. First, unlike some emerging markets that restrict foreign equity ownership to
a certain level, there is no such foreign ownership restriction in the U.S. (Stulz and Wasserfallen
1995).2 When a country imposes limits on foreign equity ownership, the estimate of shares held
by foreign investors may reflect the binding constraint on ownership rather than foreign
investors’ optimal choice, making it difficult to draw meaningful conclusions from the analysis.
Moreover, compared with foreign investors in other countries, those in the U.S. generally face
fewer investment barriers, which have long been recognized as significant impediments to
investment. Thus, the lack of an ownership limit and investment barriers makes the U.S.
particularly well suited to our investigation of LOF in a host country stock market.3
Second, the use of U.S. stock-level holdings data from the CDA/Spectrum Institutional 13F
allows us to examine the stock-picking ability of foreign institutional investors before expenses
2 For instance, Choe, Kho, and Stulz (1999) examine the information advantage of foreign money managers in Korea during a sample period in which foreign investors were not allowed to purchase more than 10% of a firm’s total shares outstanding. 3 There is a possible counter argument that the U.S. is not the optimal country to test LOF in host country stock markets because the U.S. market is among the most open markets in the world and thus the LOF would be fairly low in this market. Coval and Moskowitz (1999) and Ivkovic and Weisbenner (2005), however, show that domestic U.S. investors located near a firm’s headquarters have an informational advantage relative to other U.S. investors, suggesting that information asymmetries matter even for U.S. domestic investors.
3
and trading costs, which could provide new insights into the asset allocation and security
selection abilities of foreign institutional investors (Wermers 2006).
Using a large sample of 215,123 firm-quarter observations over the 1990 to 2007 period, we
find that the presence of foreign investors in the U.S. stock market has increased substantially
over the past two decades. While foreign institutional investors held only 0.5% of total equity
ownership in the U.S. in 1990, by 2007 foreign ownership had increased to almost 6.2%,
accounting for approximately 10% of total institutional ownership. We also find that foreign
institutional investors prefer low information asymmetry stocks more than matching domestic
institutional investors and this preference for low information asymmetry stocks is particularly
strong among foreign institutional investors from countries with high LOF. These results suggest
that foreign investors who face high LOF costs self-select into stocks with low information
asymmetry to reduce the costs associated with international equity investments.
More importantly, we find that the change in foreign institutional ownership is significantly
negatively related to future returns while the change in domestic institutional ownership is not.
We also find that the negative relation between the change in foreign institutional ownership and
future returns is particularly evident when foreign investors are from weak investor protection
countries, countries whose accounting standards differ significantly from those of the U.S.,
geographically remote countries, and non-English speaking countries. These findings support
Bell, Filatotchev, and Rasheed (2012), who argue that institutional distance, information
asymmetry, unfamiliarity, and cultural differences are important sources of the liabilities that
foreign institutions face in host country stock markets. Moreover, the negative relation between
the change in foreign institutional ownership and future returns is particularly strong for stocks
4
with greater information asymmetries, further supporting the LOF view of foreign investors in
host country stock markets.
Our study contributes to the literature in several ways. First, we extend the literature on LOF
(Demirbag, Tatoglu, and Glaister 2010; Qian, Li, Li, and Qian 2008) beyond the product market
domain by documenting the existence of LOF in host country stock markets and identifying the
main sources of LOF in these markets. Second, we extend the literature on the investment
behavior of foreign investors and their performance (Grinblatt and Keloharju 2001; Choe, Kho,
and Stulz 2005) by showing that the ability of foreign institutions to predict stock returns is
inferior to that of domestic institutions. Unlike other studies (e.g., Shukla and van Inwegen
1995), we use firm-level dataset of foreign portfolio equity holdings in the U.S. to examine the
stock-picking ability of foreign institutional investors. Finally, our study is closely related to
prior literature examining the stock-picking abilities of institutional investors (Bushee 1998; Yan
and Zhang 2009; Baik, Kang, and Kim 2010) and contributes to the ongoing debate over whether
institutional investors have an advantage in stock investments.
The remainder of this paper is organized as follows. Section II reviews the literature and
presents testable hypotheses. Section III discusses the data and provides summary statistics. In
Section IV we provide empirical evidence on the determinants of foreign and domestic
institutional ownership. In Section V we investigate the relation between the levels of and
changes in foreign and domestic institutional ownership and future stock returns. Section VI
presents results from the tests of sources of LOF cost and Section VII provides results from
robustness tests. Finally, we present a summary and concluding remarks in Section VIII.
II. Main Hypotheses
5
In this section, we develop the hypotheses regarding how the liabilities faced by foreign
investors in the U.S. stock market and the main sources of these liabilities affect their return
forecasting ability in that market. The literature on LOF posits that foreign institutions incur
additional costs in collecting value-relevant information about local firms due to their
unfamiliarity with the local environment and their lack of knowledge about host country capital
markets (Kindleberger 1969; Hymer 1976). Compared with domestic institutions, foreign
institutions are also likely to face more liabilities associated with their ability to acquire or
process information about firms in the host country due to language barriers and lack of
knowledge about host country accounting systems. For example, Grinblatt and Keloharju (2001)
show that language barriers can adversely affect communication between foreign investors and
firm management, and Bradshaw, Bushee, and Miller (2004) and Khurana and Michas (2011)
find that foreign investors’ ability to assess stock prospects is limited due to their lack of
knowledge about accounting systems in the host country. As a result of these LOF costs faced by
foreign institutions in the host country stock markets, foreign institutions are at a disadvantage
and likely have reduced stock-picking and return forecasting abilities. This leads to our first
hypothesis on the LOF view of foreign institutional investors in host country stock markets:
H1: Foreign institutions’ return forecasting ability is lower than that of domestic institutions.
Next, we predict that the return forecasting power of foreign institutional investors depends
on the extent of LOF inherent in their home country-specific characteristics. Following Bell,
Filatotchev, and Rasheed (2012), we use institutional distance, information asymmetry,
6
unfamiliarity, and cultural differences as the main sources of liabilities faced by foreign
institutions.
Since it is difficult for foreign investors to undertake profitable international equity
investments in an unfamiliar and new legal environment, the difference in legal rules can
constrain foreign investors’ stock picking ability and performance. Consistent with this view,
Chan, Covrig, and Ng (2009) show that differences in legal frameworks concerning accounting
systems and investor protection affect stock holdings of foreign institutional investors. La Porta,
Lopez-de-Silanes, Shleifer, and Vishny (LLSV 1997, 1998) also show that differences in legal
system supporting investor protection explain differences in capital market regulations and
development, suggesting that differences in legal system are an important source of the LOF
costs faced by foreign investors. Accounting literature further suggests that GAAP rules can be a
source of LOF in host country stock markets. For example, Bradshaw, Bushee, and Miller (2004)
show that U.S. institutional investors prefer foreign firms with accounting rules that conform
more closely to U.S. GAAP. These studies suggest that differences in legal environment and
accounting rules make it difficult for foreign institutions to properly evaluate firm prospects, and
thus foreign institutions from countries with weak investor protection or from countries with
different accounting rules compared with the U.S. are more likely to suffer from LOF in the U.S.
stock market. Accordingly, we use legal rules pertaining to investor protection and Generally
Accepted Accounting Principles (GAAP) in foreign investors’ home country to measure the
institutional distance between home and host countries. Detailed definitions for these variables
are provided in the appendix.
Another factor that can affect the extent of LOF is the extent of information costs that foreign
investors face in host country stock markets. To the extent that the differences in disclosure and
7
earnings quality between home and host countries affect foreign investors’ ability to interpret
financial statements and forecast U.S. firms’ future prospects, these differences likely affect their
stock picking ability. For example, foreign investors whose countries’ accounting rules are
different from those of the U.S. are likely to have difficulty in correctly assessing U.S. firms’
financial statements and accurately projecting their future financial prospects, which impose high
information search costs on them (Hopkins et al. 2008). Also, different disclosure regulations
and infrastructures in the U.S. may put foreign investors at a disadvantage in efficiently using
information at a low cost (Ferreira and Matos 2008). As measures of differences in disclosure
quality and earnings quality across countries, we use the index created by examining and rating
the annual reports of the companies of the corresponding country and the earnings quality score
estimated by Leuz, Nanda, and Wysocki (2003), respectively.
A third factor likely to contribute to the degree of LOF in stock markets is unfamiliarity.
Previous studies suggest that geographically proximate foreign institutions incur smaller
unfamiliarity costs than remote foreign institutions (Chan, Covrig, and Ng 2009; Coval and
Moskowitz 1999; Ivkovic and Weisbenner 2005; Kang and Stulz 1997).4 A foreign country’s
international trading exposure and experience may also affect investors’ unfamiliarity costs. In
particular, institutional investors from countries with more international trading exposure and
experience are likely to face smaller unfamiliarity costs than those from countries with less
international trading exposure and experience. Because a heavy export country presumably has
4 It is possible that information search costs do not necessarily increase with distance due to advances in information technology. However, prior studies suggest that the information advantages associated with distance can still exist even in the presence of advances in information technology. For example, geographically proximate investors are more likely to have informal access to information about local firms, through conversations with employees, managers, suppliers, and customers. They can also visit geographically proximate firms and meet CEOs of these firms face-to-face at lower cost. It is also possible that compared to remote investors, investors located near firms expend less time collecting information about their firms since they are on-the-spot. This value-relevant private information about the firm allows local investors to make informed trades.
8
better knowledge about other foreign countries as well as stronger connections with them, the
extent of a country’s exports may be a good proxy for institutional investors’ international
trading exposure and experience (Kang and Stulz 1997). Thus, we measure foreign institutions’
unfamiliarity with host country stock markets using the physical distance between their home
country and the host country and the home country’s exports to other countries.
A final factor likely to affect the degree of LOF in stock markets is cultural differences.
Cultural differences can make it hard for foreign investors to understand business practices and
corporate cultures in the host country, adversely affecting their ability to select stocks
(Beugelsdijk and Frijns 2010). As measures of cultural differences between home and host
countries, we use the cultural distance scores suggested by Kogut and Singh (1988) and a
dummy variable indicating whether the primary language of the foreign investor’s home country
is English (Grinblatt and Keloharju 2001).
We use these eight LOF variables to measure four types of LOF costs. However, since these
variables tend to be highly correlated with each other, including all of them in the same
regression can create the multicollinearity problem. To avoid this problem, we create the single
Composite LOF Factor using principal components analysis. We use this Composite LOF Factor
to capture the general level of LOF in host country stock markets. The arguments above on
country-specific LOF factors lead to the following hypothesis:
H2: Foreign institutions’ return forecasting ability is lower when they are from countries with a
greater degree of LOF.
9
The LOF view of foreign institutions in host country stock markets also suggests that the
adverse effects of country-specific LOF factors on foreign institutions’ return forecasting ability
differ across stocks with different levels of information asymmetry. To the extent that foreign
institutions face LOF in international stock markets and their ability to obtain value-relevant
private information about a stock is particularly low for firms with high information asymmetry,
the adverse effect of LOF costs on their return forecasting ability will be particularly pronounced
for firms with high information asymmetry. We therefore expect the negative effects of country-
specific LOF factors on foreign institutions’ return forecasting ability to be more evident for
stocks with high information asymmetry. Following prior literature, we measure firm-specific
information asymmetry using size, return volatility, analyst forecast dispersion, and R&D
intensity (Ivković and Weisbenner 2005; Baik, Kang, and Kim 2010). Using principal
components analysis, we also create a single information asymmetry factor. Information
asymmetry arguments at the security level lead to our third hypothesis:
H3: The negative effects of country-specific LOF factors on foreign institutions’ return
forecasting ability are particularly strong when foreign institutions invest in stocks with greater
information asymmetry.
Finally, we consider a fund-specific characteristic and examine whether institutions’ ability
to predict returns differs between foreign hedge funds and non-hedge funds. Previous studies
show that domestic hedge funds in the U.S. are better able to select undervalued stocks than
other types of institutions, because they have more resources and better access to expertise
(Brown, Goetzmann, and Ibbotson 1999; Brunnermeier and Nagel 2004). If foreign hedge funds
10
possess superior ability to choose stocks and this advantage allows them to reduce LOF costs, we
expect foreign hedge funds to face less LOF in stock markets than foreign non-hedge funds.
Accordingly, we expect that the return forecasting ability of foreign hedge funds is better than
that of foreign non-hedge funds. This argument leads to our final hypothesis:
H4: Foreign institutions’ poor return forecasting ability is less pronounced for foreign hedge
funds than foreign non-hedge funds.
III. Data and Summary Statistics
A. Data
Our initial sample comprises all firm-quarters over the period April 1, 1990 to December 31,
2007 with institutional ownership from CDA/Spectrum Institutional (13F) Holdings, which are
based on the SEC’s Form 13F.5
We match sample firms covered in CDA/Spectrum with firms covered in Compact
Disclosure to obtain the locations of firm headquarters. Since we focus on tests of the ability of
foreign institutional investors in the U.S. stock market to predict returns, we exclude cases in
which the firms are not located in the U.S. Information on the location of institutional investors’
headquarters comes from Nelson’s Directory of Investment Managers, Moody’s Bank and
Finance Manual, and SEC filings. We classify investors whose headquarters are located outside
the U.S. as foreign investors.
5 According to the SEC, foreign institutions are required to file Form 13F if they (1) use any means or instrumentality of U.S. interstate commerce in the course of their business, and (2) exercise investment discretion over $100 million or more in Section 13(f) securities. Since foreign investors have no way to buy U.S. stocks without using any means or instrumentality of U.S. interstate commerce, 13F filing requirements are likely to be equally binding for both foreign and domestic institutional investors. We thank an anonymous staff person at the SEC for the discussion on 13F filing requirements by foreign institutional investors.
11
Previous studies use the fund manager number (Id key = MGRNO) in CDA/Spectrum
Institutional (13F) Holdings as the institution identifier. We notice, however, that the fund
manager number is reassigned to a different institutional investor if the assigned investor
disappears. To identify cases in which the same fund manager number is assigned to different
institutional investors and to fully use them in the analysis, we track fund manager numbers and
name changes for all institutional investors during our sample period. We identify 257 foreign
fund managers in the 13F during the sample period. A firm’s stock return and financial data are
obtained from the Center for Research in Securities Prices (CRSP) and COMPUSTAT,
respectively. Finally, we obtain information on analyst following from I/B/E/S. Our final full
sample comprises 215,123 firm-quarters.
B. Descriptive Statistics
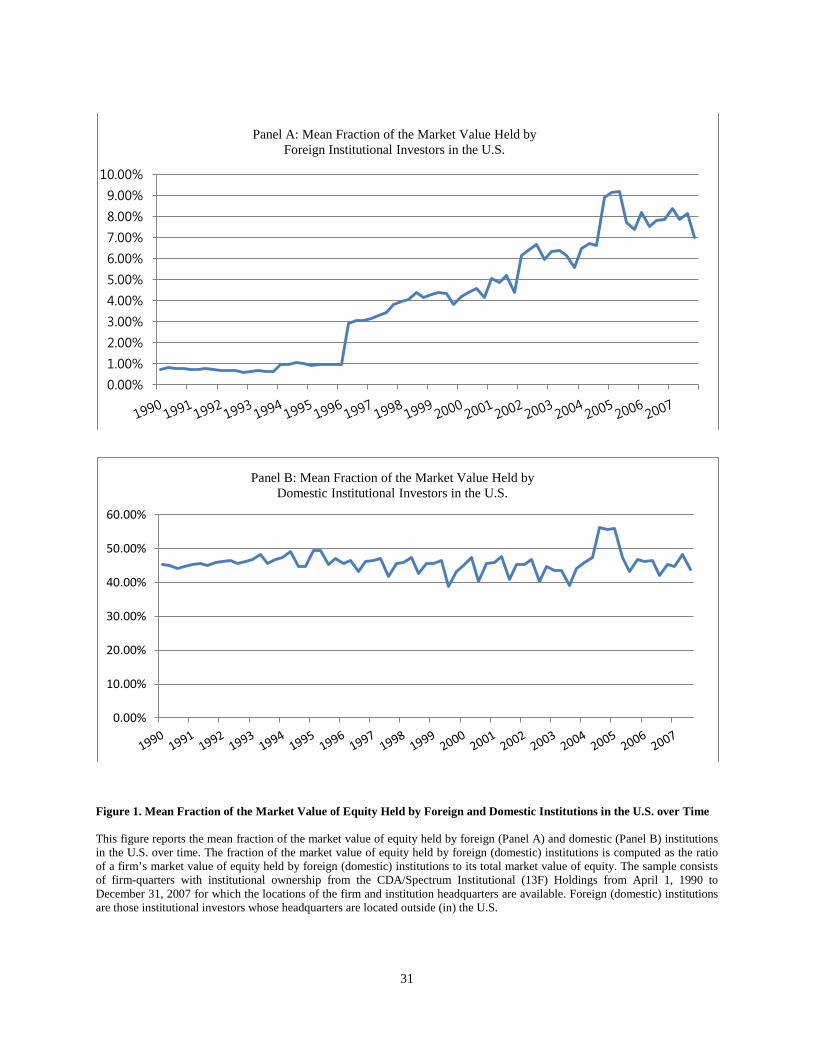
To examine how foreign institutional ownership in the U.S. has changed over time, in Figure
1 we plot the mean proportion of the market value of equity held by foreign (in Panel A) and
domestic (in Panel B) institutional investors from 1990 to 2007, calculated using firm-level data.
We obtain information on each U.S. firm’s stock price and total shares outstanding from
COMPUSTAT. Total US market value is the sum of the market value of equity (stock price
times number of shares outstanding) of all firms covered in COMPUSTAT. We set foreign
institutional ownership to zero for stocks in which foreign fund managers are not available. The
results in Figure 1 show that during our sample period, the mean fraction of the market value of
equity held by foreign institutional investors has increased from less than 1% to about 8% (Panel
A), while the mean fraction of the market value of equity held by domestic institutional investors
has not changed much at around 45% (Panel B). These results indicate that during our sample
12
period, foreign institutional ownership in the U.S. grew much faster than domestic institutional
ownership and its increase is not due to the general increasing trend in overall institutional
ownership.
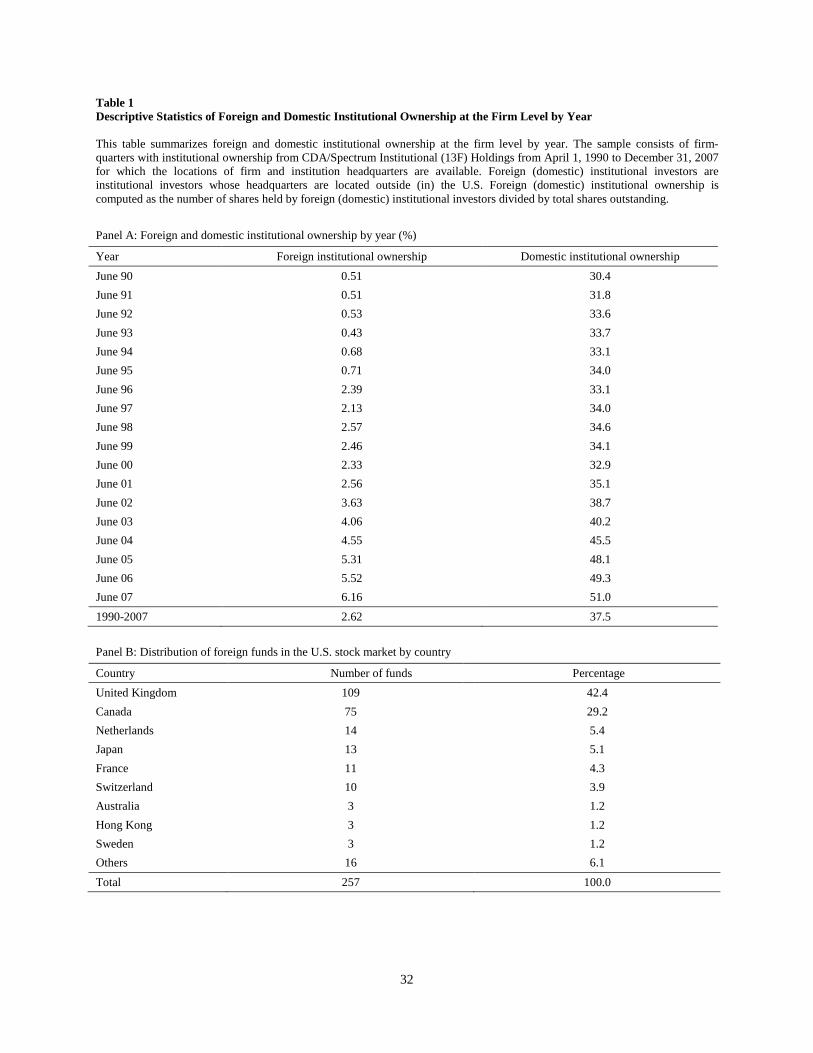
As an alternative way of measuring the time-series pattern of foreign institutional ownership,
we compute ownership by dividing the number of shares held by foreign institutional investors
by total shares outstanding at the end of June of each year. The results are reported in Panel A of
Table 1. Similar to Panel A of Figure 1, we find that foreign institutional ownership grew
substantially during our sample period. We also find that the mean fraction of the market value
of equity held by foreign institutional investors reported in Panel A of Figure 1 is always greater
than the ownership percentage held by foreign institutional investors reported in Panel A of
Table 1, indicating that foreign institutional investors invest primarily in larger firms.
Panel B of Table 1 shows the distribution of the number of foreign institutions by country.
The U.K. accounts for 42.4% of the sample, followed by Canada (29.2%), the Netherlands
(5.4%), Japan (5.1%), France (4.3%), and Switzerland (3.9%).
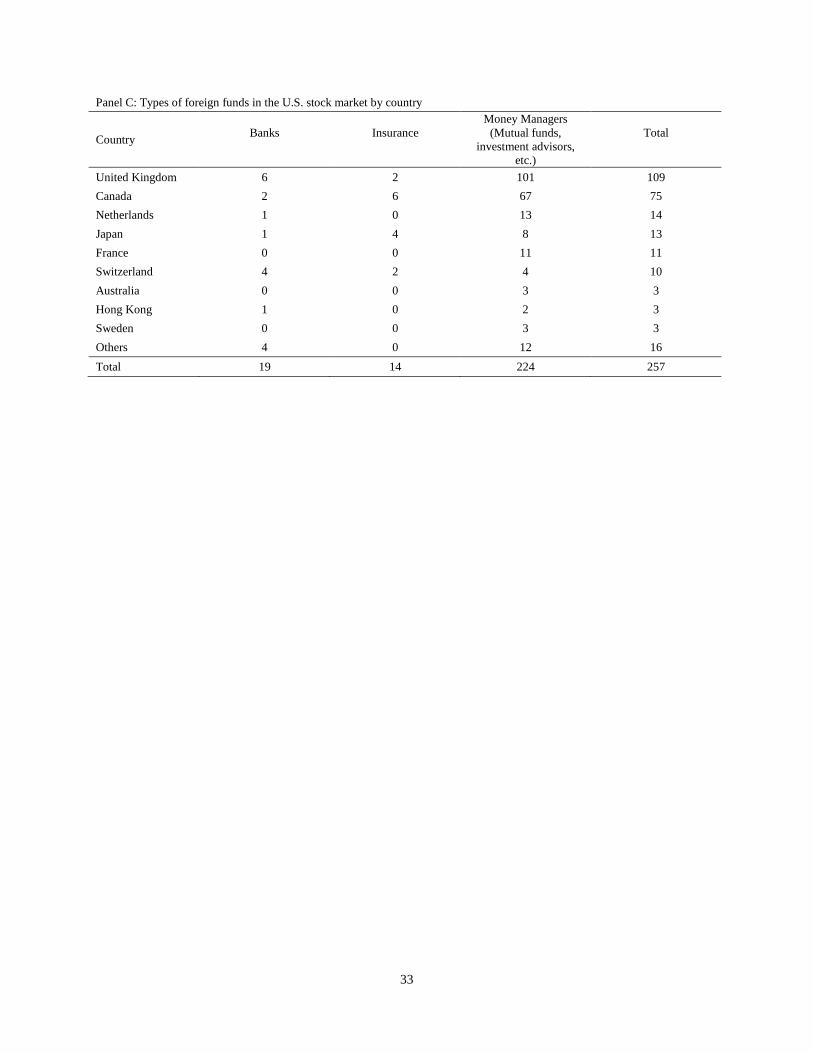
Panel C of Table 1 reports the types of foreign institutions by country. About 87.2% of the
foreign institutions are classified as money managers such as mutual funds and investment
advisors, while only 7.4% and 5.4% of the foreign institutions are banks and insurance
companies, respectively. We do not observe any systematic differences in the types of
institutional investors across the countries in the sample.
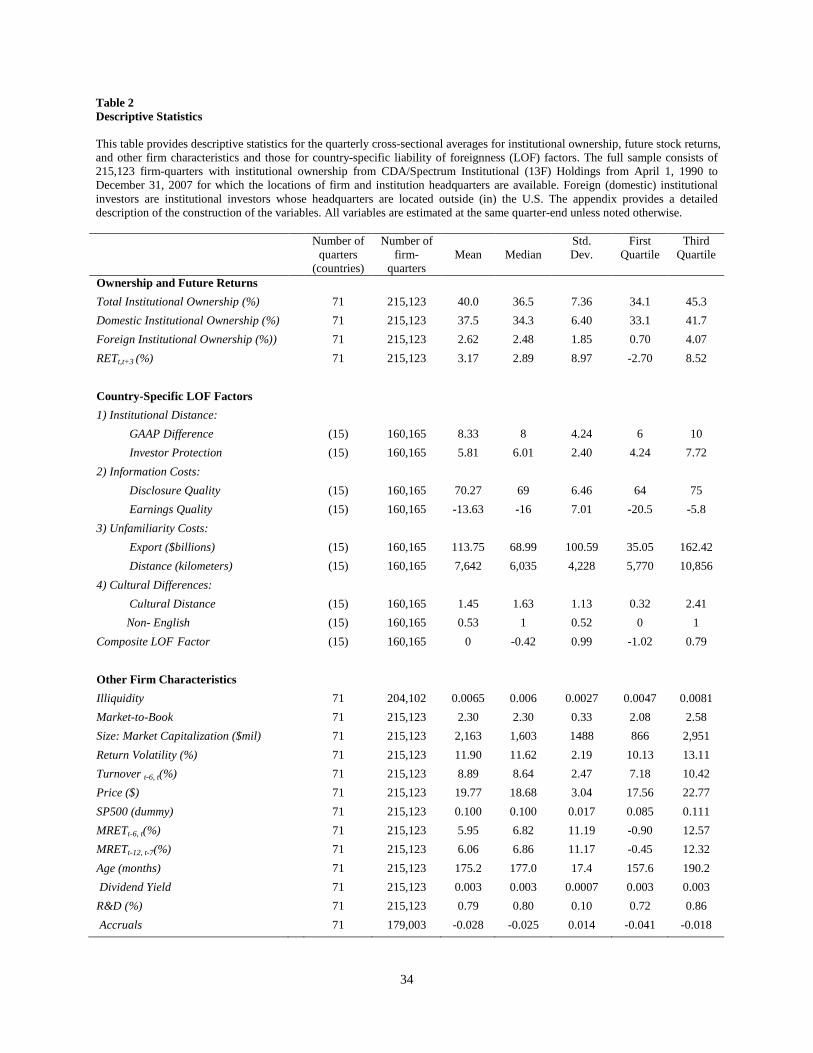
Table 2 provides descriptive statistics on foreign and domestic institutional ownership, future
stock returns, country-specific LOF characteristics, and other firm characteristics. We report the
time-series mean, median, standard deviation, first quartile, and third quartile of the quarterly
cross-sectional average of firm-specific variables. All firm-specific variables are estimated at the
13
same quarter-end unless noted otherwise. To minimize outlier problems, we trim the samples by
excluding observations at the top and bottom one percentile of the variables. To avoid issues
with respect to penny stocks, stocks with a price below one dollar are omitted from the final
sample. For country-specific LOF characteristics, we report the corresponding numbers of their
annual cross-sectional average. Detailed definitions for firm- and LOF-specific variables are
provided in the appendix.
Consistent with the results reported in Panel A of Table 1, we find that the mean (median)
equity ownership held by domestic institutional investors during our sample period is 37.5%
(34.3%) of outstanding shares, while the corresponding equity ownership held by foreign
institutional investors is 2.62% (2.48%). Since the average market value of stocks held by
foreign institutional investors is around $97.2 million, foreign institutions hold about 4.5% of the
average sample firm’s market capitalization (compared with 2.6% of the outstanding shares),
suggesting that foreign investors invest in larger firms.
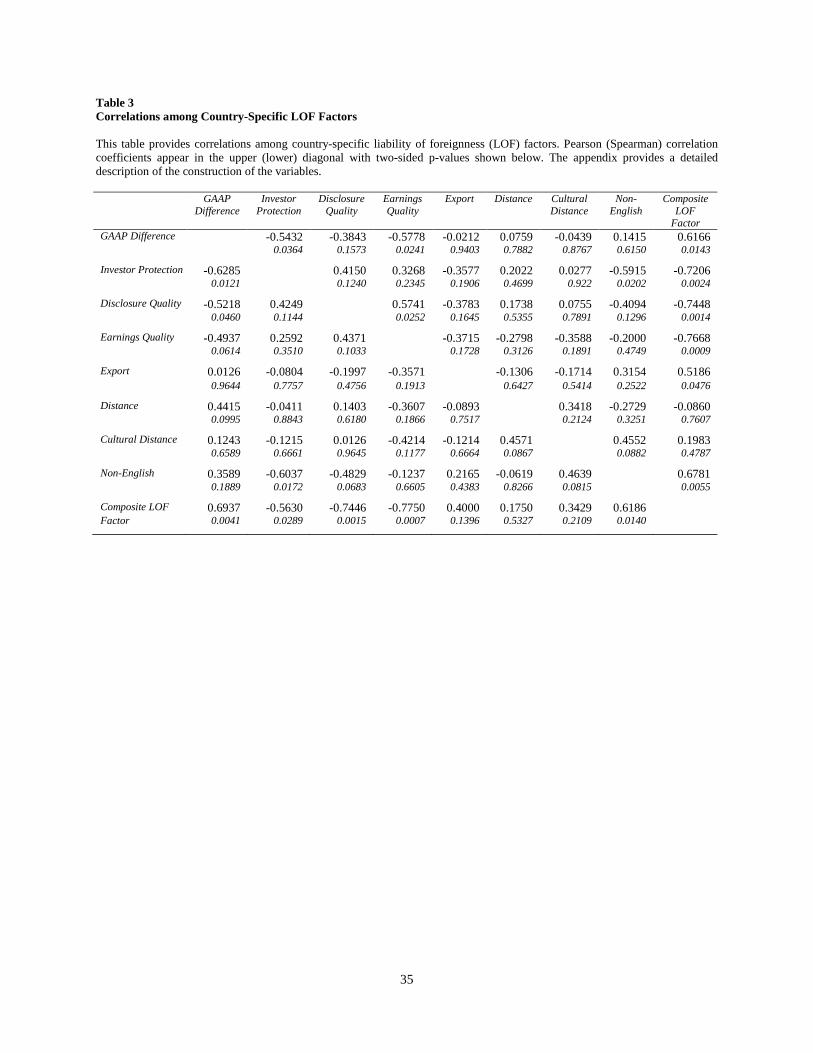
Table 3 reports correlations among country-specific LOF factors. GAAP Difference and
Investor Protection, which measure the country’s institutional distance, are highly correlated
(Spearman correlation coefficient of -0.6285), suggesting that each variable captures similar
characteristics of the country’s institutional distance. Similarly, we find high correlations
between the two information cost variables (Disclosure Quality and Earnings Quality) and
between the two cultural difference variables (Cultural Distance and Non-English). However,
Export and Distance, which measure unfamiliarity costs, are not significantly correlated with
each other.6
6 Untabulated analysis for final communality estimates shows that Earnings Quality plays the most important role in creating Composite LOF Factor (0.57), followed by Disclosure Quality (0.54), Investor Protection (0.51), English (0.45), GAAP Difference (0.37), Export (0.26), and Cultural Distance (0.04). Distance (0.01) plays the least role in
14
IV. Determinants of Domestic and Foreign Institutional Ownership
To examine whether the determinants of foreign institutional holdings differ from those of
domestic institutional holdings, we estimate cross-sectional regressions of institutional
ownership on firm characteristics separately for foreign and domestic institutional ownership. To
draw meaningful inferences about the determinants of foreign institutional holdings, we use two
types of domestic institutional ownership as comparison groups; domestic institutional
ownership held by all domestic institutions and matching domestic institutional ownership. We
use a propensity score matching approach to obtain matching domestic institutions. We use fund
size, type, age, and churn rate to match institutions since prior studies show that these variables
affect investors’ portfolio decisions (Kacperczyk, Sialm, and Zheng 2005). This matching
procedure ensures that institution characteristics are relatively homogenous across foreign and
matching domestic institutional investors.
Following Falkenstein (1996) and Gompers and Metrick (2001), we include 10 stock
characteristics as determinants of institutional ownership: Market-to-Book, Size, Return
Volatility, Turnover, Price, S&P 500, cumulative market-adjusted return for the preceding 6
months (MRETt-6, t), cumulative market-adjusted return for the penultimate 6 months (MRETt-12, t-
7), Age, and Dividend Yield. In addition, we include R&D and Accruals as explanatory variables,
because previous research shows that R&D intensity (Aghion, van Reenen, and Zingales 2009)
and earnings quality (Rajgopal, Venkatachalam, and Jiambalvo 2002) are important determinants creating the Composite LOF Factor. We also examine the correlations among firm-specific characteristics and find that the change in domestic institutional ownership (Δ Domestic Institutional Ownershipt) is not significantly related to future returns (RETt,t+3), while the change in foreign institutional ownership (Δ Foreign Institutional Ownershipt) is significantly negatively related to future returns (p-value<0.01). These results suggest that foreign institutional investors have poor stock-picking ability compared to domestic institutional investors in general. The correlations between other firm-specific control variables and future returns are largely consistent with those in prior research (Gompers and Metrick 2001).
15
of institutional ownership. We also include Illiquidity as an inverse measure of a stock’s liquidity
since stock liquidity can be an important determinant of institutional holdings. Illiquidity is
computed as the quarter t-1 average daily absolute return divided by the daily dollar trading
volume (Amihud 2002).7
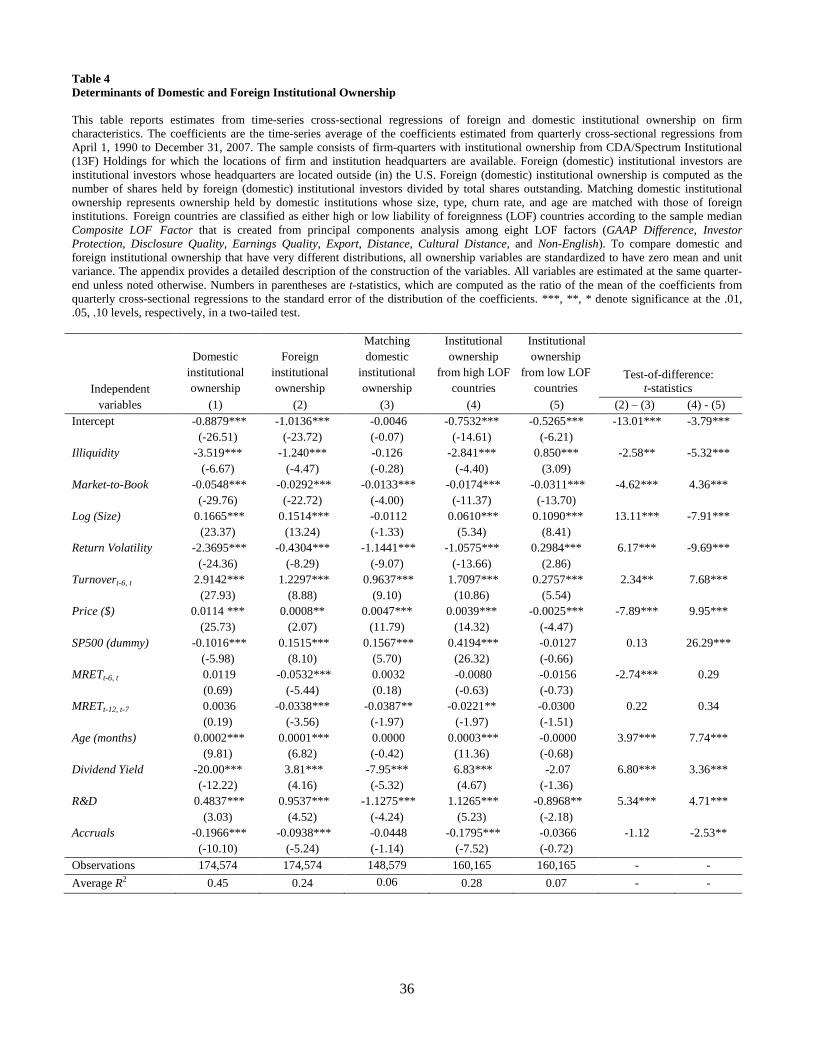
Table 4 shows the results. The reported t-statistics in parentheses are the average time-series
t-statistics for coefficients using the Fama-MacBeth (1973) method. Since foreign and domestic
institutional ownership are significantly different in size (i.e., as shown in Table 2, while the
mean domestic institutional ownership is 37.5%, the mean foreign institutional ownership is only
2.62%), all ownership variables in the analysis are standardized to have zero mean and unit
variance to make our coefficient estimates comparable (Hirshleifer, Hou, and Teoh 2009).
Column (1) shows the results using domestic institutional ownership as the dependent variable
and column (2) shows the results using foreign institutional ownership as the dependent variable.
We find that the coefficient estimates on all explanatory variables are significant in both
regressions except for MRETt-6, t and MRETt-12, t-7 in column (1). The coefficient estimates on
Size, Turnover, Price, and Age are positive and significant in both regressions. In contrast, the
coefficient estimates on Market-to-Book, Return Volatility, and Accruals are negative and
significant in both regressions. These results suggest that institutional investors, irrespective of
nationality, prefer stocks with low information asymmetry. The negative coefficient on
Illiquidity in both regressions implies that both domestic and foreign institutional investors prefer
stocks with high liquidity.
7 The LOF view of foreign investors suggests that to overcome their disadvantages and to execute profitable future trades or exit the market with minimal cost, foreign investors are likely to have a strong demand for liquidity in their international equity investments. In untabulated tests, we experiment with other alternative liquidity measures such as the inverse of the average price and the proportion of zero returns in quarter t-1 and find that the results are similar.
16
Column (3) shows the results using matching domestic institutional ownership as the
dependent variable. We find that the coefficient estimates on Illiquidity, Size, Age, and Accruals
lose their significance. We also find that the coefficient estimates on several explanatory
variables that are significant are smaller in absolute magnitude than the corresponding coefficient
estimates in columns (1) and (2). For example, the coefficient estimate on Market-to-Book in
column (3) is -0.0133, while the corresponding coefficient estimates in columns (1) and (2) are -
0.0548 and -0.0292. Similarly, the coefficient estimate on Turnover in column (3) is 0.9637,
while the corresponding coefficient estimates in columns (1) and (2) are 2.9142 and 1.2297.
Overall, these results suggest that compared with matching domestic institutional investors,
foreign institutional investors exhibit greater preference for stocks with high liquidity and low
information asymmetry. 8
Columns (4) and (5) show the results using ownership held by foreign institutions from
countries with high and low LOF costs, respectively. We divide foreign institutions into those
from countries with high and low LOF costs according to the sample median of each country’s
Composite LOF Factor. We find that foreign institutional investors’ preference for stocks with
low information asymmetry and high liquidity is mostly evident for foreign institutions from
countries with high LOF costs. For example, the coefficient estimates on Illiquidity and Return
Volatility for ownership held by foreign institutions from countries with low LOF costs are
positive and significant (p-value<0.01), while the corresponding coefficient estimates for
ownership held by foreign institutions from countries with high LOF costs are negative and
8 However, we find that the coefficient estimate on Return Volatility in column (3) is significantly negative, but its magnitude is significantly smaller than that in column (2), suggesting that although both matching domestic and foreign institutions prefer high liquidity stocks, such preference is weaker for foreign institutions than matching domestic institutions. We also find that the coefficient estimate on R&D in column (3) is significantly smaller than that on R&D in column (2), suggesting that foreign institutions prefer R&D intensive firms than matching domestic institutions.
17
significant (p-value<0.01). Similarly, we find that compared with foreign investors from low
LOF countries, those from high LOF countries prefer stocks with high Turnover, high Price,
S&P 500 inclusion, old Age, high Dividend Yield, and low Accruals. However, the coefficient
estimate on R&D intensity (size) in column (4) is significantly larger (smaller) than that on R&D
intensity (size) in column (5), suggesting that foreign institutions from high LOF countries prefer
high R&D intensive (small) firms than those from low LOF countries. Overall, these results
largely suggest that foreign institutional investors from countries with a greater degree of LOF
self-select into stocks with low information asymmetry and high liquidity to minimize the LOF
costs that they face in host country stock markets.
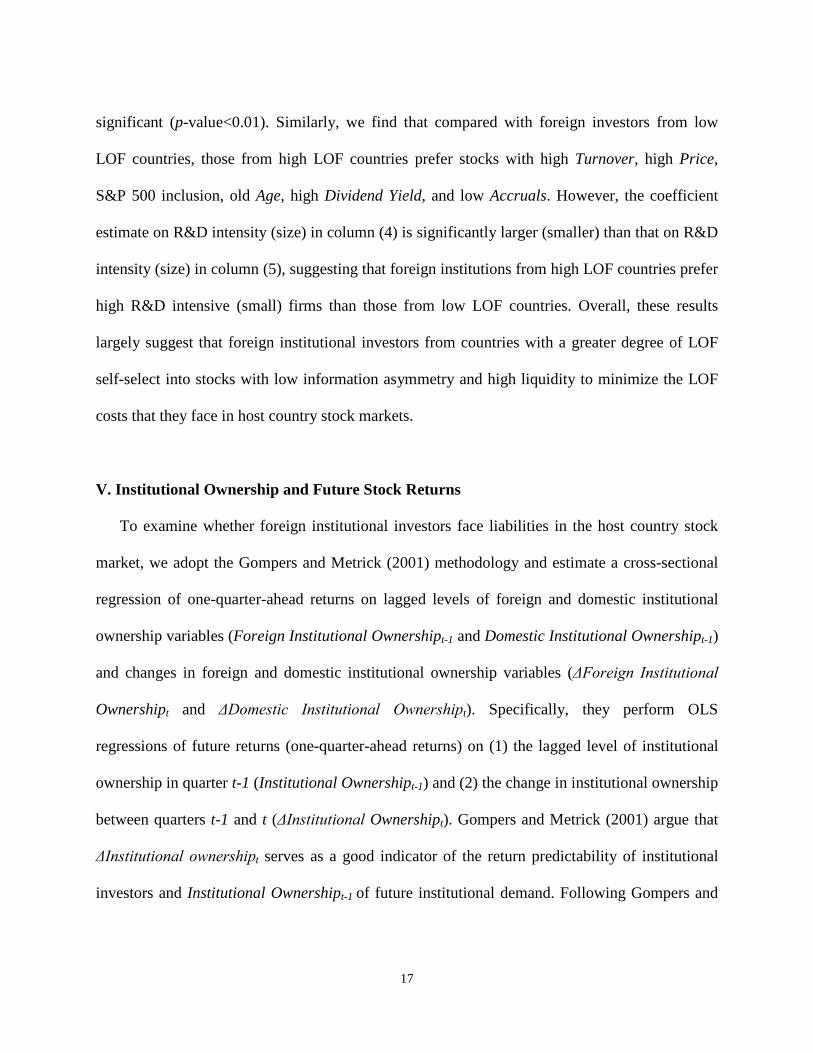
V. Institutional Ownership and Future Stock Returns
To examine whether foreign institutional investors face liabilities in the host country stock
market, we adopt the Gompers and Metrick (2001) methodology and estimate a cross-sectional
regression of one-quarter-ahead returns on lagged levels of foreign and domestic institutional
ownership variables (Foreign Institutional Ownershipt-1 and Domestic Institutional Ownershipt-1)
and changes in foreign and domestic institutional ownership variables (ΔForeign Institutional
Ownershipt and ΔDomestic Institutional Ownershipt). Specifically, they perform OLS
regressions of future returns (one-quarter-ahead returns) on (1) the lagged level of institutional
ownership in quarter t-1 (Institutional Ownershipt-1) and (2) the change in institutional ownership
between quarters t-1 and t (ΔInstitutional Ownershipt). Gompers and Metrick (2001) argue that
ΔInstitutional ownershipt serves as a good indicator of the return predictability of institutional
investors and Institutional Ownershipt-1 of future institutional demand. Following Gompers and
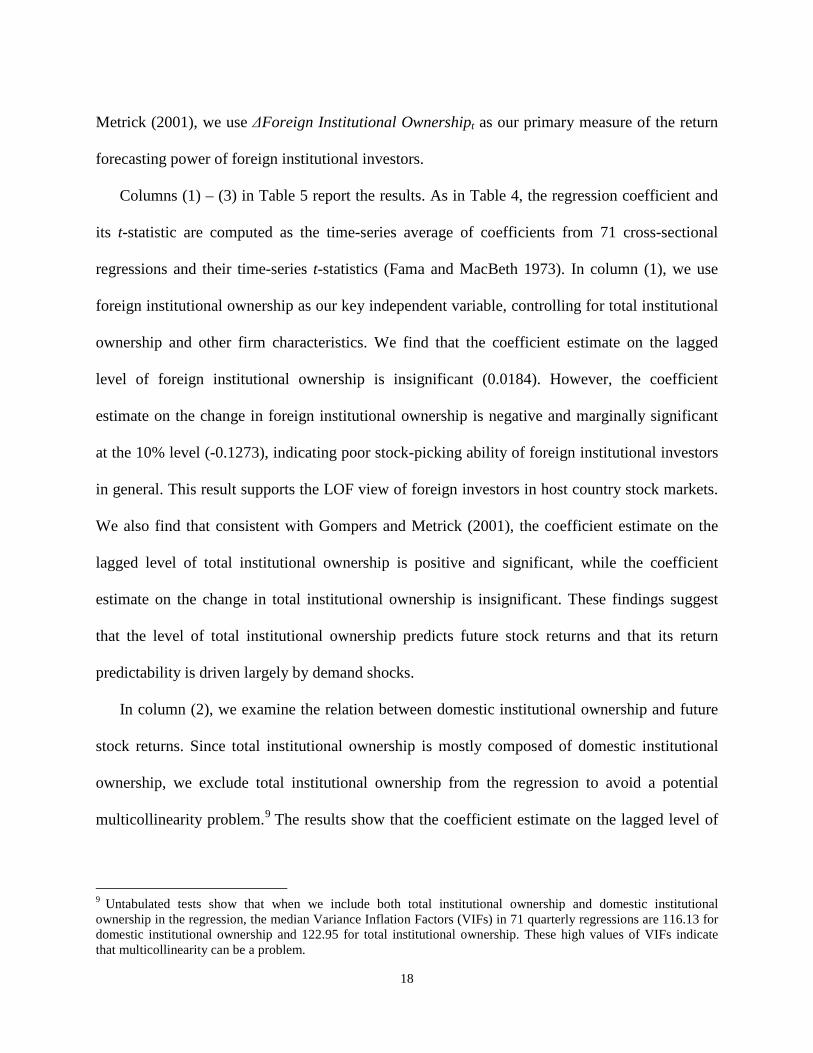
18
Metrick (2001), we use ΔForeign Institutional Ownershipt as our primary measure of the return
forecasting power of foreign institutional investors.
Columns (1) – (3) in Table 5 report the results. As in Table 4, the regression coefficient and
its t-statistic are computed as the time-series average of coefficients from 71 cross-sectional
regressions and their time-series t-statistics (Fama and MacBeth 1973). In column (1), we use
foreign institutional ownership as our key independent variable, controlling for total institutional
ownership and other firm characteristics. We find that the coefficient estimate on the lagged
level of foreign institutional ownership is insignificant (0.0184). However, the coefficient
estimate on the change in foreign institutional ownership is negative and marginally significant
at the 10% level (-0.1273), indicating poor stock-picking ability of foreign institutional investors
in general. This result supports the LOF view of foreign investors in host country stock markets.
We also find that consistent with Gompers and Metrick (2001), the coefficient estimate on the
lagged level of total institutional ownership is positive and significant, while the coefficient
estimate on the change in total institutional ownership is insignificant. These findings suggest
that the level of total institutional ownership predicts future stock returns and that its return
predictability is driven largely by demand shocks.
In column (2), we examine the relation between domestic institutional ownership and future
stock returns. Since total institutional ownership is mostly composed of domestic institutional
ownership, we exclude total institutional ownership from the regression to avoid a potential
multicollinearity problem.9 The results show that the coefficient estimate on the lagged level of
9 Untabulated tests show that when we include both total institutional ownership and domestic institutional ownership in the regression, the median Variance Inflation Factors (VIFs) in 71 quarterly regressions are 116.13 for domestic institutional ownership and 122.95 for total institutional ownership. These high values of VIFs indicate that multicollinearity can be a problem.
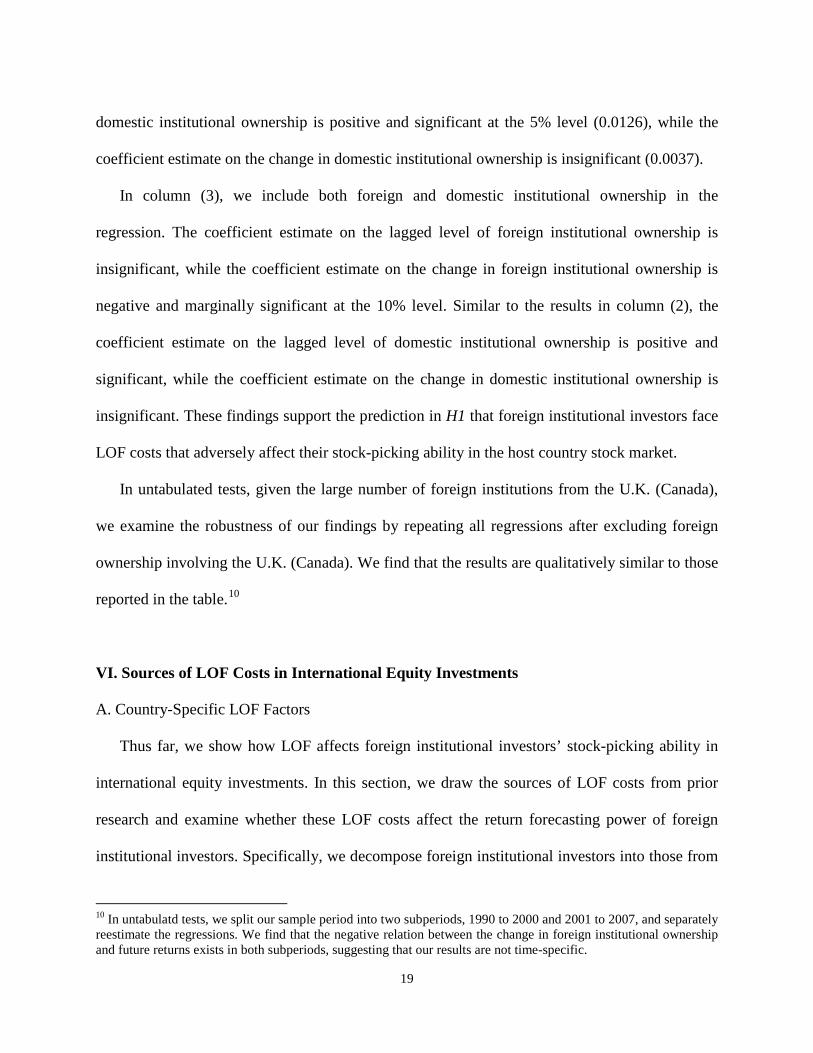
19
domestic institutional ownership is positive and significant at the 5% level (0.0126), while the
coefficient estimate on the change in domestic institutional ownership is insignificant (0.0037).
In column (3), we include both foreign and domestic institutional ownership in the
regression. The coefficient estimate on the lagged level of foreign institutional ownership is
insignificant, while the coefficient estimate on the change in foreign institutional ownership is
negative and marginally significant at the 10% level. Similar to the results in column (2), the
coefficient estimate on the lagged level of domestic institutional ownership is positive and
significant, while the coefficient estimate on the change in domestic institutional ownership is
insignificant. These findings support the prediction in H1 that foreign institutional investors face
LOF costs that adversely affect their stock-picking ability in the host country stock market.
In untabulated tests, given the large number of foreign institutions from the U.K. (Canada),
we examine the robustness of our findings by repeating all regressions after excluding foreign
ownership involving the U.K. (Canada). We find that the results are qualitatively similar to those
reported in the table.10
VI. Sources of LOF Costs in International Equity Investments
A. Country-Specific LOF Factors
Thus far, we show how LOF affects foreign institutional investors’ stock-picking ability in
international equity investments. In this section, we draw the sources of LOF costs from prior
research and examine whether these LOF costs affect the return forecasting power of foreign
institutional investors. Specifically, we decompose foreign institutional investors into those from
10 In untabulatd tests, we split our sample period into two subperiods, 1990 to 2000 and 2001 to 2007, and separately reestimate the regressions. We find that the negative relation between the change in foreign institutional ownership and future returns exists in both subperiods, suggesting that our results are not time-specific.
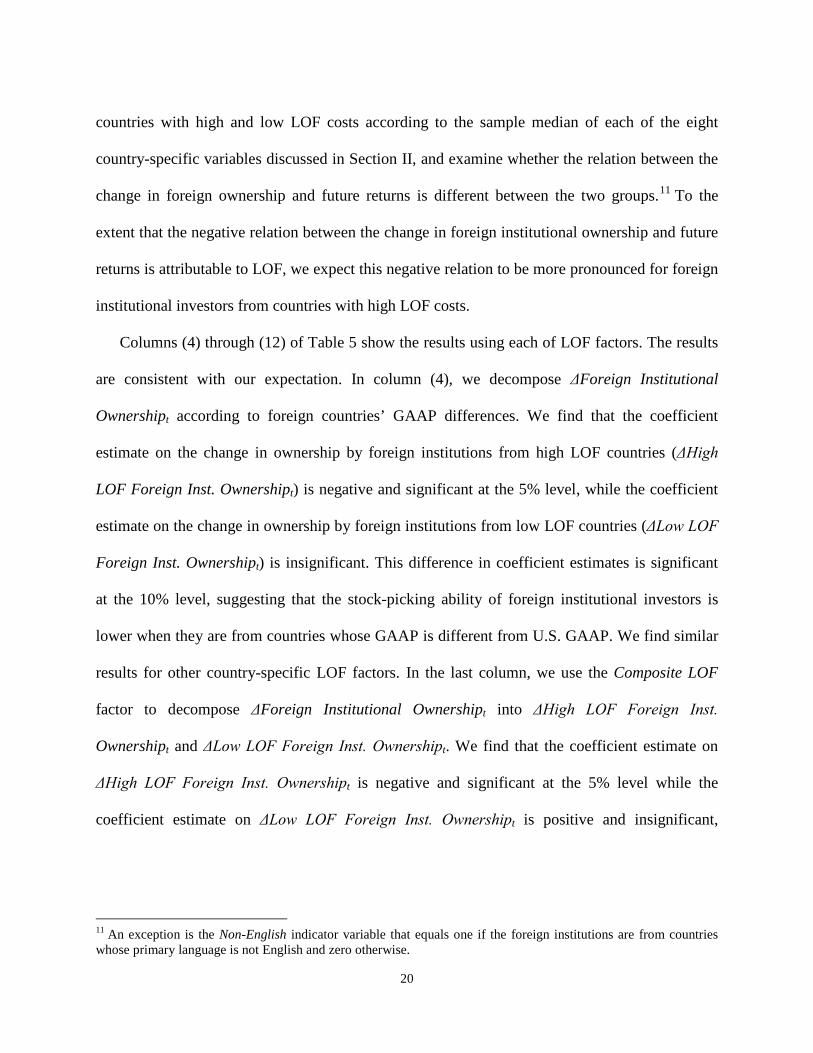
20
countries with high and low LOF costs according to the sample median of each of the eight
country-specific variables discussed in Section II, and examine whether the relation between the
change in foreign ownership and future returns is different between the two groups.11 To the
extent that the negative relation between the change in foreign institutional ownership and future
returns is attributable to LOF, we expect this negative relation to be more pronounced for foreign
institutional investors from countries with high LOF costs.
Columns (4) through (12) of Table 5 show the results using each of LOF factors. The results
are consistent with our expectation. In column (4), we decompose ΔForeign Institutional
Ownershipt according to foreign countries’ GAAP differences. We find that the coefficient
estimate on the change in ownership by foreign institutions from high LOF countries (ΔHigh
LOF Foreign Inst. Ownershipt) is negative and significant at the 5% level, while the coefficient
estimate on the change in ownership by foreign institutions from low LOF countries (ΔLow LOF
Foreign Inst. Ownershipt) is insignificant. This difference in coefficient estimates is significant
at the 10% level, suggesting that the stock-picking ability of foreign institutional investors is
lower when they are from countries whose GAAP is different from U.S. GAAP. We find similar
results for other country-specific LOF factors. In the last column, we use the Composite LOF
factor to decompose ΔForeign Institutional Ownershipt into ΔHigh LOF Foreign Inst.
Ownershipt and ΔLow LOF Foreign Inst. Ownershipt. We find that the coefficient estimate on
ΔHigh LOF Foreign Inst. Ownershipt is negative and significant at the 5% level while the
coefficient estimate on ΔLow LOF Foreign Inst. Ownershipt is positive and insignificant,
11 An exception is the Non-English indicator variable that equals one if the foreign institutions are from countries whose primary language is not English and zero otherwise.
21
suggesting that foreign institutional investors’ stock-picking ability is poorer when they are from
countries with high LOF. Overall, these results support H2.12
B. Interaction of Country-Specific LOF Factors with Stocks’ Information Asymmetry Measures
In this subsection, we examine whether the effect of LOF on the return forecasting ability of
foreign institutions differs across stocks with different levels of information asymmetry. To the
extent that foreign institutions face LOF in international stock markets and the adverse effect of
LOF on their return predictability is particularly severe for stocks with high information
asymmetry, we expect the results in the last column of Table 5 to be more pronounced for stocks
with higher information asymmetry than those with lower information asymmetry.
To test this prediction, we first perform principal components analysis among four
information asymmetry variables (firm size, return volatility, analyst forecast dispersion, and
R&D intensity) and create a single information asymmetry factor to avoid multicollinearity or
attenuation bias problems.13 We then divide our sample firms into high and low information
asymmetry firms according to the sample median of this information asymmetry factor and
reestimate the last regression in Table 5 separately for the two subgroups.
Table 6 presents the results. As expected, the coefficient estimate on ΔHigh LOF Foreign
Inst. Ownershipt is negative and significant for high information asymmetry firms (column (1)),
but insignificant for low information asymmetry firms (column (2)). The difference in these two
12 In untabulated tests, we experiment with an alternative measure of country-specific LOF costs, the proportion of firms from a foreign country that are cross-listed in the U.S. (i.e., the ratio of the number of cross-listed firms in the U.S. to the total number of publicly listed firms in that country during our sample period). We find that this listing ratio is negatively related to our LOF measures. We also find that foreign institutional investors who are from countries with a lower listing ratio have inferior stock-picking ability than those who are from countries with a higher listing ratio. 13 Untabulated analysis for final communality estimates shows that Return Volatility plays the most important role in creating Composite Information Asymmetry Factor (0.35), followed by Size (0.21), R&D (0.19), and Analyst Forecast Dispersion (0.14).
22
coefficient estimates is statistically significant. Thus, foreign institutional investors from
countries with a high LOF underperform when they trade stocks with high information
asymmetry, supporting H3.
These results, together with those in Table 4, suggest that when foreign investors face high
LOFs, they have strong incentives to take necessary actions to reduce the adverse effect of LOF
costs on stock investments in the host country such as holding stocks with low information
asymmetry. However, when foreign institutional investors from countries with high LOF costs
decide to invest in stocks with high information asymmetry, they are likely to underperform
because high LOF costs constrain their stock-picking ability and performance.
C. Foreign Hedge Funds versus Non-Hedge Funds
In this subsection, we examine whether the return forecasting power of foreign institutional
investors differs between foreign hedge funds and non-hedge funds. Untabulated analysis shows
that the negative relation between the change in foreign institutional ownership and future
returns reported in Table 5 is largely driven by foreign non-hedge funds. Specifically, we find
that that the change in foreign non-hedge fund ownership is significantly negatively related to
future returns while the relation is negative but statistically insignificant for foreign hedge fund
ownership. We also find that for the subsample of firms with high information asymmetry, the
coefficient estimate on the interaction term between the change in foreign non-hedge funds
ownership and the high Composite LOF indicator is negative and significant while that on the
interaction term between the change in foreign hedge funds ownership and the high Composite
LOF indicator is insignificant. For the subsample of firms with low information asymmetry, the
coefficient estimates on both interaction terms are not significant. These results suggest that non-
23
hedge fund investors who are from countries with high LOF costs perform worse when they
purchase stocks with high information asymmetry.
D. Portfolio Analysis
Finally, to gauge the economic significance of the effect of LOF on the return predictability
of foreign institutional investors, we perform portfolio analyses. The results are reported in Table
7. Specifically, in each quarter from April 1, 1996 to December 31, 2007, we sort stocks into
deciles on the basis of the change in domestic and foreign institutional ownership, and then
compute annualized one-quarter-ahead value-weighted returns on the decile portfolios. Similarly,
we repeat this sorting using ownership held by foreign institutions from countries with high and
low LOF costs.14 We then form a zero-cost investment, a hedge portfolio strategy, which takes a
long position in portfolio D10 (the decile portfolio with the largest ownership increase) and a
short position in portfolio D1 (the decile portfolio with the largest ownership decrease), and
compute the average return on the hedge portfolio (D10 – D1).
When stocks are sorted by the change in domestic institutional ownership (column (4)), the
risk-adjusted return (Daniel et al., 1997) for stocks in the highest decile (stocks most heavily
purchased by institutional investors) does not differ significantly from that for stocks in the
lowest decile (stocks most heavily sold by institutional investors). However, the risk-adjusted
hedge portfolio return calculated from the sort based on the change in foreign institutional
14 As shown in Figure 1, foreign institutional ownership was relatively small and stable in the early years of our sample period, particularly during the 1990-1995 subperiod. Since this scarcity and stability of foreign ownership distort our decile portfolios, we examine portfolio returns after omitting the 1990-1995 subperiod. In untabulated tests, we reestimate the regressions in Tables 5 using the 1996-2007 subperiod and find that our key results for the negative (positive) relation between the change in foreign institutional ownership (level of domestic institutional ownership) and future returns does not change.
24
ownership generates a significant -2.18% per year (column (1)), further supporting the prediction
in H1 that foreign investors have poor stock-picking ability.
When we further partition foreign institutional ownership into high and low LOF subgroups,
we find that the negative hedge portfolio returns of foreign ownership are mainly driven by high
LOF foreign ownership. The risk-adjusted hedge portfolio return based on the change in
ownership held by foreign institutions from countries with high LOF costs is a significant -2.85%
per year (column (2)). In contrast, we do not observe any significant hedge portfolio return when
the return is calculated from the sort based on the change in ownership held by foreign
institutions from countries with low LOF costs (column (3)). The difference in risk-adjusted
hedge portfolio returns between high and low LOF groups is statistically significant (p-
value=0.06). These results corroborate those reported in Table 5, supporting the prediction in H2
that the ability of foreign institutions to predict future returns is lower when they are from
countries with a greater degree of LOF.
VII. Additional Tests
To check the robustness of the results, we conduct several additional tests. First, we examine
whether the lower stock-picking ability of foreign institutional investors is mainly driven by a
few worst-performing foreign institutional investors or a subset of foreign institutional investors
with specific fund characteristics. Specifically, we repeat the analyses after excluding foreign
institutional investors in the bottom decile of past quarter performance and find almost identical
results to those reported in the paper. We also decompose foreign institutional investors into two
groups according to the sample median of each fund characteristic (high versus low churn rates,
young versus old funds, and large versus small fund size) and find that the stock-picking ability
25
of foreign institutional investors is not different between the two groups. Next, we examine
whether our results are robust when using longer time horizons such as two- and three-quarter-
ahead returns. We find that the negative relation between the change in foreign institutional
ownership and future returns becomes statistically insignificant when we use two- or three-
quarter-ahead returns as the dependent variable, suggesting that foreign institutions’
disadvantages in the U.S. stock market are short-lived. However, to the extent that SEC Form
13F filings are updated at the end of every quarter and foreign intuitions are able to rebalance
their stock holdings every quarter (particularly stocks with large losses), the results may also
suggest that long-term returns such as two- and three-quarter-ahead returns can be a noisy
measure of institutional investors’ return forecasting ability.15
As an additional test, using a unique setting for Canadian institutional investors (i.e.,
Canadian institutions share almost similar characteristics as U.S. domestic institutions), we
explore the variation in their LOF costs in a given country. We examine how distance affects the
relation between the change in Canadian institutional ownership and future returns by including
a remote indicator (takes the value of one if Canadian institutional investors’ physical distance
from the headquarters of their U.S. portfolio firms is in the top quartile of the sample and zero
otherwise) and its interaction with the change in Canadian institutional ownership in the
regression. We find that the coefficient estimate on the interaction term is negative and
15 To the extent that SEC Form 13F filings are updated at the end of every quarter and foreign intuitions are able to rebalance their stock holdings every quarter (particularly stocks with large losses), the results may suggest that long-term returns such as two- and three-quarter-ahead returns are a noisy measure of institutional investors’ return forecasting ability. Because of this potential problem, previous studies including Gompers and Metric (2001), Yan and Zhang (2009), and Baik, Kang, and Kim (2010) use one-quarter-ahead returns as their key measure of institutions’ return forecasting ability. There is also another potential problem in using quarterly holding data. SEC’s Form 13F requires disclosure of the number of shares as of the end of the calendar quarter for which the report is filed. As such, the data on institutional holdings will only capture positions at quarter-end. Therefore, the periodicity of the data may obscure the true performance of institutions.
26
significant at the 5% level, suggesting that the stock-picking ability is lower for remote Canadian
institutions than geographically proximate Canadian institutions. Finally, to control for foreign
investors’ risk-reducing diversification benefits, we compute benchmark-adjusted returns for
nine countries (U.K., Canada, Netherlands, Japan, France, Switzerland, Australia, Hong Kong,
and Sweden) available in Datastream International by subtracting foreign institutions’ equally-
weighted index returns in their home country from one-quarter-ahead returns and regress these
benchmark-adjusted returns on the lagged level of and change in equity ownership held by
foreign institutional investors. We find that the coefficient estimate on the change in foreign
institutional ownership is negative and significant at the 1% level, suggesting that our results are
robust to controlling for risk-reducing diversification benefits.
VIII. Summary and Conclusion
In this paper we examine whether foreign investors face the LOF in the host country stock
market by investigating the return predictability of foreign and domestic institutional ownership
in the U.S. stock market. We find that while both foreign and domestic institutional investors
prefer firms with low information asymmetry, the preference for lower information asymmetry
stocks is stronger for foreign institutional investors, particularly when they are from countries
with high LOF. Supporting the LOF view of foreign investors in host country stock markets, we
find a negative and significant relation between the change in foreign ownership and future
returns, but no such relation between the change in domestic ownership and future returns.
Moreover, the negative relation between the change in foreign institutional ownership and
future returns is particularly pronounced when foreign investors face a greater degree of LOF in
the U.S. stock market, for instance, when they are from countries with higher institutional
27
distance, information asymmetry, unfamiliarity, and cultural differences. The negative effect of
country-specific LOF factors on the return forecasting power of foreign institutional investors is
more evident when they trade stocks with higher information asymmetry. Overall, these findings
suggest that foreign institutional investors face significant LOF costs in the U.S. stock market,
resulting in their poorer ability to forecast returns.
Several caveats are in order. First, to examine LOF costs in international equity investments,
we use only the shares of the U.S. firms that foreign institutional investors hold, that is, we do
not include other shares held by these investors in non-U.S. stock markets, due to lack of data.
To the extent that other non-U.S. stock markets have different characteristics and regulations, our
results may not be generalizable to these markets. Second, because of data limitations, we
examine the ability of foreign institutions to predict returns without considering their intra-
quarter trading. To the extent that foreign investors have high turnover in certain stocks,
particularly during the latter part of our sample period, our analysis may not fully capture their
short-term trading. Finally, it is possible that using their resources and trading skills, some
foreign institutions are able to employ complex trading strategies that our equity holding data on
13F filings cannot capture. This data limitation may overstate the information disadvantages of
foreign institutional investors in the U.S. stock market. An analysis of the importance of these
issues represents a valuable area for future research.
28
Reference
Aghion, P., Reenen, J. van, & Zingales, J. 2013. Innovation and institutional ownership. American Economic Review, 103(1): 277-304.
Amihud, Y. 2002. Illiquidity and stock returns: cross-section and time-series effects. Journal of
Financial Markets 5; 31-56. Bae, K.-H., Tan, H., & Welker, M. 2008. International GAAP differences: the impact on foreign
analysts. Accounting Review 83; 593-628. Baik, B., Kang, J.-K., & Kim, J.-M. 2010. Local institutional investors, information asymmetries,
and equity returns. Journal of Financial Economics 97; 81-106. Bell, R. G., Filatotchev, I., & Rasheed, A. A. 2012. The liability of foreignness in capital
markets: Sources and remedies. Journal of International Business Studies 43; 107-122. Bradshaw, M. T., Bushee, B., & Miller, G. 2004. Accounting choices, home bias, and U.S.
investment in non-U.S. firms. Journal of Accounting Research 42; 795–841. Brown, J., Goetzmann, W., & Ibbotson, R. 1999. Offshore hedge funds: Survival and
performance, 1989-95. Journal of Business 72; 91–117. Brunnermeier, M. & Nagel, S. 2004. Hedge funds and the technology bubble. Journal of Finance
59; 2013-2040. Bushee, B. 1998. The influence of institutional investors on myopic R&D investment behavior.
Accounting Review 73; 305-333. Chan, K., Covrig, V., & Ng, L. 2009. Does home bias affect firm value? Evidence from holdings
of mutual funds worldwide. Journal of International Economics 78; 230-241. Choe, H., Kho, B.-C., & Stulz, R. 1999. Do foreign investors destabilize stock markets? The
Korean experience in 1997. Journal of Financial Economics 54; 227-264. Choe, H., Kho, B.-C., & Stulz, R. 2005. Do domestic investors have an edge? The trading
experience of foreign investors in Korea. Review of Financial Studies 18; 795-829. Coval, J., & Moskowitz, T. 1999. Home bias at home: Local equity preference in domestic
portfolios. Journal of Finance 54; 2045-2073. Daniel, K., Grinblatt, M., Titman, S., & Wermers, R. 1997. Measuring mutual fund performance
with characteristic-based benchmarks. Journal of Finance 52; 1035-1058. Demirbag, M., Tatoglu, E., & Glaister, K. W. 2010. Institutional and transaction cost influences
on partnership structure of foreign Affiliates. Management International Review 50; 709-745.
29
Falkenstein, E. 1996. Preferences for stock characteristics as revealed by mutual fund portfolio
holdings. Journal of Finance 51; 111-135. Fama, E., & MacBeth, J. 1973. Risk, return, and equilibrium: Empirical tests. Journal of
Political Economy 81; 607-636. Ferreira, M. A., & Matos, P. 2008. The colors of investors’ money: The role of institutional
investors around the world. Journal of Financial Economics 88; 499-533. Gompers, P., & Metrick, A. 2001.Institutional investors and equity prices. Quarterly Journal of
Economics 116; 229-259. Grinblatt, M., & Keloharju, M. 2001. How distance, language, and culture influence
stockholdings and trades. Journal of Finance 56; 1053-1073. Hirshleifer, D., Hou, K., & Teoh, H. 2009. Accruals, cash flows, and aggregate stock returns.
Journal of Financial Economics 91 (3); 389-406. Hofstede, G. 2001. Culture's Consequences: Comparing values, behaviors, institutions, and
organizations across nations (2nd ed.). Thousand Oaks, CA: Sage. Hopkins, P., Botosan, C., Bradshaw, M., Callahan, C., Ciesielski, J., Farber, D., Kohlbeck, M.,
Hodder, L., Luax, B., Stober, T., Stocken, P., and Yohn, T. 2008. Response to the SEC Release, "Acceptance from Foreign Private Issuers of Financial Statements Prepared in Accordance with International Financial Reporting Standards without Reconciliation to U.S. GAAP File No. S7-13-07." Accounting Horizons (June); 223-240.
Hymer, S. H. 1976. The international operations of national firms: A study of direct investment.
Cambridge, MA: MIT Press. Ivković, Z., & Weisbenner, S. 2005. Local does as local is: Information content of the geography
of individual investors’ common stock investments. Journal of Finance 60; 267-306. Kacperczyk, M., Sialm, C., & Zheng, L. 2005. On the industry concentration of actively
managed equity mutual funds. Journal of Finance 60; 1983-2011. Kang, J.-K., & Stulz, R. 1997. Why is there a home bias? An analysis of foreign portfolio equity
ownership in Japan. Journal of Financial Economics 46; 3-28. Khurana, I. K., & Michas, P. N. 2011. Mandatory IFRS adoption and the U.S. home bias.
Accounting Horizons 25; 729–753. Kindleberger, C. 1969. American business abroad. New Haven, CT: University Press.
30
Kogut, B., & Singh, H. 1988. The effect of national culture on the choice of entry mode. Journal of International Business Studies 19; 411-432.
La Porta, R., Lopez-de-Silanes, F., Shleifer, A., & Vishny, R. 1997. Legal determinants of
external finance. Journal of Finance 52; 1131-50. La Porta, R., Lopez-de-Silanes, F., Shleifer, A., & Vishny, R. 1998. Law and finance. Journal of
Political Economy 106; 1113-55. La Porta, R., Lopez-de-Silanes, F., Shleifer, A., & Vishny, R. 1999. The quality of government.
Journal of Law, Economics, and Organization 15; 222-79. Leuz, C., Nanda D., & Wysocki, P. 2003. Earnings management and investor protection: An
international comparison. Journal of Financial Economics 69; 505-527. Mata, J., & Freitas, E. 2012. Foreignness and exit over the life cycle of firms. Journal of
International Business Studies 43; 615-630. Mezias, J. M. 2002. Identifying liabilities of foreignness and strategies to minimize their effects:
The case of labor lawsuit judgments in the United States. Strategic Management Journal 23; 229-244.
O'Grady, S., & Lane, H. W. 1996. The psychic distance paradox. Journal of International
Business Studies 27; 309-333. Qian, G., Li, L., Li, J., & Qian, Z. 2008. Regional diversification and firm performance. Journal
of International Business Studies 39; 197-214. Rajgopal, S., Venkatachalam, M., & Jiambalvo, J. 2002. Institutional ownership and the extent to
which stock prices reflect future earnings. Contemporary Accounting Research 19; 117-136. Shukla, R., & Inwegen, G. van. 1995. Do locals perform better than foreigners? An analysis of
UK and U.S. mutual fund managers. Journal of Economics & Business 47; 241-254. Stulz, R., & Wasserfallen, W. 1995. Foreign equity investment restrictions, capital flight, and
shareholder wealth maximization: Theory and evidence. Review of Financial Studies 8; 1019-1057
Wermers, R., 2006. Performance Evaluation with Portfolio Holdings Information. North
American Journal of Economics and Finance; 207-230. Yan, S., & Zhang, Z. 2009. Institutional investors and equity returns: Are short-term institutions
better informed? Review of Financial Studies 22; 893-924. Zaheer, S. 1995. Overcoming the liability of foreignness. Academy of Management Journal 38;
341–363.
31
Figure 1. Mean Fraction of the Market Value of Equity Held by Foreign and Domestic Institutions in the U.S. over Time This figure reports the mean fraction of the market value of equity held by foreign (Panel A) and domestic (Panel B) institutions in the U.S. over time. The fraction of the market value of equity held by foreign (domestic) institutions is computed as the ratio of a firm’s market value of equity held by foreign (domestic) institutions to its total market value of equity. The sample consists of firm-quarters with institutional ownership from the CDA/Spectrum Institutional (13F) Holdings from April 1, 1990 to December 31, 2007 for which the locations of the firm and institution headquarters are available. Foreign (domestic) institutions are those institutional investors whose headquarters are located outside (in) the U.S.
0.00%
1.00%
2.00%
3.00%
4.00%
5.00%
6.00%
7.00%
8.00%
9.00%
10.00%
Panel A: Mean Fraction of the Market Value Held by Foreign Institutional Investors in the U.S.
0.00%
10.00%
20.00%
30.00%
40.00%
50.00%
60.00%
Panel B: Mean Fraction of the Market Value Held by Domestic Institutional Investors in the U.S.
32
Table 1 Descriptive Statistics of Foreign and Domestic Institutional Ownership at the Firm Level by Year This table summarizes foreign and domestic institutional ownership at the firm level by year. The sample consists of firm-quarters with institutional ownership from CDA/Spectrum Institutional (13F) Holdings from April 1, 1990 to December 31, 2007 for which the locations of firm and institution headquarters are available. Foreign (domestic) institutional investors are institutional investors whose headquarters are located outside (in) the U.S. Foreign (domestic) institutional ownership is computed as the number of shares held by foreign (domestic) institutional investors divided by total shares outstanding. Panel A: Foreign and domestic institutional ownership by year (%)
Year Foreign institutional ownership Domestic institutional ownership June 90 0.51 30.4 June 91 0.51 31.8 June 92 0.53 33.6 June 93 0.43 33.7 June 94 0.68 33.1 June 95 0.71 34.0 June 96 2.39 33.1 June 97 2.13 34.0 June 98 2.57 34.6 June 99 2.46 34.1 June 00 2.33 32.9 June 01 2.56 35.1 June 02 3.63 38.7 June 03 4.06 40.2 June 04 4.55 45.5 June 05 5.31 48.1 June 06 5.52 49.3 June 07 6.16 51.0 1990-2007 2.62 37.5
Panel B: Distribution of foreign funds in the U.S. stock market by country
Country Number of funds Percentage United Kingdom 109 42.4 Canada 75 29.2 Netherlands 14 5.4 Japan 13 5.1 France 11 4.3 Switzerland 10 3.9 Australia 3 1.2 Hong Kong 3 1.2 Sweden 3 1.2 Others 16 6.1 Total 257 100.0
33
Panel C: Types of foreign funds in the U.S. stock market by country
Country
Banks
Insurance
Money Managers (Mutual funds,
investment advisors, etc.)
Total
United Kingdom 6 2 101 109 Canada 2 6 67 75 Netherlands 1 0 13 14 Japan 1 4 8 13 France 0 0 11 11 Switzerland 4 2 4 10 Australia 0 0 3 3 Hong Kong 1 0 2 3 Sweden 0 0 3 3 Others 4 0 12 16 Total 19 14 224 257
34
Table 2 Descriptive Statistics This table provides descriptive statistics for the quarterly cross-sectional averages for institutional ownership, future stock returns, and other firm characteristics and those for country-specific liability of foreignness (LOF) factors. The full sample consists of 215,123 firm-quarters with institutional ownership from CDA/Spectrum Institutional (13F) Holdings from April 1, 1990 to December 31, 2007 for which the locations of firm and institution headquarters are available. Foreign (domestic) institutional investors are institutional investors whose headquarters are located outside (in) the U.S. The appendix provides a detailed description of the construction of the variables. All variables are estimated at the same quarter-end unless noted otherwise. Number of
quarters (countries)
Number of firm-
quarters
Mean
Median
Std. Dev.
First Quartile
Third Quartile
Ownership and Future Returns Total Institutional Ownership (%) 71 215,123 40.0 36.5 7.36 34.1 45.3 Domestic Institutional Ownership (%) 71 215,123 37.5 34.3 6.40 33.1 41.7 Foreign Institutional Ownership (%)) 71 215,123 2.62 2.48 1.85 0.70 4.07 RETt,t+3 (%) 71 215,123 3.17 2.89 8.97 -2.70 8.52 Country-Specific LOF Factors 1) Institutional Distance: GAAP Difference (15) 160,165 8.33 8 4.24 6 10 Investor Protection (15) 160,165 5.81 6.01 2.40 4.24 7.72 2) Information Costs: Disclosure Quality (15) 160,165 70.27 69 6.46 64 75 Earnings Quality (15) 160,165 -13.63 -16 7.01 -20.5 -5.8 3) Unfamiliarity Costs: Export ($billions) (15) 160,165 113.75 68.99 100.59 35.05 162.42 Distance (kilometers) (15) 160,165 7,642 6,035 4,228 5,770 10,856 4) Cultural Differences: Cultural Distance (15) 160,165 1.45 1.63 1.13 0.32 2.41 Non- English (15) 160,165 0.53 1 0.52 0 1 Composite LOF Factor (15) 160,165 0 -0.42 0.99 -1.02 0.79 Other Firm Characteristics Illiquidity 71 204,102 0.0065 0.006 0.0027 0.0047 0.0081 Market-to-Book 71 215,123 2.30 2.30 0.33 2.08 2.58 Size: Market Capitalization ($mil) 71 215,123 2,163 1,603 1488 866 2,951 Return Volatility (%) 71 215,123 11.90 11.62 2.19 10.13 13.11 Turnover t-6, t(%) 71 215,123 8.89 8.64 2.47 7.18 10.42 Price ($) 71 215,123 19.77 18.68 3.04 17.56 22.77 SP500 (dummy) 71 215,123 0.100 0.100 0.017 0.085 0.111 MRETt-6, t(%) 71 215,123 5.95 6.82 11.19 -0.90 12.57 MRETt-12, t-7(%) 71 215,123 6.06 6.86 11.17 -0.45 12.32 Age (months) 71 215,123 175.2 177.0 17.4 157.6 190.2 Dividend Yield 71 215,123 0.003 0.003 0.0007 0.003 0.003 R&D (%) 71 215,123 0.79 0.80 0.10 0.72 0.86 Accruals 71 179,003 -0.028 -0.025 0.014 -0.041 -0.018
35
Table 3 Correlations among Country-Specific LOF Factors This table provides correlations among country-specific liability of foreignness (LOF) factors. Pearson (Spearman) correlation coefficients appear in the upper (lower) diagonal with two-sided p-values shown below. The appendix provides a detailed description of the construction of the variables.
GAAP
Difference Investor
Protection Disclosure
Quality Earnings Quality
Export Distance Cultural Distance
Non-English
Composite LOF
Factor GAAP Difference -0.5432 -0.3843 -0.5778 -0.0212 0.0759 -0.0439 0.1415 0.6166 0.0364 0.1573 0.0241 0.9403 0.7882 0.8767 0.6150 0.0143
Investor Protection -0.6285 0.4150 0.3268 -0.3577 0.2022 0.0277 -0.5915 -0.7206 0.0121 0.1240 0.2345 0.1906 0.4699 0.922 0.0202 0.0024
Disclosure Quality -0.5218 0.4249 0.5741 -0.3783 0.1738 0.0755 -0.4094 -0.7448 0.0460 0.1144 0.0252 0.1645 0.5355 0.7891 0.1296 0.0014
Earnings Quality -0.4937 0.2592 0.4371 -0.3715 -0.2798 -0.3588 -0.2000 -0.7668 0.0614 0.3510 0.1033 0.1728 0.3126 0.1891 0.4749 0.0009
Export 0.0126 -0.0804 -0.1997 -0.3571 -0.1306 -0.1714 0.3154 0.5186 0.9644 0.7757 0.4756 0.1913 0.6427 0.5414 0.2522 0.0476
Distance 0.4415 -0.0411 0.1403 -0.3607 -0.0893 0.3418 -0.2729 -0.0860 0.0995 0.8843 0.6180 0.1866 0.7517 0.2124 0.3251 0.7607
Cultural Distance 0.1243 -0.1215 0.0126 -0.4214 -0.1214 0.4571 0.4552 0.1983 0.6589 0.6661 0.9645 0.1177 0.6664 0.0867 0.0882 0.4787
Non-English 0.3589 -0.6037 -0.4829 -0.1237 0.2165 -0.0619 0.4639 0.6781 0.1889 0.0172 0.0683 0.6605 0.4383 0.8266 0.0815 0.0055
Composite LOF 0.6937 -0.5630 -0.7446 -0.7750 0.4000 0.1750 0.3429 0.6186 Factor 0.0041 0.0289 0.0015 0.0007 0.1396 0.5327 0.2109 0.0140
36
Table 4 Determinants of Domestic and Foreign Institutional Ownership This table reports estimates from time-series cross-sectional regressions of foreign and domestic institutional ownership on firm characteristics. The coefficients are the time-series average of the coefficients estimated from quarterly cross-sectional regressions from April 1, 1990 to December 31, 2007. The sample consists of firm-quarters with institutional ownership from CDA/Spectrum Institutional (13F) Holdings for which the locations of firm and institution headquarters are available. Foreign (domestic) institutional investors are institutional investors whose headquarters are located outside (in) the U.S. Foreign (domestic) institutional ownership is computed as the number of shares held by foreign (domestic) institutional investors divided by total shares outstanding. Matching domestic institutional ownership represents ownership held by domestic institutions whose size, type, churn rate, and age are matched with those of foreign institutions. Foreign countries are classified as either high or low liability of foreignness (LOF) countries according to the sample median Composite LOF Factor that is created from principal components analysis among eight LOF factors (GAAP Difference, Investor Protection, Disclosure Quality, Earnings Quality, Export, Distance, Cultural Distance, and Non-English). To compare domestic and foreign institutional ownership that have very different distributions, all ownership variables are standardized to have zero mean and unit variance. The appendix provides a detailed description of the construction of the variables. All variables are estimated at the same quarter-end unless noted otherwise. Numbers in parentheses are t-statistics, which are computed as the ratio of the mean of the coefficients from quarterly cross-sectional regressions to the standard error of the distribution of the coefficients. ***, **, * denote significance at the .01, .05, .10 levels, respectively, in a two-tailed test.
Independent
variables
Domestic
institutional ownership
Foreign
institutional ownership
Matching domestic
institutional ownership
Institutional ownership
from high LOF countries
Institutional ownership
from low LOF countries
Test-of-difference:
t-statistics (1) (2) (3) (4) (5) (2) – (3) (4) - (5)
Intercept
-0.8879*** (-26.51)
-1.0136*** (-23.72)
-0.0046 (-0.07)
-0.7532*** (-14.61)
-0.5265*** (-6.21)
-13.01***
-3.79***
Illiquidity -3.519*** (-6.67)
-1.240*** (-4.47)
-0.126 (-0.28)
-2.841*** (-4.40)
0.850*** (3.09)
-2.58**
-5.32***
Market-to-Book
-0.0548*** (-29.76)
-0.0292*** (-22.72)
-0.0133*** (-4.00)
-0.0174*** (-11.37)
-0.0311*** (-13.70)
-4.62***
4.36***
Log (Size) 0.1665*** (23.37)
0.1514*** (13.24)
-0.0112 (-1.33)
0.0610*** (5.34)
0.1090*** (8.41)
13.11***
-7.91***
Return Volatility -2.3695*** (-24.36)
-0.4304*** (-8.29)
-1.1441*** (-9.07)
-1.0575*** (-13.66)
0.2984*** (2.86)
6.17***
-9.69***
Turnovert-6, t 2.9142*** (27.93)
1.2297*** (8.88)
0.9637*** (9.10)
1.7097*** (10.86)
0.2757*** (5.54)
2.34**
7.68***
Price ($)
0.0114 *** (25.73)
0.0008** (2.07)
0.0047*** (11.79)
0.0039*** (14.32)
-0.0025*** (-4.47)
-7.89***
9.95***
SP500 (dummy)
-0.1016*** (-5.98)
0.1515*** (8.10)
0.1567*** (5.70)
0.4194*** (26.32)
-0.0127 (-0.66)
0.13
26.29***
MRETt-6, t 0.0119 (0.69)
-0.0532*** (-5.44)
0.0032 (0.18)
-0.0080 (-0.63)
-0.0156 (-0.73)
-2.74*** 0.29
MRETt-12, t-7 0.0036 (0.19)
-0.0338*** (-3.56)
-0.0387** (-1.97)
-0.0221** (-1.97)
-0.0300 (-1.51)
0.22 0.34
Age (months) 0.0002*** (9.81)
0.0001*** (6.82)
0.0000 (-0.42)
0.0003*** (11.36)
-0.0000 (-0.68)
3.97***
7.74***
Dividend Yield -20.00*** (-12.22)
3.81*** (4.16)
-7.95*** (-5.32)
6.83*** (4.67)
-2.07 (-1.36)
6.80***
3.36***
R&D 0.4837*** (3.03)
0.9537*** (4.52)
-1.1275*** (-4.24)
1.1265*** (5.23)
-0.8968** (-2.18)
5.34***
4.71***
Accruals -0.1966*** (-10.10)
-0.0938*** (-5.24)
-0.0448 (-1.14)
-0.1795*** (-7.52)
-0.0366 (-0.72)
-1.12
-2.53**
Observations 174,574 174,574 148,579 160,165 160,165 - - Average R2 0.45 0.24 0.06 0.28 0.07 - -
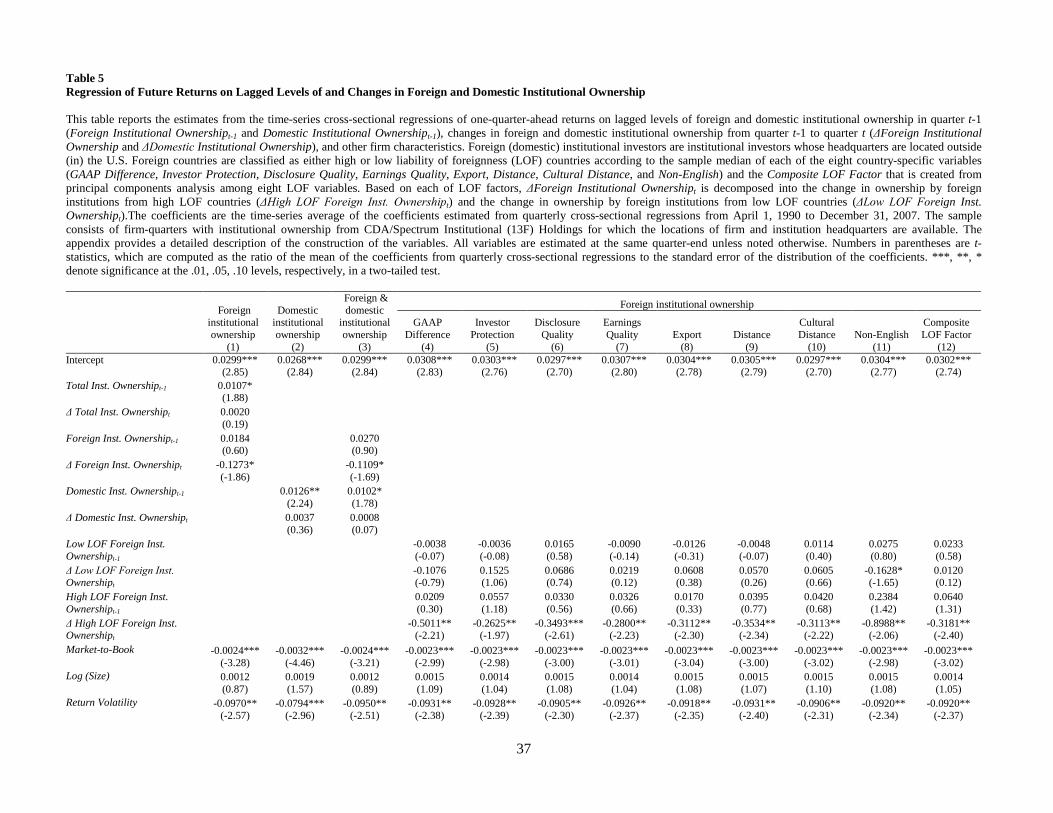
37
Table 5 Regression of Future Returns on Lagged Levels of and Changes in Foreign and Domestic Institutional Ownership This table reports the estimates from the time-series cross-sectional regressions of one-quarter-ahead returns on lagged levels of foreign and domestic institutional ownership in quarter t-1 (Foreign Institutional Ownershipt-1 and Domestic Institutional Ownershipt-1), changes in foreign and domestic institutional ownership from quarter t-1 to quarter t (ΔForeign Institutional Ownership and ΔDomestic Institutional Ownership), and other firm characteristics. Foreign (domestic) institutional investors are institutional investors whose headquarters are located outside (in) the U.S. Foreign countries are classified as either high or low liability of foreignness (LOF) countries according to the sample median of each of the eight country-specific variables (GAAP Difference, Investor Protection, Disclosure Quality, Earnings Quality, Export, Distance, Cultural Distance, and Non-English) and the Composite LOF Factor that is created from principal components analysis among eight LOF variables. Based on each of LOF factors, ΔForeign Institutional Ownershipt is decomposed into the change in ownership by foreign institutions from high LOF countries (ΔHigh LOF Foreign Inst. Ownershipt) and the change in ownership by foreign institutions from low LOF countries (ΔLow LOF Foreign Inst. Ownershipt).The coefficients are the time-series average of the coefficients estimated from quarterly cross-sectional regressions from April 1, 1990 to December 31, 2007. The sample consists of firm-quarters with institutional ownership from CDA/Spectrum Institutional (13F) Holdings for which the locations of firm and institution headquarters are available. The appendix provides a detailed description of the construction of the variables. All variables are estimated at the same quarter-end unless noted otherwise. Numbers in parentheses are t-statistics, which are computed as the ratio of the mean of the coefficients from quarterly cross-sectional regressions to the standard error of the distribution of the coefficients. ***, **, * denote significance at the .01, .05, .10 levels, respectively, in a two-tailed test.
Foreign institutional ownership
(1)
Domestic institutional ownership
(2)
Foreign & domestic
institutional ownership
(3)
Foreign institutional ownership
GAAP Difference
(4)
Investor Protection
(5)
Disclosure Quality
(6)
Earnings Quality
(7)
Export
(8)
Distance
(9)
Cultural Distance
(10)
Non-English
(11)
Composite LOF Factor
(12) Intercept 0.0299***
(2.85) 0.0268***
(2.84) 0.0299***
(2.84) 0.0308***
(2.83) 0.0303***
(2.76) 0.0297***
(2.70) 0.0307***
(2.80) 0.0304***
(2.78) 0.0305***
(2.79) 0.0297***
(2.70) 0.0304***
(2.77) 0.0302***
(2.74) Total Inst. Ownershipt-1 0.0107*
(1.88)
Δ Total Inst. Ownershipt 0.0020 (0.19)
Foreign Inst. Ownershipt-1 0.0184 (0.60)
0.0270 (0.90)
Δ Foreign Inst. Ownershipt -0.1273* (-1.86)
-0.1109* (-1.69)
Domestic Inst. Ownershipt-1 0.0126**
(2.24) 0.0102* (1.78)
Δ Domestic Inst. Ownershipt 0.0037 (0.36)
0.0008 (0.07)
Low LOF Foreign Inst. Ownershipt-1
-0.0038 (-0.07)
-0.0036 (-0.08)
0.0165 (0.58)
-0.0090 (-0.14)
-0.0126 (-0.31)
-0.0048 (-0.07)
0.0114 (0.40)
0.0275 (0.80)
0.0233 (0.58)
Δ Low LOF Foreign Inst. Ownershipt
-0.1076 (-0.79)
0.1525 (1.06)
0.0686 (0.74)
0.0219 (0.12)
0.0608 (0.38)
0.0570 (0.26)
0.0605 (0.66)
-0.1628* (-1.65)
0.0120 (0.12)
High LOF Foreign Inst. Ownershipt-1 0.0209
(0.30) 0.0557 (1.18)
0.0330 (0.56)
0.0326 (0.66)
0.0170 (0.33)
0.0395 (0.77)
0.0420 (0.68)
0.2384 (1.42)
0.0640 (1.31)
Δ High LOF Foreign Inst. Ownershipt
-0.5011** (-2.21)
-0.2625** (-1.97)
-0.3493*** (-2.61)
-0.2800** (-2.23)
-0.3112** (-2.30)
-0.3534** (-2.34)
-0.3113** (-2.22)
-0.8988** (-2.06)
-0.3181** (-2.40)
Market-to-Book -0.0024*** (-3.28)
-0.0032*** (-4.46)
-0.0024*** (-3.21)
-0.0023*** (-2.99)
-0.0023*** (-2.98)
-0.0023*** (-3.00)
-0.0023*** (-3.01)
-0.0023*** (-3.04)
-0.0023*** (-3.00)
-0.0023*** (-3.02)
-0.0023*** (-2.98)
-0.0023*** (-3.02)
Log (Size) 0.0012 (0.87)
0.0019 (1.57)
0.0012 (0.89)
0.0015 (1.09)
0.0014 (1.04)
0.0015 (1.08)
0.0014 (1.04)
0.0015 (1.08)
0.0015 (1.07)
0.0015 (1.10)
0.0015 (1.08)
0.0014 (1.05)
Return Volatility -0.0970** (-2.57)
-0.0794*** (-2.96)
-0.0950** (-2.51)
-0.0931** (-2.38)
-0.0928** (-2.39)
-0.0905** (-2.30)
-0.0926** (-2.37)
-0.0918** (-2.35)
-0.0931** (-2.40)
-0.0906** (-2.31)
-0.0920** (-2.34)
-0.0920** (-2.37)
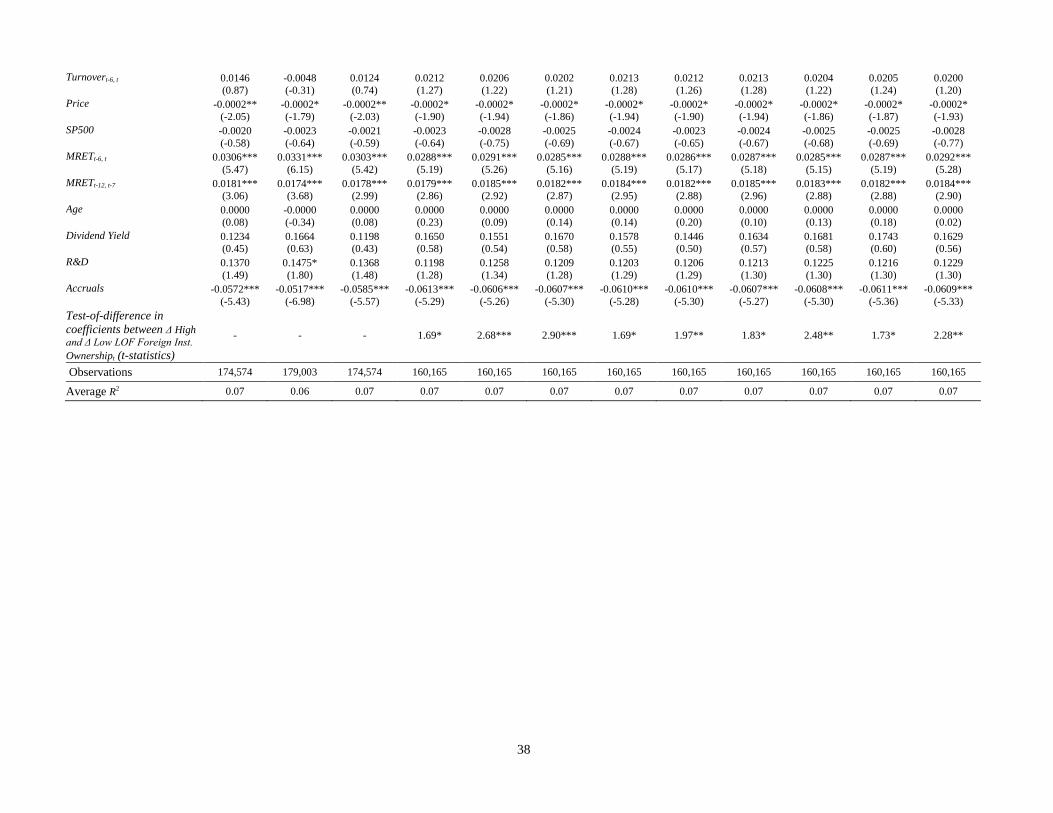
38
Turnovert-6, t 0.0146 (0.87)
-0.0048 (-0.31)
0.0124 (0.74)
0.0212 (1.27)
0.0206 (1.22)
0.0202 (1.21)
0.0213 (1.28)
0.0212 (1.26)
0.0213 (1.28)
0.0204 (1.22)
0.0205 (1.24)
0.0200 (1.20)
Price -0.0002** (-2.05)
-0.0002* (-1.79)
-0.0002** (-2.03)
-0.0002* (-1.90)
-0.0002* (-1.94)
-0.0002* (-1.86)
-0.0002* (-1.94)
-0.0002* (-1.90)
-0.0002* (-1.94)
-0.0002* (-1.86)
-0.0002* (-1.87)
-0.0002* (-1.93)
SP500 -0.0020 (-0.58)
-0.0023 (-0.64)
-0.0021 (-0.59)
-0.0023 (-0.64)
-0.0028 (-0.75)
-0.0025 (-0.69)
-0.0024 (-0.67)
-0.0023 (-0.65)
-0.0024 (-0.67)
-0.0025 (-0.68)
-0.0025 (-0.69)
-0.0028 (-0.77)
MRETt-6, t 0.0306*** (5.47)
0.0331*** (6.15)
0.0303*** (5.42)
0.0288*** (5.19)
0.0291*** (5.26)
0.0285*** (5.16)
0.0288*** (5.19)
0.0286*** (5.17)
0.0287*** (5.18)
0.0285*** (5.15)
0.0287*** (5.19)
0.0292*** (5.28)
MRETt-12, t-7 0.0181*** (3.06)
0.0174*** (3.68)
0.0178*** (2.99)
0.0179*** (2.86)
0.0185*** (2.92)
0.0182*** (2.87)
0.0184*** (2.95)
0.0182*** (2.88)
0.0185*** (2.96)
0.0183*** (2.88)
0.0182*** (2.88)
0.0184*** (2.90)
Age 0.0000 (0.08)
-0.0000 (-0.34)
0.0000 (0.08)
0.0000 (0.23)
0.0000 (0.09)
0.0000 (0.14)
0.0000 (0.14)
0.0000 (0.20)
0.0000 (0.10)
0.0000 (0.13)
0.0000 (0.18)
0.0000 (0.02)
Dividend Yield 0.1234 (0.45)
0.1664 (0.63)
0.1198 (0.43)
0.1650 (0.58)
0.1551 (0.54)
0.1670 (0.58)
0.1578 (0.55)
0.1446 (0.50)
0.1634 (0.57)
0.1681 (0.58)
0.1743 (0.60)
0.1629 (0.56)
R&D 0.1370 (1.49)
0.1475* (1.80)
0.1368 (1.48)
0.1198 (1.28)
0.1258 (1.34)
0.1209 (1.28)
0.1203 (1.29)
0.1206 (1.29)
0.1213 (1.30)
0.1225 (1.30)
0.1216 (1.30)
0.1229 (1.30)
Accruals -0.0572*** (-5.43)
-0.0517*** (-6.98)
-0.0585*** (-5.57)
-0.0613*** (-5.29)
-0.0606*** (-5.26)
-0.0607*** (-5.30)
-0.0610*** (-5.28)
-0.0610*** (-5.30)
-0.0607*** (-5.27)
-0.0608*** (-5.30)
-0.0611*** (-5.36)
-0.0609*** (-5.33)
Test-of-difference in coefficients between Δ High and Δ Low LOF Foreign Inst. Ownershipt (t-statistics)
- - - 1.69* 2.68*** 2.90*** 1.69* 1.97** 1.83* 2.48** 1.73* 2.28**
Observations 174,574 179,003 174,574 160,165 160,165 160,165 160,165 160,165 160,165 160,165 160,165 160,165
Average R2 0.07 0.06 0.07 0.07 0.07 0.07 0.07 0.07 0.07 0.07 0.07 0.07
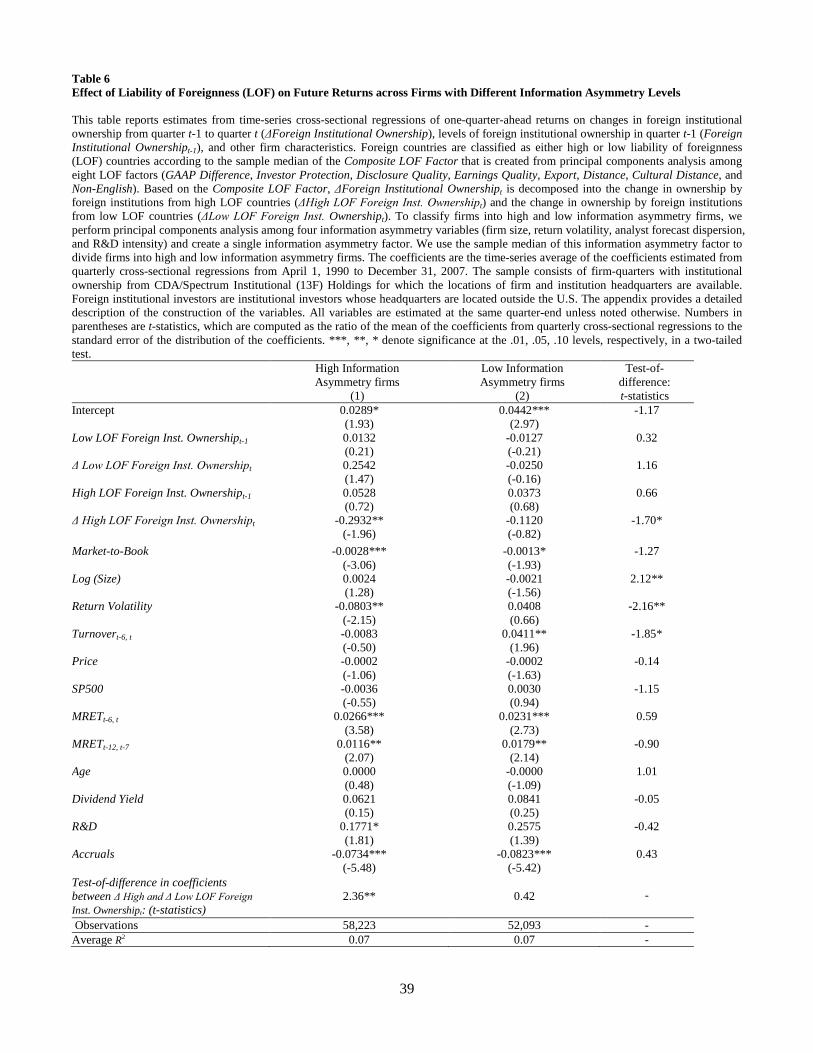
39
Table 6 Effect of Liability of Foreignness (LOF) on Future Returns across Firms with Different Information Asymmetry Levels This table reports estimates from time-series cross-sectional regressions of one-quarter-ahead returns on changes in foreign institutional ownership from quarter t-1 to quarter t (ΔForeign Institutional Ownership), levels of foreign institutional ownership in quarter t-1 (Foreign Institutional Ownershipt-1), and other firm characteristics. Foreign countries are classified as either high or low liability of foreignness (LOF) countries according to the sample median of the Composite LOF Factor that is created from principal components analysis among eight LOF factors (GAAP Difference, Investor Protection, Disclosure Quality, Earnings Quality, Export, Distance, Cultural Distance, and Non-English). Based on the Composite LOF Factor, ΔForeign Institutional Ownershipt is decomposed into the change in ownership by foreign institutions from high LOF countries (ΔHigh LOF Foreign Inst. Ownershipt) and the change in ownership by foreign institutions from low LOF countries (ΔLow LOF Foreign Inst. Ownershipt). To classify firms into high and low information asymmetry firms, we perform principal components analysis among four information asymmetry variables (firm size, return volatility, analyst forecast dispersion, and R&D intensity) and create a single information asymmetry factor. We use the sample median of this information asymmetry factor to divide firms into high and low information asymmetry firms. The coefficients are the time-series average of the coefficients estimated from quarterly cross-sectional regressions from April 1, 1990 to December 31, 2007. The sample consists of firm-quarters with institutional ownership from CDA/Spectrum Institutional (13F) Holdings for which the locations of firm and institution headquarters are available. Foreign institutional investors are institutional investors whose headquarters are located outside the U.S. The appendix provides a detailed description of the construction of the variables. All variables are estimated at the same quarter-end unless noted otherwise. Numbers in parentheses are t-statistics, which are computed as the ratio of the mean of the coefficients from quarterly cross-sectional regressions to the standard error of the distribution of the coefficients. ***, **, * denote significance at the .01, .05, .10 levels, respectively, in a two-tailed test.
High Information Asymmetry firms
(1)
Low Information Asymmetry firms
(2)
Test-of-difference: t-statistics
Intercept 0.0289* (1.93)
0.0442*** (2.97)
-1.17
Low LOF Foreign Inst. Ownershipt-1 0.0132 (0.21)
-0.0127 (-0.21)
0.32
Δ Low LOF Foreign Inst. Ownershipt 0.2542 (1.47)
-0.0250 (-0.16)
1.16
High LOF Foreign Inst. Ownershipt-1 0.0528 (0.72)
0.0373 (0.68)
0.66
Δ High LOF Foreign Inst. Ownershipt -0.2932** (-1.96)
-0.1120 (-0.82)
-1.70*
Market-to-Book -0.0028*** (-3.06)
-0.0013* (-1.93)
-1.27
Log (Size) 0.0024 (1.28)
-0.0021 (-1.56)
2.12**
Return Volatility -0.0803** (-2.15)
0.0408 (0.66)
-2.16**
Turnovert-6, t -0.0083 (-0.50)
0.0411** (1.96)
-1.85*
Price -0.0002 (-1.06)
-0.0002 (-1.63)
-0.14
SP500 -0.0036 (-0.55)
0.0030 (0.94)
-1.15
MRETt-6, t 0.0266*** (3.58)
0.0231*** (2.73)
0.59
MRETt-12, t-7 0.0116** (2.07)
0.0179** (2.14)
-0.90
Age 0.0000 (0.48)
-0.0000 (-1.09)
1.01
Dividend Yield 0.0621 (0.15)
0.0841 (0.25)
-0.05
R&D 0.1771* (1.81)
0.2575 (1.39)
-0.42
Accruals -0.0734*** (-5.48)
-0.0823*** (-5.42)
0.43
Test-of-difference in coefficients between Δ High and Δ Low LOF Foreign Inst. Ownershipt: (t-statistics)
2.36** 0.42 -
Observations 58,223 52,093 - Average R2 0.07 0.07 -
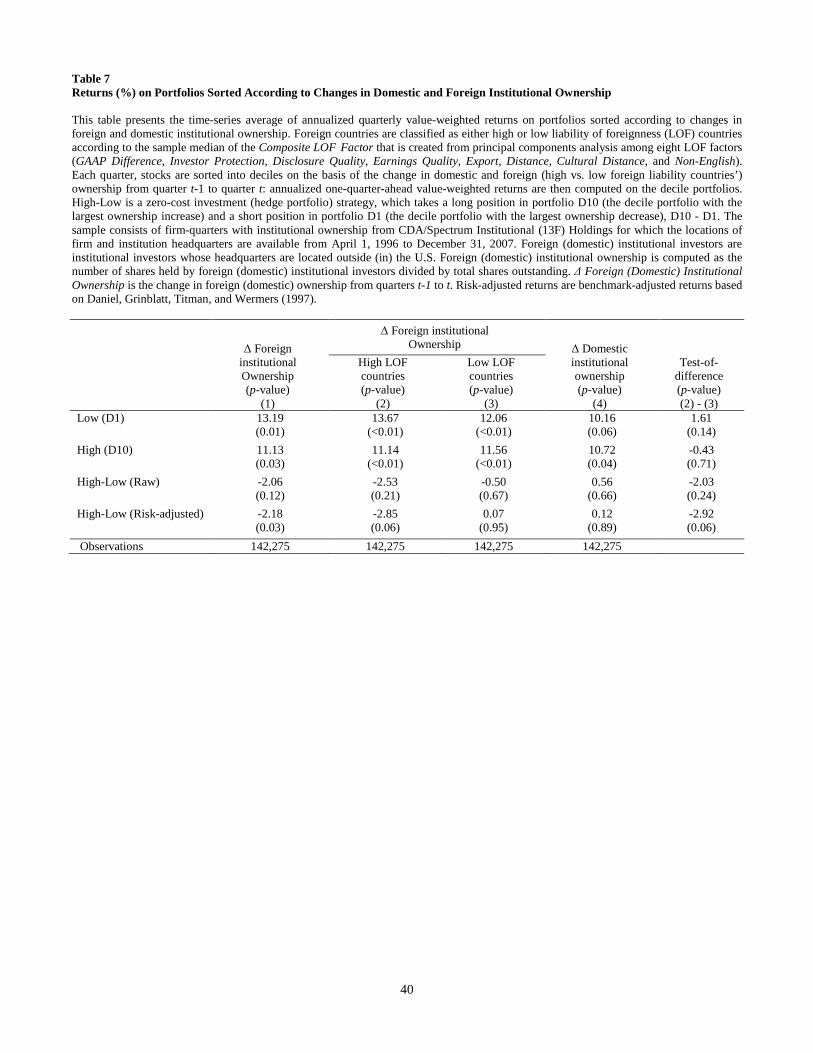
40
Table 7 Returns (%) on Portfolios Sorted According to Changes in Domestic and Foreign Institutional Ownership This table presents the time-series average of annualized quarterly value-weighted returns on portfolios sorted according to changes in foreign and domestic institutional ownership. Foreign countries are classified as either high or low liability of foreignness (LOF) countries according to the sample median of the Composite LOF Factor that is created from principal components analysis among eight LOF factors (GAAP Difference, Investor Protection, Disclosure Quality, Earnings Quality, Export, Distance, Cultural Distance, and Non-English). Each quarter, stocks are sorted into deciles on the basis of the change in domestic and foreign (high vs. low foreign liability countries’) ownership from quarter t-1 to quarter t: annualized one-quarter-ahead value-weighted returns are then computed on the decile portfolios. High-Low is a zero-cost investment (hedge portfolio) strategy, which takes a long position in portfolio D10 (the decile portfolio with the largest ownership increase) and a short position in portfolio D1 (the decile portfolio with the largest ownership decrease), D10 - D1. The sample consists of firm-quarters with institutional ownership from CDA/Spectrum Institutional (13F) Holdings for which the locations of firm and institution headquarters are available from April 1, 1996 to December 31, 2007. Foreign (domestic) institutional investors are institutional investors whose headquarters are located outside (in) the U.S. Foreign (domestic) institutional ownership is computed as the number of shares held by foreign (domestic) institutional investors divided by total shares outstanding. Δ Foreign (Domestic) Institutional Ownership is the change in foreign (domestic) ownership from quarters t-1 to t. Risk-adjusted returns are benchmark-adjusted returns based on Daniel, Grinblatt, Titman, and Wermers (1997).
Δ Foreign institutional Ownership (p-value)
(1)
Δ Foreign institutional Ownership Δ Domestic
institutional ownership (p-value)
(4)
High LOF
countries (p-value)
(2)
Low LOF countries (p-value)
(3)
Test-of-difference (p-value) (2) - (3)
Low (D1) 13.19 (0.01)
13.67 (<0.01)
12.06 (<0.01)
10.16 (0.06)
1.61 (0.14)
High (D10) 11.13 (0.03)
11.14 (<0.01)
11.56 (<0.01)
10.72 (0.04)
-0.43 (0.71)
High-Low (Raw) -2.06 (0.12)
-2.53 (0.21)
-0.50 (0.67)
0.56 (0.66)
-2.03 (0.24)
High-Low (Risk-adjusted) -2.18 (0.03)
-2.85 (0.06)
0.07 (0.95)
0.12 (0.89)
-2.92 (0.06)
Observations 142,275 142,275 142,275 142,275
41
Appendix Variable definitions This appendix provides a detailed description of the construction of all the variables used in the tables.
Variable Definition
Ownership-specific Variables:
Foreign (Domestic) Institutional Ownershipt-1
Number of shares held by foreign (domestic) institutional investors divided by total shares outstanding in quarter t-1.
Δ Foreign (Domestic) Institutional Ownershipt
Change in foreign (domestic) institutional ownership from quarters t-1 to t.
High (Low) LOF Foreign Inst. Ownershipt-1
Number of shares held by foreign institutional investors who are from countries with high (low) LOF factor, divided by total shares outstanding in quarter t-1. Foreign countries are classified as either high or low LOF countries according to the sample median of each of the eight country-specific factors (GAAP Difference, Investor Protection, Disclosure Quality, Earnings Quality, Export, Distance, Cultural Distance, and Non-English) and the Composite LOF Factor.
Δ High (Low) LOF Foreign Inst. Ownershipt
Change in foreign institutional ownership from countries with high (low) LOF factor from quarters t-1 to t.
Total Institutional Ownershipt-1
Number of shares held by all institutional investors divided by total shares outstanding in quarter t-1.
Δ Total Institutional Ownershipt
Change in total institutional ownership from quarters t-1 to t.
Firm-specific Variables:
Accrualst Total accruals calculated as net income less operating cash, divided by lagged total assets.
Aget Number of months passed since the first appearance of a firm’s stock return in the CRSP database.
Dividend Yieldt Cash dividend divided by share price. We may want to move the above three right above market to book.
Illiquidityt Quarter t-1 average daily absolute return divided by the daily dollar trading volume times one thousand (Amihud 2002).
Market-to-Bookt Ratio of the market capitalization to the book value of equity in quarter t.
MRETt-6, t Preceding 6-month cumulative market-adjusted return.
MRETt-12, t-7 Penultimate 6-month cumulative market-adjusted return.
Pricet Quarter-end share price from COMPUSTAT.
R&Dt Research and development expenditures divided by total assets.
RETt,t+3 One-quarter-ahead stock return (i.e., buy-and-hold return).
Return Volatilityt Standard deviation of monthly returns over the previous 24 months.
Sizet Market capitalization calculated as the number of shares outstanding times quarter-end stock price in quarter t.
SP500t (indicator) Indicator that takes the value of one if the firm is included in the S&P 500 index, and zero otherwise.
Turnovert-6, t Ratio of the average monthly trading volume to the number of shares outstanding over the previous 6 months.
LOF Characteristics Institutional Distance: GAAP Difference GAAP difference between the foreign country and the U.S. calculated by identifying 21 key accounting
areas from prior literature and using both IAS section numbers and the accompanying text from GAAP 2001: A Survey of National Accounting Rules Benchmarked Against International Accounting Standards (Nobes 2001) (Bae, Tan, and Welker 2008).
Investor Protection A principal component of private enforcement and anti-director rights, scaled from 0 to 10 (La Porta, Lopez-de-Silanes, Shleifer, and Vishny 1999).
Information Costs:
42
Disclosure Quality An index created by the Center for International Financial Analysis and Research to rate the annual reports of the companies of the corresponding countries on their inclusion or omission of 90 items falling in the categories of general information, income statements, balance sheets, funds flow statement, accounting standards, stock data, and special items (La Porta, Lopez-de-Silanes, Shleifer, and Vishny 1998).
Earnings Quality A composite index of the following four earnings management measures: 1) a country’s median ratio of the firm-level standard deviation of operating income and operation cash flow, 2) a country’s Spearman correlation between the change in accruals and the change in cash flow from operations, 3) a country’s median ratio of the absolute value of accruals and the absolute value of cash flow from operations, and 4) the number of “small profits” divided by the number of “small losses” for each country (Leuz, Nanda, and Wysocki 2003). We multiply this composite index by negative one.
Unfamiliarity Costs: Export A country’s total exports in US$ billion. Distance Physical distance between the economic center (the largest city in terms of population) of the foreign
country and the U.S. Cultural Differences: Cultural Distance Kogut and Singh’s (1988) index of Cultural Distance. The index is based on the differences in scores
along each of Hofstede’s (2001) four cultural dimensions - power distance, uncertainty avoidance,
individualism, and masculinity. Specifically, ∑=
−=
4
1 4
/2)(
i
iViusIijICD j , where CDj is the cultural
distance between country j and the U.S., Iij is country j’s score on the ith cultural dimension, Ius is the score of the U.S. on this dimension, and Vi is the variance of the score on the dimension.
Non-English Indicator that takes the value of one if English is not the primary language of the foreign country and zero otherwise.
Composite LOF Factor A composite factor from principal components analysis among eight LOF variables above.