Embed Size (px)
Citation preview
The Legalization of Marijuana in Colorado: The Impact Volume 5 – 2018, UPDATE
REPORT AVAILABLE AT:
www.RMHIDTA.org
(Click on the “Reports” tab)
PREPARED BY THE ROCKY MOUNTAIN HIDTA
STRATEGIC INTELLIGENCE UNIT
SEPTEMBER 2018
The Legalization of Marijuana in Colorado: The Impact Volume 5 – 2018, UPDATE
Table of Contents i
Table of Contents
Table of Contents i
Executive Summary 1
Introduction 5
Purpose 5
Background 5
Section I: Traffic Fatalities & Impaired Driving 7
Some Findings 7
Definitions by Rocky Mountain HIDTA 8
Traffic Fatalities 9
Impaired Driving 16
Impaired Driving Information 18
Section II: Marijuana Use 21
Some Findings 21
National Survey on Drug Use and Health (NSDUH) Data 22
Healthy Kids Colorado Survey (HKCS) Data 27
Youth Risk Behavior Surveillance System (YRBSS) Data 31
Marijuana Use Information 32
Section III: Public Health 35
Some Findings 35
Definitions by Rocky Mountain HIDTA 36
Emergency Department Data 37
Hospitalization Data 39
Poison Control/ Marijuana Exposure Data 42
Treatment Data 44
Suicide Data 46
The Legalization of Marijuana in Colorado: The Impact Volume 5 – 2018, UPDATE
Table of Contents ii
Public Health Information 49
Section IV: Black Market 53
Some Findings 53
Definitions by Rocky Mountain HIDTA 53
Task Force Investigations 54
Highway Interdiction Data 57
Parcel Interdiction Data 60
Public Lands 63
Black Market Information 63
Section V: Societal Impact 71
Some Findings 71
Tax Revenue 71
Crime 73
Local Response 75
Medical Marijuana Statistics 76
Alcohol Consumption 77
Societal Impact Information 77
Section VI: Marijuana Industry 79
Some Findings 79
Business 80
Market Size and Demand 81
Reported Sales of Marijuana in Colorado 82
Pricing and Potency Trends 84
Resource Consumption 87
Marijuana Industry Information 88
The Legalization of Marijuana in Colorado: The Impact Volume 5 – 2018, UPDATE
Executive Summary 1
Executive Summary
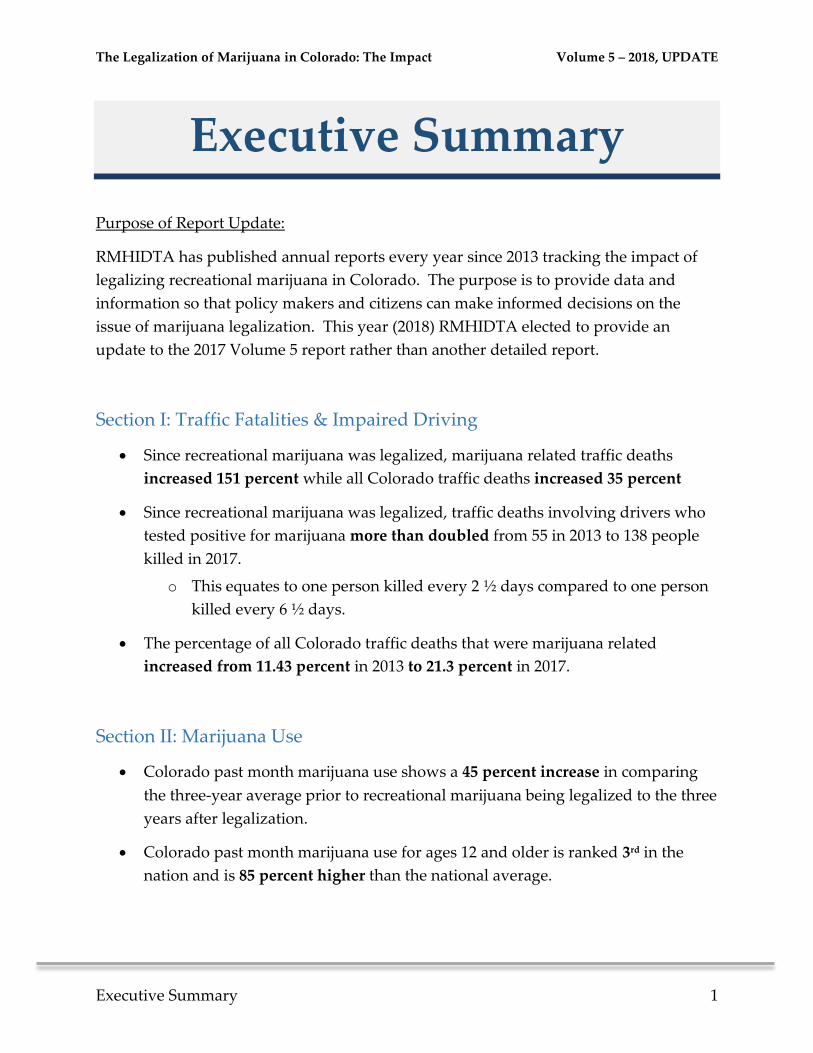
Purpose of Report Update:
RMHIDTA has published annual reports every year since 2013 tracking the impact of
legalizing recreational marijuana in Colorado. The purpose is to provide data and
information so that policy makers and citizens can make informed decisions on the
issue of marijuana legalization. This year (2018) RMHIDTA elected to provide an
update to the 2017 Volume 5 report rather than another detailed report.
Section I: Traffic Fatalities & Impaired Driving
Since recreational marijuana was legalized, marijuana related traffic deaths
increased 151 percent while all Colorado traffic deaths increased 35 percent
Since recreational marijuana was legalized, traffic deaths involving drivers who
tested positive for marijuana more than doubled from 55 in 2013 to 138 people
killed in 2017.
o This equates to one person killed every 2 ½ days compared to one person
killed every 6 ½ days.
The percentage of all Colorado traffic deaths that were marijuana related
increased from 11.43 percent in 2013 to 21.3 percent in 2017.
Section II: Marijuana Use
Colorado past month marijuana use shows a 45 percent increase in comparing
the three-year average prior to recreational marijuana being legalized to the three
years after legalization.
Colorado past month marijuana use for ages 12 and older is ranked 3rd in the
nation and is 85 percent higher than the national average.
The Legalization of Marijuana in Colorado: The Impact Volume 5 – 2018, UPDATE
Executive Summary 2
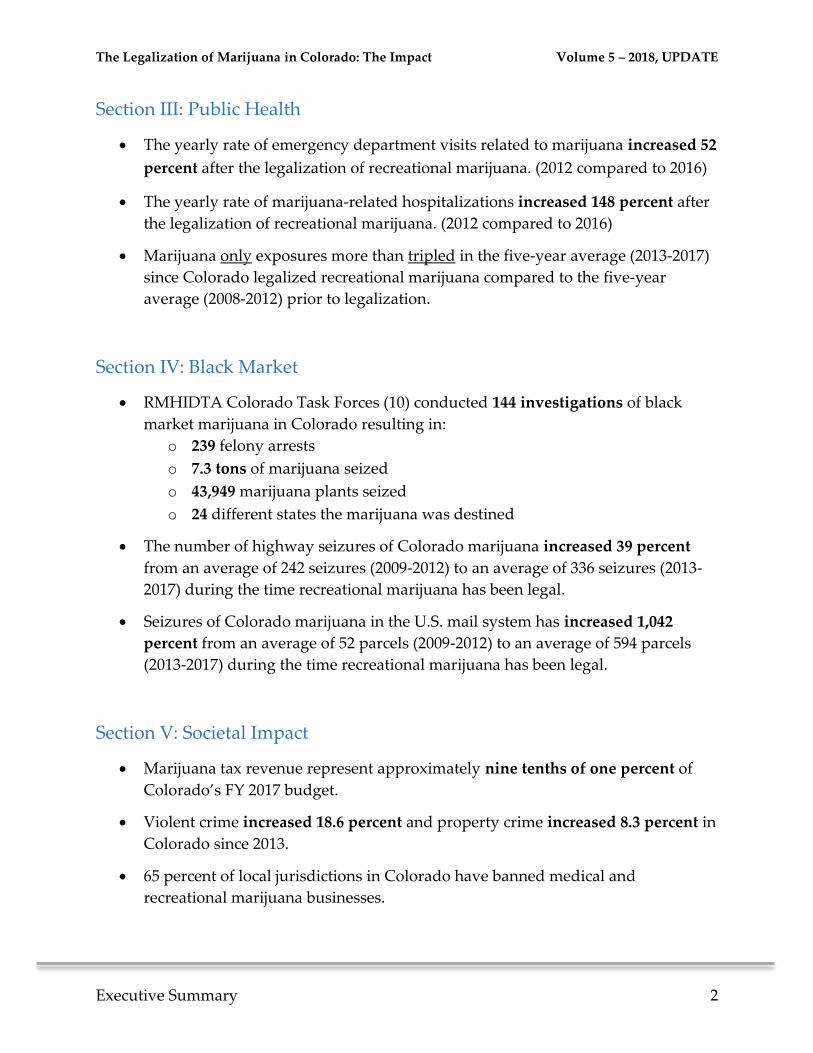
Section III: Public Health
The yearly rate of emergency department visits related to marijuana increased 52
percent after the legalization of recreational marijuana. (2012 compared to 2016)
The yearly rate of marijuana-related hospitalizations increased 148 percent after
the legalization of recreational marijuana. (2012 compared to 2016)
Marijuana only exposures more than tripled in the five-year average (2013-2017)
since Colorado legalized recreational marijuana compared to the five-year
average (2008-2012) prior to legalization.
Section IV: Black Market
RMHIDTA Colorado Task Forces (10) conducted 144 investigations of black
market marijuana in Colorado resulting in:
o 239 felony arrests
o 7.3 tons of marijuana seized
o 43,949 marijuana plants seized
o 24 different states the marijuana was destined
The number of highway seizures of Colorado marijuana increased 39 percent
from an average of 242 seizures (2009-2012) to an average of 336 seizures (2013-
2017) during the time recreational marijuana has been legal.
Seizures of Colorado marijuana in the U.S. mail system has increased 1,042
percent from an average of 52 parcels (2009-2012) to an average of 594 parcels
(2013-2017) during the time recreational marijuana has been legal.
Section V: Societal Impact
Marijuana tax revenue represent approximately nine tenths of one percent of
Colorado’s FY 2017 budget.
Violent crime increased 18.6 percent and property crime increased 8.3 percent in
Colorado since 2013.
65 percent of local jurisdictions in Colorado have banned medical and
recreational marijuana businesses.
The Legalization of Marijuana in Colorado: The Impact Volume 5 – 2018, UPDATE
Executive Summary 3
Section IV: Marijuana Industry
According to the Marijuana Policy Group, Market Size and Demand for
Marijuana in Colorado 2017 Market Update:
o “From 2014 through 2017, average annual adult use flower prices fell 62.0
percent, from $14.05 to $5.34 per gram weighted average.”
o “Adult use concentrate prices fell 47.9 percent, from $41.43 to $21.57 per
gram.”
o “The average THC content of all tested flower in 2017 was 19.6 percent
statewide compared to 17.4 percent in 2016, 16.6 percent in 2015 and 16.4
percent in 2014.”
o “The average potency of concentrated extract products increased steadily
from 56.6 percent THC content by weight in 2014 to 68.6 percent at the
end of 2017.”
As of June 2017, there were 491 retail marijuana stores in the state of Colorado
compared to 392 Starbucks and 208 McDonald’s.
The Legalization of Marijuana in Colorado: The Impact Volume 5 – 2018, UPDATE
Executive Summary 4
THIS PAGE INTENTIALLY LEFT BLANK
The Legalization of Marijuana in Colorado: The Impact Volume 5 – 2018, UPDATE
Introduction 5
Introduction
Purpose
In October of 2017, RMHIDTA issued a detailed report titled “The Legalization of
Marijuana in Colorado: The Impact, Volume 5” (www.RMHIDTA.org click on Reports
tab). This document serves as an abbreviated supplement to Volume 5 to provide
updated data related to marijuana legalization in Colorado. Readers are encouraged to
review Volume 5 as well as this update for a comprehensive understanding of the topic.
These reports were prepared to identify data and trends related to the legalization of
marijuana so that informed decisions can be made regarding this issue.
Background
It is important to note that, for purposes of the debate on legalizing marijuana in
Colorado, there are three distinct timeframes to consider: the early medical marijuana
era (2000-2008), the medical marijuana commercialization era (2009 – current) and the
recreational marijuana era (2013 – current).
2000 – 2008, Early Medical Marijuana Era: In November 2000, Colorado voters
passed Amendment 20 which permitted a qualifying patient, and/or caregiver of
a patient, to possess up to 2 ounces of marijuana and grow 6 marijuana plants for
medical purposes. During that time there were between 1,000 and 4,800 medical
marijuana cardholders and no known dispensaries operating in the state.
2009 – Current, Medical Marijuana Commercialization Era: Beginning in 2009
due to a number of events, marijuana became de facto legalized through the
commercialization of the medical marijuana industry. By the end of 2012, there
were over 100,000 medical marijuana cardholders and 500 licensed dispensaries
operating in Colorado. There were also licensed cultivation operations and edible
manufacturers.
The Legalization of Marijuana in Colorado: The Impact Volume 5 – 2018, UPDATE
Introduction 6
2013 – Current, Recreational Marijuana Legalization Era: In November 2012,
Colorado voters passed Constitutional Amendment 64 which legalized
marijuana for recreational purposes for anyone over the age of 21. The
amendment also allowed for licensed marijuana retail stores, cultivation
operations and edible manufacturers. Retail marijuana businesses became
operational January 1, 2014.
NOTE:
DATA, IF AVAILABLE, WILL COMPARE PRE- AND POST-2009 WHEN MEDICAL
MARIJUANA BECAME COMMERCIALIZED AND AFTER 2013 WHEN RECREATIONAL
MARIJUANA BECAME LEGALIZED.
MULTI-YEAR COMPARISONS ARE GENERALLY BETTER INDICATORS OF TRENDS.
ONE-YEAR FLUCTUATIONS DO NOT NECESSARILY REFLECT A NEW TREND.
PERCENTAGE COMPARISONS MAY BE ROUNDED TO THE NEAREST WHOLE
NUMBER.
PERCENT CHANGES FOUND WITHIN GRAPHS WERE CALCULATED AND ADDED BY
ROCKY MOUNTAIN HIDTA.
THIS REPORT WILL CITE DATASETS WITH TERMS SUCH AS “MARIJUANA-
RELATED” OR “TESTED POSITIVE FOR MARIJUANA.” THAT DOES NOT
NECESSARILY PROVE THAT MARIJUANA WAS THE CAUSE OF THE INCIDENT.
The Legalization of Marijuana in Colorado: The Impact Volume 5 – 2018, UPDATE
Section I: Traffic Fatalities & Impaired Driving 7
Section I: Traffic Fatalities
& Impaired Driving
Some Findings
Since recreational marijuana was legalized, marijuana related traffic deaths
increased 151 percent while all Colorado traffic deaths increased 35 percent
Since recreational marijuana was legalized, traffic deaths involving drivers who
tested positive for marijuana more than doubled from 55 in 2013 to 138 people
killed in 2017.
o This equates to one person killed every 2 ½ days compared to one person
killed every 6 ½ days.
The percentage of all Colorado traffic deaths that were marijuana related
increased from 11.43 percent in 2013 to 21.3 percent in 2017.
Consistent with the past, in 2017, less than half of drivers (42 percent) or half of
operators (50 percent) involved in traffic deaths were tested for drug
impairment.
A Colorado Department of Transportation survey found that 69 percent of self-
identified marijuana users admitted to driving after having consumed
marijuana.
The Legalization of Marijuana in Colorado: The Impact Volume 5 – 2018, UPDATE
Section I: Traffic Fatalities & Impaired Driving 8
Definitions by Rocky Mountain HIDTA
Driving Under the Influence of Drugs (DUID): DUID could include alcohol in
combination with drugs. This is an important measurement since the driver’s ability to
operate a vehicle was sufficiently impaired that it brought his or her driving to the
attention of law enforcement. The erratic driving and the subsequent evidence that the
subject was under the influence of marijuana helps confirm the causation factor.
Marijuana-Related: Also called “marijuana mentions,” is any time marijuana shows up
in the toxicology report. It could be marijuana only or marijuana with other drugs
and/or alcohol.
Marijuana Only: When toxicology results show marijuana and no other drugs or
alcohol.
Fatalities: Any death resulting from a traffic crash involving a motor vehicle.
Operators: Anyone in control of their own movements such as a driver, pedestrian or
bicyclist.
Drivers: An occupant who is in physical control of a transport vehicle. For an out-of-
control vehicle, an occupant who was in control until control was lost.
Personal Conveyance: Non-motorized transport devices such as skateboards,
wheelchairs (including motorized wheelchairs), tricycles, foot scooters, and Segways.
These are more or less non-street legal transport devices.
The Legalization of Marijuana in Colorado: The Impact Volume 5 – 2018, UPDATE
Section I: Traffic Fatalities & Impaired Driving 9
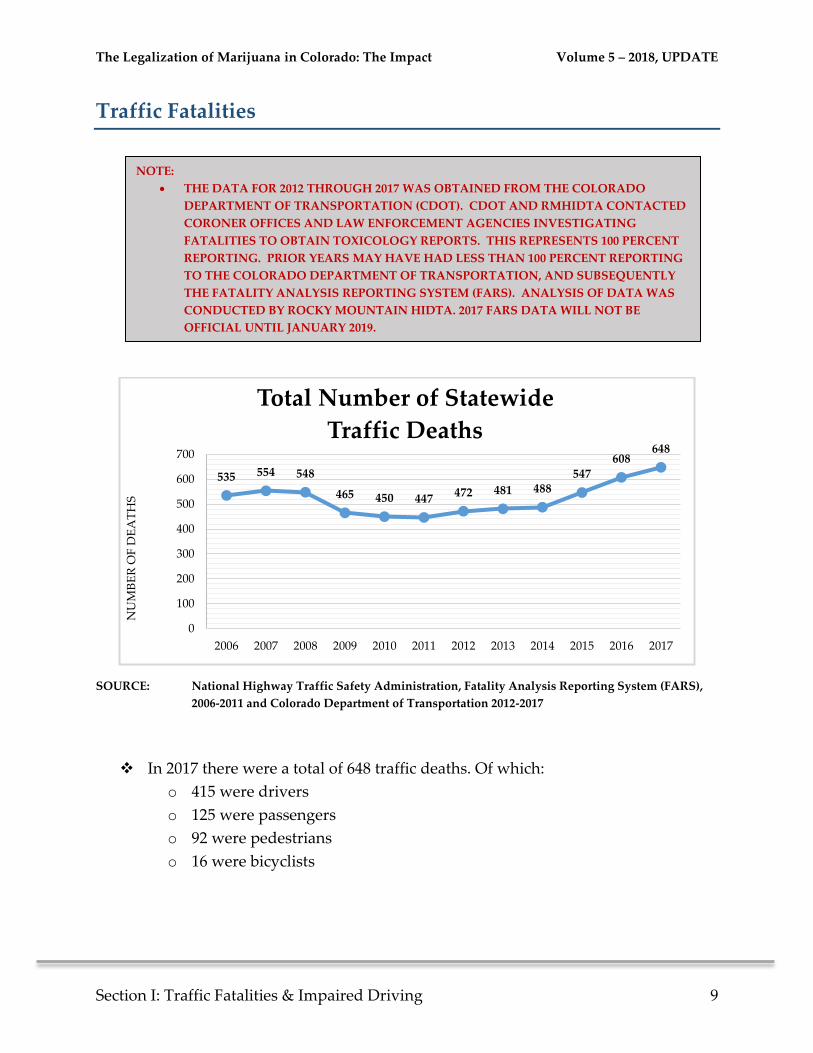
Traffic Fatalities
SOURCE: National Highway Traffic Safety Administration, Fatality Analysis Reporting System (FARS),
2006-2011 and Colorado Department of Transportation 2012-2017
In 2017 there were a total of 648 traffic deaths. Of which:
o 415 were drivers
o 125 were passengers
o 92 were pedestrians
o 16 were bicyclists
535 554 548
465 450 447472 481 488
547608
648
0
100
200
300
400
500
600
700
2006 2007 2008 2009 2010 2011 2012 2013 2014 2015 2016 2017
NU
MB
ER
OF
DE
AT
HS
Total Number of Statewide
Traffic Deaths
NOTE:
THE DATA FOR 2012 THROUGH 2017 WAS OBTAINED FROM THE COLORADO
DEPARTMENT OF TRANSPORTATION (CDOT). CDOT AND RMHIDTA CONTACTED
CORONER OFFICES AND LAW ENFORCEMENT AGENCIES INVESTIGATING
FATALITIES TO OBTAIN TOXICOLOGY REPORTS. THIS REPRESENTS 100 PERCENT
REPORTING. PRIOR YEARS MAY HAVE HAD LESS THAN 100 PERCENT REPORTING
TO THE COLORADO DEPARTMENT OF TRANSPORTATION, AND SUBSEQUENTLY
THE FATALITY ANALYSIS REPORTING SYSTEM (FARS). ANALYSIS OF DATA WAS
CONDUCTED BY ROCKY MOUNTAIN HIDTA. 2017 FARS DATA WILL NOT BE
OFFICIAL UNTIL JANUARY 2019.
The Legalization of Marijuana in Colorado: The Impact Volume 5 – 2018, UPDATE
Section I: Traffic Fatalities & Impaired Driving 10
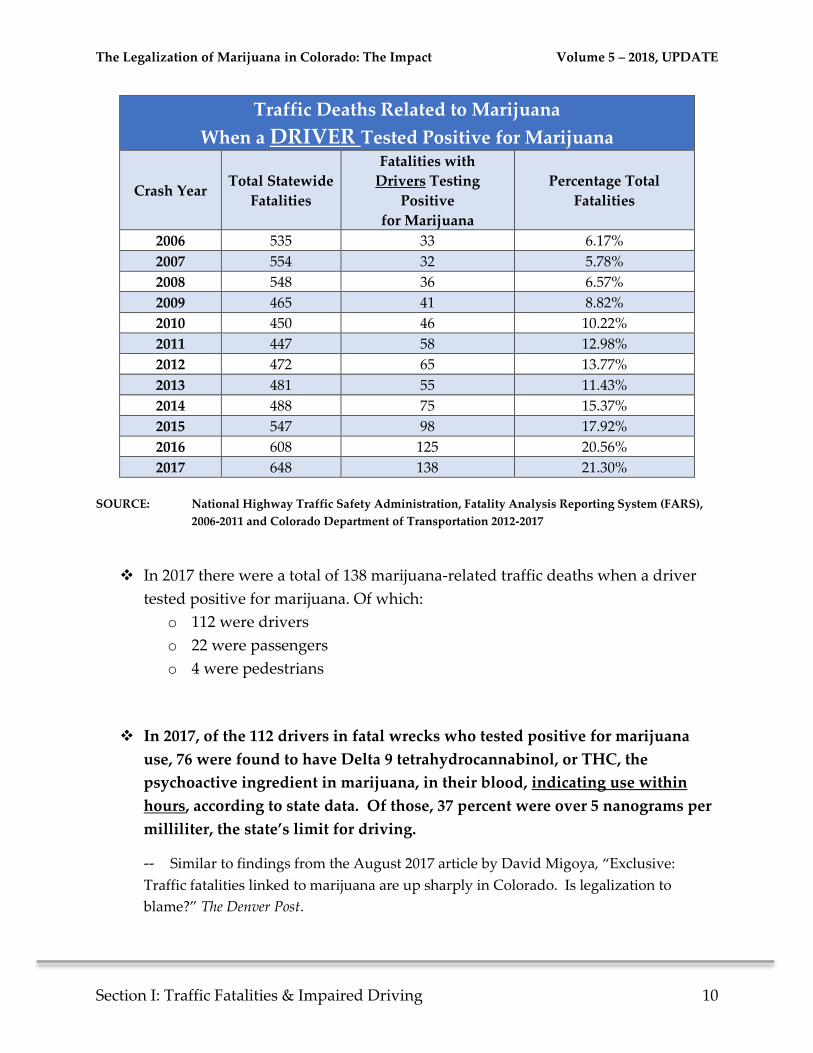
Traffic Deaths Related to Marijuana
When a DRIVER Tested Positive for Marijuana
Crash Year Total Statewide
Fatalities
Fatalities with
Drivers Testing
Positive
for Marijuana
Percentage Total
Fatalities
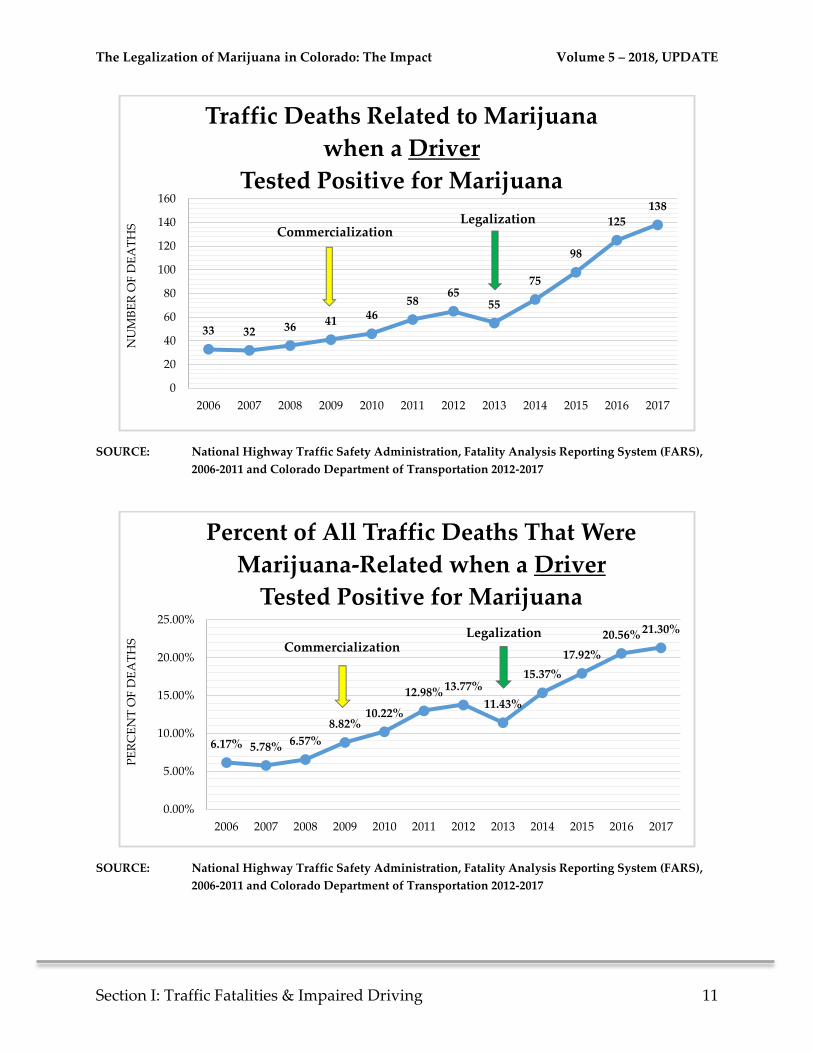
2006 535 33 6.17%
2007 554 32 5.78%
2008 548 36 6.57%
2009 465 41 8.82%
2010 450 46 10.22%
2011 447 58 12.98%
2012 472 65 13.77%
2013 481 55 11.43%
2014 488 75 15.37%
2015 547 98 17.92%
2016 608 125 20.56%
2017 648 138 21.30%
SOURCE: National Highway Traffic Safety Administration, Fatality Analysis Reporting System (FARS),
2006-2011 and Colorado Department of Transportation 2012-2017
In 2017 there were a total of 138 marijuana-related traffic deaths when a driver
tested positive for marijuana. Of which:
o 112 were drivers
o 22 were passengers
o 4 were pedestrians
In 2017, of the 112 drivers in fatal wrecks who tested positive for marijuana
use, 76 were found to have Delta 9 tetrahydrocannabinol, or THC, the
psychoactive ingredient in marijuana, in their blood, indicating use within
hours, according to state data. Of those, 37 percent were over 5 nanograms per
milliliter, the state’s limit for driving.
-- Similar to findings from the August 2017 article by David Migoya, “Exclusive:
Traffic fatalities linked to marijuana are up sharply in Colorado. Is legalization to
blame?” The Denver Post.
The Legalization of Marijuana in Colorado: The Impact Volume 5 – 2018, UPDATE
Section I: Traffic Fatalities & Impaired Driving 11
SOURCE: National Highway Traffic Safety Administration, Fatality Analysis Reporting System (FARS),
2006-2011 and Colorado Department of Transportation 2012-2017
SOURCE: National Highway Traffic Safety Administration, Fatality Analysis Reporting System (FARS),
2006-2011 and Colorado Department of Transportation 2012-2017
33 32 36 41 4658
6555
75
98
125
138
0
20
40
60
80
100
120
140
160
2006 2007 2008 2009 2010 2011 2012 2013 2014 2015 2016 2017
NU
MB
ER
OF
DE
AT
HS
Traffic Deaths Related to Marijuana
when a Driver
Tested Positive for Marijuana
LegalizationCommercialization
6.17% 5.78% 6.57%
8.82%10.22%
12.98% 13.77%
11.43%
15.37%
17.92%
20.56% 21.30%
0.00%
5.00%
10.00%
15.00%
20.00%
25.00%
2006 2007 2008 2009 2010 2011 2012 2013 2014 2015 2016 2017
PE
RC
EN
T O
F D
EA
TH
S
Percent of All Traffic Deaths That Were
Marijuana-Related when a Driver
Tested Positive for Marijuana
LegalizationCommercialization
The Legalization of Marijuana in Colorado: The Impact Volume 5 – 2018, UPDATE
Section I: Traffic Fatalities & Impaired Driving 12
SOURCE: National Highway Traffic Safety Administration, Fatality Analysis Reporting System (FARS),
2006-2011 and Colorado Department of Transportation 2012-2017
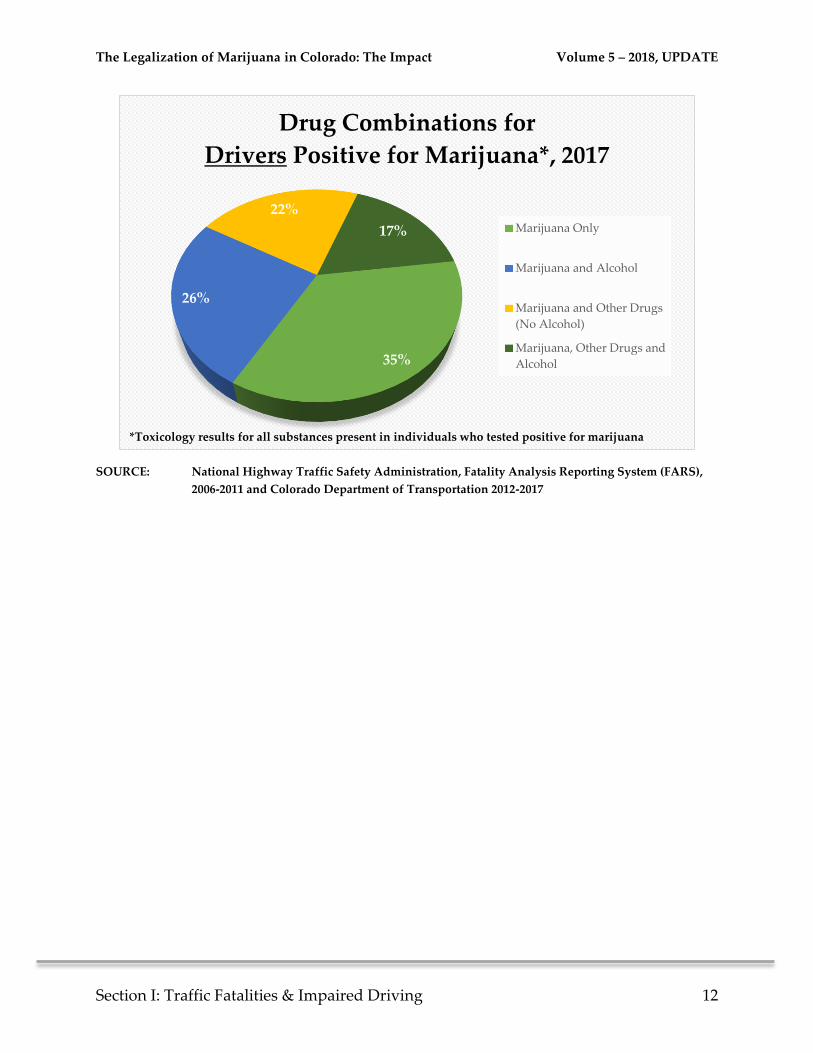
35%
26%
22%
17%
Drug Combinations for
Drivers Positive for Marijuana*, 2017
Marijuana Only
Marijuana and Alcohol
Marijuana and Other Drugs
(No Alcohol)
Marijuana, Other Drugs and
Alcohol
*Toxicology results for all substances present in individuals who tested positive for marijuana
The Legalization of Marijuana in Colorado: The Impact Volume 5 – 2018, UPDATE
Section I: Traffic Fatalities & Impaired Driving 13
Traffic Deaths Related to Marijuana
When an OPERATOR Tested Positive for Marijuana
Crash Year
Total
Statewide
Fatalities
Fatalities with
Operators Testing
Positive
for Marijuana
Percentage Total
Fatalities
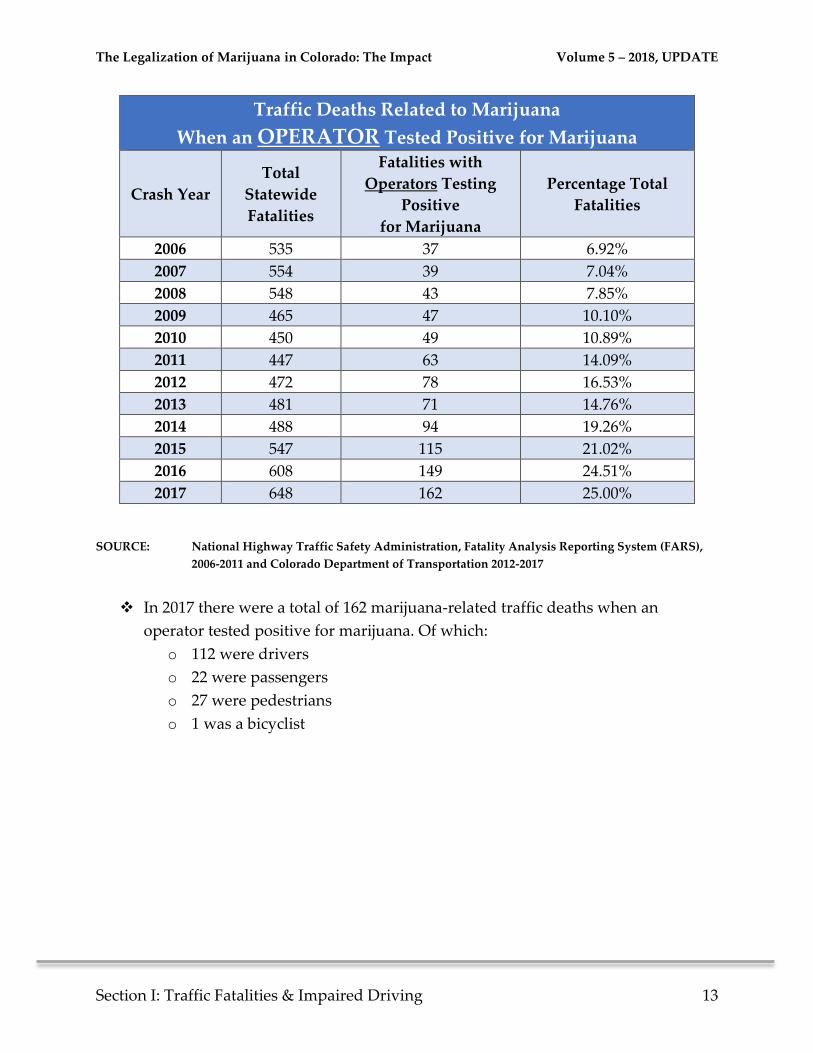
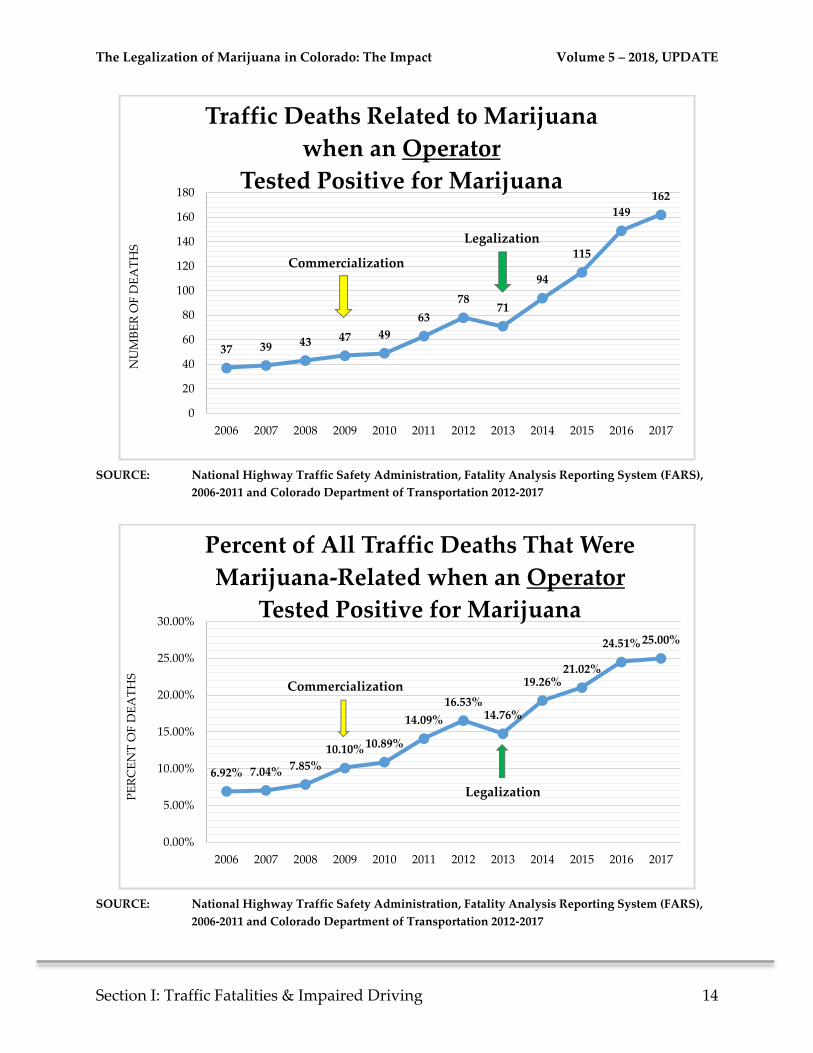
2006 535 37 6.92%
2007 554 39 7.04%
2008 548 43 7.85%
2009 465 47 10.10%
2010 450 49 10.89%
2011 447 63 14.09%
2012 472 78 16.53%
2013 481 71 14.76%
2014 488 94 19.26%
2015 547 115 21.02%
2016 608 149 24.51%
2017 648 162 25.00%
SOURCE: National Highway Traffic Safety Administration, Fatality Analysis Reporting System (FARS),
2006-2011 and Colorado Department of Transportation 2012-2017
In 2017 there were a total of 162 marijuana-related traffic deaths when an
operator tested positive for marijuana. Of which:
o 112 were drivers
o 22 were passengers
o 27 were pedestrians
o 1 was a bicyclist
The Legalization of Marijuana in Colorado: The Impact Volume 5 – 2018, UPDATE
Section I: Traffic Fatalities & Impaired Driving 14
SOURCE: National Highway Traffic Safety Administration, Fatality Analysis Reporting System (FARS),
2006-2011 and Colorado Department of Transportation 2012-2017
SOURCE: National Highway Traffic Safety Administration, Fatality Analysis Reporting System (FARS),
2006-2011 and Colorado Department of Transportation 2012-2017
37 39 43 47 49
63
7871
94
115
149
162
0
20
40
60
80
100
120
140
160
180
2006 2007 2008 2009 2010 2011 2012 2013 2014 2015 2016 2017
NU
MB
ER
OF
DE
AT
HS
Traffic Deaths Related to Marijuana
when an Operator
Tested Positive for Marijuana
Commercialization
Legalization
6.92% 7.04% 7.85%
10.10% 10.89%
14.09%
16.53%14.76%
19.26%21.02%
24.51% 25.00%
0.00%
5.00%
10.00%
15.00%
20.00%
25.00%
30.00%
2006 2007 2008 2009 2010 2011 2012 2013 2014 2015 2016 2017
PE
RC
EN
T O
F D
EA
TH
S
Percent of All Traffic Deaths That Were
Marijuana-Related when an Operator
Tested Positive for Marijuana
Commercialization
Legalization
The Legalization of Marijuana in Colorado: The Impact Volume 5 – 2018, UPDATE
Section I: Traffic Fatalities & Impaired Driving 15
SOURCE: National Highway Traffic Safety Administration, Fatality Analysis Reporting System (FARS),
2006-2011 and Colorado Department of Transportation 2012-2017
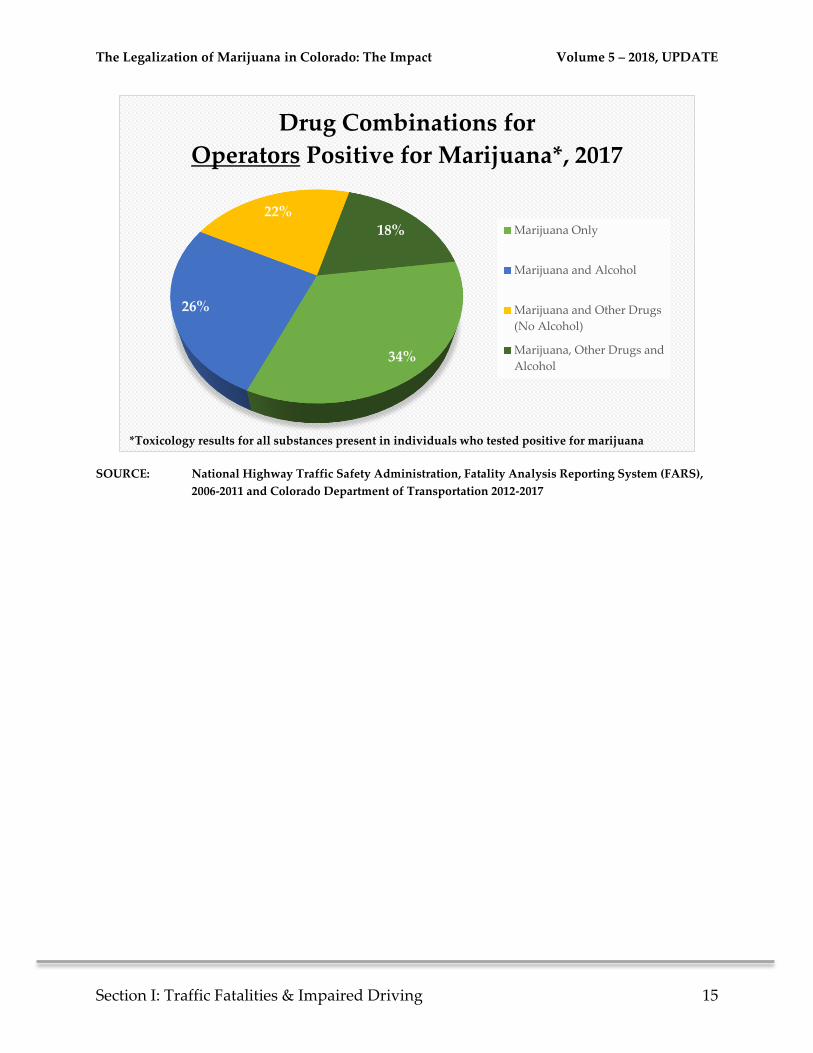
34%
26%
22%18%
Drug Combinations for
Operators Positive for Marijuana*, 2017
Marijuana Only
Marijuana and Alcohol
Marijuana and Other Drugs
(No Alcohol)
Marijuana, Other Drugs and
Alcohol
*Toxicology results for all substances present in individuals who tested positive for marijuana
The Legalization of Marijuana in Colorado: The Impact Volume 5 – 2018, UPDATE
Section I: Traffic Fatalities & Impaired Driving 16
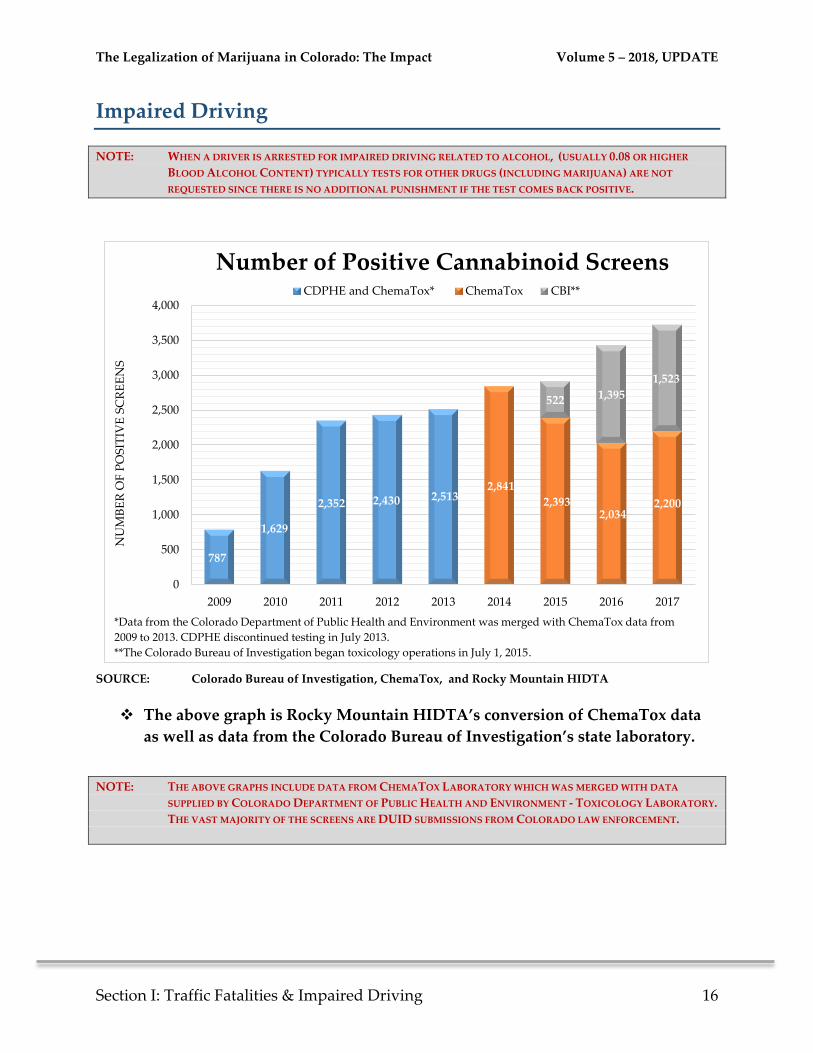
Impaired Driving
NOTE: WHEN A DRIVER IS ARRESTED FOR IMPAIRED DRIVING RELATED TO ALCOHOL, (USUALLY 0.08 OR HIGHER
BLOOD ALCOHOL CONTENT) TYPICALLY TESTS FOR OTHER DRUGS (INCLUDING MARIJUANA) ARE NOT
REQUESTED SINCE THERE IS NO ADDITIONAL PUNISHMENT IF THE TEST COMES BACK POSITIVE.
SOURCE: Colorado Bureau of Investigation, ChemaTox, and Rocky Mountain HIDTA
The above graph is Rocky Mountain HIDTA’s conversion of ChemaTox data
as well as data from the Colorado Bureau of Investigation’s state laboratory.
NOTE: THE ABOVE GRAPHS INCLUDE DATA FROM CHEMATOX LABORATORY WHICH WAS MERGED WITH DATA
SUPPLIED BY COLORADO DEPARTMENT OF PUBLIC HEALTH AND ENVIRONMENT - TOXICOLOGY LABORATORY.
THE VAST MAJORITY OF THE SCREENS ARE DUID SUBMISSIONS FROM COLORADO LAW ENFORCEMENT.
787
1,629
2,352 2,430 2,513 2,841
2,393 2,034
2,200
522 1,395
1,523
0
500
1,000
1,500
2,000
2,500
3,000
3,500
4,000
2009 2010 2011 2012 2013 2014 2015 2016 2017
NU
MB
ER
OF
PO
SIT
IVE
SC
RE
EN
S
Number of Positive Cannabinoid ScreensCDPHE and ChemaTox* ChemaTox CBI**
*Data from the Colorado Department of Public Health and Environment was merged with ChemaTox data from
2009 to 2013. CDPHE discontinued testing in July 2013.
**The Colorado Bureau of Investigation began toxicology operations in July 1, 2015.
There were a total of 723 9-Panel drug screen (including Cannabinoids ) cases analyzed by CBI in 2015.
The Legalization of Marijuana in Colorado: The Impact Volume 5 – 2018, UPDATE
Section I: Traffic Fatalities & Impaired Driving 17
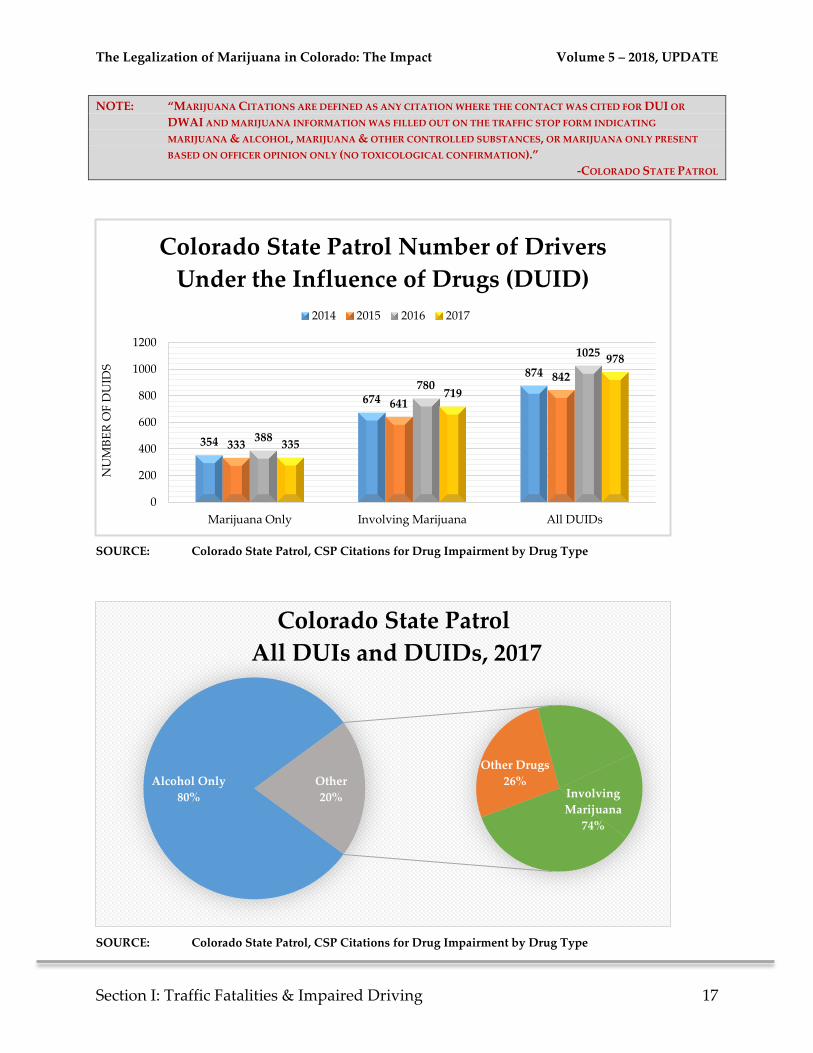
NOTE: “MARIJUANA CITATIONS ARE DEFINED AS ANY CITATION WHERE THE CONTACT WAS CITED FOR DUI OR
DWAI AND MARIJUANA INFORMATION WAS FILLED OUT ON THE TRAFFIC STOP FORM INDICATING
MARIJUANA & ALCOHOL, MARIJUANA & OTHER CONTROLLED SUBSTANCES, OR MARIJUANA ONLY PRESENT
BASED ON OFFICER OPINION ONLY (NO TOXICOLOGICAL CONFIRMATION).”
-COLORADO STATE PATROL
SOURCE: Colorado State Patrol, CSP Citations for Drug Impairment by Drug Type
SOURCE: Colorado State Patrol, CSP Citations for Drug Impairment by Drug Type
354
674
874
333
641
842
388
780
1025
335
719
978
0
200
400
600
800
1000
1200
Marijuana Only Involving Marijuana All DUIDs
NU
MB
ER
OF
DU
IDS
Colorado State Patrol Number of Drivers
Under the Influence of Drugs (DUID)
2014 2015 2016 2017
Alcohol Only
80%
Other Drugs
26%Involving
Marijuana
74%
Other
20%
Colorado State Patrol
All DUIs and DUIDs, 2017
The Legalization of Marijuana in Colorado: The Impact Volume 5 – 2018, UPDATE
Section I: Traffic Fatalities & Impaired Driving 18
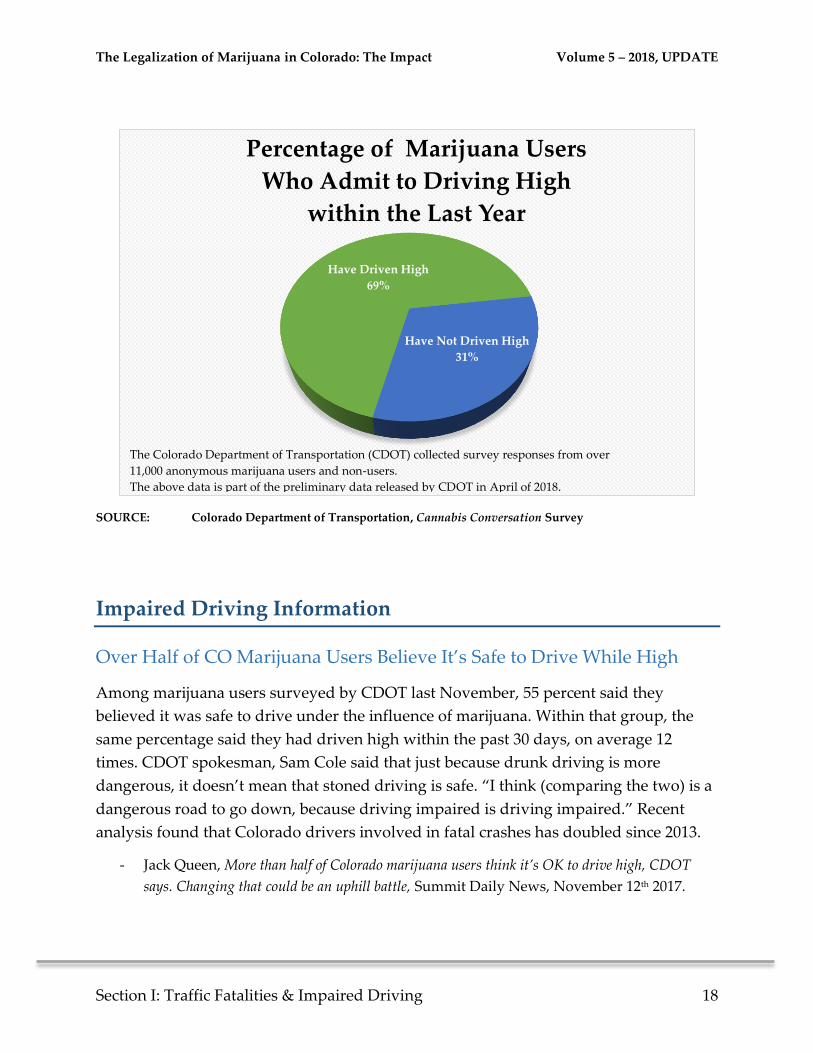
SOURCE: Colorado Department of Transportation, Cannabis Conversation Survey
Impaired Driving Information
Over Half of CO Marijuana Users Believe It’s Safe to Drive While High
Among marijuana users surveyed by CDOT last November, 55 percent said they
believed it was safe to drive under the influence of marijuana. Within that group, the
same percentage said they had driven high within the past 30 days, on average 12
times. CDOT spokesman, Sam Cole said that just because drunk driving is more
dangerous, it doesn’t mean that stoned driving is safe. “I think (comparing the two) is a
dangerous road to go down, because driving impaired is driving impaired.” Recent
analysis found that Colorado drivers involved in fatal crashes has doubled since 2013.
- Jack Queen, More than half of Colorado marijuana users think it’s OK to drive high, CDOT
says. Changing that could be an uphill battle, Summit Daily News, November 12th 2017.
Have Not Driven High
31%
Have Driven High
69%
Percentage of Marijuana Users
Who Admit to Driving High
within the Last Year
The Colorado Department of Transportation (CDOT) collected survey responses from over
11,000 anonymous marijuana users and non-users.
The above data is part of the preliminary data released by CDOT in April of 2018.
The Legalization of Marijuana in Colorado: The Impact Volume 5 – 2018, UPDATE
Section I: Traffic Fatalities & Impaired Driving 19
Legal Pot and Pedestrian Deaths
A study published by the Governors’ Highway Safety Association looked at pedestrian
fatalities over 20 years. They noted interesting information from the seven states that
legalized recreational marijuana. Between 2012 and 2016 there was a 16.4 percent
increase in pedestrian traffic deaths for the first six months of 2017 compared to the first
6 months of 2016 whereas all other states had a 5.8 percent decrease. Traffic safety
engineer, Richard Retting was clear to point out that the report was not making a direct
correlation or expressly claiming a link between weed and walking deaths.
- A.J. Herrington, Is A Rise In Pedestrian Deaths Really Due To Legal Cannabis? High Times,
March 3rd, 2018.
70% Drivers in DUI Test Positive for Marijuana
A comprehensive analysis of 2016 driving under the influence data revealed that over
70% of 3,946 drivers charged with driving under the influence of alcohol also tested
positive for marijuana. Even though the presence of Delta 9 THC, the primary
psychoactive ingredient in marijuana, dissipates rather quickly, still over 70% tested
positive for Delta 9 and close to half detected Delta 9 THC at a 5.0 ng/ML or above.
- Driving Under the Influence of Drugs and Alcohol Colorado Department of Public Safety,
Division of Criminal Justice, July 2018.
Higher Levels of THC
In Colorado, the legal limit of THC in a driver’s blood is 5ng/mL. However, according to the
Denver Post, “THC levels in drivers killed in crashes in 2016 routinely reached levels of more
than 30 ng/mL… [t]he year before, levels only occasionally topped 5 ng/mL.” This trend has
coroners concerned because some are “uncertain about listing the presence of THC on a death
certificate because of doubts on what constitutes impairment.” Police Chief Jackson of
Greenwood Village, CO attributes the rise in THC levels of drivers to the rise in THC potency in
marijuana oils and concentrates. He states, “This is not your grandfather’s weed.”
- David Migoya, Exclusive: Traffic fatalities linked to marijuana are up sharply in Colorado. Is
Legalization to blame? The Denver Post, August 25th 2017.
The Legalization of Marijuana in Colorado: The Impact Volume 5 – 2018, UPDATE
Section I: Traffic Fatalities & Impaired Driving 20
57 Percent of Marijuana Users in Colorado Admit Driving within 2 Hours:
A survey conducted by the Colorado Department of Transportation discovered that 57 percent
of people who reported using marijuana drove within two hours after consumption. The survey
also indicated that, on average, those participants who reported consuming marijuana and then
driving within 2 hours did so on 11.7 of 30 days. By comparison, 38 percent of respondents who
drank alcoholic beverages reported driving within 2 hours after consumption and only reported
doing so on 2.8 of 30 days.
- Anica Padilla, Study: 57 percent of marijuana users in Colorado admit driving within 2 hours,
KDVR/Fox 31 Denver, March 9 2017.
Drivers Killed in Crashes More Likely to be on Drugs than Alcohol
A recent study using data available from 2015 indicates that “[d]rivers who are killed in car
crashes are now more likely to be on drugs than alcohol.” Drugs were present in 43 percent of
drivers in fatal accidents compared to 37 percent with alcohol above the legal limit.
Additionally, 36 percent of the drivers tested had marijuana present in their system at the time
of the accident. In general, traffic fatalities are rising and can be attributed to factors such as
improved economy, more distracted drivers, and more drugged drivers. 11
- Melanie Zanona, Study: Drivers Killed in Crashes More Likely to be on Drugs than
Alcohol, The Hill, April 26th 2017.
The Legalization of Marijuana in Colorado: The Impact Volume 5 – 2018, UPDATE
Section II: Marijuana Use 21
Section II: Marijuana Use
Some Findings
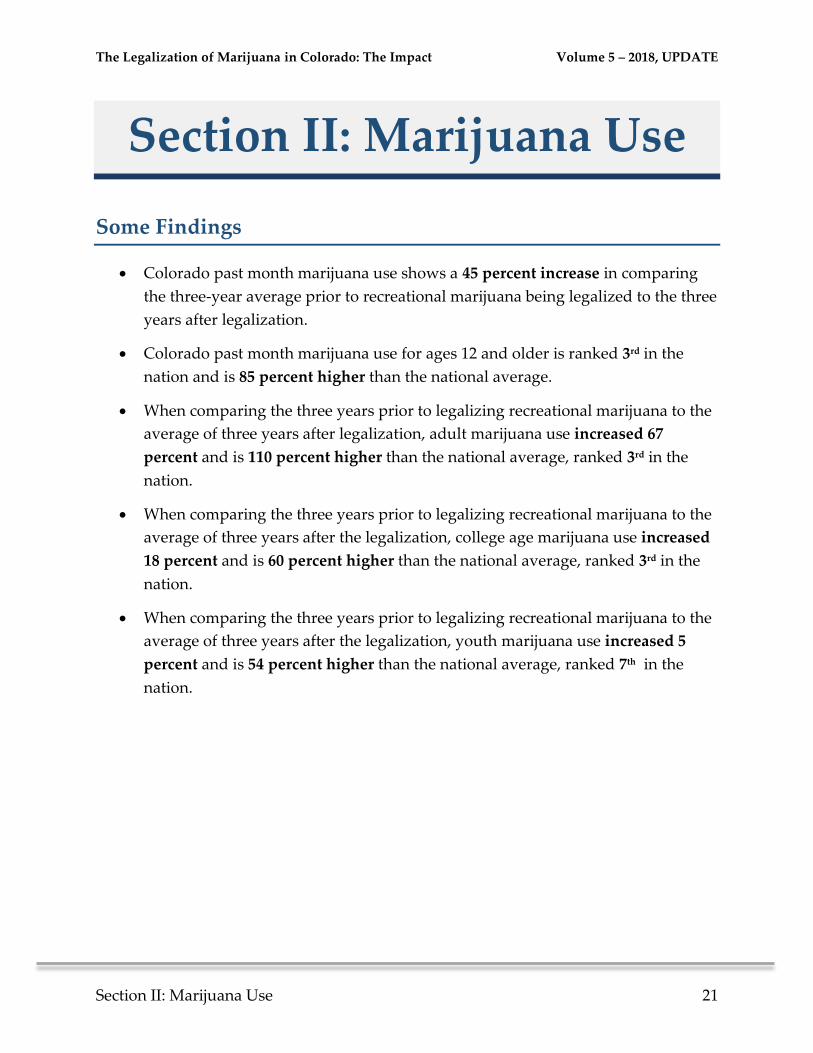
Colorado past month marijuana use shows a 45 percent increase in comparing
the three-year average prior to recreational marijuana being legalized to the three
years after legalization.
Colorado past month marijuana use for ages 12 and older is ranked 3rd in the
nation and is 85 percent higher than the national average.
When comparing the three years prior to legalizing recreational marijuana to the
average of three years after legalization, adult marijuana use increased 67
percent and is 110 percent higher than the national average, ranked 3rd in the
nation.
When comparing the three years prior to legalizing recreational marijuana to the
average of three years after the legalization, college age marijuana use increased
18 percent and is 60 percent higher than the national average, ranked 3rd in the
nation.
When comparing the three years prior to legalizing recreational marijuana to the
average of three years after the legalization, youth marijuana use increased 5
percent and is 54 percent higher than the national average, ranked 7th in the
nation.
The Legalization of Marijuana in Colorado: The Impact Volume 5 – 2018, UPDATE
Section II: Marijuana Use 22
National Survey on Drug Use and Health (NSDUH) Data
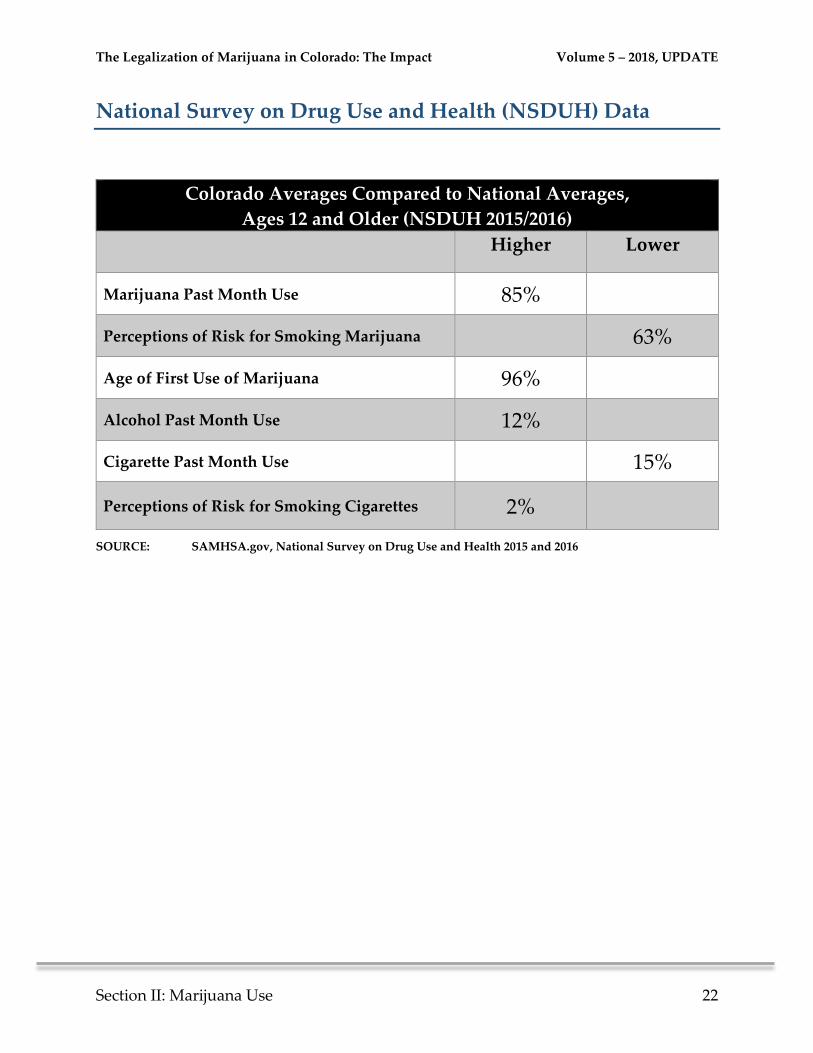
Colorado Averages Compared to National Averages,
Ages 12 and Older (NSDUH 2015/2016)
Higher Lower
Marijuana Past Month Use 85%
Perceptions of Risk for Smoking Marijuana 63%
Age of First Use of Marijuana 96%
Alcohol Past Month Use 12%
Cigarette Past Month Use 15%
Perceptions of Risk for Smoking Cigarettes 2%
SOURCE: SAMHSA.gov, National Survey on Drug Use and Health 2015 and 2016
The Legalization of Marijuana in Colorado: The Impact Volume 5 – 2018, UPDATE
Section II: Marijuana Use 23
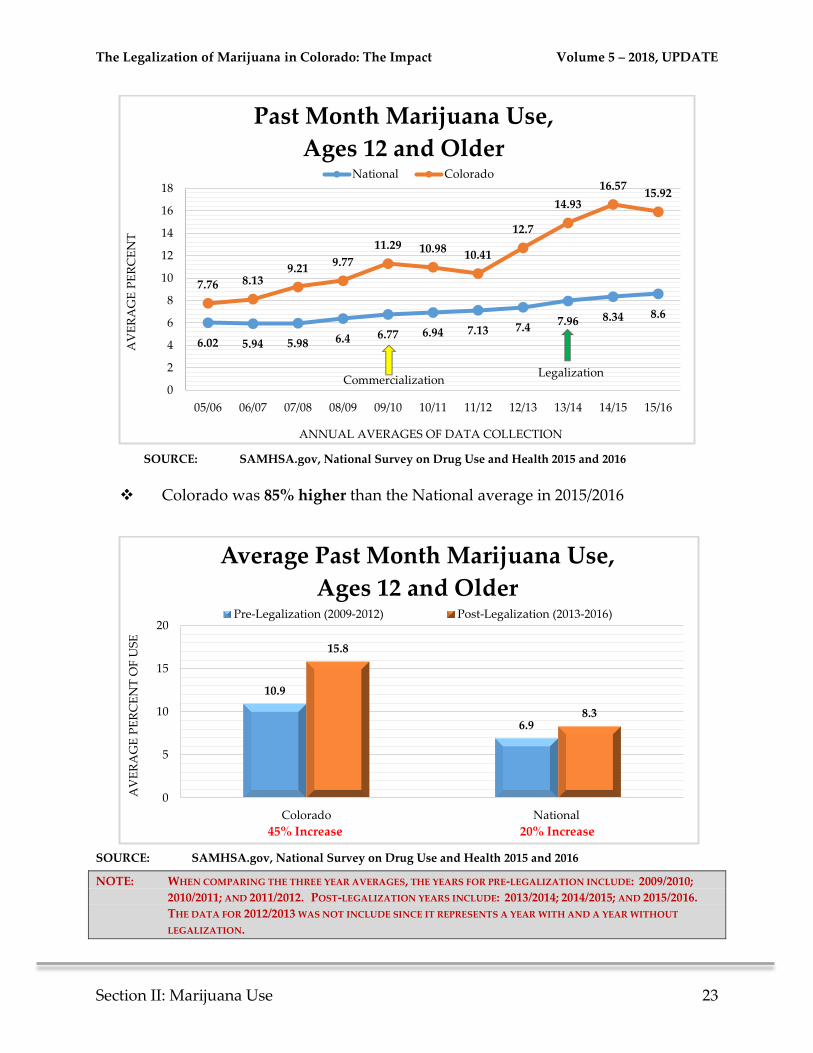
SOURCE: SAMHSA.gov, National Survey on Drug Use and Health 2015 and 2016
Colorado was 85% higher than the National average in 2015/2016
SOURCE: SAMHSA.gov, National Survey on Drug Use and Health 2015 and 2016
NOTE: WHEN COMPARING THE THREE YEAR AVERAGES, THE YEARS FOR PRE-LEGALIZATION INCLUDE: 2009/2010;
2010/2011; AND 2011/2012. POST-LEGALIZATION YEARS INCLUDE: 2013/2014; 2014/2015; AND 2015/2016.
THE DATA FOR 2012/2013 WAS NOT INCLUDE SINCE IT REPRESENTS A YEAR WITH AND A YEAR WITHOUT
LEGALIZATION.
6.02 5.94 5.98 6.4 6.77 6.94 7.13 7.47.96 8.34 8.6
7.76 8.139.21
9.77
11.29 10.9810.41
12.7
14.93
16.5715.92
0
2
4
6
8
10
12
14
16
18
05/06 06/07 07/08 08/09 09/10 10/11 11/12 12/13 13/14 14/15 15/16
AV
ER
AG
E P
ER
CE
NT
ANNUAL AVERAGES OF DATA COLLECTION
Past Month Marijuana Use,
Ages 12 and OlderNational Colorado
CommercializationLegalization
10.9
6.9
15.8
8.3
0
5
10
15
20
Colorado National
AV
ER
AG
E P
ER
CE
NT
OF
US
E
Average Past Month Marijuana Use,
Ages 12 and OlderPre-Legalization (2009-2012) Post-Legalization (2013-2016)
20% Increase45% Increase
The Legalization of Marijuana in Colorado: The Impact Volume 5 – 2018, UPDATE
Section II: Marijuana Use 24
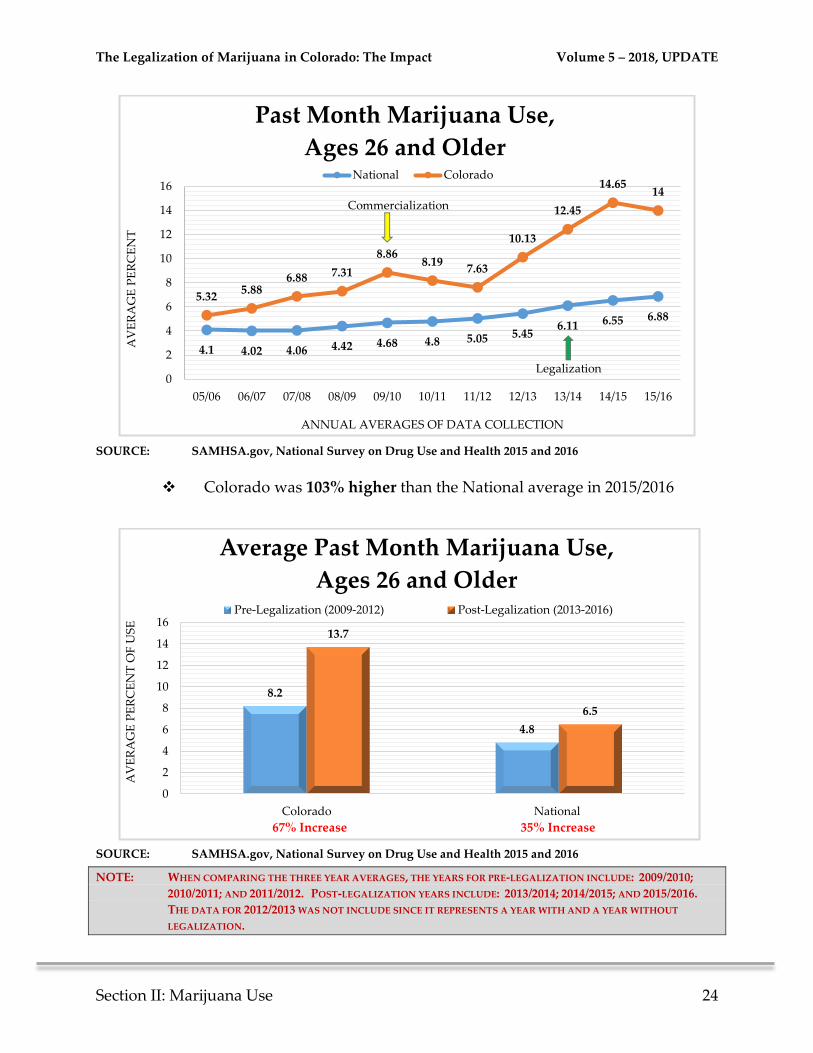
SOURCE: SAMHSA.gov, National Survey on Drug Use and Health 2015 and 2016
Colorado was 103% higher than the National average in 2015/2016
SOURCE: SAMHSA.gov, National Survey on Drug Use and Health 2015 and 2016
NOTE: WHEN COMPARING THE THREE YEAR AVERAGES, THE YEARS FOR PRE-LEGALIZATION INCLUDE: 2009/2010;
2010/2011; AND 2011/2012. POST-LEGALIZATION YEARS INCLUDE: 2013/2014; 2014/2015; AND 2015/2016.
THE DATA FOR 2012/2013 WAS NOT INCLUDE SINCE IT REPRESENTS A YEAR WITH AND A YEAR WITHOUT
LEGALIZATION.
4.1 4.02 4.06 4.42 4.68 4.8 5.05 5.456.11 6.55 6.88
5.325.88
6.88 7.31
8.868.19
7.63
10.13
12.45
14.6514
0
2
4
6
8
10
12
14
16
05/06 06/07 07/08 08/09 09/10 10/11 11/12 12/13 13/14 14/15 15/16
AV
ER
AG
E P
ER
CE
NT
ANNUAL AVERAGES OF DATA COLLECTION
Past Month Marijuana Use,
Ages 26 and OlderNational Colorado
Commercialization
Legalization
8.2
4.8
13.7
6.5
0
2
4
6
8
10
12
14
16
Colorado National
AV
ER
AG
E P
ER
CE
NT
OF
US
E
Average Past Month Marijuana Use,
Ages 26 and OlderPre-Legalization (2009-2012) Post-Legalization (2013-2016)
35% Increase67% Increase
The Legalization of Marijuana in Colorado: The Impact Volume 5 – 2018, UPDATE
Section II: Marijuana Use 25
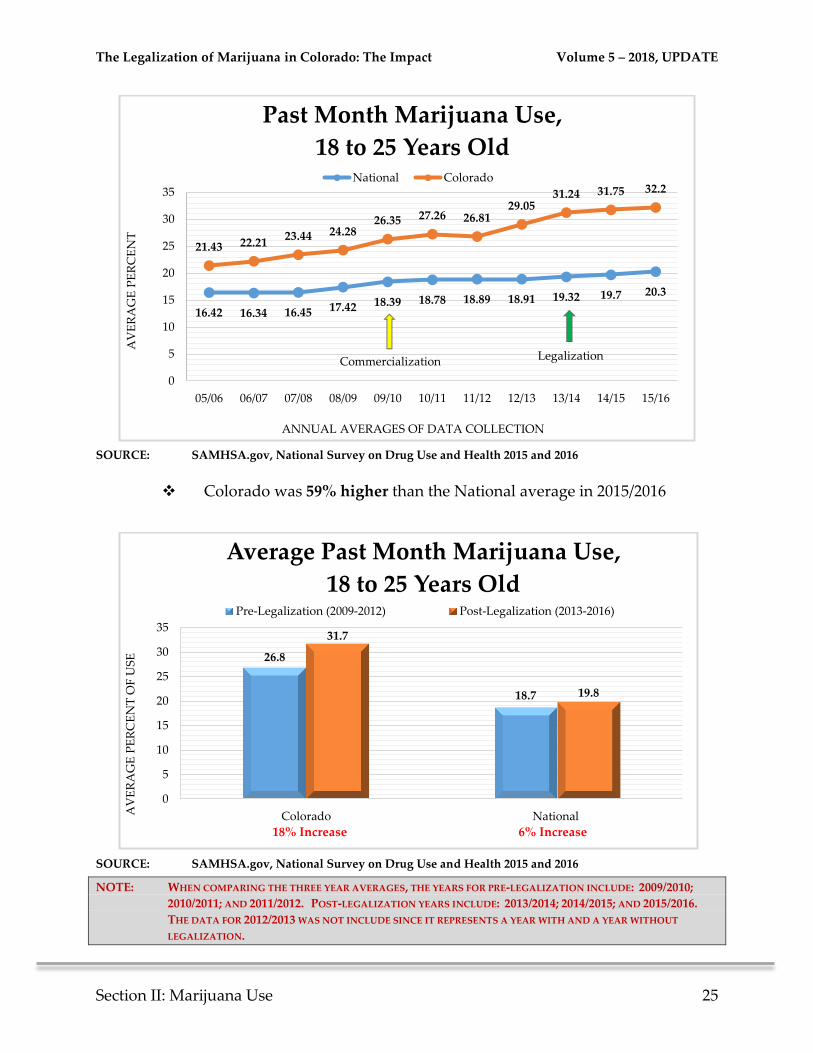
SOURCE: SAMHSA.gov, National Survey on Drug Use and Health 2015 and 2016
Colorado was 59% higher than the National average in 2015/2016
SOURCE: SAMHSA.gov, National Survey on Drug Use and Health 2015 and 2016
NOTE: WHEN COMPARING THE THREE YEAR AVERAGES, THE YEARS FOR PRE-LEGALIZATION INCLUDE: 2009/2010;
2010/2011; AND 2011/2012. POST-LEGALIZATION YEARS INCLUDE: 2013/2014; 2014/2015; AND 2015/2016.
THE DATA FOR 2012/2013 WAS NOT INCLUDE SINCE IT REPRESENTS A YEAR WITH AND A YEAR WITHOUT
LEGALIZATION.
16.42 16.34 16.45 17.42 18.39 18.78 18.89 18.91 19.32 19.7 20.3
21.43 22.2123.44 24.28
26.35 27.26 26.8129.05
31.24 31.75 32.2
0
5
10
15
20
25
30
35
05/06 06/07 07/08 08/09 09/10 10/11 11/12 12/13 13/14 14/15 15/16
AV
ER
AG
E P
ER
CE
NT
ANNUAL AVERAGES OF DATA COLLECTION
Past Month Marijuana Use,
18 to 25 Years Old National Colorado
Commercialization Legalization
26.8
18.7
31.7
19.8
0
5
10
15
20
25
30
35
Colorado NationalAV
ER
AG
E P
ER
CE
NT
OF
US
E
Average Past Month Marijuana Use,
18 to 25 Years Old Pre-Legalization (2009-2012) Post-Legalization (2013-2016)
6% Increase18% Increase
The Legalization of Marijuana in Colorado: The Impact Volume 5 – 2018, UPDATE
Section II: Marijuana Use 26
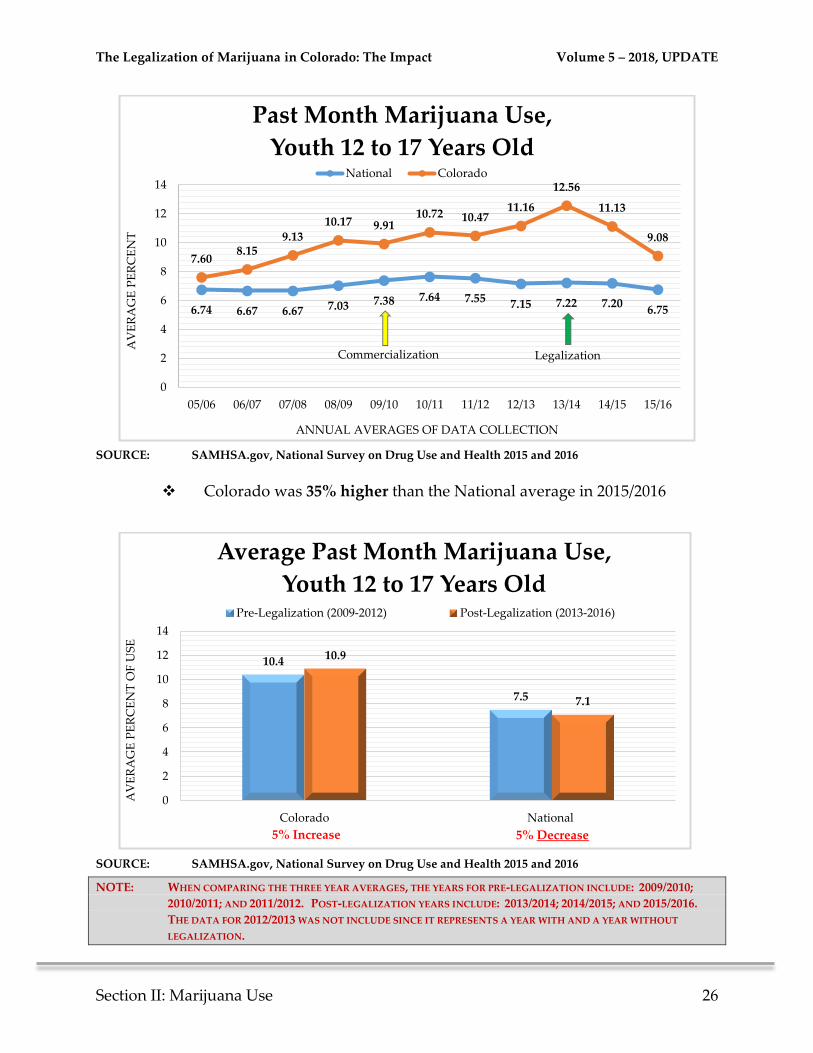
SOURCE: SAMHSA.gov, National Survey on Drug Use and Health 2015 and 2016
Colorado was 35% higher than the National average in 2015/2016
SOURCE: SAMHSA.gov, National Survey on Drug Use and Health 2015 and 2016
NOTE: WHEN COMPARING THE THREE YEAR AVERAGES, THE YEARS FOR PRE-LEGALIZATION INCLUDE: 2009/2010;
2010/2011; AND 2011/2012. POST-LEGALIZATION YEARS INCLUDE: 2013/2014; 2014/2015; AND 2015/2016.
THE DATA FOR 2012/2013 WAS NOT INCLUDE SINCE IT REPRESENTS A YEAR WITH AND A YEAR WITHOUT
LEGALIZATION.
6.74 6.67 6.67 7.03 7.38 7.64 7.55 7.15 7.22 7.206.75
7.608.15
9.1310.17 9.91
10.72 10.4711.16
12.56
11.13
9.08
0
2
4
6
8
10
12
14
05/06 06/07 07/08 08/09 09/10 10/11 11/12 12/13 13/14 14/15 15/16
AV
ER
AG
E P
ER
CE
NT
ANNUAL AVERAGES OF DATA COLLECTION
Past Month Marijuana Use,
Youth 12 to 17 Years OldNational Colorado
Commercialization Legalization
10.4
7.5
10.9
7.1
0
2
4
6
8
10
12
14
Colorado National
AV
ER
AG
E P
ER
CE
NT
OF
US
E
Average Past Month Marijuana Use,
Youth 12 to 17 Years OldPre-Legalization (2009-2012) Post-Legalization (2013-2016)
5% Decrease5% Increase
The Legalization of Marijuana in Colorado: The Impact Volume 5 – 2018, UPDATE
Section II: Marijuana Use 27
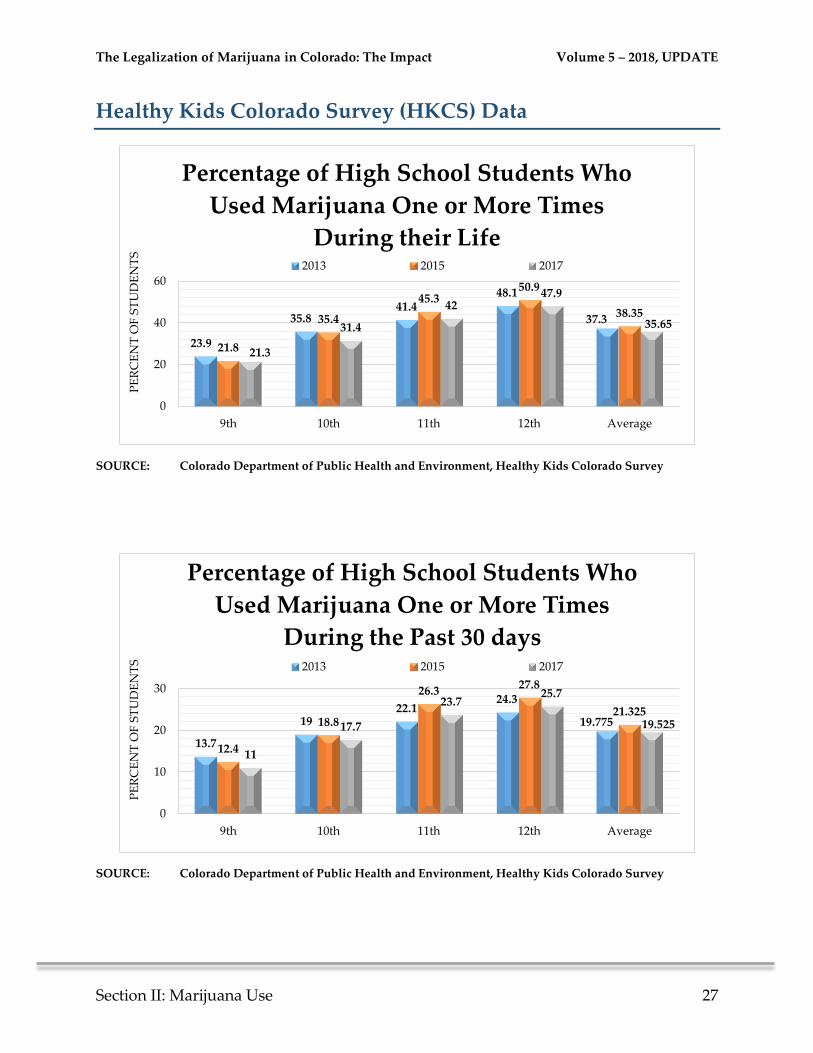
Healthy Kids Colorado Survey (HKCS) Data
SOURCE: Colorado Department of Public Health and Environment, Healthy Kids Colorado Survey
SOURCE: Colorado Department of Public Health and Environment, Healthy Kids Colorado Survey
23.9
35.841.4
48.1
37.3
21.8
35.4
45.350.9
38.35
21.3
31.4
4247.9
35.65
0
20
40
60
9th 10th 11th 12th Average
PE
RC
EN
T O
F S
TU
DE
NT
S
Percentage of High School Students Who
Used Marijuana One or More Times
During their Life 2013 2015 2017
13.7
1922.1
24.3
19.775
12.4
18.8
26.327.8
21.325
11
17.7
23.725.7
19.525
0
10
20
30
9th 10th 11th 12th Average
PE
RC
EN
T O
F S
TU
DE
NT
S
Percentage of High School Students Who
Used Marijuana One or More Times
During the Past 30 days 2013 2015 2017
The Legalization of Marijuana in Colorado: The Impact Volume 5 – 2018, UPDATE
Section II: Marijuana Use 28
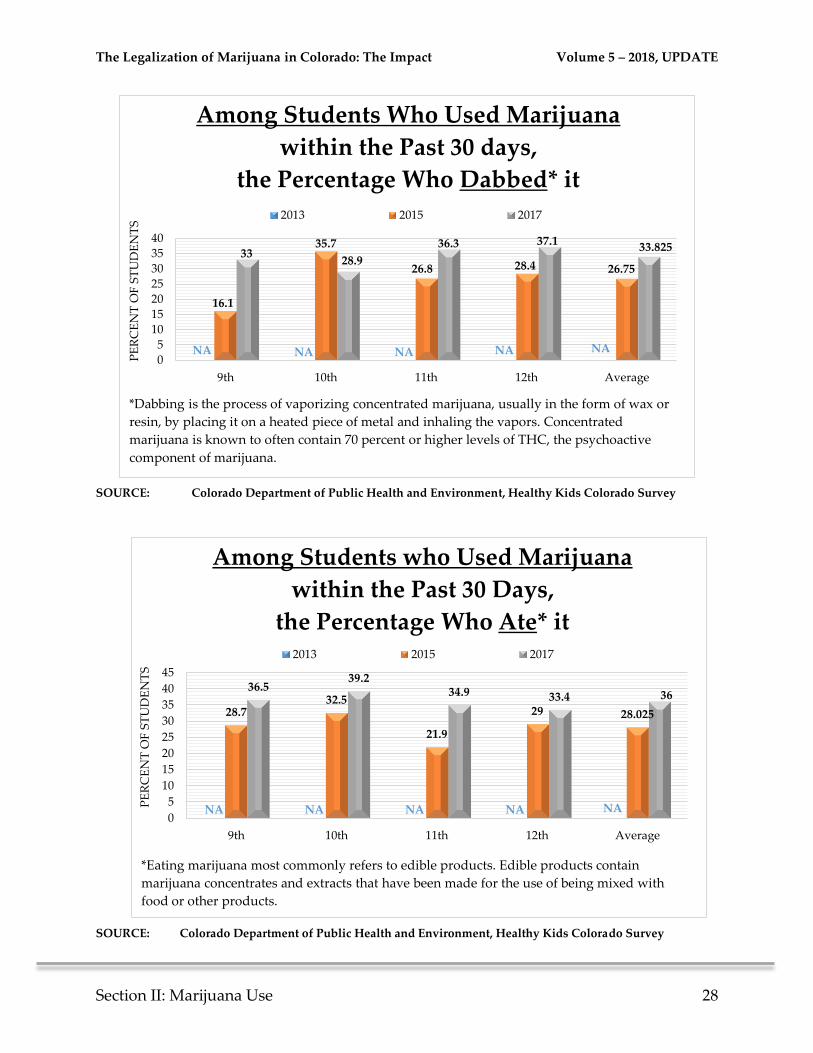
SOURCE: Colorado Department of Public Health and Environment, Healthy Kids Colorado Survey
SOURCE: Colorado Department of Public Health and Environment, Healthy Kids Colorado Survey
NA NA NA NA NA
16.1
35.7
26.8 28.4 26.75
3328.9
36.3 37.133.825
0
5
1015
20
25
30
35
40
9th 10th 11th 12th Average
PE
RC
EN
T O
F S
TU
DE
NT
S
Among Students Who Used Marijuana
within the Past 30 days,
the Percentage Who Dabbed* it
2013 2015 2017
*Dabbing is the process of vaporizing concentrated marijuana, usually in the form of wax or
resin, by placing it on a heated piece of metal and inhaling the vapors. Concentrated
marijuana is known to often contain 70 percent or higher levels of THC, the psychoactive
component of marijuana.
NA NA NA NA NA
28.732.5
21.9
29 28.025
36.539.2
34.9 33.4 36
0
5
10
15
20
25
30
35
40
45
9th 10th 11th 12th Average
PE
RC
EN
T O
F S
TU
DE
NT
S
Among Students who Used Marijuana
within the Past 30 Days,
the Percentage Who Ate* it2013 2015 2017
*Eating marijuana most commonly refers to edible products. Edible products contain
marijuana concentrates and extracts that have been made for the use of being mixed with
food or other products.
The Legalization of Marijuana in Colorado: The Impact Volume 5 – 2018, UPDATE
Section II: Marijuana Use 29
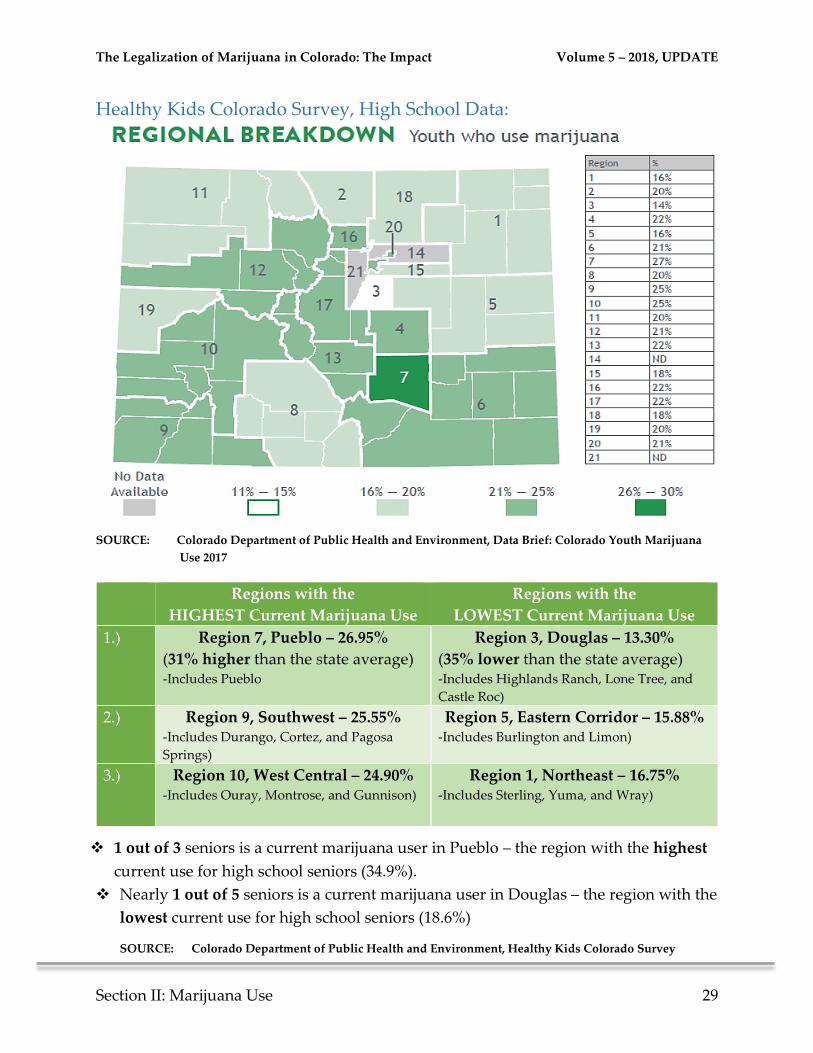
Healthy Kids Colorado Survey, High School Data:
SOURCE: Colorado Department of Public Health and Environment, Data Brief: Colorado Youth Marijuana
Use 2017
Regions with the
HIGHEST Current Marijuana Use
Regions with the
LOWEST Current Marijuana Use
1.) Region 7, Pueblo – 26.95%
(31% higher than the state average) -Includes Pueblo
Region 3, Douglas – 13.30%
(35% lower than the state average) -Includes Highlands Ranch, Lone Tree, and
Castle Roc)
2.) Region 9, Southwest – 25.55% -Includes Durango, Cortez, and Pagosa
Springs)
Region 5, Eastern Corridor – 15.88% -Includes Burlington and Limon)
3.) Region 10, West Central – 24.90% -Includes Ouray, Montrose, and Gunnison)
Region 1, Northeast – 16.75% -Includes Sterling, Yuma, and Wray)
1 out of 3 seniors is a current marijuana user in Pueblo – the region with the highest
current use for high school seniors (34.9%).
Nearly 1 out of 5 seniors is a current marijuana user in Douglas – the region with the
lowest current use for high school seniors (18.6%)
SOURCE: Colorado Department of Public Health and Environment, Healthy Kids Colorado Survey
The Legalization of Marijuana in Colorado: The Impact Volume 5 – 2018, UPDATE
Section II: Marijuana Use 30
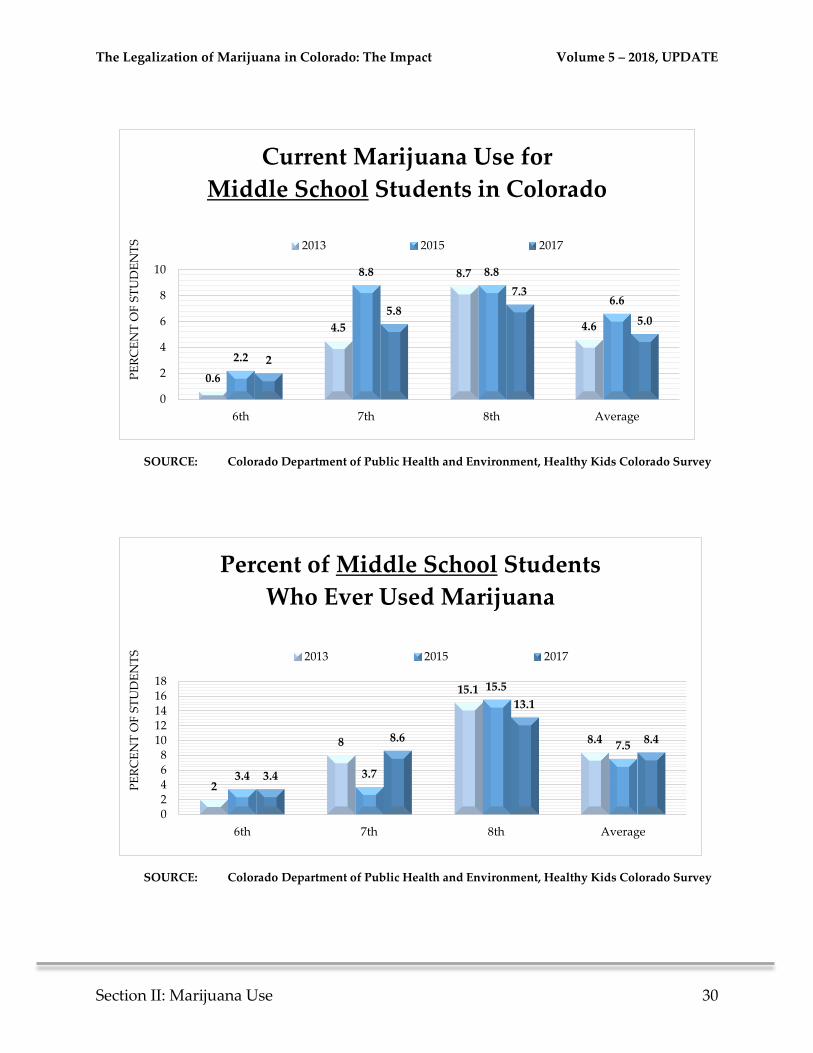
SOURCE: Colorado Department of Public Health and Environment, Healthy Kids Colorado Survey
SOURCE: Colorado Department of Public Health and Environment, Healthy Kids Colorado Survey
0.6
4.5
8.7
4.6
2.2
8.8 8.8
6.6
2
5.8
7.3
5.0
0
2
4
6
8
10
6th 7th 8th Average
PE
RC
EN
T O
F S
TU
DE
NT
S
Current Marijuana Use for
Middle School Students in Colorado
2013 2015 2017
2
8
15.1
8.4
3.4 3.7
15.5
7.5
3.4
8.6
13.1
8.4
02468
1012141618
6th 7th 8th Average
PE
RC
EN
T O
F S
TU
DE
NT
S
Percent of Middle School Students
Who Ever Used Marijuana
2013 2015 2017
The Legalization of Marijuana in Colorado: The Impact Volume 5 – 2018, UPDATE
Section II: Marijuana Use 31
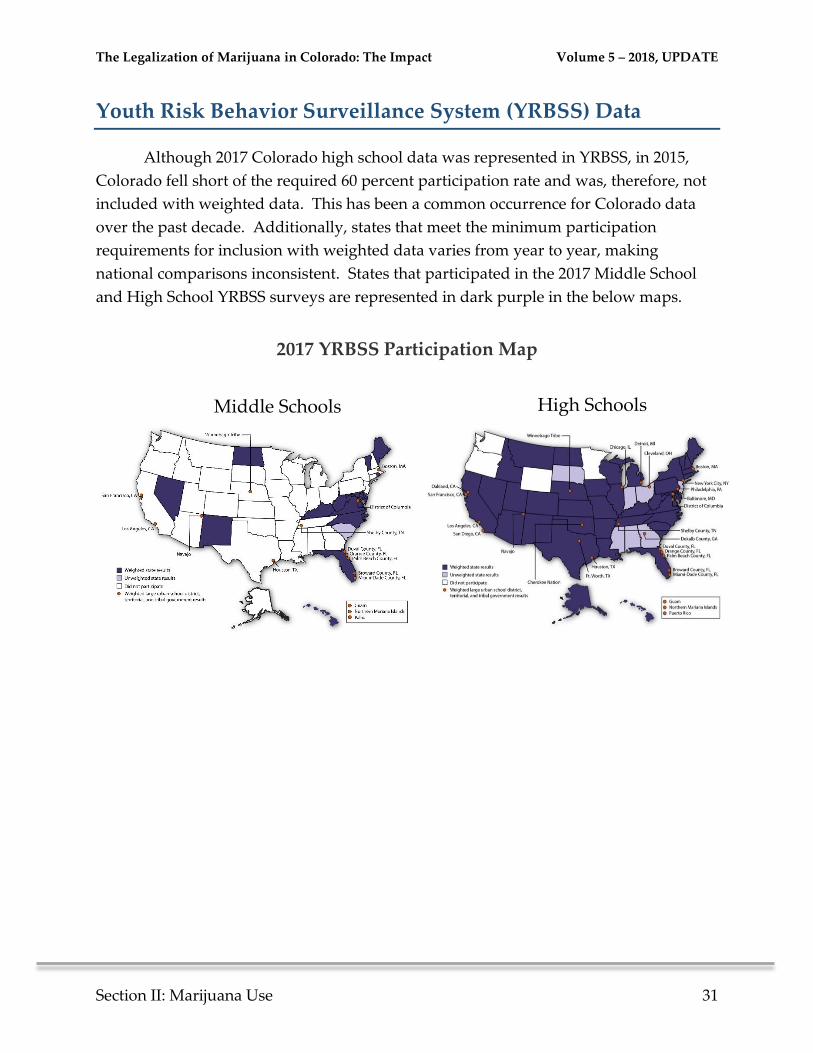
Youth Risk Behavior Surveillance System (YRBSS) Data
Although 2017 Colorado high school data was represented in YRBSS, in 2015,
Colorado fell short of the required 60 percent participation rate and was, therefore, not
included with weighted data. This has been a common occurrence for Colorado data
over the past decade. Additionally, states that meet the minimum participation
requirements for inclusion with weighted data varies from year to year, making
national comparisons inconsistent. States that participated in the 2017 Middle School
and High School YRBSS surveys are represented in dark purple in the below maps.
2017 YRBSS Participation Map
High Schools Middle Schools
The Legalization of Marijuana in Colorado: The Impact Volume 5 – 2018, UPDATE
Section II: Marijuana Use 32
Marijuana Use Information
Police in Colorado Find Use on the Rise
School resource officers in Colorado – police who are assigned to public schools – say
that based on their observation, use among students has increased in recent years.
What has changed they say, is how youths are disciplined in school for marijuana
violations and how statewide data on violations is collected. “There is a great disparity
in the number of kids they say use marijuana and what we actually saw”, said Matt
Montgomery a former Broomfield police officer and school resource officer (SRO).
“They’re doing it so much that it’s scary. Marijuana is easier to get than alcohol.” The
Executive Director of Act on Drugs, Lynn Riemer said, “The data collection is just not
well done.” This article was in response to surveys that said drug use among youth has
dropped.
- David Migoya, Police across Colorado questioning whether youths are using marijuana less,
The Denver Post, December 22nd 2017.
Medical Marijuana Advertising Exposure Among Adolescents
In a seven year study conducted by The RAND Corporation, approximately 6,500
adolescents were surveyed and tracked regarding exposure to medical marijuana
advertisements and the likelihood of increased adolescent use. Over the seven years
(2010-2017), the study found that the adolescents that were exposed more frequently to
medical marijuana advertising were more likely to have used the drug within the
previous 30 days with intent to use again within the next six months, had more positive
views about the drug, and reported negative consequences because of marijuana use.
“This work highlights the importance of considering regulations for marijuana
advertising that would be similar to rules already in place to curb the promotion of
tobacco and alcohol across the United States.”
- Elizabeth J. D’Amico, Adolescents Who View More Medical Marijuana Advertising Are More
Likely to Use Marijuana, Have Positive Views About the Drug, RAND Corporation, May 17th
2018.
The Legalization of Marijuana in Colorado: The Impact Volume 5 – 2018, UPDATE
Section II: Marijuana Use 33
Marijuana Users Go to Work High?
A January 25th 2017 survey was conducted in states with legal recreational marijuana;
600 users took part in the poll. Of the 600, 48 percent said they had gone to work high
and 39 percent of those said they did so once a week.
- Michael Roberts, Survey: 48 Percent of Marijuana Users Have Gone to Work High,
Westword, January 29th, 2018.
Drug Positivity in U.S. Workforce Rises to Nearly Highest Level in a
Decade
According to the world’s leading provider of diagnostic drug testing services, “The
percentage of employees in the combined U.S. workforce testing positive for drugs has
steadily increased over the last three years to a 10-year high.” The three primary
diagnostic tests offered by Quest Diagnostics include oral, urine and hair follicle drug
tests. Speaking to oral fluid testing, which provides a 24-48 hour history, the positivity
rate increased 47 percent in the past three years. According to the diagnostics
corporation, “The increase was largely driven by double-digit increases in marijuana
positivity during this time period. In 2015, there was a 25 percent relative increase in
marijuana detection as compared to 2014.” Additionally, “Almost half (45 percent) of
individuals in the general U.S. workforce with a positive drug test for any substance in
2015 showed evidence of marijuana use.
- Quest Diagnostics, Drug Positivity in U.S. Workforce Rises to Nearly Highest Level in
a Decade, September 25th 2016.
Medical Cannabis Legalization and State-Level Prevalence of Serious
Mental Illness in the National Survey on Drug Use and Health (NSDUH)
Researchers have recently taken a preliminary look at the relationship between medical
cannabis legalization and mental health. This population level research study saw that
medical cannabis legalization is associated with a higher prevalence of serious mental
illness. Study authors state that “cannabis use somewhat accounts for this association.”
- Lauren M. Dutra, William J. Parish, Camille K. Gourdet, Sarah A. Wylie, and
Jenny L. Wiley, Medical cannabis legalization and state-level prevalence of serious
mental illness in the National Survey on Drug Use and Health (NSDUH) 2008-2015,
International Review of Psychiatry, July 16th 2018.
The Legalization of Marijuana in Colorado: The Impact Volume 5 – 2018, UPDATE
Section II: Marijuana Use 34
Persistency of Cannabis Use Predicts Violence following Acute Psychiatric
Discharge
It is generally accepted that substance use is positively correlated with exacerbations of
psychiatric symptoms and violence. Due to the lack of research on psychiatric patients
who use cannabis, a team of Canadian researchers recently aimed to examine the
relationship between cannabis use and psychiatric episodes as well as violence.
Findings indicated that the longer an individual reports using cannabis after a
psychiatric discharge, the more likely they are of being violent.
- Jules R. Dugre, Laura Dellazizzo, Charles-Edouard Giguere, Stephane Potvin,
and Alexandre Dumais, Persistency of Cannabis Use Predicts Violence following
Acute Psychiatric Discharge, Frontiers in Psychiatry, Forensic Psychiatry,
September 21st 2017.
The Legalization of Marijuana in Colorado: The Impact Volume 5 – 2018, UPDATE
Section III: Public Health 35
Section III: Public Health
Some Findings
The yearly rate of emergency department visits related to marijuana increased 52
percent after the legalization of recreational marijuana. (2012 compared to 2016)
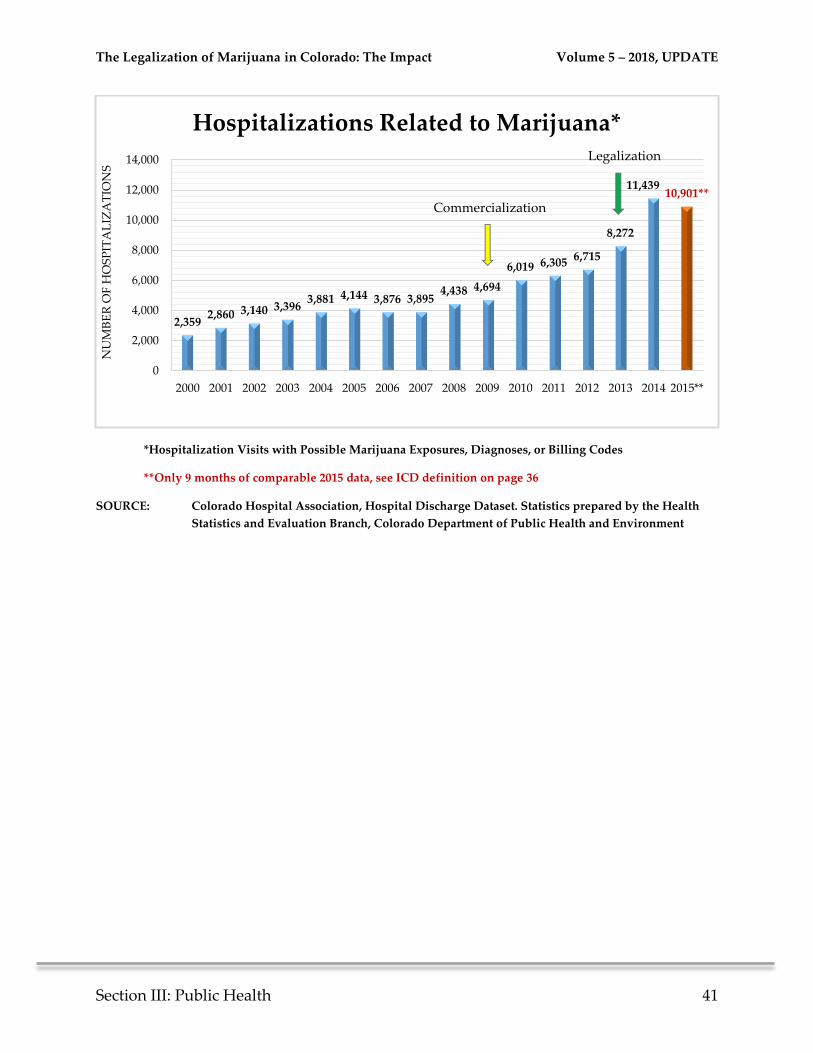
Number of hospitalizations related to marijuana:
o 2011 – 6,305
o 2012 – 6,715
o 2013 – 8,272
o 2014 – 11,439
o Jan-Sept 2015 – 10,901
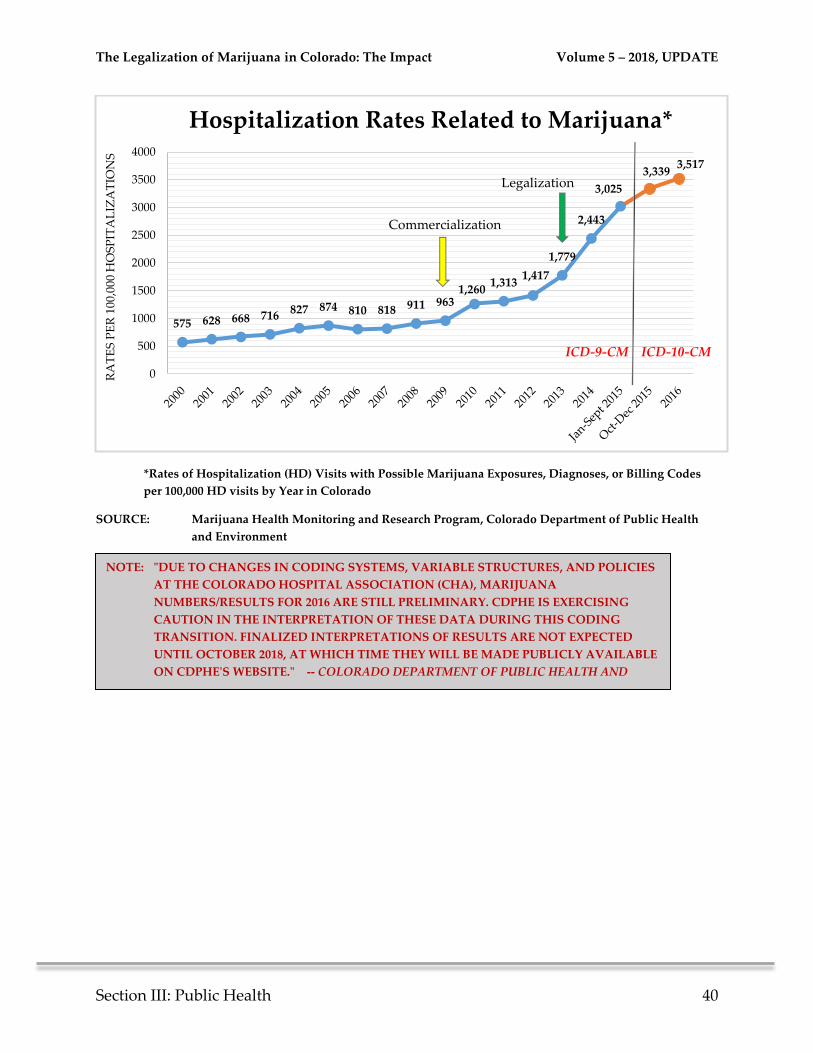
The yearly rate of marijuana-related hospitalizations increased 148 percent after
the legalization of recreational marijuana. (2012 compared to 2016)
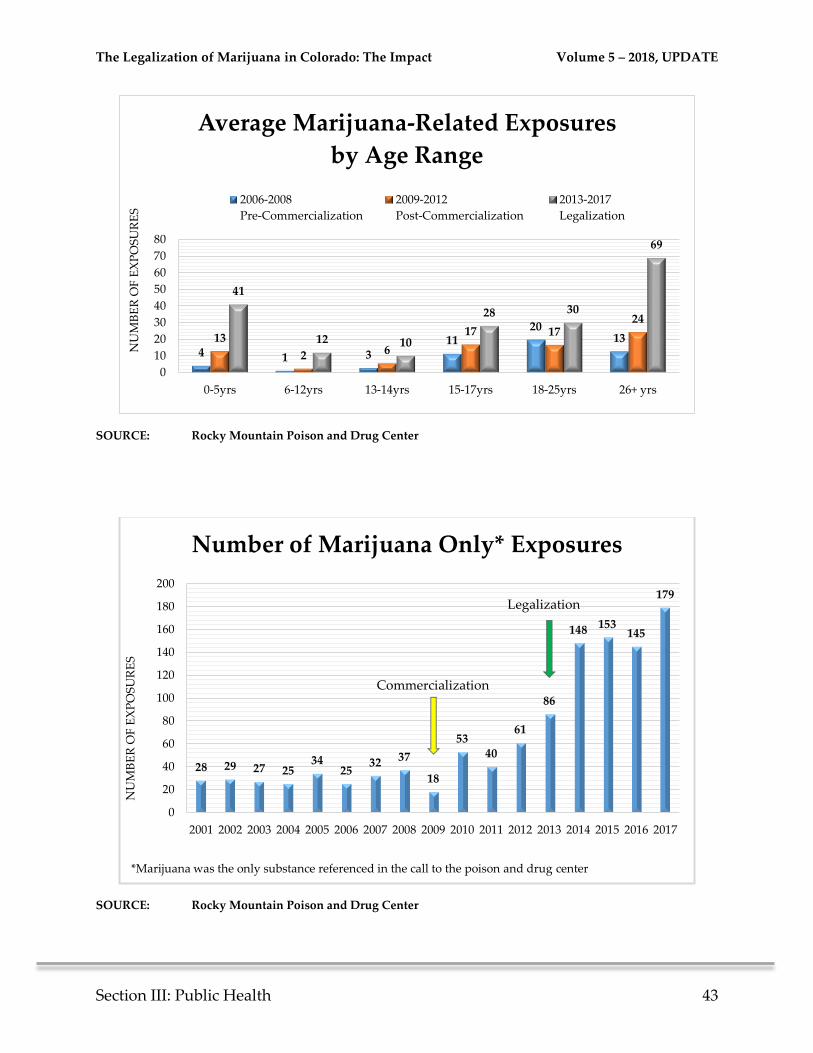
Marijuana only exposures more than tripled in the five-year average (2013-2017)
since Colorado legalized recreational marijuana compared to the five-year
average (2008-2012) prior to legalization.
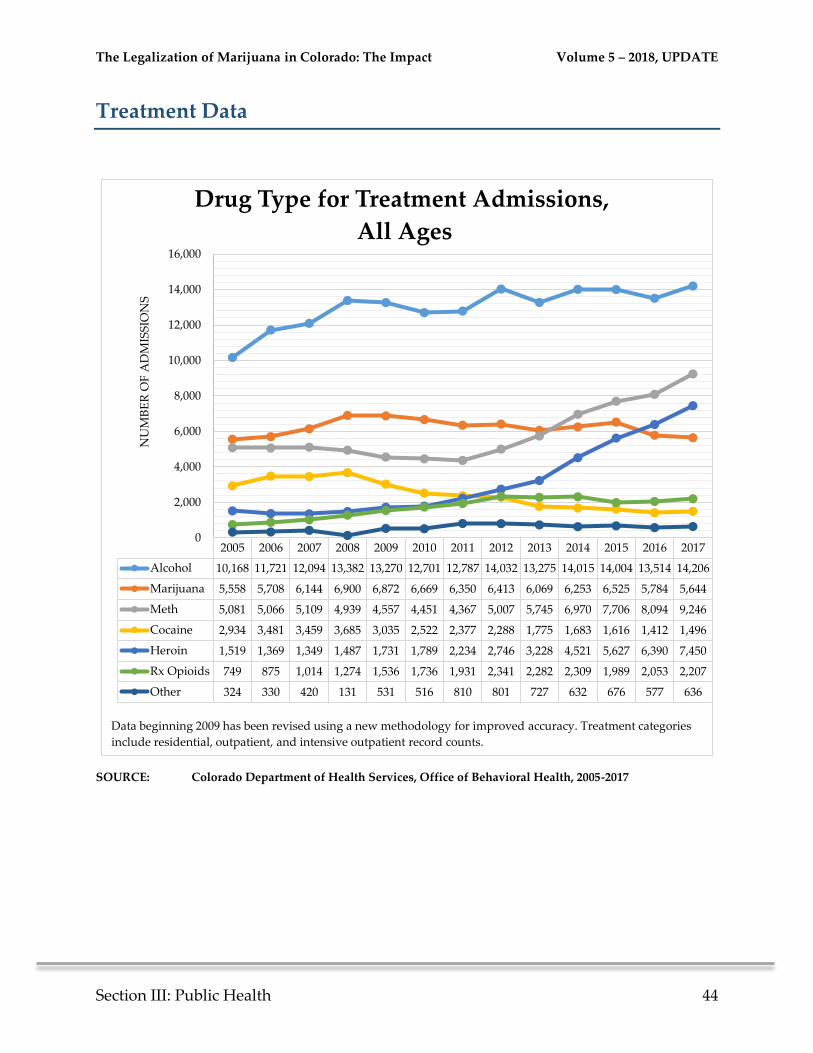
The five year average (2008-2012) of marijuana treatment admissions prior to
legalization, decreased 9 percent compared to the five year average (2013-2017)
after legalization.
The Legalization of Marijuana in Colorado: The Impact Volume 5 – 2018, UPDATE
Section III: Public Health 36
Definitions by Rocky Mountain HIDTA
Marijuana-Related: Also referred to as “marijuana mentions.” Data could be obtained
from lab tests, patient self-admission or some other form of validation obtained by the
provider. Being marijuana-related does not necessarily prove marijuana was the cause
of the emergency department admission or hospitalization.
International Classification of Disease (ICD): A medical coding system used to
classify diseases and related health problems.
**In 2015, ICD-10 (the tenth modification) was implemented in place of ICD-9.
Although ICD-10 will allow for better analysis of disease patterns and treatment
outcomes for the advancement of medical care, comparison of trends before and
after the conversion can be made difficult and/or impossible. The number of
codes increased from approximately 13,600 codes to approximately 69,000 codes.
For the above reasons, hospitalization and emergency department data was only
provided pre-conversion to ICD-10 for the 2017, Volume 5 report. However, some
preliminary data for rates per 100,000 individuals was provided by the Colorado
Department of Public Health and Environment (CDPHE) for this update.
The Legalization of Marijuana in Colorado: The Impact Volume 5 – 2018, UPDATE
Section III: Public Health 37
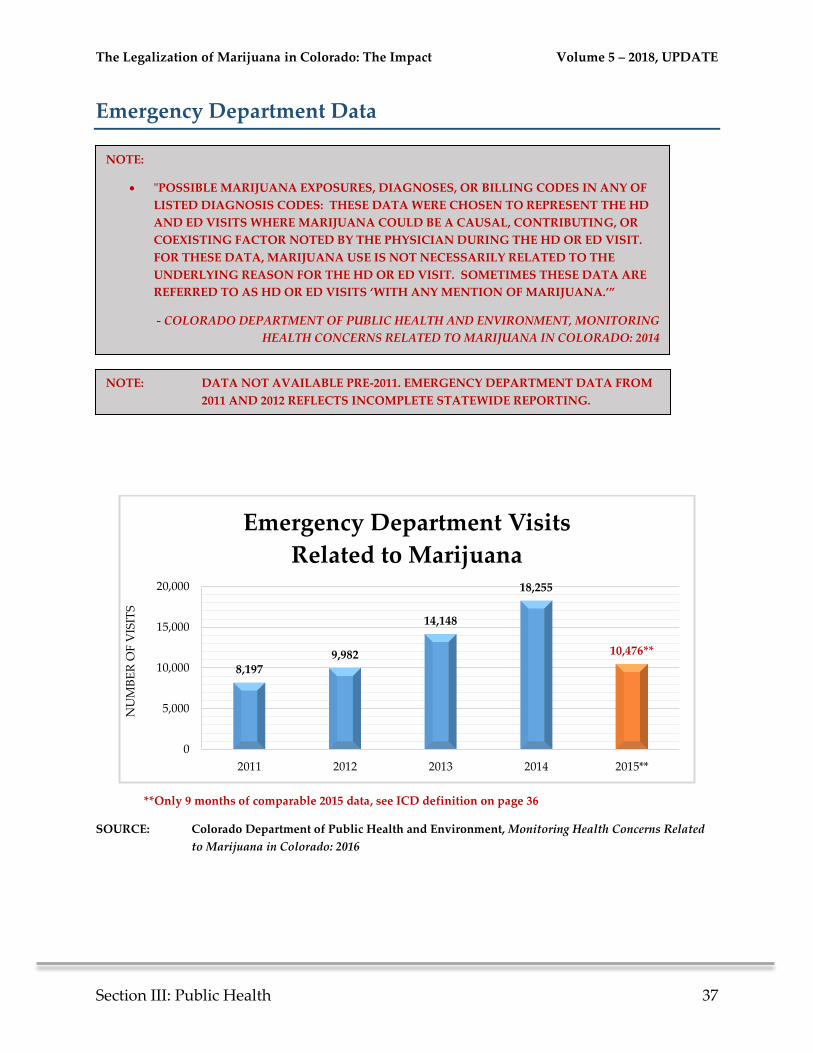
Emergency Department Data
**Only 9 months of comparable 2015 data, see ICD definition on page 36
SOURCE: Colorado Department of Public Health and Environment, Monitoring Health Concerns Related
to Marijuana in Colorado: 2016
8,1979,982
14,148
18,255
10,476**
0
5,000
10,000
15,000
20,000
2011 2012 2013 2014 2015**
NU
MB
ER
OF
VIS
ITS
Emergency Department Visits
Related to Marijuana
NOTE:
"POSSIBLE MARIJUANA EXPOSURES, DIAGNOSES, OR BILLING CODES IN ANY OF
LISTED DIAGNOSIS CODES: THESE DATA WERE CHOSEN TO REPRESENT THE HD
AND ED VISITS WHERE MARIJUANA COULD BE A CAUSAL, CONTRIBUTING, OR
COEXISTING FACTOR NOTED BY THE PHYSICIAN DURING THE HD OR ED VISIT.
FOR THESE DATA, MARIJUANA USE IS NOT NECESSARILY RELATED TO THE
UNDERLYING REASON FOR THE HD OR ED VISIT. SOMETIMES THESE DATA ARE
REFERRED TO AS HD OR ED VISITS ‘WITH ANY MENTION OF MARIJUANA.’”
- COLORADO DEPARTMENT OF PUBLIC HEALTH AND ENVIRONMENT, MONITORING
HEALTH CONCERNS RELATED TO MARIJUANA IN COLORADO: 2014
NOTE: DATA NOT AVAILABLE PRE-2011. EMERGENCY DEPARTMENT DATA FROM
2011 AND 2012 REFLECTS INCOMPLETE STATEWIDE REPORTING.
The Legalization of Marijuana in Colorado: The Impact Volume 5 – 2018, UPDATE
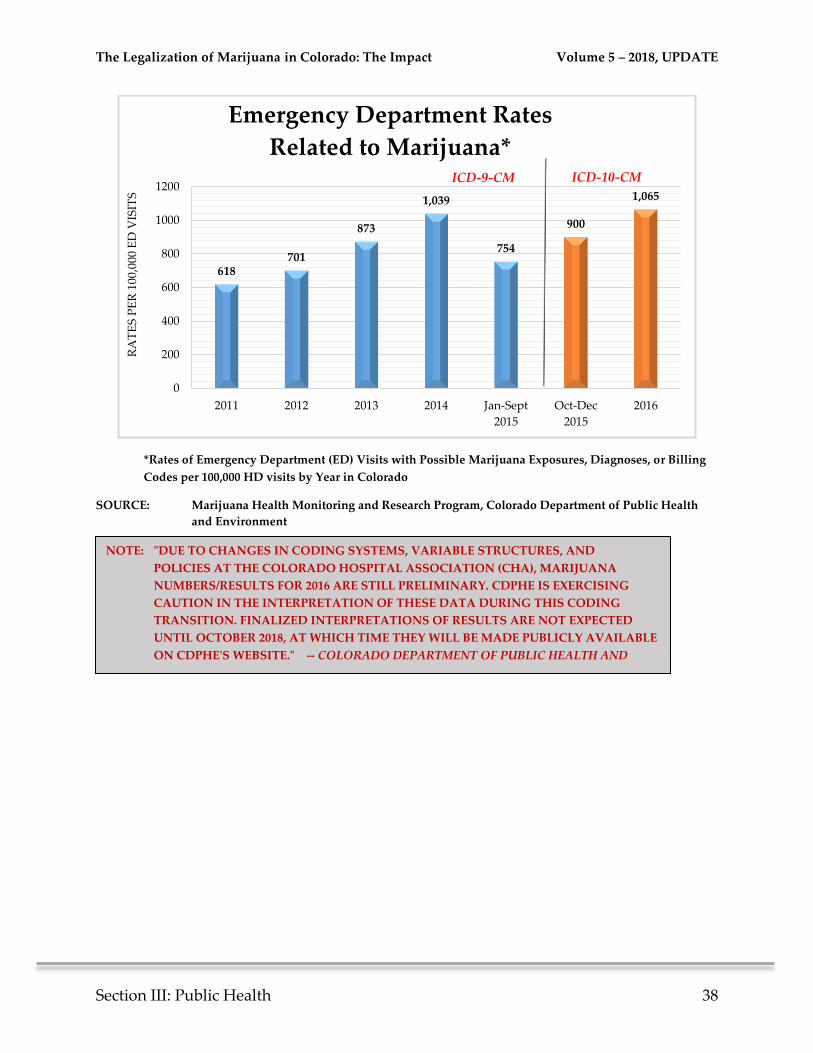
Section III: Public Health 38
*Rates of Emergency Department (ED) Visits with Possible Marijuana Exposures, Diagnoses, or Billing
Codes per 100,000 HD visits by Year in Colorado
SOURCE: Marijuana Health Monitoring and Research Program, Colorado Department of Public Health
and Environment
618701
873
1,039
754
900
1,065
0
200
400
600
800
1000
1200
2011 2012 2013 2014 Jan-Sept
2015
Oct-Dec
2015
2016
RA
TE
S P
ER
100
,000
ED
VIS
ITS
Emergency Department Rates
Related to Marijuana*ICD-9-CM ICD-10-CM
NOTE: "DUE TO CHANGES IN CODING SYSTEMS, VARIABLE STRUCTURES, AND
POLICIES AT THE COLORADO HOSPITAL ASSOCIATION (CHA), MARIJUANA
NUMBERS/RESULTS FOR 2016 ARE STILL PRELIMINARY. CDPHE IS EXERCISING
CAUTION IN THE INTERPRETATION OF THESE DATA DURING THIS CODING
TRANSITION. FINALIZED INTERPRETATIONS OF RESULTS ARE NOT EXPECTED
UNTIL OCTOBER 2018, AT WHICH TIME THEY WILL BE MADE PUBLICLY AVAILABLE
ON CDPHE'S WEBSITE." -- COLORADO DEPARTMENT OF PUBLIC HEALTH AND
ENVIRONMENT,
MARIJUANA HEALTH MONITORING AND RESEARCH PROGRAM
The Legalization of Marijuana in Colorado: The Impact Volume 5 – 2018, UPDATE
Section III: Public Health 39
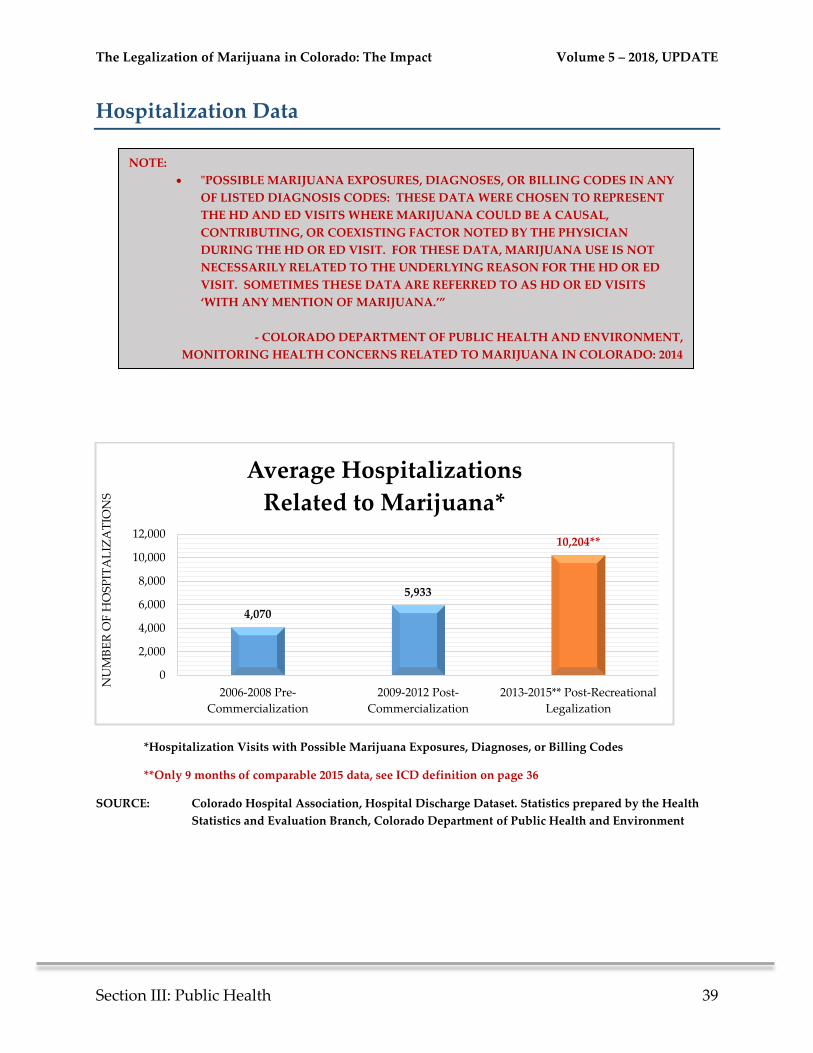
Hospitalization Data
*Hospitalization Visits with Possible Marijuana Exposures, Diagnoses, or Billing Codes
**Only 9 months of comparable 2015 data, see ICD definition on page 36
SOURCE: Colorado Hospital Association, Hospital Discharge Dataset. Statistics prepared by the Health
Statistics and Evaluation Branch, Colorado Department of Public Health and Environment
4,070
5,933
10,204**
0
2,000
4,000
6,000
8,000
10,000
12,000
2006-2008 Pre-
Commercialization
2009-2012 Post-
Commercialization
2013-2015** Post-Recreational
Legalization
NU
MB
ER
OF
HO
SP
ITA
LIZ
AT
ION
S
Average Hospitalizations
Related to Marijuana*
NOTE:
"POSSIBLE MARIJUANA EXPOSURES, DIAGNOSES, OR BILLING CODES IN ANY
OF LISTED DIAGNOSIS CODES: THESE DATA WERE CHOSEN TO REPRESENT
THE HD AND ED VISITS WHERE MARIJUANA COULD BE A CAUSAL,
CONTRIBUTING, OR COEXISTING FACTOR NOTED BY THE PHYSICIAN
DURING THE HD OR ED VISIT. FOR THESE DATA, MARIJUANA USE IS NOT
NECESSARILY RELATED TO THE UNDERLYING REASON FOR THE HD OR ED
VISIT. SOMETIMES THESE DATA ARE REFERRED TO AS HD OR ED VISITS
‘WITH ANY MENTION OF MARIJUANA.’”
- COLORADO DEPARTMENT OF PUBLIC HEALTH AND ENVIRONMENT,
MONITORING HEALTH CONCERNS RELATED TO MARIJUANA IN COLORADO: 2014
The Legalization of Marijuana in Colorado: The Impact Volume 5 – 2018, UPDATE
Section III: Public Health 40
*Rates of Hospitalization (HD) Visits with Possible Marijuana Exposures, Diagnoses, or Billing Codes
per 100,000 HD visits by Year in Colorado
SOURCE: Marijuana Health Monitoring and Research Program, Colorado Department of Public Health
and Environment
575 628 668 716827 874 810 818 911 963
1,2601,313
1,417
1,779
2,443
3,025
3,3393,517
0
500
1000
1500
2000
2500
3000
3500
4000
RA
TE
S P
ER
100
,000
HO
SP
ITA
LIZ
AT
ION
SHospitalization Rates Related to Marijuana*
Commercialization
Legalization
ICD-9-CM ICD-10-CM
NOTE: "DUE TO CHANGES IN CODING SYSTEMS, VARIABLE STRUCTURES, AND POLICIES
AT THE COLORADO HOSPITAL ASSOCIATION (CHA), MARIJUANA
NUMBERS/RESULTS FOR 2016 ARE STILL PRELIMINARY. CDPHE IS EXERCISING
CAUTION IN THE INTERPRETATION OF THESE DATA DURING THIS CODING
TRANSITION. FINALIZED INTERPRETATIONS OF RESULTS ARE NOT EXPECTED
UNTIL OCTOBER 2018, AT WHICH TIME THEY WILL BE MADE PUBLICLY AVAILABLE
ON CDPHE'S WEBSITE." -- COLORADO DEPARTMENT OF PUBLIC HEALTH AND
ENVIRONMENT,
MARIJUANA HEALTH MONITORING AND RESEARCH PROGRAM
The Legalization of Marijuana in Colorado: The Impact Volume 5 – 2018, UPDATE
Section III: Public Health 41
*Hospitalization Visits with Possible Marijuana Exposures, Diagnoses, or Billing Codes
**Only 9 months of comparable 2015 data, see ICD definition on page 36
SOURCE: Colorado Hospital Association, Hospital Discharge Dataset. Statistics prepared by the Health
Statistics and Evaluation Branch, Colorado Department of Public Health and Environment
2,3592,860 3,140 3,396
3,881 4,144 3,876 3,8954,438 4,694
6,019 6,3056,715
8,272
11,43910,901**
0
2,000
4,000
6,000
8,000
10,000
12,000
14,000
2000 2001 2002 2003 2004 2005 2006 2007 2008 2009 2010 2011 2012 2013 2014 2015**
NU
MB
ER
OF
HO
SP
ITA
LIZ
AT
ION
S
Hospitalizations Related to Marijuana*
Commercialization
Legalization
The Legalization of Marijuana in Colorado: The Impact Volume 5 – 2018, UPDATE
Section III: Public Health 42
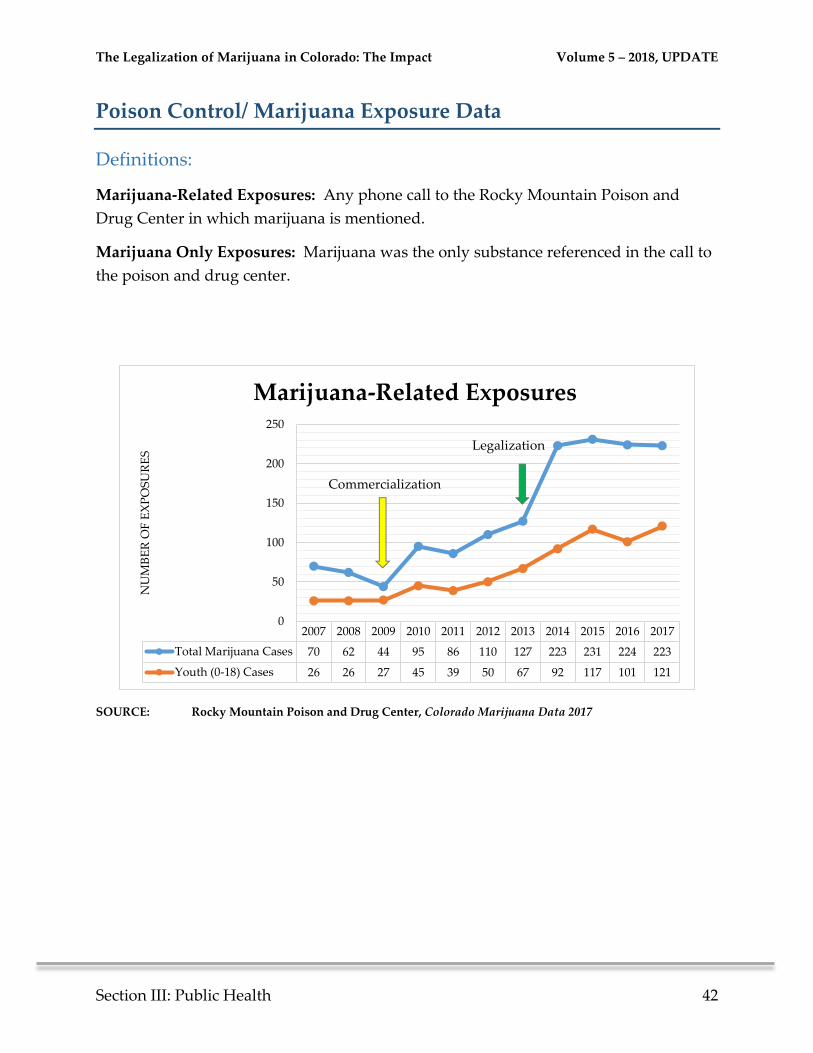
Poison Control/ Marijuana Exposure Data
Definitions:
Marijuana-Related Exposures: Any phone call to the Rocky Mountain Poison and
Drug Center in which marijuana is mentioned.
Marijuana Only Exposures: Marijuana was the only substance referenced in the call to
the poison and drug center.
SOURCE: Rocky Mountain Poison and Drug Center, Colorado Marijuana Data 2017
2007 2008 2009 2010 2011 2012 2013 2014 2015 2016 2017
Total Marijuana Cases 70 62 44 95 86 110 127 223 231 224 223
Youth (0-18) Cases 26 26 27 45 39 50 67 92 117 101 121
0
50
100
150
200
250
NU
MB
ER
OF
EX
PO
SU
RE
S
Marijuana-Related Exposures
Commercialization
Legalization
The Legalization of Marijuana in Colorado: The Impact Volume 5 – 2018, UPDATE
Section III: Public Health 43
SOURCE: Rocky Mountain Poison and Drug Center
SOURCE: Rocky Mountain Poison and Drug Center
4 1 311
201313
2 6
17 1724
41
12 10
28 30
69
0
10
20
30
40
50
60
70
80
0-5yrs 6-12yrs 13-14yrs 15-17yrs 18-25yrs 26+ yrs
NU
MB
ER
OF
EX
PO
SU
RE
SAverage Marijuana-Related Exposures
by Age Range
2006-2008
Pre-Commercialization
2009-2012
Post-Commercialization
2013-2017
Legalization
28 29 27 2534
2532 37
18
5340
61
86
148 153145
179
0
20
40
60
80
100
120
140
160
180
200
2001 2002 2003 2004 2005 2006 2007 2008 2009 2010 2011 2012 2013 2014 2015 2016 2017
NU
MB
ER
OF
EX
PO
SU
RE
S
Number of Marijuana Only* Exposures
*Marijuana was the only substance referenced in the call to the poison and drug center
Commercialization
Legalization
The Legalization of Marijuana in Colorado: The Impact Volume 5 – 2018, UPDATE
Section III: Public Health 44
Treatment Data
SOURCE: Colorado Department of Health Services, Office of Behavioral Health, 2005-2017
2005 2006 2007 2008 2009 2010 2011 2012 2013 2014 2015 2016 2017
Alcohol 10,168 11,721 12,094 13,382 13,270 12,701 12,787 14,032 13,275 14,015 14,004 13,514 14,206
Marijuana 5,558 5,708 6,144 6,900 6,872 6,669 6,350 6,413 6,069 6,253 6,525 5,784 5,644
Meth 5,081 5,066 5,109 4,939 4,557 4,451 4,367 5,007 5,745 6,970 7,706 8,094 9,246
Cocaine 2,934 3,481 3,459 3,685 3,035 2,522 2,377 2,288 1,775 1,683 1,616 1,412 1,496
Heroin 1,519 1,369 1,349 1,487 1,731 1,789 2,234 2,746 3,228 4,521 5,627 6,390 7,450
Rx Opioids 749 875 1,014 1,274 1,536 1,736 1,931 2,341 2,282 2,309 1,989 2,053 2,207
Other 324 330 420 131 531 516 810 801 727 632 676 577 636
0
2,000
4,000
6,000
8,000
10,000
12,000
14,000
16,000
NU
MB
ER
OF
AD
MIS
SIO
NS
Drug Type for Treatment Admissions,
All Ages
Data beginning 2009 has been revised using a new methodology for improved accuracy. Treatment categories
include residential, outpatient, and intensive outpatient record counts.
The Legalization of Marijuana in Colorado: The Impact Volume 5 – 2018, UPDATE
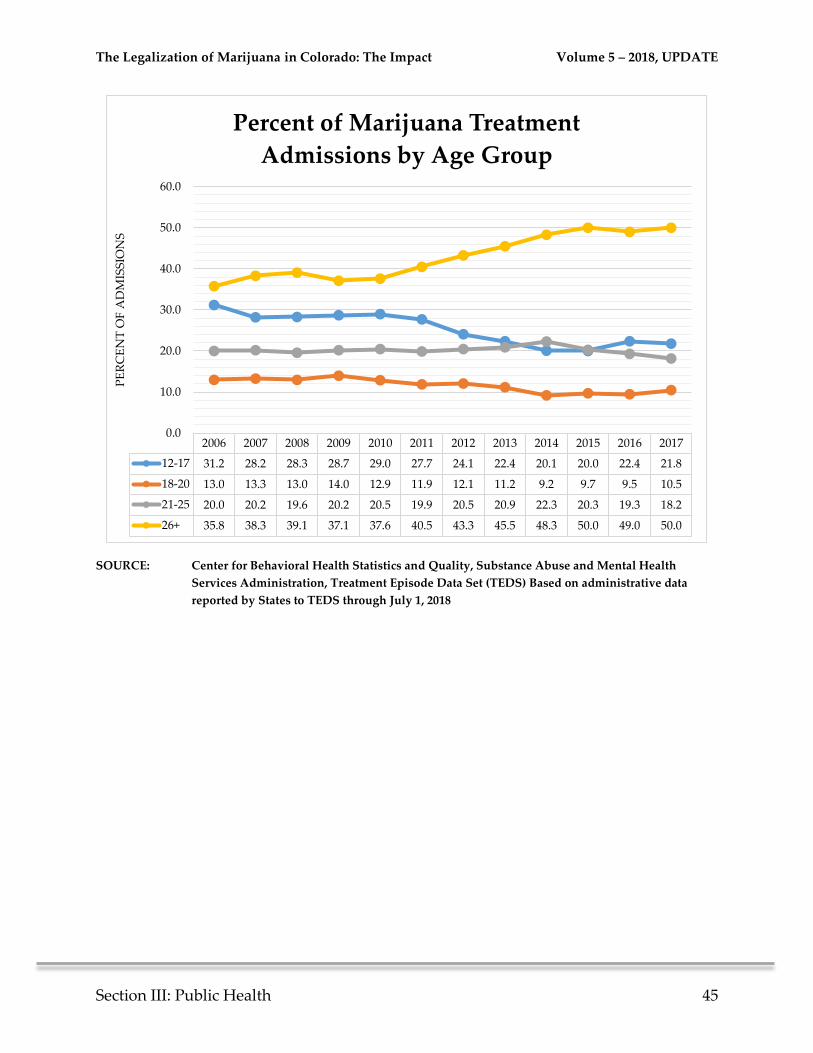
Section III: Public Health 45
SOURCE: Center for Behavioral Health Statistics and Quality, Substance Abuse and Mental Health
Services Administration, Treatment Episode Data Set (TEDS) Based on administrative data
reported by States to TEDS through July 1, 2018
2006 2007 2008 2009 2010 2011 2012 2013 2014 2015 2016 2017
12-17 31.2 28.2 28.3 28.7 29.0 27.7 24.1 22.4 20.1 20.0 22.4 21.8
18-20 13.0 13.3 13.0 14.0 12.9 11.9 12.1 11.2 9.2 9.7 9.5 10.5
21-25 20.0 20.2 19.6 20.2 20.5 19.9 20.5 20.9 22.3 20.3 19.3 18.2
26+ 35.8 38.3 39.1 37.1 37.6 40.5 43.3 45.5 48.3 50.0 49.0 50.0
0.0
10.0
20.0
30.0
40.0
50.0
60.0
PE
RC
EN
T O
F A
DM
ISS
ION
SPercent of Marijuana Treatment
Admissions by Age Group
The Legalization of Marijuana in Colorado: The Impact Volume 5 – 2018, UPDATE
Section III: Public Health 46
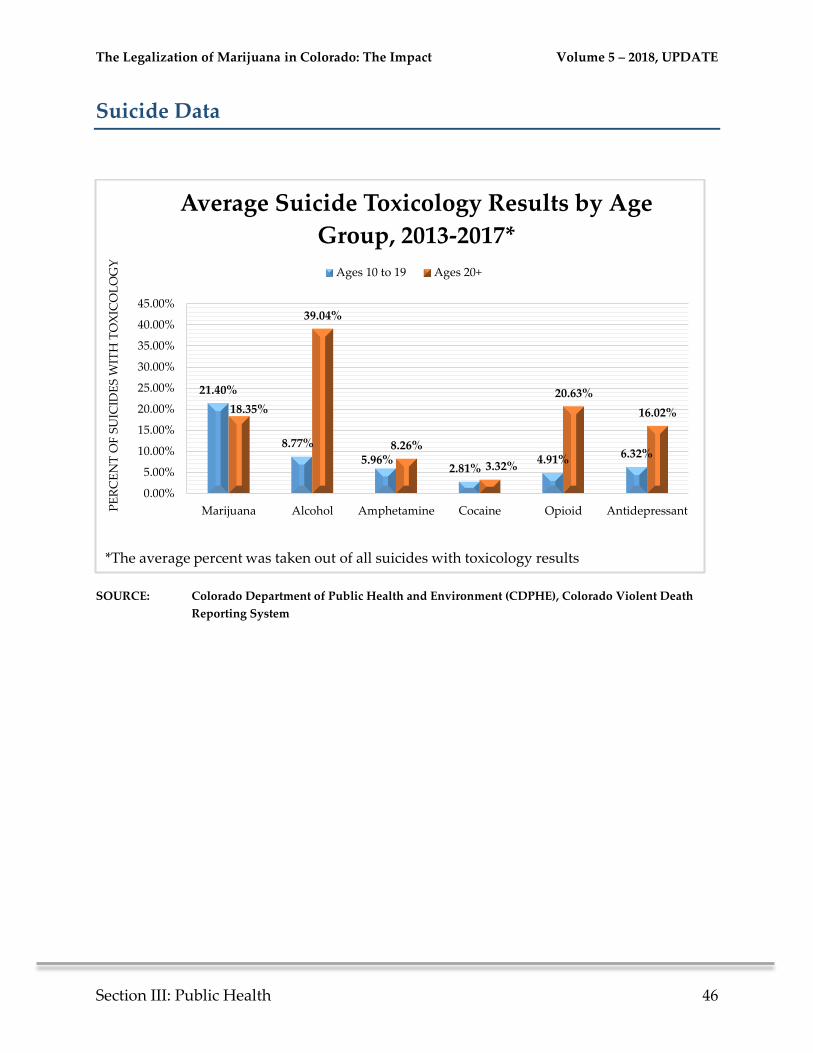
Suicide Data
SOURCE: Colorado Department of Public Health and Environment (CDPHE), Colorado Violent Death
Reporting System
21.40%
8.77%
5.96%2.81%
4.91% 6.32%
18.35%
39.04%
8.26%
3.32%
20.63%
16.02%
0.00%
5.00%
10.00%
15.00%
20.00%
25.00%
30.00%
35.00%
40.00%
45.00%
Marijuana Alcohol Amphetamine Cocaine Opioid AntidepressantPE
RC
EN
T O
F S
UIC
IDE
S W
ITH
TO
XIC
OL
OG
Y
Average Suicide Toxicology Results by Age
Group, 2013-2017*
Ages 10 to 19 Ages 20+
*The average percent was taken out of all suicides with toxicology results
The Legalization of Marijuana in Colorado: The Impact Volume 5 – 2018, UPDATE
Section III: Public Health 47
SOURCE: Colorado Department of Public Health and Environment (CDPHE), Colorado Violent Death
Reporting System
SOURCE: Colorado Department of Public Health and Environment (CDPHE), Colorado Violent Death
Reporting System
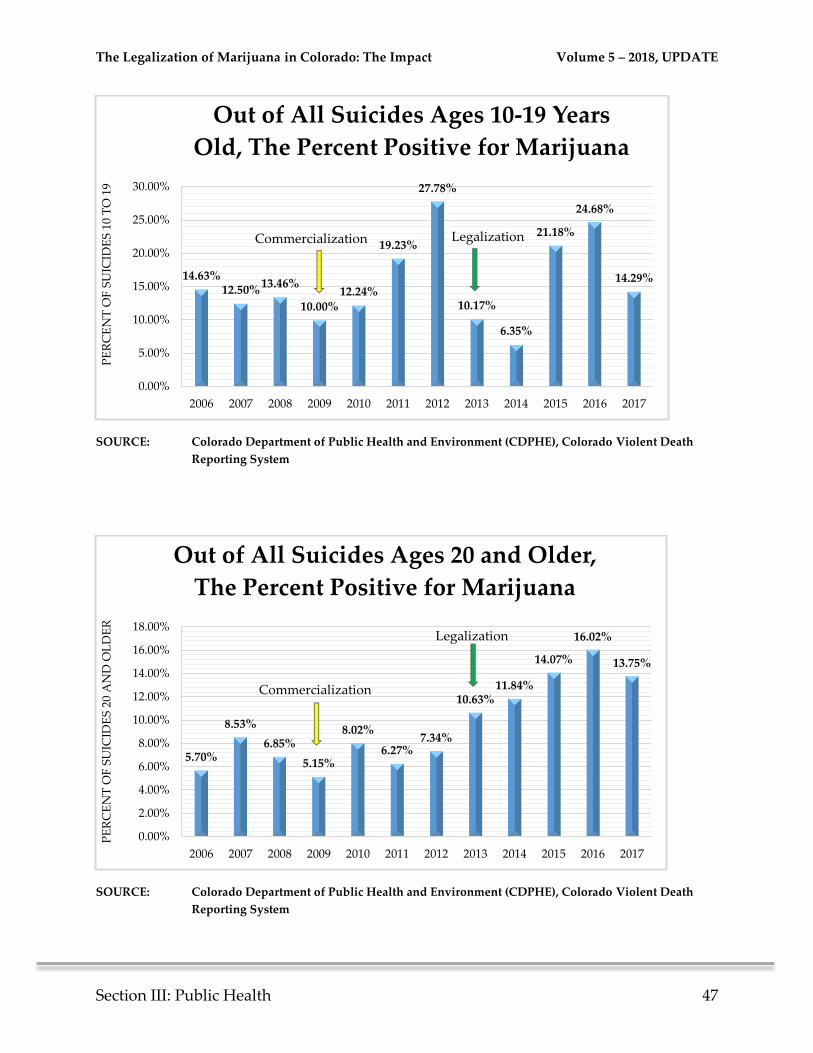
14.63%12.50%
13.46%
10.00%12.24%
19.23%
27.78%
10.17%
6.35%
21.18%
24.68%
14.29%
0.00%
5.00%
10.00%
15.00%
20.00%
25.00%
30.00%
2006 2007 2008 2009 2010 2011 2012 2013 2014 2015 2016 2017
PE
RC
EN
T O
F S
UIC
IDE
S 1
0 T
O 1
9Out of All Suicides Ages 10-19 Years
Old, The Percent Positive for Marijuana
Commercialization Legalization
5.70%
8.53%
6.85%
5.15%
8.02%
6.27%7.34%
10.63%11.84%
14.07%
16.02%
13.75%
0.00%
2.00%
4.00%
6.00%
8.00%
10.00%
12.00%
14.00%
16.00%
18.00%
2006 2007 2008 2009 2010 2011 2012 2013 2014 2015 2016 2017
PE
RC
EN
T O
F S
UIC
IDE
S 2
0 A
ND
OL
DE
R
Out of All Suicides Ages 20 and Older,
The Percent Positive for Marijuana
Commercialization
Legalization
The Legalization of Marijuana in Colorado: The Impact Volume 5 – 2018, UPDATE
Section III: Public Health 48
SOURCE: Colorado Department of Public Health and Environment (CDPHE), Colorado Violent Death
Reporting System
SOURCE: Colorado Department of Public Health and Environment (CDPHE), Colorado Violent Death
Reporting System
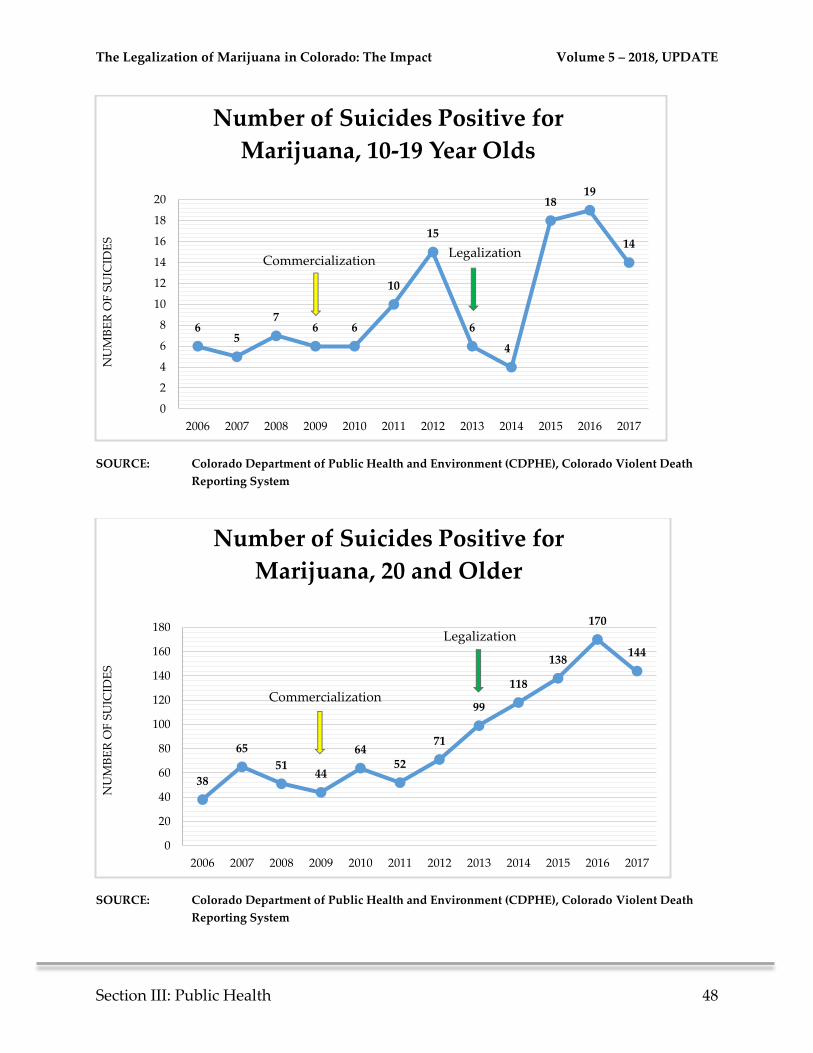
65
76 6
10
15
6
4
1819
14
0
2
4
6
8
10
12
14
16
18
20
2006 2007 2008 2009 2010 2011 2012 2013 2014 2015 2016 2017
NU
MB
ER
OF
SU
ICID
ES
Number of Suicides Positive for
Marijuana, 10-19 Year Olds
CommercializationLegalization
38
65
5144
6452
71
99
118
138
170
144
0
20
40
60
80
100
120
140
160
180
2006 2007 2008 2009 2010 2011 2012 2013 2014 2015 2016 2017
NU
MB
ER
OF
SU
ICID
ES
Number of Suicides Positive for
Marijuana, 20 and Older
Commercialization
Legalization
The Legalization of Marijuana in Colorado: The Impact Volume 5 – 2018, UPDATE
Section III: Public Health 49
Public Health Information
Opioid Deaths and Legalized Marijuana
Contrary to information that has been published, opioid/opiate deaths in Colorado have
increased 33% since legalization of marijuana in 2013. Prescription opioid deaths
decreased slightly in 2015 and 2016 but increased to 357 in 2017. Heroin deaths
increased 93% from 2013 to 2016 but decreased 7% in 2017.
- Colorado Department of Public Health and Environment, Vital Statistics, 2018.
Marijuana Addiction is Real, and Rising
Many people are unaware of marijuana addiction. In the public health and medical
communities, it is a well-defined disorder that includes physical withdrawal symptoms,
cravings, and psychological dependence. “There should be no controversy about the
existence of marijuana addiction,” said David Smith, a physician who has been treating
addiction since he opened a free clinic in San Francisco’s drug-drenched Haight
Ashbury neighborhood in the 1960s. The percentage of people who become addicted to
marijuana are estimated at about 9 percent of all users; 17 percent of those who start in
adolescence become addicted.
- Christine Vestal, Marijuana Addiction is Real, and Rising, Tribune News Service, June 24th
2018.
Marijuana-Related ED Visits by Colorado Teens on the Rise
“Between 2005 and 2015 the proportion of ED or urgent care visits by youth ages 13 to
20 for marijuana-related illnesses rose from 1.8 per 1,000 visits to 4.9 per 1,000 visits, the
study team reported in the Journal of Adolescent Health online March 30.” That is over
a 170% increase in the ten-year period.
- Shereen Lehman, Marijuana-related ED Visits by Colorado Teens on the Rise, Reuters, April
18th 2018.
The Legalization of Marijuana in Colorado: The Impact Volume 5 – 2018, UPDATE
Section III: Public Health 50
Renowned Medical Marijuana Doctor Says Concentrates Should be Banned
Dr. Rav Ivker, a physician renowned for using marijuana to treat chronic pain, has said
he believes marijuana concentrates should be banned. “I think they should be illegal, in
fact, I hope they become illegal”, he said. “The only thing they’re good for is really
getting high. But they’re a high-risk, and really no benefit from them.” Ivker also said
that “Addiction is possible with high-potency marijuana products, including
concentrates – the shatter and the wax. These can contain from 80% to even 95% THC.”
- Renowned Medical Marijuana Doctor Says Concentrates Should be Banned, High Times, July
5th 2018.
Marijuana-related Vomiting Ailment
Cannabinoid hyperemesis syndrome was first documented in Australia in 2004. It
affects a small population — namely, a subset of marijuana users who smoke multiple
times a day for months, years or even decades. Physicians have historically
misdiagnosed it as the more generic “cyclic vomiting syndrome,” which has no
identifiable cause. Doctors say it’s difficult to treat the condition. There is no cure other
than to quit using marijuana; many skeptical patients continue using cannabis and their
vomiting episodes continue.
- Pauline Bartolone, What doctors have learned about an agonizing marijuana-related vomiting
ailment, California Healthline, December 7th 2017.
Marijuana in Breast Milk
In a study conducted by Thomas Hale and Dr. Teresa Baker from Texas Tech University
School of Medicine in Amarillo, they found that mothers that use marijuana transferred
a percentage into breast milk. “Levels in milk were quite low,” said Hale, director of the
Infant Risk Center. Both Hale and Baker said that women should abstain from smoking
marijuana while breast-feeding because there’s simply no known safe amount.”
- Serena Gordon, Mom’s Marijuana Ends Up in Breast Milk, Healthday Reporter, April 9th
2018.
The Legalization of Marijuana in Colorado: The Impact Volume 5 – 2018, UPDATE
Section III: Public Health 51
Effect of Cannabis Use in People with Chronic Non-Cancer Pain
As alternatives to opioids continues to be an important public health topic, recent
research suggests that there is no evidence that cannabis use reduced pain severity or
any sort of opioid-sparing effect in patients with chronic non-cancer pain.
- Gabrielle Campbell, Wayne D Hail, Amy Peacock, Nicholas Lintzeris, Raimondo
Bruno, Briony Larance, Suzanne Nielsen, Milton Cohen, Gary Chan, Richard P
Mattick, Fiona Blyth, Marian Shanahan, Timothy Dobbins, Michael Farrell, and
Louisa Degenhardt, Effect of cannabis use in people with chronic non-cancer pain
prescribed opioids: findings from a 4-year prospective cohort study, The Lancet, Public
Health, July 1st 2018
- of Psychiatry, September 26th 2017
Non-medical Cannabis Self-Exposure as a Dimensional Predictor of Opioid
Dependence Diagnosis: A Propensity Score Matched Analysis
“The impact of increasing non-medical cannabis use on vulnerability to develop opioid
use disorders has received considerable attention, with contrasting findings.”
Researchers have recently found that “Increasing self-exposure to non-medical
cannabis… was a predictor of greater odds of opioid dependence diagnosis.”
- Eduardo R. Butelman, Angelo G. I. Maremmani, Silvia Bacciardi, Carina Y. Chen,
Joel Correa da Rosa, and Mary Jeanne Kreek, Non-medical Cannabis Self-Exposure
as a Dimensional Predictor of Opioid Dependence Diagnosis: A Propensity Score
Matched Analysis, Frontiers in Psychiatry, Addictive Disorders, June 27th 2018
Medical Marijuana Users are More Likely to Use Prescription Drugs
Medically and Non-medically
Although there have been conflicting studies regarding the correlation between
cannabis use and prescription opioid use, a study published in the Journal of Addiction
Medicine concludes that “medical marijuana users should be a target population in
efforts to combat nonmedical prescription drug use.” Researchers found that medical
marijuana users were significantly more likely to report medical and nonmedical use of
prescription drugs.
- Theodore L. Caputi and Keith Humphreys, Medical Marijuana Users are More
Likely to Use Prescription Drugs Medically and Nonmedically, Journal of Addiction
Medicine, January 29th 2018
The Legalization of Marijuana in Colorado: The Impact Volume 5 – 2018, UPDATE
Section III: Public Health 52
Cannabis Use Causing Alarming Increase in Emergency Hospital Visits
and Childhood Poisoning
Dr. Mark S. Gold, a world renowned expert on addiction-related diseases, summarizes a study
published in late 2016 that aimed to examine trends and correlates of cannabis-involved
emergency department visits in the United States from 2004-2011. “The ED visit rate increased
for both cannabis-only use (51 to 73 visits per 100,000) and cannabis-polydrug use (63 to 100 per
100,000) in those aged 12 and older. Of note, the largest increase occurred in adolescents aged
12-17, and among persons who identified as non-Hispanic black.”
Dr. Gold goes on to highlight the findings of the study which state that “The odds of
hospitalization increased with older age users, as compared to adolescent admissions. These
data suggest a heavier burden to both the patient and to the health care system as a result of
increasing cannabis use among older adults. The severity of the “burden” is associated with the
prevalence of cannabis use, specific cannabis potency and dose (which is increasing over time),
the mode of administration, and numerous individual risk factors.”
- Mark Gold, MD, Cannabis Use Causing Alarming Increase in Emergency Hospital Visits and
Childhood Poisoning, Rivermend Health.
The Legalization of Marijuana in Colorado: The Impact Volume 5 – 2018, UPDATE
Section IV: Black Market 53
Section IV: Black Market
Some Findings
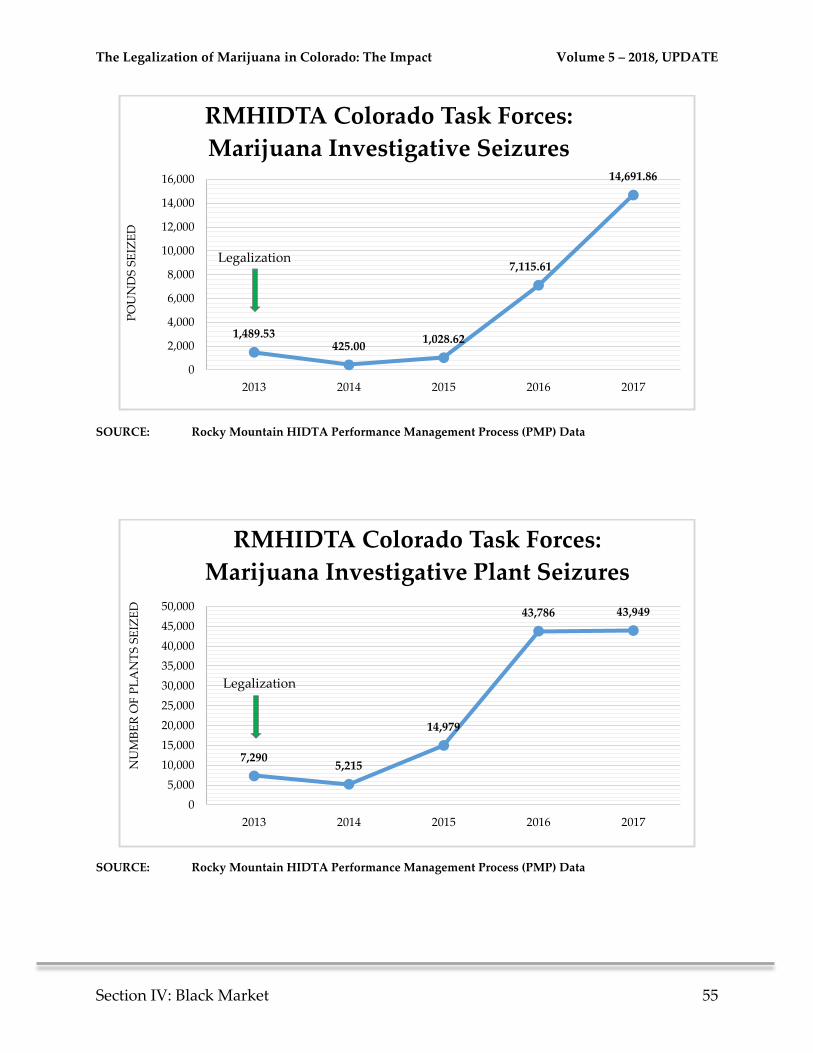
RMHIDTA Colorado Task Forces (10) conducted 144 investigations of black
market marijuana in Colorado resulting in:
o 239 felony arrests
o 7.3 tons of marijuana seized
o 43,949 marijuana plants seized
o 24 different states the marijuana was destined
The number of highway seizures of Colorado marijuana increased 39 percent
from an average of 242 seizures (2009-2012) to an average of 336 seizures (2013-
2017) during the time recreational marijuana has been legal.
Seizures of Colorado marijuana in the U.S. mail system has increased 1,042
percent from an average of 52 parcels (2009-2012) to an average of 594 parcels
(2013-2017) during the time recreational marijuana has been legal.
Definitions by Rocky Mountain HIDTA
Colorado Marijuana Investigations: RMHIDTA Colorado drug task forces
investigating individuals or organizations involved in illegally selling Colorado
marijuana, both within and outside of the state. These investigations only include those
reported by the ten RMHIDTA drug task forces.
Colorado Marijuana Interdictions: Incidents where state highway patrol officers
stopped a driver for a traffic violation and subsequently found Colorado marijuana
destined for other parts of the country. These interdiction seizures are reported on a
voluntary basis to the National Seizure System (NSS) managed by the El Paso
Intelligence Center (EPIC). These are random traffic stops, not investigations, and do
not include local law enforcement data.
The Legalization of Marijuana in Colorado: The Impact Volume 5 – 2018, UPDATE
Section IV: Black Market 54
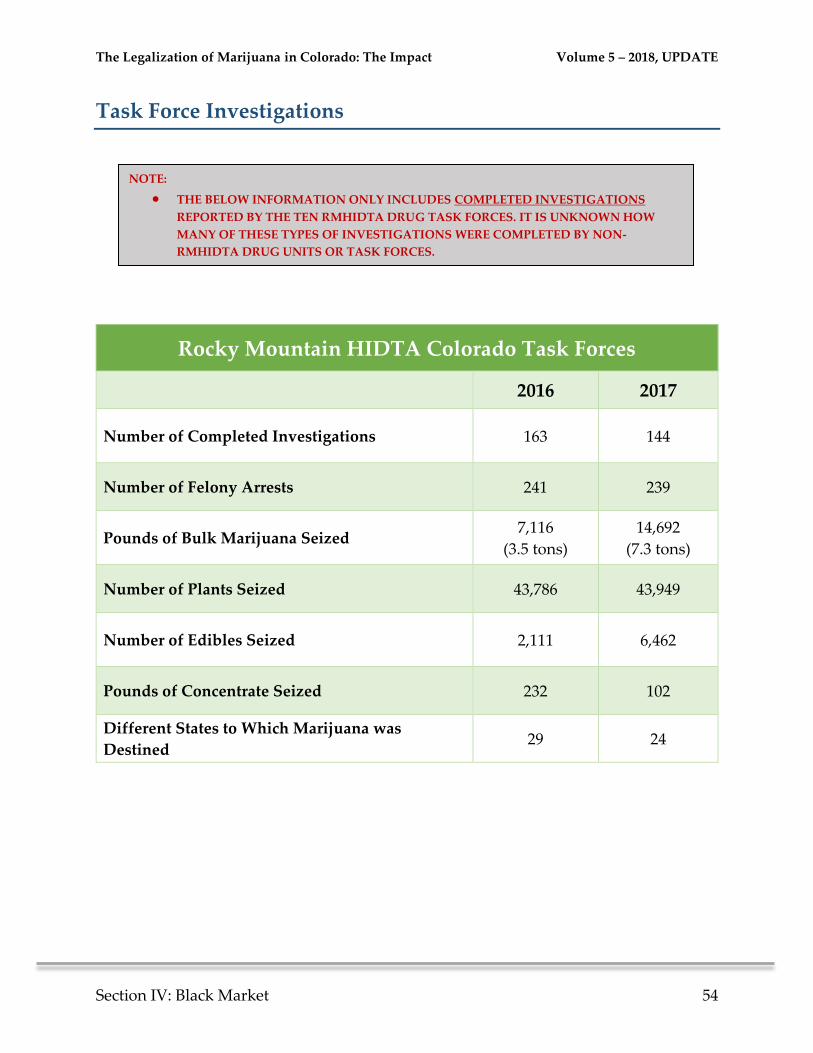
Task Force Investigations
Rocky Mountain HIDTA Colorado Task Forces
2016 2017
Number of Completed Investigations 163 144
Number of Felony Arrests 241 239
Pounds of Bulk Marijuana Seized 7,116
(3.5 tons)
14,692
(7.3 tons)
Number of Plants Seized 43,786 43,949
Number of Edibles Seized 2,111 6,462
Pounds of Concentrate Seized 232 102
Different States to Which Marijuana was
Destined 29 24
NOTE:
THE BELOW INFORMATION ONLY INCLUDES COMPLETED INVESTIGATIONS
REPORTED BY THE TEN RMHIDTA DRUG TASK FORCES. IT IS UNKNOWN HOW
MANY OF THESE TYPES OF INVESTIGATIONS WERE COMPLETED BY NON-
RMHIDTA DRUG UNITS OR TASK FORCES.
The Legalization of Marijuana in Colorado: The Impact Volume 5 – 2018, UPDATE
Section IV: Black Market 55
SOURCE: Rocky Mountain HIDTA Performance Management Process (PMP) Data
SOURCE: Rocky Mountain HIDTA Performance Management Process (PMP) Data
1,489.53425.00
1,028.62
7,115.61
14,691.86
0
2,000
4,000
6,000
8,000
10,000
12,000
14,000
16,000
2013 2014 2015 2016 2017
PO
UN
DS
SE
IZE
DRMHIDTA Colorado Task Forces:
Marijuana Investigative Seizures
Legalization
7,2905,215
14,979
43,786 43,949
0
5,000
10,000
15,000
20,000
25,000
30,000
35,000
40,000
45,000
50,000
2013 2014 2015 2016 2017
NU
MB
ER
OF
PL
AN
TS
SE
IZE
D
RMHIDTA Colorado Task Forces:
Marijuana Investigative Plant Seizures
Legalization
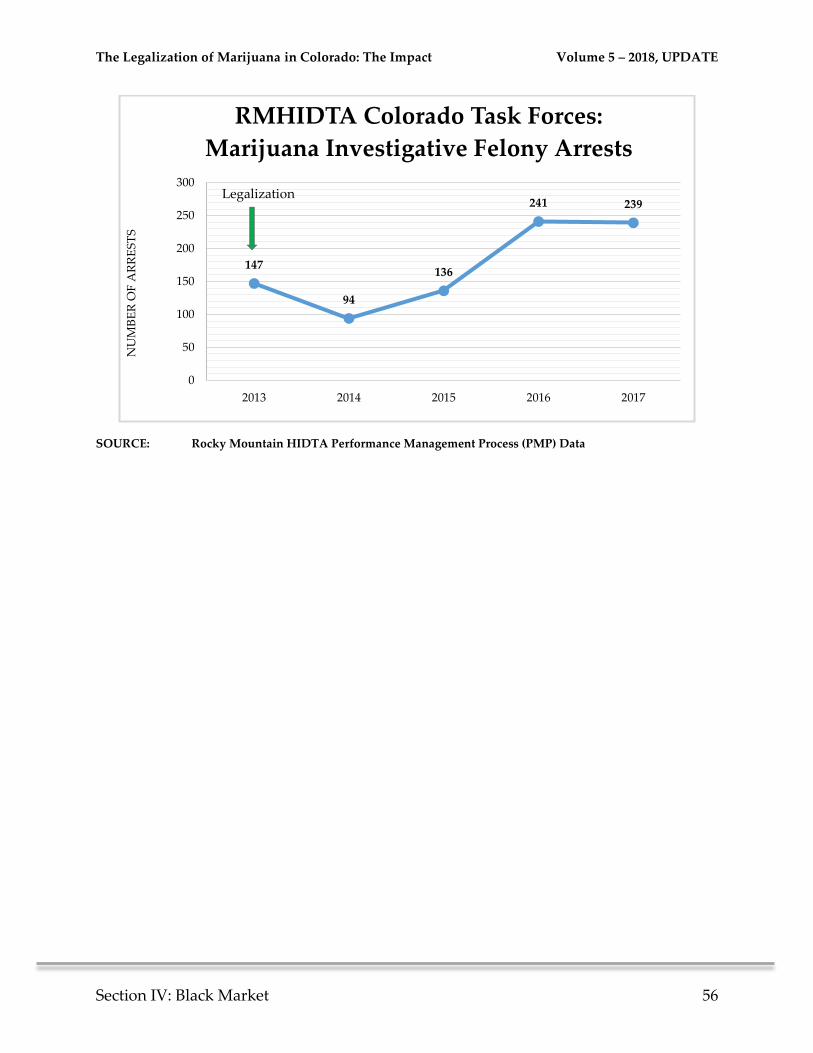
The Legalization of Marijuana in Colorado: The Impact Volume 5 – 2018, UPDATE
Section IV: Black Market 56
SOURCE: Rocky Mountain HIDTA Performance Management Process (PMP) Data
147
94
136
241 239
0
50
100
150
200
250
300
2013 2014 2015 2016 2017
NU
MB
ER
OF
AR
RE
ST
SRMHIDTA Colorado Task Forces:
Marijuana Investigative Felony Arrests
Legalization
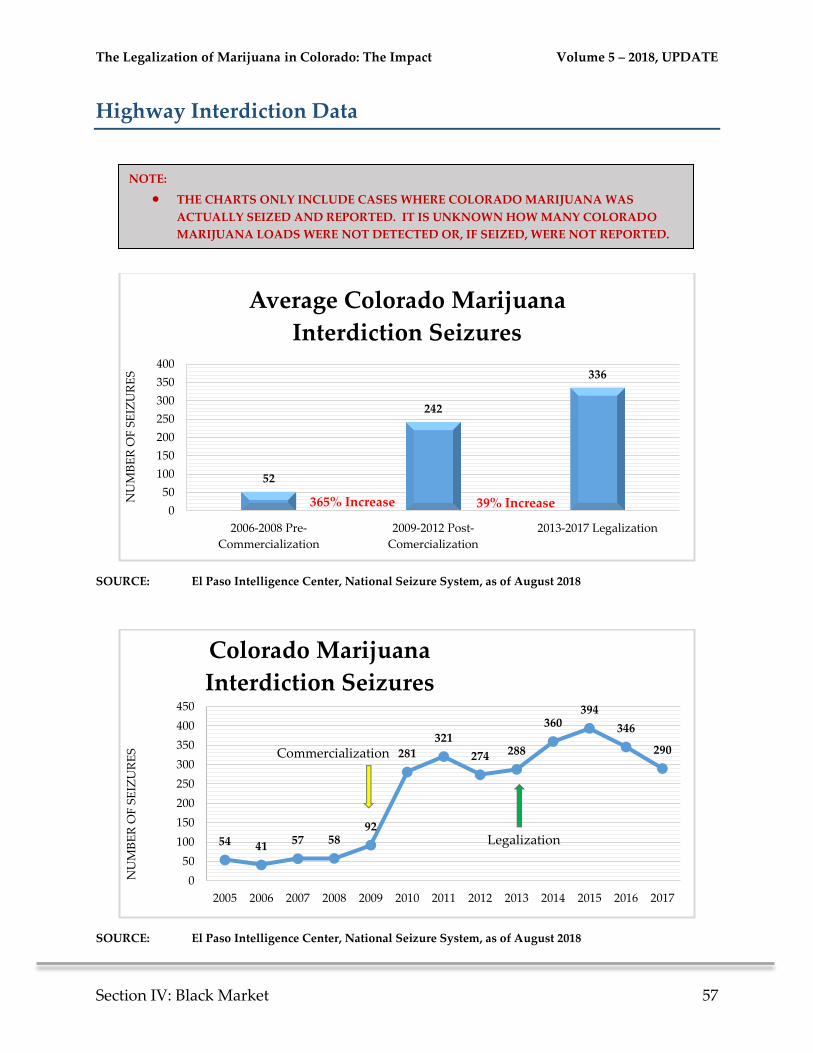
The Legalization of Marijuana in Colorado: The Impact Volume 5 – 2018, UPDATE
Section IV: Black Market 57
Highway Interdiction Data
SOURCE: El Paso Intelligence Center, National Seizure System, as of August 2018
SOURCE: El Paso Intelligence Center, National Seizure System, as of August 2018
52
242
336
0
50
100
150
200
250
300
350
400
2006-2008 Pre-
Commercialization
2009-2012 Post-
Comercialization
2013-2017 Legalization
NU
MB
ER
OF
SE
IZU
RE
S
Average Colorado Marijuana
Interdiction Seizures
365% Increase 39% Increase
54 4157 58
92
281
321
274 288
360394
346
290
0
50
100
150
200
250
300
350
400
450
2005 2006 2007 2008 2009 2010 2011 2012 2013 2014 2015 2016 2017
NU
MB
ER
OF
SE
IZU
RE
S
Colorado Marijuana
Interdiction Seizures
Commercialization
Legalization
NOTE:
THE CHARTS ONLY INCLUDE CASES WHERE COLORADO MARIJUANA WAS
ACTUALLY SEIZED AND REPORTED. IT IS UNKNOWN HOW MANY COLORADO
MARIJUANA LOADS WERE NOT DETECTED OR, IF SEIZED, WERE NOT REPORTED.
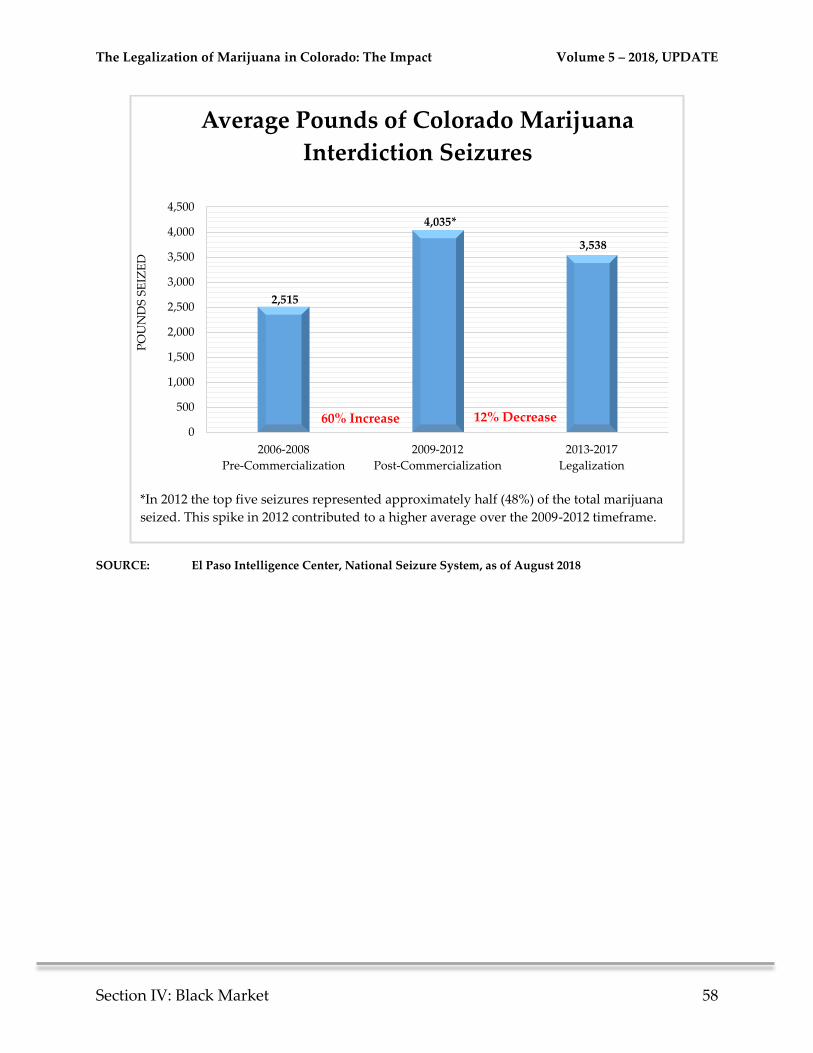
The Legalization of Marijuana in Colorado: The Impact Volume 5 – 2018, UPDATE
Section IV: Black Market 58
SOURCE: El Paso Intelligence Center, National Seizure System, as of August 2018
2,515
4,035*
3,538
0
500
1,000
1,500
2,000
2,500
3,000
3,500
4,000
4,500
2006-2008
Pre-Commercialization
2009-2012
Post-Commercialization
2013-2017
Legalization
PO
UN
DS
SE
IZE
D
Average Pounds of Colorado Marijuana
Interdiction Seizures
12% Decrease60% Increase
*In 2012 the top five seizures represented approximately half (48%) of the total marijuana
seized. This spike in 2012 contributed to a higher average over the 2009-2012 timeframe.
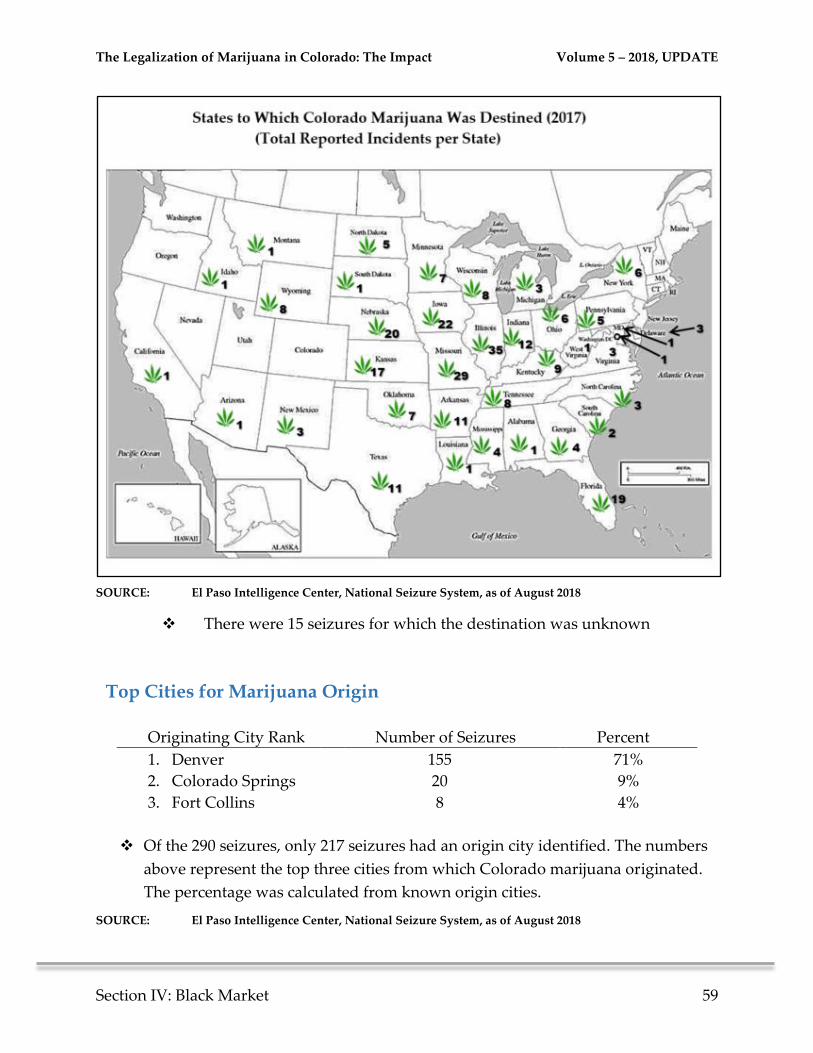
The Legalization of Marijuana in Colorado: The Impact Volume 5 – 2018, UPDATE
Section IV: Black Market 59
SOURCE: El Paso Intelligence Center, National Seizure System, as of August 2018
There were 15 seizures for which the destination was unknown
Originating City Rank Number of Seizures Percent
1. Denver 155 71%
2. Colorado Springs 20 9%
3. Fort Collins 8 4%
Of the 290 seizures, only 217 seizures had an origin city identified. The numbers
above represent the top three cities from which Colorado marijuana originated.
The percentage was calculated from known origin cities.
SOURCE: El Paso Intelligence Center, National Seizure System, as of August 2018
Top Cities for Marijuana Origin
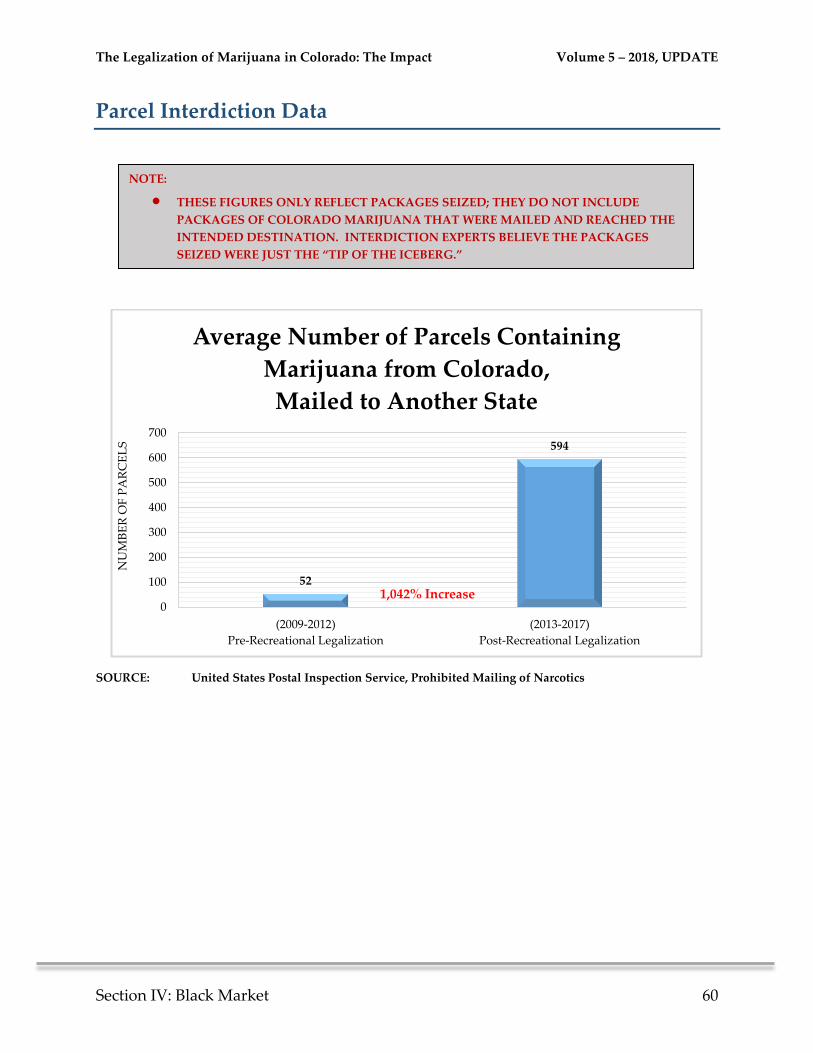
The Legalization of Marijuana in Colorado: The Impact Volume 5 – 2018, UPDATE
Section IV: Black Market 60
Parcel Interdiction Data
SOURCE: United States Postal Inspection Service, Prohibited Mailing of Narcotics
52
594
0
100
200
300
400
500
600
700
(2009-2012)
Pre-Recreational Legalization
(2013-2017)
Post-Recreational Legalization
NU
MB
ER
OF
PA
RC
EL
S
Average Number of Parcels Containing
Marijuana from Colorado,
Mailed to Another State
1,042% Increase
NOTE:
THESE FIGURES ONLY REFLECT PACKAGES SEIZED; THEY DO NOT INCLUDE
PACKAGES OF COLORADO MARIJUANA THAT WERE MAILED AND REACHED THE
INTENDED DESTINATION. INTERDICTION EXPERTS BELIEVE THE PACKAGES
SEIZED WERE JUST THE “TIP OF THE ICEBERG.”
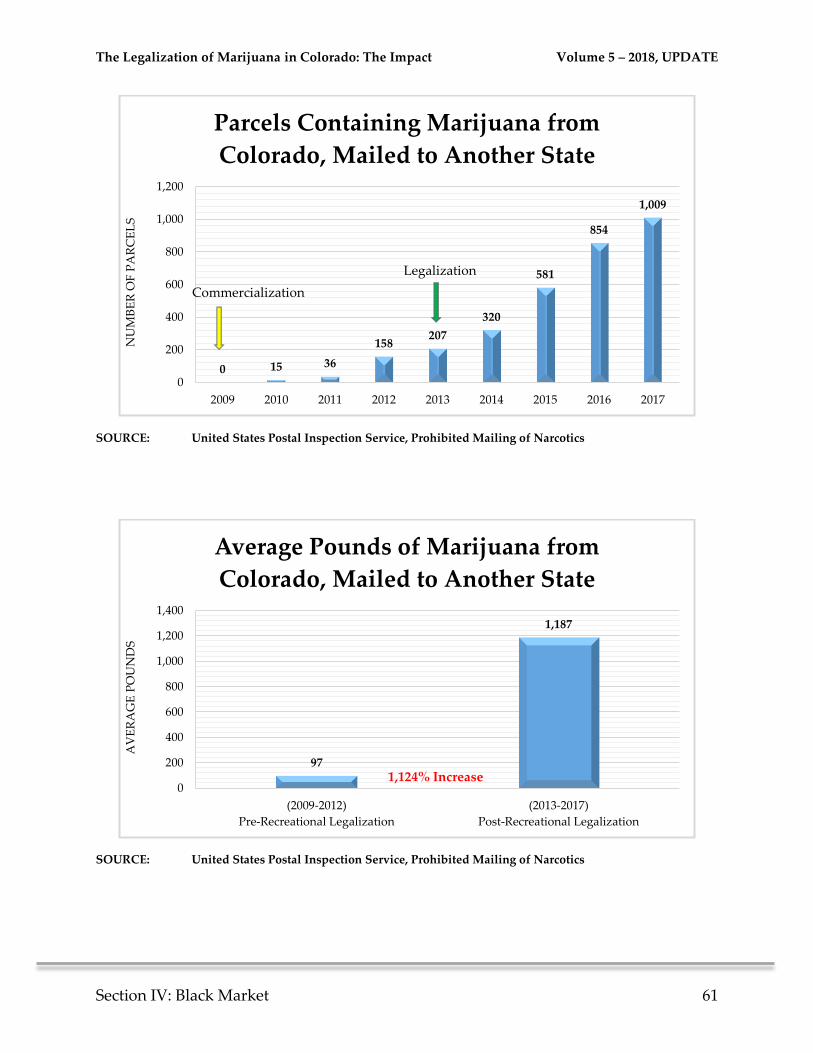
The Legalization of Marijuana in Colorado: The Impact Volume 5 – 2018, UPDATE
Section IV: Black Market 61
SOURCE: United States Postal Inspection Service, Prohibited Mailing of Narcotics
SOURCE: United States Postal Inspection Service, Prohibited Mailing of Narcotics
0 15 36
158207
320
581
854
1,009
0
200
400
600
800
1,000
1,200
2009 2010 2011 2012 2013 2014 2015 2016 2017
NU
MB
ER
OF
PA
RC
EL
SParcels Containing Marijuana from
Colorado, Mailed to Another State
Legalization
Commercialization
97
1,187
0
200
400
600
800
1,000
1,200
1,400
(2009-2012)
Pre-Recreational Legalization
(2013-2017)
Post-Recreational Legalization
AV
ER
AG
E P
OU
ND
S
Average Pounds of Marijuana from
Colorado, Mailed to Another State
1,124% Increase
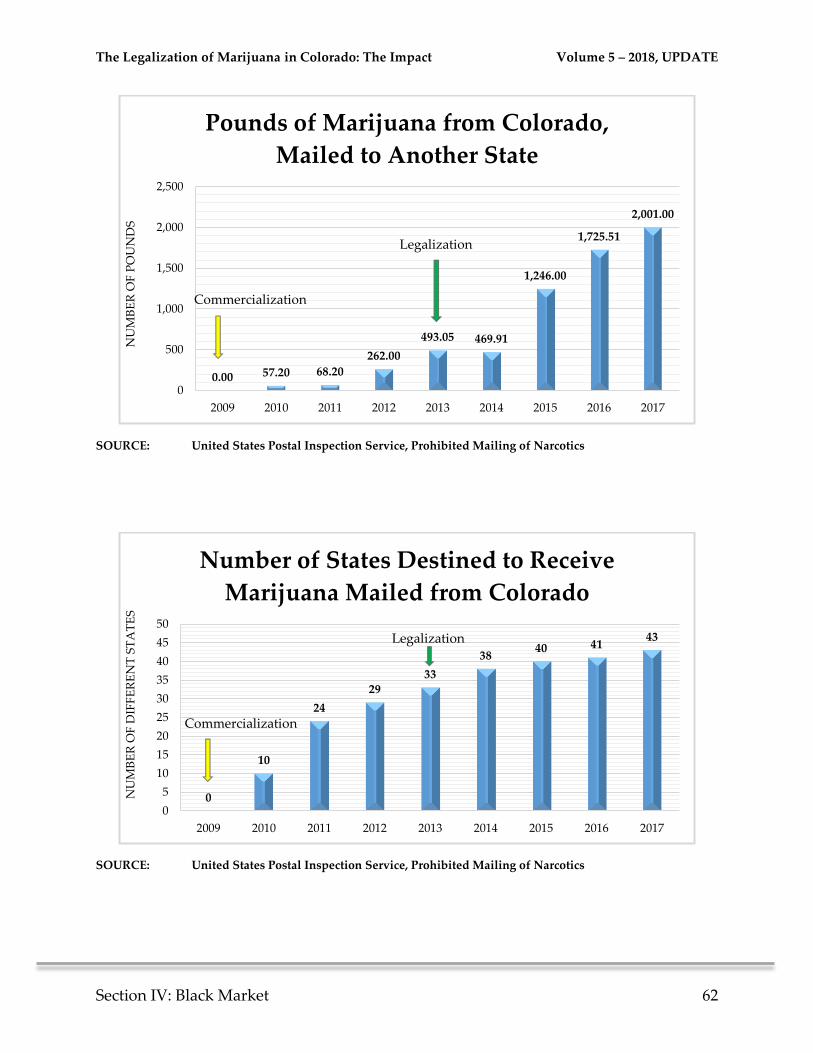
The Legalization of Marijuana in Colorado: The Impact Volume 5 – 2018, UPDATE
Section IV: Black Market 62
SOURCE: United States Postal Inspection Service, Prohibited Mailing of Narcotics
SOURCE: United States Postal Inspection Service, Prohibited Mailing of Narcotics
0.00 57.20 68.20
262.00
493.05 469.91
1,246.00
1,725.51
2,001.00
0
500
1,000
1,500
2,000
2,500
2009 2010 2011 2012 2013 2014 2015 2016 2017
NU
MB
ER
OF
PO
UN
DS
Pounds of Marijuana from Colorado,
Mailed to Another State
Legalization
Commercialization
0
10
24
2933
3840 41
43
0
5
10
15
20
25
30
35
40
45
50
2009 2010 2011 2012 2013 2014 2015 2016 2017
NU
MB
ER
OF
DIF
FE
RE
NT
ST
AT
ES
Number of States Destined to Receive
Marijuana Mailed from Colorado
Legalization
Commercialization
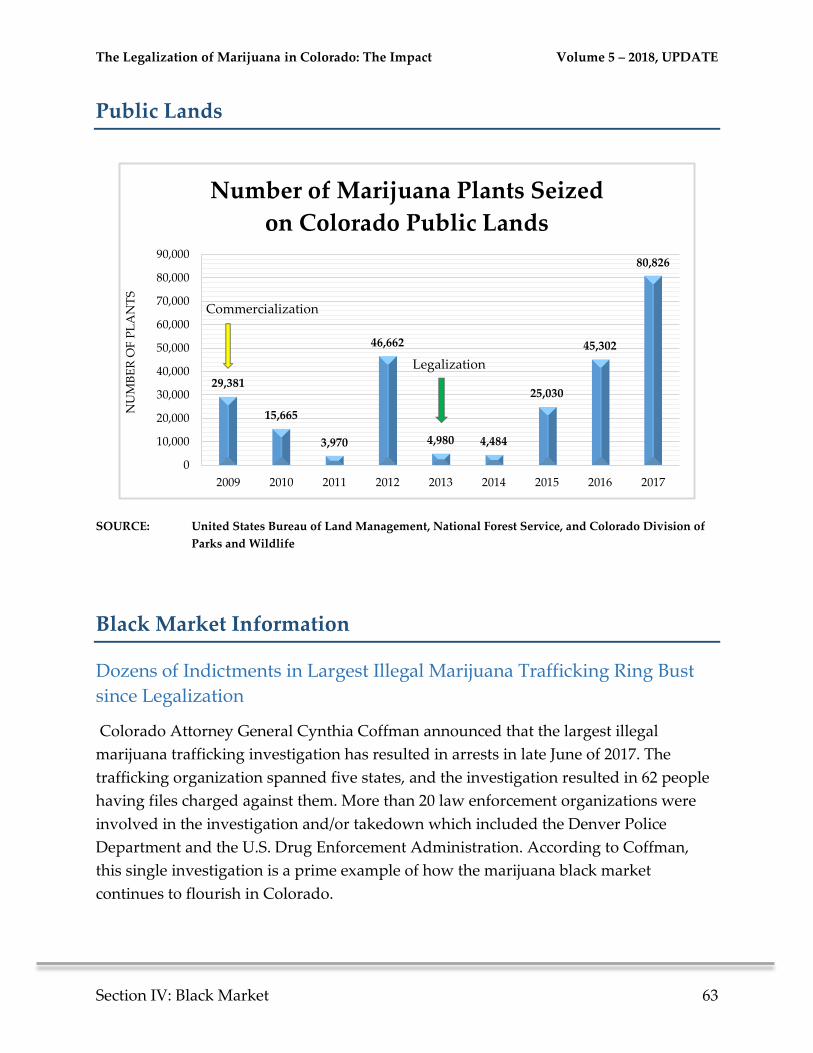
The Legalization of Marijuana in Colorado: The Impact Volume 5 – 2018, UPDATE
Section IV: Black Market 63
Public Lands
SOURCE: United States Bureau of Land Management, National Forest Service, and Colorado Division of
Parks and Wildlife
Black Market Information
Dozens of Indictments in Largest Illegal Marijuana Trafficking Ring Bust
since Legalization
Colorado Attorney General Cynthia Coffman announced that the largest illegal
marijuana trafficking investigation has resulted in arrests in late June of 2017. The
trafficking organization spanned five states, and the investigation resulted in 62 people
having files charged against them. More than 20 law enforcement organizations were
involved in the investigation and/or takedown which included the Denver Police
Department and the U.S. Drug Enforcement Administration. According to Coffman,
this single investigation is a prime example of how the marijuana black market
continues to flourish in Colorado.
29,381
15,665
3,970
46,662
4,980 4,484
25,030
45,302
80,826
0
10,000
20,000
30,000
40,000
50,000
60,000
70,000
80,000
90,000
2009 2010 2011 2012 2013 2014 2015 2016 2017
NU
MB
ER
OF
PL
AN
TS
Number of Marijuana Plants Seized
on Colorado Public Lands
Commercialization
Legalization
The Legalization of Marijuana in Colorado: The Impact Volume 5 – 2018, UPDATE
Section IV: Black Market 64
During raids, agents seized 2,600 marijuana plants and another 4,000 lbs. of marijuana.
As a whole, the trafficking ring produced an estimated 100 lbs. of marijuana a month,
which is sold for approximately $2,000 per pound on the black market in Colorado.
- Chuck Hickey, Dozens of indictments in largest illegal marijuana trafficking ring bust
since legalization, KDVR-TV Channel 2 Denver, June 28, 2017.
Indictment in Colorado Pot Biz’s Largest Fraud Case Ever
Scott Pack was indicted by a grand jury in what attorney Matthew Buck referred to as
“the largest fraud case in the history of Colorado’s marijuana industry.” The large
operation that distributed Colorado grown marijuana across state lines ended in the
indictment of sixteen people. Among those indicted was Renee Rayton, a former
Marijuana Enforcement Division employee.
According to attorney Matthew Buck, “There are potentially victims for as much as $10
million. Scott Pack’s company is one of the larger marijuana companies in Colorado.
They own a significant number of licenses, and through a series of shell companies,
they hold the leases on many buildings across the state.”
In the Westword article published June of 2017, Buck continued to describe the details of
the indictment, and said “[Scott Pack] had a sophisticated understanding of how to use
loopholes to get around state law.” 2
- Michael Roberts, Scott Pack Indicted in Colorado Pot Biz’s Largest Fraud Case Ever,
Attorney Says, Westword, June 14, 2017.
Arrests Made in South Pueblo County Marijuana Grow
According to a press release by the Pueblo County Sheriff’s Office, three individuals
were arrested on April 13th, 2016 in connection with an illegal marijuana grow operating
from within a Pueblo, CO home. In total, 180 marijuana plants were found growing in
the home being occupied by the three individuals.
The three individuals had been living in Florida, but were originally from Cuba. One of
the three individuals had recently purchased the home in February of 2016. Although
the press release did not specifically state that the marijuana was being illegally
trafficked outside the state, several indicators suggest that the marijuana was intended
to leave Colorado. Twelve people, all from Florida, have been arrested in seven separate
illegal marijuana grow operations discovered in Pueblo County on March 30th and April
14th, 2016. Five of the twelve individuals were originally from Cuba.
- Pueblo County Sheriff’s Office, Arrests Made in South Pueblo County Illegal
Marijuana Grow, April 14, 2016.
The Legalization of Marijuana in Colorado: The Impact Volume 5 – 2018, UPDATE
Section IV: Black Market 65
Individuals Indicted for an Illegal Home-grow Also Possess Legal
Marijuana Licenses
- In March 2017, 16 people were indicted for participating in a massive illicit marijuana
home-grow operation. Of the 16, eight are recorded as having active or expired licenses
to work in the legal marijuana business including the ringleader, Michael Alan
Stonehouse, who acts as a consultant for the marijuana industry in Colorado.
According to authorities, the group cultivated their marijuana in properties in Colorado
Springs, Castle Rock, Elbert County and Denver and then diverted the marijuana to
Illinois, Arkansas, Minnesota and Missouri to make a higher profit.
- Jesse Paul, Eight of 16 people indicted in Colorado marijuana trafficking operation listed
as having state pot licenses, The Denver Post, March 24, 2017.
Laotian Marijuana Operation
Southern Colorado Drug Task Force managed by DEA began an investigation of a
Laotian drug trafficking organization that had relocated to Colorado from Arkansas
and California. This organization had 12 different cultivation marijuana sites located in
5 different counties in southeast Colorado. Task force officers served search warrants
seizing 2,291 marijuana plants, 2,393 pounds of processed marijuana. Also seized were
4 hand guns and 6 long guns.
- Rocky Mountain HIDTA Task Force Quarterly Reports, Calendar Year 2016-2017.
Florida Cuban Drug Trafficking Organization
In May 2016, Southern Colorado Drug Task Force executed search warrants at 5
different residential locations operated by a group of Cubans from Florida. These grow
operations were in Pueblo County and offices seized a total of 214 marijuana plants, 55
pounds of processed marijuana and over $100,000 in grow equipment.
- Rocky Mountain HIDTA Task Force Quarterly Reports, Calendar Year 2016-2017.
The Legalization of Marijuana in Colorado: The Impact Volume 5 – 2018, UPDATE
Section IV: Black Market 66
Marijuana Syndicate Grew Pot in Gated Greenwood Village Home and
Sold it Around the U.S.
More than twenty members of a marijuana trafficking organization allegedly
transported marijuana across the country from illegal grows in Denver metro houses.
The enterprise was mailing boxes of marijuana and stacks of money through the U.S.
Postal Service. The Arapahoe County Court indicted members on charges of
distributing illegally grown marijuana to Texas, Iowa, Georgia, North Carolina,
Tennessee, New York and Kansas. According to the news story, the group was selling
80 pounds of marijuana a week, and in one year had sold more than $1 million of
marijuana across the country.
- Kirk Mitchell, Marijuana syndicate grew pot in gated Greenwood Village home and sold
it around the U.S., The Denver Post, November 21st 2017.
Colorado Marijuana Activist Arrested in Oklahoma for Felony Possession
with Intent to Distribute
In Early 2018, a Colorado activist was traveling to Oklahoma to speak about a medical
marijuana measure set to appear on the state’s ballot in June. Dr. Regina Nelson, CEO of
ECS-Therapy Center in Boulder, was also scheduled to speak at a Cannabis Education
Advocacy Symposium that same week. Nelson, along with her colleague and co-author,
were found to be traveling with several “rolled cigarettes with a green leafy substance,”
two pipes, a single edible, capsules with a green oil, and a backpack which had a digital
scale along with multiple bags of a green leafy substance. Additionally, a suitcase with
three large vacuum-sealed bags of marijuana was located in the vehicle. According to
Nelson, “We were absolutely targeted.” Despite the accusation, as of February, the three
faced felony charges of possession of a controlled drug with intent to distribute.
- Lindsey Bartlett, Colorado marijuana activist arrested in Oklahoma for felony
possession with intent to distribute, The Cannabist, February 21st 2018.
The Legalization of Marijuana in Colorado: The Impact Volume 5 – 2018, UPDATE
Section IV: Black Market 67
Nebraska Troopers Seize 227 Pounds of Pot Days After Colorado Man
Busted with 122 Pounds of the Drug
In January of 2018, State Troopers arrested a man who was traveling along I-80 with 227
pounds of marijuana in his possession. The vehicle was initially stopped for speeding
while just west of Lincoln. This incident happened just days after a different Colorado
man had been arrested while traveling through Nebraska with 122 pounds of
marijuana.
- Ann Lauricello, Neb. Troopers seize 227 pounds of pot days after Colorado man busted
with 122 pounds of the drug, Fox 31 Denver News, January 26th 2018.
Colorado Man Arrested After Indiana Traffic Stop Nets 78 Pounds of
Marijuana
In April of 2018, a 51-year-old man of Colorado was found to be traveling along I-70
with a 42-year-old man of Indiana. After initially being stopped for swerving, police
discovered the two individuals to be traveling with 78 pounds of marijuana. Police
estimate the marijuana to have a $250,000 street value.
- Colorado man arrested after Indiana traffic stop nets 78 pounds of marijuana, The
Associated Press, April 17th 2018.
3 Plead Guilty to Trying to Ship Colorado Marijuana to Mississippi
In March of 2018, 23-year-old Kristopher Nguyen pleaded guilty to a charge of
possession with intent to distribute marijuana. Nguyen explained that he and his two
friends, who took similar plea deals, used FedEx for the shipment of 11 pounds of
marijuana from Colorado to a Mississippi home.
- 3 plead guilty to trying to ship Colorado marijuana to Mississippi, The Associated
Press, March 22nd 2018.
Man’s Attempt to Mail Marijuana Leads to One-Year Sentence
After a Colorado man had mailed multiple packages of marijuana, each containing
approximately one kilogram of the drug, authorities searched Mark Koenig’s home in
Colorado. During the search, 123 plants were discovered and Koenig was arrested. The
Arvada man pleaded guilty to possession of a federally controlled substance with intent
to distribute.
- Man’s Attempt To Mail Marijuana Leads To One-Year Sentence, CBS 4 Denver,
February 8th 2018
The Legalization of Marijuana in Colorado: The Impact Volume 5 – 2018, UPDATE
Section IV: Black Market 68
Coloradan Arrested in North Dakota for Having 30 Pounds
In December of 2017, a man from Loveland, CO was arrested in North Dakota. Initially,
the 29-year-old Jacob Todd was stopped for speeding. After a police dog indicated that
drugs may be in the vehicle, police discovered multiple bags of marijuana. According to
the article, the bags totaled 30 pounds and had an approximate $30,000 street value.
- Coloradan arrested in North Dakota for having 30 pounds, The Associated Press,
December 15th 2017
Denver Man Arrested After Marijuana Seizure during Traffic Stop in
Indiana
23-year old Michael Granados Jr. was taken into custody after authorities discovered
several packages of marijuana in the SUV he was traveling in. Several packages were
hidden in various locations throughout the vehicle, totaling approximately 33 pounds.
According to sources, “Troopers said they determined the marijuana had originated in
Colorado and was being taken to an unknown location in Ohio.”
- David Mitchell, Denver man arrested after marijuana seizure during traffic stop in
Indiana, Fox 31 Denver News, October 21st 2017.
Laotian Marijuana Operation
Southern Colorado Drug Task Force managed by DEA began an investigation of a
Laotian drug trafficking organization that had relocated to Colorado from Arkansas
and California. This organization had 12 different cultivation marijuana sites located in
5 different counties in southeast Colorado. Task force officers served search warrants
seizing 2,291 marijuana plants, 2,393 pounds of processed marijuana. Also seized were
4 hand guns and 6 long guns.
- Sewell, R. Andrew, James Poling, and Mehmet Sofuoglu, The Effect of Cannabis
Compared with Alcohol on Driving, The American Journal on Addictions /
American Academy of Psychiatrists in Alcoholism and Addictions, February 7th
2017.
The Legalization of Marijuana in Colorado: The Impact Volume 5 – 2018, UPDATE
Section IV: Black Market 69
Florida Cuban Drug Trafficking Organization
In May 2016, Southern Colorado Drug Task Force executed search warrants at 5
different residential locations operated by a group of Cubans from Florida. These grow
operations were in Pueblo County and offices seized a total of 214 marijuana plants, 55
pounds of processed marijuana and over $100,000 in grow equipment.
- Sewell, R. Andrew, James Poling, and Mehmet Sofuoglu, The Effect of Cannabis
Compared with Alcohol on Driving, The American Journal on Addictions /
American Academy of Psychiatrists in Alcoholism and Addictions, February 7th
2017.
71,000 Plants Seized on Colorado Public Lands in 2017
Federal agencies removed more than 71,000 marijuana plants from public lands during
last year’s growing season. The plants were grown illegally on 38 acres. U.S. Attorney,
Robert Troyer said, “Public lands are just that – they’re public and belong to all of us.
These black marketers abuse our land, our water, our animals and plants. With these
prosecutions, we motivate black marketers to make less harmful occupational choices.”
- Federal agencies removed more than 71,000 marijuana plants from Colorado public lands
in 2017, The Denver Post, August 14th 2018.
Illegal Marijuana Home Grow Arrests
Authorities discovered a large home grow after responding to a report of shots fired at
a Colorado Springs residents. The home was being used to grow and cultivate
marijuana, and authorities found 352 marijuana plants, 1,300 cloned plants, and 33
pounds of refined marijuana. Plants were found growing in the main residence as well
as in the oversized two-car garage. Two arrests were made for suspicion of felony
cultivation and distribution.
- Ellie Mulder, 2 arrested after large illegal marijuana grow found at Colorado Springs
home, The Gazette, February 23rd 2018.
Two Dead at Illegal Home Grow
Deputies were called to a residence in Elbert County Colorado to discover two men had
been shot to death inside a home. The home was the site of an illegal marijuana grow
operation which appeared to have played a part in the deaths of the two men.
- 2 men found shot to death at illegal marijuana grow site in Elbert Colorado, Fox 31 News
Denver, November 9th 2017.
The Legalization of Marijuana in Colorado: The Impact Volume 5 – 2018, UPDATE
Section IV: Black Market 70
THIS PAGE LEFT INTENTIONALLY BLANK
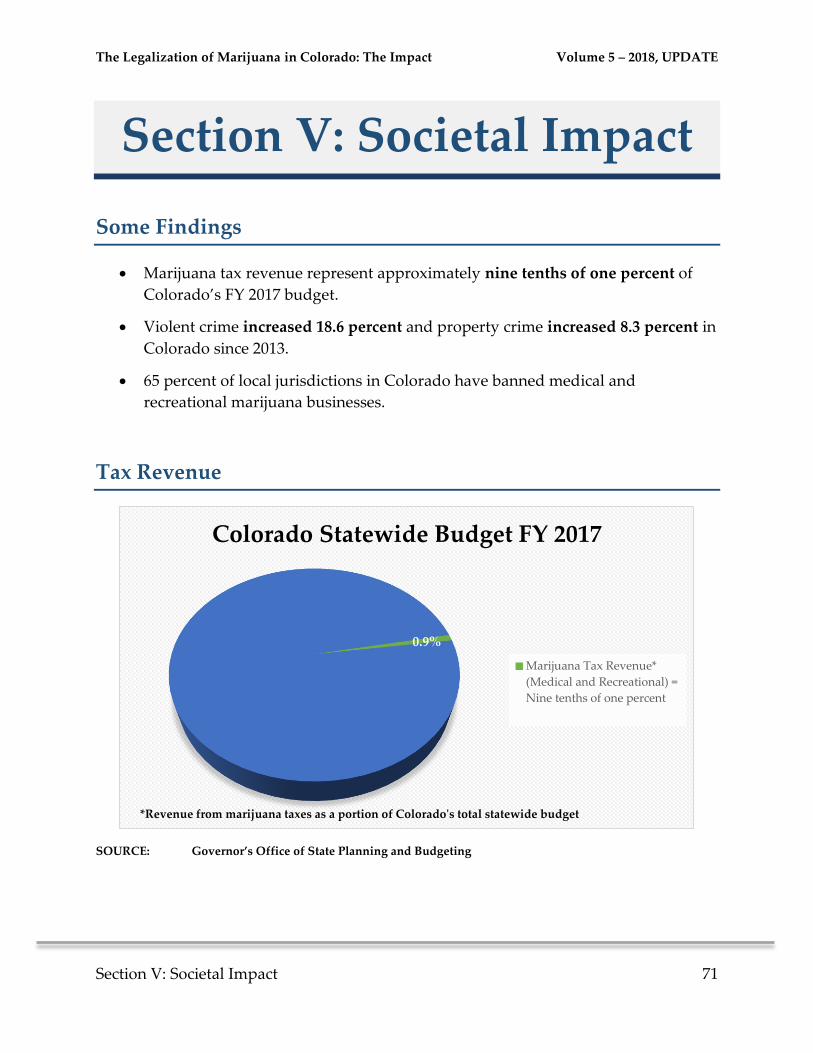
The Legalization of Marijuana in Colorado: The Impact Volume 5 – 2018, UPDATE
Section V: Societal Impact 71
Section V: Societal Impact
Some Findings
Marijuana tax revenue represent approximately nine tenths of one percent of
Colorado’s FY 2017 budget.
Violent crime increased 18.6 percent and property crime increased 8.3 percent in
Colorado since 2013.
65 percent of local jurisdictions in Colorado have banned medical and
recreational marijuana businesses.
Tax Revenue
SOURCE: Governor’s Office of State Planning and Budgeting
0.9%
Colorado Statewide Budget FY 2017
Marijuana Tax Revenue*
(Medical and Recreational) =
Nine tenths of one percent
*Revenue from marijuana taxes as a portion of Colorado's total statewide budget
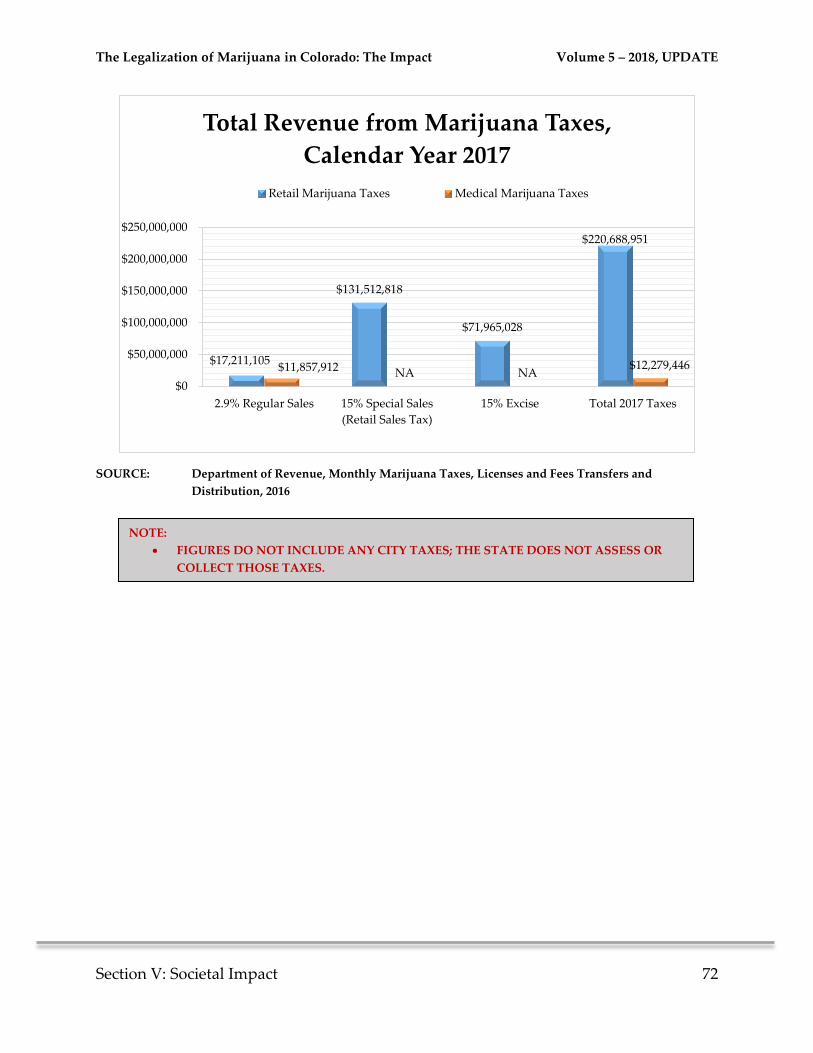
The Legalization of Marijuana in Colorado: The Impact Volume 5 – 2018, UPDATE
Section V: Societal Impact 72
SOURCE: Department of Revenue, Monthly Marijuana Taxes, Licenses and Fees Transfers and
Distribution, 2016
$17,211,105
$131,512,818
$71,965,028
$220,688,951
$11,857,912 NA NA$12,279,446
$0
$50,000,000
$100,000,000
$150,000,000
$200,000,000
$250,000,000
2.9% Regular Sales 15% Special Sales
(Retail Sales Tax)
15% Excise Total 2017 Taxes
Total Revenue from Marijuana Taxes,
Calendar Year 2017
Retail Marijuana Taxes Medical Marijuana Taxes
NOTE:
FIGURES DO NOT INCLUDE ANY CITY TAXES; THE STATE DOES NOT ASSESS OR
COLLECT THOSE TAXES.
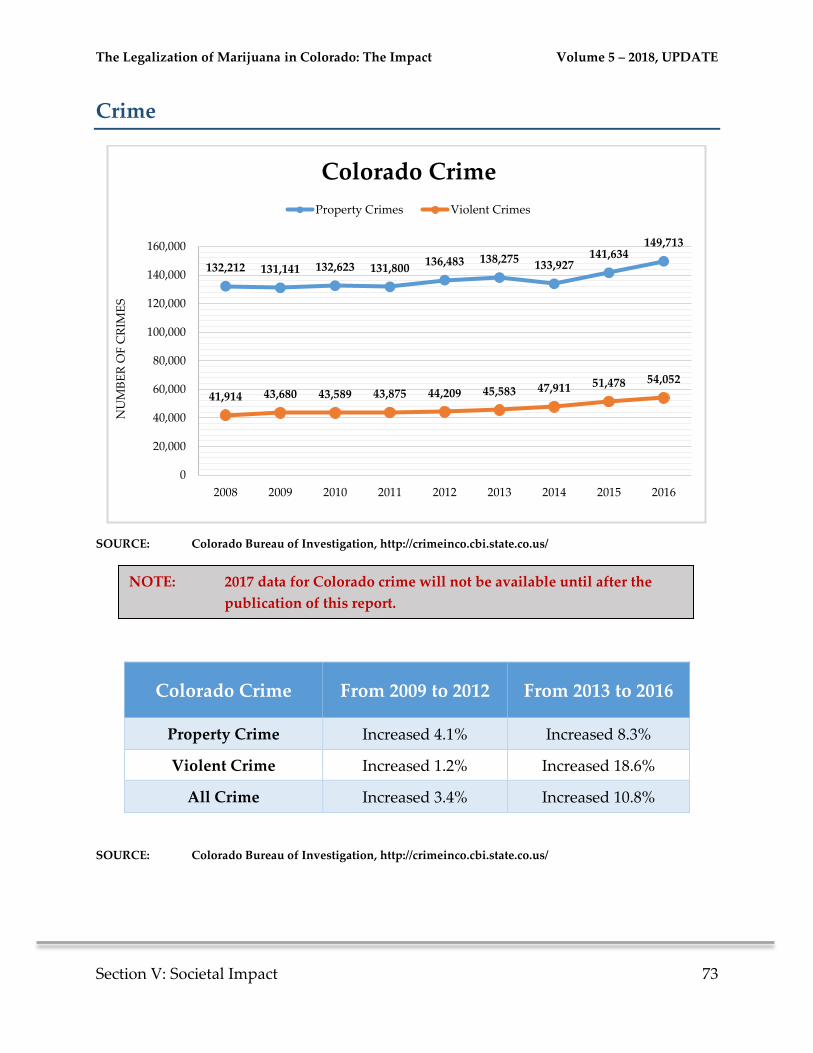
The Legalization of Marijuana in Colorado: The Impact Volume 5 – 2018, UPDATE
Section V: Societal Impact 73
Crime
SOURCE: Colorado Bureau of Investigation, http://crimeinco.cbi.state.co.us/
Colorado Crime From 2009 to 2012 From 2013 to 2016
Property Crime Increased 4.1% Increased 8.3%
Violent Crime Increased 1.2% Increased 18.6%
All Crime Increased 3.4% Increased 10.8%
SOURCE: Colorado Bureau of Investigation, http://crimeinco.cbi.state.co.us/
132,212 131,141 132,623 131,800136,483 138,275
133,927141,634
149,713
41,914 43,680 43,589 43,875 44,209 45,583 47,911 51,478 54,052
0
20,000
40,000
60,000
80,000
100,000
120,000
140,000
160,000
2008 2009 2010 2011 2012 2013 2014 2015 2016
NU
MB
ER
OF
CR
IME
S
Colorado Crime
Property Crimes Violent Crimes
NOTE: 2017 data for Colorado crime will not be available until after the
publication of this report.
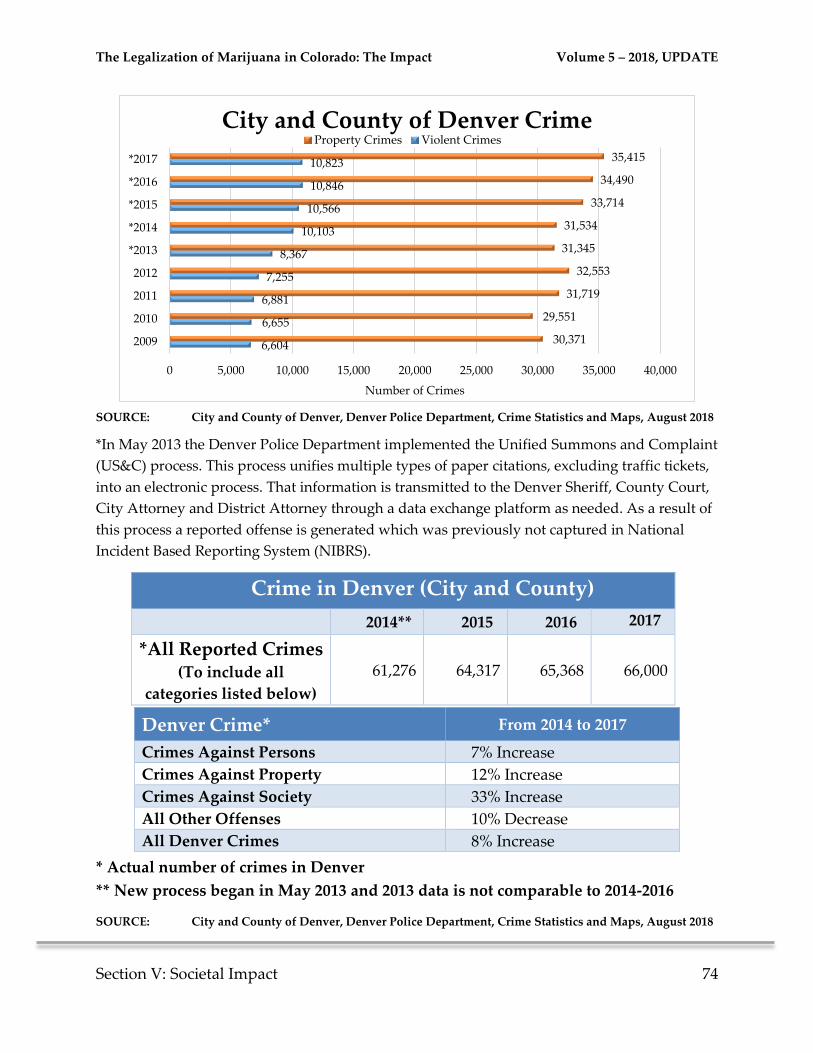
The Legalization of Marijuana in Colorado: The Impact Volume 5 – 2018, UPDATE
Section V: Societal Impact 74
SOURCE: City and County of Denver, Denver Police Department, Crime Statistics and Maps, August 2018
*In May 2013 the Denver Police Department implemented the Unified Summons and Complaint
(US&C) process. This process unifies multiple types of paper citations, excluding traffic tickets,
into an electronic process. That information is transmitted to the Denver Sheriff, County Court,
City Attorney and District Attorney through a data exchange platform as needed. As a result of
this process a reported offense is generated which was previously not captured in National
Incident Based Reporting System (NIBRS).
Crime in Denver (City and County)
2014** 2015 2016 2017
*All Reported Crimes (To include all
categories listed below)
61,276 64,317 65,368 66,000
Denver Crime* From 2014 to 2017
Crimes Against Persons 7% Increase
Crimes Against Property 12% Increase
Crimes Against Society 33% Increase
All Other Offenses 10% Decrease
All Denver Crimes 8% Increase
* Actual number of crimes in Denver
** New process began in May 2013 and 2013 data is not comparable to 2014-2016
SOURCE: City and County of Denver, Denver Police Department, Crime Statistics and Maps, August 2018
6,604
6,655
6,881
7,255
8,367
10,103
10,566
10,846
10,823
30,371
29,551
31,719
32,553
31,345
31,534
33,714
34,490
35,415
0 5,000 10,000 15,000 20,000 25,000 30,000 35,000 40,000
2009
2010
2011
2012
*2013
*2014
*2015
*2016
*2017
Number of Crimes
City and County of Denver CrimeProperty Crimes Violent Crimes
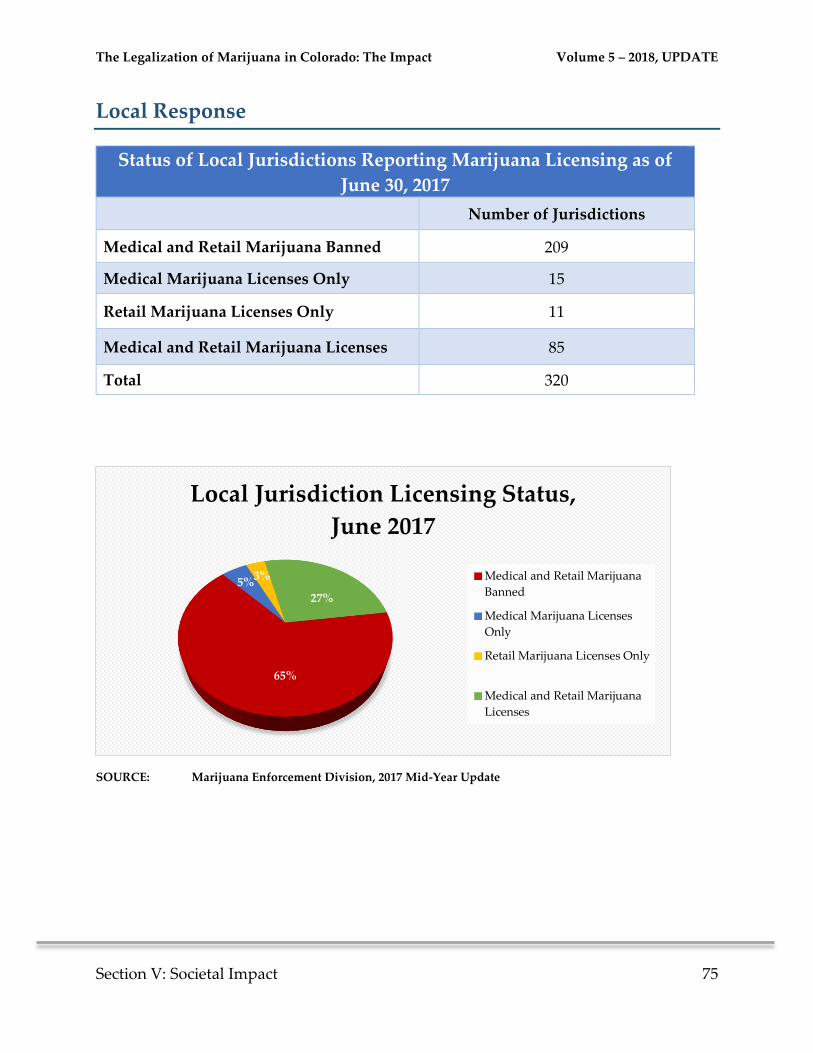
The Legalization of Marijuana in Colorado: The Impact Volume 5 – 2018, UPDATE
Section V: Societal Impact 75
Local Response
Status of Local Jurisdictions Reporting Marijuana Licensing as of
June 30, 2017
Number of Jurisdictions
Medical and Retail Marijuana Banned 209
Medical Marijuana Licenses Only 15
Retail Marijuana Licenses Only 11
Medical and Retail Marijuana Licenses 85
Total 320
SOURCE: Marijuana Enforcement Division, 2017 Mid-Year Update
65%
5%3%
27%
Local Jurisdiction Licensing Status,
June 2017
Medical and Retail Marijuana
Banned
Medical Marijuana Licenses
Only
Retail Marijuana Licenses Only
Medical and Retail Marijuana
Licenses

The Legalization of Marijuana in Colorado: The Impact Volume 5 – 2018, UPDATE
Section V: Societal Impact 76
Medical Marijuana Statistics
Medical Marijuana Registry Identification Cards
December 31, 2009 – 41,039
December 31, 2010 – 116,198
December 31, 2011 – 82,089
December 31, 2012 – 108,526
December 31, 2013 – 110,979
December 31, 2014 – 115,467
December 31, 2015 – 107,534
December 31, 2016 – 94,577
December 31, 2017 – 93,372
Profile of Colorado Medical Marijuana Cardholders:
Age of cardholder
o 62 percent male, with an average age of 43 years
o 0.3 percent between the ages of 0 and 17
o 46 percent between the ages of 18 and 40
21 percent between the ages of 21 and 30
Reporting medical condition of cardholder
o 93 percent report severe pain as the medical condition
o 5 percent collectively report cancer, glaucoma and HIV/AIDS
o 3 percent report seizures
SOURCE: Colorado Department of Public Health and Environment, Medical Marijuana Registry Program
Update, December 31st, 2017
0.00% 0.97% 1.09% 2.80% 3.10% 4.38%13.04%
28.74%
92.84%
0%
20%
40%
60%
80%
100%
PE
RC
EN
T O
F P
AT
IEN
TS
Percent of Medical Marijuana Patients
Based on Reporting Conditions, 2017
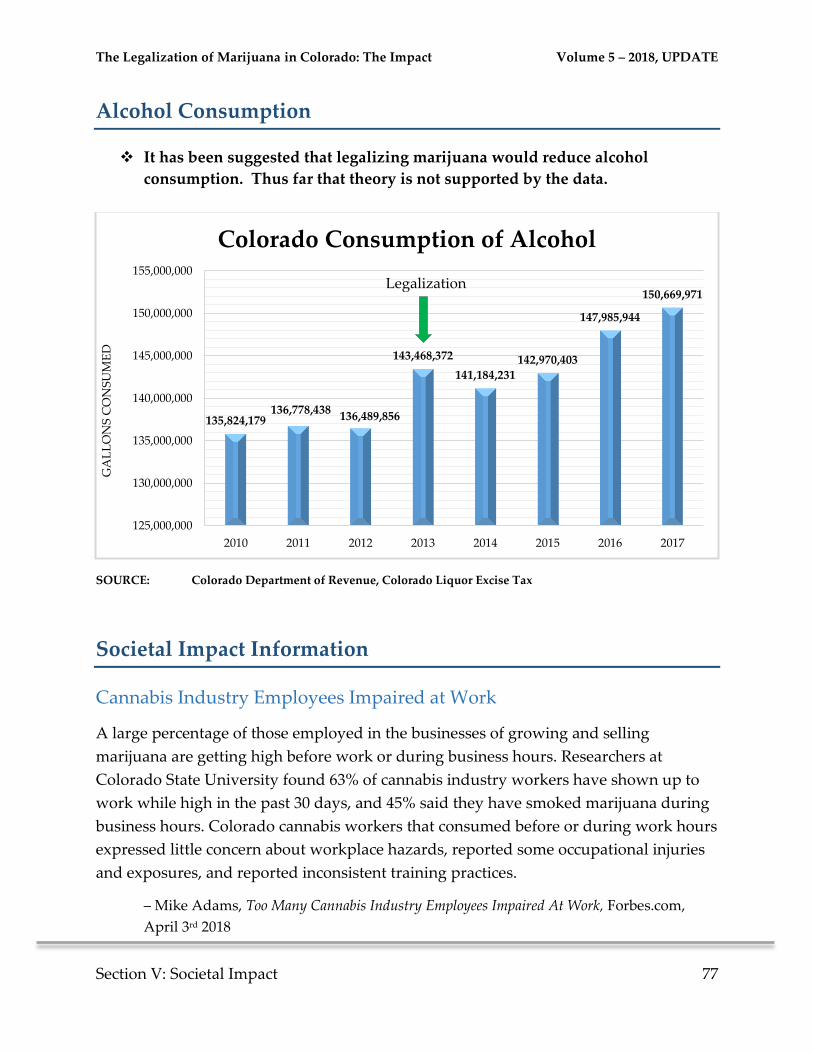
The Legalization of Marijuana in Colorado: The Impact Volume 5 – 2018, UPDATE
Section V: Societal Impact 77
Alcohol Consumption
It has been suggested that legalizing marijuana would reduce alcohol
consumption. Thus far that theory is not supported by the data.
SOURCE: Colorado Department of Revenue, Colorado Liquor Excise Tax
Societal Impact Information
Cannabis Industry Employees Impaired at Work
A large percentage of those employed in the businesses of growing and selling
marijuana are getting high before work or during business hours. Researchers at
Colorado State University found 63% of cannabis industry workers have shown up to
work while high in the past 30 days, and 45% said they have smoked marijuana during
business hours. Colorado cannabis workers that consumed before or during work hours
expressed little concern about workplace hazards, reported some occupational injuries
and exposures, and reported inconsistent training practices.
– Mike Adams, Too Many Cannabis Industry Employees Impaired At Work, Forbes.com,
April 3rd 2018
150,669,971
147,985,944
142,970,403141,184,231
143,468,372
136,489,856136,778,438
135,824,179
125,000,000
130,000,000
135,000,000
140,000,000
145,000,000
150,000,000
155,000,000
20172016201520142013201220112010
GA
LL
ON
S C
ON
SU
ME
D
Colorado Consumption of Alcohol
Legalization
The Legalization of Marijuana in Colorado: The Impact Volume 5 – 2018, UPDATE
Section V: Societal Impact 78
From Medical to Recreational Marijuana Sales: Marijuana Outlets and
Crime in an Era of Changing Marijuana Legalization
As the debate surrounding the legalization of marijuana for medical and/or recreational
use continues, researchers recently took a look at one of the possible adverse effects of
legalization: Crime rates. Researchers found that “the density of marijuana outlets
[businesses] was related to higher rates of property crime in spatially adjacent areas…
However… we found no relationships between the presence of local marijuana outlets
and violent crime. The density of medical marijuana outlets in local and spatially
adjacent areas were related to higher rates of marijuana-specific crime.”
In other words, the potential impact of increased crime may not be felt directly in the
immediate areas in which more marijuana dispensaries are opened, but it was clear that
surrounding areas experienced an increase in the amount of crime reported.
- Bridget Freisthler, Andrew Gaidus, Christina Tam, William R. Ponicki, and Paul
J. Gruenewald, From Medical to Recreational Marijuana Sales: Marijuana Outlets and
Crime in an Era of Changing Marijuana legislation, Journal of Primary Prevention,
April 27th 2017
Homeless Inmates and Marijuana
The most commonly reported reason homeless inmates came to Colorado after 2012
was to get away from a problem (44.2%) followed by family (38.9%). The third most
prevalent reason was marijuana (35.1%). “Among those inmates who are not Colorado
natives, 41.3% moved here after 2012, the year recreational marijuana was legalized.”
- A Study of Homelessness in Seven Colorado Jails, Colorado Department of Public Safety,
Division of Criminal Justice, June 2018
The Legalization of Marijuana in Colorado: The Impact Volume 5 – 2018, UPDATE
Section VI: Marijuana Industry 79
Section VI: Marijuana
Industry
Some Findings
According to the Marijuana Policy Group, Market Size and Demand for
Marijuana in Colorado 2017 Market Update:
o “From 2014 through 2017, average annual adult use flower prices fell 62.0
percent, from $14.05 to $5.34 per gram weighted average.”
o “Adult use concentrate prices fell 47.9 percent, from $41.43 to $21.57 per
gram.”
o “The average THC content of all tested flower in 2017 was 19.6 percent
statewide compared to 17.4 percent in 2016, 16.6 percent in 2015 and 16.4
percent in 2014.”
o “The average potency of concentrated extract products increased steadily
from 56.6 percent THC content by weight in 2014 to 68.6 percent at the
end of 2017.”
As of June 2017, there were 491 retail marijuana stores in the state of Colorado
compared to 392 Starbucks and 208 McDonald’s.
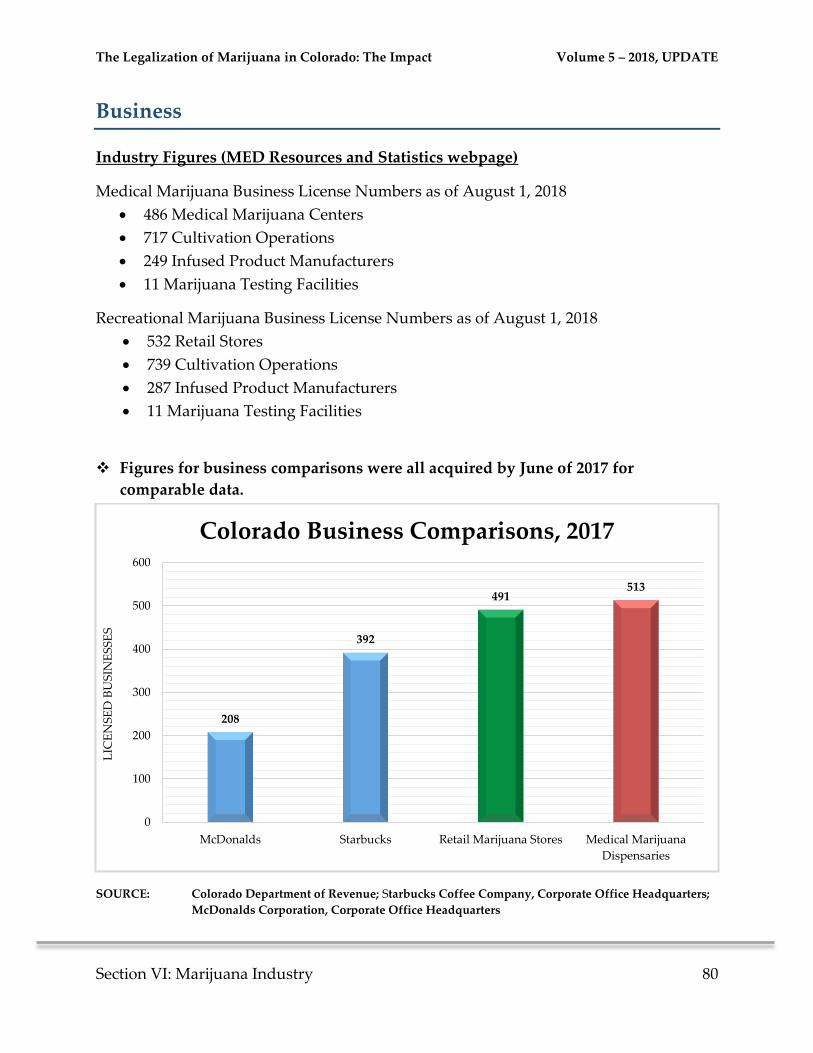
The Legalization of Marijuana in Colorado: The Impact Volume 5 – 2018, UPDATE
Section VI: Marijuana Industry 80
Business
Industry Figures (MED Resources and Statistics webpage)
Medical Marijuana Business License Numbers as of August 1, 2018
486 Medical Marijuana Centers
717 Cultivation Operations
249 Infused Product Manufacturers
11 Marijuana Testing Facilities
Recreational Marijuana Business License Numbers as of August 1, 2018
532 Retail Stores
739 Cultivation Operations
287 Infused Product Manufacturers
11 Marijuana Testing Facilities
Figures for business comparisons were all acquired by June of 2017 for
comparable data.
SOURCE: Colorado Department of Revenue; Starbucks Coffee Company, Corporate Office Headquarters;
McDonalds Corporation, Corporate Office Headquarters
208
392
491513
0
100
200
300
400
500
600
McDonalds Starbucks Retail Marijuana Stores Medical Marijuana
Dispensaries
LIC
EN
SE
D B
US
INE
SS
ES
Colorado Business Comparisons, 2017
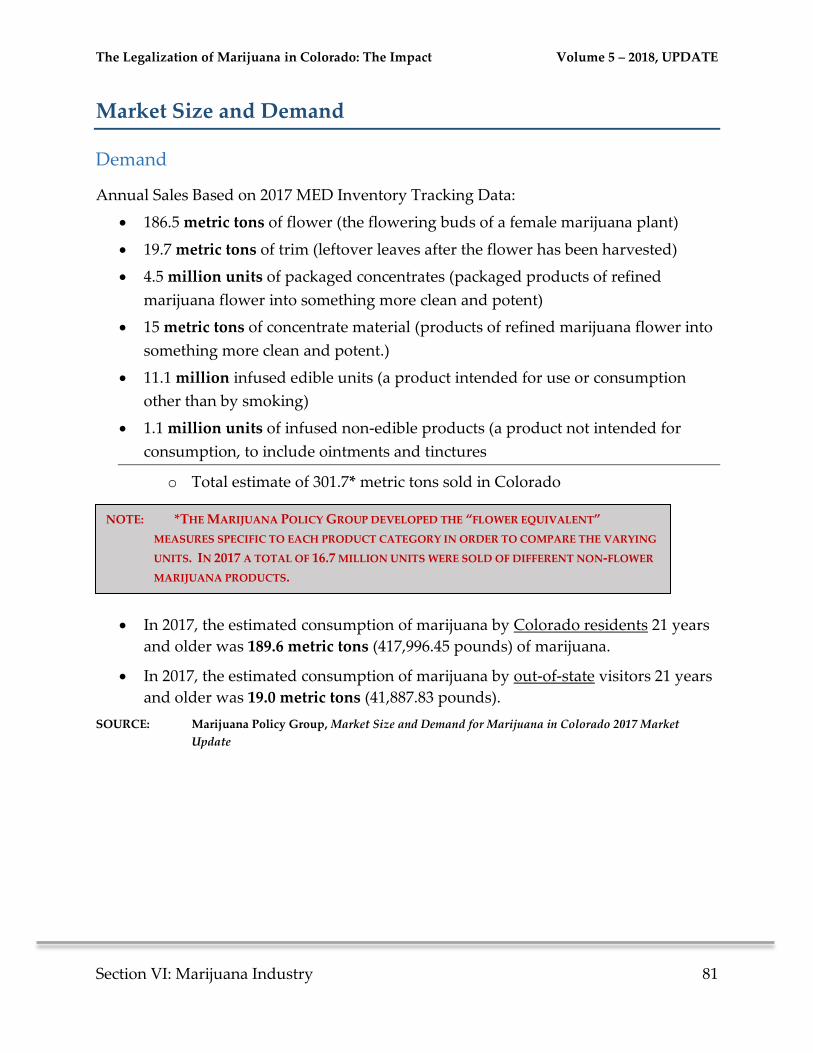
The Legalization of Marijuana in Colorado: The Impact Volume 5 – 2018, UPDATE
Section VI: Marijuana Industry 81
Market Size and Demand
Demand
Annual Sales Based on 2017 MED Inventory Tracking Data:
186.5 metric tons of flower (the flowering buds of a female marijuana plant)
19.7 metric tons of trim (leftover leaves after the flower has been harvested)
4.5 million units of packaged concentrates (packaged products of refined
marijuana flower into something more clean and potent)
15 metric tons of concentrate material (products of refined marijuana flower into
something more clean and potent.)
11.1 million infused edible units (a product intended for use or consumption
other than by smoking)
1.1 million units of infused non-edible products (a product not intended for
consumption, to include ointments and tinctures
o Total estimate of 301.7* metric tons sold in Colorado
In 2017, the estimated consumption of marijuana by Colorado residents 21 years
and older was 189.6 metric tons (417,996.45 pounds) of marijuana.
In 2017, the estimated consumption of marijuana by out-of-state visitors 21 years
and older was 19.0 metric tons (41,887.83 pounds).
SOURCE: Marijuana Policy Group, Market Size and Demand for Marijuana in Colorado 2017 Market
Update
NOTE: *THE MARIJUANA POLICY GROUP DEVELOPED THE “FLOWER EQUIVALENT”
MEASURES SPECIFIC TO EACH PRODUCT CATEGORY IN ORDER TO COMPARE THE VARYING
UNITS. IN 2017 A TOTAL OF 16.7 MILLION UNITS WERE SOLD OF DIFFERENT NON-FLOWER
MARIJUANA PRODUCTS.
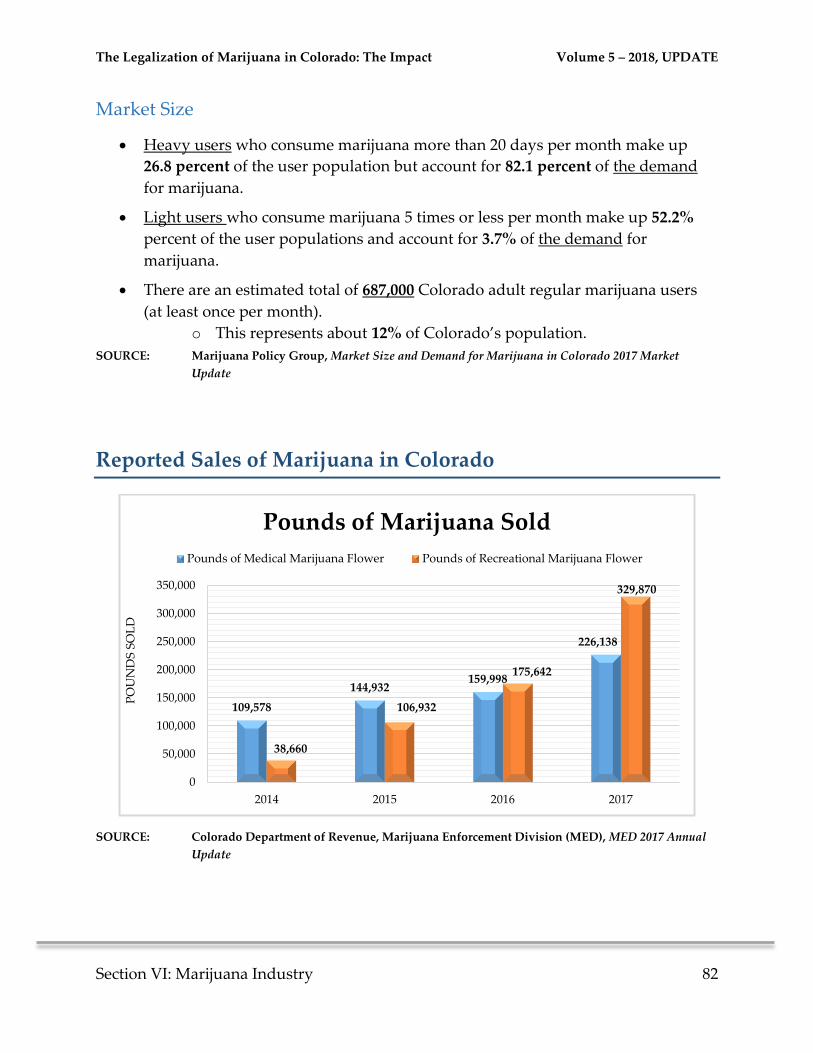
The Legalization of Marijuana in Colorado: The Impact Volume 5 – 2018, UPDATE
Section VI: Marijuana Industry 82
Market Size
Heavy users who consume marijuana more than 20 days per month make up
26.8 percent of the user population but account for 82.1 percent of the demand
for marijuana.
Light users who consume marijuana 5 times or less per month make up 52.2%
percent of the user populations and account for 3.7% of the demand for
marijuana.
There are an estimated total of 687,000 Colorado adult regular marijuana users
(at least once per month).
o This represents about 12% of Colorado’s population.
SOURCE: Marijuana Policy Group, Market Size and Demand for Marijuana in Colorado 2017 Market
Update
Reported Sales of Marijuana in Colorado
SOURCE: Colorado Department of Revenue, Marijuana Enforcement Division (MED), MED 2017 Annual
Update
109,578
144,932159,998
226,138
38,660
106,932
175,642
329,870
0
50,000
100,000
150,000
200,000
250,000
300,000
350,000
2014 2015 2016 2017
PO
UN
DS
SO
LD
Pounds of Marijuana Sold
Pounds of Medical Marijuana Flower Pounds of Recreational Marijuana Flower
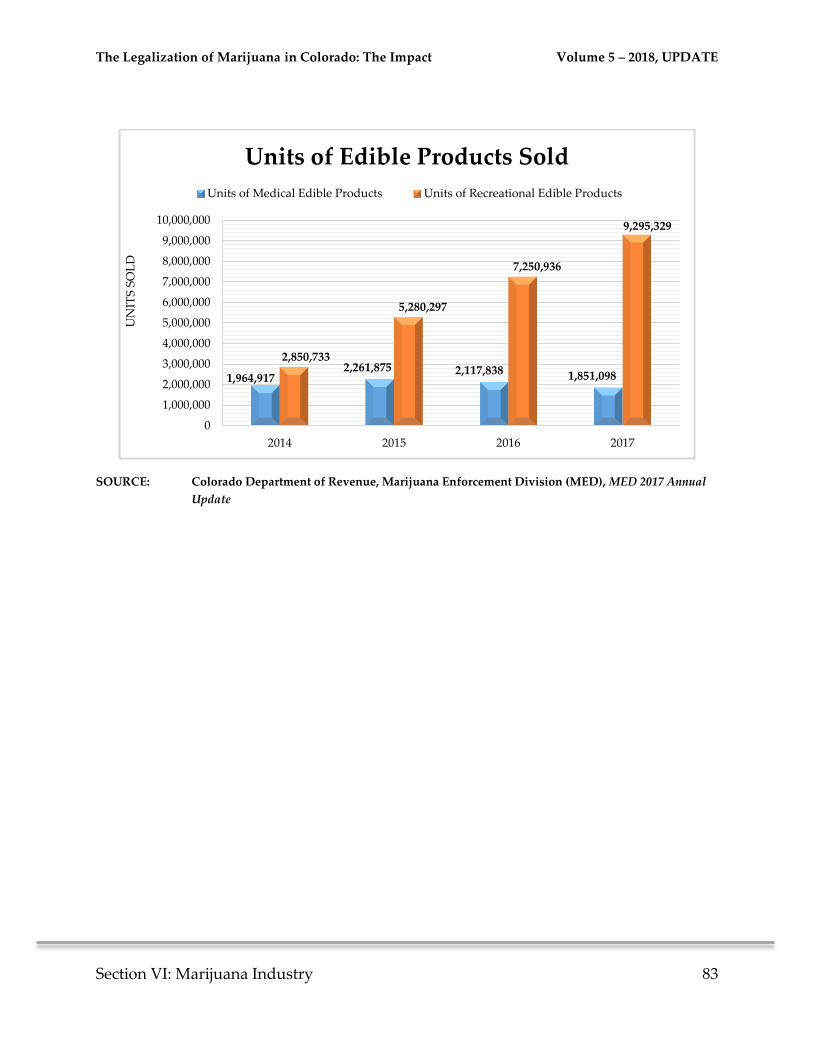
The Legalization of Marijuana in Colorado: The Impact Volume 5 – 2018, UPDATE
Section VI: Marijuana Industry 83
SOURCE: Colorado Department of Revenue, Marijuana Enforcement Division (MED), MED 2017 Annual
Update
1,964,9172,261,875 2,117,838 1,851,098
2,850,733
5,280,297
7,250,936
9,295,329
0
1,000,000
2,000,000
3,000,000
4,000,000
5,000,000
6,000,000
7,000,000
8,000,000
9,000,000
10,000,000
2014 2015 2016 2017
UN
ITS
SO
LD
Units of Edible Products Sold
Units of Medical Edible Products Units of Recreational Edible Products
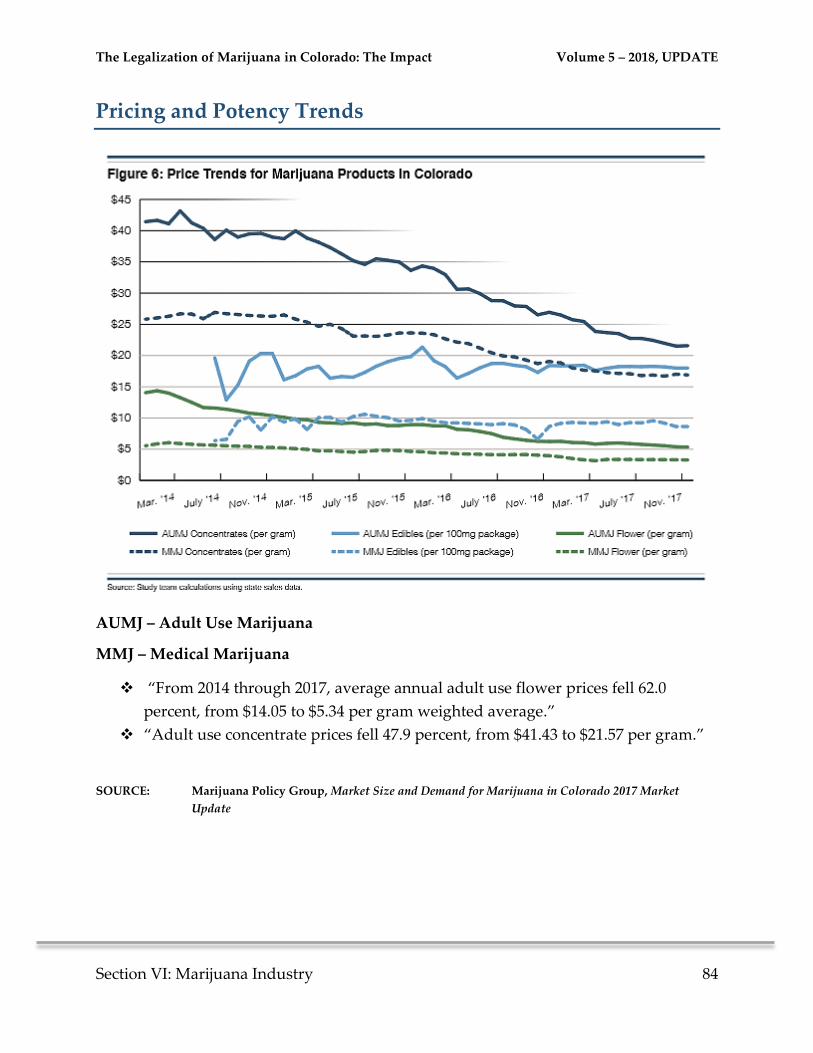
The Legalization of Marijuana in Colorado: The Impact Volume 5 – 2018, UPDATE
Section VI: Marijuana Industry 84
Pricing and Potency Trends
AUMJ – Adult Use Marijuana
MMJ – Medical Marijuana
“From 2014 through 2017, average annual adult use flower prices fell 62.0
percent, from $14.05 to $5.34 per gram weighted average.”
“Adult use concentrate prices fell 47.9 percent, from $41.43 to $21.57 per gram.”
SOURCE: Marijuana Policy Group, Market Size and Demand for Marijuana in Colorado 2017 Market
Update
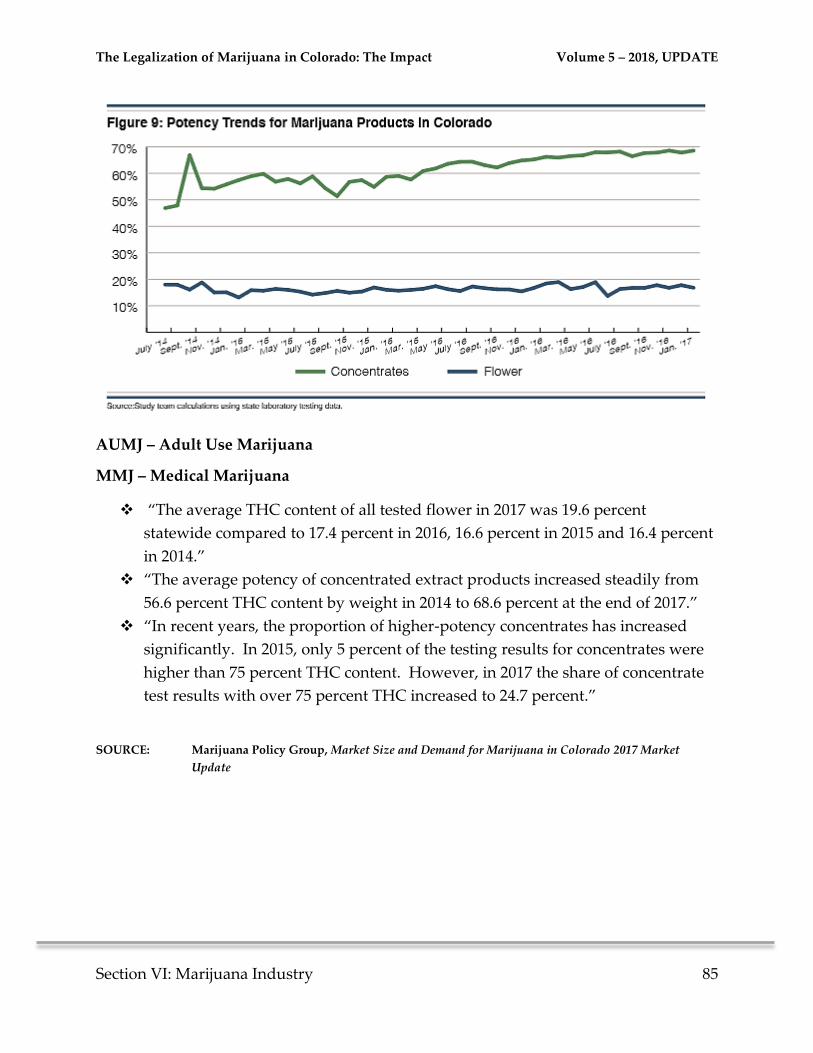
The Legalization of Marijuana in Colorado: The Impact Volume 5 – 2018, UPDATE
Section VI: Marijuana Industry 85
AUMJ – Adult Use Marijuana
MMJ – Medical Marijuana
“The average THC content of all tested flower in 2017 was 19.6 percent
statewide compared to 17.4 percent in 2016, 16.6 percent in 2015 and 16.4 percent
in 2014.”
“The average potency of concentrated extract products increased steadily from
56.6 percent THC content by weight in 2014 to 68.6 percent at the end of 2017.”
“In recent years, the proportion of higher-potency concentrates has increased
significantly. In 2015, only 5 percent of the testing results for concentrates were
higher than 75 percent THC content. However, in 2017 the share of concentrate
test results with over 75 percent THC increased to 24.7 percent.”
SOURCE: Marijuana Policy Group, Market Size and Demand for Marijuana in Colorado 2017 Market
Update
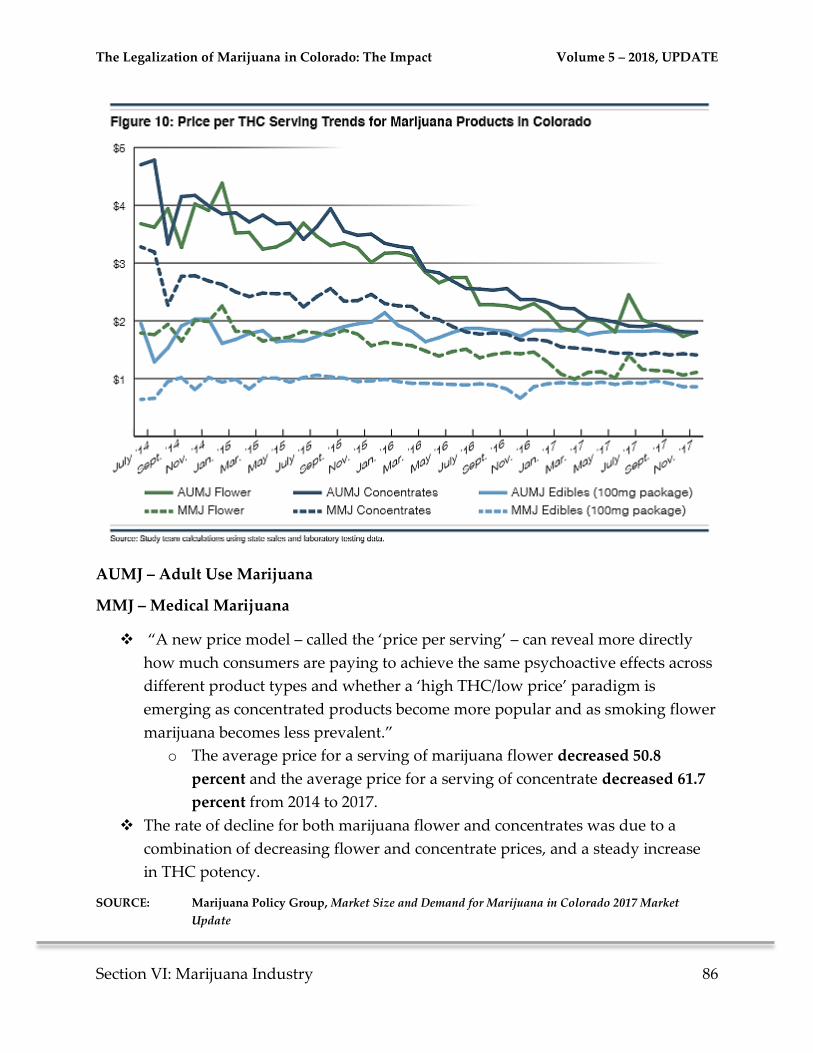
The Legalization of Marijuana in Colorado: The Impact Volume 5 – 2018, UPDATE
Section VI: Marijuana Industry 86
AUMJ – Adult Use Marijuana
MMJ – Medical Marijuana
“A new price model – called the ‘price per serving’ – can reveal more directly
how much consumers are paying to achieve the same psychoactive effects across
different product types and whether a ‘high THC/low price’ paradigm is
emerging as concentrated products become more popular and as smoking flower
marijuana becomes less prevalent.”
o The average price for a serving of marijuana flower decreased 50.8
percent and the average price for a serving of concentrate decreased 61.7
percent from 2014 to 2017.
The rate of decline for both marijuana flower and concentrates was due to a
combination of decreasing flower and concentrate prices, and a steady increase
in THC potency.
SOURCE: Marijuana Policy Group, Market Size and Demand for Marijuana in Colorado 2017 Market
Update
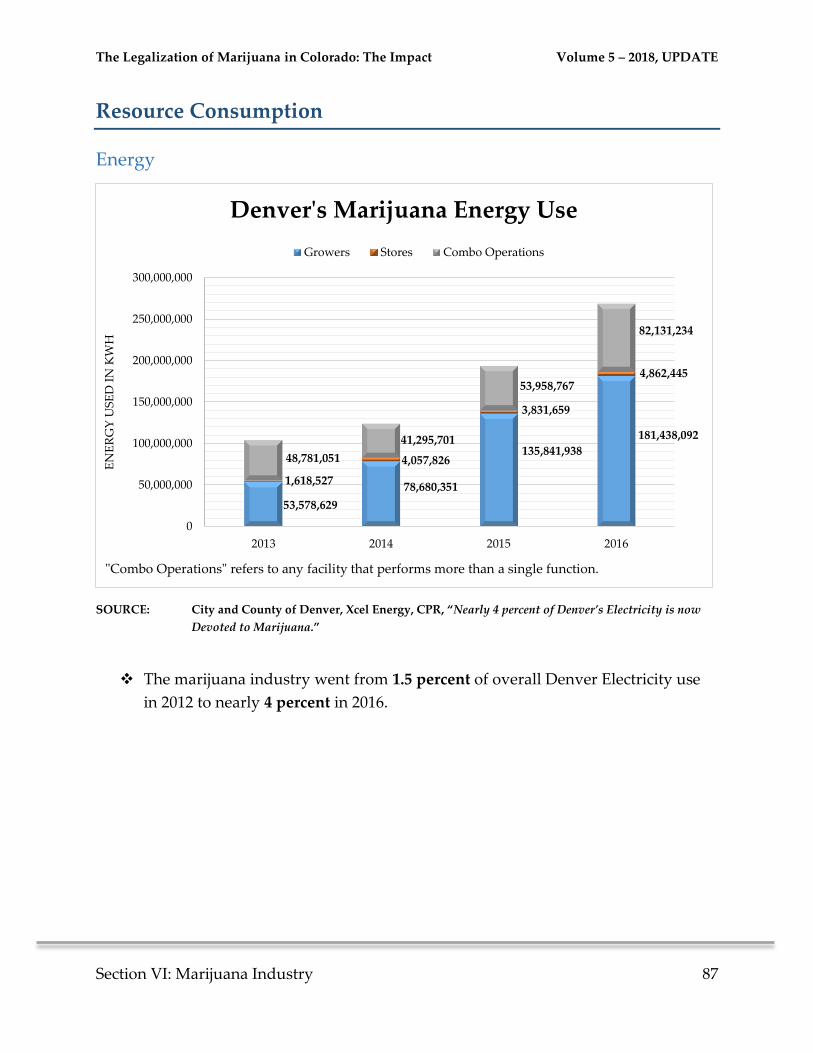
The Legalization of Marijuana in Colorado: The Impact Volume 5 – 2018, UPDATE
Section VI: Marijuana Industry 87
Resource Consumption
Energy
SOURCE: City and County of Denver, Xcel Energy, CPR, “Nearly 4 percent of Denver’s Electricity is now
Devoted to Marijuana.”
The marijuana industry went from 1.5 percent of overall Denver Electricity use
in 2012 to nearly 4 percent in 2016.
53,578,629
78,680,351
135,841,938
181,438,092
1,618,527
4,057,826
3,831,659
4,862,445
48,781,051
41,295,701
53,958,767
82,131,234
0
50,000,000
100,000,000
150,000,000
200,000,000
250,000,000
300,000,000
2013 2014 2015 2016
EN
ER
GY
US
ED
IN
KW
H
Denver's Marijuana Energy Use
Growers Stores Combo Operations
"Combo Operations" refers to any facility that performs more than a single function.
The Legalization of Marijuana in Colorado: The Impact Volume 5 – 2018, UPDATE
Section VI: Marijuana Industry 88
Marijuana Industry Information
Nearly 4 Percent of Denver’s Electricity is Now Devoted to Marijuana
According to an early 2018 article written by Grace Hood of Colorado Public Radio, “In
2016, the marijuana industry comprised 4 percent of Denver’s electricity use.” While
this number may seem small, according to an advisor for the Denver Department of
Public Health and Environment - “it’s significant.” While the industry is striving to
become more and more efficient in their energy consumption, “the energy use trajectory
continues to plot upward for the industry.”
- Grace Hood, Nearly 4 Percent Of Denver’s Electricity Is Now Devoted To Marijuana,
Colorado Public Radio, February 19th 2018.
Medical Marijuana Recommended for Pregnant Women
Approximately 70% of randomly selected medical marijuana centers in Colorado
recommended marijuana as a treatment for morning sickness for pregnant women.
This recommendation from the employees of the dispensaries clash with “doctors’
warnings about the potential harms according to a study published Wednesday in the
Journal Obstetrics and Gynecology.” Doctors caution that marijuana’s effects on a fetus
could include low birth rate and developmental problems according to U.S. Centers for
Disease Control and Prevention.
- Michael Nedelman, Marijuana shops recommend products to pregnant women, against
doctors’ warnings, CNN May 10th 2018.
Marijuana Cultivation Center fined $2,000 for Odor Problem
In November of 2017, a marijuana cultivation center was fined $2,000 due to complaints
received from neighbors that the facility was emitting too strong of a scent. This same
location had received similar complaints and had been fined one year prior when it was
occupied by another marijuana facility. In total the location was fined $14,000 the first
time.
- Alex Burness, Marijuana odor from cultivation center continues to seep into north Boulder,
Daily Camera, November 26th 2017.
The Legalization of Marijuana in Colorado: The Impact Volume 5 – 2018, UPDATE
Section VI: Marijuana Industry 89
8 Marijuana Retail Locations Raided and 13 Budtenders Arrested in Police
Investigation
Eight Sweet Leaf Marijuana Centers were raided in December 2017 and 13 bud tenders
were arrested. The bud tenders were arrested for criminal activities that included sales
of marijuana in violation of Colorado law stipulating that adults over the age of 21 can
buy and possess up to 1 ounce of marijuana at a time. Undercover law enforcement
officers “entered a single location multiple times – as few as five times and as many as
16 – during windows of time ranging from 59 minutes to 5 hours and 50 minutes” and
would typically purchase 1 ounce of marijuana.
- Alicia Wallace and Alex Pasquariello, 13 Sweet Leaf budtenders swept up in Denver police
raids, The Cannabist, December 15th 2017.
Not-so-Green Greenhouses for Cannabis Hyper-Cultivation
In 2018, Evan Mills, Ph.D. described some of the environmental ramifications of the
legalized marijuana industry. The energy analyst and building scientist, who is a
Research Affiliate with the U.C. Berkeley’s Energy and Resources Group, described
many considerations of the marijuana cultivation industry, including the point that
“greenhouses are among the most thermally inefficient structures imaginable.”
Although he admits that estimating the energy use of these “hyper-cultivation” facilities
is complex – a theoretical hyper-greenhouse “uses 8-times as much electricity per
square foot for lighting alone as the average U.S. office building uses for all purposes
and 17-times as much as the average U.S. home.” The publication goes on to describe
that “carbon-intensive cannabis will continue to compound climate change unless an
array of public policy strategies are assembled.”
- Evans Mills, Not-so-Green Greenhouses for Cannabis Hyper-Cultivation, Energy Associates,
February 26th 2018.
Marijuana Enforcement Division (MED) 2017 Annual Update
The mission of the MED is to “promote public safety and reduce public harm by
regulating the Colorado commercial marijuana industry through the consistent
administration of laws and regulations and strategic integration of process
management, functional expertise, and innovative problem-solving.” The 2017 Annual
Update details licensing data, number of cultivated plants, volume of marijuana sold to
customers, marijuana testing data, and investigation data. - MED 2017 Annual Update, Colorado Department of Revenue, Enforcement Division,
May 17th 2018.