Embed Size (px)
Citation preview

Your Investment Reference
THE
LEBANON BRIEF
ISSUE 792
Week of 08 - 12 October, 2012
ECONOMIC RESEARCH DEPARTMENT
Rashid Karame Street, Verdun Area
P.O.Box 11-1540 Beirut, Lebanon
T (01) 991784/7 F (+961) 1 991732
www.blom.com.lb
S A L

The Lebanon Brief Table Of Contents Page 2 of 14
ISSUE 792; Week of 08 – 12 October, 2012
S A L
TABLE OF CONTENTSTABLE OF CONTENTSTABLE OF CONTENTSTABLE OF CONTENTS
FINANCIAL MARKETSFINANCIAL MARKETSFINANCIAL MARKETSFINANCIAL MARKETS 3333
Equity Market 3
Foreign Exchange Market 5
Money & Treasury Bills Markets 5
Eurobond Market 6
ECONOMIC AND FINANCIAL NEWSECONOMIC AND FINANCIAL NEWSECONOMIC AND FINANCIAL NEWSECONOMIC AND FINANCIAL NEWS 7777
Kafalat Loan Guarantees Retract by a 14% YTD rate 7
Fiscal Deficit Widens To $1.17B by July 7
Transfers to EDL Approaching $1B in H1 2012 8
Port of Beirut Activity Continues to Record Slight Improvement in September 8
Airport Passengers Reach 4.58 Million by the end of September 2012 9
Aid to Lebanon in September: Developing Capabilities to Integrated Border Management 9
CORPORATE DEVELOPMENTSCORPORATE DEVELOPMENTSCORPORATE DEVELOPMENTSCORPORATE DEVELOPMENTS 10101010
Holcim Liban and Ciment Blancs H1 Unconsolidated Results 10
RYMCO’s Unaudited Financials Show Profits Of $2M in H1 2012 10
FOCUS IN BRIEFFOCUS IN BRIEFFOCUS IN BRIEFFOCUS IN BRIEF 11111111
Predictive Ability of the Yield Curve: Evidence from Lebanon 11
This report is published for information purposes only. The information herein has been compiled from, or based upon sources we believe to be
reliable, but we do not guarantee or accept responsibility for its completeness or accuracy. This document should not be construed as a
solicitation to take part in any investment, or as constituting any representation or warranty on our part. The consequences of any action taken
on the basis of information contained herein are solely the responsibility of the recipient.
The Lebanon Brief Financial Markets Page 3 of 14
FINANCIAL MARKETSFINANCIAL MARKETSFINANCIAL MARKETSFINANCIAL MARKETS
Equity Market
Stock Market
12/10/2012 05/10/12 % Change
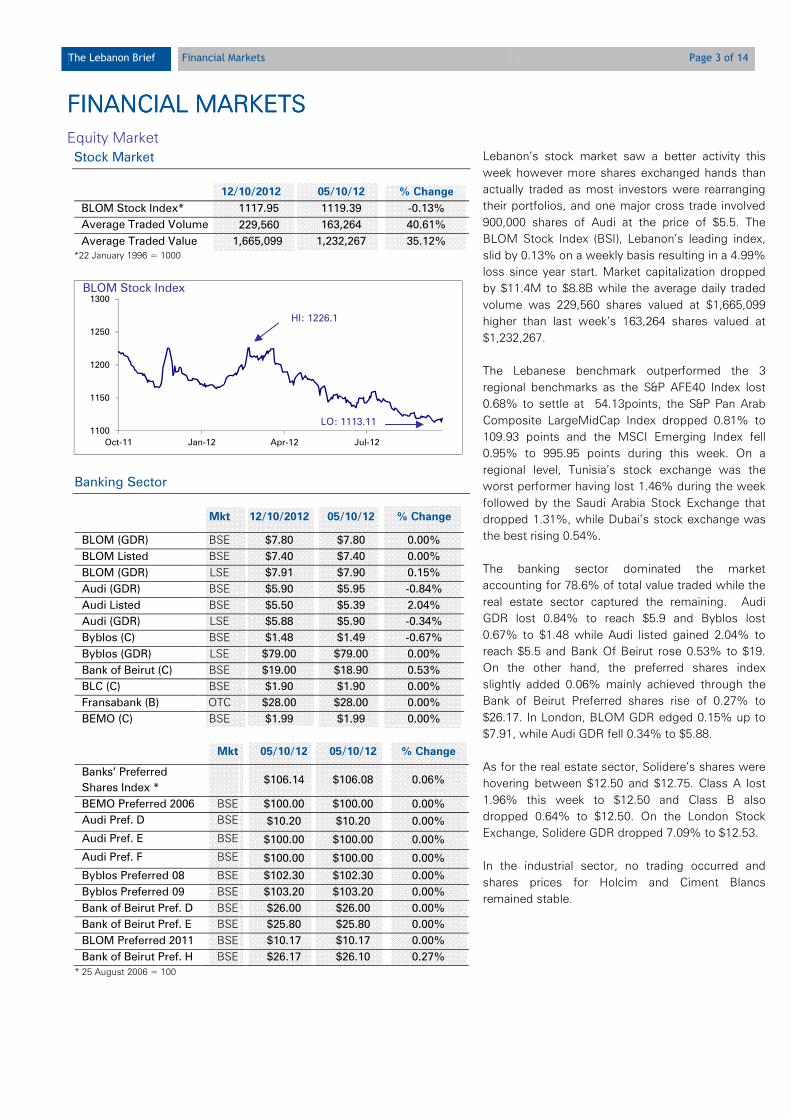
BLOM Stock Index* 1117.95 1119.39 -0.13%
Average Traded Volume 229,560 163,264 40.61%
Average Traded Value 1,665,099 1,232,267 35.12% *22 January 1996 = 1000
Lebanon’s stock market saw a better activity this
week however more shares exchanged hands than
actually traded as most investors were rearranging
their portfolios, and one major cross trade involved
900,000 shares of Audi at the price of $5.5. The
BLOM Stock Index (BSI), Lebanon’s leading index,
slid by 0.13% on a weekly basis resulting in a 4.99%
loss since year start. Market capitalization dropped
by $11.4M to $8.8B while the average daily traded
volume was 229,560 shares valued at $1,665,099
higher than last week’s 163,264 shares valued at
$1,232,267.
The Lebanese benchmark outperformed the 3
regional benchmarks as the S&P AFE40 Index lost
0.68% to settle at 54.13 points, the S&P Pan Arab
Composite LargeMidCap Index dropped 0.81% to
109.93 points and the MSCI Emerging Index fell
0.95% to 995.95 points during this week. On a
regional level, Tunisia’s stock exchange was the
worst performer having lost 1.46% during the week
followed by the Saudi Arabia Stock Exchange that
dropped 1.31%, while Dubai’s stock exchange was
the best rising 0.54%.
The banking sector dominated the market
accounting for 78.6% of total value traded while the
real estate sector captured the remaining. Audi
GDR lost 0.84% to reach $5.9 and Byblos lost
0.67% to $1.48 while Audi listed gained 2.04% to
reach $5.5 and Bank Of Beirut rose 0.53% to $19.
On the other hand, the preferred shares index
slightly added 0.06% mainly achieved through the
Bank of Beirut Preferred shares rise of 0.27% to
$26.17. In London, BLOM GDR edged 0.15% up to
$7.91, while Audi GDR fell 0.34% to $5.88.
As for the real estate sector, Solidere’s shares were
hovering between $12.50 and $12.75. Class A lost
1.96% this week to $12.50 and Class B also
dropped 0.64% to $12.50. On the London Stock
Exchange, Solidere GDR dropped 7.09% to $12.53.
In the industrial sector, no trading occurred and
shares prices for Holcim and Ciment Blancs
remained stable.
Banking Sector
Mkt 12/10/2012 05/10/12 % Change
BLOM (GDR) BSE $7.80 $7.80 0.00%
BLOM Listed BSE $7.40 $7.40 0.00%
BLOM (GDR) LSE $7.91 $7.90 0.15%
Audi (GDR) BSE $5.90 $5.95 -0.84%
Audi Listed BSE $5.50 $5.39 2.04%
Audi (GDR) LSE $5.88 $5.90 -0.34%
Byblos (C) BSE $1.48 $1.49 -0.67%
Byblos (GDR) LSE $79.00 $79.00 0.00%
Bank of Beirut (C) BSE $19.00 $18.90 0.53%
BLC (C) BSE $1.90 $1.90 0.00%
Fransabank (B) OTC $28.00 $28.00 0.00%
BEMO (C) BSE $1.99 $1.99 0.00%
Mkt 05/10/12 05/10/12 % Change
Banks’ Preferred
Shares Index *
$106.14 $106.08 0.06%
BEMO Preferred 2006 BSE $100.00 $100.00 0.00%
Audi Pref. D BSE $10.20 $10.20 0.00%
Audi Pref. E BSE $100.00 $100.00 0.00%
Audi Pref. F BSE $100.00 $100.00 0.00%
Byblos Preferred 08 BSE $102.30 $102.30 0.00%
Byblos Preferred 09 BSE $103.20 $103.20 0.00%
Bank of Beirut Pref. D BSE $26.00 $26.00 0.00%
Bank of Beirut Pref. E BSE $25.80 $25.80 0.00%
BLOM Preferred 2011 BSE $10.17 $10.17 0.00%
Bank of Beirut Pref. H BSE $26.17 $26.10 0.27%
* 25 August 2006 = 100
1100
1150
1200
1250
1300
Oct-11 Jan-12 Apr-12 Jul-12
BLOM Stock Index
HI: 1226.1
62
LO: 1113.11

The Lebanon Brief Financial Markets Page 4 of 14
ISSUE 792; Week of 08 – 12 October, 2012
S A L
Real Estate
Mkt 12/10/2012 05/10/12 % Change
Solidere (A) BSE $12.50 $12.75 -1.96%
Solidere (B) BSE $12.50 $12.58 -0.64%
Solidere (GDR) LSE $12.53 $13.49 -7.09%
Finally, Beirut Stock Exchange still seems far from
recovering in light of continuing pressures on the
domestic market, with union movements picking
up and political divisions over the elections law
heating up.
Manufacturing Sector
Mkt 12/10/2012 05/10/12 % Change
HOLCIM Liban BSE $15.51 $15.51 0.00%
Ciments Blancs (B) BSE $3.50 $3.50 0.00%
Ciments Blancs (N) BSE $3.05 $3.05 0.00%
Funds
Mkt 12/10/2012 05/10/2012 % Change
Beirut Preferred Fund BSE $102.80 $102.80 0.00%
BLOM Cedars Balanced
Fund Tranche “A” ----- $6,722.98 $6,705.34 0.26%
BLOM Cedars Balanced
Fund Tranche “B” ----- $5,094.48 $5,080.66 0.27%
BLOM Cedars Balanced
Fund Tranche “C” ----- $5,106.15 $5,092.75 0.26%
BLOM Bond Fund ----- $9,859.37 $9,778.40 0.83%
Retail Sector
Mkt 12/10/2012 05/10/12 % Change
RYMCO BSE $2.20 $2.20 0.00%
ABC (New) OTC $16.50 $16.50 0.00%
Tourism Sector
Mkt 12/10/2012 05/10/12 % Change
Casino Du Liban OTC $565.00 $565.00 0.00%
SGHL OTC $4.50 $4.50 0.00%

The Lebanon Brief Financial Markets Page 5 of 14
ISSUE 792; Week of 08 – 12 October, 2012
S A L
Foreign Exchange Market
Lebanese Forex Market
12/10/2012 05/10/12 %Change
Dollar / LP 1502.50 1502.50 0.00%
Euro / LP 1955.38 1960.05 -0.24%
Swiss Franc / LP 1616.62 1617.84 -0.08%
Yen / LP 19.21 19.22 -0.05%
Sterling / LP 2421.20 2438.98 -0.73%
NEER Index** 103.51 103.33 0.17%
*Close of GMT 09:00+2 **Nominal Effective Exchange Rate; Base Year Jan 2006=100
**The unadjusted weighted average value of a country’s currency relative to all
major currencies being traded within a pool of currencies. The NEER represents
the approximate relative price a consumer will pay for an imported good.
The exchange rate between the Lebanese Pound and the US
dollar remained this week at $/LP 1,501 - $/LP 1,504 with a
mid-price of $/LP 1,502.5. Foreign assets (excluding gold) at
the Central Bank had decreased by a monthly 0.5% to $35.09
billion by the end of September 2012, while the dollarization
rate of private sector deposits remained slightly below 65% by
the end of August 2012, compared to 66% in December 2011.
Nominal Effective Exchange Rate (NEER)
In international markets, the euro started the week on a low
note due to resurfacing concerns over Spain and Greece, and
after Standard & Poor’s cut Spain’s sovereign credit rating to
BBB-. The single currency still regained some of its losses on
Thursday and Friday, following a three-day decline, after IMF
Managing Director Christine Lagarde said that European
countries should be given more time to cut their budget
deficits. By Friday October 12, 2012, 12.30 pm Beirut time, the
euro closed at €/$ 1.2971 recording a 0.24% decline from the
previous week. The dollar-pegged Lebanese Pound thus
appreciated to €/LP 1955.38, from €/LP 1960.05. The Nominal
effective exchange rate (NEER) climbed 0.17% to 103.51
points.
Money & Treasury Bills Markets
Money Market Rates
Treasury Yields
12/10/12 05/10/12 Change bps
3-M TB yield 4.39% 4.39% 0
6-M TB yield 4.87% 4.87% 0
12-M TB yield 5.08% 5.08% 0
24-M TB coupon 5.84% 5.84% 0
36-M TB coupon 6.50% 6.50% 0
60-M TB coupon 6.74% 6.74% 0
12/10/2012 05/10/2012 Change bps
Overnight interbank 2.75 2.75% 0
BDL 45-day C 3.57% 3.57% 0
BDL 60-day CD 3.85% 3.85% 0
Broad money M3 decreased by LP187B ($124.05M) during
the week ending September 27 to reach LP154,518B
($102.5B). However, M3 increased by 7.23% y-o-y and 5.42%
from end of December 2011. M1 fell during the week by
LP38B ($25.21M) as money in circulation went down by
LP76B ($50.41M), while demand deposits rose by LP38B
($25.21M). Total deposits (excluding demand deposits)
dropped by $98.8M due to a $124M decline in deposits
denominated in foreign currencies, whereas term and saving
deposits in LP climbed by $25.21M. As for the dollarization
rate of broad money, it edged down by 5 basis points on a
weekly basis to 58.34%. The overnight interbank rate stood at
2.75% during the month of July, according to the Association
of Lebanese Banks.
In the TBs auction held on October 04, the Ministry of
Finance raised LP454.89B ($301.75M) through the issuance
of Treasury Bills. Demand was mainly observed on the 36M
TB paper, which captured 87.93% of total subscription, while
the 12M and 24M papers accounted for 11.82% and 0.25%
respectively. During the auction, the average discount rate for
the 12M paper and the average coupon rate for the 24M and
36M papers stood at 5.08%, 5.84% and 6.5% respectively.
To note that the MoF continues to undertake all accepted
bids.
89.00
91.00
93.00
95.00
97.00
99.00
101.00
103.00
105.00
107.00
Oct-11 Dec-11 Feb-12 Apr-12 Jun-12 Aug-12 Oct-12
The Lebanon Brief Financial Markets Page 6 of 14
ISSUE 792; Week of 08 – 12 October, 2012
S A L
Eurobond Market
Eurobonds Index and Yield
12/10/2012 05/10/12 Change Year to Date
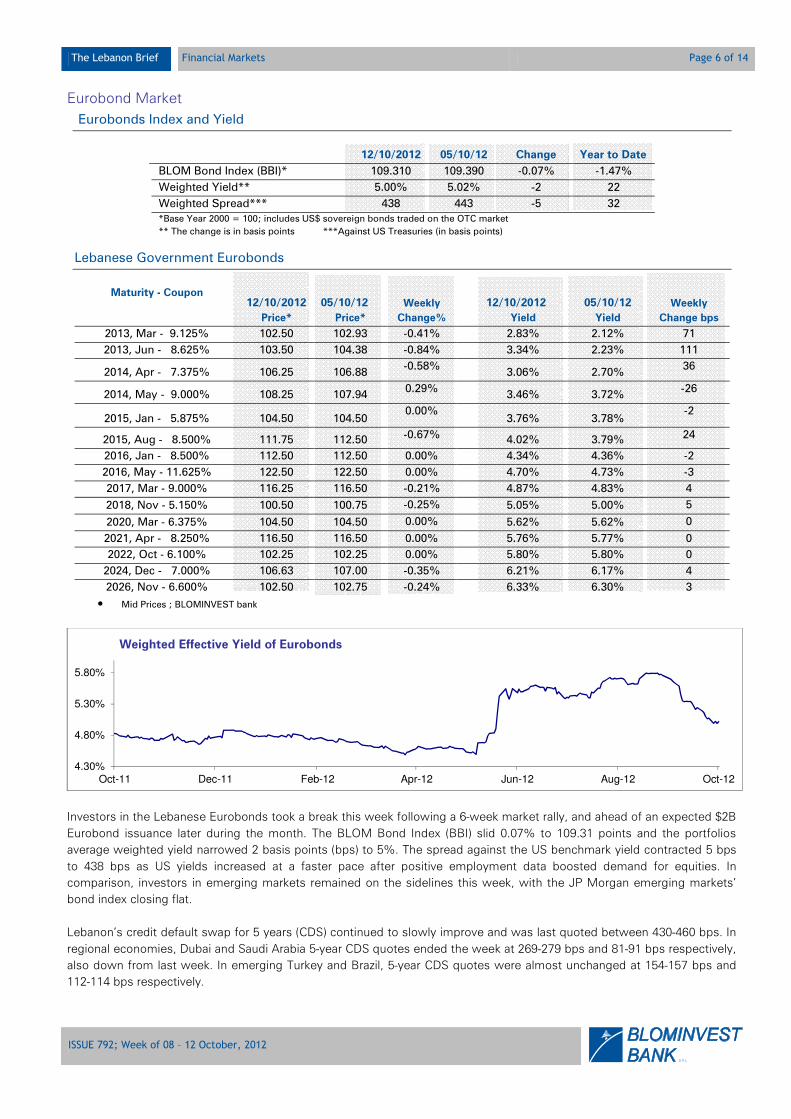
BLOM Bond Index (BBI)* 109.310 109.390 -0.07% -1.47%
Weighted Yield** 5.00% 5.02% -2 22
Weighted Spread*** 438 443 -5 32
*Base Year 2000 = 100; includes US$ sovereign bonds traded on the OTC market
** The change is in basis points ***Against US Treasuries (in basis points)
Lebanese Government Eurobonds
Maturity - Coupon 12/10/2012
Price*
05/10/12
Price*
Weekly
Change%
12/10/2012
Yield
05/10/12
Yield
Weekly
Change bps
2013, Mar - 9.125% 102.50 102.93 -0.41% 2.83% 2.12% 71
2013, Jun - 8.625% 103.50 104.38 -0.84% 3.34% 2.23% 111
2014, Apr - 7.375% 106.25 106.88 -0.58% 3.06% 2.70%
36
2014, May - 9.000% 108.25 107.94 0.29% 3.46% 3.72%
-26
2015, Jan - 5.875% 104.50 104.50 0.00% 3.76% 3.78%
-2
2015, Aug - 8.500% 111.75 112.50 -0.67% 4.02% 3.79% 24
2016, Jan - 8.500% 112.50 112.50 0.00% 4.34% 4.36% -2
2016, May - 11.625% 122.50 122.50 0.00% 4.70% 4.73% -3
2017, Mar - 9.000% 116.25 116.50 -0.21% 4.87% 4.83% 4
2018, Nov - 5.150% 100.50 100.75 -0.25% 5.05% 5.00% 5
2020, Mar - 6.375% 104.50 104.50 0.00% 5.62% 5.62% 0
2021, Apr - 8.250% 116.50 116.50 0.00% 5.76% 5.77% 0
2022, Oct - 6.100% 102.25 102.25 0.00% 5.80% 5.80% 0
2024, Dec - 7.000% 106.63 107.00 -0.35% 6.21% 6.17% 4
2026, Nov - 6.600% 102.50 102.75 -0.24% 6.33% 6.30% 3
• Mid Prices ; BLOMINVEST bank
Investors in the Lebanese Eurobonds took a break this week following a 6-week market rally, and ahead of an expected $2B
Eurobond issuance later during the month. The BLOM Bond Index (BBI) slid 0.07% to 109.31 points and the portfolios
average weighted yield narrowed 2 basis points (bps) to 5%. The spread against the US benchmark yield contracted 5 bps
to 438 bps as US yields increased at a faster pace after positive employment data boosted demand for equities. In
comparison, investors in emerging markets remained on the sidelines this week, with the JP Morgan emerging markets’
bond index closing flat.
Lebanon’s credit default swap for 5 years (CDS) continued to slowly improve and was last quoted between 430-460 bps. In
regional economies, Dubai and Saudi Arabia 5-year CDS quotes ended the week at 269-279 bps and 81-91 bps respectively,
also down from last week. In emerging Turkey and Brazil, 5-year CDS quotes were almost unchanged at 154-157 bps and
112-114 bps respectively.
4.30%
4.80%
5.30%
5.80%
Oct-11 Dec-11 Feb-12 Apr-12 Jun-12 Aug-12 Oct-12
Weighted Effective Yield of Eurobonds

The Lebanon Brief Economic and Financial News Page 7 of 14
ECONOMIC AND FINANCIAL NEWS ECONOMIC AND FINANCIAL NEWS ECONOMIC AND FINANCIAL NEWS ECONOMIC AND FINANCIAL NEWS
Total Portfolio Value & Number of Loans
Guaranteed
Source: Kafalat
Kafalat Loan Guarantees Retract by a 14% YTD rate
Business loans guaranteed by Kafalat stood at 111 in September
for a total value of $13.9M, i.e. a yearly drop of 21.8% compared to
the 146 loans worth $17.8M guaranteed in September 2011. Total
portfolio value since year start was less by 14% ending September
at $108.8M compared to $126.2M in the same period of last year.
The decreasing figures go in line with the uneasy atmosphere
that’s reigning in the country and discouraging entrepreneurs in
need for a nurturing environment for their new businesses. Despite
that, September portfolio value actually grew by 15% compared to
August’s, and while diminishing opportunities for touristic
businesses led their share to account for 19% of guaranteed loans
with 21 new loans approved, focus remained on the Industrial and
Agricultural sectors that took 40.5% and 37% respectively with 45
and 41 new loans guaranteed respectively in each sector.
Businesses located in Mount Lebanon made up the major part with
40% of guaranteed loans concentrated there, followed by Bekaa at
20.7%, the North at 18% and the South at 8.11%.
Government Fiscal Deficit up to July ($M)
Source:Ministry of Finance
Fiscal Deficit Widens To $1.17B by July
Lebanon’s YTD fiscal deficit ended July at $1.17B, compared to
$798M registered in the first 7 months of 2011, and represented
16.34% of total expenditures, while primary surplus recorded
$931M or 13% of total expenditures compared to $1.43M last year
or 22% of total expenditures, according to data released by the
Ministry of Finance. Over the seven months period, total revenues
increased by 5.66% to $5.98B whereas expenditures grew higher
by 10.69% to reach $7.1B. In details, revenues improvement was
brought by tax revenues, namely the VAT collections which
increased by 7% to $1.4B compared to 2011, and the Telecom
proceeds amounting to $836M. On the other hand, expenditures
were distressed by the transfers to EDL that witnessed the largest
increase compared to 2011 growing 63% to $1.2B, as well as by
withdrawals on the treasury account of $1.2B. Nevertheless, some
economies were made on the previous budget expenditures and
debt service. In the month of July alone, figures reflected a budget
deficit of $36M and a primary surplus of $158.7M.
103
128 126
109
0
200
400
600
800
1,000
1,200
0
20
40
60
80
100
120
140
2009 2010 2011 2012
Up to September
Total Value of Loans, $M
Number of Loans Guaranteed
(1,710)
(1,187)
(798)
(1,169)
2009 2010 2011 2012

The Lebanon Brief Economic and Financial News Page 8 of 14
ISSUE 792; Week of 08 – 12 October, 2012
S A L
Transfers to EdL Components: Values (In $M) and Percentages
Source: Ministry of Finance
Transfers to EDL Approaching $1B in H1 2012
Transfers to EDL increased by 43% during the first half of 2012 to
reach $981M compared to $683M in H1 2011. This rise was driven
by a $ 331.6M increase in payments to reimburse KPC and
Sonatrach for fuel oil and gas oil purchases, according to data
released by the Ministry of Finance. The 54% jump in fuel costs
was due to both, a larger amount of oil imports to compensate for
the halt of natural gas supply from Egypt’s EGAS, and an annual
increase in international oil prices. Average prices of crude oil
imported between May and December 2011, and consumed during
H1 2012 were $111.2/barrel, 36% higher than the price paid for fuel
imports that were consumed in H1 2011. Debt service stood at
$29.8M by the end of June 2012 compared to $27.9M during the
same period in 2011. Finally, EDL had contributed to 2.2% of the
fuel suppliers’ bill. In nominal terms, the company had paid a
higher contribution in 2011 of $55M compared to $21.2M this year.
Container Activity at Port of Beirut (Excluding Transshipment)
Source: Port of Beirut
Port of Beirut Activity Continues to Record Slight
Improvement in September
Total container activity at Port of Beirut Lebanon’s main port,
increased by 3.57% y-o-y in the three quarters of 2012 to reach
795,823 twenty-foot equivalent units (TEU) following a 5.57% y-o-y
rise during the same period a year earlier. Transshipment activity
slid 3.23% y-o-y to 318,544 TEU, after having increased by 22%
during the same period in 2011. Container activity (excluding
transshipment) jumped by 8.67% y-o-y 477,279 TEU, whereas the
total volume of merchandise (imports and exports) reached almost
5.45 million tons, or up by 8.4% y-o-y. The number of imported
cars increased by 27.14% y-o-y to 61,496, but was still well below
the 73,501 vehicles imported in the first nine months of 2010. In
September alone, total container activity was 92,049 TEU, up by
2.35% from the same month a year earlier. The number of cars
imported in August surged by almost 52% y-o-y to 6,501 recording
the largest annual increase this year.
45
54
951
656
1.33
2.65
29.85
27.86
Jun-12 Jun-11 H1 2012 H1 2011
Oil and Gas Reimbursments Debt Service
379,188
444,650
458,094
439,220
477,279
2008 2009 2010 2011 2012
Up to September, TEU

The Lebanon Brief Economic and Financial News Page 9 of 14
ISSUE 792; Week of 08 – 12 October, 2012
S A L
Airport Passengers up to September & % of
total in Q3
Source: Rafic Hariri International Airport
Airport Passengers Reach 4.58 Million by the end of
September 2012
It seems that regional instability and domestic cleavages between
political parties ahead of next year’s parliamentary elections started
to take their toll on airport activity, as the number of passengers
declined in September for the second time in three months, sliding
by 6.1% from September 2011 to 546,784. Arrivals and departures
were respectively 7.3% and 4.8% less. Transit passengers dropped
by 1 third from last year to 3,864. However, over the first three
quarters of 2012, the annual change in the number of passengers
remained in positive territories, rising by 6.89% year-on-year to
$4.58 million, after having nudged up by only 0.4% y-o-y to 3.7
million in the same period last year. According to figures released
by Rafic Hariri International Airport, total arrivals in the first three
quarters rose 5% y-o-y to 2.23 million passengers, departures
climbed 8.8% y-o-y to 2.31 million, while the number passengers
making transitory stops at the airport declined by 6.8% y-o-y to
41,481.
Major Aid Projects from the EU in Q3 2012
Description Value (euro)
Promotion of human rights policy and practice in the prisons of Lebanese women
-
Inauguration of six legal electronic compendiums
1.1 M
Agricultural and Rural Development Program
1.81 M
Development Projects in North Lebanon 2.5 M
Source: Ministry of Finance
Aid to Lebanon in September: Developing Capabilities
to Integrated Border Management
One aid project was signed during the month of September,
entitled “Developing National Capability for Integrated Border
Management” and assigned a budget of Euro 3.6 million, according
the AID Coordination newsletter released by the Ministry of
Finance. The European Union signed the contract with the
International Center for Migration Policy Development (ICMPD) to
implement the project through the Lebanese Customs and the
General Security. The 3 years project aims at supporting the
Lebanese Authorities to secure and control the borders in
accordance with national and international Integrated Border
Management standards.
3.02
3.79
4.24 4.28
4.58
46.36%
39.76%
36%
38%
40%
42%
44%
46%
48%
0
0.5
1
1.5
2
2.5
3
3.5
4
4.5
5
2008 2009 2010 2011 2012
Up to September, In Millions
Airport Passengers
% of Total Passengers Arriving in Q3

The Lebanon Brief Corporate Developments Page 10 of 14
CORPORATE DEVELOPMENTSCORPORATE DEVELOPMENTSCORPORATE DEVELOPMENTSCORPORATE DEVELOPMENTS
Holcim Financial Highlights ($M)
Jun-12 Dec-11 % change
Total Assets 283.53 300.57 -5.67%
Total Capital 197.82 215.17 -8.06%
Net Sales 89.81 97.05* -7.46%
Net Income 9.09 19.90* -54.32%
*: Up to June 2011 Source: Company Data
Holcim Liban and Ciment Blancs H1 Unconsolidated
Results
Holcim Liban released its unconsolidated results for the interim
period ending June 30, 2012 revealing an annual decrease in net
profits to LP13.7B ($9.09M) compared to LP30B ($19.9M) recorded
a year earlier as net sales declined by 7.46% y-o-y in the first half of
2012 to LP135.39B ($89.81M). The company’s total assets also
dropped by 5.67% from year start to LP427.42B ($283.53M). On
the other hand, Holcim Liban’s junior counterpart white cement
producer, the Societe Libanaise des Ciments Blans (SLCB), posted
a net income of LP1.73B ($1.15M) up to June 2011 as opposed to
LP4.7B ($3.12M) registered a year earlier.
RYMCO Financial Highlights ($M)
H1 2012 H1 2011 % Change
Total Assets 115.57 133.71 -13.6%
Total Equity 53.14 51.80 2.6%
Net Sales 84.21 73.7 14.3%
Net Profit 2 (0.42) -
Source: Company’s Data
RYMCO’s Unaudited Financials Show Profits Of $2M in
H1 2012
Rasamny Younis Motor Co. SAL (RYMCO), the exclusive dealer of
Nissan, GMC and Infiniti in Lebanon, released its unaudited
financials for the period ending on 30/6/2012. Net profits showed a
positive $2M compared to a loss of $425k in the first half of 2011.
Sales have increased by 14% to reach $84M and gross margin
enhanced from 9% in 2011 to 12%, together leading to a better
coverage of operating charges. On the balance sheet, total assets
saw a decrease of 13.6% to $115M where receivables made up
42% of totals, conserving their nominal amount of $48M, while
inventory of cars and spare parts decreased by 40% to reach
$29M. Self-financing ratio went up from 39% to 46% as some of
the short and medium term loans were settled.

The Lebanon Brief Focus in Brief Page 11 of 14
ISSUE 792; Week of 08 – 12 October, 2012
S A L
FOCUS IN BRIEFFOCUS IN BRIEFFOCUS IN BRIEFFOCUS IN BRIEF
Predictive Ability of the Yield Curve: Evidence from Lebanon
Graph 1: Coincident Indicator Components Graph 2: Coincident Indicator and GDP
Source: BdL Source: BdL, National Accounts, Blominvest Research Department
Graph 3: Yield Curve Slope as a One-Year Leading Indicator vs Coincident Indicator
Source: BdL, Blominvest Research Department
A new angle on the relationship between interest rates and economic activity gained attention in the late 1980’s when
studies began to examine the ability of the yield curve to forecast economic trends and business cycles.
Passenger Flows, 11%
Foreign Trade, 11.80%
Money Stock (M3),
12%
Cleared Checks, 12%
Cement Deliveries, 16.50%
Oil Derivative Imports, 18.20%
Electricity Production, 18.60%
-4%
-2%
0%
2%
4%
6%
-16%
-12%
-8%
-4%
0%
4%
8%
12%
16%
20%
24%
Q2 2000
Q4 2000
Q2 2001
Q4 2001
Q2 2002
Q4 2002
Q2 2003
Q4 2003
Q2 2004
Q4 2004
Q2 2005
Q4 2005
Q2 2006
Q4 2006
Q2 2007
Q4 2007
Q2 2008
Q4 2008
Q2 2009
Q4 2009
Q2 2010
Q4 2010
Q2 2011
Q4 2011
Q2 2012
Q4 2012
Q2 2013
Coincident Indicator 4Q Forward - Yield Curve Slope
-2%
0%
2%
4%
6%
8%
10%
12%
14%
16%
2000 2001 2002 2003 2004 2005 2006 2007 2008 2009 2010 2011
Coincident Indicator % Y-o-Y Change GDP Y-o-Y Growth

The Lebanon Brief Focus in Brief Page 12 of 14
ISSUE 792; Week of 08 – 12 October, 2012
S A L
The slope of the yield curve, defined as the spread between interest rates on designated long and short bonds1, was tested
as an alternative and shorthand method to estimate real GDP growth rates or to estimate the probability of future
recessions.
Most studies on the subject have to the best of our knowledge used evidence from the US and to a lesser extent, Japan
and Europe, to represent this relationship. The obvious reason for doing so has been the availability of reliable data on GDP
figures and interest rate spreads, and which span long enough for the results to be significant. In this study, we examine
the extent of the application of such a model in Lebanon. As we cannot find similarly accurate and long spanning data for
monthly GDP growth rates and the yield curve slope, we use proxies that represent both the abovementioned variables
spanning from January 2000 to June 2012.
Empirical evidence from studies conducted in the late 1980’s and early 1990’s2 revealed that a steepening yield curve
usually signals a near-future period of faster economic growth, whereas the inversion of the yield curve – when yields of
short term papers exceed yields of longer term papers – precedes an economic contraction by four to six quarters. Data
shows that the last six recessions in the US before 20083, were preceded by an inversion in the yield curve.
Theoretical models4 that have opted to explain this phenomenon attributed “relationships between the term structure of
interest rates and macro-economic variables”5 to monetary policy. Using evidence from the US, economists, such as former
Federal Reserve Chairman Alan Greenspan and current Chairman Ben Bernanke have suggested that the policy instrument
behind the relationship is the Federal Fund’s Rate (FFR). Bond Yields follow movement in the FFR. Monetary tightening
triggers a rise in short term interest rates, causing the yield curve to flatten and economic activity to slow.
Other studies have attributed the relationship between the slope of the yield curve and economic growth to market
dynamics and investors’ expectations. Simply put, changes in yields are indicators of saving and investment levels, which
influence future growth rates.
Antagonists of this theory argue that in the modern economy, such a relationship between interest rates and growth
doesn’t necessarily apply. They base their argument on the idea that large spreads between international interest rates that
induce global flows of capital and speculative investments, dwarf the effect of domestic monetary policy and local
propensities to save or invest. This automatically changes the relationship between interest rates and future growth trends.
However, recent evidence has also shown that the financial crisis of 2008 was preceded by cues that were in line with this
stipulation. The yield curve of US Treasuries began to invert during the second half of 2006 and the spread between 10-year
and 3-month Treasuries fell to negative 65 basis points between 5 and 6 quarters before September 2008, when Lehman
Brothers filed for bankruptcy. Moreover, while this may be true in cases of extreme capital flows, the relationship between
yield fluctuations and economic activity should ideally hold true in economies that are inherently dependent capital inflows,
such as Lebanon’s dependence on remittances.
Testing the hypothesis in Lebanon, the primary limitations we face are related to the lack of required data on monthly GDP
growth rates and long term Treasury bill rates. Lebanon’s National accounts have only issued annual growth rates since the
beginning of 1997. Likewise, and although data for short term or 3-month TB rates exists as far back as 1977, the Lebanese
government only issued its first 10-year paper as recently as September 2012, and therefore, proper data on the spread
cannot be directly used.
To counter such problems, we use instead proxies for each of the abovementioned data sets. First, to account for economic
activity, we utilize the Central Bank’s (BdL) Coincident Indicator (CI). The CI is a composite indicator adopted by BdL in 1994
and acts as a monthly approximation of GDP. “It is composed of eight variables that reflect economic activity (See Graph 1),
and is computed from the total of these quantitative variables, weighed according to their importance in the GDP”6. To
1 The spread most commonly used is that between 10-year and 3-month Treasury Bills 2 Harvey (1988), Laurent (1988, 1989), Minshkin (1990, 1991), Bernanke and Blinder (1992) 3 “The Yield Curve as a Predictor of US Recessions” Arturo Estrella and Frederic S. Mishkin, Current Issues in Economics and Finance Federal Reserve Bank of New York; Volume 2, no. 7, July 1996 4 Estrella and Minshkin (1995), Estrella (1997) 5 Estrella (1997) 6 “The Use of Surveys to Measure Sentiment and Expected Behavior of Key Sectors in the Financial System and the Economy: Evidence from the Business Survey conducted by the Central Bank of Lebanon”. Sana Souaid Jad, Fifth IFC Conference on “Initiatives to Address Data Gaps Revealed by the Financial Crisis” Basel, 25-26 August 2010

The Lebanon Brief Focus in Brief Page 13 of 14
ISSUE 792; Week of 08 – 12 October, 2012
S A L
assess whether the CI can make a good proxy for GDP growth, we calculate annual averages of the coincident indicator and
test their percentage change against annual GDP growth rates from the National Accounts (See Graph 2). The two data sets
show an 87.8 percent correlation.
Secondly, in order to measure the difference between interest rates on long and short bonds, we use Eurobond7 yields
rather than interest rates on local currency denominated Treasury bills. First, considering that while data from BdL on the
coupon and return rates of 3-month Treasury bills stretches as far back as 1977, data on 5-Year Treasury bills exists only
since 2005. Therefore, available slope figures constitute a very short time frame for our results to be significant. The slope
data we thus use is the difference between yields of Eurobonds maturing in the next three months to account for short-
term rates and yields of Eurobonds with an average 5 year maturity; noting that not all years in our series contain papers
maturing in 10-years; a preferred measure for longer term rates as tested by previous works.
In addition to solving the problem of our data deficiency, we find that using figures from the secondary Eurobond market
offers several advantages that could arguably produce much more accurate results. Primarily, Eurobond yields are
essentially treasury rates less a margin that represents Lebanon’s local currency risk, and therefore have monetary policy as
an underlying determinant. Typically, 85% of Eurobonds are publically traded and therefore, the Eurobond market is
significantly more liquid than the market for Treasury bills and better reflects investors’ expectations about future economic
activity. Eurobonds are a major foreign currency investment channel for local banks. Therefore, aside from policy and
expectations, Eurobond rates signal the evolution of foreign capital inflows into Lebanon, which in turn play a major role in
determining near future investments and consumption trends.
Examining our results, we find that the slope between 2000 and mid 2006 correspondingly precedes the trend of annual
change in BdL’s Coincident Indicator by an average three to five quarters. Values of both series do not change at equivalent
rates as the fluctuation of the slope is more severe. The correlation of the two series is still almost 60%.
Between 2006 and 2010, the positive relationship between the slope of the yield curve and the coincident indicator seemed
less discernible. After the Q3 2006 fluctuations, in which the CI drops substantially with the July war, economic growth
rates spike up to decade-highs while the yield curve remains almost flat. This is especially evident after the financial crisis
when sharp drops in international interest rates drove large capital flows into emerging economies with high deposit rates;
Lebanon saw unprecedented inflows of foreign funds, of which large Investments went into medium and long term
Eurobonds and flattened the yield curve. Lebanon’s economy during those years was also booming, with record tourist
numbers and foreign direct investment inflows. Annual changes in the coincident indicator remained above 10% between
Q4 2007 and Q1 2010 while annual GDP growth averaged 8.5% during the period.
Between 2010 and 2012, the correlation between the slope of the yield curve and the coincident indicator jumped to 71%.
Political developments during the period, which resulted in yield curve fluctuations did not have a direct effect on the
economy and were met in the following four to six quarters with corresponding changes in the coincident indicator.
In periods when economic developments were influenced by the political environment, changes in real activity that geared
the coincident indicator were consistently preceded by cues from the bond market. Political tension is usually followed by
an immediate decline in the spread as a bearish short term economic outlook raises the preference for stable and higher
yielding papers, while shorter papers lose their risk-return appeal. Moreover, as political tension also causes an increase in
the dollarization of deposits in local banks, investments by financial institutions increase in longer term papers. Both factors
result in the flattening of the yield curve. This effect however doesn’t materialize immediately in real activity, except when
political turmoil is acute, as was the case in the July war of 2006.
While we cannot say that the inversion of the yield curve in our data is consistently followed by an economic contraction,
due to the short-time frame of our study and the lack of occurrences where the slope went into negative territory, the
correlation between the slope of the yield curve and economic activity is certainly discernible in our data, where a
steepening yield curve is followed by faster economic growth and a flattening yield curve, by deceleration of economic
growth if not contraction.
7 Lebanese Eurobonds have constituted 28% and 55% of total government debt between 2000 and 2012
The Lebanon Brief Focus in Brief Page 14 of 14
ISSUE 792; Week of 08 – 12 October, 2012
S A L
Another factor that we find interferes with the correlation between the slope and real activity in Lebanon is the dependence
of domestic interest rate policy on US policy. Lebanon’s currency peg to the US dollar calls for a need to adjust domestic
interest rates in line with US rates. This is especially crucial in cases when the US Federal Reserve hikes interest rates, given
that Lebanon has to maintain a minimum spread against US rates to account for the country’s risk and to continue drawing
in foreign funds.
Finally, judging from our model, we can expect economic activity to begin picking up by the end of 2012 and early 2013.
The yield curve slope had touched a low of 0.42% in Q2 2011, before moving up to 1.6% and stabilizing at around that rate
up to Q1 2012. This however again hinges on the notion that the political environment doesn’t deteriorate further.
.

The Lebanon Brief
Page 15 of 14
Your Investment Reference
S A L
Research Department:
Maya Mantach [email protected]
Malak Hawa [email protected]
Walid Sayegh [email protected]
Gaelle Khoury [email protected]
Marwan Mikhael [email protected]