Embed Size (px)
Citation preview
The Learning C u r v e
What We Are Discovering
About U.S. Science and
Mathematics Education
The Learning C u r v e
N A T I O N A L S C I E N C E F O U N D A T I O N
The National Science Foundation Act of 1950
The National Science Foundation was established by Congress in 1950 “to initi-ate and support basic scientific research and programs to strengthen scientificresearch potential and science education programs at all levels in the mathematical,physical, medical, biological, social, and other sciences and to initiate and supportresearch fundamental to the engineering process and programs to strengthen engi-neering research potential and engineering education programs at all levels…”

The Learning Curve:What We Are Discovering about
U.S. Science and Mathematics EducationA Prefatory Report on the National Science Foundation’s
Indicators of Science and Mathematics Education 1995
January 1996
National ScienceFoundation
REC IndicatorsSeries

Recommended Citation
Division of Research, Evaluation and Communication, Directorate for Educationand Human Resources. The Learning Curve: What We Are Discovering about U.S.
Science and Mathematics Education. Edited by Larry E. Suter. Washington, DC:National Science Foundation, 1996 (NSF 96-53).

The Learning Curve: What We Are Discovering about U.S. Science and Mathematics
Education was planned and prepared in the Directorate for Education and HumanResources (EHR), Luther S. Williams, Assistant Director. Daryl E. Chubin, DivisionDirector of the Division of Research, Evaluation and Communication, provided gen-eral direction and oversight. Larry E. Suter, Deputy Director of the division, wasresponsible for directing the writing and production of the report. Tom Ewing andLaure Sharp, Westat, wrote this volume as a prefatory report on the NationalScience Foundation’s Indicators of Science and Mathematics Education 1995.They usedhighlights from the Indicators of Science and Mathematics Education 1995, which waswritten by Larry E. Suter, National Science Foundation; Joy Frechtling, Westat;Daniel C. Humphrey, Amy L. Lewis, Marjorie E. Wechsler, and Judith Powell of SRIInternational; Iris Weiss, Horizon Research, Inc.; Frances Lawrenz, University ofMinnesota; Mary L. Queitzsch, former AERA fellow, Northwest RegionalEducational Laboratory; and James S. Dietz, National Science Foundation.
Acknowledgments

Under contract to the Directorate for Education and Human Resources, FridaySystems Services provided the following services in the production of this document:research, statistical analysis, editing, design, data entry, graphics creation, qualitycontrol, and desktop publishing. Kaarin Engelmann was Managing Editor.
List of Figures . . . . . . . . . . . . . . . . . . . . . . . . . . . . . . . . . . . . . . . .v
Presenting the Indicators . . . . . . . . . . . . . . . . . . . . . . . . . . . . . . .1
Standards and the Quest for Reform . . . . . . . . . . . . . . . . . . . . . . . . . . . . . . .3
Data Sources . . . . . . . . . . . . . . . . . . . . . . . . . . . . . . . . . . . . . . . . . . . . . . . . .6
Highlights . . . . . . . . . . . . . . . . . . . . . . . . . . . . . . . . . . . . . . . . . . . .8
Student Achievement . . . . . . . . . . . . . . . . . . . . . . . . . . . . . . . . . . . . . . . . . .8
Curriculum . . . . . . . . . . . . . . . . . . . . . . . . . . . . . . . . . . . . . . . . . . . . . . . . .11
Teachers and the Learning Environment . . . . . . . . . . . . . . . . . . . . . . . . . . .12
Equity . . . . . . . . . . . . . . . . . . . . . . . . . . . . . . . . . . . . . . . . . . . . . . . . . . . . .14
Demographic Changes . . . . . . . . . . . . . . . . . . . . . . . . . . . . . . . . . . . . . . . .17
Postsecondary Education . . . . . . . . . . . . . . . . . . . . . . . . . . . . . . . . . . . . . . .17
Toward the Future . . . . . . . . . . . . . . . . . . . . . . . . . . . . . . . . . . . .22
Table of Contents
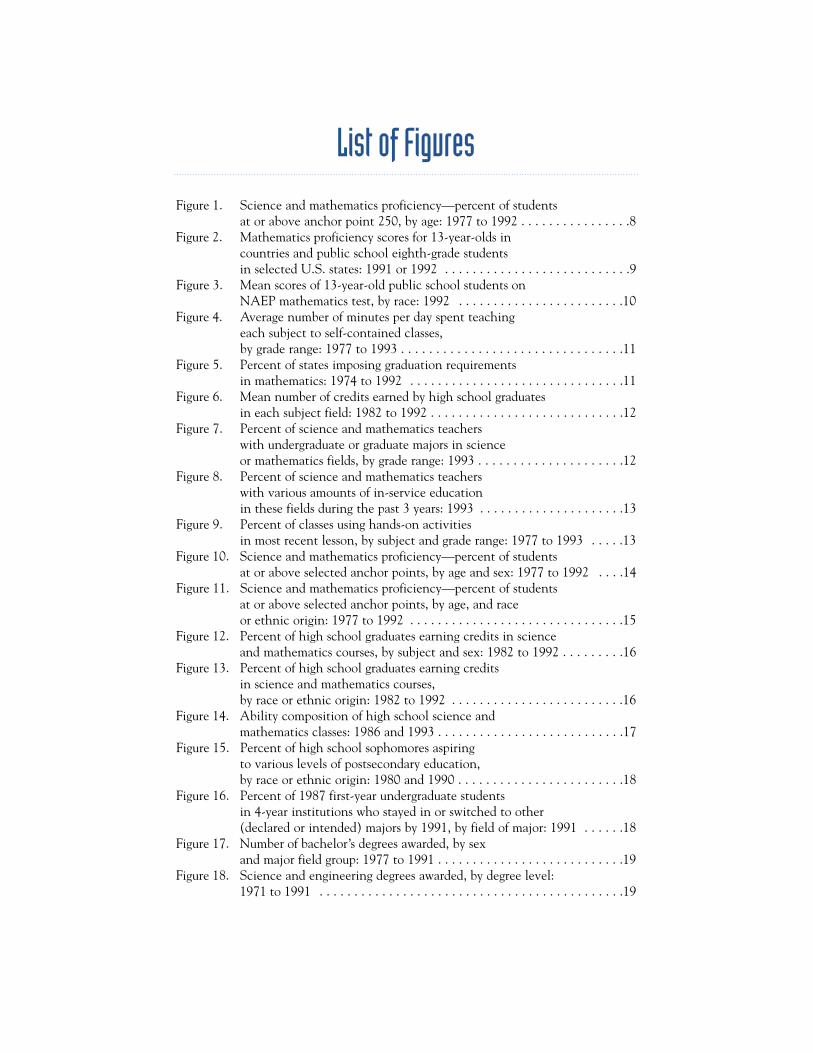
Figure 1. Science and mathematics proficiency—percent of students at or above anchor point 250, by age: 1977 to 1992 . . . . . . . . . . . . . . . .8
Figure 2. Mathematics proficiency scores for 13-year-olds in countries and public school eighth-grade students in selected U.S. states: 1991 or 1992 . . . . . . . . . . . . . . . . . . . . . . . . . . .9
Figure 3. Mean scores of 13-year-old public school students onNAEP mathematics test, by race: 1992 . . . . . . . . . . . . . . . . . . . . . . . .10
Figure 4. Average number of minutes per day spent teaching each subject to self-contained classes, by grade range: 1977 to 1993 . . . . . . . . . . . . . . . . . . . . . . . . . . . . . . . .11
Figure 5. Percent of states imposing graduation requirementsin mathematics: 1974 to 1992 . . . . . . . . . . . . . . . . . . . . . . . . . . . . . . .11
Figure 6. Mean number of credits earned by high school graduates in each subject field: 1982 to 1992 . . . . . . . . . . . . . . . . . . . . . . . . . . . .12
Figure 7. Percent of science and mathematics teachers with undergraduate or graduate majors in scienceor mathematics fields, by grade range: 1993 . . . . . . . . . . . . . . . . . . . . .12
Figure 8. Percent of science and mathematics teachers with various amounts of in-service education in these fields during the past 3 years: 1993 . . . . . . . . . . . . . . . . . . . . .13
Figure 9. Percent of classes using hands-on activities in most recent lesson, by subject and grade range: 1977 to 1993 . . . . .13
Figure 10. Science and mathematics proficiency—percent of students at or above selected anchor points, by age and sex: 1977 to 1992 . . . .14
Figure 11. Science and mathematics proficiency—percent of students at or above selected anchor points, by age, and race or ethnic origin: 1977 to 1992 . . . . . . . . . . . . . . . . . . . . . . . . . . . . . . .15
Figure 12. Percent of high school graduates earning credits in science and mathematics courses, by subject and sex: 1982 to 1992 . . . . . . . . .16
Figure 13. Percent of high school graduates earning credits in science and mathematics courses, by race or ethnic origin: 1982 to 1992 . . . . . . . . . . . . . . . . . . . . . . . . .16
Figure 14. Ability composition of high school science and mathematics classes: 1986 and 1993 . . . . . . . . . . . . . . . . . . . . . . . . . . .17
Figure 15. Percent of high school sophomores aspiring to various levels of postsecondary education, by race or ethnic origin: 1980 and 1990 . . . . . . . . . . . . . . . . . . . . . . . .18
Figure 16. Percent of 1987 first-year undergraduate students in 4-year institutions who stayed in or switched to other (declared or intended) majors by 1991, by field of major: 1991 . . . . . .18
Figure 17. Number of bachelor’s degrees awarded, by sex and major field group: 1977 to 1991 . . . . . . . . . . . . . . . . . . . . . . . . . . .19
Figure 18. Science and engineering degrees awarded, by degree level: 1971 to 1991 . . . . . . . . . . . . . . . . . . . . . . . . . . . . . . . . . . . . . . . . . . . .19
List of Figures
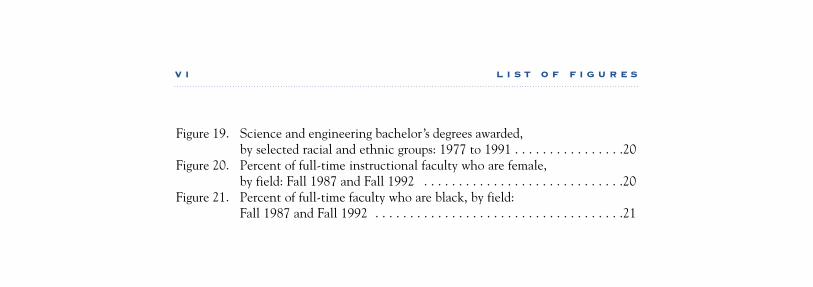
Figure 19. Science and engineering bachelor ’s degrees awarded, by selected racial and ethnic groups: 1977 to 1991 . . . . . . . . . . . . . . . .20
Figure 20. Percent of full-time instructional faculty who are female, by field: Fall 1987 and Fall 1992 . . . . . . . . . . . . . . . . . . . . . . . . . . . . .20
Figure 21. Percent of full-time faculty who are black, by field: Fall 1987 and Fall 1992 . . . . . . . . . . . . . . . . . . . . . . . . . . . . . . . . . . . .21
V I L I S T O F F I G U R E S
Presenting the Indicators
A ccording to data recently compiled by the National Science Foundation(NSF), elementary schools in the United States today are devoting moreclassroom time than ever before to science and mathematics instruction.
More high school students are undertaking advanced courses in these cruciallyimportant areas of study. And U.S. colleges and universities are awarding more bach-elor’s, master’s, and doctoral degrees in the natural sciences and engineering.
Moreover, members of all racial and ethnic groups are sharing in a number of thenotable gains made by the Nation’s science and mathematics students; for example,a greater proportion of U.S. high school students, regardless of race or ethnic back-ground, are now satisfactorily completing courses in science and mathematics.Achievement scores in these fields are on the rise for students of all races. And thereis a discernible increase in the number of blacks, Hispanics, and Native Americansearning bachelor’s degrees in science and engineering.
These and an array of other encouraging findings are offered in an NSF presentationof statistical data—or “indicators”—concerning the students, teachers, systems, cur-ricula, learning environments, teaching methods, and other components of theNation’s science and mathematics education community. Titled Indicators of Science
and Mathematics Education 1995, the report was created in compliance with a 1991mandate from the U.S. Congress. Like its 1992 predecessor, for which it serves as anupdate, the latest volume is intended for use by anyone seeking qualitative andquantitative information on trends in elementary, secondary, and postsecondary edu-cation. NSF expects the report’s readership to be broad in scope, including educa-tors, elected officials, government policy makers, social commentators, professionalscientists and mathematicians, and the general public—all citizens, that is, who sup-port the notion that significant improvement in U.S. science and mathematics edu-cation should rank among the Nation’s highest priorities.
For those who share in the hope that U.S. science and mathematics education iseffectively preparing our young people to live, work, and prosper in a technology-intensive, increasingly competitive global society, the report offers grounds for cau-tious optimism. Indeed, based on hundreds of statistical findings gathered by NSFfrom a wide variety of authoritative national surveys, Indicators of Science and
T H E L E A R N I N G C U R V E 1
What is an “Indicator”?
An indicator is a statistic that describes the health
of a system or the status of an important policy issue.
Mathematics Education 1995 suggests that considerable progress in science and math-ematics education is being made at all grade levels.
◆ Particularly encouraging is the growing awareness among elementary schoolteachers and curriculum designers that a familiarity with basic concepts in sci-ence and mathematics should be introduced to students at an early age.Measured in blocks of time ranging from approximately 20 minutes to 100minutes, the average amount of classroom time per day dedicated to scienceand mathematics for grades 1 through 6 rose substantially between 1977 and1993, according to a 1993 National Survey of Science and MathematicsEducation (NSSME), one of several sources for the Indicators of Science and
Mathematics Education 1995.
◆ Furthermore, students’ early exposure to science and mathematics is now beingparlayed beneficially through their high school years far more effectively thanit has been in the past, thanks largely to an increase in the number of statesthat are imposing stricter graduation requirements in these areas of study. In1974, about 15 percent of states required 2 or more years of mathematics forgraduation; in 1992, the figure was approaching 90 percent. Consistent withelevated graduation requirements, the increased availability of advanced sci-ence and mathematics courses at the secondary level is evident nationwide.Currently, nearly 100 percent of all U.S. high schools offer courses not only inintroductory algebra, geometry, and biology, but also in chemistry, physics,algebra II, and trigonometry.
◆ Along with more stringent high school graduation requirements and the avail-ability of advanced science and mathematics courses, the level of preparationof postsecondary science and engineering students and the number of collegedegrees being awarded in these areas are rising. Much of this progress has beenmade within the very recent past. High school students who in 1993 plannedan undergraduate major in the natural sciences or engineering were, for themost part, better prepared than were their counterparts just 3 years earlier.Between 1990 and 1993, for example, the proportion of intended natural sci-ence or engineering majors who took calculus in high school rose from aboutone-quarter to one-third, while the proportion of those taking physicsincreased from about one-half to almost two-thirds.
◆ Among the most encouraging trends noted in the report is the increase in thenumber of women with degrees in science fields. Between 1971 and 1991, thepercent of bachelor’s degrees in science and engineering fields awarded towomen increased from 29 to 44 percent and the percent of doctoral degreesawarded to women increased from 10 to 28 percent. Steady increases occurredover the past 20 years in the number of women receiving bachelor’s and doc-toral degrees in science fields while the number of men receiving degrees didnot increase. While the number of women receiving doctorates in sciencefields has increased by more than threefold since 1971, the number of menreceiving doctoral degrees is about the same in 1991 as in 1971.
2 P R E S E N T I N G T H E I N D I C A T O R S
The Indicators of Science and Mathematics Education 1995 presents some less-encour-aging indicators as well:
◆ While more high school students of all races are enrolling in and successfullycompleting science and mathematics courses, and although test scores of allstudents have improved during the past decade, scores for white studentsremain significantly higher than those for black and Hispanic students. Andalthough more blacks, Hispanics, and Native Americans are earning bachelor’sdegrees in science and engineering today than ever before, all three minoritygroups remain underrepresented in relation to their presence in the overallU.S. college-age population.
◆ Despite some modest gains since 1988, women and minorities continue to beunderrepresented on U.S. higher education science and engineering faculties.
◆ While today’s students have parents with higher levels of education—a factorthat many experts consider a positive influence on academic proficiency—these students are more likely to be members of one-parent families and to beliving in poverty—factors that many experts consider a negative influence onperformance.
◆ Eighth-grade mathematics achievement in some states (Iowa, North Dakota,and Minnesota) was the same as in top-performing countries (Taiwan, Korea,and former Soviet Union), while achievement in the lowest performing states(Arkansas, Alabama, Louisiana, and Mississippi) was about the same as in thelowest performing country (Jordan).
◆ Despite increases in the time and attention being devoted to science andmathematics, the high school graduation requirements for these subjects inmany states still fall short of the 4 years of each that has been recommendedby education reform advocates.
These and a wealth of other significant revelations emerge from the array of indica-tors presented in the report, a sampling of which appears in Highlights (page 8 ofthis summary report). In creating Indicators of Science and Mathematics Education
1995, NSF has focused on collecting, synthesizing, analyzing, evaluating, and pre-senting relevant data.
Standards and the Quest for Reform
Over the past decade, science and mathematics education standards have been artic-ulated by a number of prestigious organizations, such as the National Council forTeachers of Mathematics, the National Research Council, the National ScienceTeachers Association, and the American Association for the Advancement ofScience. While differing in details, the standards are consistent in providing guide-lines for instruction, calling for improvement in teacher qualifications and the learn-ing environment, and setting levels of expectation for student achievement. Thestandards reinforce the notion that the pursuit of excellence must be open to all stu-dents, regardless of their sex, race, or the community in which they live.
T H E L E A R N I N G C U R V E 3

The standards have, in turn, yielded a widely endorsed set of specific goals, such asthe following:
◆ All students should be expected to attain a high level of scientific and mathe-matical competency.
◆ Students should learn science and mathematics as active processes focused ona limited number of concepts.
◆ Curricula should stress understanding, reasoning, and problem solving ratherthan memorization of facts, terminology, and algorithms.
◆ Teachers should engage students in meaningful activities that regularly andeffectively employ calculators, computers, and other tools in the course ofinstruction.
◆ Teachers need both a deep understanding of subject matter and the opportuni-ty to learn to teach in a manner that reflects research on how students learn.
One way the standards and goals of excellence and equity in science and mathemat-ics education have been implemented is through efforts to reform many aspects ofthe school system at once—an approach entailing a coordinated national initiative,as opposed to piecemeal remedial efforts, to address all critical components of theprevailing educational system. Dr. Luther S. Williams, Assistant Director of NSF’sDirectorate for Education and Human Resources, says that systemic reform “…is arevolutionary vehicle to ameliorate the performance gap—which demographics dic-tate we must do in order to achieve Goals 2000 for all of our students.”
4 P R E S E N T I N G T H E I N D I C A T O R S
What are the “Standards”?
National standards provide an explicit set of expectations for teaching
and learning. Stressing the importance of mathematics and science
for all students, they provide a vision that is based on our best
understanding of teaching and learning. Standards provide the basis
for guiding educational programs and for measuring the
accomplishments of our educational institutions.
Systemic science and mathematics education reform is built on the followingelements:
◆ Curricular reform for all students at all grade levels, including the establish-ment of achievement standards based on the ability to master scientificprocesses rather than memorization of facts or formulas.
◆ Changes in the learning environment, including pedagogic reform, with teach-ers emphasizing active student involvement through discussion, problem solv-ing, hands-on activities, and small-group work.
◆ More opportunities for all students to use calculators and computers in theclassroom and for homework.
◆ More exposure of low-achieving students to the full range of educationalopportunities and demands.
◆ Assessment reform that replaces tests based on factual knowledge with teststhat measure the ability to reason, solve problems, and use scientific principles.
T H E L E A R N I N G C U R V E 5
What is “Systemic Reform?”
“Systemic reform” is a process of educational reform based on the
premise that achieving excellence and equity requires alignment of
critical activities and components. It is as much a change in infra-
structure as in outcomes. Central elements include—
◆ High standards for learning expected from all students;
◆ Alignment among all the parts of the system—policies,
practices, and accountability mechanisms;
◆ A change in governance that includes greater school site
flexibility;
◆ Greater involvement of the public and the community;
◆ A closer link between formal and informal learning experiences;
◆ Enhanced attention to professional development; and
◆ Increased articulation between the precollege and postsecondary
education institutions.
In light of prevailing concerns about U.S. students’ comparatively low academicachievement in science and math, and considering the commitment of the FederalGovernment and state governments to reverse the situation by the year 2000, it fol-lows that policy makers, congressional leaders, parents, and others are looking foranswers to a number of questions, including the following:
◆ Are current reform efforts succeeding in improving science and mathematicseducation?
◆ Has overall achievement improved?
◆ Do students in each state and region of the country perform equally?
◆ Are achievement levels among ethnic groups converging?
◆ Have differences in the achievement levels of the United States and othercountries narrowed?
◆ Is a reduction occurring in the practice of grouping students by ability level?
◆ Is there an increase in the number of teacher-development programs thatemphasize new methods of science and mathematics instruction?
◆ Is there an increase in the number of teachers with undergraduate-levelcoursework in science and mathematics?
◆ Is there an increase in the number of teachers who belong to racial and ethnicminorities, especially in schools with large minority student populations?
Data Sources
Since its establishment in 1950, one of NSF’s missions has been to provide research,guidance, and support for U.S. science and mathematics education. NSF’s roleextends into the compilation of statistical data about science and mathematics pro-grams gathered by Federal agencies, such as the National Center for EducationStatistics. NSF analyzes statistical information from outside sources as well anddevelops appropriate methods for evaluating the effectiveness of programs and initia-tives. Creation of the biennial indicators report, therefore, builds on the agency’sleadership as compiler, reviewer, and interpreter of complex data.
While the 1992 Indicators of Science and Mathematics Education report primarilydescribed science- and mathematics-related trends from 1970 to 1990, the latest doc-ument focuses wherever possible on information regarding student proficiency, cur-ricula, learning environments, demographics, and so forth, that has been gatheredthrough 1993. Therefore, the 1995 report serves as an update on the ways in whichthe important issues in science and mathematics education that were analyzed in the1992 edition continue to change.
6 P R E S E N T I N G T H E I N D I C A T O R S
Major sources of the latest data included such existing national surveys as theNational Assessment of Educational Progress (NAEP), the National EducationLongitudinal Study of 1988, the National Survey of Science and MathematicsEducation, and the High School and Beyond study. The main source for internation-al comparisons was the International Assessment of Educational Progress. In somecases, the authors have conducted secondary analyses of the existing data, but nonew data were collected by NSF.
The 1995 report is presented in three main chapters, covering student achievement,characteristics of elementary and secondary education, and progress in postsecondaryeducation. The indicators were chosen by the authors of each chapter, who wereguided by members of an advisory committee and by publications on the status ofrelevant indicators. In the selection of the indicators, a special effort was made toaddress salient issues and trends of specific concern to school administrators anddecision makers in the congressional and executive branches of government. Thedata cover, for example, the policy environment of educational reform, the demo-graphic context of education, student achievement in science and math, reforms inscience and mathematics education on the elementary and secondary levels, andtrends in postsecondary science and engineering education. The report also discussesthe overall state of educational reform and highlights the types of indicators requiredto assess future progress.
T H E L E A R N I N G C U R V E 7
Highlights
T o reflect the content of the full Indicators of Science and Mathematics
Education 1995, the following sampling of the report highlights significantfindings regarding student achievement, curriculum, teachers and the learn-
ing environment, equity, demographic changes, and postsecondary education.
Student Achievement
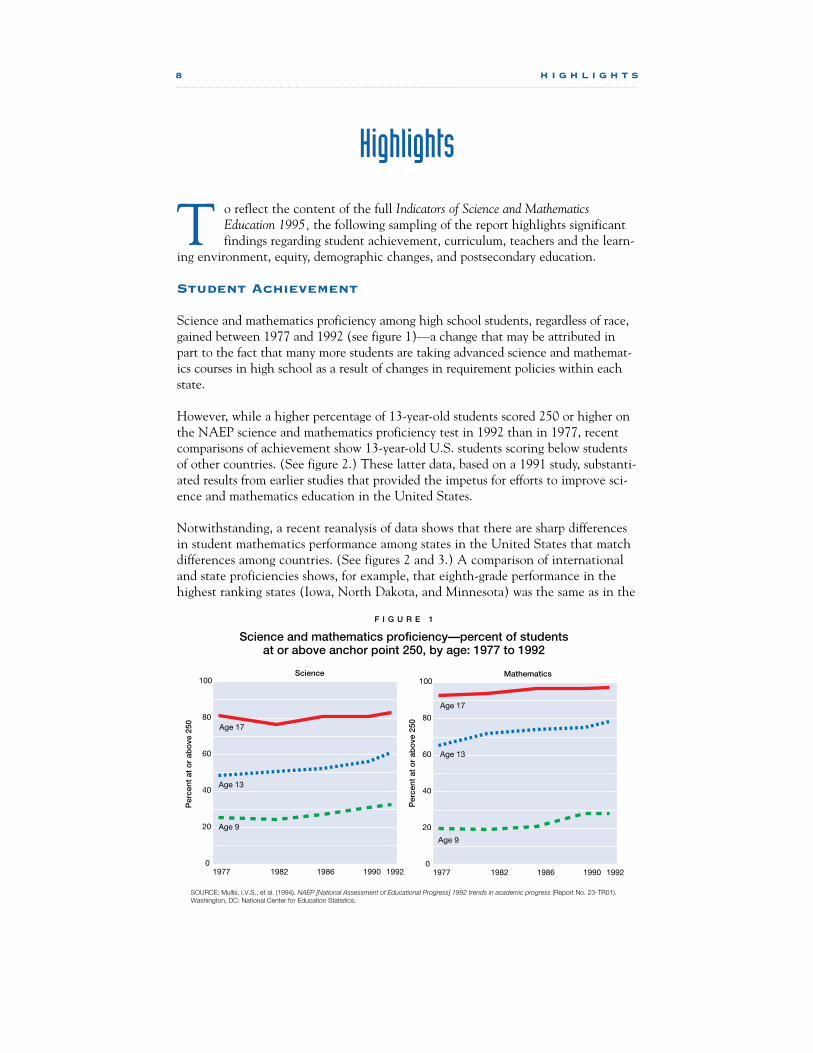
Science and mathematics proficiency among high school students, regardless of race,gained between 1977 and 1992 (see figure 1)—a change that may be attributed inpart to the fact that many more students are taking advanced science and mathemat-ics courses in high school as a result of changes in requirement policies within eachstate.
However, while a higher percentage of 13-year-old students scored 250 or higher onthe NAEP science and mathematics proficiency test in 1992 than in 1977, recentcomparisons of achievement show 13-year-old U.S. students scoring below studentsof other countries. (See figure 2.) These latter data, based on a 1991 study, substanti-ated results from earlier studies that provided the impetus for efforts to improve sci-ence and mathematics education in the United States.
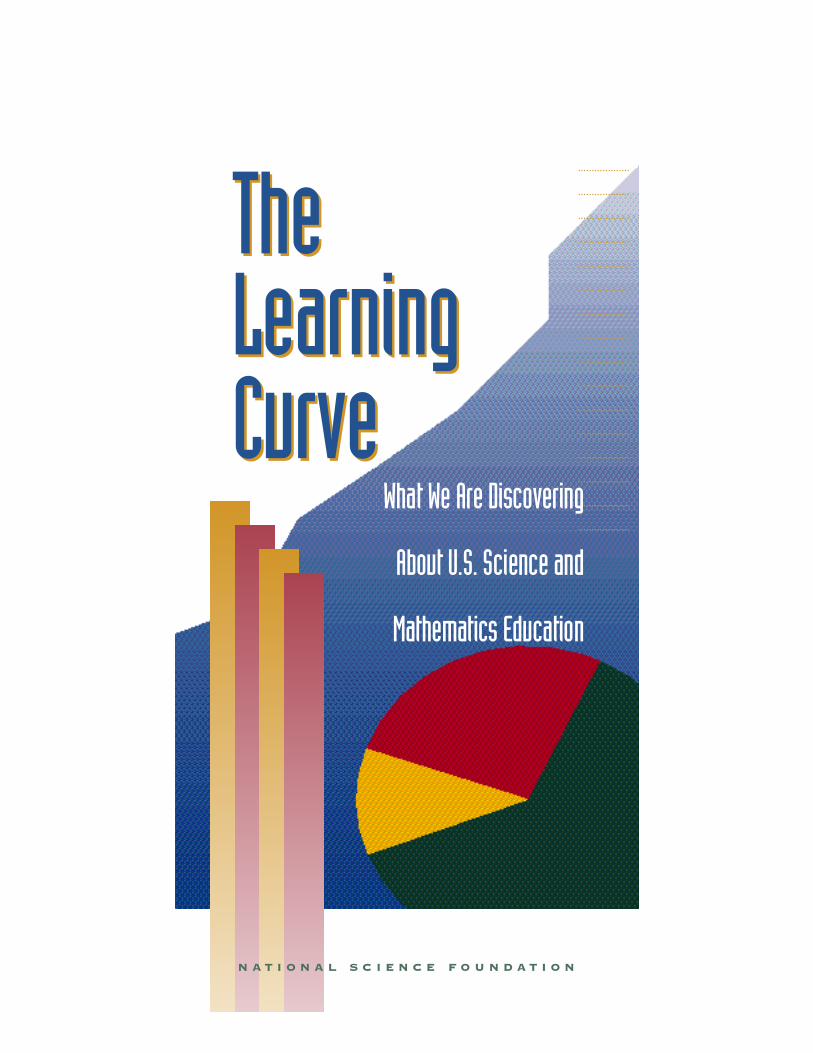
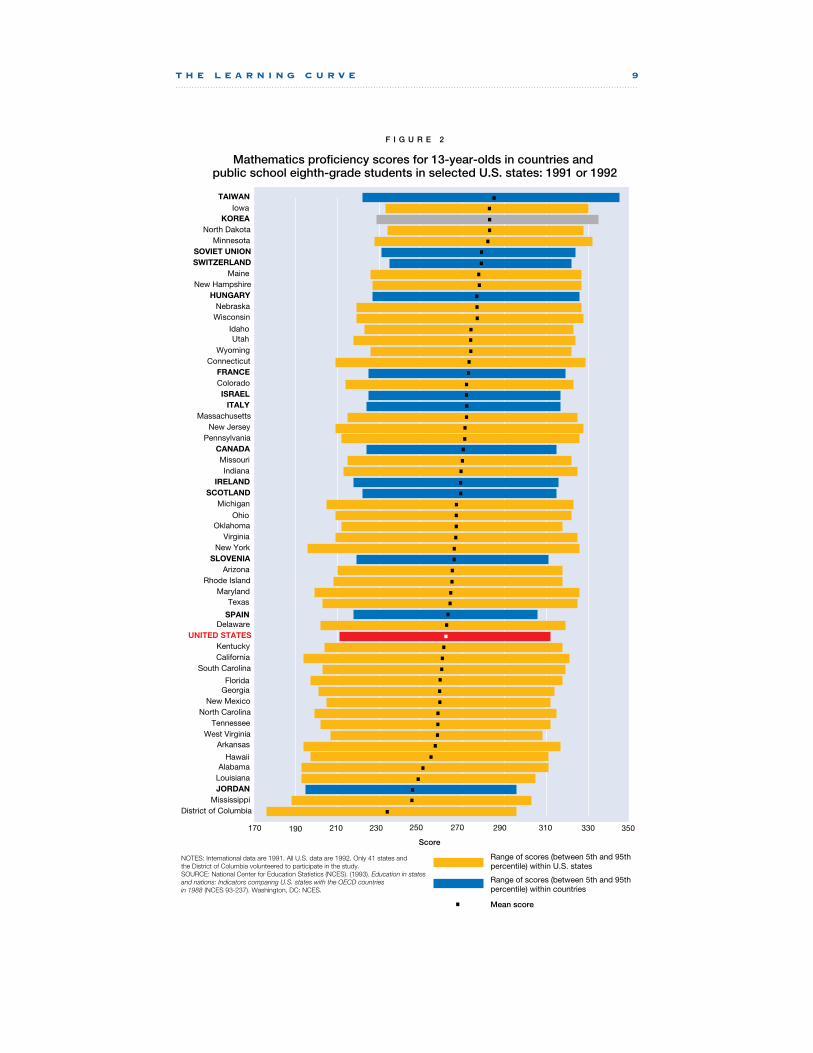
Notwithstanding, a recent reanalysis of data shows that there are sharp differencesin student mathematics performance among states in the United States that matchdifferences among countries. (See figures 2 and 3.) A comparison of internationaland state proficiencies shows, for example, that eighth-grade performance in thehighest ranking states (Iowa, North Dakota, and Minnesota) was the same as in the
8 H I G H L I G H T S
1977 1982 1986 1990 19920
20
40
60
80
100
Per
cent
at
or
abo
ve 2
50
Science
Age 17
Age 13
Age 9
1977 1982 1986 1990 19920
20
40
60
80
100
Per
cent
at
or
abo
ve 2
50
Mathematics
Age 17
Age 13
Age 9
SOURCE: Mullis, I.V.S., et al. (1994). NAEP [National Assessment of Educational Progress] 1992 trends in academic progress (Report No. 23-TR01). Washington, DC: National Center for Education Statistics.
F I G U R E 1
Science and mathematics proficiency—percent of students at or above anchor point 250, by age: 1977 to 1992
T H E L E A R N I N G C U R V E 9
F I G U R E 2
Mathematics proficiency scores for 13-year-olds in countries and public school eighth-grade students in selected U.S. states: 1991 or 1992
NOTES: International data are 1991. All U.S. data are 1992. Only 41 states and the District of Columbia volunteered to participate in the study. SOURCE: National Center for Education Statistics (NCES). (1993). Education in states and nations: Indicators comparing U.S. states with the OECD countries� in 1988 (NCES 93-237). Washington, DC: NCES.
Mean (average)District of Columbia
MississippiJORDANLouisianaAlabama
Arkansas
Hawaii
West VirginiaTennessee
North CarolinaNew Mexico
GeorgiaFlorida
South CarolinaCaliforniaKentucky
UNITED STATESDelaware
SPAIN
TexasMaryland
Rhode IslandArizona
SLOVENIANew York
VirginiaOklahoma
OhioMichigan
SCOTLANDIRELAND
IndianaMissouri
CANADAPennsylvania
New JerseyMassachusetts
ITALYISRAEL
ColoradoFRANCE
ConnecticutWyoming
UtahIdaho
WisconsinNebraska
HUNGARYNew Hampshire
MaineSWITZERLANDSOVIET UNION
MinnesotaNorth Dakota
KOREAIowa
TAIWAN
170 190 210 230 250 270 290 310 330 350
Score
Mean score
Range of scores (between 5th and 95th percentile) within U.S. states
Range of scores (between 5th and 95th percentile) within countries
281 or higher
274 to 280
267 to 273
Nonparticipant*
260 to 266
273
277277
276
275 272
276278
279
272
281
284284
284
275
265
263
282
274 273
262264
266
264
260 275
266
270
273
276
276
279
279
278272
283283
278
271
277
F I G U R E 3
Mean scores of 13-year-old public school students
on NAEP mathematics test, by race: 1992
265
251 or higher244 to 250237 to 243
Nonparticipant*
220-236
245
240
238
247
253
261
254
257
253
253
248
248
252
254 251
228
228
246
249245
223220
227
231230 254
238
233
233
248246
243
240239
247241
232
Hispanic
240
258
DC=225
251 or higher
244 to 250
237 to 243
Nonparticipant*
230-236
236
233
251
241
243
238
236
241
230
232
246
234243
230231
234
241243 244
238
241
241
232237
232
239241
242242
240
Black
243
DC=233
*This category also includes states where there were too few sample cases for a reliable estimate. SOURCE: National Center for Education Statistics. (1993). Data almanac: NAEP's 1992 assessment in mathematics [CD-ROM]. Princeton, NJ: Education Testing Service [Producer]. Washington, DC: U.S. Department of Education [Distributor].
1 0 H I G H L I G H T S
T H E L E A R N I N G C U R V E 1 1
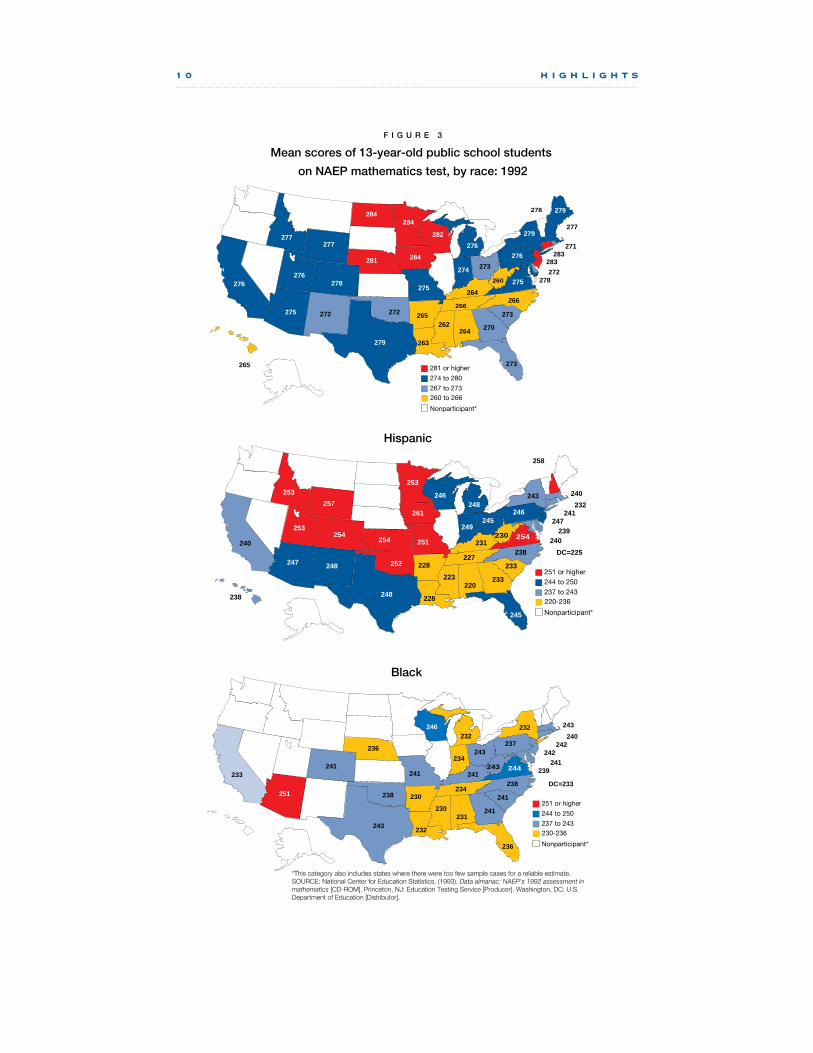
top-performing countries (Taiwan,Korea, and the former Soviet Union),and achievement in the lowest per-forming states (Arkansas, Alabama,Louisiana, and Mississippi) was aboutthe same as in the lowest performingcountry (Jordan).
Within the United States, differencesin student mathematics achievementare not simply a reflection of the con-centration of racial or ethnic groups insome regions. For example, large differ-ences in state mathematics scores existfor white and Hispanic students acrossregions and small differences exist forblack students across regions. Overall,students in the Midwest had the high-est NAEP mathematics scores, and stu-dents in the Southeast had the lowestscores. (See figure 3.)
Curriculum
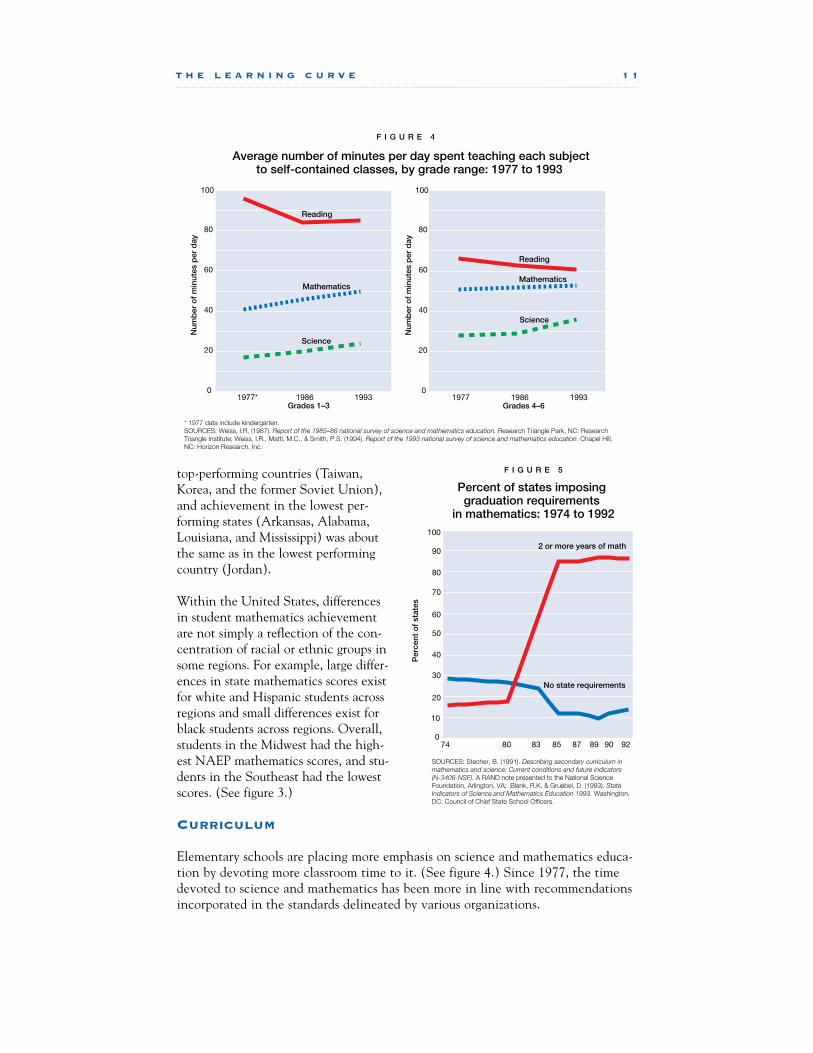
Elementary schools are placing more emphasis on science and mathematics educa-tion by devoting more classroom time to it. (See figure 4.) Since 1977, the timedevoted to science and mathematics has been more in line with recommendationsincorporated in the standards delineated by various organizations.
1977* 1986 19930
20
40
60
80
100N
umb
er o
f m
inut
es p
er d
ay
Grades 1–3
Reading
Mathematics
Science
1977 1986 19930
20
40
60
80
100
Num
ber
of
min
utes
per
day
Grades 4–6
Reading
Mathematics
Science
F I G U R E 4
Average number of minutes per day spent teaching each subject to self-contained classes, by grade range: 1977 to 1993
* 1977 data include kindergarten. SOURCES: Weiss, I.R. (1987). Report of the 1985–86 national survey of science and mathematics education. Research Triangle Park, NC: Research Triangle Institute; Weiss, I.R., Matti, M.C., & Smith, P.S. (1994). Report of the 1993 national survey of science and mathematics education. Chapel Hill, NC: Horizon Research, Inc.
740
10
20
30
40
50
60
70
80
90
100
Per
cent
of
stat
es
No state requirements
2 or more years of math
80 83 85 87 89 9290
SOURCES: Stecher, B. (1991). Describing secondary curriculum in mathematics and science: Current conditions and future indicators (N-3406-NSF). A RAND note presented to the National Science Foundation, Arlington, VA; Blank, R.K. & Gruebel, D. (1993). State Indicators of Science and Mathematics Education 1993. Washington, DC: Council of Chief State School Officers.
F I G U R E 5 Percent of states imposing graduation requirements
in mathematics: 1974 to 1992
High schools also appear to be placing more emphasis on science and mathematicseducation. Whereas 20 percent of states required high school students to complete 2or more years of mathematics in 1974, 86 percent of states had that requirement in1992. (See figure 5.) The indicators are similar for science.
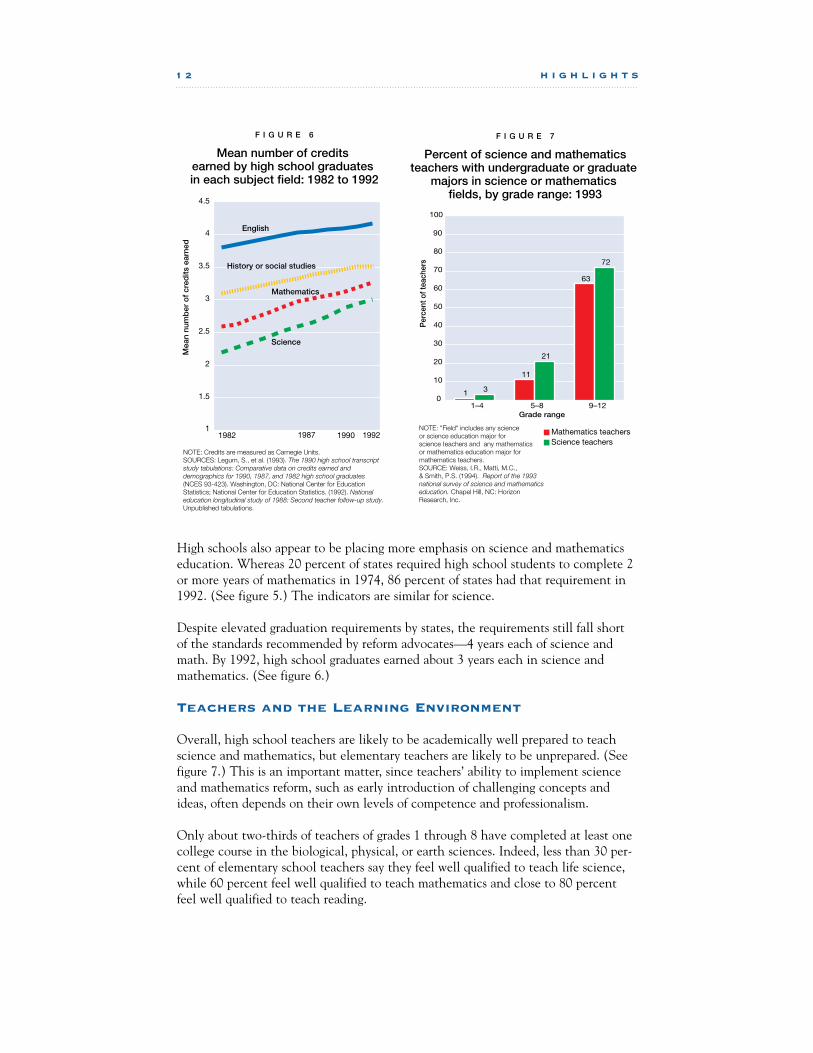
Despite elevated graduation requirements by states, the requirements still fall shortof the standards recommended by reform advocates—4 years each of science andmath. By 1992, high school graduates earned about 3 years each in science andmathematics. (See figure 6.)
Teachers and the Learning Environment
Overall, high school teachers are likely to be academically well prepared to teachscience and mathematics, but elementary teachers are likely to be unprepared. (Seefigure 7.) This is an important matter, since teachers’ ability to implement scienceand mathematics reform, such as early introduction of challenging concepts andideas, often depends on their own levels of competence and professionalism.
Only about two-thirds of teachers of grades 1 through 8 have completed at least onecollege course in the biological, physical, or earth sciences. Indeed, less than 30 per-cent of elementary school teachers say they feel well qualified to teach life science,while 60 percent feel well qualified to teach mathematics and close to 80 percentfeel well qualified to teach reading.
1 2 H I G H L I G H T S
1982 1987 1990 19921
1.5
2
2.5
3
3.5
4
4.5
English
Mathematics
Science
History or social studies
F I G U R E 6
Mean number of credits earned by high school graduates in each subject field: 1982 to 1992
NOTE: Credits are measured as Carnegie Units. SOURCES: Legum, S., et al. (1993). The 1990 high school transcript study tabulations: Comparative data on credits earned and demographics for 1990, 1987, and 1982 high school graduates (NCES 93-423). Washington, DC: National Center for Education Statistics; National Center for Education Statistics. (1992). National education longitudinal study of 1988: Second teacher follow-up study. Unpublished tabulations.
Mea
n nu
mb
er o
f cr
edits
ear
ned
1–4 5–8 9–120
10
20
30
40
50
60
70
80
Per
cent
of t
each
ers
Grade range
1 3
11
21
63
72
Science teachersMathematics teachers
F I G U R E 7
Percent of science and mathematics teachers with undergraduate or graduate
majors in science or mathematics fields, by grade range: 1993
NOTE: "Field" includes any science or science education major for science teachers and any mathematics or mathematics education major for mathematics teachers. SOURCE: Weiss, I.R., Matti, M.C., & Smith, P.S. (1994). Report of the 1993 national survey of science and mathematics education. Chapel Hill, NC: Horizon Research, Inc.
90
100
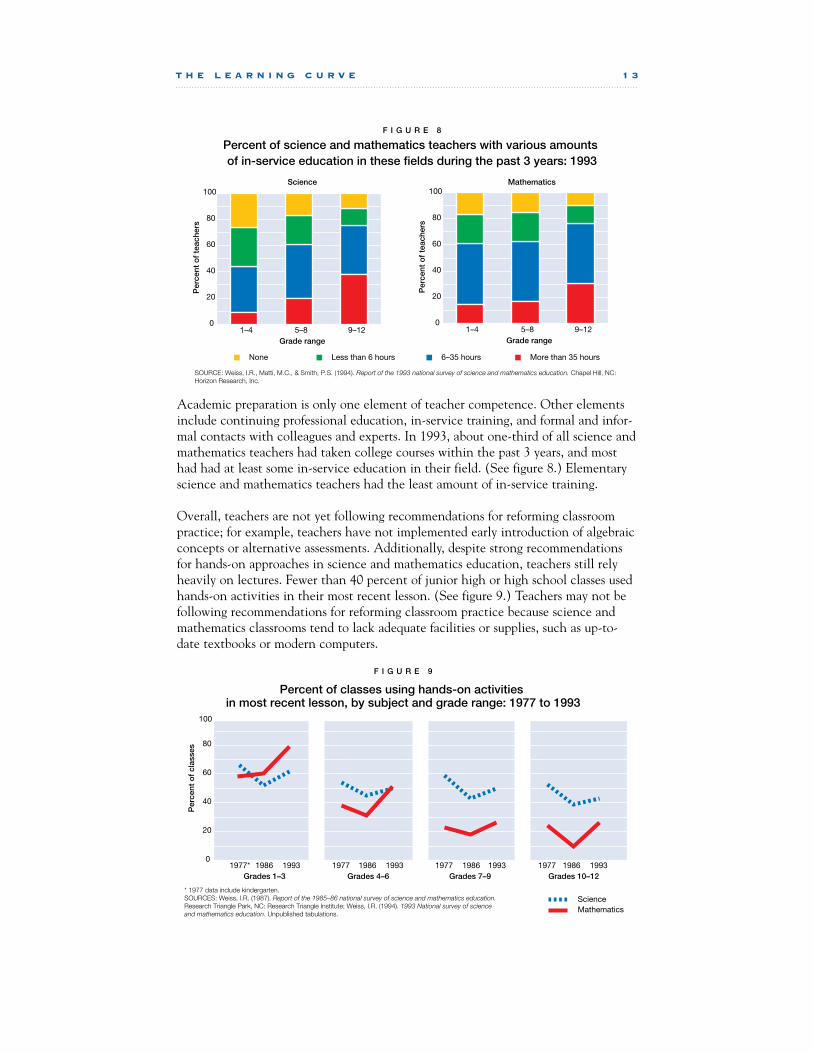
Academic preparation is only one element of teacher competence. Other elementsinclude continuing professional education, in-service training, and formal and infor-mal contacts with colleagues and experts. In 1993, about one-third of all science andmathematics teachers had taken college courses within the past 3 years, and mosthad had at least some in-service education in their field. (See figure 8.) Elementaryscience and mathematics teachers had the least amount of in-service training.
Overall, teachers are not yet following recommendations for reforming classroompractice; for example, teachers have not implemented early introduction of algebraicconcepts or alternative assessments. Additionally, despite strong recommendationsfor hands-on approaches in science and mathematics education, teachers still relyheavily on lectures. Fewer than 40 percent of junior high or high school classes usedhands-on activities in their most recent lesson. (See figure 9.) Teachers may not befollowing recommendations for reforming classroom practice because science andmathematics classrooms tend to lack adequate facilities or supplies, such as up-to-date textbooks or modern computers.
T H E L E A R N I N G C U R V E 1 3
1–4 5–8 9–120
20
40
60
80
100P
erce
nt o
f te
ache
rs
Grade range
More than 35 hours6–35 hoursLess than 6 hoursNone
1–4 5–8 9–120
20
40
60
80
100
Per
cent
of
teac
hers
Grade range
Science Mathematics
SOURCE: Weiss, I.R., Matti, M.C., & Smith, P.S. (1994). Report of the 1993 national survey of science and mathematics education. Chapel Hill, NC: Horizon Research, Inc.
F I G U R E 8
Percent of science and mathematics teachers with various amounts of in-service education in these fields during the past 3 years: 1993
0
20
40
60
80
Per
cent
of
clas
ses
Grades 1–3
ScienceMathematics
1977* 1986 1993 1977 1986 1993 1977 1986 1993 1977 1986 1993Grades 4–6 Grades 7–9 Grades 10–12
* 1977 data include kindergarten. SOURCES: Weiss, I.R. (1987). Report of the 1985–86 national survey of science and mathematics education. Research Triangle Park, NC: Research Triangle Institute; Weiss, I.R. (1994). 1993 National survey of science and mathematics education. Unpublished tabulations.
F I G U R E 9
Percent of classes using hands-on activities in most recent lesson, by subject and grade range: 1977 to 1993
100
Equity
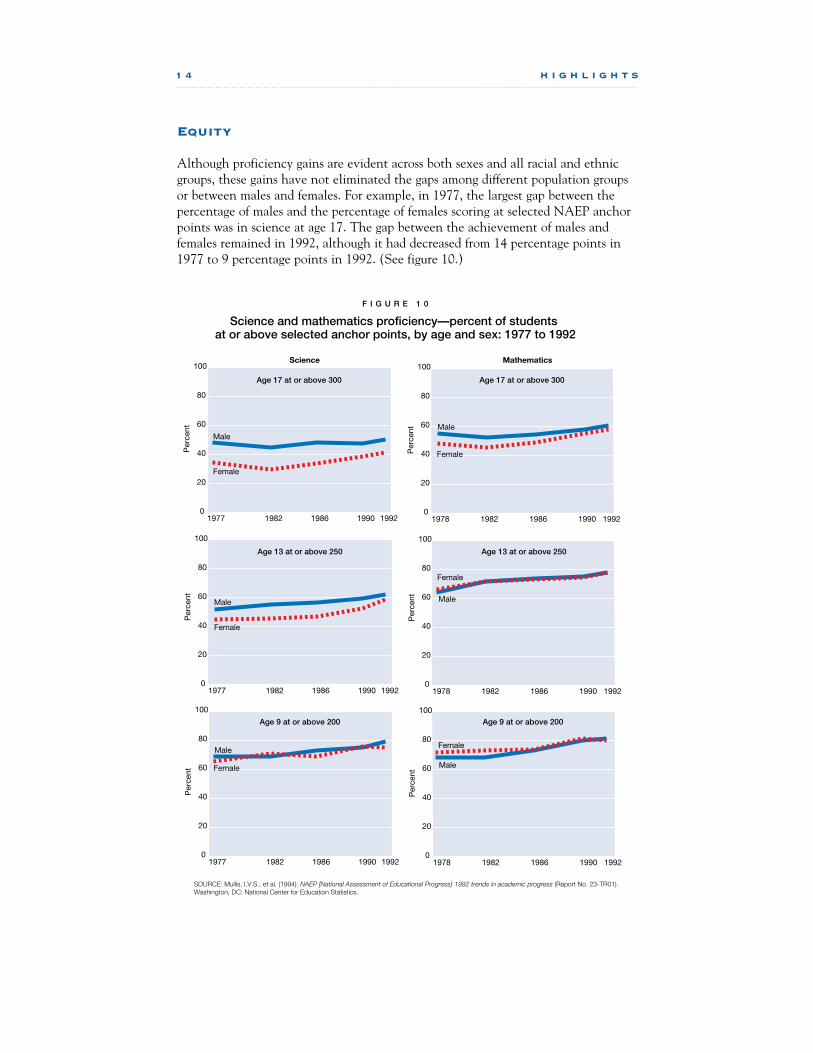
Although proficiency gains are evident across both sexes and all racial and ethnicgroups, these gains have not eliminated the gaps among different population groupsor between males and females. For example, in 1977, the largest gap between thepercentage of males and the percentage of females scoring at selected NAEP anchorpoints was in science at age 17. The gap between the achievement of males andfemales remained in 1992, although it had decreased from 14 percentage points in1977 to 9 percentage points in 1992. (See figure 10.)
1 4 H I G H L I G H T S
1977 1982 1986 1990 19920
20
40
60
80
100
Per
cent
Age 17 at or above 300
Male
Female
Science
1978 1982 1986 1990 19920
20
40
60
80
100
Per
cent
Age 17 at or above 300
Mathematics
Female
Male
F I G U R E 1 0
Science and mathematics proficiency—percent of students at or above selected anchor points, by age and sex: 1977 to 1992
1977 1982 1986 1990 19920
20
40
60
80
100
Per
cent
Age 13 at or above 250
Male
Female
1978 1982 1986 1990 19920
20
40
60
80
100
Per
cent
Age 13 at or above 250
Female
Male
1977 1982 1986 1990 19920
20
40
60
80
100
Per
cent
Age 9 at or above 200
Male
Female
1978 1982 1986 1990 19920
20
40
60
80
100
Per
cent
Female
Male
SOURCE: Mullis, I.V.S., et al. (1994). NAEP [National Assessment of Educational Progress} 1992 trends in academic progress (Report No. 23-TR01). Washington, DC: National Center for Education Statistics.
Age 9 at or above 200
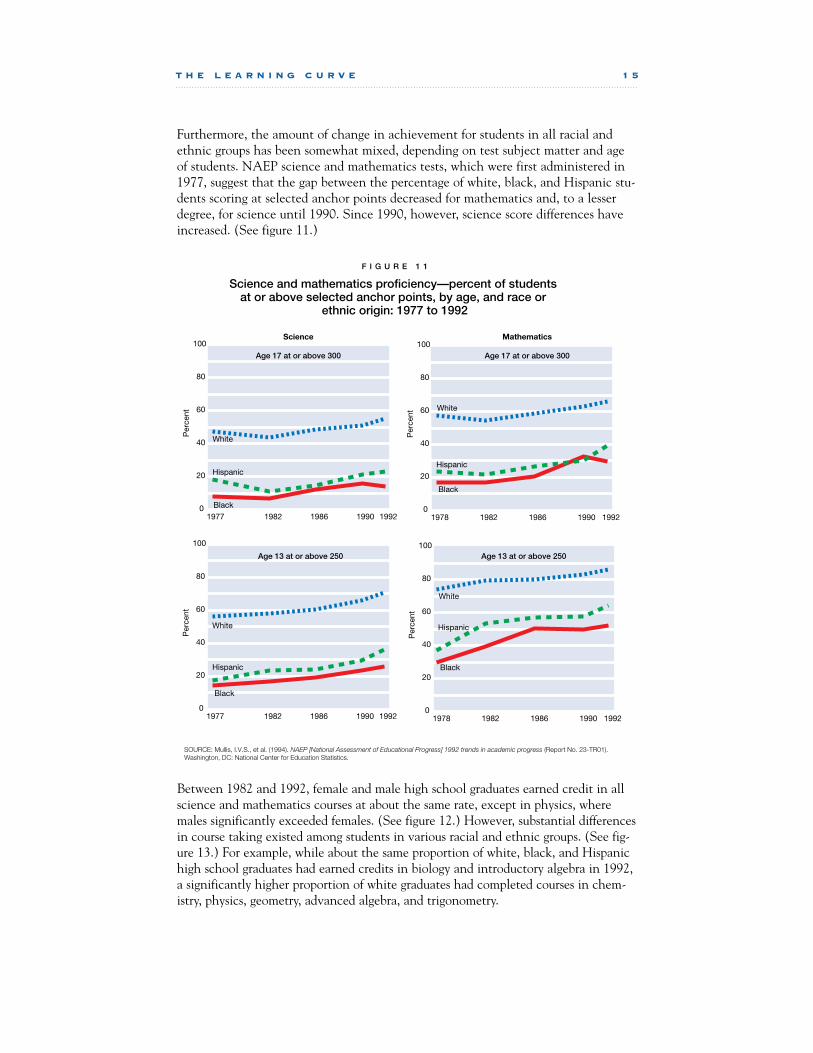
Furthermore, the amount of change in achievement for students in all racial andethnic groups has been somewhat mixed, depending on test subject matter and ageof students. NAEP science and mathematics tests, which were first administered in1977, suggest that the gap between the percentage of white, black, and Hispanic stu-dents scoring at selected anchor points decreased for mathematics and, to a lesserdegree, for science until 1990. Since 1990, however, science score differences haveincreased. (See figure 11.)
Between 1982 and 1992, female and male high school graduates earned credit in allscience and mathematics courses at about the same rate, except in physics, wheremales significantly exceeded females. (See figure 12.) However, substantial differencesin course taking existed among students in various racial and ethnic groups. (See fig-ure 13.) For example, while about the same proportion of white, black, and Hispanichigh school graduates had earned credits in biology and introductory algebra in 1992,a significantly higher proportion of white graduates had completed courses in chem-istry, physics, geometry, advanced algebra, and trigonometry.
T H E L E A R N I N G C U R V E 1 5
1977 1982 1986 1990 19920
20
40
60
80
100
Per
cent
Age 17 at or above 300
White
Black
Hispanic
Science
1977 1982 1986 1990 19920
20
40
60
80
100
Per
cent
Age 13 at or above 250
White
Black
Hispanic
1978 1982 1986 1990 19920
20
40
60
80
100
Per
cent
Age 17 at or above 300
Mathematics
Black
Hispanic
White
1978 1982 1986 1990 19920
20
40
60
80
100
Per
cent
Age 13 at or above 250
Black
Hispanic
White
SOURCE: Mullis, I.V.S., et al. (1994). NAEP [National Assessment of Educational Progress] 1992 trends in academic progress (Report No. 23-TR01). Washington, DC: National Center for Education Statistics.
F I G U R E 1 1
Science and mathematics proficiency—percent of students at or above selected anchor points, by age, and race or
ethnic origin: 1977 to 1992

1 6 H I G H L I G H T S
NOTE: Credits are measured in Carnegie Units SOURCES: Legum, S., et al. (1993). The 1990 high school transcript study tabulations: Comparative data on credits earned and demographics for 1990, 1987, and 1982 high school graduates (NCES 93-423). Washington, DC: National Center for Education Statistics; National Center for Education Statistics. (1992). National education longitudinal study transcripts. Washington, DC: Author.
1982 1987 1990 19920
20
40
60
80
100
Male Female
Geometry
Algebra II
Trigonometry
Calculus
Per
cent
Mathematics
F I G U R E 1 2
Percent of high school graduates earning credits in science and mathematics courses, by subject and sex: 1982 to 1992
1982 1987 1990 1992
Male Female
Biology
Chemistry
Physics
Science
0
20
40
60
80
100P
erce
nt
0
20
40
60
80
100
Per
cent
of
gra
dua
tes
F I G U R E 1 3
Percent of high school graduates earning credits in science and mathematics courses, by race or ethnic origin: 1982 to 1992
Any science Biology
Chemistry
Physics
82 87 90 92 82 87 90 92 82 87 90 92 82 87 90 92
0
20
40
60
80
100
Per
cent
of
gra
dua
tes Algebra I
Geometry
Algebra II
Trigonometry
WhiteBlackHispanic
NOTE: Credits are measured in Carnegie Units. SOURCES: Legum, S., et al. (1993). The 1990 high school transcript study tabulations: Comparative data on credits earned and demographics for 1990, 1987, and 1982 high school graduates (NCES 93-423). Washington, DC: National Center for Education Statistics; Smith, T.M., et al. (1994). The condition of education, 1994 (NCES 94-149). Washington, DC: National Center for Education Statistics.
82 87 90 92 82 87 90 92 82 87 90 92 82 87 90 92
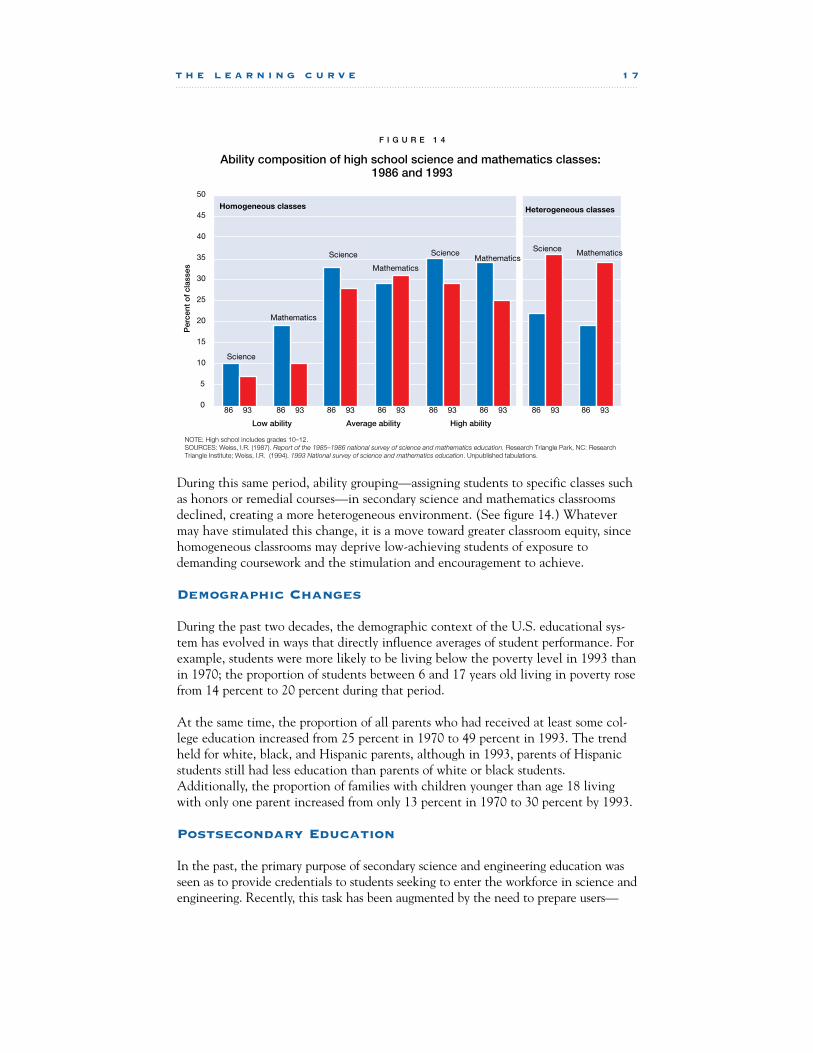
F I G U R E 1 4
Ability composition of high school science and mathematics classes: 1986 and 1993
NOTE: High school includes grades 10–12. SOURCES: Weiss, I.R. (1987). Report of the 1985–1986 national survey of science and mathematics education. Research Triangle Park, NC: Research Triangle Institute; Weiss, I.R. (1994). 1993 National survey of science and mathematics education. Unpublished tabulations.
Science
Mathematics
Science
Mathematics
Science Science Mathematics
0
5
10
15
20
25
30
35
40
45
50
Low ability
86
High abilityAverage ability
Heterogeneous classes
Per
cent
of
clas
ses
Homogeneous classes
93 86 93 86 93 86 93 86 93 86 93 86 93 86 93
Mathematics
During this same period, ability grouping—assigning students to specific classes suchas honors or remedial courses—in secondary science and mathematics classroomsdeclined, creating a more heterogeneous environment. (See figure 14.) Whatevermay have stimulated this change, it is a move toward greater classroom equity, sincehomogeneous classrooms may deprive low-achieving students of exposure todemanding coursework and the stimulation and encouragement to achieve.
Demographic Changes
During the past two decades, the demographic context of the U.S. educational sys-tem has evolved in ways that directly influence averages of student performance. Forexample, students were more likely to be living below the poverty level in 1993 thanin 1970; the proportion of students between 6 and 17 years old living in poverty rosefrom 14 percent to 20 percent during that period.
At the same time, the proportion of all parents who had received at least some col-lege education increased from 25 percent in 1970 to 49 percent in 1993. The trendheld for white, black, and Hispanic parents, although in 1993, parents of Hispanicstudents still had less education than parents of white or black students.Additionally, the proportion of families with children younger than age 18 livingwith only one parent increased from only 13 percent in 1970 to 30 percent by 1993.
Postsecondary Education
In the past, the primary purpose of secondary science and engineering education wasseen as to provide credentials to students seeking to enter the workforce in science andengineering. Recently, this task has been augmented by the need to prepare users—
T H E L E A R N I N G C U R V E 1 7
F I G U R E 1 4
Ability composition of high school science and mathematics classes: 1986 and 1993
NOTE: High school includes grades 10–12. SOURCES: Weiss, I.R. (1987). Report of the 1985–1986 national survey of science and mathematics education. Research Triangle Park, NC: Research Triangle Institute; Weiss, I.R. (1994). 1993 National survey of science and mathematics education. Unpublished tabulations.
Science
Mathematics
Science
Mathematics
Science Science Mathematics
0
5
10
15
20
25
30
35
40
45
50
Low ability
86
High abilityAverage ability
Heterogeneous classes
Per
cent
of
clas
ses
Homogeneous classes
93 86 93 86 93 86 93 86 93 86 93 86 93 86 93
Mathematics
future professionals and managers—for aworkplace transformed by scientific andtechnological innovations.
As the value of postsecondary educa-tion has increased across all sectors ofthe economy, the percentage of highschool students aspiring to obtain abachelor’s, or higher, degree hasincreased dramatically, regardless of sex,race, or ethnic origin. (See figure 15.)
During the 1980s, despite decreases inthe population of college-age youth,the number of bachelor’s degree recipi-ents increased markedly. The numberof science and engineering bachelor’sdegree recipients also increased,although not as notably. However,compared with nations such as Japan,South Korea, and Germany, the United
1 8 H I G H L I G H T S
Mathematical sciences
Computer sciences
Physical sciences
Biological sciences
NATURAL SCIENCES AND ENGINEERING
Business
ENGINEERING
History or political science
Education
Fine arts
SOCIAL AND BEHAVIORAL SCIENCES
English
0 10 20 30 40 50 60 70 80 90 100
Percent of students
63
54
51
51
44
41
38
35
32
30
28
15
37
46
49
49
56
60
62
65
68
70
72
85
Moved to other group of majors Remained in same or like major
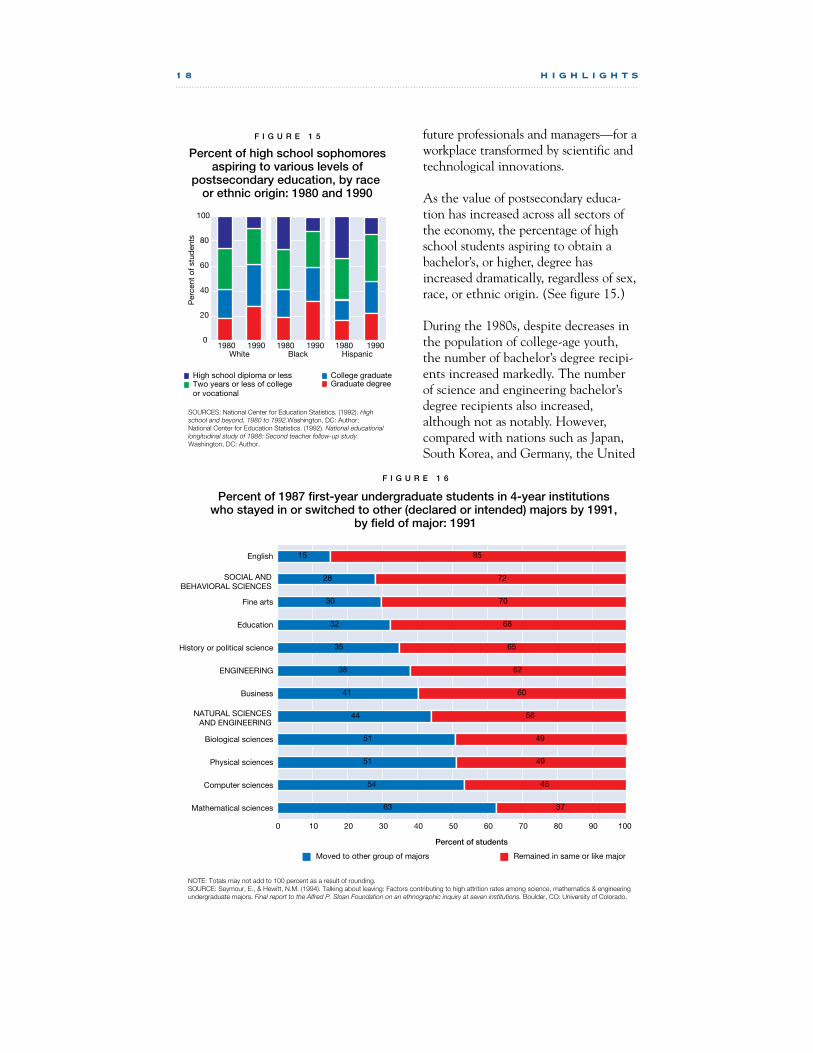
F I G U R E 1 6
Percent of 1987 first-year undergraduate students in 4-year institutions who stayed in or switched to other (declared or intended) majors by 1991,
by field of major: 1991
NOTE: Totals may not add to 100 percent as a result of rounding. SOURCE: Seymour, E., & Hewitt, N.M. (1994). Talking about leaving: Factors contributing to high attrition rates among science, mathematics & engineering undergraduate majors. Final report to the Alfred P. Sloan Foundation on an ethnographic inquiry at seven institutions. Boulder, CO: University of Colorado.
19800
20
40
60
80
100
Per
cent
of s
tud
ents
Graduate degreeCollege graduate
Two years or less of college or vocational
High school diploma or less
1990 1980 1990 1980 1990White Black Hispanic
F I G U R E 1 5
Percent of high school sophomores aspiring to various levels of
postsecondary education, by race or ethnic origin: 1980 and 1990
SOURCES: National Center for Education Statistics. (1992). High school and beyond, 1980 to 1992.Washington, DC: Author; National Center for Education Statistics. (1992). National educational longitudinal study of 1988: Second teacher follow-up study. Washington, DC: Author.

States graduates significantly fewer persons with first degrees in natural sciences andengineering.
The slow growth in science and engineering degrees conferred in the United Statesmay be partially attributed to “major switching,” which is more prevalent for scienceand engineering majors than for any other major. (See figure 16.) While 28 percentof male and 10 percent of female high school seniors planned to major in one of thescience or engineering fields, by the time they were college seniors, only 11 percent ofmales and 4 percent of females actually completed the major.
Another explanation for the slow rate of growth in science and engineering fieldsmay be the lack of female and minority participation. Females constituted 54 per-cent of all bachelor’s degree recipients in 1991, yet they earned only 44 percent ofall bachelor’s degrees in science and engineering. (See figure 17.)
Between 1971 and 1991, graduate degrees in science and engineering increased at afaster rate than at the bachelor’s level. By 1991, doctorates in science and engineer-ing constituted almost two-thirds of all doctorates granted in the United States.Universities awarded about 22,000, or 39 percent, more science and engineeringmaster’s degrees in 1991 than in 1971 and about 4,500, or 23 percent, more scienceand engineering doctoral degrees. (See figure 18.)
T H E L E A R N I N G C U R V E 1 9
77 79 81 83 85 87 89 910
100,000
200,000
300,000
400,000
500,000
600,000
Num
ber
of
bac
helo
r's
deg
rees
All bachelor's degrees
Male
Female
Male
Female
Science and engineering bachelor's degrees
SOURCE: National Science Foundation. (1994). Science and engineering degrees: 1966-91 (NSF 94-305). Arlington, VA: Author.
F I G U R E 1 7
Number of bachelor's degrees awarded, by sex and major field
group: 1977 to 1991
1971 1975 1979 1983 1987 19910
50,000
100,000
150,000
200,000
250,000
300,000
350,000
Associate
Bachelor's
Master's
Doctoral
F I G U R E 1 8
Science and engineering degrees awarded, by degree level: 1971 to 1991
NOTE: Associate degree data available beginning in 1983. SOURCE: National Science Foundation. (1994). Science and engineering degrees: 1966-91 (NSF 94-305). Arlington, VA: Author.
Num
ber
of
deg
rees

Recent data reveal that equity problems prevail in the postsecondary environment asthey do in elementary and secondary education. While there has been an increase inthe number of blacks, Hispanics, and Native Americans earning bachelor’s degreesin science and engineering, all three ethnic groups remained significantly underrep-resented when compared with their presence in the total U.S. college-age popula-tion. (See figure 19.)
2 0 H I G H L I G H T S
BlackHispanicNative American
1977 1979 1981 1985 1987 1989 1990 19910
5,000
10,000
15,000
20,000
25,000
30,000
35,000
40,000
45,000N
umb
er o
f b
ache
lor'
s d
egre
es
NOTE: Persons of Hispanic origin may be of any race. SOURCE: National Science Foundation. (1994). Science and engineering degrees, by race/ethnicity of recipients: 1977-91 (NSF 94-306). Arlington, VA: Author.
F I G U R E 1 9
Science and engineering bachelor’s degrees awarded, by selected racial and ethnic groups: 1977 to 1991
Engineering Science and engineering
Natural sciences, total
Social and behavioral sciences
Non-science and -engineering, total
0
5
10
15
20
25
30
35
40
Per
cent
2.5
5.9
16.6 17.0 16.715.4
22.824.8
29.1
36.5
1987 1992
F I G U R E 2 0
Percent of full-time instructional faculty who are female, by field: Fall 1987 and Fall 1992
SOURCE: National Center for Education Statistics. (1994b). [Special tabulations from the 1993 national study of postsecondary faculty]. Unpublished data.
T H E L E A R N I N G C U R V E 2 1
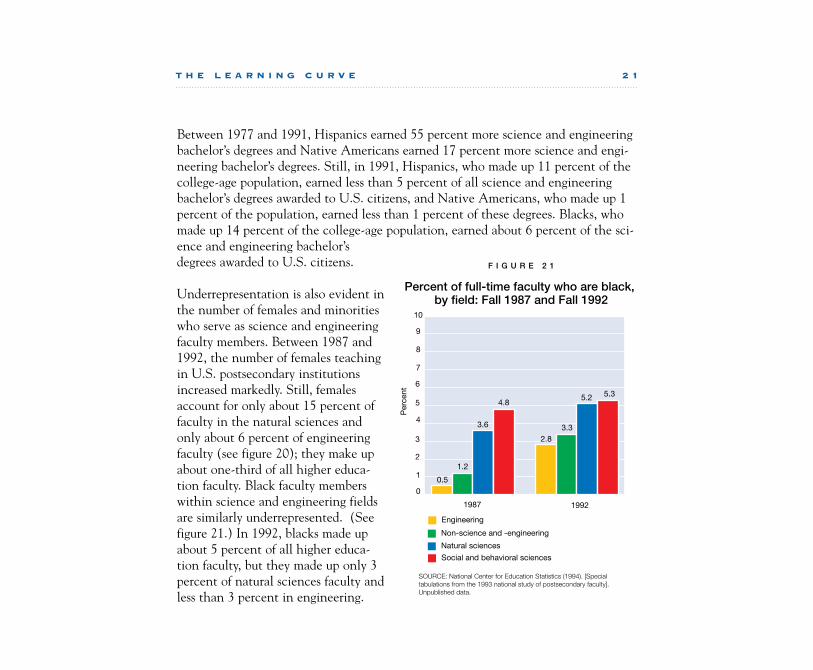
Between 1977 and 1991, Hispanics earned 55 percent more science and engineeringbachelor’s degrees and Native Americans earned 17 percent more science and engi-neering bachelor’s degrees. Still, in 1991, Hispanics, who made up 11 percent of thecollege-age population, earned less than 5 percent of all science and engineeringbachelor’s degrees awarded to U.S. citizens, and Native Americans, who made up 1percent of the population, earned less than 1 percent of these degrees. Blacks, whomade up 14 percent of the college-age population, earned about 6 percent of the sci-ence and engineering bachelor’sdegrees awarded to U.S. citizens.
Underrepresentation is also evident inthe number of females and minoritieswho serve as science and engineeringfaculty members. Between 1987 and1992, the number of females teachingin U.S. postsecondary institutionsincreased markedly. Still, femalesaccount for only about 15 percent offaculty in the natural sciences andonly about 6 percent of engineeringfaculty (see figure 20); they make upabout one-third of all higher educa-tion faculty. Black faculty memberswithin science and engineering fieldsare similarly underrepresented. (Seefigure 21.) In 1992, blacks made upabout 5 percent of all higher educa-tion faculty, but they made up only 3percent of natural sciences faculty andless than 3 percent in engineering.
1987 1992
Engineering
Natural sciences
Non-science and -engineering
Social and behavioral sciences
F I G U R E 2 1
Percent of full-time faculty who are black, by field: Fall 1987 and Fall 1992
SOURCE: National Center for Education Statistics (1994). [Special tabulations from the 1993 national study of postsecondary faculty]. Unpublished data.
0
1
2
3
4
5
6
7
8
9
10
Per
cent
0.5
1.2
3.6
4.8
2.83.3
5.2 5.3
Toward The Future
A lthough the syntheses of available statistics presented above, along with theabundance of additional data published in the full report, provide signifi-cant insights into the evolution of U.S. science and mathematics education
over the past two decades, many elusive questions remain. It is becoming increasinglyclear that both additional data and new types of data are needed to describe reformand its impact. For example:
◆ While available indicators reveal encouraging trends toward greater participa-tion in science and mathematics by elementary school students and increasedcourse completion and achievement by high school students, many states haveyet to match their requirements to recommended standards. What are theobstacles, and what incentives might be needed?
◆ Since 1978, advances in performance have been observable for students of allages and races; yet the pace is slow and uneven. Why is this so? What prac-tices toward achieving full equity are proving most effective? Where are theybeing implemented? Why do they succeed or fail?
◆ Why do science and mathematics students in some regions of the UnitedStates consistently perform better than students in other areas? Is there solidempirical support for the notion that demographic factors such as familyincome and level of parental education have a profound impact on studentmotivation and performance?
Review of available data also shows that critical gaps in information exist withregard to
◆ state-level indicators measuring trends in student achievement, course taking,and teaching methods;
◆ data on science and mathematics course taking and content in higher educa-tion institutions; and
◆ the relationship between the planned and implemented classroom curricula.
Finally, comprehensive reports from bodies such as the National Academy ofSciences and the RAND Corporation suggest additional areas that indicator systemsneed to address, including adult literacy, resources committed by governmental andnongovernmental bodies, and teachers’ knowledge.
NSF is taking steps to address these concerns and fill these gaps by supporting thedevelopment of measures of adult literacy and by considering studies to collectinformation on resources committed to science and mathematics education.However, few measures of teachers’ knowledge exist in surveys of teachers.
2 2 T O W A R D T H E F U T U R E
Long term, the Foundation must take a broader look at ways to characterize the stateof U.S. science and mathematics education. Challenges will include specifying theindicators for modification and future investigation; reviewing the frameworks thathave, thus far, provided the basis for selecting indicators; and reevaluating thesources of data that will be available for the next biennial indicators report.
Measuring systemic reform and the progress of this evolving practice will requirenew efforts with survey techniques—techniques that measure the relationshipamong more parts of the educational system, the sharing of resources, and the pub-lic’s understanding of science and mathematics education in the United States. ■
T H E L E A R N I N G C U R V E 2 3

The Foundation provides awards for research in the sciences and engineering. The
awardee is wholly responsible for the conduct of such research and preparation of the results
for publication. The Foundation, therefore, does not assume responsibility for the research
findings or their interpretation.
The Foundation welcomes proposals from all qualified scientists and engineers and
strongly encourages women, minorities, and persons with disabilities to compete fully in any
of the research and related programs described here.
In accordance with federal statutes, regulations, and NSF policies, no person on grounds
of race, color, age, sex, national origin, or disability shall be excluded from participation in,
be denied the benefits of, or be subject to discrimination under any program or activity
receiving financial assistance from the National Science Foundation.
Facilitation Awards for Scientists and Engineers with Disabilities (FASED) provide
funding for special assistance or equipment to enable persons with disabilities (investigators
and other staff, including student research assistants) to work on NSF projects. See the
program announcement or contact the program coordinator at (703) 306-1636.
Privacy Act. The information requested on proposal forms is solicited under the authority
of the National Science Foundation Act of 1950, as amended. It will be used in connection
with the selection of qualified proposals and may be disclosed to qualified reviewers and staff
assistants as part of the review process; to applicant institutions/grantees; to provide or
obtain data regarding the application review process, award decisions, or the administration
of awards; to government contractors, experts, volunteers, and researchers as necessary to
complete assigned work; and to other government agencies in order to coordinate programs.
See Systems of Records, NSF-50, Principal Investigators/Proposal File and Associated
Records, and NSF-51, 60 Federal Register 4449 (January 23, 1995). Reviewer/Proposal
File and Associated Records, 59 Federal Register 8031 (February 17, 1994). Submission
of the information is voluntary. Failure to provide full and complete information, however,
may reduce the possibility of your receiving an award.
The National Science Foundation has TDD (Telephonic Device for the Deaf) capability,
which enables individuals with hearing impairment to communicate with the Foundation about
NSF programs, employment, or general information. This number is (703) 306-0090.

BULK RATEPOSTAGE & FEES PAID
National Science FoundationPermit No. G-69
NATIONAL SCIENCE FOUNDATIONARLINGTON, VA 22230
______________OFFICIAL BUSINESS
PENALTY FOR PRIVATE USE $300
NSB 96-53