Embed Size (px)
Citation preview
April-June 2016 Outlook
The “Lean” is Warm/Hot and Dry Into Early Summer Persistence Seems Best Forecast; Enough Rain Could Keep Things “Honest”
Though El Niño continued at strong levels through March, the weather across the Rio Grande Valley did not quite match the conventional wisdom. At month’s end, rainfall will end up in the above normal category, but the event that did the job was not a typical El Niño one; similar events have occurred during any phase of the El Niño/Southern Oscillation. A second, more minor rain event that was sourced with a subtropical wave more typical of El Niño produced pockets of light to moderate rain in some Valley locations, but saved its energy from Laredo to Corpus with a combination of damaging wind, hail, and locally heavy rainfall on March 18th and 19th . Temperature, on the other hand, continued above to well above average for a second consecutive month, with departures ranging from 2.5 to more than 5°F above the 1981-2010 normal and placing many stations among their Top Ten warmest March periods. So, while El Niño – despite a projected weakening trend into early summer – remains a factor, other “puzzle pieces” may well turn spring 2016 toward a warm to hot and relatively dry season rather than the conventional wisdom forecast that suggests above average rain and leans toward below average temperature (above). Reasons for the contrary forecast are provided in the outlook that follows.
Figure 1:. Rainfall departure from normal for most of March 2016. Purple and magenta colors are 300 to 600 percent of average;
blue colors are 150 to 300 percent of average. March, one of the drier months on the calendar, averages 0.75 to 1.5 inches across the
Valley.
Outlook: Late Spring and Early Summer 2016 Using recent trends in general weather and precipitation, as well as the closest analog that includes several closely matched puzzle pieces, which include: El Niño phase and trend, Pacific-Decadal Oscillation and trend, and remarkably similar sea surface temperature anomalies (SSTA) at the end of March in each case, we are leaning our forecast toward the warm to hotter than average, and potentially drier than average, for the April through June 2016 period. For April, the mid latitude jet stream, which dictates the overall storm track, will continue to shift farther north, stretching from northern California through the central Great Plains and into the Mississippi and Ohio Valley in April. Such a pattern favors even more warming with periodic gusty southerly winds doing the work; nights and early mornings would tend to become increasingly muggy. With deep tropical moisture only available through a rogue system that somehow would dive into northern Mexico, an already dry month on average (1 to 1.5 inches area wide) would fall short, and temperatures, which normally push toward 90°F in the mid Valley during the mid-afternoon by late month, would run a few degrees higher still. The wild card, of course, is the availability of deep tropical moisture. As March 2016 showed, a singular, “one-off” event on the 8th and 9th brought more than enough rain to meet or exceed the monthly totals. And, unlike 1998, the phase of the North Atlantic Oscillation has remained persistently positive for most of this El Niño event, while 1998 was dominated by the negative phase. In transition toward summer, this could matter, but exactly how is unclear as of this writing at the end of March.
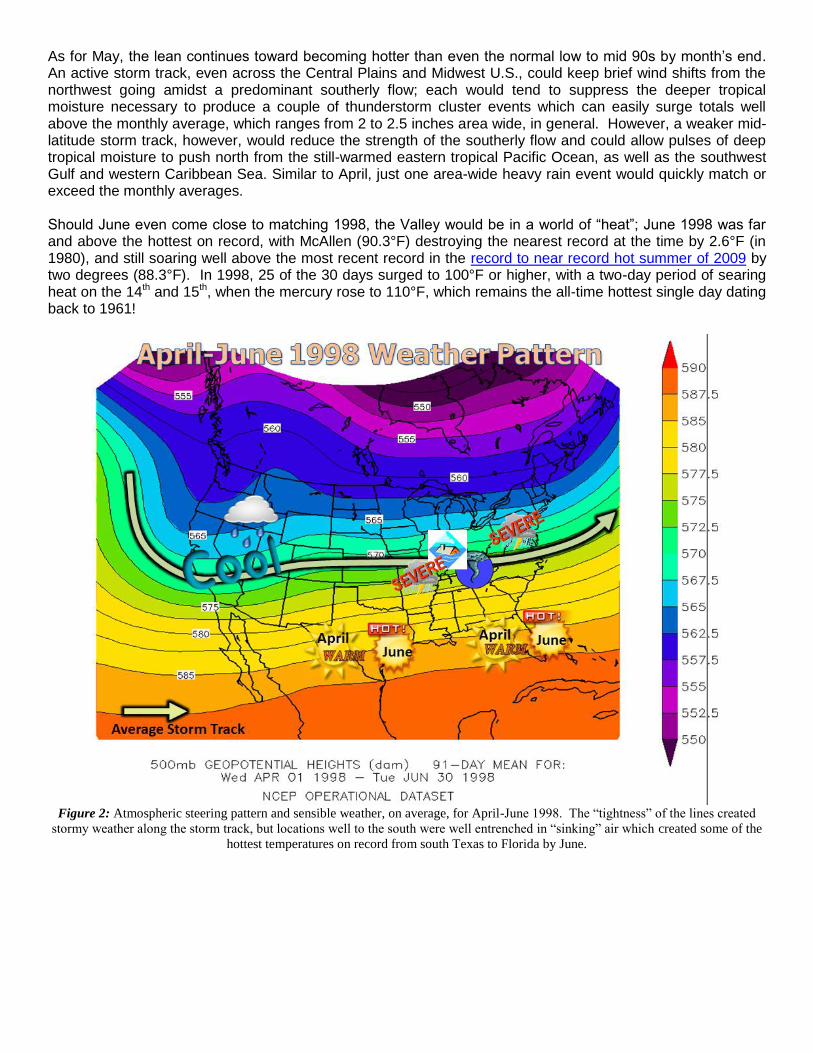
As for May, the lean continues toward becoming hotter than even the normal low to mid 90s by month’s end. An active storm track, even across the Central Plains and Midwest U.S., could keep brief wind shifts from the northwest going amidst a predominant southerly flow; each would tend to suppress the deeper tropical moisture necessary to produce a couple of thunderstorm cluster events which can easily surge totals well above the monthly average, which ranges from 2 to 2.5 inches area wide, in general. However, a weaker mid-latitude storm track, however, would reduce the strength of the southerly flow and could allow pulses of deep tropical moisture to push north from the still-warmed eastern tropical Pacific Ocean, as well as the southwest Gulf and western Caribbean Sea. Similar to April, just one area-wide heavy rain event would quickly match or exceed the monthly averages. Should June even come close to matching 1998, the Valley would be in a world of “heat”; June 1998 was far and above the hottest on record, with McAllen (90.3°F) destroying the nearest record at the time by 2.6°F (in 1980), and still soaring well above the most recent record in the record to near record hot summer of 2009 by two degrees (88.3°F). In 1998, 25 of the 30 days surged to 100°F or higher, with a two-day period of searing heat on the 14th and 15th, when the mercury rose to 110°F, which remains the all-time hottest single day dating back to 1961!
Figure 2: Atmospheric steering pattern and sensible weather, on average, for April-June 1998. The “tightness” of the lines created
stormy weather along the storm track, but locations well to the south were well entrenched in “sinking” air which created some of the
hottest temperatures on record from south Texas to Florida by June.
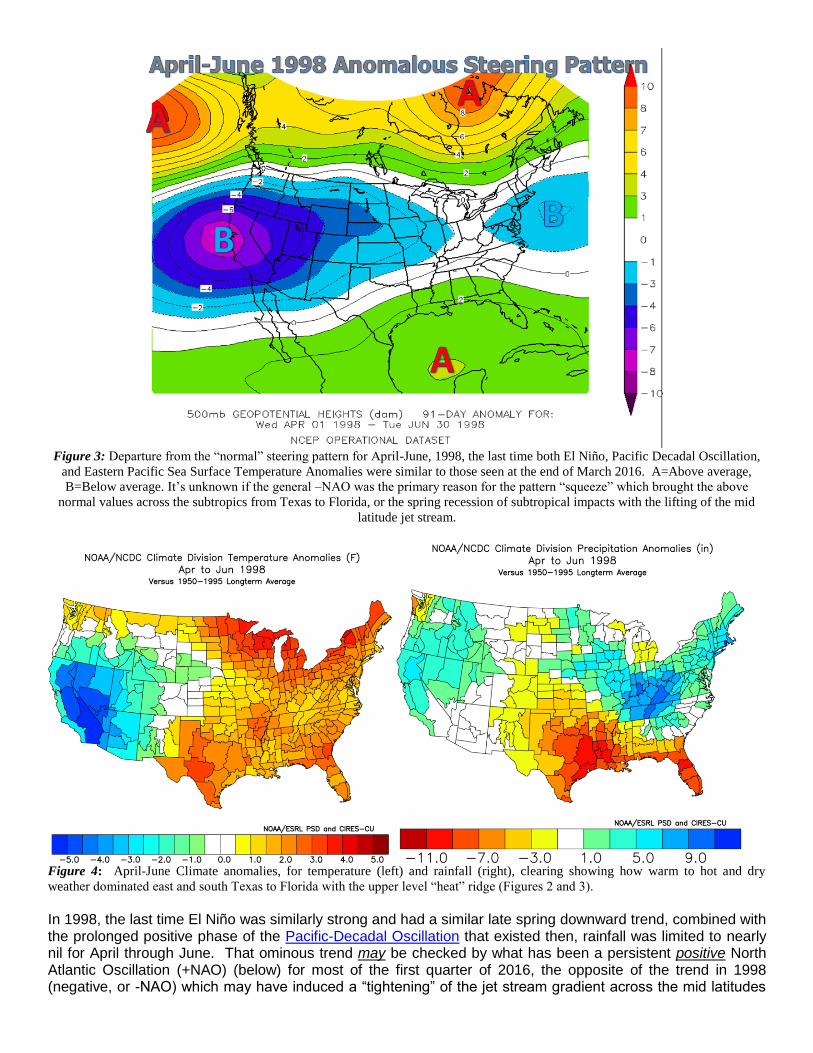
Figure 3: Departure from the “normal” steering pattern for April-June, 1998, the last time both El Niño, Pacific Decadal Oscillation,
and Eastern Pacific Sea Surface Temperature Anomalies were similar to those seen at the end of March 2016. A=Above average,
B=Below average. It’s unknown if the general –NAO was the primary reason for the pattern “squeeze” which brought the above
normal values across the subtropics from Texas to Florida, or the spring recession of subtropical impacts with the lifting of the mid
latitude jet stream.
Figure 4: April-June Climate anomalies, for temperature (left) and rainfall (right), clearing showing how warm to hot and dry
weather dominated east and south Texas to Florida with the upper level “heat” ridge (Figures 2 and 3).
In 1998, the last time El Niño was similarly strong and had a similar late spring downward trend, combined with the prolonged positive phase of the Pacific-Decadal Oscillation that existed then, rainfall was limited to nearly nil for April through June. That ominous trend may be checked by what has been a persistent positive North Atlantic Oscillation (+NAO) (below) for most of the first quarter of 2016, the opposite of the trend in 1998 (negative, or -NAO) which may have induced a “tightening” of the jet stream gradient across the mid latitudes
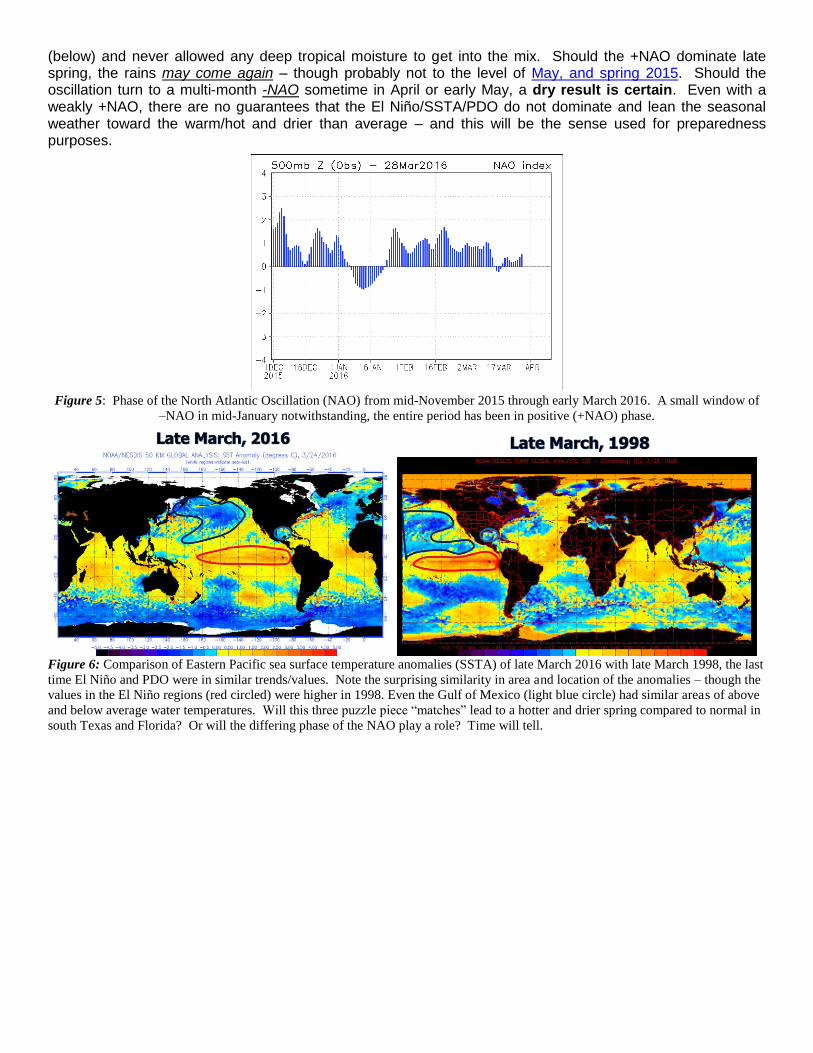
(below) and never allowed any deep tropical moisture to get into the mix. Should the +NAO dominate late spring, the rains may come again – though probably not to the level of May, and spring 2015. Should the oscillation turn to a multi-month -NAO sometime in April or early May, a dry result is certain. Even with a weakly +NAO, there are no guarantees that the El Niño/SSTA/PDO do not dominate and lean the seasonal weather toward the warm/hot and drier than average – and this will be the sense used for preparedness purposes.
Figure 5: Phase of the North Atlantic Oscillation (NAO) from mid-November 2015 through early March 2016. A small window of
–NAO in mid-January notwithstanding, the entire period has been in positive (+NAO) phase.
Figure 6: Comparison of Eastern Pacific sea surface temperature anomalies (SSTA) of late March 2016 with late March 1998, the last
time El Niño and PDO were in similar trends/values. Note the surprising similarity in area and location of the anomalies – though the
values in the El Niño regions (red circled) were higher in 1998. Even the Gulf of Mexico (light blue circle) had similar areas of above
and below average water temperatures. Will this three puzzle piece “matches” lead to a hotter and drier spring compared to normal in
south Texas and Florida? Or will the differing phase of the NAO play a role? Time will tell.
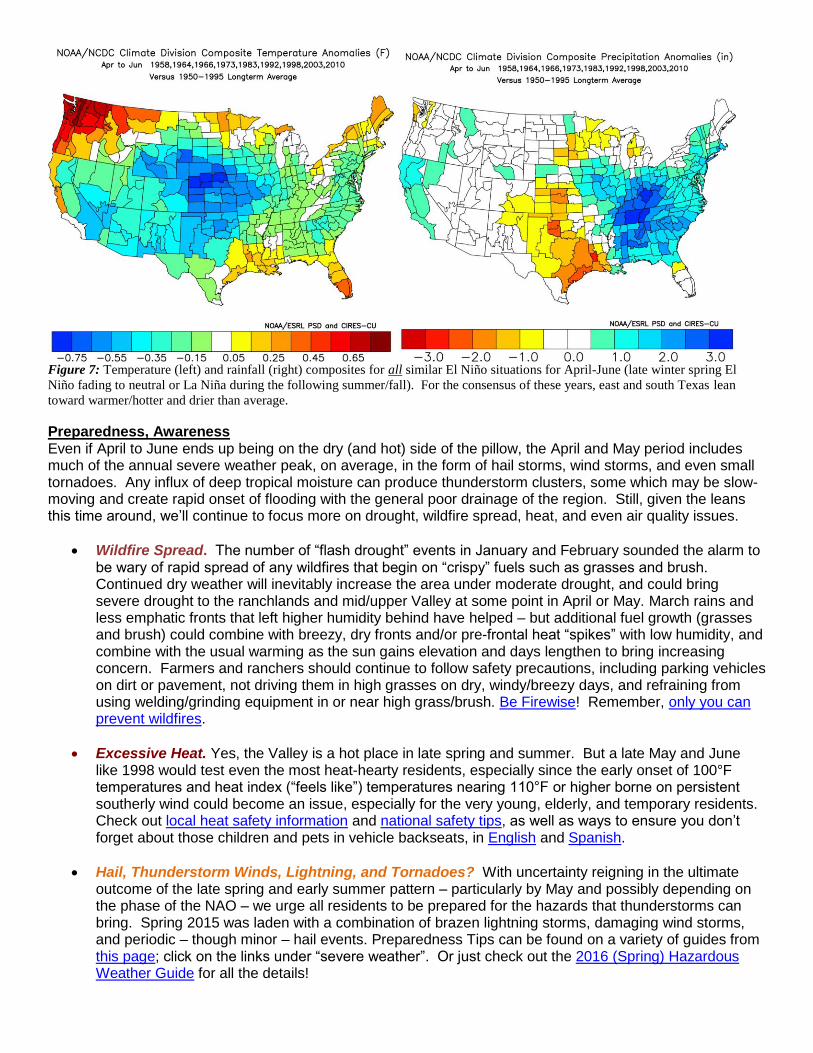
Figure 7: Temperature (left) and rainfall (right) composites for all similar El Niño situations for April-June (late winter spring El
Niño fading to neutral or La Niña during the following summer/fall). For the consensus of these years, east and south Texas lean
toward warmer/hotter and drier than average.
Preparedness, Awareness Even if April to June ends up being on the dry (and hot) side of the pillow, the April and May period includes much of the annual severe weather peak, on average, in the form of hail storms, wind storms, and even small tornadoes. Any influx of deep tropical moisture can produce thunderstorm clusters, some which may be slow-moving and create rapid onset of flooding with the general poor drainage of the region. Still, given the leans this time around, we’ll continue to focus more on drought, wildfire spread, heat, and even air quality issues.
Wildfire Spread. The number of “flash drought” events in January and February sounded the alarm to be wary of rapid spread of any wildfires that begin on “crispy” fuels such as grasses and brush. Continued dry weather will inevitably increase the area under moderate drought, and could bring severe drought to the ranchlands and mid/upper Valley at some point in April or May. March rains and less emphatic fronts that left higher humidity behind have helped – but additional fuel growth (grasses and brush) could combine with breezy, dry fronts and/or pre-frontal heat “spikes” with low humidity, and combine with the usual warming as the sun gains elevation and days lengthen to bring increasing concern. Farmers and ranchers should continue to follow safety precautions, including parking vehicles on dirt or pavement, not driving them in high grasses on dry, windy/breezy days, and refraining from using welding/grinding equipment in or near high grass/brush. Be Firewise! Remember, only you can prevent wildfires.
Excessive Heat. Yes, the Valley is a hot place in late spring and summer. But a late May and June like 1998 would test even the most heat-hearty residents, especially since the early onset of 100°F temperatures and heat index (“feels like”) temperatures nearing 110°F or higher borne on persistent southerly wind could become an issue, especially for the very young, elderly, and temporary residents. Check out local heat safety information and national safety tips, as well as ways to ensure you don’t forget about those children and pets in vehicle backseats, in English and Spanish.
Hail, Thunderstorm Winds, Lightning, and Tornadoes? With uncertainty reigning in the ultimate outcome of the late spring and early summer pattern – particularly by May and possibly depending on the phase of the NAO – we urge all residents to be prepared for the hazards that thunderstorms can bring. Spring 2015 was laden with a combination of brazen lightning storms, damaging wind storms, and periodic – though minor – hail events. Preparedness Tips can be found on a variety of guides from this page; click on the links under “severe weather”. Or just check out the 2016 (Spring) Hazardous Weather Guide for all the details!
Flooding Rain. Even if spring ends up drier than average, the possibility of one or more slow-moving torrential rain events, more than likely involving thunder and lightning, remains a concern. This could be most important during the second half of spring, all depending on the eventual atmospheric pattern. We only need to look back to April 2015 and Spring 2015 overall to remember the several cases of flooding. And, a similar slow-mover in June brings even more tropical moisture with it.
It’s always a good time to check roofs and walls for leaky areas and repair; dry periods in March and probably April will provide the opportunity. But anytime is a good time to remove any debris from gutters and downspouts. Speaking of debris - after trimming brush and cutting grass, be sure to remove it and never clog drainage ditches or canals!! More here:
o Flood Safety Awareness
Air Quality Concerns. The continuation of Mexican agricultural burning, particularly over and toward the Yucatan Peninsula, combined with an expected dominant south to southeast wind flow pattern, will likely bring anywhere from a couple to numerous cases of annoying haze and polluted air from dust and smoke that causes persons with respiratory ailments, from asthma to allergies, to have breathing difficulties. Already in March, RGV air quality edged close to “unhealthy” (132) for particulates at the start of Spring Break before a ‘norther cleaned out the air. The burning season continues through mid-May. Be prepared with particulate-blocking masks and other equipment, and be ready to spend time indoors in worse case situations. Clear/change air conditioning filters and service systems to ensure particulates are removed from the air before reaching the inside of the home. Keep tabs of the air quality conditions across Texas and U.S. at http://airnow.gov.
Tropical Tricks? As 2015’s Tropical Storm Bill and 2010’s Hurricane Alex showed, a rogue southwest Caribbean or southwest Gulf of Mexico tropical wave can fester into a tropical cyclone and potentially impact Texas during June. Bill occurred during the ramp-up to the current El Niño, while Alex formed during the rapid wind-down of the 2009/2010 El Niño. A dry April, May, and early June would be the perfect time to revisit your hurricane action plan and restock your family’s “stay” or “go” kit. Learn how with our most recent Rio Grande Valley Hurricane Guide, in English and Spanish.