Embed Size (px)
Citation preview
The Leadership Circle®and Organizational Performance
Bob Anderson
Founder, Chairman & Chief Development Officer
The Leadership Circle®
The Leadership Circle® and Organizational Performance
The Leadership Circle ©2015 | All Rights Reserved2
INTRODUCTION
In late 2005 and early 2006, The Leadership Circle undertook a major study to measure how The Leadership Circle Profile (TLCP)—a 360 degree leadership assessment—relates to business performance. This position paper provides a description of the results of the study. It assumes familiarity with TLCP. For additional information on The Leadership Circle Profile please refer to theleadershipcircle.com. See also, “The Leadership Circle Profile: Advanced Leadership Assessment Technology” (Emerald Journal of Industrial and Commercial Training, Volume 38 No4, 2006).
This paper will show that The Leadership Circle Profile dimensions are highly correlated to a measure of Leadership Effectiveness. It will also show strong and significant correlations to a measure of Business Performance. It will dramatically show how The Leadership Circle Profile graphically displays the aggregate results for those leaders whose business performance was rated best and worst. In short, this paper presents powerful evidence that changes in leadership behavior, as measured by The Leadership Circle Profile, are very likely to translate into increased leadership effectiveness and, thereby, bottom-line business performance.
METHODOLOGY
Four hundred eighty six (486) managers and executives from a wide variety of business and non- profit organizations were assessed using The Leadership Circle 360 Profile. Attached to the Profile was a Business Performance Index and a Leadership Effectiveness scale (described below) that assessors also completed. The 360 leadership behavioral results were correlated to both Leadership Effectiveness and Business Performance. The 50 business units that were most highly rated on the Business Performance Index were identified (top 10% of the sample). The 50 business units that were evaluated the lowest, using the Business Performance Index, were also identified (bottom 10% of the sample). Aggregate 360 profiles were created for both groups (top and bottom 10%). Results are displayed below on The Leadership Circle Profile graphic.
THE BUSINESS PERFORMANCE INDEX
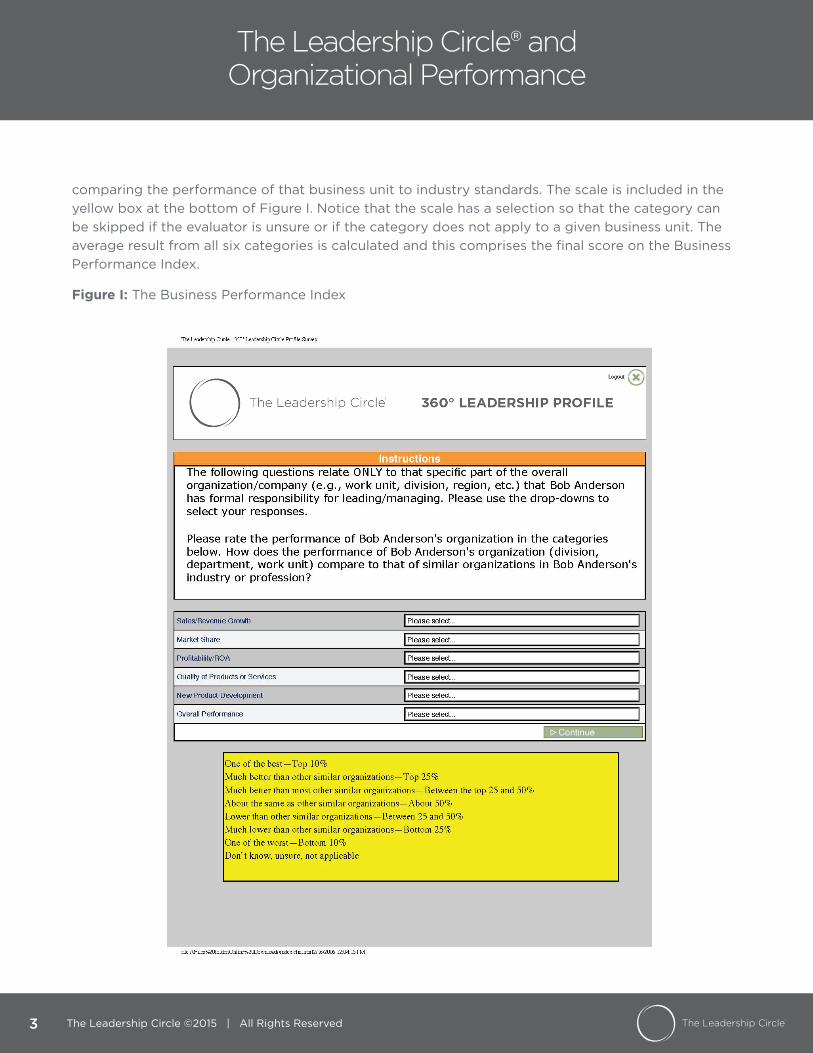
The Business Performance Index was created by The Leadership Circle and attached to TLCP. After a 360 feedback-provider has completed his/her on-line assessment of a given manager, a page comes up on his/her screen asking him/her to switch focus—from evaluating the manager’s behavior to evaluating the performance of the business unit that the manager leads. A screen- shot of this page is included in Figure I. Evaluators are asked to compare the business performance of the part of the organization that the person being evaluated manages to the performance of similar organizations. There are six categories for evaluating business performance: Sales/Revenue Growth, Market Share, Profitability/ROA, Quality of Products and Services, New Product Development, and Overall Performance. Each category has a drop-down next to it, that when selected, displays a scale for
The Leadership Circle® and Organizational Performance
The Leadership Circle ©2015 | All Rights Reserved3
comparing the performance of that business unit to industry standards. The scale is included in the yellow box at the bottom of Figure I. Notice that the scale has a selection so that the category can be skipped if the evaluator is unsure or if the category does not apply to a given business unit. The average result from all six categories is calculated and this comprises the final score on the Business Performance Index.
Figure I: The Business Performance Index
The Leadership Circle® and Organizational Performance
The Leadership Circle ©2015 | All Rights Reserved4
THE LEADERSHIP EFFECTIVENESS SCALE
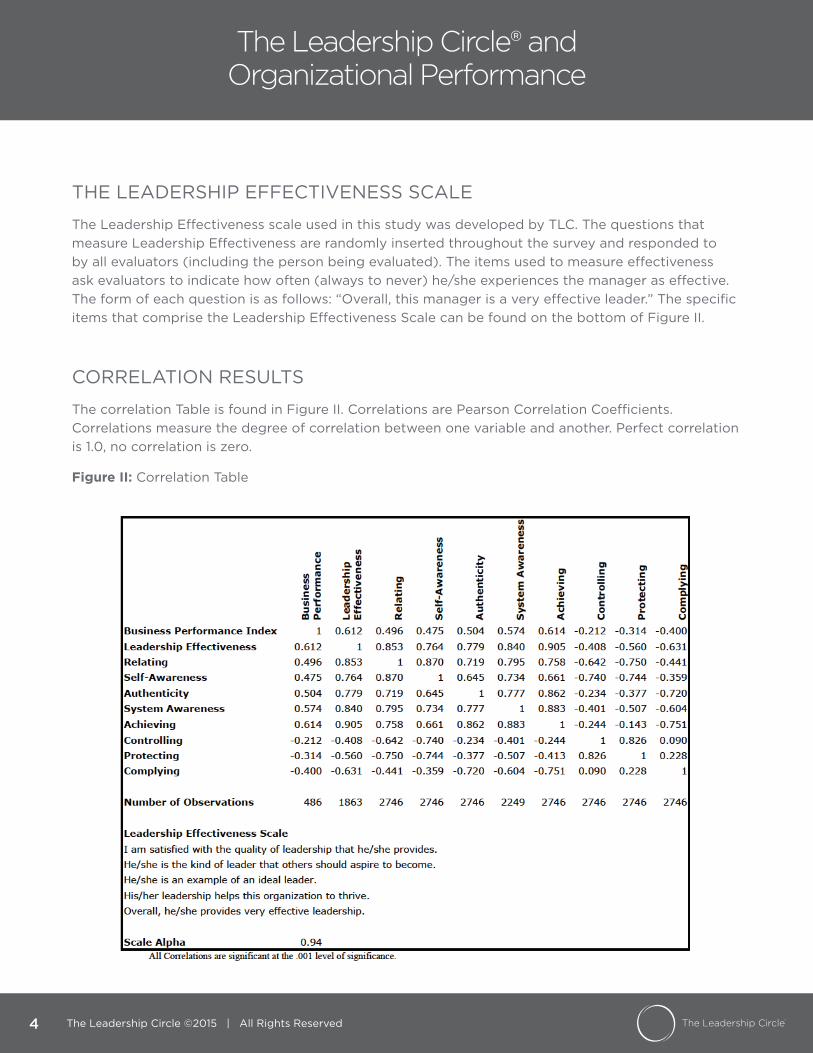
The Leadership Effectiveness scale used in this study was developed by TLC. The questions that measure Leadership Effectiveness are randomly inserted throughout the survey and responded to by all evaluators (including the person being evaluated). The items used to measure effectiveness ask evaluators to indicate how often (always to never) he/she experiences the manager as effective. The form of each question is as follows: “Overall, this manager is a very effective leader.” The specific items that comprise the Leadership Effectiveness Scale can be found on the bottom of Figure II.
CORRELATION RESULTS
The correlation Table is found in Figure II. Correlations are Pearson Correlation Coefficients. Correlations measure the degree of correlation between one variable and another. Perfect correlation is 1.0, no correlation is zero.
Figure II: Correlation Table
The Leadership Circle® and Organizational Performance
The Leadership Circle ©2015 | All Rights Reserved5
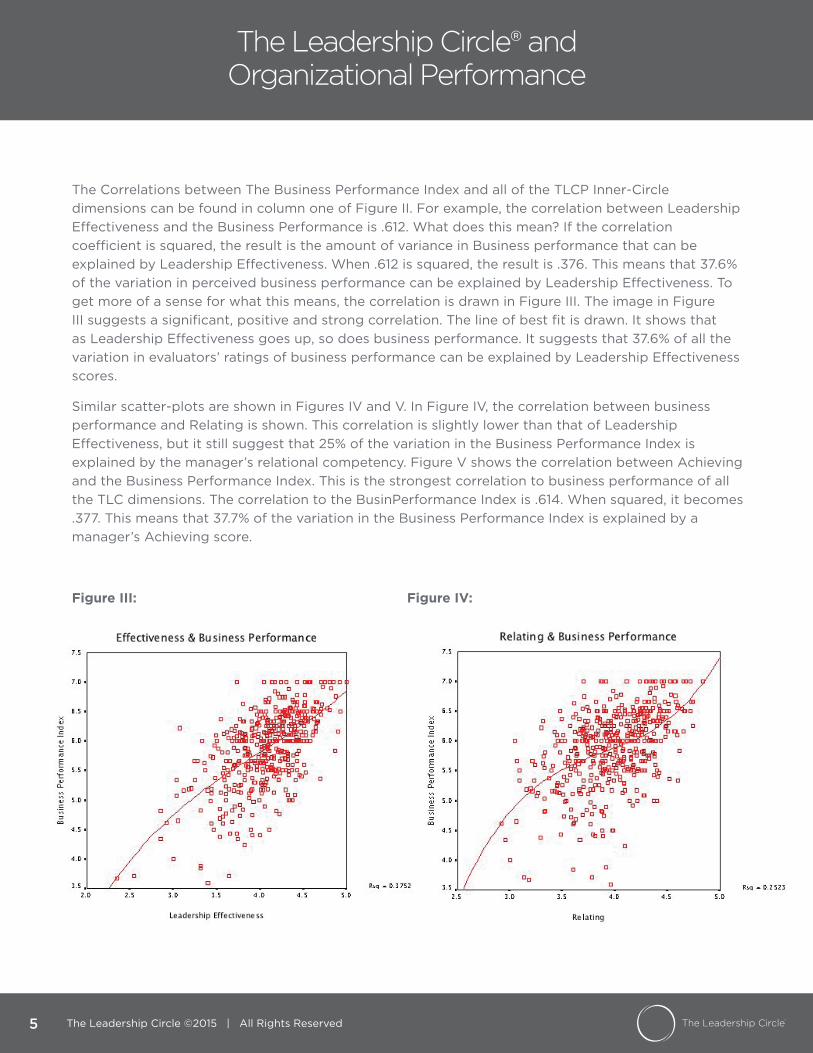
The Correlations between The Business Performance Index and all of the TLCP Inner-Circle dimensions can be found in column one of Figure II. For example, the correlation between Leadership Effectiveness and the Business Performance is .612. What does this mean? If the correlation coefficient is squared, the result is the amount of variance in Business performance that can be explained by Leadership Effectiveness. When .612 is squared, the result is .376. This means that 37.6% of the variation in perceived business performance can be explained by Leadership Effectiveness. To get more of a sense for what this means, the correlation is drawn in Figure III. The image in Figure III suggests a significant, positive and strong correlation. The line of best fit is drawn. It shows that as Leadership Effectiveness goes up, so does business performance. It suggests that 37.6% of all the variation in evaluators’ ratings of business performance can be explained by Leadership Effectiveness scores.
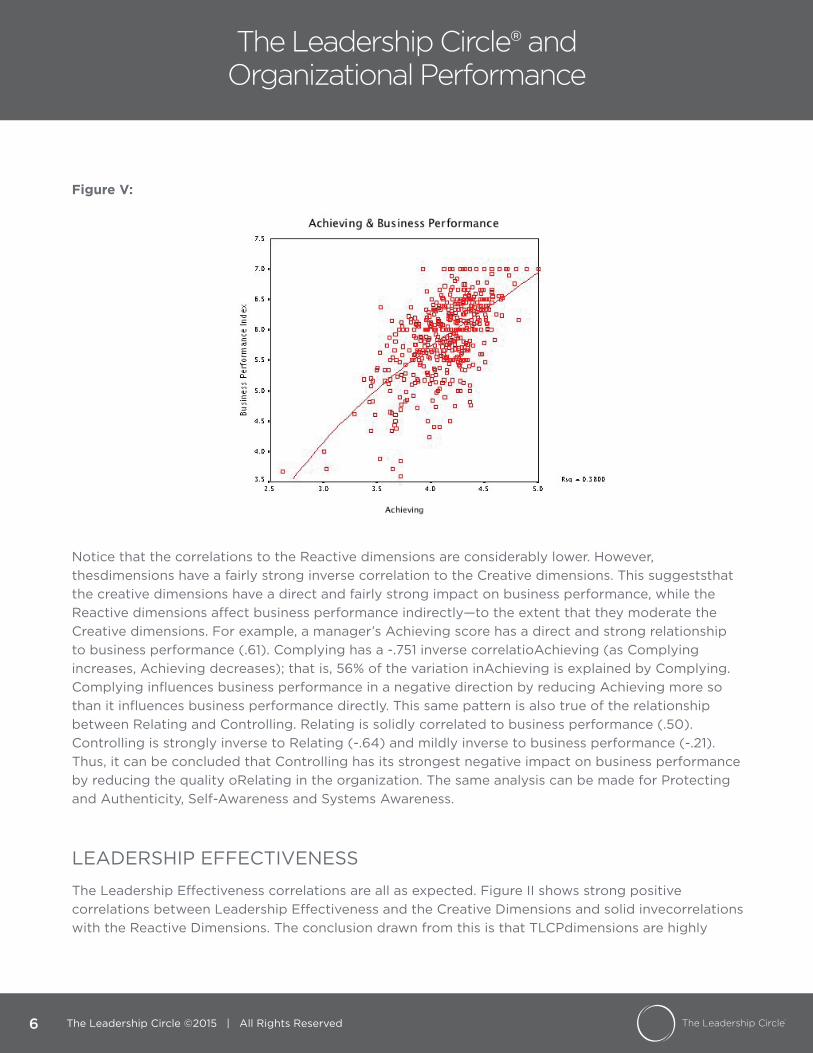
Similar scatter-plots are shown in Figures IV and V. In Figure IV, the correlation between business performance and Relating is shown. This correlation is slightly lower than that of Leadership Effectiveness, but it still suggest that 25% of the variation in the Business Performance Index is explained by the manager’s relational competency. Figure V shows the correlation between Achieving and the Business Performance Index. This is the strongest correlation to business performance of all the TLC dimensions. The correlation to the BusinPerformance Index is .614. When squared, it becomes .377. This means that 37.7% of the variation in the Business Performance Index is explained by a manager’s Achieving score.
Figure III: Figure IV:
The Leadership Circle® and Organizational Performance
The Leadership Circle ©2015 | All Rights Reserved6
Figure V:
Notice that the correlations to the Reactive dimensions are considerably lower. However, thesdimensions have a fairly strong inverse correlation to the Creative dimensions. This suggeststhat the creative dimensions have a direct and fairly strong impact on business performance, while the Reactive dimensions affect business performance indirectly—to the extent that they moderate the Creative dimensions. For example, a manager’s Achieving score has a direct and strong relationship to business performance (.61). Complying has a -.751 inverse correlatioAchieving (as Complying increases, Achieving decreases); that is, 56% of the variation inAchieving is explained by Complying. Complying influences business performance in a negative direction by reducing Achieving more so than it influences business performance directly. This same pattern is also true of the relationship between Relating and Controlling. Relating is solidly correlated to business performance (.50). Controlling is strongly inverse to Relating (-.64) and mildly inverse to business performance (-.21). Thus, it can be concluded that Controlling has its strongest negative impact on business performance by reducing the quality oRelating in the organization. The same analysis can be made for Protecting and Authenticity, Self-Awareness and Systems Awareness.
LEADERSHIP EFFECTIVENESS
The Leadership Effectiveness correlations are all as expected. Figure II shows strong positive correlations between Leadership Effectiveness and the Creative Dimensions and solid invecorrelations with the Reactive Dimensions. The conclusion drawn from this is that TLCPdimensions are highly
The Leadership Circle® and Organizational Performance
The Leadership Circle ©2015 | All Rights Reserved7
predictive of Leadership Effectiveness. Leadership Effectiveness measures have consistently been shown to correlate to actual business performance numbers at about a .40 correlation (Zenger and Folkman, 2002). These findings are consistent with the above perceived business performance data.
BEST AND WORST PROFILES
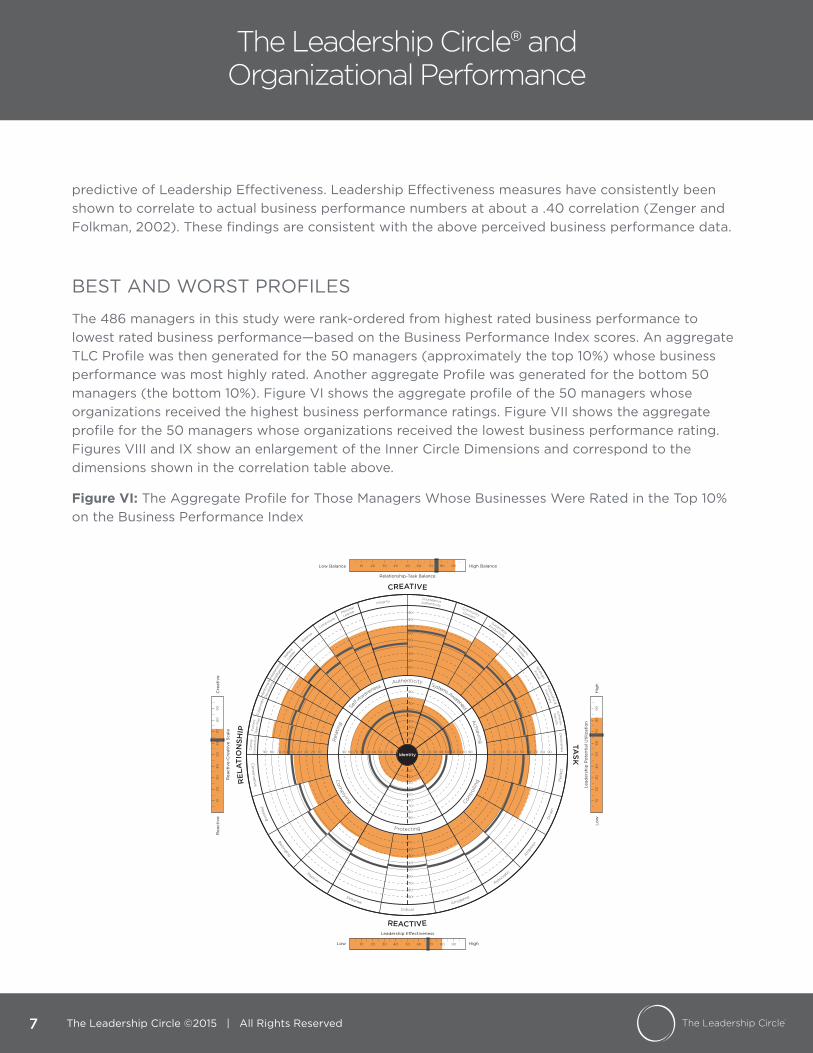
The 486 managers in this study were rank-ordered from highest rated business performance to lowest rated business performance—based on the Business Performance Index scores. An aggregate TLC Profile was then generated for the 50 managers (approximately the top 10%) whose business performance was most highly rated. Another aggregate Profile was generated for the bottom 50 managers (the bottom 10%). Figure VI shows the aggregate profile of the 50 managers whose organizations received the highest business performance ratings. Figure VII shows the aggregate profile for the 50 managers whose organizations received the lowest business performance rating. Figures VIII and IX show an enlargement of the Inner Circle Dimensions and correspond to the dimensions shown in the correlation table above.
Figure VI: The Aggregate Profile for Those Managers Whose Businesses Were Rated in the Top 10% on the Business Performance Index
The Leadership Circle® and Organizational Performance
The Leadership Circle ©2015 | All Rights Reserved8
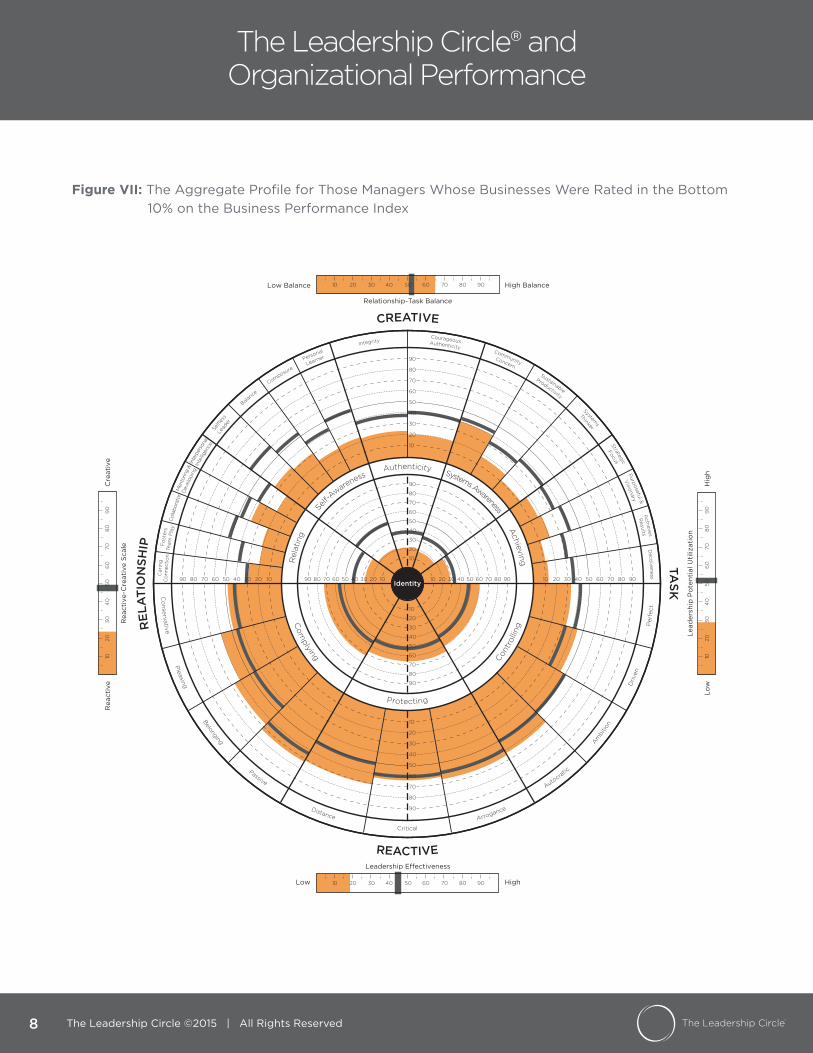
Figure VII: The Aggregate Profile for Those Managers Whose Businesses Were Rated in the Bottom 10% on the Business Performance Index
The Leadership Circle® and Organizational Performance
The Leadership Circle ©2015 | All Rights Reserved9
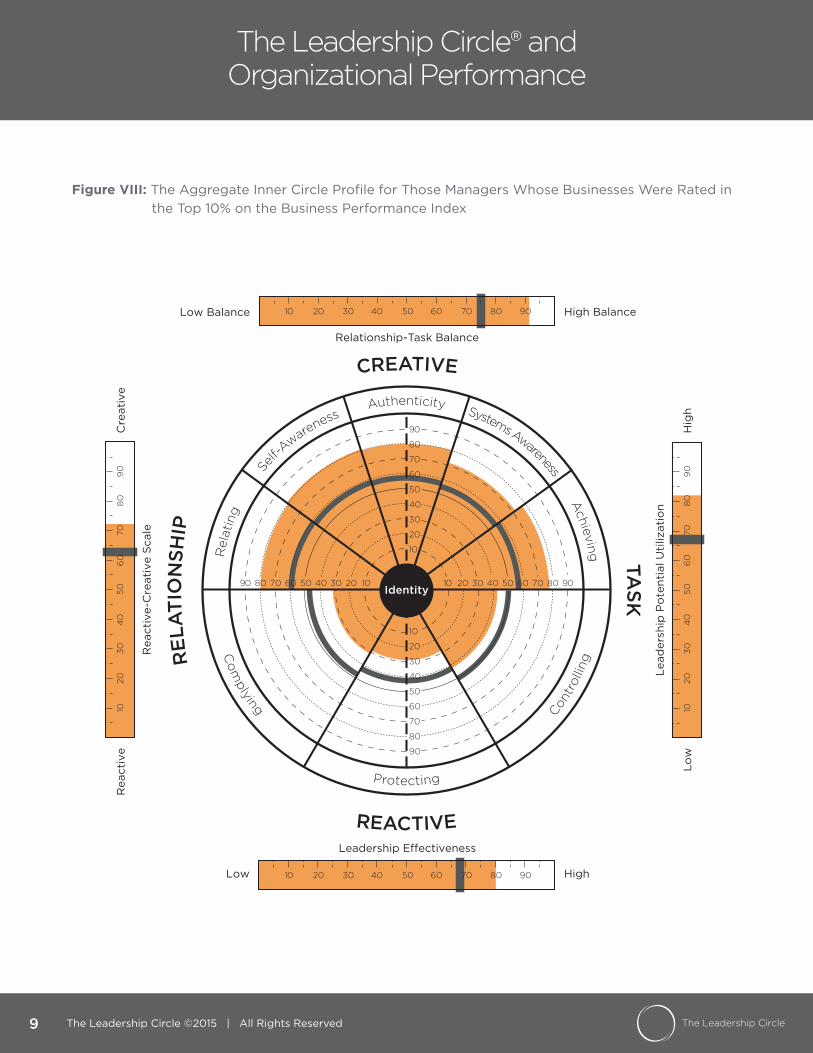
Figure VIII: The Aggregate Inner Circle Profile for Those Managers Whose Businesses Were Rated in the Top 10% on the Business Performance Index
The Leadership Circle® and Organizational Performance
The Leadership Circle ©2015 | All Rights Reserved10
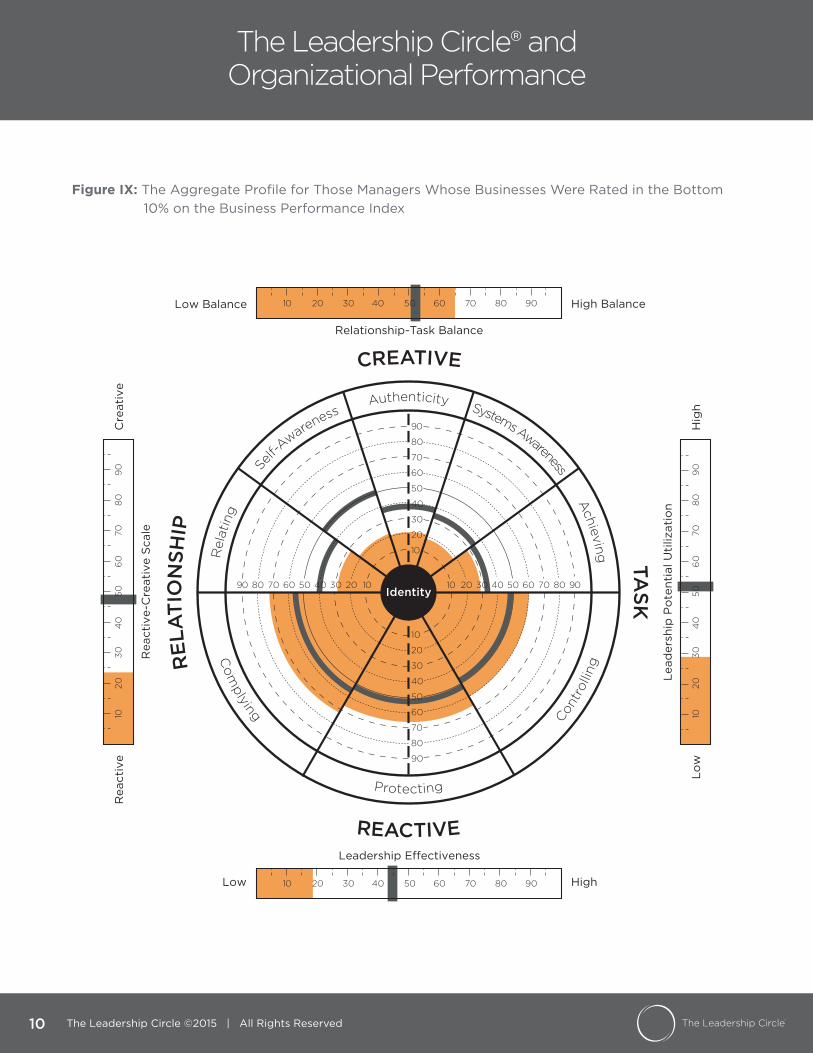
Figure IX: The Aggregate Profile for Those Managers Whose Businesses Were Rated in the Bottom 10% on the Business Performance Index
The Leadership Circle® and Organizational Performance
The Leadership Circle ©2015 | All Rights Reserved11
DISCUSSION AND CONCLUSION
The findings and analysis presented above are important for two reasons. First, this study makes a contribution to ongoing validation of the competency measures used in The Leadership Circle Profile. Second, it provides support for the new and more evocative framework for leadership development that is designed into The Leadership Circle Profile.
Based on years of validity research, The Leadership Circle Profile has been shown to reliably and consistently correlate as predicted by the theory base of the profile. This study shows the same. All of the data presented above supports the major theoretical underpinnings of The Leadership Circle Profile. All of the Inner Circle dimensions are correlated in expected directions. The Creative dimensions are highly correlated with each other and with Leadership Effectiveness. This suggests that TLCP measures a set of key competencies that are highly predictive of Effectiveness. The Reactive dimensions are inverse to the Creative dimensions and most inverse to those on the opposite side of the Circle. This suggests that the model upon which the Circle is built (see theleadershipcircle.com) is being statistically validated.
Over the past year, participants and evaluators taking TLCP have been asked to provide their assessment of the effectiveness of the leader being evaluated and the organizational performance of the business unit that person leads. These measures are external to the dimensional structure of the Profile and, thereby, correlate TLCP dimensions to ‘real-world’ measures of performance. In doing so, it is clear that the Profile is, in fact, measuring key components of Leadership Effectiveness and the relationship of those components to organizational results. These results provide answers the perennial question, “So what?” The answer to the “So what” question is that TLCP clearly measures the key leadership competencies that make a demonstrable difference in organizational effectiveness and performance. Furthermore, the Reactive dimensions, not measured by any other 360 competency tool, provide an accurate assessment of leadership assumptions and behavior that limit the leader’s effectiveness and business performance. The data suggests that Reactive dimensions indirectly impact business performance by their strongly inverse correlations to the Creative dimensions.
It is clear from these findings that Creative orientation and behavior dominate in organizations that perform well, and that Reactive orientation and behavior dominate in the poorly performing organizations. The Top 10% and Bottom 10% graphic Profiles show in a dramatic way how The Leadership Circle Profile relates to business performance as measured by the Business Performance Index. These graphics clearly suggest that as Reactive behavior grows, Creative behavior diminishes, and this has a corresponding negative impact on business performance and Leadership Effectiveness. Conversely, higher business performance is clearly associated with a shift from Reactive to Creative ways of leading. This is critical information in understanding how to develop individual executives as well as the leadership teams throughout the organization.
The Leadership Circle® and Organizational Performance
The Leadership Circle ©2015 | All Rights Reserved12
Another exciting finding, is the relationship between self perception and other’s aggregate perception as seen in the two graphics, Figures VI and VII. (Self-assessments are shown by the red line, and the outer edge of the green shaded area is the average aggregate perception of others.) It is clear that managers whose businesses are viewed as the most poorly performing have a tendency to overestimate their effectiveness on every dimension. They also underestimate their Reactive behavior. Conversely, those leaders who manage the businesses viewed as the highest performing have a tendency to be more humble in their self-assessments. This is consistent with the Level 5 leader described by Jim Collins in Good to Great.
It is also quite interesting that the area most over-assessed by the Bottom 10% group is Self-Awareness. The sub-dimensions within Self-Awareness that show the greatest discrepancies are Selfless Leader—which measures Level 5 (Collins, 2001) awareness—and Personal Learner—which measures a managers orientation toward life-long growth in self-awareness. All of this suggest a very significant relationship between self-awareness and self-perception and leadership effectiveness and correspondingly on business performance. This is an area for future research.
In conclusion, the above data strongly suggest that The Leadership Circle Profile measures a set of behaviors that are highly predictive of effectiveness and, thereby, business performance. Future research will focus on refining the conclusions of this study and further exploring the insights provided here.
The Leadership Circle® and Organizational Performance
The Leadership Circle ©2015 | All Rights Reserved13
REFERENCES
Beck, D. and Cowan C. (1995) Spiral Dynamics: Mastering Values, Leadership and Change. Blackwell, Oxford, UK.
Block, P. (1987) The Empowered Manager: Positive Political Skills at Work. Jossey-Bass, San Francisco, USA.
Burns, D. (1980) Feeling Good: The New Mood Therapy. Signet, New York, USA.
Collins, J. (2001) Good to Great: Why Some Companies Make the leap…and Others Don’t. HarperCollins, New York, USA.
Ellis, A. (1988) How to Stubbornly Refuse to Make Yourself Miserable About Anything. Lyle Stuart, Inc., New York, USA.
Fritz, R. (1989) Path of Least Resistance: Learning to Become the Creative Force in Your Life. Fawcett-Columbine Books, New York, USA.
Gilligan, C. (1983) In a Different Voice: Psychological Theory and Women’s Development. Harvard University Press, Cambridge, Mass., USA.
Hall, B. (1995) Values Shift: A Guide to Personal and Organizational Transformation. Twin Lights, Rockport, Mass., USA.
Horney, K. (1945) Our Inner Conflicts: A Constructive Theory of Neurosis. W.W. Norton & Company, New York, USA.
Kegan, R. (1994) In Over Our Heads: The Mental Demands of Modern Life. Harvard University Press, Cambridge, Mass., USA.
Kohlberg, L. (1981) The Philosophy of Moral Development. Harper & Row, New York, USA.
Miller, M., and Cook-Greuter, S.R. (1999) Creativity, Spirituality, and Transcendence: Paths to Integrity and Wisdom in the Mature Self, Greenwood Publishing Group, Inc., Westport, Conn., USA.
Miller, M. and Cook-Greuter, S.R. (1994) Transcendence and Mature Thought in Adulthood: The Further Reaches of Adult Development, Rowman & Littlefield, Inc., Lanham, Maryland, USA.
Senge, P.M. (1990) The Fifth Discipline: The Art and Practice of the Learning Organization. Doubleday, New York, USA.
Torbert, W. (2004) Action Inquiry: The Secret of Timely and Transforming Leadership. Berrett-Koehler, San Francisco, USA.
The Leadership Circle® and Organizational Performance
The Leadership Circle ©2015 | All Rights Reserved14
Wilber, K. (2000) A Theory of Everything: An Integral Vision for Business, Politics, Science, and Spirituality. Shambhala, Boston, USA.
Wilber, K. (2000) Integral Psychology: Consciousness, Spirit, Psychology, Therapy. Shambhala, Boston, USA.
Wilber, K. (1999) One Taste: Daily Reflections on Integral Spirituality. Shambhala, Boston, USA.
Wilson, L. (2004) Play to Win, Revised Edition: Choosing Growth Over Fear in Work and Life. Bard Press, Austin, Texas, USA.
Zenger, J.H., and Folkman, J. (2002) The Extraordinary Leader: Turning Good Managers into Great Leaders. The McGraw-Hill Companies, New York, USA.
BIO
Bob Anderson is the Chairman and Chief Creative Officer of The Leadership Circle, LLC. He has over 20 years experience designing and conducting leadership development intensives. Bob is the creator of the Leadership Circle Profile and all associated tools and workshops. He is an Extended Faculty Member with the Mendoza College of Business at The University of Notre Dame.
E-mail: [email protected].
1st QUARTERLEADERSHIPREVIEW
CONTACT US:1234 E Washington Ave
Anytown, NY 84010
(801) 123-4567
www.yourwebsite.com