Embed Size (px)
Citation preview

LIU-IEI-FIL-A—09/00489—SE
Linköping University, Sweden
Department of Management and Engineering
Master’s Thesis in Finance 15hp
The International Business Program
Spring 2009
The Law of One Price Evidence from Three European Stock Exchanges
Lagen om ett pris Bevis från tre europeiska börsmarknader
Author:
– Sanna Olkkonen –
Supervisor: Göran Hägg

The Law of One Price – Evidence from Three European Stock Exchanges
2
Abstract
For the last decades the Efficient Market Hypothesis (EMH) has had a vital role in the financial theory. According to the theory assets, independent of geographic location, always are correctly priced due to the notion of information efficiency across financial markets. A consequence of EMH is the Law of One Price, hereafter simply the Law, which is the main concept of this thesis. The Law extends the
analysis by stating that in a perfectly integrated and competitive market cross-traded assets should trade for the same common-currency price in every country. This becomes a fact due to the presence of arbitrageurs’ continuous vigilance in the financial markets, where any case of mispricing is acted upon in a matter of seconds
by buying the cheaper asset and selling it where the price is higher in order to make a profit from the price gap.
Past research reveals that mispricing on cross-traded assets does exist, indicating
that there exists evidence of violations of the Law on financial markets. However, in the real world most likely only a few cases of mispricing equal arbitrage opportunities due to the fact that worldwide financial markets are not characterized
by the perfect conditions required by Law. Consequently, it is of relevance to
include factors that may have an impact on mispricing when implementing a validation test of the Law on cross-traded assets, as these may as well eliminate the
assumed arbitrage opportunities.
In this study the author implements a validation test of the Law by examining the
degree of mispricing on 19 cross-traded assets in three European stock exchanges.
Consequently, from the prevalent theoretical point of view, the author maps and analyzes the possible impact of market imperfections on the detected mispricings.
The major finding of this study is that mispricing does exist to significant degree on
the considered markets. However, by examining the possible impact of market
imperfections, the author cannot disregard the fact that these may explain a
considerable part of the detected price discrepancies. The final conclusion of this
study is that the main focus when discussing mispricing should revolve round
analyzing its underlying causes, rather than resting on tenacious financial theories, in order to be able to draw more comprehensive and fair conclusions about
mispricing on cross-traded assets.

The Law of One Price – Evidence from Three European Stock Exchanges
3
Acknowledgements
During the conduction of this thesis the author has received help and support from
several persons. First the author wants to express a special gratitude to her
supervisor Göran Hägg for his commitment and valuable inputs throughout the
process of the thesis. She also wants to thank her friends and family for their
unconditional support. Moreover, the author also wants to thank her opponents
Magnus Fock, Johan Dahlstrand and Niklas Ekmark; Johan Kellgren and Christian
Vegfors; Rosanna Bergdahl and Martina von Melsted for their academic guidance
during the seminary sessions.
Linköping, May 2009
Sanna Olkkonen

The Law of One Price – Evidence from Three European Stock Exchanges
4
Table of Contents
1. Introduction ............................................................................................................ 6
1.1 Purpose and Contribution .......................................................................................................... 8
1.2 Methodology and Delimitations ............................................................................................ 10
1.3 Disposition ..................................................................................................................................... 11
2. Explanatory Factors to Mispricing ............................................................... 12
2.1 Institutional Barriers ................................................................................................................. 12
2.2 Transaction Costs ........................................................................................................................ 14
2.3 Tick Size .......................................................................................................................................... 17
2.4 Irrational Market Behavior ..................................................................................................... 17
3. Methodology ........................................................................................................ 19
3.1 The Mode of Procedure ............................................................................................................ 19
3.1.1 Sample Criteria and Data Description ........................................................................ 19
3.1.2 Implementing a Validation Test of the Law ............................................................. 21
3.1.3 Comparative Analysis ....................................................................................................... 23
3.1.4 Explanatory Factors to Mispricing .............................................................................. 23
3.2 Compilation of the Mode of Procedure ............................................................................... 26
3.3 Validity and Reliability .............................................................................................................. 26
3.4 Method Criticism ......................................................................................................................... 27
4. Implementation of the Validation Test of the Law ................................. 29
4.1 OMX Stockholm - Frankfurt Stock Exchange .................................................................... 29
4.2 London Stock Exchange - Frankfurt Stock Exchange .................................................... 36
4.3 A Comparative Stock Exchange Analysis ........................................................................... 42
4.4 Explanatory Factors to Mispricing ....................................................................................... 43
5. Conclusions .......................................................................................................... 50
5.1 Final Comments ........................................................................................................................... 53

The Law of One Price – Evidence from Three European Stock Exchanges
5
5.2 Suggested Future Investigation ............................................................................................. 54
6. Sources ................................................................................................................... 55

The Law of One Price – Evidence from Three European Stock Exchanges
6
1. Introduction
In the past decades, several empirical pieces of evidence of market imperfections
have been detected on the financial markets. Defining imperfect conditions as
mispricing, numerous studies uncover the presence of repeated differentials in
asset prices across markets. (Lamont & Thaler, 2003) Mainly two strands of
literature within the financial theory discussing the phenomena of mispricing and
imperfect market conditions can be distinguished. The first literature derives from
the assumption that prices reflect the assets’ fundamental values. A well known
pioneer within the paradigm is Eugene Fama introducing the Efficient Market
Hypothesis (EMH) in the beginning of the 1960’s. According to the theory,
information is the key element in stock-pricing where prices, independent of
geographic location, always reflect the information available to investors (Bodie et
al, 2008). Given that all investors have same access to information, the notion of
market efficiency therefore results in impossibility for investors to outperform the
market and generate gains from mispricing on cross-traded assets over time. (Fama,
1998)
A consequence of the Efficient Market Hypothesis is the Law, which is a second
strand of literature discussing mispricing in financial markets. The Law extends the
analysis of market efficiency stating that in a perfectly integrated and competitive
market cross-traded assets should trade for the same common-currency price in
every country. (Baldwin & Yan, 2004) The Law constantly holds because of the
presence of arbitrageurs’ continuous vigilance on financial markets. Any arisen
arbitrage opportunity will begin the arbitrage activity, where arbitrageurs at the
same exact moment purchase the cheaper asset and sell it where the price is higher
in order to make a profit of the mispricing. (Bodie et al, 2008) The price
convergence occurs nearly instantly given the advanced technology on today’s
financial markets, which has made it exceptionally difficult to make gains from asset
mispricing. Investors are capable of buying and selling assets with help of
computerized trading systems that identify market fluctuations instantaneously.
Any arbitrage opportunities are therefore responded to rapidly and eliminated
within a couple of seconds. Given the market efficiency in both information and

The Law of One Price – Evidence from Three European Stock Exchanges
7
advanced technology one would therefore assume that the market’s adaptation to
assets’ mispricing occurs mechanically wherefore the Law should hold in well-
functioning financial markets. (Lamont & Thaler, 2003)
Nevertheless, even though the Law seems to be a fine and non-conversional law,
mispricing has been detected even in well-functioning financial markets. The
particular problem appears when a same asset traded in different markets does not
have the same common-currency price over time. All detected observations should
in this case indicate that investors disregard arbitrage opportunities, being
inconsistent with both the Law and EMH. Past research presents several cases
where a violation of the Law is suspected. Two prominent cases of alleged
mispricing are the case of closed-end funds and the Siamese twins.
The closed-end fund case refers to an issue that is given birth to due to closed-end
funds’ nature of consequently showing discounts and premiums greater than 30
percent to its net value, implying a direct violation of the Law. (Lamont & Thaler,
2003) Klibanoff et al. (1998) elucidate the example of mispriced foreign closed-end
funds traded on the U.S. stock market, showing values that significantly differ from
their observed value in the domestic exchange market. Various explanations are
given to the observed price differences, but mainly market frictions such as
irrational market behavior are found as principal explanations. A prominent case of
a mispriced closed-end fund is the Taiwan fund that was traded on the New York
Stock Exchange in 1980’s. In 1987, it presented a 205 percent premium, suggesting
that the asset was traded for more than three times its domestic value. Klibanoff et
al. (1998) argue that the case of Taiwan is a result of legal barriers preventing U.S.
investors from buying the Taiwanese stock without restraints. However, since the
legal barriers presumably did not execute trading tariffs of 205 percent, one can
assume that U.S. investors’ decision making might as well have been influenced by
irrationalism at this time.
The case of Siamese twins is discussed in Lamont and Thaler (2003) and Froot and
Dabora (1999). The case of the Siamese twins refers to two of world’s most liquid
stocks; the Royal Dutch and Shell. The Royal Dutch stocks were traded in
The Law of One Price – Evidence from Three European Stock Exchanges
8
Amsterdam and Shell traded in London. Due to historical reasons the agreement
was to entitle all future cash flows 60 and 40 percent respectively between the two
assets, with the consequence of a 50 percent more expensive Royal Dutch stock
than Shell. (Lamont & Thaler, 2003) Although the relative price discrepancy of the
two stocks was known to the public, the mispricing persisted on the two assets.
Quite the reverse, the assets’ prices fluctuated by being up to 30 percent too low to
15 percent too high from its theoretical value through many years. (Froot & Dabora,
1999) Lamont and Thaler (2003) give the explanation to a minor part of the
mispricing by elucidating the fact that Royal Dutch during the time was included in
the S&P 500 index where it is common that stock prices tend to rise once noticed on
the index’s stock-list. Although, the initial rise in the asset’s value has no
fundamental value, it increases as a consequence of the fact that other stock values
drop. For instance, index funds are forced to track the index; resulting in this case
that they might have bought the more expensive Royal Dutch stock in order to
maintain their index fund’s value-weighted portfolio.
The past two cases briefly discuss mispricing where market imperfections could
explain some of the price differentials. In the first example institutional barriers
and investors’ irrationalism in investment decision making were given as main
explanations to mispricing. The second case introduced a third type of market
friction possibly explicating one part of the detected price differentials. Other
market imperfections that appear in the debate of mispricing in terms of financial
integration are transaction costs, asymmetric information, tick-size and turnover,
among others. Lamont et al, (2003) argue that market frictions serve as important
implications when testing a validation of the Law on internationally traded assets,
since they could eliminate any possible opportunity of arbitrage.
1.1 Purpose and Contribution
The considered concept of this thesis is the economic theory the Law, where the
author conducts a field study analyzing its validation on three European stock
markets; OMX Nordic Exchange Stockholm, Frankfurt Stock Exchange and London
Stock Exchange. The focus on the subject departs from the author’s earlier

The Law of One Price – Evidence from Three European Stock Exchanges
9
observations of empirical studies discussing mispricing and possible explanatory
factors to price discrepancies on cross-traded assets.
The main purpose of this thesis is to study the degree of mispricing on three
European stock exchanges and, from a prevalent theoretical point of view, to map
what possible market imperfections may explain the price discrepancies.
Consequently, according to the previous discussion about mispricing on cross-
traded assets, the author intends to answer the following questions:
� To what degree can mispricing be detected on the three European stock
exchanges; OMX Nordic Exchange Stockholm, Frankfurt Stock Exchange and
London Stock Exchange?
- How can the historical pattern of mispricing be characterized on the three
stock markets?
- Are there any differences or similarities in the pattern of mispricing on the
two combinations of markets; OMX Nordic Stock Exchange Stockholm vs.
Frankfurt Stock Exchange and London Stock Exchange vs. Frankfurt Stock
Exchange?
- What explanatory factors to mispricing can be detected that possibly could
explicate some parts of the price discrepancies?
� How can the prevalent financial theories and results of this study contribute
to a greater understanding and intelligibility about mispricing on cross-
traded assets?
Although mispricings in general are well-documented the author has not yet come
across any empirical study including a thoroughgoing map out and comprehensive
analysis about market imperfections when analyzing mispricing. The author
therefore hopes that this study will strengthen the field of price discrepancies on
cross-traded assets. Moreover she has not yet found other empirical works
implementing studying the degree of mispricing on the three considered European
stock markets, thus also strengthening the literature discussing price discrepancy
on cross-traded assets within this geographic area.
The Law of One Price – Evidence from Three European Stock Exchanges
10
1.2 Methodology and Delimitations
This study includes an analysis of the validation of the Law on 19 cross-traded
assets, listed on OMX Nordic Exchange Stockholm, Frankfurt Stock Exchange and
London Stock Exchange. The Data material consists of quoted closing prices and
exchange rates on the three considered markets, covering a time period of two
years.
The author maps out the degree of mispricing on the three markets and examines
the historical pattern of the detected price discrepancies, additionally also
comparing the results from the three markets. Moreover, from the perspective of
previous research, the author includes a final discussion about the possible impact
of market imperfections in order to elucidate factors that may serve as underlying
causes to mispricing on cross-traded assets. The explanatory factors that are
included in this study are: institutional barriers, transaction costs, asymmetric
information, irrational market behavior, turnover, exchange rate and tick size. The
author is also well aware of the fact that there exists a large number other market
frictions not analyzed in this study that may have an impact on price discrepancies,
however, due to restrictions in time and resources the author delimits the analysis
to these particular market imperfections.
Furthermore, the author wants to stress that the aim of this study is not to fully
explain price discrepancies but to map and deepen the analysis of those concerned.
Hence, this thesis makes a preliminary study to mispricings on cross-traded assets.

The Law of One Price – Evidence from Three European Stock Exchanges
11
1.3 Disposition
Chapter 2 discusses possible explanations to mispricing on cross-traded assets. The
main objective for this section is to elucidate the possible impact of market frictions
when analyzing price discrepancies, as they may serve as crucial implications when
testing the validation of the Law.
Chapter 3 gives the reader an explanation about the author’s mode of procedure
when examining the quandary of the thesis. This section also provides a discussion
about the credibility of the thesis by including the two significant conceptions in the
methodology theorem validity and reliability. Lastly, the author presents the
method criticism of the thesis and how she managed the upcoming errors during
the progression of the study.
Chapter 4 presents the empirical findings of the thesis, also providing the reader a
discussion about the findings of the result. An analysis about the possible impact of
market imperfections is also included to be able to draw more comprehensive
conclusions of price differentials on the considered markets.
Chapter 5 presents the author’s final conclusions about the study, also giving
suggestions for future research on mispricing on cross-traded assets.

The Law of One Price
2. Explanatory Factors to
The concept of the Law states that a financial asset move
equilibrium due to arbitrageurs’ constant watchf
the market. However, past research
imperfect market conditions
in consideration when testing
(Lamont & Thaler, 2003)
frictions and constraints that may serve as explanatory factors to mispricing
cross-traded assets. The factors that are included in this
barriers, including the newly introduced
Financial Instruments Directive
discussion about asymmetric information
be discussed more profoundly in the analysis chapter)
market behavior. The author is well aware of the fact that there exists a large
number other market
wherefore there exists also a factor
explanatory factors to mispricing on cross
Figure 1: A Bullet points of possible
2.1 Institutional Barriers
Institutional barriers to cross
economic, political and juridical legislations imposed by one country in order to
restrict the trade on markets,
Institutional
Barriers
MiFID
Transaction Costs
Asymmetric
Information
The Law of One Price – Evidence from Three European Stock Exchanges
Explanatory Factors to Mispricing
The concept of the Law states that a financial asset move
rbitrageurs’ constant watchfulness over possible mispricing
However, past research presents evidence of mispricing due to
imperfect market conditions, demonstrating that market frictions
in consideration when testing the validation of the Law on cross
(Lamont & Thaler, 2003) In this section the author presents the principal market
constraints that may serve as explanatory factors to mispricing
The factors that are included in this study
including the newly introduced European Legislation
Financial Instruments Directive (MiFID); transaction costs, also
asymmetric information; turnover; exchange rate
be discussed more profoundly in the analysis chapter); tick size and
The author is well aware of the fact that there exists a large
number other market frictions that may have an impact on price discrepancy,
there exists also a factor other. Figure 1 makes a compilation of
to mispricing on cross-traded assets.
possible explanatory factors to mispricing on cross-traded assets.
Institutional Barriers
s to cross-border trading may be expressed as contracts,
and juridical legislations imposed by one country in order to
markets, because it feels incited to protect the country’s
Mispricing
Asymmetric
Information
Tick Size TurnoverChanges in
Exchange Rate
Irrational Market
Behavior
Evidence from Three European Stock Exchanges
12
The concept of the Law states that a financial asset moves towards price
ulness over possible mispricing on
mispricing due to
market frictions have to be taken
cross-traded assets.
In this section the author presents the principal market
constraints that may serve as explanatory factors to mispricing on
study are; institutional
European Legislation the Markets in
; transaction costs, also including a
; exchange rate (the last two will
; tick size and irrational
The author is well aware of the fact that there exists a large
frictions that may have an impact on price discrepancy,
Figure 1 makes a compilation of possible
traded assets.
may be expressed as contracts,
and juridical legislations imposed by one country in order to
protect the country’s
Irrational Market
BehaviorOther

The Law of One Price – Evidence from Three European Stock Exchanges
13
economical interests. Institutional barriers are often referred to when discussing
mispricing on cross-traded assets as market constraints may delimit foreign
investors’ possibility to invest in another country. Examples of restrictions
commonly affecting cross-border traders among others are taxes (in some cases
foreign investors even face higher taxes on earnings than locals) and restrictions in
shorting. (Krugman & Obstfeld, 2006)
The Markets in Financial Instruments Directive (MiFID) is a European Union
Instrument which provides a harmonized regulatory regime for investment services
within the European economic area (including the 27 member states of the EU plus
Iceland, Norway and Liechtenstein). The main objective of the legislation is to
protect investor interests and increase competition on the financial markets within
the economic area. It was officially introduced November 1, 2007. MiFID constitutes
an important pillar within the European Commission’s Financial Services Action
Plan, whose key purpose is to increase the efficiency of the operation of financial
markets within the EU.
The regulation is a consequence of the increasing activity on the European markets,
where more and more investors have become active in operating on financial
markets and the markets are offering even more complex services and instruments.
In view of this development, it has become necessary to provide a degree
harmonization to offer investors a better protection and to help investment
companies to provide their services across the Community. The principal action has
been to establish a comprehensive legislation for the execution of investor
transactions in financial instruments and the trading methods used to finish off
those particular transactions. Moreover, the legislation has aimed to sustain the
overall efficiency of the financial system, where the whole European Community
should operate as if being a single market. (EU legislation summary, 2009)
The harmonizing effects of MiFID are still under preliminary stage due to its short
period of prevalence and it is a matter of opinion how its effects are perceived on
the European markets. Its main critique has referred to the fragmentation of trading
venues which was intended to increase the transparency for prices. Before the

The Law of One Price – Evidence from Three European Stock Exchanges
14
introduction of MiFID financial institutions and traders were able to accumulate
data from only one or two exchanges, instead now they are provided with data from
numerous European trading platforms. This results in an additional amount of time
and effort needed to benefit from the new market conditions. Moreover, this has
created a concern among investors whether their trades are being executed at the
best possible price due to the lack of a central mechanism for aggregating price
reporting, as it is hard to rely on prices reported from multiple venues. (Financial
Times, 2008)
Others, however, are of another opinion when discussing the post-impact of MiFID.
The positive criticism has mainly referred to MiFID’s ability to break the monopoly
of the European stock exchanges that had long enjoyed on where a stock was
traded, implying higher tariffs on traders. The lowering of transaction costs has
been one of the main advantages within the introduction of MiFID, as transaction
costs are considered to be minimized in order to create efficient financial markets.
The introduction of the notion of a single European financial market has opened the
way for other trading platforms to challenge the exchanges thus also streamline
stock pricing. (Financial Times, 2008)
2.2 Transaction Costs
In cross-border trading a transaction cost is a cost incurred in making the economic
exchange of assets and can be seen as consequence of the risks before (ex-ante) and
during (ex-post) the transaction. (Verbeke & Nordberg, 1999) Trading normally
implies three different types of transaction costs: Search and Information;
Bargaining and Decision; and Policing and Enforcement Costs.
Search and Information costs are costs that are incurred in when searching for
potential trading counterparties and prevalent stock prices. Although, today’s well-
functioning financial markets have lower transaction costs due to the general
movement towards a consolidation of existing exchanges trading similar securities
and hence more universal trading platforms and thus information centers, market
information is normally underprovided despite the fact that all actors participating
in the trade are in need of it. Intermediaries, such as brokers or consultants,

The Law of One Price – Evidence from Three European Stock Exchanges
15
sometimes provide information at additional cost. (Board et al., 2002) Bargaining
and Decision costs are costs that are incurred when two trading parties negotiate
and establish an agreement. The level of complexity of the agreement and to what
degree there is asymmetrical information when coming to an agreement of the
terms of the contract has a positive relationship with the size of these costs
(asymmetric information will be discussed more profoundly later in this chapter).
(Schmitz, 2006) Policing and Enforcement Costs are costs that appear after the trade
has been agreed upon. There may as well be significant costs involved in monitoring
and policing the other party to make sure he follows the terms of the agreements,
and in case he is not, possibly to take appropriate legal actions to make him do so.
(Dietrich, 1994)
Assets’ transaction costs in the stock exchange market are under continuous debate.
There exists a conflict of interests between policymakers and market agents
advocating free capital movement across borders. Policymakers argue that trading
costs may reduce excessive fluctuations by reducing unproductive speculations and
encourage investors to make long term investments instead of engage in short term
trading. On the other hand, opponents disagree arguing that transaction costs cause
several issues such as reducing assets’ value and liquidity, decreasing market
efficiency and repulsion of foreign investors. (Baltagi et al, 2006)
So far most theoretical papers eliminate transaction costs as a factor in their
analysis when examining cross-traded assets, due to the complex work of
estimating the costs correctly. It is also common to rely on the supposition of the
traditional financial theory that capital is assumed to move freely internationally,
hence eliminating the impact of trading cost in the analysis. However, according to
Gordon and Bovenberg (1996) et al, a complete and comprehensive analysis should
include the impact of transaction costs due to the fact that it is universally
apprehended that transaction costs are present in every financial market and may
well therefore explain a significant part in assets’ mispricing.
Asymmetric information makes an important incentive to transaction costs also
serving as the main cause to restrictions in rationality in market behavior (which

The Law of One Price – Evidence from Three European Stock Exchanges
16
will be discussed later in this chapter). Bodie et al. (2008) define the concept of
asymmetric information as a situation in which one party of a transaction has more
or superior information than the other. This could have a negative impact on asset
pricing since one party can take advantage of another due to better relative
knowledge. Even though asymmetric information has been to decline thanks to
increased advancements in technology letting more and more people easily access
all types of information it still continues to be present on financial markets,
consequently constituting a market imperfection of relevance when analyzing price
differentials.
Gordon and Bovenberg (1996) discuss asset mispricing and asymmetric
information across countries by stating that asymmetry in information is a natural
consequence of the fact that investors, by living in a particular country, know a lot
more about the economic prospects of the domestic country than they do about
those in other countries. They also elucidate the example of a problem that might
occur in connection with company acquisitions. In this case it is not uncommon for
foreigners to overpay for an acquisition of a domestic company due to the fact that
the domestic owners have a better access to information that can be relevant, not
only about the company’s and market’s conditions themselves but also about future
government interventions and policies that may have an impact on the company’s
future activity.
The EMH, also the fully revealing rational expectations hypothesis, states that
traders base their investment decisions on both private information and the
information reflected in price. This creates the price equilibrium situation where all
information is reflected perfectly in asset prices. (Lang et al, 1992) On the other
hand, another hypothesis in the financial theory, the Noisy Market Hypothesis,
contradicts the EMH by claiming that asset prices are not always the exact estimate
of a company’s fundamental value. Conversely, it argues that prices are influenced
by speculators as well as insiders and institutions that often buy and sell stocks for
reasons that are not related to real values, such as for diversification, liquidity and
taxes etc. These temporary shocks referred to as "noise" may as well explain the
price of assets and can result in mispricing for longer periods. (Siegel, 2006)

The Law of One Price – Evidence from Three European Stock Exchanges
17
Another view sees noise traders as investors who are less than rational; they are
subject to behavioral biases. (Dow & Gorton, 2006)
2.3 Tick Size
Tick size is known as the minimum price change allowed, and is part of the contract
specifications for all financial markets. The tick size-rule has been under debate
over time because its feature restricts the trading activity. On one hand, restriction
in form of decimalization may benefit the decrease of bid and ask spreads. On the
other hand it may also cause liquidity to dry up, which depends on an asset’s trading
volume, and may have an unfavorable impact on investors. (Chen & Gau, 2009) The
tick size rule is thus relevant to include in the analysis of mispricing due to the fact
that it may as well explain a considerable part of it.
2.4 Irrational Market Behavior
Mispricing and irrational market behavior is often discussed in the same context.
Irrationality in investment decision making is a widely discussed dilemma in the
modern financial theory, due to its hard estimated nature. Until only a few decades
ago the capital market theory stated that financial markets are efficient because all
investors are rational, however, visionaries of the new school behavioral finance say
the opposite. Rather than thinking rationally, investors tend to make biased
investment decisions. Peters (2003) discusses the human behavior on financial
markets stating that investors often fail to use statistical reasoning when making
decisions and instead rely on “rules of thumb”. However, he defends the regular
investor by stating that investors many times fail to meet the rationality criterion
due to the restrictions in favorable conditions when making a trading decision.
Behavioral finance visionaries often disregard the circumstances under which
decisions are made, assuming that investment decisions are made under conditions
that favor standard quantitative methods, but the reality often presents the
opposite conditions. He implements the expression “true uncertainty”, stating that
decisions are frequently made under these conditions. This condition is a direct
result of investors not knowing all possible outcomes of a decision. The investor
might therefore be as rational as he can, based on the conditions he has, meaning

The Law of One Price – Evidence from Three European Stock Exchanges
18
that he is rational in decision making but the degree of rationality is lowered due to
the “true uncertainty” factor. Even though there might be excuses for limited
rationality on financial markets, there is still a concern when examining cross-
border stock pricing, where some cases may serve as crucial explanatory factors to
mispricing.

The Law of One Price – Evidence from Three European Stock Exchanges
19
3. Methodology
In this chapter the author presents the mode of procedure when examining the
quandary of this thesis. The procedure is divided into four parts to facilitate the
structure. This section also provides a discussion about the credibility of the thesis
credibility including the two significant concepts in the methodology theorem;
validity and reliability. Lastly, the author presents the method criticism of the thesis
and how she manages difficulties in the progression of the study.
3.1 The Mode of Procedure
In this thesis the author maps mispricing and analyzes mispricing on three
European stock markets; OMX Nordic Exchange Stockholm, Frankfurt Stock
Exchange and London Stock Exchange. A quantitative approach is used to collect
trading data on a sample of 19 cross-traded assets in order to carry out the purpose
of this thesis. A quantitative approach is central when analyzing empirical data
since it provides a fundamental connection between empirical data and
mathematical models that quantify relationships. The main advantage of the
method is its high formalization and structure which makes it applicable to a larger
sample of observations. (Nickles, 2002)
3.1.1 Sample Criteria and Data Description
The motivation for the choice of the particular stock markets is that the three
markets, despite the fact that they do not operate in the same time zone, have
matching daily trading hours. (Nasdaq OMX; Deutsche Börse Group; London Stock
Exchange, 2009). This makes it possible to collect daily quotes for all assets at the
exact same moment (raw data for the different assets must be collected at the same
exact moment from the different stock markets, in order to meet the requirements
in a validation test of the Law).
The motivation for the election of the 19 particular assets is based on a general
liquidity criterion, where the assets must show an everyday trading activity to be
included in the sample. The liquidity criterion relies on the author’s assumption that
less traded assets assumingly show a higher degree of mispricing. The liquidity

The Law of One Price – Evidence from Three European Stock Exchanges
20
criterion is met by a filtering process, consisting of three steps. The first step is to
identify assets in the OMX Nordic Exchange Stockholm that also are listed in the
Frankfurt Stock Exchange and the London Stock Exchange. The author identifies a
relatively large number of assets listed in Frankfurt, whereas only a few in London.
However, for an asset to serve as qualitative data for the analysis it must present a
satisfactory trading activity. (The author assumes that a validation test of the Law is
not applicable in inert stock trading markets.) The trading activity is measured by
observing daily price fluctuations, where only assets presenting a daily price change
are included in the sample. This constitutes the second step in the stock selection
process. A final filtering process is made by eliminating stocks presenting a weak
trading volume, which comes down to a final sample of 10 cross-traded assets.
Nevertheless, none of the Swedish assets traded on the London Stock Exchange, in
terms of having Stockholm as home stock market place, comply with the trading
volume requirements wherefore only Swedish assets traded on the Frankfurt Stock
Exchange are included in the study. Subsequently, the same procedure is performed
by identifying British cross-listed assets, in terms of having London Stock Exchange
as home market, on the Stockholm and Frankfurt stock markets. Also, British assets
are poorly traded in Stockholm, wherefore a filtering process comes down to 9
cross-traded assets, in London and Frankfurt. Consequently, the data provides a
total sample of 19 cross-traded assets on the three European stock exchange
markets. According to the previous discussion, this thesis does not consider
Swedish assets traded in London and British assets traded in Stockholm, wherefore
the market combinations that are analyzed are: OMX Nordic Exchange Stockholm
vs. Frankfurt Stock Exchange and London Stock Exchange vs. Frankfurt Stock
Exchange.
Given the selected sample of 19 cross-traded assets, the next step before collecting
closing quotations is to determine the time period that the study will cover. The
author decides to analyze a two year period, covering from February 16, 2007 to
February 18, 2009, which will provide 524 trading days to the analysis. This equals
9956 observations during the two-year period, which is statistically acceptable. The
time period of reference is a result of restrictions in accessibility to raw data. The
The Law of One Price – Evidence from Three European Stock Exchanges
21
statistic data used in this thesis are quoted closing prices collected from Thomson
Reuters’ Datastream database. Trading volume data is collected from the Yahoo
Finance database.
The author’s initial intention was to use minute or hourly data over a more limited
time period, which would be interesting due to the notion that price is assumed to
converge nearly instantly given the advanced technology on today’s financial
markets. However, restrictions in data accessibility do not permit this action,
wherefore daily quotes, based on the prevalent conditions, serves as the best
option. A potential loss by using closing prices is that one cannot follow the
everyday movements and actual trading activity, where mispricings are supposed to
be acted upon in a matter of seconds. The potential gain by using closing prices is
that one can consider a longer period of time, also being able to identify the possible
impact of persistent market imperfections.
When examining how other studies have carried out the process analyzing
mispricing on cross-traded assets, the author detects that the denominator is first
implementing the non-equilibrium condition. However, studies in general do not
include all possible factors affecting the non-equilibrium, but possibly quantify the
impact of one or two market imperfections. On the other hand, in this study the
author includes an analysis about many possible market imperfections as they may
all serve as crucial implications when testing the Law’s validation. However,
restrictions in time and resources do not permit the action to quantify the impact of
the considered factors, wherefore this thesis makes a preliminary study to analyze
mispricings on cross-traded assets.
3.1.2 Implementing a Validation Test of the Law
Once closing data of the 19 cross-traded assets for the selected time period is
collected, the following step is to include the exchange rates of the three considered
currencies; SEK, EUR and GBP, in order to be able to convert the quoted prices into a
common currency, which in this study will be EUR. The author therefore collects
spot prices for the same time period as the quoted prices, is to say from February
16, 2007 to February 18, 2009.

The Law of One Price – Evidence from Three European Stock Exchanges
22
When all pieces of data for the analysis are collected, the next phase is to determine
whether any mispricing exists on the 19 cross-traded assets included in the sample.
The validation test of the Law across borders is carried out by applying the non-
arbitrage equilibrium stated as follows:
S���� �������
Pjx is the closing price of asset j in terms of x, Pjy is the closing price of the identical
asset in terms of y and S is the EUR spot exchange rate, calculated as S����. The
equation concludes that the price of an asset calculated in the same currency must
be equal. (Moosa, 2003) By carrying out the non-arbitrage equilibrium the author is
able to state the degree of mispricing on the cross-traded assets included in the
sample.
The next step is to examine the historical pattern of price discrepancies on the three
European stock exchanges. This is done first by studying price discrepancies on
Stockholm vs. Frankfurt markets and secondly by examining the results from
London vs. Frankfurt markets.
Next, the author determines the total absolute and relative degrees of mispricing
across the markets, also calculating the median, maximum and minimum points and
the standard deviation of the total price discrepancies. This is done for every asset
separately. As a next step the author divides the relative mispricings into intervals
of 2.5 percentage points to facilitate a general view of the size of degree of price
discrepancies. The 2.5 p.p. intervals in degree in mispricing distribution may be
presented as: minus or plus 0.0 to 2.5 p.p.; 2.5 to 5.0 p.p.; 5.0 to 7.5 p.p.; 7.5 to 10.0
p.p.; 10.0 to 12.5 p.p.; 12.5 to 15.0 p.p.; 15.0 to 17.5 p.p.; 17.5 to 20.0 p.p. and 20.0
p.p. and higher, respectively. Observations of mispricing within the interval of plus
or minus 10.0 to greater than 20.0 percent are examined closer by analyzing the
assets’ raw data. This is done to identify, if possible, the underlying incidents
causing the price difference. However, the author wants to stress that the interval of
plus or minus 10.0 to greater than 20.0 percent does not make an arbitrage interval.
The distribution is just made to facilitate the data analysis, since the large amount of
The Law of One Price – Evidence from Three European Stock Exchanges
23
observations included in this study does not permit a deeper analysis of every
single case of mispricing.
3.1.3 Comparative Analysis
In the third step the author conducts a comparative analysis by comparing the
historical pattern of the price discrepancies between Stockholm vs. Frankfurt and
London vs. Frankfurt, also comparing the markets’ average degree of mispricing,
maximum and minimum points and standard deviations. This is done in order to be
able to draw overall conclusions about average mispricing on the considered
markets.
3.1.4 Explanatory Factors to Mispricing
In the last step of the procedure the author maps and analyzes the possible impact
of market imperfections on the detected price discrepancies in this study, in order
to be able to draw more comprehensive conclusions about the results. The
explanatory factors are included in this study are; institutional barriers, including
the European Legislation MiFID; transaction costs, including asymmetric
information; turnover; changes in exchange rate; tick size and irrational market
behavior.
The author’s initial hypothesis is that mispricings exist to a greater extent on less
traded stocks than those that are traded more frequently (see also the initial
filtering process where the author eliminates assets not meeting the trading activity
criterion). The relationship between average price discrepancy and turnover can be
established by using a simple linear regression analysis. A simple regression
analysis is a statistical model consisting of values of one dependent variable, one
independent variables and one error term (representing the unexplained variation
in the dependent variable). The simple regression equation is expressed as follows:
� � �� ��� �

The Law of One Price – Evidence from Three European Stock Exchanges
24
� is the dependent variable, �� the first parameter indicating the value of Y when X
= 0, �� is the slope of the line, � is the independent variable and � is the random
variable. (Kazmier, 2003)
In this analysis, the Y-variable is the absolute value of the average relative price
difference for a specific stock whilst the X-variable is the average turnover of the
corresponding stock; calculated as the average value of closing prices multiplied
with trading volumes every day. The regression analysis is conducted on the assets’
home market, is to say OMX Nordic Stock Exchange Stockholm for Swedish assets
and London Stock Exchange for the British assets. The author is well aware of the
fact that there probably is a substantial difference in trading activity and
consequently turnover rate between the assets’ domestic and foreign markets.
However, the author cannot come across reliable data on Frankfurt Stock Exchange,
wherefore she decides not to include Frankfurt in the analysis (the author discusses
the possible consequences of not performing this analysis later in this chapter
under “Method Criticism”).
In other words, the author performs a cross sectional analysis, as opposed to a time
series analysis. An alternative method to conduct a linear regression analysis would
be to consider the everyday price differences as Y-variables and everyday turnovers
as X-variables, thus making a time series analysis on every asset separately.
However, the author does not find this mode of procedure coherent for this analysis
since she seeks to find the relationship between all assets and turnover.
When examining the results from the regression analysis, a negative relationship
implies that a higher degree of price discrepancy can be explained by a lower
turnover on the cross-traded assets and vice versa. The linear regression model also
includes a coefficient of determination value, R2. The R2-value serves as an estimate
of how well future outcomes are likely to coincide with the model. The value of the
estimate varies between 0 and 1 and is stated as follows;
�� = ����������

The Law of One Price – Evidence from Three European Stock Exchanges
25
Where ����� makes the sum of residuals (squared errors) and ����� is the total sum
of squared deviations. The linear regression analysis is finalized by conducting a
significance test to determine whether the null hypothesis is rejected, in favor of the
alternative research hypothesis, or not. The significance level used in this thesis is
0.10 percent (� � 0.10!, which is one of the most commonly used significance level.
(Kazmier, 2003) This analysis’s hypotheses that are tested are as follows:
H0 = There is not a relationship between turnover rate and degree of mispricing
H1 = There is a relationship between turnover rate and degree of mispricing
Furthermore, the author aims to analyze the possible impact of changes in exchange
rate on the degree of mispricing. This is done by conducting a correlation analysis.
A correlation matrix is used in order to estimate correlations between the
mispricings, and is done separately on the two market combinations; OMX
Stockholm vs. Frankfurt and London vs. Frankfurt. A correlation matrix is a
commonly used statistic tool to seek a relationship between two independent
variables by measuring the degree of correlation. The correlation analysis can be
stated by the following formula:
",� $ %�&'(),(*!+),+*
�, �� are the random variables, ,, ,� are the standard deviations of the variables
of �, �� , -./0�, ��1 the covariance of �, �� (indicating to what extent the two
variables co-vary) and ",�is the correlation between the two variables. A correlation
is always a number from –1 and 1. (Kazmier, 2003)
The author’s principal assumption is that price discrepancies should not correlate
with one another. If they do, this may be a consequence of delays in adaptations to
changes in the exchange rate. This can be exemplified as follows; suppose the
extreme situation where all cross-traded assets are initially correctly priced. If
suddenly the exchange rate changes, all assets will immediately show equally big
relative mispricings. Thus, the fact that all assets present mispricing at the same
time could indicate that there has not been an adaption in assets’ prices to the

The Law of One Price
change in exchange rate
the exchange rate S would caus
equal to 1, which signifies that the price discrepancies are perfectly correlated.
Conversely, a correlation equal to 0 signifies that the assets’ mispricing does not
correlate with one another, is to
disconnected from changes in the exchange rate. The author includes
rate factor in the analysis since it may serve as an explanatory factor to mispricing
on cross-traded assets if the adaption to chan
immediately. Any correlation higher than 0 would indicate that this factor provokes
the mispricing since the exchange rate factor is the only factor affecting all prices at
the same exact moment.
3.2 Compilation of the Mod
The author now has given an account of this thesis’s mode of procedure. The
following figure 2 makes
Figure 2: A Compilation of the Mode of Procedure.
3.3 Validity and Reliability
In order for this thesis to
discussion about the fundamental method criteria that will be taken in
consideration when collecting
The criteria secure that the method used t
Sample Criteria and
Data Description
• Election of Three
European Stock
Exchanges
• Election of 19 cross-
traded asset
• Filtration by the
Liquidity Criterion
• Election of Time Period
• Election of Daily Quoted
Prices
The Law of One Price – Evidence from Three European Stock Exchanges
change in exchange rate (see the non-arbitrage equilibrium; all equal, a change in
would cause mispricing). This situation would give a correlation
equal to 1, which signifies that the price discrepancies are perfectly correlated.
Conversely, a correlation equal to 0 signifies that the assets’ mispricing does not
correlate with one another, is to say the price discrepancies are completely
disconnected from changes in the exchange rate. The author includes
rate factor in the analysis since it may serve as an explanatory factor to mispricing
traded assets if the adaption to changes in exchange rate does not occur
immediately. Any correlation higher than 0 would indicate that this factor provokes
the mispricing since the exchange rate factor is the only factor affecting all prices at
the same exact moment.
Compilation of the Mode of Procedure
The author now has given an account of this thesis’s mode of procedure. The
s a compilation of the different phases in the process:
the Mode of Procedure.
alidity and Reliability
thesis to meet the credibility criteria, the author includes a
about the fundamental method criteria that will be taken in
collecting data and analyzing the results; validity and
secure that the method used to gather data is convenient in order to
Implementation of
the Validation Test
of the Law
• Conversion of Prices
into Common Currency
Level
• Carry ing out of the
non-equilibrium
• The Historical Pattern
of Price Discrepancies
• Distribution of
Discrepancy Intervals
Comparative
Analysis Between
the Stock Market
Combinations
Evidence from Three European Stock Exchanges
26
; all equal, a change in
e mispricing). This situation would give a correlation
equal to 1, which signifies that the price discrepancies are perfectly correlated.
Conversely, a correlation equal to 0 signifies that the assets’ mispricing does not
say the price discrepancies are completely
disconnected from changes in the exchange rate. The author includes the exchange
rate factor in the analysis since it may serve as an explanatory factor to mispricing
ges in exchange rate does not occur
immediately. Any correlation higher than 0 would indicate that this factor provokes
the mispricing since the exchange rate factor is the only factor affecting all prices at
The author now has given an account of this thesis’s mode of procedure. The
phases in the process:
meet the credibility criteria, the author includes a brief
about the fundamental method criteria that will be taken in
alidity and reliability.
onvenient in order to
Discussion about
Explanatory Factors
to Mispricing
• Market Imperfections
• Regression Analysis
• Correlation Analysis
The Law of One Price – Evidence from Three European Stock Exchanges
27
fulfill the thesis’s purpose. The validity criterion secures that the data that is
collected is relevant to the results of the thesis and the reliability criterion
guarantees that the mode of measuring is done in an accurate way. Both these
criteria must be met to ensure that the results are steadfast and consistent, is to say,
one could carry out the same study in future acquiring the same or very similar
results. (Patton, 2002)
The author attempts to meet the validity criterion by securing that the raw data that
are collected, in terms of closing prices, spot exchange rates and trading volume, are
coherent to the analysis. The fact that the data that are collected from independent
and acknowledged statistical databases also increases the trustworthiness thus
these serve as accurate sources of information. Moreover, the author considers
making safe the reliability criterion by using statistical methods that are well
recognized and habitually used when adopting statistical methods.
3.4 Method Criticism
The first method criticism of this thesis refers to the assembled data for exchange
rates. The exchange rate is taken at 5.00 p.m. (CET) and the stock price data at 5.30
p.m. (CET). Unfortunately, despite intense work of research, the author cannot come
across 30 minute data for a longer period than two days, wherefore there is a minor
time spread of 30 minutes between the spot exchange rate and the stocks’ closing
prices. This results in a minor margin of error in the estimations of mispricing. In
order to estimate the significance of the margin error in asset prices after having
adjusted the prices to a common currency level, the author tracks down 30 minute
exchange rate data for a period of two days. She thereafter makes a spot test by
electing a number of observations and determining by how much the exchange
rates may vary from an half-hour to another. She concludes that a change in the
exchange rate in some cases can be observed on the last fourth decimal.
In order to estimate the margin of error that is caused be time difference the author
calculates the impact of the change by implementing the following example; imagine
that the spot price changes from 10.000 to 10.001 between 5.00 p.m. and 5.30 p.m.
and assume also that the degree of mispricing at 5.30 p.m. is 0.50 percent calculated

The Law of One Price – Evidence from Three European Stock Exchanges
28
with the spot rate at 5.00 p.m. If the exchange rate data instead would have been
detected at 5.30, the degree of mispricing would no longer be 0.50 percent but 0.51
percent. Hence, the margin of error in the exchange rate data does have a minor
effect on the size of the degree of mispricing even though it assumingly does not
have a greater impact on the results of the analysis of this thesis. However, a future
study that manages to eliminate the inaccuracy in the exchange rate would acquire
even more exact results when measuring the degree of mispricing.
The second method criticism refers to trading volume data, where the author only
can get hold of daily data on an everyday basis on OMX Stockholm and London
Stock Exchange. The author concludes that there must be a trading volume on an
everyday basis due to the fact that the assets present price movements also on
Frankfurt Stock Exchange. However, the author cannot implement a regression
analysis measuring the relationship between absolute average mispricing and
average turnover that incorporates the Frankfurt Stock Exchange, wherefore
conclusions about Swedish assets can only be drawn by studying OMX Stockholm
and conclusions about British asses can only be drawn from the London Stock
Exchange British assets. The fact that the author cannot get hold of trading volume
data on Frankfurt restricts the author’s ability to draw complete conclusions about
the relationship between average turnover and mispricing on all three markets.
Finally, the last method criticism refers to the fact that the author maps and gives
her own interpretations of the observed mispricings, is to say she draws her own
conclusions about what factors may serve as explicators. In order to minimize the
subjectivity factor and sustain the thesis’s credibility, all mispricings are studied
repeatedly and carefully.

The Law of One Price – Evidence from Three European Stock Exchanges
29
4. Implementation of the Validation Test of the Law
In this section the author presents and analyses the results by implementing a
validation test of the Law, also presenting the most important tables and graphs of
this study. Due to the large quantity of data all tables cannot be included in this
section wherefore they are found in Appendix i) and ii).
4.1 OMX Stockholm - Frankfurt Stock Exchange
Table 1 reports the statistics of average turnover, average price differentials, the
maximum and minimum price discrepancies as well as the standard deviation on
the 10 assets traded on OMX Stockholm and Frankfurt Stock Exchange.

The Law of One Price – Evidence from Three European Stock Exchanges
30
Table 1: Average turnover, average relative degree of mispricing, absolute value of average relative
degree of mispricing, median of all relative mispricings, maximum and minimum points of relative
discrepancies and standard deviation of relative mispricings on OMX Nordic Stock Exchange Stockholm
vs. Frankfurt Stock Exchange, considering the time period from February 16, 2007 to February 18, 2009.
Data: Thomson Reuters & Yahoo Finance (2009).

The Law of One Price – Evidence from Three European Stock Exchanges
31
When looking at the price discrepancies on each one of the considered 10 stocks,
one can determine that all assets are, on average, traded at 1.28 percent below the
home market’s stock price during the time period of February 16, 2007 to February
18, 2009. The median presents an average mispricing of minus 1.41 percent. Table 1
displays the assets’ mispricings separately, where all assets included in the sample
show a degree of mispricing. H&M presents the smallest value, demonstrating an
average relative mispricing degree of only 0.04 percent below its domestic value.
H&M is also the asset that in comparison to the other assets presents considerably
less fluctuations in price differentials during the considered period, which also may
be illustrated in the mispricing intervals where the maximum price discrepancy
reaches the peak of plus 3.79 percent and a minimum of minus 2.40 percent (see
also the graph illustrating the pattern of relative price discrepancy of H&M in
appendix i)). Alfa Laval presents the major peaks in price discrepancy with a
maximum of plus 20.59 percent and a minimum of minus 21.40 percent. Bio Invent
shows the major average relative price difference, showing a relative price
differential of 3.39 percent below the home market’s value. Bio Invent is also the
asset that is characterized by most fluctuations during the time period. For the rest
of the cross-traded assets the author finds mispricing ranging from minus 2.39 to
minus 0.31 percent. The average maximum price discrepancy is 11.36 percent,
signifying that the assets are as highest traded to a 11.36 basis points premium to
Swedish market’s stock price. The minimum point is determined at minus 9.75
percent. The average standard deviation for the 10 assets is 2.47 percent, which
means that there is a considerable variation in price differentials among the sample.
This can also be illustrated in the following Diagram 1, presenting the cross-traded
assets’ price discrepancies by intervals of 2.5 percentage points.
The Law of One Price – Evidence from Three European Stock Exchanges
32
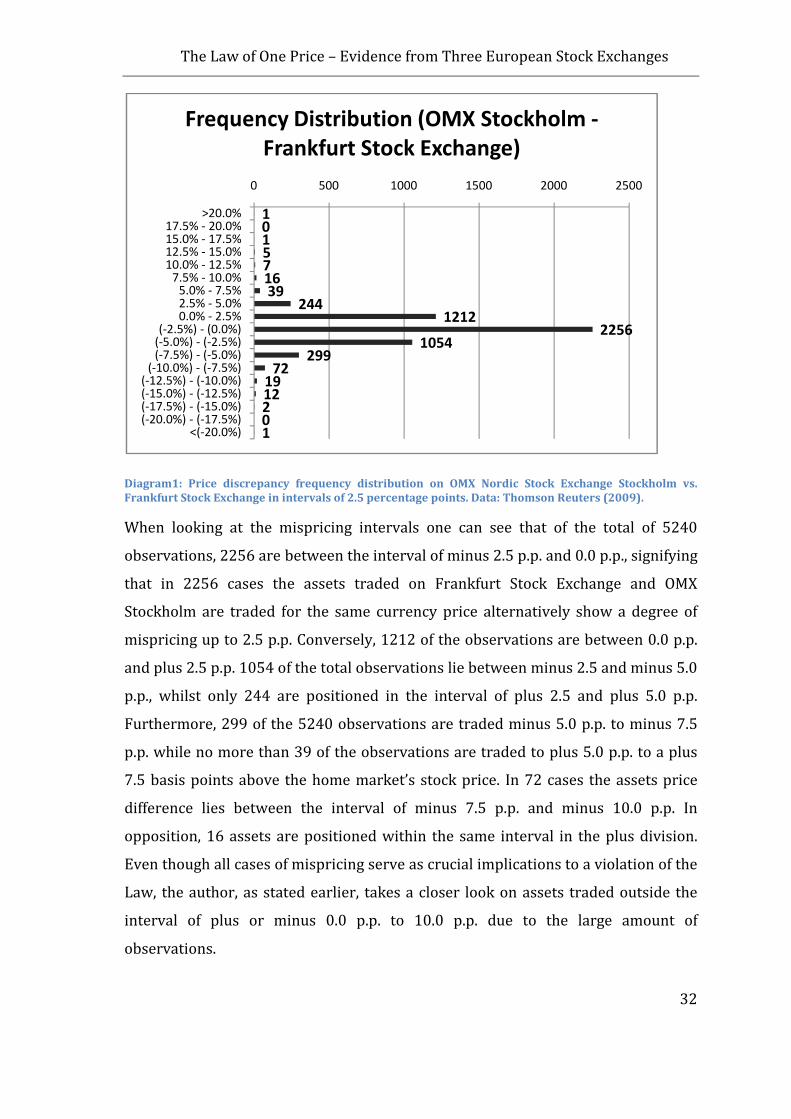
Diagram1: Price discrepancy frequency distribution on OMX Nordic Stock Exchange Stockholm vs.
Frankfurt Stock Exchange in intervals of 2.5 percentage points. Data: Thomson Reuters (2009).
When looking at the mispricing intervals one can see that of the total of 5240
observations, 2256 are between the interval of minus 2.5 p.p. and 0.0 p.p., signifying
that in 2256 cases the assets traded on Frankfurt Stock Exchange and OMX
Stockholm are traded for the same currency price alternatively show a degree of
mispricing up to 2.5 p.p. Conversely, 1212 of the observations are between 0.0 p.p.
and plus 2.5 p.p. 1054 of the total observations lie between minus 2.5 and minus 5.0
p.p., whilst only 244 are positioned in the interval of plus 2.5 and plus 5.0 p.p.
Furthermore, 299 of the 5240 observations are traded minus 5.0 p.p. to minus 7.5
p.p. while no more than 39 of the observations are traded to plus 5.0 p.p. to a plus
7.5 basis points above the home market’s stock price. In 72 cases the assets price
difference lies between the interval of minus 7.5 p.p. and minus 10.0 p.p. In
opposition, 16 assets are positioned within the same interval in the plus division.
Even though all cases of mispricing serve as crucial implications to a violation of the
Law, the author, as stated earlier, takes a closer look on assets traded outside the
interval of plus or minus 0.0 p.p. to 10.0 p.p. due to the large amount of
observations.
101571639
2441212
22561054
29972
1912201
0 500 1000 1500 2000 2500
>20.0%17.5% - 20.0%15.0% - 17.5%12.5% - 15.0%10.0% - 12.5%
7.5% - 10.0%5.0% - 7.5%2.5% - 5.0%0.0% - 2.5%
(-2.5%) - (0.0%)(-5.0%) - (-2.5%)(-7.5%) - (-5.0%)
(-10.0%) - (-7.5%)(-12.5%) - (-10.0%)(-15.0%) - (-12.5%)(-17.5%) - (-15.0%)(-20.0%) - (-17.5%)
<(-20.0%)
Frequency Distribution (OMX Stockholm -
Frankfurt Stock Exchange)

The Law of One Price – Evidence from Three European Stock Exchanges
33
When examining assets that are traded within the five intervals (minus and plus
10.0 to 12.5 p.p.; 12.5 to 15.0 p.p.; 15.0 to 17.5 p.p.; 17.5 to 20 p.p. and 20.0 p.p. and
higher, respectively) between minus or plus 10.0 p.p. to minus and plus greater than
20.0 p.p., the author concludes that 34 of the cases can be observed in the minus
interval whilst no more than 14 are observed in the plus interval. By analyzing raw
data of assets’ traded within these intervals the author identifies a pair of
underlying incidents causing the price discrepancies.
The first observation when analyzing raw data of the total amount of 48
observations is that in numerous cases the assets are traded relatively stable on the
two stock markets when the price suddenly drops or rises in one of the assets. This
can be illustrated in several examples, as the case of the Alfa Laval asset that on
November 13, 2007 drops on the Swedish market whilst it remains at the same
price on Frankfurt Stock Exchange until the following day. This trend can also be
exemplified in the Elekta asset, which on March 8, 2007 shows a considerable rise
on the Frankfurt market whilst it practically remains on the same price level on the
Swedish stock market (there is a small price difference that possible is eliminated
when adjusting for changes in exchange rate the actual day). Only a few days after
the same trend repeats when the same asset drops on the Frankfurt market
remaining at the same price level on the Swedish market. A third example refers to
Bio Invent that on March 3, 2007 is traded to a 11.82 percent premium at the
Frankfurt market for one day before a price converge takes place (although not to
perfect price level) also on the Frankfurt market. Finally also the same can be
observed when studying Investor, that on August 8, 2008 is traded at 10.78 percent
above its domestic price. The main conclusion about these and other not
exemplified cases is therefore that there is a one day of delay in price change which
causes the temporal mispricing of the assets (see also the graph illustrating the
pattern of relative price discrepancy of Alfa Laval, Elekta, Bio Invent and Investor in
appendix i)).
When analyzing the pattern, the author mainly thinks of three possible explanations
for the delay of price change. The first one is national holidays that do not coincide
on the two markets the actual trading day. This option will however be disregarded

The Law of One Price – Evidence from Three European Stock Exchanges
34
since the author discovers that the days in question do not coincide with any
national holiday in the two countries. A second explanation could be a weak trading
activity in one of the markets that would cause the mispricing. The author discovers
an everyday price movement in the particular assets, wherefore she can conclude
that there is a daily activity on the two markets. However, due to the fact that the
author only can come across daily trading volume data on OMX Stockholm every
day, she cannot draw any conclusions about the extension of the trading activity and
consequently any definitive conclusions about the impact of the trading activity on
the detected mispricings. A third possible explanation to the particular mispricings
is asymmetric information, where one of the market’s investors may have acted
upon new information whilst the other market’s investors have not. This might be
the causing one part of the mispricing in especially one particular case, namely the
example of the Alfa Laval asset that on November 13, 2007 drops on the Swedish
market whilst it remains at the same price on Frankfurt Stock Exchange until the
following day. By examining the prices for both assets and the trading volume of the
Alfa Laval assets on OMX Stockholm, the author discovers that there is a big
increase in the trading volume this day in comparison to the previous and following
day. One possible explanation to the sudden price drop on the domestic market
could therefore be new information presented on OMX Stockholm that is not
presented on Frankfurt Stock Exchange.
A second observation when analyzing raw data of the total amount of 48
observations is that in few cases an asset shows a degree of mispricing that lasts for
several days, thus presenting a long-lasting delay of price changes in some cases.
This tendency can be exemplified by the case of Alfa Laval when it between
November 3, 2007 and November 5, 2008 is mispriced for three days (traded at
13.38, 21.40 and 16.32 percent respectively below the home market’s value) before
the Euro price in Frankfurt finally converges to the Swedish price. In this particular
case the author detects the price level remains at the same level on Frankfurt Stock
Exchange over the three particular days, which strongly implies that the factor
causing mispricing in this case is lack of trading activity. The relationship between
asset’s trading activity and consequently turnover and degree of mispricing has

The Law of One Price – Evidence from Three European Stock Exchanges
35
been discussed earlier (see methodology chapter) where the author states that this
might be a factor causing mispricing. A deeper analysis is therefore conducted
further on in this chapter in order to draw conclusions about whether there might
be a correlation between the two variables. Moreover, when examining the possible
presence of holidays these particular days the author can disregard the impact of
any holidays as no holidays coincide with these days.
However, the author also detects cases of delays in price changes causing mispricing
that appear to need further explanations than the previous ones. The author finds
several cases where price discrepancies seem to persist on one of the markets
despite the fact that the assets present a relatively stable trading activity on OMX
Stockholm and considerable price movements on both markets (there are also no
superior changes observed in the exchange rate during the days). This can, among
others, be illustrated in the example of Bio Invent which is traded below its
domestic market value for several days from March 14, 2007 before the prices
converge to a common currency level. In this case there exists a delay in price
change in one of the assets despite the fact that it presents considerable price
fluctuations on both the Swedish and the German market, which perhaps could
reject the lack of trading activity causing mispricing supposition. Possible
explanations to the detected mispricings are the presence of information
asymmetry and an increased presence of irrational market behavior on one of the
markets these particular days. These factors may also serve as explicators to some
particular cases where the author detects that the value of one asset drops on one
market at the same time as it goes up on the other. This pattern is highly
inconsistent with the theory of the Law, also showing that the assets’ prices actually
diverge instead of converge. This can mainly be exemplified by Bio Invent that on
November 12, 2007, despite the fact that it gains value on the Swedish market drops
on the German market (a divergence in the EUR exchange rate is also observed).
Another example is the SEB asset that on January 22, 2008 drops on the Frankfurt
Stock Exchange while it goes up on the domestic market (even in this case there is a
divergence in the EUR exchange rate). However, in these cases the price

The Law of One Price – Evidence from Three European Stock Exchanges
36
convergence occurs reasonably rapidly where an adaptation takes place the next
following day.
A final observation is that the mispricing interval widens as closer the markets get
the financial crisis. During the financial crisis markets worldwide are characterized
by high volatility and probably not all price changes equal fundamental values due
to the impact of market frictions. This strengthens the author’s earlier supposition
that more volatile times may present more cases of mispricing, which also can be
observed in varying extent when studying the historical pattern of the price
discrepancies on the assets (see also appendix i)).
4.2 London Stock Exchange - Frankfurt Stock Exchange
Table 2 reports the statistics of the average turnover, average price differentials, the
maximum and minimum price discrepancies as well as the standard deviation on
the 9 assets traded on London Stock Exchange and Frankfurt Stock Exchange.

The Law of One Price – Evidence from Three European Stock Exchanges
37
Table 2: Average turnover, average relative degree of mispricing, absolute value of average relative
degree of mispricing, median of all relative mispricings, maximum and minimum points of relative
discrepancies and standard deviation of relative mispricings on London Stock Exchange vs. Frankfurt
Stock Exchange, considering the time period from February 16, 2007 to February 18, 2009. Data:
Thomson Reuters & Yahoo Finance (2009).

The Law of One Price – Evidence from Three European Stock Exchanges
38
When studying the price discrepancies considered 9 stocks included in the sample,
one can determine that all assets are, on average, traded to a 0.11 basis points
premium to home market’s stock price. The median presents an average mispricing
of 0.06 percent above the home market’s value. Table 2 shows the assets’ price
differentials separately, where all assets included in the sample show a degree of
mispricing, except BT Group that presents an average mispricing degree of 0.00
percent. However, the asset does present fluctuations in price differentials during
the considered period, which also may be illustrated in the mispricing intervals
where the maximum price discrepancy reaches the peak of plus 9.01 percent and a
minimum of minus 6.9 percent (see also the graph illustrating the pattern of relative
price discrepancy of BT Group in appendix ii)). Vodafone is also showing a very low
average mispricing rate of plus 0.01 percent, meaning that the asset’s average price
is 0.01 higher than the price of the domestic stock. Vodafone also is the asset
presenting less fluctuation in the sample also showing the smallest intervals in price
discrepancy, with the maximum point of plus 2.89 percent and a minimum point of
minus 3.31 percent (see also Vodafone’s graph in appendix ii)). Reed Elsevier
presents the major negative relative price difference of minus 1.16, at the same time
as Barclays shows major positive mispricing of 1.07. Ladbrokes, Johnson Matthey
and BP also show small average relative price differentials, presenting minus 0.13,
minus 0.13 and plus 0.17 percents respectively. John Matthey is the asset presenting
the largest interval of mispricing showing a maximum peak value of plus 23.4
percent and a minimum peak value of minus 17.23 percent. Finally, British Airways
and Lloyd Banking show a standard mispricing of 0.48 and 0.67 correspondingly,
implying that British Airways and Lloyd Banking are 0.48 and 0.67 more expensive
than the underlying domestic assets.
The average maximum price discrepancy for the sample is 12.04 percent, signifying
that the assets are as highest traded to a 12.04 basis points premium to London
Exchange’s stock price. The minimum point is determined at minus 8.57 percent.
The average standard deviation for the 9 assets is 1.89 percent, which means that
there is a variation in price differentials among the sample. This can also be
illustrated in the following figure 2, which in accordance with the analysis of OMX

The Law of One Price – Evidence from Three European Stock Exchanges
39
Stockholm and Frankfurt Stock Exchange, presents the cross-traded assets’ price
discrepancies by intervals of 2.5 percentage points.
Diagram 2: Price discrepancy frequency distribution on London Stock Exchange vs. Frankfurt Stock
Exchange in intervals of 2.5 percentage points. Data: Thomson Reuters (2009).
When studying the mispricing intervals one can see that of the total of 4716
observations, 1787 are between the interval of minus 2.5 p.p. and 0.0 p.p., telling
that in 1787 cases the assets traded on London Stock Exchange vs. Frankfurt Stock
Exchange are traded for the same currency price alternatively show a degree of
mispricing up to 2.5 p.p.. In opposition, 2180 of the observations are between 0.0
p.p. and plus 2.5 p.p. Moreover, 315 of the total observations lie between minus 2.5
and minus 5.0 p.p., whilst 267 are positioned in the interval of plus 2.5 and plus 5.0
p.p.. Furthermore, 54 of the 4716 observations are traded minus 5.0 p.p. to minus
7.5 p.p. while 72 of the observations are traded to plus 5.0 p.p. to a plus 7.5 basis
points above the home market’s stock price. In 8 cases the assets’ price difference
lies between the interval of minus 7.5 p.p. and minus 10.0 p.p. On the contrary, 18
assets are situated within the same interval in the plus interval.
2010718
72267
21801787
31554
831100
0 500 1000 1500 2000 2500
>20.0%17.5% - 20.0%15.0% - 17.5%12.5% - 15.0%10.0% - 12.5%
7.5% - 10.0%5.0% - 7.5%2.5% - 5.0%0.0% - 2.5%
(-2.5%) - (0.0%)(-5.0%) - (-2.5%)(-7.5%) - (-5.0%)
(-10.0%) - (-7.5%)(-12.5%) - (-10.0%)(-15.0%) - (-12.5%)(-17.5%) - (-15.0%)(-20.0%) - (-17.5%)
<(-20.0%)
Frequency Distribution (London Stock
Exchange - Frankfurt Stock Exchange)

The Law of One Price – Evidence from Three European Stock Exchanges
40
When examining assets that are presenting a price discrepancy within the interval
between minus or plus 10.0 p.p. to minus and plus more than 20.0 p.p., the author
concludes that 5 of the cases can be observed in the minus interval whilst 10 are
observed in the plus interval. When the author analyses raw data of assets’ traded
within this interval the author identifies a number of underlying incidents that
appear to explain the price discrepancies.
The author’s principal observation is that there is only one case of mispricing
detected on assets within the defined interval before September 14, 2008, before
the Financial Crisis of 2008 seemingly, by reporting the Lehman Brothers collapse,
begins to carry out a threat also against the European markets. This fact implies that
the high volatility might bring along market frictions that may cause the extreme
price discrepancies. Increased degree of mispricing on the assets included in this
sample may also be observed in varying size when studying the historical pattern of
the price discrepancies on the assets (also see appendix ii)).
A second observation, also observed when examining the raw data of assets traded
on London Stock Exchange and Frankfurt Stock Exchange, is that in various cases
the assets are traded comparatively stable on the two stock markets when the price
suddenly drops or rises in one of the assets. This can be illustrated in several
examples; the first one can be detected when examining the British Airways asset
that on November 12, 2008 goes up on the Frankfurt market whilst it remains on
the same price level on the London market, before an adaptation takes place the
next coming day. The same pattern is demonstrated in the Reed Elsevier asset that
on September 19, 2008 is traded at a premium of 11.49 percent on the domestic
market practically remaining on the same price level on the German stock market
(there is a small price difference that possibly is eliminated when adjusting for
changes in exchange rate the actual day). A third example refers to Ladbrokes that
on October 6, 2008 is traded 11.67 percent above the London market for one day
before a price converge takes place (even if not to a perfect common currency level)
also on the Frankfurt market. The opposite relation can be seen only two days later,
on October 8, 2008 when the asset shows a one day lasting price discrepancy of

The Law of One Price – Evidence from Three European Stock Exchanges
41
minus 10,67 percent, implying that the asset is traded to a 10.67 basis points above
on the London market.
The author’s principal action when detecting one day peaks, is to say there is a one
day of delay in price change on one of the assets which causes the temporal
mispricing, is to eliminate national holidays as an explanatory factor to the
particular price changes. In this case no holidays coincide with the actual dates. A
second explanation the author thinks of is a weak trading activity in one of the
markets causing the mispricing. She discovers an everyday price movement in the
particular assets, wherefore she can determine that there is a daily activity on the
two markets. However, due to the fact that the author only can come across daily
trading volume data on the London Stock Exchange, she cannot draw any
conclusions about the extension of the trading activity and consequently any
definitive conclusions about the impact of the trading activity on the detected
mispricings. A third possible explanation to the particular mispricings is
asymmetric information, where one of the market’s investors may have acted upon
new information whilst the other market’s investors have not. A fourth possible
explanation could be an increased irrational behavior these particular days.
A third observation, also stated in when examining the stock markets in Stockholm
and Frankfurt, is that in several cases the value of one asset drops on one market at
the same time as it goes up on other, and when this is not motivated by exchange
rate movements. This pattern is highly inconsistent with the theory of the Law;
where the two assets’ prices diverge instead of converge. This can be exemplified by
Johnson Matthey that on May 30, 2008 is traded 17.23 percent below its home
market’s value on the German market and British Airways that on September 9,
2008 that, despite the fact that it gains value on the London market drops on the
German market. Another, contrary example is the Lloyd Banking assets that on
September 18, 2008 suddenly drops on the London market while it goes up on the
Frankfurt market, before the price converges to a common currency price the
following day. A third example refers to Barclays that on the same day September
18, 2008 equally to Lloyd Banking drops on the London Market whilst it goes up on
the Frankfurt market. In none of these cases, exchange rate movements motivated
The Law of One Price – Evidence from Three European Stock Exchanges
42
such behavior. Possible explanations to the detected inconsistencies are the
presence of information asymmetry and an increased presence of irrational market
behavior on one of the markets these particular days.
4.3 A Comparative Stock Exchange Analysis
When comparing the empirical findings from Stockholm OMX vs. Frankfurt Stock
Exchange and London Stock Exchange vs. Frankfurt Stock Exchange the author
detects that there are several differences in the two markets’ price discrepancy
patterns. The principal observation is that the Stockholm vs. Frankfurt combination
shows a higher degree of mispricing than the London vs. Frankfurt combination;
presenting an average relative price discrepancy of minus 1.28 percent which is
considerably higher than the average price discrepancy of plus 0.11 detected on the
London vs. Frankfurt markets. A second detection is that the cross-traded assets on
Frankfurt vs. Stockholm markets on average are traded below the Swedish market’s
value, whilst the opposite relation is detected on London vs. Frankfurt markets
where the average asset is traded above the British market’s value. When
comparing the average maximum price discrepancies for the two market
combinations there are also considerable differences in maximum peaks.
By first examining the highest and average lowest price differential points,
Stockholm vs. Frankfurt shows a maximum point of 20.59 percent that can be
compared to the London vs. Frankfurt that presents a highest point of 12.04,
implying that the assets are, on average, as highest traded to a 12.04 basis points
premium to London Exchange Market’s stock price. The same observation can be
made when looking at the markets’ minimum points where Stockholm vs. Frankfurt
shows an average minimum point of minus 21.40 percent that can be compared to
the average minimum point of minus 8.57. The fact that the Stockholm vs. Frankfurt
combination shows wider spreads in mispricing than the London vs. Frankfurt
combination can also be seen when comparing the standard deviations of the two
market compositions, where Stockholm vs. Frankfurt presents standard deviation of
2.49 percent which can be compared to London vs. Frankfurt’s standard deviation
of 1.89 percent.
The Law of One Price – Evidence from Three European Stock Exchanges
43
The previous can also be strengthened when studying the two markets’ frequency
distribution diagrams where a larger amount of the Swedish assets are presented
within the higher intervals than the British ones. For Swedish assets 0.9 percent of
the detected mispricings lie between the interval of minus and plus 10 percent to
minus and plus 20 percent and more. This can be compared to the British assets
where only 0.3 percent of the mispricings lie within the same interval. It is also clear
that the degree of mispricing on the British assets is considerably lower, as 84
percent of the mispricings are located within the intervals of minus and plus 0.00
percent to minus and plus 2.5 percent, whilst only 28 percent of the mispricings on
the Swedish assets are located within the same interval.
The fact that the assets traded on Stockholm vs. Frankfurt present a higher degree
of mispricing, also showing more cases of mispricings lying in the, by the author’s
definition, more extreme area (minus and plus 10.0 p.p. to minus and plus 20.0 p.p.
and more) and present less cases of smaller degrees of mispricings is interesting,
since it might say a lot about the market conditions of the two markets. The
discrepancy between the two market combinations might reveal that there is a
higher presence of market imperfections on OMX Stockholm vs. Frankfurt. The
author has already discussed the possible impact of scarcity in trading activity,
information asymmetry and temporal increments in irrational market behavior on
the detected mispricings. Another suspicion is that there might be differences in the
degree of information efficiency between the considered markets, where based on
the results of this study, OMX Stockholm vs. Frankfurt seem to have less efficient
markets. This due to the EMH’s supposition, given the scenario where all investors
have same access to information it is difficult for investors to outperform the
market and generate gains from mispricing on cross-traded assets over time.
4.4 Explanatory Factors to Mispricing
In this study the author reveals that mispricing exists to a significant degree on the
three considered European stock markets. She has already briefly discussed the
possible impact of information asymmetry, trading activity and irrational market
behavior on mispricing. Moreover, other market imperfections that appear in this
study are transaction costs, institutional barriers, tick-size, turnover and changes in

The Law of One Price – Evidence from Three European Stock Exchanges
44
exchange rate. All factors serve as important implications when testing a validation
of the Law on internationally traded assets, since they could eliminate any possible
opportunity of arbitrage. Consequently, the author deepens the discussion about
possible explanatory factors in order to be able to draw reasonable conclusions
about the detected mispricings.
When studying mispricings on the three European markets, the author comes
across several observations where information asymmetry may serve as an
explicator to the detected price discrepancy. Particularly in cases where there is a
delay in price change in the assets’ foreign market this seems to be reasonable
explanation due to domestic investors’ better knowledge about the economic
prospects in their own country and faster update about domestic shares’ news.
Even though it has been stated that asymmetric information has been to decline
thanks to increased advancements in technology letting more and more people
easily access all types of information, apparently it still continues to make an issue
on the European markets.
Another aspect of information asymmetry is the possible presence of “noise”
traders. “Noise” investors may serve as reasonable explicators to some of the
detected mispricings, where speculators as well as insiders and institutions on the
three markets buy and sell the assets for reasons that are not related to the assets’
real values (such as for diversification, liquidity and taxes etc.) thus causing the
mispricing. The author believes that these in particular, might have a more piercing
effect on assets’ prices on the German market where the trading activity of the
Swedish and British is relatively low, wherefore investment decisions of bigger
institutions may as well have a huge impact on these assets’ prices.
The possible impact of transaction costs on the detected mispricings is another
factor that can be discussed within asymmetric information, especially since it is
assumed that the presence asymmetric information on these markets may as well
increment these costs. Although, today’s well-functioning financial markets are
supposed to provide lower transaction costs due to a free capital movement across
the European borders and the general movement towards a consolidation of
The Law of One Price – Evidence from Three European Stock Exchanges
45
existing exchanges trading similar securities and hence more universal trading
platforms and information centers, the author cannot disregard the actual effect of
transaction costs on the detected mispricing. She also believes the consolidation
might as well, initially when there is an increased supply of investment options, give
birth to a greater demand of intermediaries, such as brokers or consultants, which
brings additional transaction costs.
The previous discussion also leads to the discussion about the possible presence of
institutional barriers and a doubt whether the alleged harmonizing of the European
financial markets through MiFID yet has had the desired effect on these particular
markets. Sympathizers of the regulation claim that MiFID has created more efficient
financial markets. By breaking the monopoly of the European stock exchanges that
had long enjoyed on where a stock was traded, the transaction costs are now
assumed to be lower creating these particular efficient market conditions. However,
the fact that the author detects a significant amount of mispricings on the European
markets included in this study makes her strongly doubt that the effects of the
regulation are yet visible. One of the main concerns might be the fragmentation of
trading venues, where investors have to seek market data from numerous European
trading platforms, leading to an additional amount of time and effort needed to
benefit from dedication to cross-border trading. Another institutional barrier
preventing cross-border investing may also be restrictions in shorting, which limits
the possibility to act upon price discrepancies.
Another element restricting the possibility to act upon mispricings is the tick size
factor. In this case, the minimum decimalization criterion might restrict investors
from acting upon some of the existing price discrepancies on the three markets,
wherefore it may explain a small part of the detected mispricings.
The author also discusses the possible impact of trading activity on the mispricings.
By analyzing the relationship between the assets’ average turnover and the average
absolute mispricings, the author may be able to draw conclusions about the possible
impact of the trading activity on the detected mispricings. This is made by
conducting a regression analysis. Figure 3 shows the linear regression relationship

The Law of One Price – Evidence from Three European Stock Exchanges
46
between average absolute mispricing and average turnover on every cross-traded
asset on OMX Stockholm and Frankfurt Stock Exchange:
Figure 3: The linear regression relationship between absolute average price difference and average
turnover on the cross-traded assets on OMX Nordic Stock Exchange Stockholm vs. Frankfurt Stock
Exchange. The y-variable makes the absolute average price difference whilst the x-variable makes the
average turnover on every asset; calculated as the average value of closing prices multiplied with
trading volumes every day, considering the time period from February 16, 2007 to February 18, 2009.
Every point constitutes a cross-traded asset on the two markets. Data: Yahoo Finance (2009).
By studying the linear regression relationship between average price discrepancy
and average turnover on the cross-traded assets on OMX Nordic Stock Exchange
Stockholm one can determine that the line is downward sloping presenting a
negative relationship between the absolute degree of mispricing and average
turnover, implying that a higher degree of price discrepancy can be explained by a
lower turnover on the cross-traded assets and vice versa. The R2 value is 0.3347,
signifying that the assets’ turnover rate to 33.47 percent explains the detected
mispricings. The results of the significance test state that the outcome is statistically
significant on the 90 percent level, is to say H0 can be rejected with 90 percent
probability.
y = -1E-10x + 0.0194
R² = 0.3331
0%
1%
2%
3%
4%
0 50 100 150
EUR Millions
Absolute Average Price Difference
vs. Average Turnover
(OMX Stockholm - Frankfurt Stock
Exchange)
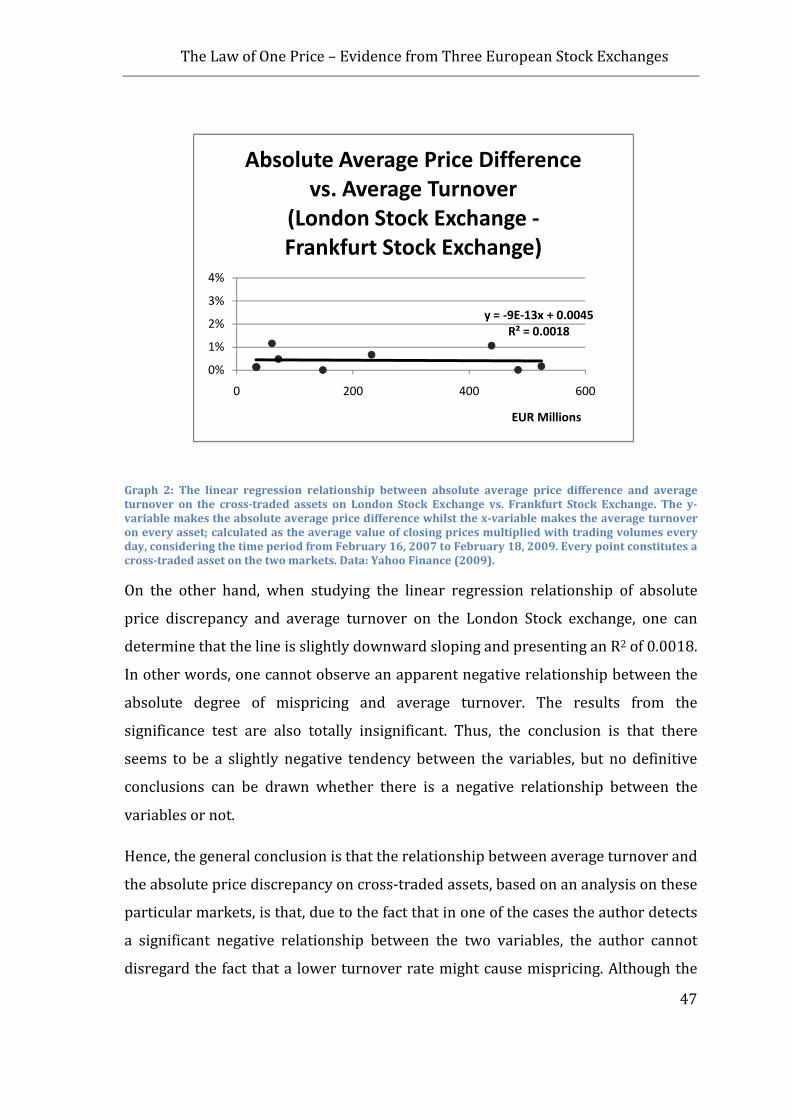
The Law of One Price – Evidence from Three European Stock Exchanges
47
Graph 2: The linear regression relationship between absolute average price difference and average
turnover on the cross-traded assets on London Stock Exchange vs. Frankfurt Stock Exchange. The y-
variable makes the absolute average price difference whilst the x-variable makes the average turnover
on every asset; calculated as the average value of closing prices multiplied with trading volumes every
day, considering the time period from February 16, 2007 to February 18, 2009. Every point constitutes a
cross-traded asset on the two markets. Data: Yahoo Finance (2009).
On the other hand, when studying the linear regression relationship of absolute
price discrepancy and average turnover on the London Stock exchange, one can
determine that the line is slightly downward sloping and presenting an R2 of 0.0018.
In other words, one cannot observe an apparent negative relationship between the
absolute degree of mispricing and average turnover. The results from the
significance test are also totally insignificant. Thus, the conclusion is that there
seems to be a slightly negative tendency between the variables, but no definitive
conclusions can be drawn whether there is a negative relationship between the
variables or not.
Hence, the general conclusion is that the relationship between average turnover and
the absolute price discrepancy on cross-traded assets, based on an analysis on these
particular markets, is that, due to the fact that in one of the cases the author detects
a significant negative relationship between the two variables, the author cannot
disregard the fact that a lower turnover rate might cause mispricing. Although the
y = -9E-13x + 0.0045
R² = 0.0018
0%
1%
2%
3%
4%
0 200 400 600
EUR Millions
Absolute Average Price Difference
vs. Average Turnover
(London Stock Exchange -
Frankfurt Stock Exchange)

The Law of One Price – Evidence from Three European Stock Exchanges
48
results of this implementation of the linear regression model do not present
impermeable evidence it is of relevance to include the possible impact of turnover
when examining discrepancies on cross-traded assets. However, more studies are
needed to study this relationship in order to draw more comprehensive conclusions
about the link between the two variables.
The author also considers the possible impact of sudden changes in the exchange
rate as an explanatory factor to mispricing, is to say, there is a delay in adaptation to
fluctuations in the exchange rate on the considered stock markets. This impact is
measured by carrying out a correlation matrix on the two market combinations. By
conducting a correlation analysis on assets traded on OMX Stockholm vs. Frankfurt,
the author determines that the correlation is 36.5 percent. Quite similar results are
obtained when determining the correlation coefficient on assets traded on London
vs. Frankfurt, where the correlation is 30.4 percent (see also the correlation
matrices in appendix iii)). The results of the correlation appear interesting since the
fact that the correlations in both market combinations are greater than zero. The
higher the correlation is (as it gets closer to 1) the higher is the probability that the
exchange rate is the causing factor. In this case, the correlations of 36.5 and 30.4
percent say that one cannot disregard the fact that some cases of the detected
mispricings may as well depend on changes in exchange rate. Consequently, based
on this study’s results, the exchange rate should serve as another factor when
analyzing possible causers to mispricings.
One other important factor that the author includes when analyzing the results of
this study is irrational market behavior. Particularly, in cases where the value of one
asset drops on one market at the same time as it goes up on the other the author,
despite mentioning the possible impact of information asymmetry and the Financial
Crisis, throws her suppositions of an increased degree of irrationality in investor
behavior, which causes the mispricings. The author considers the factor as highly
relevant due to the fact that she believes that investors tend to make biased
investment decisions, since rationality restrictions in human nature restrict in how
well investment decisions can be defined. This assumption can also be expressed as
“true uncertainty”, defending the irrational behavior by stating that investors tend

The Law of One Price – Evidence from Three European Stock Exchanges
49
to fail to act rationally since they are not fully informed by market conditions.
Nevertheless, even though the fact irrationality in market behavior to some degree
is excusable, the author still thinks it is a concern of issue since it can explain a
considerable part of the detected mispricings in this study.

The Law of One Price – Evidence from Three European Stock Exchanges
50
5. Conclusions
Mainly two strands of literature within the financial theory discuss the phenomenon
of mispricing and imperfect market conditions. The first literature is the EMH,
deriving from the assumption that prices reflect assets’ fundamental values due to
information efficiency, wherefore it is impossible for investors to outperform the
market and generate gains from mispricing on cross-traded assets over time. The
second literature discussing mispricing, is the Law. The Law extends the analysis of
the EMH by stating that in a perfectly integrated and competitive market cross-
traded assets should trade for the same common-currency price in every country.
The Law is held due to the presence of arbitrageurs’ continuous vigilance in the
financial markets, where any case of mispricing is acted upon in a matter of seconds
by buying the cheaper asset and selling it where the price is higher in order to make
a profit from the price gap. Nevertheless, even though the Law seems to be a fine
and non-conversional law, mispricing has been detected repeatedly on financial
markets. In the introduction of this study the author discusses two prominent cases,
the closed-end funds and the Siamese twins, both making cases where a same asset
traded in different markets does not have the same common-currency price over
time, being highly inconsistent with both the Law and the EMH. Nonetheless, in
these cases the mispricings are not recognized as riskless arbitrage opportunities
due to the suspicion of presence of market imperfections, which may as well explain
a considerable part of the price discrepancies.
In this study the author implements a validation test of the Law in order to study
the degree of mispricing on three European stock exchanges. Consequently, from
the prevalent theoretical point of view, the author maps what possible market
imperfections may eliminate the price discrepancies.
The principal conclusion of this study is that mispricing exists to a significant degree
on the three considered European stock markets. When studying the historical
pattern of the mispricings, the author detects substantial price discrepancies during
the whole period of reference, where almost all assets show sudden drops or rises
on the domestic or foreign market during the period, is to say present days where

The Law of One Price – Evidence from Three European Stock Exchanges
51
the asset is traded considerably below or above the domestic or foreign market. An
additional observation is that the degree of mispricing becomes higher as the effects
of the Financial Crisis begin to carry out on the European financial markets.
When comparing the empirical findings from Stockholm OMX vs. Frankfurt Stock
Exchange and London Stock Exchange vs. Frankfurt Stock Exchange the author
detects that there are several differences in the two markets’ price discrepancy
patterns. The Stockholm vs. Frankfurt combination shows a higher degree of
average mispricing than the London vs. Frankfurt combination, also showing more
cases of extreme mispricings. Moreover, the assets on Frankfurt vs. Stockholm
markets are on average traded below the Swedish market’s value, whilst the
opposite is seen on the London vs. Frankfurt markets where the average asset is
traded above the British market’s value. The author’s main conclusion when
observing the differences is that the market conditions may vary on the considered
markets, where there is a higher presence of market imperfections on OMX
Stockholm vs. Frankfurt than London vs. Frankfurt and that there are differences in
the degree of information efficiency between the considered markets, where based
on the results of this study, OMX Stockholm and Frankfurt seem to have less
efficient markets.
Moreover, when the author maps what possible market imperfections may
eliminate the price discrepancies, she identifies transaction costs, including
asymmetric information; institutional barriers, including the European Legislation
MiFID; turnover; changes in exchange rate; tick size and irrational market behavior
as possible explanatory factors to the detected mispricings.
The author believes that transaction costs still continue to burden investors despite
the assumption of lower transaction costs as a result of well-functioning and more
and more consolidated financial markets, in addition believing that the
consolidation of exchange markets initially might result in an increased supply of
investment options and an increased demand of Intermediaries, implying additional
transaction costs. Moreover, the author includes information asymmetry as a
market imperfection that particularly seems to serve as a reasonable explanation in
The Law of One Price – Evidence from Three European Stock Exchanges
52
cases where there is a delay in price change in the assets’ foreign market, being a
consequence of be domestic investors’ better knowledge about the economic
prospects in their own country and faster update about domestic shares’ news. She
also mentions the possible impact of “noise” traders on mispricing, especially on the
Frankfurt Stock Exchange where the trading activity is relatively low, and thus, due
to the absence of traders the investment decisions of bigger institutions probably
have a great impact on the assets’ prices.
Furthermore, the author includes institutional barriers as an explanatory factor,
where she foremost questions the MiFID and its attempted harmonizing effects on
European financial markets. The realization of MiFID is supposed to bring along
lower transaction costs and facilitate the trading activity within the EU through
more trading platforms, however, due the fact that the author detects a significant
amount of mispricings on the European markets included in this study makes her
strongly doubt that the effects of the regulation are yet visible.
Likewise, the author considers the tick size factor, as the minimum decimalization
criterion might restrict investors from acting upon some of the existing price
discrepancies on the three markets, wherefore it may explain a small part of the
detected mispricings.
The author also discusses the possible impact of scarcity in trading activity,
believing that it makes one of the most important explanations to the detected
mispricings. The results from the linear regression model to some extent strengthen
the author’s hypothesis that there is a connection between these two variables, even
though more research is needed to study this relationship to be able to draw more
definitive conclusions.
The author also believes that the mispricings cannot be disconnected from changes
in the exchange rate. The results of this study reveal that there might be delays in
adaptations to changes in exchange rates causing mispricings, wherefore this factor
needs to be studied more thoroughly in future works.
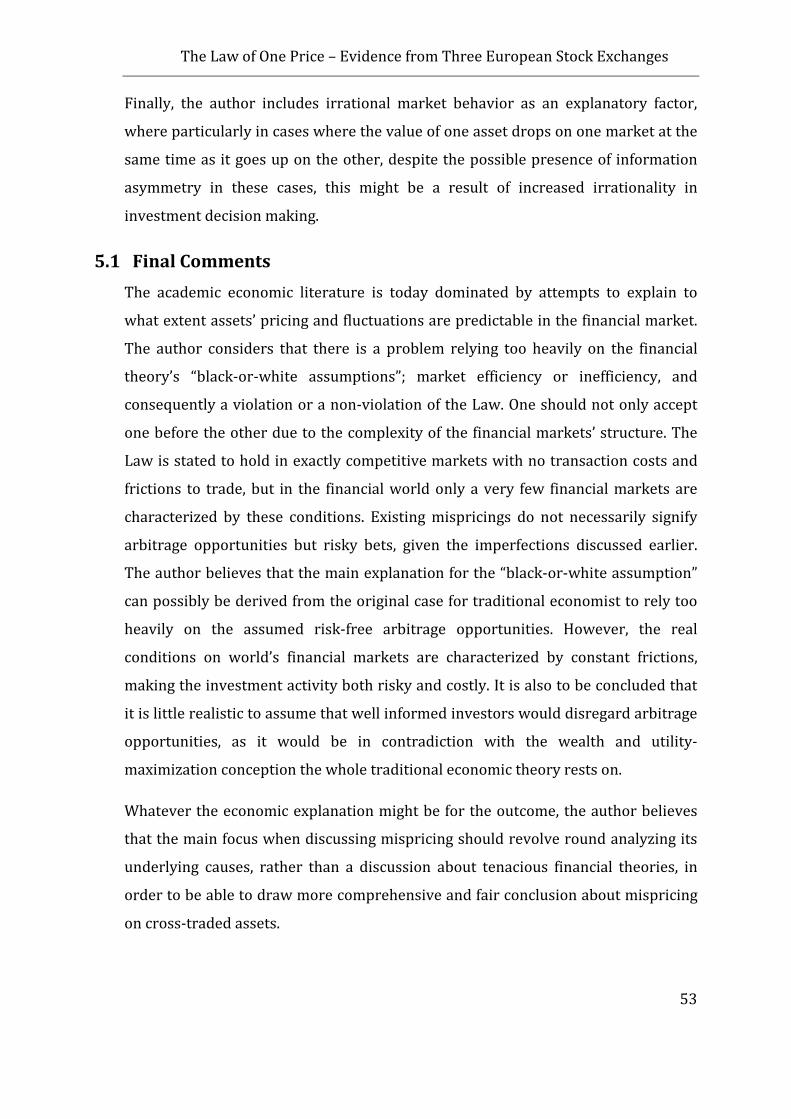
The Law of One Price – Evidence from Three European Stock Exchanges
53
Finally, the author includes irrational market behavior as an explanatory factor,
where particularly in cases where the value of one asset drops on one market at the
same time as it goes up on the other, despite the possible presence of information
asymmetry in these cases, this might be a result of increased irrationality in
investment decision making.
5.1 Final Comments
The academic economic literature is today dominated by attempts to explain to
what extent assets’ pricing and fluctuations are predictable in the financial market.
The author considers that there is a problem relying too heavily on the financial
theory’s “black-or-white assumptions”; market efficiency or inefficiency, and
consequently a violation or a non-violation of the Law. One should not only accept
one before the other due to the complexity of the financial markets’ structure. The
Law is stated to hold in exactly competitive markets with no transaction costs and
frictions to trade, but in the financial world only a very few financial markets are
characterized by these conditions. Existing mispricings do not necessarily signify
arbitrage opportunities but risky bets, given the imperfections discussed earlier.
The author believes that the main explanation for the “black-or-white assumption”
can possibly be derived from the original case for traditional economist to rely too
heavily on the assumed risk-free arbitrage opportunities. However, the real
conditions on world’s financial markets are characterized by constant frictions,
making the investment activity both risky and costly. It is also to be concluded that
it is little realistic to assume that well informed investors would disregard arbitrage
opportunities, as it would be in contradiction with the wealth and utility-
maximization conception the whole traditional economic theory rests on.
Whatever the economic explanation might be for the outcome, the author believes
that the main focus when discussing mispricing should revolve round analyzing its
underlying causes, rather than a discussion about tenacious financial theories, in
order to be able to draw more comprehensive and fair conclusion about mispricing
on cross-traded assets.

The Law of One Price – Evidence from Three European Stock Exchanges
54
5.2 Suggested Future Investigation
This thesis makes a preliminary study to examine mispricing on cross-traded assets.
The author believes that this study can be extended in future by covering a deeper
examination about explanatory factors to mispricing. By evaluating the impact of
these mechanisms future works will be able to draw definitive conclusions about
price discrepancies on cross-traded assets. Moreover, the author suggests
implementing the validation test of the Law on other markets since it would be
interesting to see if the results’ outcome would be different when considering other
stock exchanges. It would also be interesting to use longer time series covering
several economic cycles to be able to draw more complete conclusions about
mispricings and the general pattern of the same, also including an analysis about the
impact of more volatile market conditions. Finally, the author also suggests
performing the validation test on minute and hour data, in other to test the
efficiency of today’s well-functioning financial markets, where the convergence is
assumed nearly instantly given the advanced technology.

The Law of One Price – Evidence from Three European Stock Exchanges
55
6. Sources
Baldwin, J. & Yan B. (2004) “The Law of One Price: A Canada/U.S. Exploration”. Review of Income and Wealth.
Baltagi, B., Li, D. & Li, Q. (2006) ”Transaction Tax and Stock Market Behavior: Evidence from an Emerging Market”. Empirical Economics.
Board, J., Sutcliffe, C. & Wells, S. (2002) Transparency and Fragmentation : Financial
Market Regulation in a Dynamic Environment. Palgrave Macmillan.
Bodie, Z., Kane, A. & Marcus, A. J. (2008) Investments (7th ed.). McGraw-Hill.
Chen, Y-L. & Gau, Y-F. (2009) “Tick Sizes and Relative Rates of Price Discovery in Stock, Futures, and Options Markets: Evidence from the Taiwan Stock Exchange”.
Journal of Futures Markets.
Databases (2009): Thomson Reuters
Yahoo Finance
Dewachter, H & Smedts, K. (2007) “Limits to International Arbitrage: An Empirical Evaluation “. International Journal of Finance and Economics.
Dow, J. & Gorton, G. (2006) “Noise Traders”. National Bureau of Economic Research,
Inc, NBER Working Papers: 12256
EU legislation summary (2009): “Markets in financial instruments (MiFID) and
investment services”. Retrieved on 07/05/09 from;
http://europa.eu/scadplus/leg/en/lvb/l24036e.htm;
http://europa.eu/scadplus/leg/en/lvb/l24210.htm
Fama, E. (1998). Market Efficiency, Long-Term Returns, and Behavioral Finance
Journal of Financial Economics.
Financial Times (2008):
“Mifid causing data frustration” Retrieved on 12/05/09 from;
http://www.ft.com/cms/s/0/2bd9c2ce-4185-11dd-9661-0000779fd2ac.html?nclick_check=1; “Mifid opens door for US platforms in Europe” Retrieved on 12/05/09 from; http://www.ft.com/cms/s/0/7436b8d6-a6b3-11dd-95be-000077b07658.html
Froot, K. & Dabora, E. (1999)“How are Stock Prices Affected by the Location of Trade?” Journal of Financial Economics.
Gordon, R. & Bovenberg, A. (1996) “Why Is Capital So Immobile Internationally? Possible Explanations and Implications for Capital Income Taxation” American
Economic Review, December 1996, v. 86, iss. 5, pp. 1057-75

The Law of One Price – Evidence from Three European Stock Exchanges
56
Jorion, P. (2000) “Risk Management Lessons from Long-Term Capital Management”
European Financial Management.
Kazmier, L. (2003) Schaum’s Outline of Business Statistics. McGraw-Hill Trade
Klibanoff, P.; Lamont, O. & Wizman T.H., (1998) “Investor Reaction to Salient News in Closed-End Country Funds.” Journal of Finance.
Krugman, P. & Obstfeld (2006) International Economics. Pearson Education Limited.
Lamont, O. & Thaler, R. (2003) “Anomalies: The Law of One Price in Financial Markets”. Journal of Economic Perspectives.
Lang, L.; Litzenberger, R. & Madrigal, V. (1992) “Testing Financial Market Equilibrium under Asymmetric Information”. Journal of Political Economy, April
1992, v. 100, iss. 2, pp. 317-48
Moosa, I. (2003) International Financial Operations: Arbitrage, Hedging, Speculation,
Financing and Investment. Palgrave Macmillan.
Newman, P., Milgate, M. & Eatwell, J. (1992) “The New Palgrave Dictionary of Money
and Finance”. The MacMillan Press Limited.
Nickels, T. (2002) Thomas Kuhn. Cambridge University Press.
Patton, M.Q. (2002) Qualitative research & evaluation methods (3rd edition).
Thousand Oaks, California: Sage Publications.
Peters, E. (2003) “Simple and Complex Market Inefficiencies: Integrating Efficient Markets, Behavioral Finance, and Complexity” Journal of Behavioral Finance, 2003, v.
4, iss. 4, pp. 225-33
Pippinger, J. & Phillips, L. (2008) “Some Pitfalls in Testing the Law of One Price in
Commodity Markets”. Journal of International Money and Finance.
Siegel J. (2006) “The Noisy Market Hypothesis”. Wall Street Journal Schmitz, P. (2006) “Information Gathering, Transaction Costs, and the Property
Rights Approach”. American Economic Review v. 96, iss. 1, pp. 422-34
Stock Exchanges (2009):
Nasdaq OMX Deutsche Börse Group
London Stock Exchange Verbeke A. & Nordberg, M. (1999) Strategic Management of High Technology
Contracts : The Case of CERN: Competence Based and Transaction Cost Perspectives.
ElsevierScience.

The Law of One Price – Evidence from Three European Stock Exchanges
57
Appendix i) Historical Pattern of Price Discrepancies on OMX
Stockholm vs. Frankfurt Stock Exchange
Diagram 3: Relative Price discrepancy of Alfa Laval on OMX Stockholm vs. Frankfurt Stock Exchange
during the period from February 16, 2007 to February 18, 2009. Data: Thomson Reuters (2009).
Diagram 4: Relative Price discrepancy of BioInvent on OMX Stockholm vs. Frankfurt Stock Exchange
during the period from February 16, 2007 to February 18, 2009. Data: Thomson Reuters (2009).
-25%-20%-15%-10%
-5%0%5%
10%15%20%25%
Alfa Laval - Relative Price Discrepancy OMX Stockholm vs. Frankfurt
Stock Exchange
-25%
-20%
-15%
-10%
-5%
0%
5%
10%
15%
20%
25%
BioInvent- Relative Price Discrepancy OMX Stockholm vs. Frankfurt
Stock Exchange
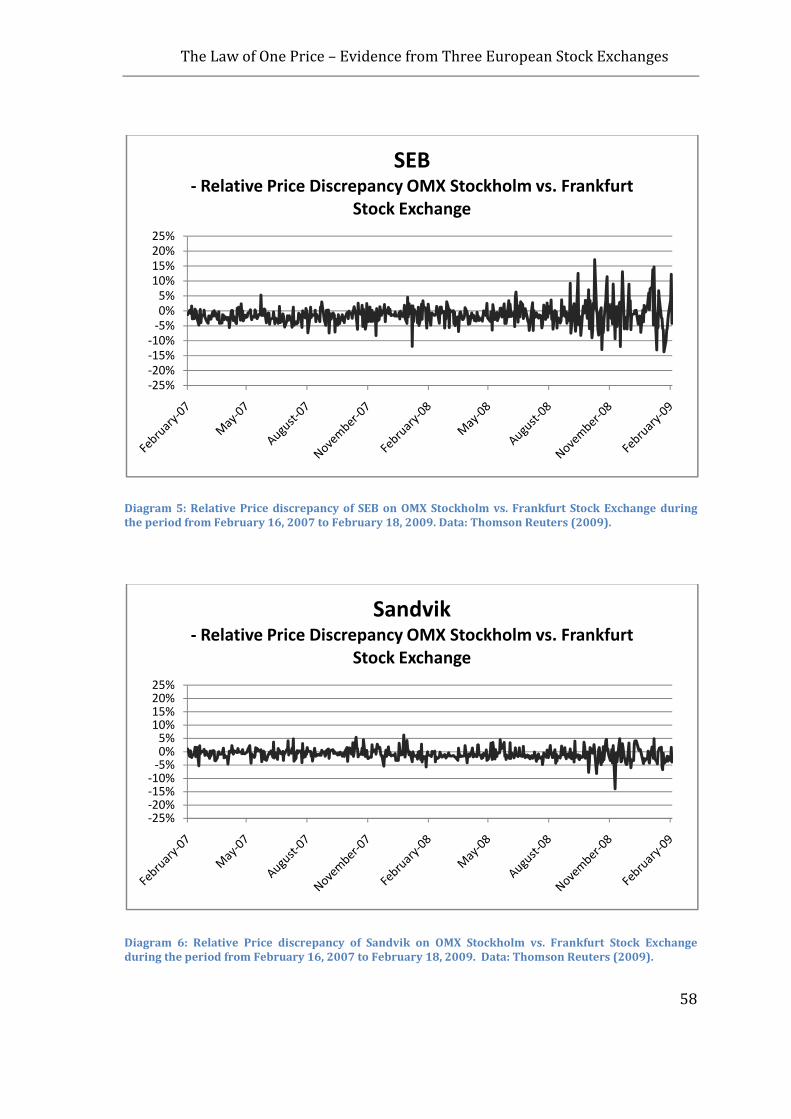
The Law of One Price – Evidence from Three European Stock Exchanges
58
Diagram 5: Relative Price discrepancy of SEB on OMX Stockholm vs. Frankfurt Stock Exchange during
the period from February 16, 2007 to February 18, 2009. Data: Thomson Reuters (2009).
Diagram 6: Relative Price discrepancy of Sandvik on OMX Stockholm vs. Frankfurt Stock Exchange
during the period from February 16, 2007 to February 18, 2009. Data: Thomson Reuters (2009).
-25%
-20%
-15%
-10%
-5%
0%
5%
10%
15%
20%
25%
SEB- Relative Price Discrepancy OMX Stockholm vs. Frankfurt
Stock Exchange
-25%-20%-15%-10%
-5%0%5%
10%15%20%25%
Sandvik- Relative Price Discrepancy OMX Stockholm vs. Frankfurt
Stock Exchange

The Law of One Price – Evidence from Three European Stock Exchanges
59
Diagram 7: Relative Price discrepancy of Nordea on OMX Stockholm vs. Frankfurt Stock Exchange during
the period from February 16, 2007 to February 18, 2009. Data: Thomson Reuters (2009).
Diagram 8: Relative Price discrepancy of Elekta on OMX Stockholm vs. Frankfurt Stock Exchange during
the period from February 16, 2007 to February 18, 2009. Data: Thomson Reuters (2009).
-25%
-20%
-15%
-10%
-5%
0%
5%
10%
15%
20%
25%
Nordea- Relative Price Discrepancy OMX Stockholm vs. Frankfurt
Stock Exchange
-25%-20%-15%-10%
-5%0%5%
10%15%20%25%
Elekta- Relative Price Discrepancy OMX Stockholm vs. Frankfurt
Stock Exchange

The Law of One Price – Evidence from Three European Stock Exchanges
60
Diagram 9: Relative Price discrepancy of Eniro on OMX Stockholm vs. Frankfurt Stock Exchange during
the period from February 16, 2007 to February 18, 2009. Data: Thomson Reuters (2009).
Diagram 10: Relative Price discrepancy of Getinge on OMX Stockholm vs. Frankfurt Stock Exchange
during the period from February 16, 2007 to February 18, 2009. Data: Thomson Reuters (2009).
-25%-20%-15%-10%
-5%0%5%
10%15%20%25%
Eniro- Relative Price Discrepancy OMX Stockholm vs. Frankfurt
Stock Exchange
-25%-20%-15%-10%
-5%0%5%
10%15%20%25%
Getinge- Relative Price Discrepancy OMX Stockholm vs. Frankfurt
Stock Exchange

The Law of One Price – Evidence from Three European Stock Exchanges
61
Diagram 11: Relative Price discrepancy of H&M on OMX Stockholm vs. Frankfurt Stock Exchange during
the period from February 16, 2007 to February 18, 2009. Data: Thomson Reuters (2009).
Diagram 12: Relative Price discrepancy of Investor on OMX Stockholm vs. Frankfurt Stock Exchange
during the period from February 16, 2007 to February 18, 2009. Data: Thomson Reuters (2009).
-25%
-20%
-15%
-10%
-5%
0%
5%
10%
15%
20%
25%
H&M- Relative Price Discrepancy OMX Stockholm vs. Frankfurt
Stock Exchange
-25%-20%-15%-10%
-5%0%5%
10%15%20%25%
Investor- Relative Price Discrepancy OMX Stockholm vs. Frankfurt
Stock Exchange
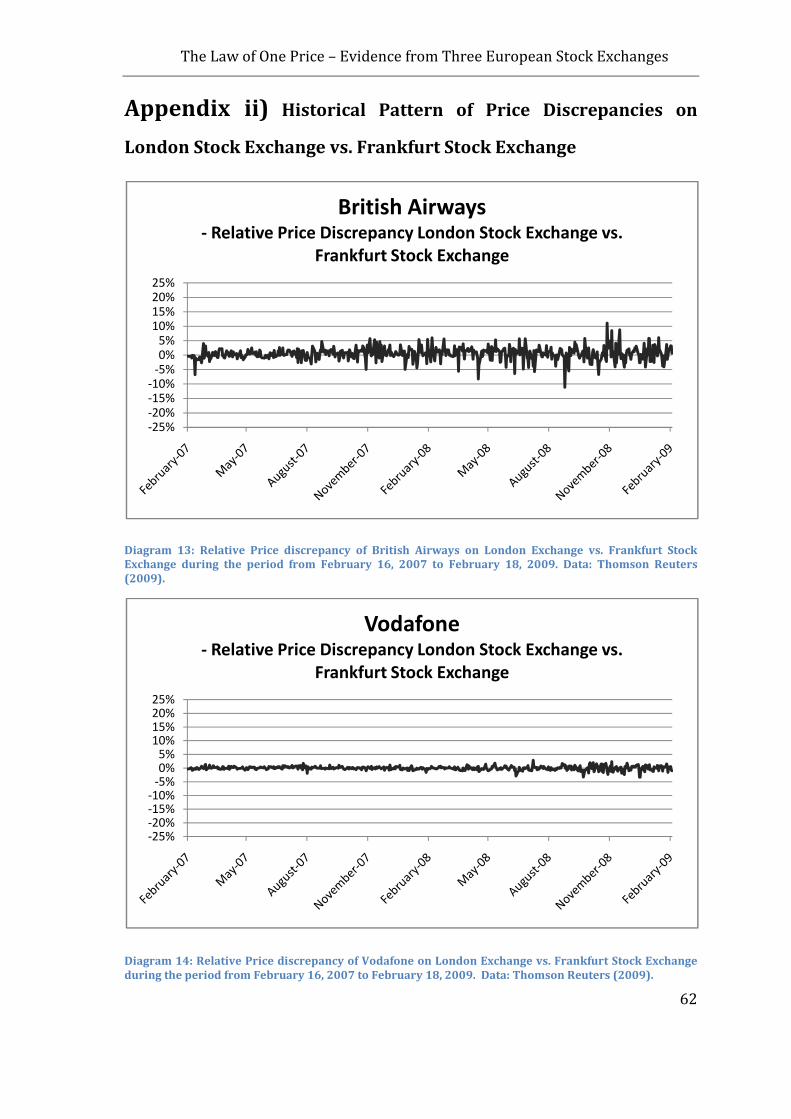
The Law of One Price – Evidence from Three European Stock Exchanges
62
Appendix ii) Historical Pattern of Price Discrepancies on
London Stock Exchange vs. Frankfurt Stock Exchange
Diagram 13: Relative Price discrepancy of British Airways on London Exchange vs. Frankfurt Stock
Exchange during the period from February 16, 2007 to February 18, 2009. Data: Thomson Reuters
(2009).
Diagram 14: Relative Price discrepancy of Vodafone on London Exchange vs. Frankfurt Stock Exchange
during the period from February 16, 2007 to February 18, 2009. Data: Thomson Reuters (2009).
-25%-20%
-15%-10%
-5%
0%5%
10%15%
20%25%
British Airways- Relative Price Discrepancy London Stock Exchange vs.
Frankfurt Stock Exchange
-25%-20%-15%-10%
-5%0%5%
10%15%20%25%
Vodafone- Relative Price Discrepancy London Stock Exchange vs.
Frankfurt Stock Exchange

The Law of One Price – Evidence from Three European Stock Exchanges
63
Diagram 15: Relative Price discrepancy of Reed Elsevier on London Exchange vs. Frankfurt Stock
Exchange during the period from February 16, 2007 to February 18, 2009. Data: Thomson Reuters
(2009).
Diagram 16: Relative Price discrepancy of Lloyds Banking on London Exchange vs. Frankfurt Stock
Exchange during the period from February 16, 2007 to February 18, 2009. Data: Thomson Reuters
(2009).
-25%-20%-15%-10%
-5%0%5%
10%15%20%25%
Reed Elsevier- Relative Price Discrepancy London Stock Exchange vs.
Frankfurt Stock Exchange
-25%-20%-15%-10%
-5%0%5%
10%15%20%25%
Lloyds Banking- Relative Price Discrepancy London Stock Exchange vs.
Frankfurt Stock Exchange

The Law of One Price – Evidence from Three European Stock Exchanges
64
Diagram 17: Relative Price discrepancy BT Group on London Exchange vs. Frankfurt Stock Exchange
during the period from February 16, 2007 to February 18, 2009. Data: Thomson Reuters (2009).
Diagram 18: Relative Price discrepancy of Barclays on London Exchange vs. Frankfurt Stock Exchange
during the period from February 16, 2007 to February 18, 2009. Data: Thomson Reuters (2009).
-25%-20%-15%-10%
-5%0%5%
10%15%20%25%
BT Group- Relative Price Discrepancy London Stock Exchange vs.
Frankfurt Stock Exchange
-25%-20%-15%-10%
-5%0%5%
10%15%20%25%
Barclays- Relative Price Discrepancy London Stock Exchange vs.
Frankfurt Stock Exchange

The Law of One Price – Evidence from Three European Stock Exchanges
65
Diagram 19: Relative Price discrepancy of Ladbrokes on London Exchange vs. Frankfurt Stock Exchange
during the period from February 16, 2007 to February 18, 2009. Data: Thomson Reuters (2009).
Diagram 20: Relative Price discrepancy of John Matthey on London Exchange vs. Frankfurt Stock
Exchange during the period from February 16, 2007 to February 18, 2009. Data: Thomson Reuters
(2009).
-25%-20%-15%-10%
-5%0%5%
10%15%20%25%
Ladbrokes- Relative Price Discrepancy London Stock Exchange vs.
Frankfurt Stock Exchange
-25%-20%-15%-10%
-5%0%5%
10%15%20%25%
Johnson Matthey- Relative Price Discrepancy London Stock Exchange vs.
Frankfurt Stock Exchange
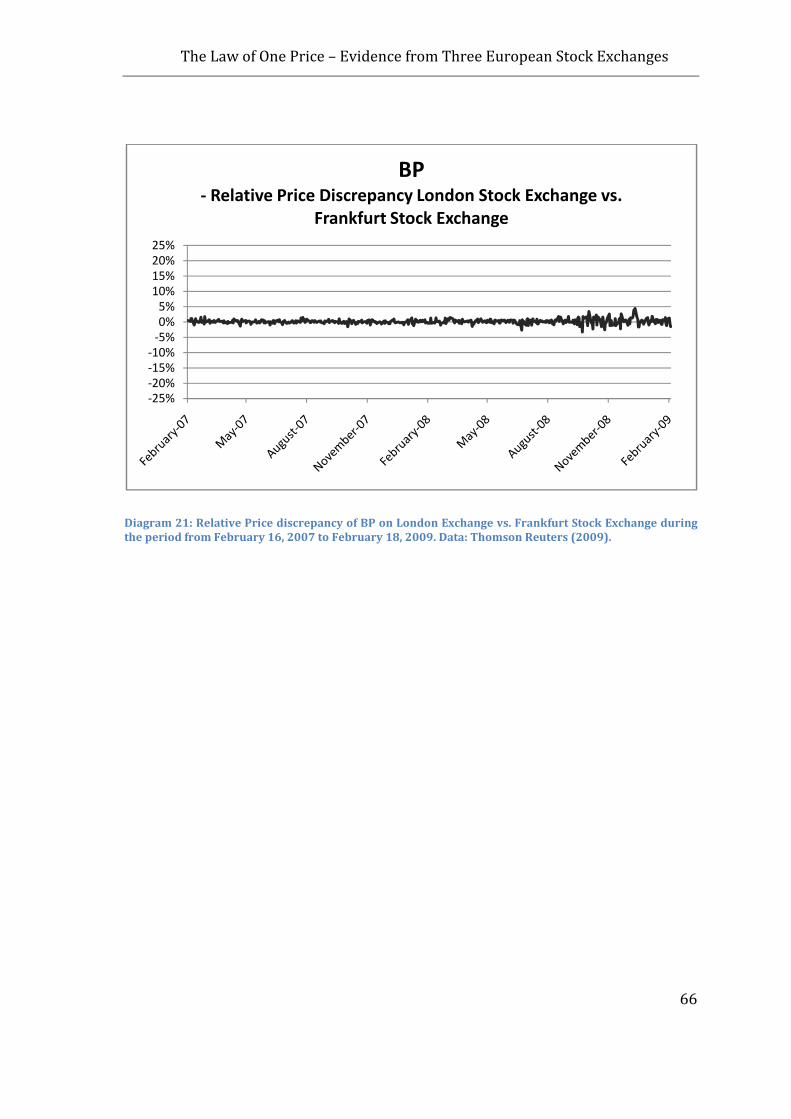
The Law of One Price – Evidence from Three European Stock Exchanges
66
Diagram 21: Relative Price discrepancy of BP on London Exchange vs. Frankfurt Stock Exchange during
the period from February 16, 2007 to February 18, 2009. Data: Thomson Reuters (2009).
-25%
-20%
-15%
-10%
-5%
0%
5%
10%
15%
20%
25%
BP- Relative Price Discrepancy London Stock Exchange vs.
Frankfurt Stock Exchange

The Law of One Price – Evidence from Three European Stock Exchanges
67
Appendix iii) Correlation Matrices: OMX Stockholm vs.
Frankfurt Stock Exchange and Frankfurt Stock Exchange vs.
London Stock Exchange
Correlation Matrix 1: The correlation between price discrepancies of the 10 cross-traded assets on the
OMX Nordic Stockholm Exchange vs. Frankfurt Stock Exchange. Data: Thomson Reuters.
Correlation Matrix 2: The correlation between price discrepancies of the 9 cross-traded assets on the
London Stock Exchange vs. Frankfurt Stock Exchange. Data: Thomson Reuters.
Alfa Laval Bio Invent SEB Sandvik Nordea Elekta Eniro Getinge H&M Investor
Alfa Laval 1 0.279675 0.350952 0.271279 0.368825 0.324762 0.232863 0.181128 0.081224 0.276461
BioInvent 1 0.336196 0.131878 0.271936 0.084607 0.209457 0.279463 0.047144 0.135849
SEB 1 0.272565 0.571139 0.15391 0.399746 0.282792 0.074478 0.397041
Sandvik 1 0.334904 0.158768 0.185276 0.160934 0.040003 0.270886
Nordea 1 0.148481 0.327326 0.339802 0.211409 0.428479
Elekta 1 0.178262 0.183146 0.014477 0.151134
Eniro 1 0.246787 0.066241 0.226549
Getinge 1 0.068156 0.229724
H&M 1 0.062823
Investor 1
Average 36.45 %
British
Airways Vodafone
Reed
Elsevier
Lloyds
Banking
BT
Group Barclays Ladbrokes
Johnson
Matthey BP
British Airways 1 0.0299924 0.244652 0.048571 0.142947 0.117723 0.289044 0.215807 -0.00809
Vodafone 1 0.041422 0.157146 0.108675 0.053403 0.0524047 0.015798 0.250356
Reed Elsevier 1 0.069111 0.245743 0.094874 0.2854792 0.155584 0.100087
Lloyds Banking 1 -0.03201 0.355261 0.008491 0.008135 0.169518
BT Group 1 0.216542 0.2821969 0.16252 0.187879
Barclays 1 0.0699569 0.051021 0.195497
Ladbrokes 1 0.24451 0.020725
Johnson Matthey 1 0.016958
BP 1
Average 30.37 %