Embed Size (px)
Citation preview
The Lathrop Urban Runoff Study:
Final Study Results
Rachel Pisor
CA/NV AWWA Annual Conference
10/1/2013

Outline Study Design
Water Quality Concerns and Regulations
Water Quality Parameters
• Organic Carbon concentrations and loads
• Bromide concentrations and loads
• Total Trihalomethane Formation Potential
concentrations
Land use Analysis
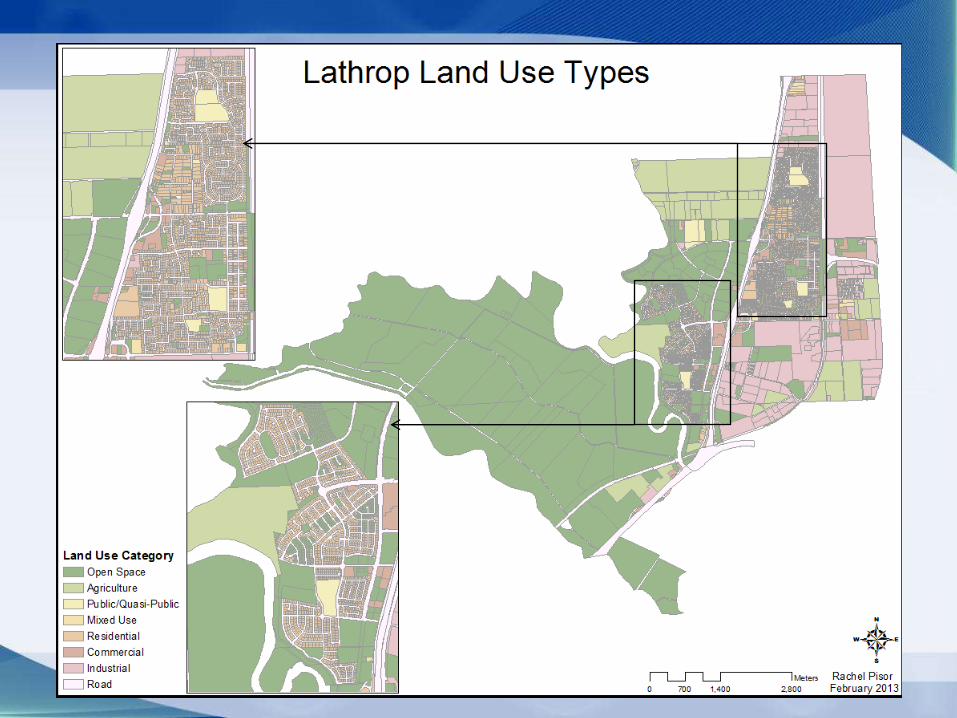
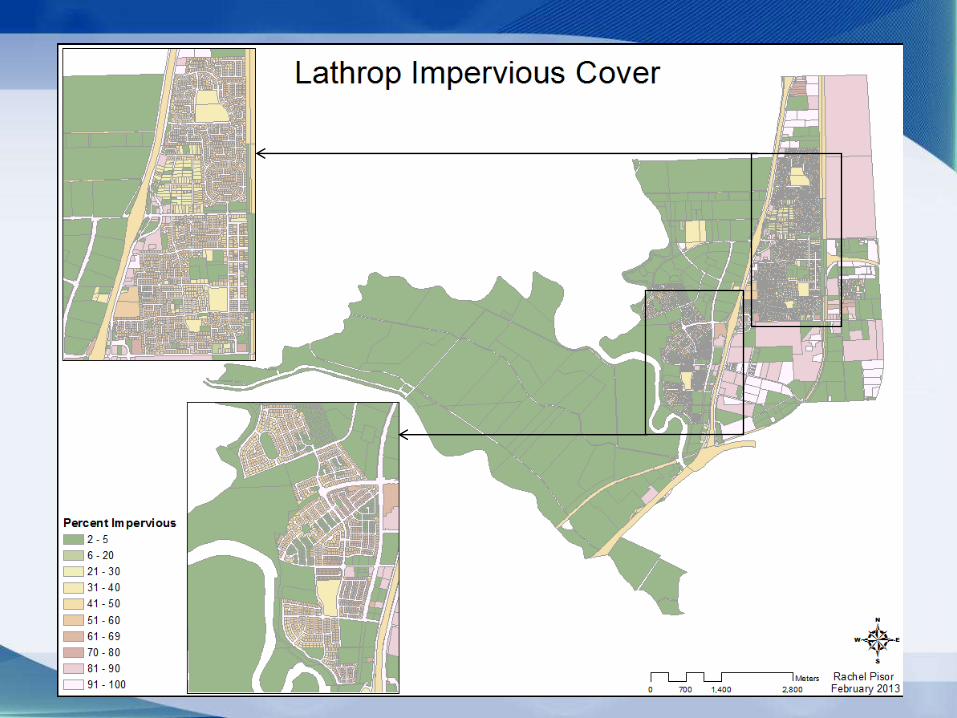
• Current land Use
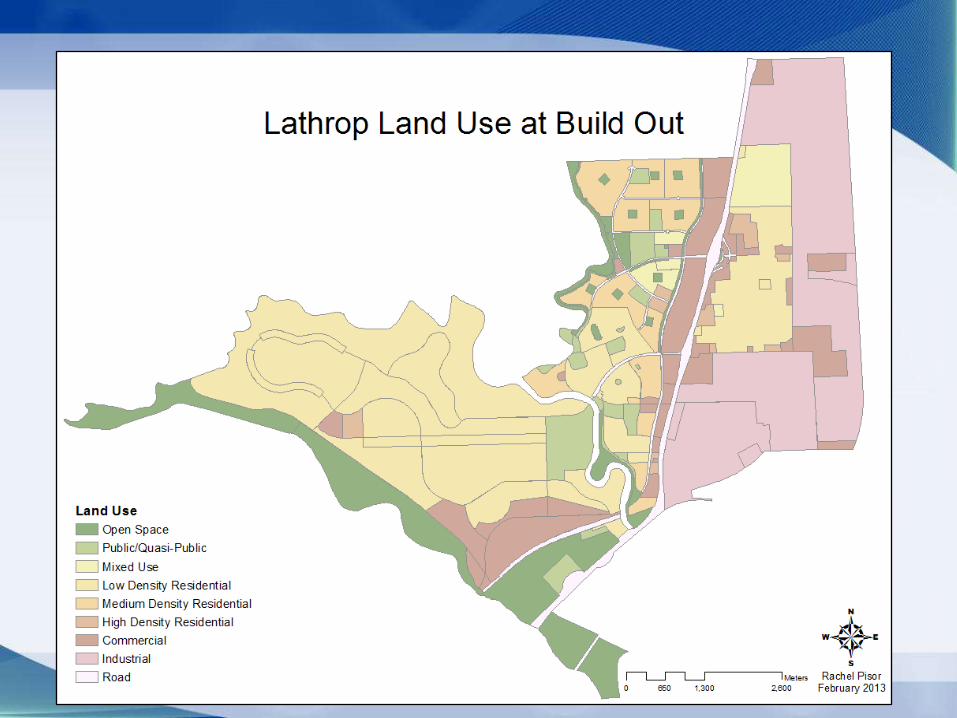
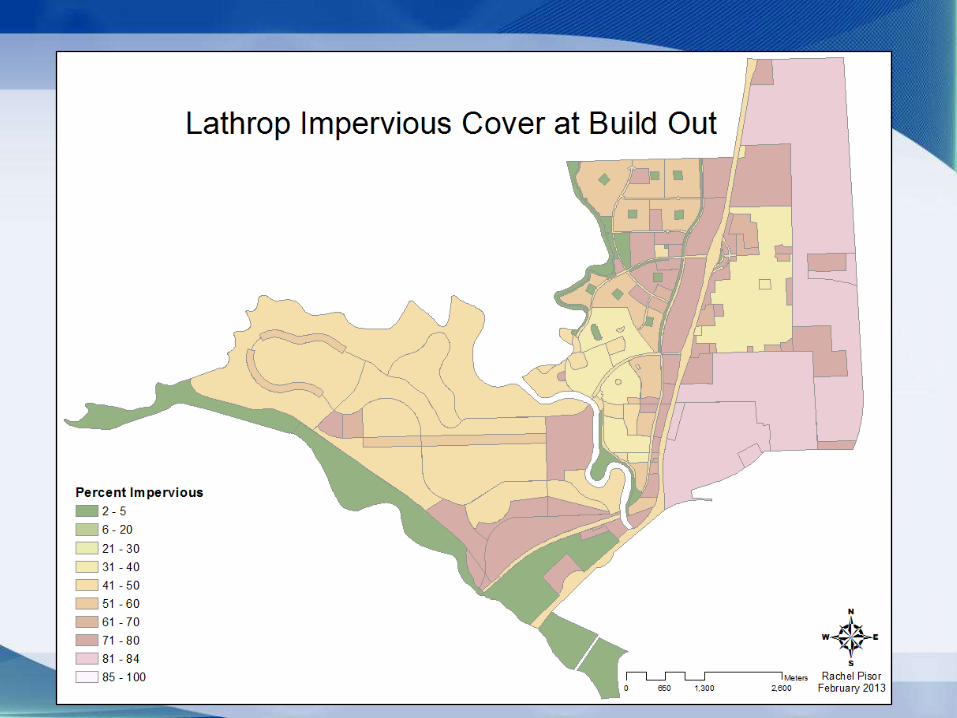
• Build Out
Conclusions

Study Location
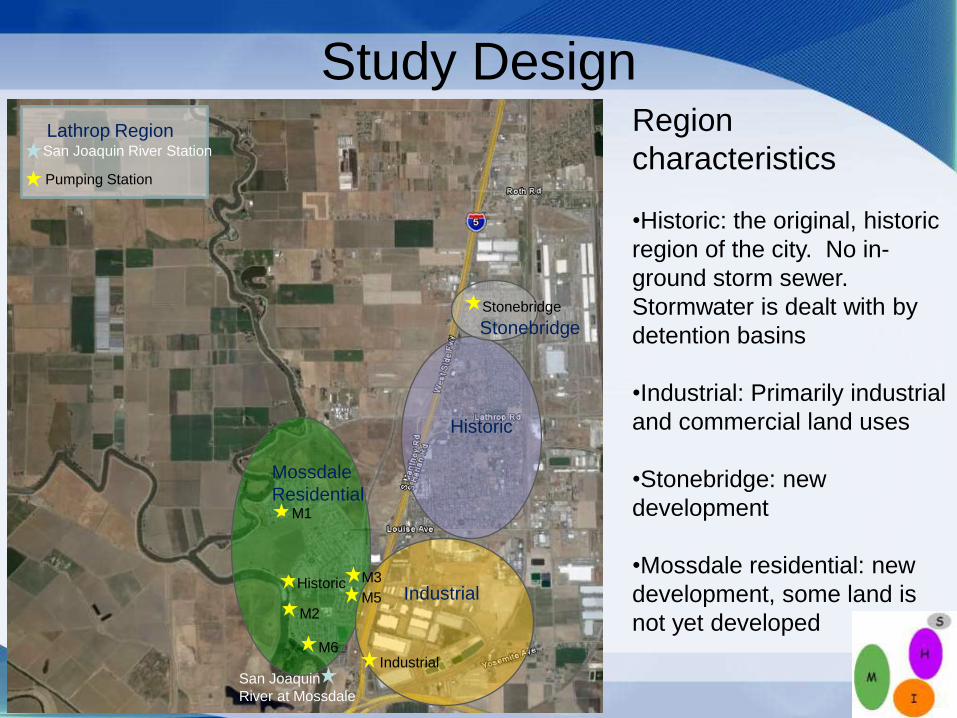
Study Design
Stonebridge
M1
Historic
Stonebridge
Industrial
Historic
Mossdale
Residential
Industrial
M2
M3
M5
San Joaquin
River at Mossdale
Lathrop Region San Joaquin River Station
Pumping Station
M6
Region
characteristics
•Historic: the original, historic
region of the city. No in-
ground storm sewer.
Stormwater is dealt with by
detention basins
•Industrial: Primarily industrial
and commercial land uses
•Stonebridge: new
development
•Mossdale residential: new
development, some land is
not yet developed
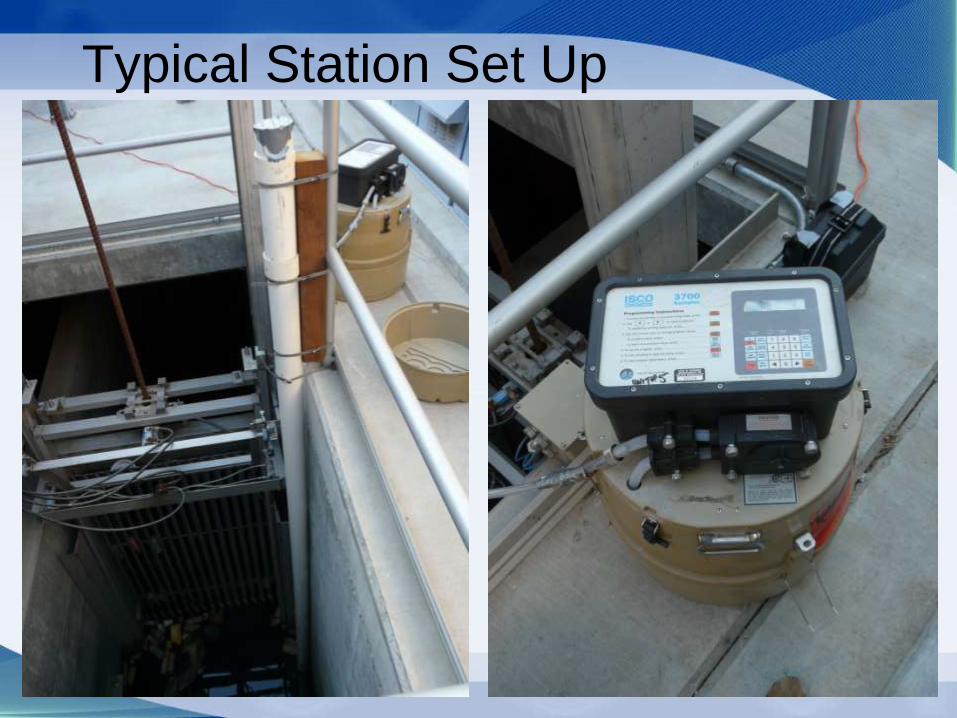
Typical Station Set Up
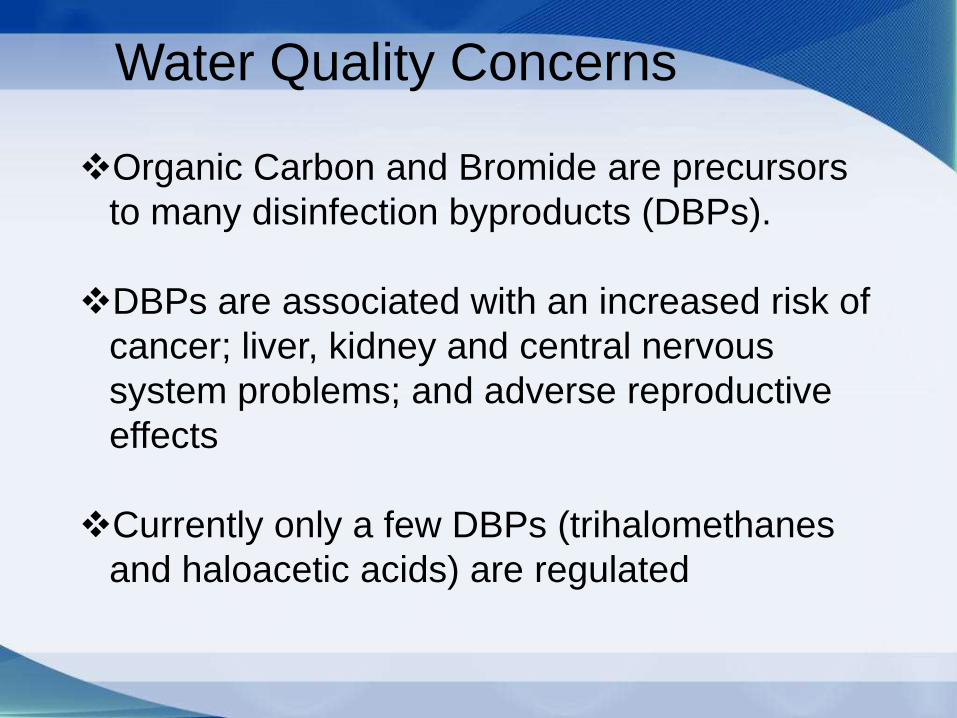
Water Quality Concerns
Organic Carbon and Bromide are precursors
to many disinfection byproducts (DBPs).
DBPs are associated with an increased risk of
cancer; liver, kidney and central nervous
system problems; and adverse reproductive
effects
Currently only a few DBPs (trihalomethanes
and haloacetic acids) are regulated
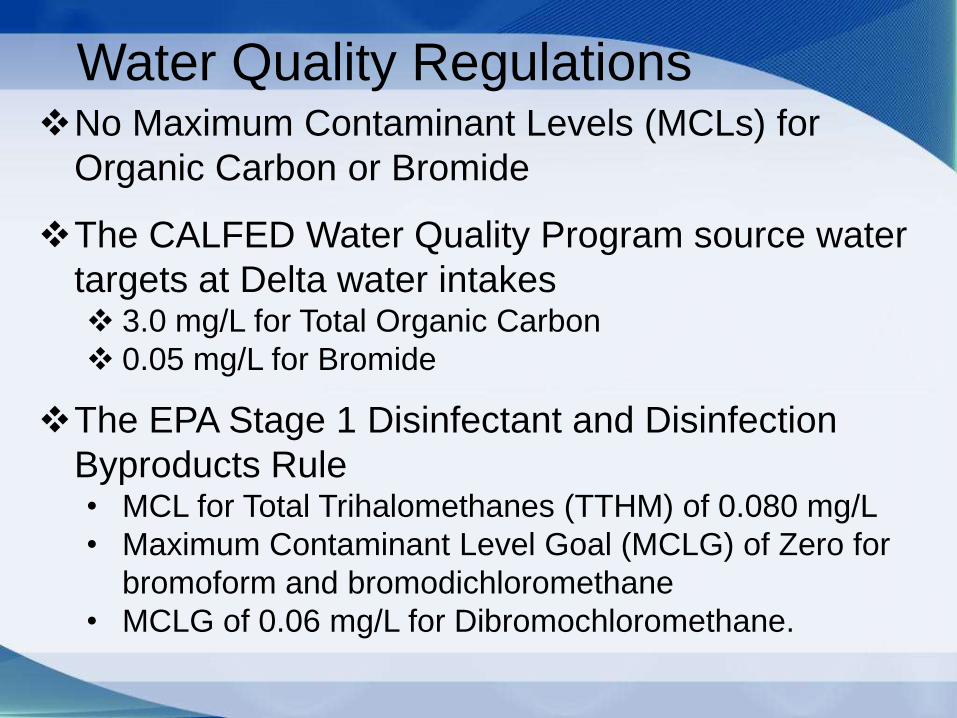
Water Quality RegulationsNo Maximum Contaminant Levels (MCLs) for
Organic Carbon or Bromide
The CALFED Water Quality Program source water
targets at Delta water intakes 3.0 mg/L for Total Organic Carbon
0.05 mg/L for Bromide
The EPA Stage 1 Disinfectant and Disinfection
Byproducts Rule• MCL for Total Trihalomethanes (TTHM) of 0.080 mg/L
• Maximum Contaminant Level Goal (MCLG) of Zero for
bromoform and bromodichloromethane
• MCLG of 0.06 mg/L for Dibromochloromethane.
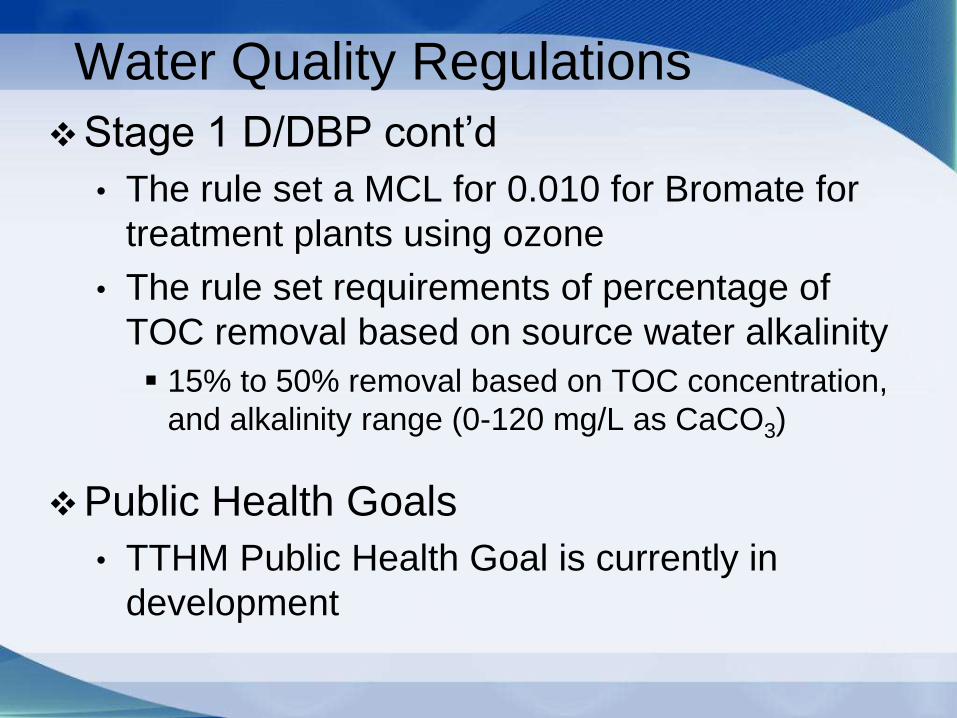
Water Quality Regulations
Stage 1 D/DBP cont’d
• The rule set a MCL for 0.010 for Bromate for
treatment plants using ozone
• The rule set requirements of percentage of
TOC removal based on source water alkalinity
15% to 50% removal based on TOC concentration,
and alkalinity range (0-120 mg/L as CaCO3)
Public Health Goals
• TTHM Public Health Goal is currently in
development
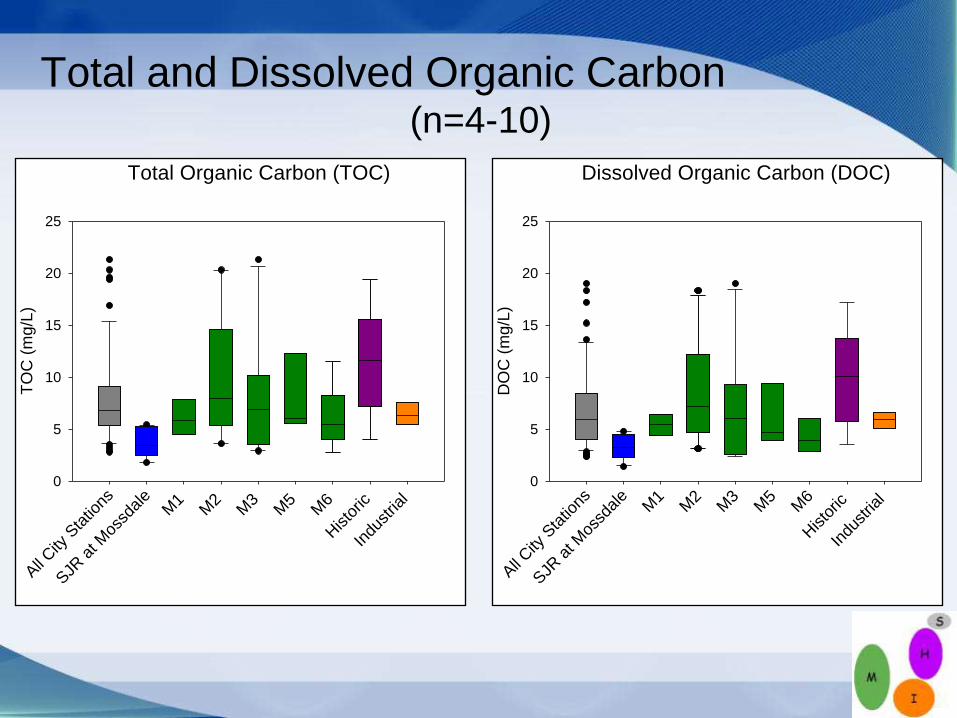
Total and Dissolved Organic Carbon(n=4-10)
Dissolved Organic Carbon (DOC)
All City
Sta
tions
SJR
at M
ossd
ale
M1
M2
M3
M5
M6
Histo
ric
Indu
stria
l D
OC
(m
g/L
)
0
5
10
15
20
25
Total Organic Carbon (TOC)
All City
Sta
tions
SJR
at M
ossd
ale
M1
M2
M3
M5
M6
Histo
ric
Indu
stria
l
TO
C (
mg
/L)
0
5
10
15
20
25

Organic Carbon Trends
TOC Trends
Nov
-10
Jan-
11
Mar
-11
May
-11
Jul-1
1
Sep
-11
Nov
-11
Jan-
12
Mar
-12
TO
C (
mg/L
)
0
2
4
6
8
10
12
14
16
18
City Median TOC
SJR TOC
TOC at Vernalis
DOC Trends
Nov
-10
Jan-
11
Mar
-11
May
-11
Jul-1
1
Sep-1
1
Nov
-11
Jan-
12
Mar
-12
D
OC
(m
g/L
)0
2
4
6
8
10
12
14
16
18
City Median DOC
SJR DOC
DOC at Vernalis
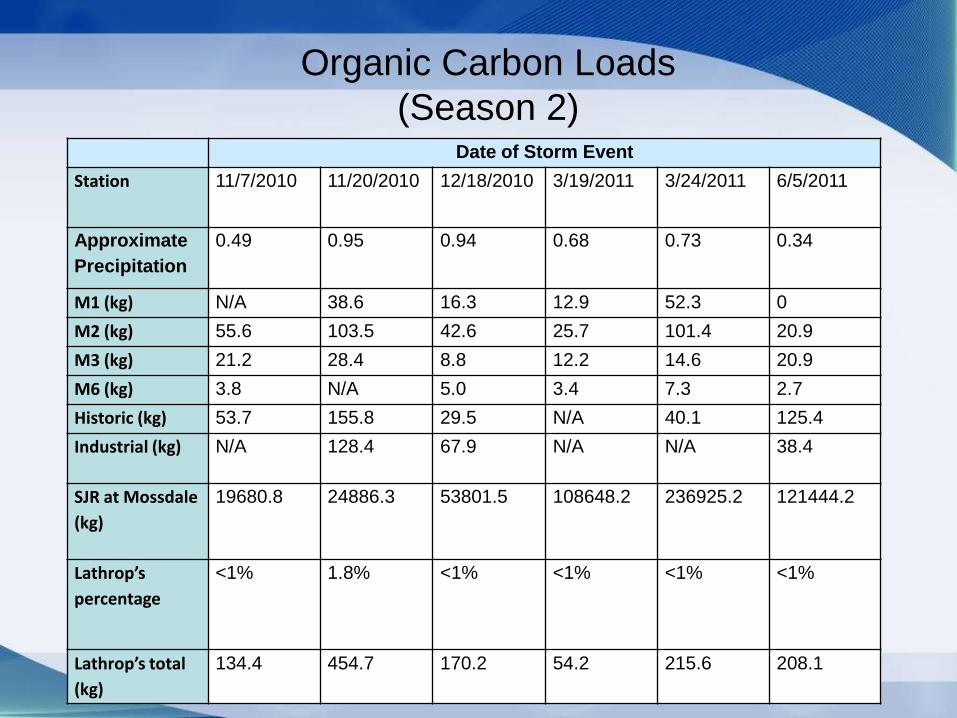
Organic Carbon Loads
(Season 2)Date of Storm Event
Station 11/7/2010 11/20/2010 12/18/2010 3/19/2011 3/24/2011 6/5/2011
Approximate
Precipitation
0.49 0.95 0.94 0.68 0.73 0.34
M1 (kg) N/A 38.6 16.3 12.9 52.3 0
M2 (kg) 55.6 103.5 42.6 25.7 101.4 20.9
M3 (kg) 21.2 28.4 8.8 12.2 14.6 20.9
M6 (kg) 3.8 N/A 5.0 3.4 7.3 2.7
Historic (kg) 53.7 155.8 29.5 N/A 40.1 125.4
Industrial (kg) N/A 128.4 67.9 N/A N/A 38.4
SJR at Mossdale
(kg)
19680.8 24886.3 53801.5 108648.2 236925.2 121444.2
Lathrop’s
percentage
<1% 1.8% <1% <1% <1% <1%
Lathrop’s total
(kg)
134.4 454.7 170.2 54.2 215.6 208.1

Organic Carbon Loads
(Season 3)Date of Storm event
Station 10/5/2011 1/20/2012 3/17/2012 3/24/2012
Approximate
Precipitation (in.)
0.77 0.94 0.68 0.38
M1 83.4 25.0 31.2 4.3
M2 136.8 30.7 40.3 63.5
M3 71.4 78.8 16.2 4.8
M5 144.4 24.8 7.7 4.5
M6 7.7 3.8 4.9 1.3
Historic 187.4 89.5 97.3 14.9
Industrial 124.6 164.6 0.1 2.2
SJR at Mossdale
(kg)
10,193.3 25,832.2 27,965.4 6,916.4
Lathrop’s
percentage
6.9% 1.6% <1% 1.4%
Lathrop’s total
(kg)
755.7 417.1 197.7 95.4
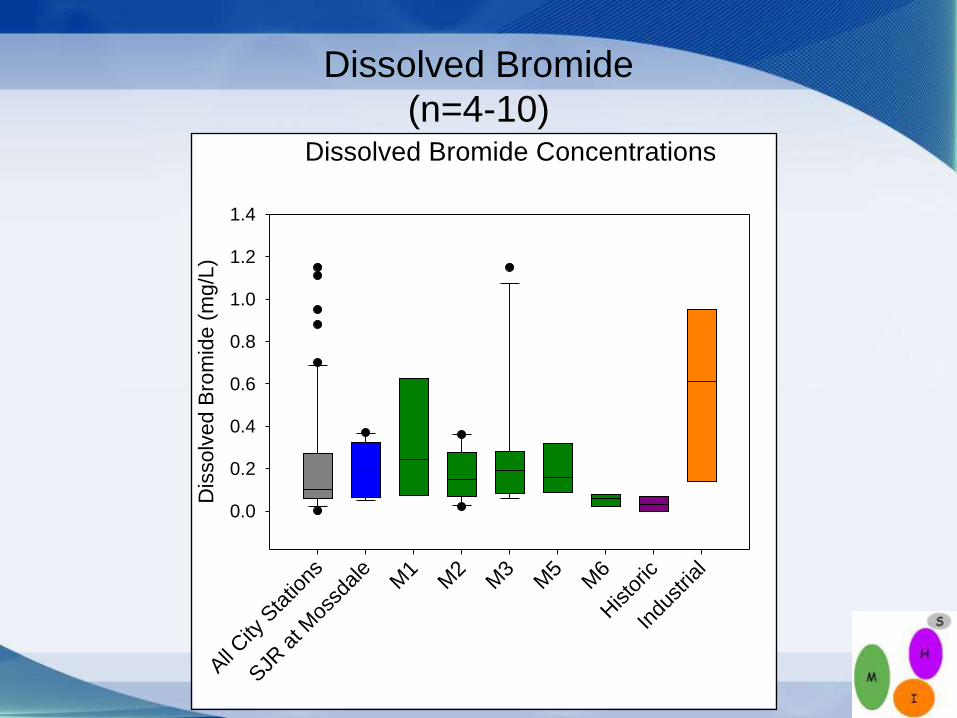
Dissolved Bromide
(n=4-10)Dissolved Bromide Concentrations
All City
Sta
tions
SJR
at M
ossd
ale
M1
M2
M3
M5
M6
Histo
ric
Indu
stria
l
Dis
so
lve
d B
rom
ide (
mg
/L)
0.0
0.2
0.4
0.6
0.8
1.0
1.2
1.4

Bromide Loads (Season 2)
Date of Storm Event
Station 11/7/2010 11/20/2010 12/18/2010 3/19/2011 3/24/2011 6/5/2011
Approximate
Precipitation
(in.)
0.49 0.95 0.94 0.68 0.73 0.34
M1 (kg) N/A 0.51 0.22 1.29 10.95 0
M2 (kg) 0.20 2.00 0.52 1.43 8.45 0.85
M3 (kg) 0.24 0.30 0.17 1.3 0.30 2.80
M6 (kg) 0.01 N/A 0.02 0.08 0.11 0.18
Historic (kg) 0.12 0.51 <R.L. N/A <R.L. 0.89
Industrial (kg) N/A 2.36 0.72 N/A N/A 7.22
SJR at
Mossdale (kg)
19681.8 24886.3 53801.5 108648.2 236925.2 121444.2
Lathrop’s
percentage
<1% <1% <1% <1% <1% <1%
Lathrop’s
total (kg)
0.57 5.68 1.65 4.08 19.81 11.93
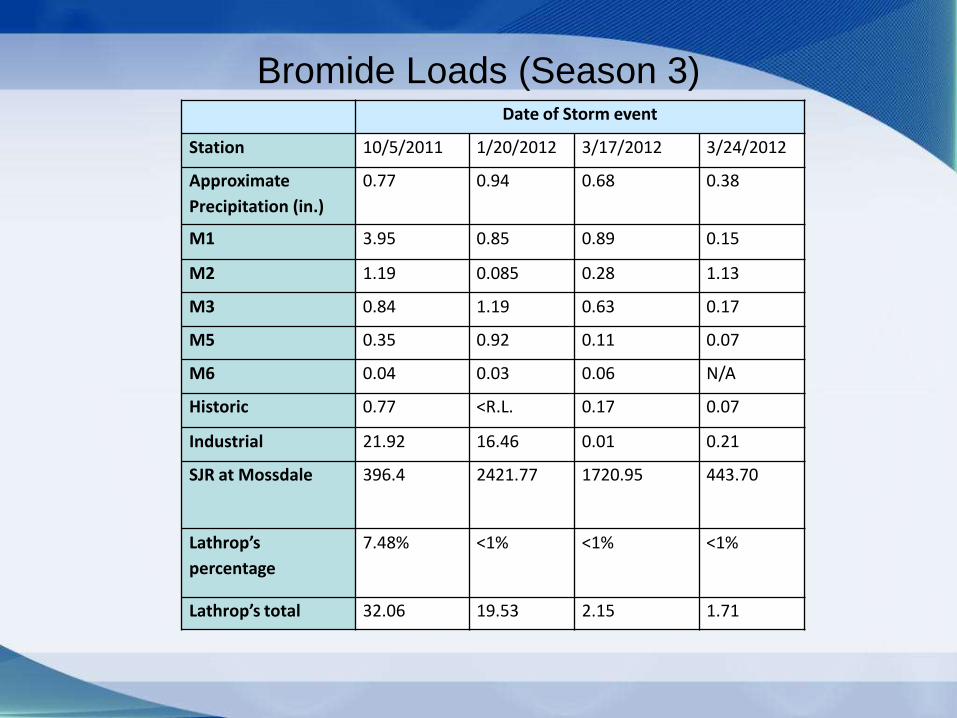
Bromide Loads (Season 3)Date of Storm event
Station 10/5/2011 1/20/2012 3/17/2012 3/24/2012
Approximate
Precipitation (in.)
0.77 0.94 0.68 0.38
M1 3.95 0.85 0.89 0.15
M2 1.19 0.085 0.28 1.13
M3 0.84 1.19 0.63 0.17
M5 0.35 0.92 0.11 0.07
M6 0.04 0.03 0.06 N/A
Historic 0.77 <R.L. 0.17 0.07
Industrial 21.92 16.46 0.01 0.21
SJR at Mossdale 396.4 2421.77 1720.95 443.70
Lathrop’s
percentage
7.48% <1% <1% <1%
Lathrop’s total 32.06 19.53 2.15 1.71
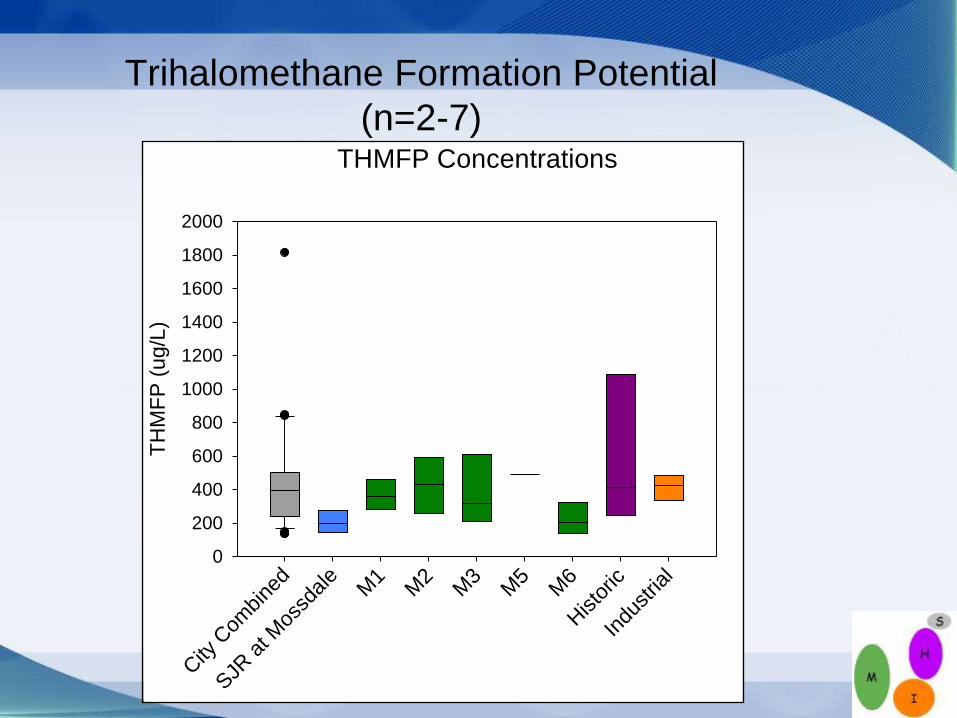
Trihalomethane Formation Potential
(n=2-7)THMFP Concentrations
City
Com
bine
d
SJR
at M
ossd
ale
M1
M2
M3
M5
M6
Histo
ric
Indu
stria
l
TH
MF
P (
ug/L
)
0
200
400
600
800
1000
1200
1400
1600
1800
2000
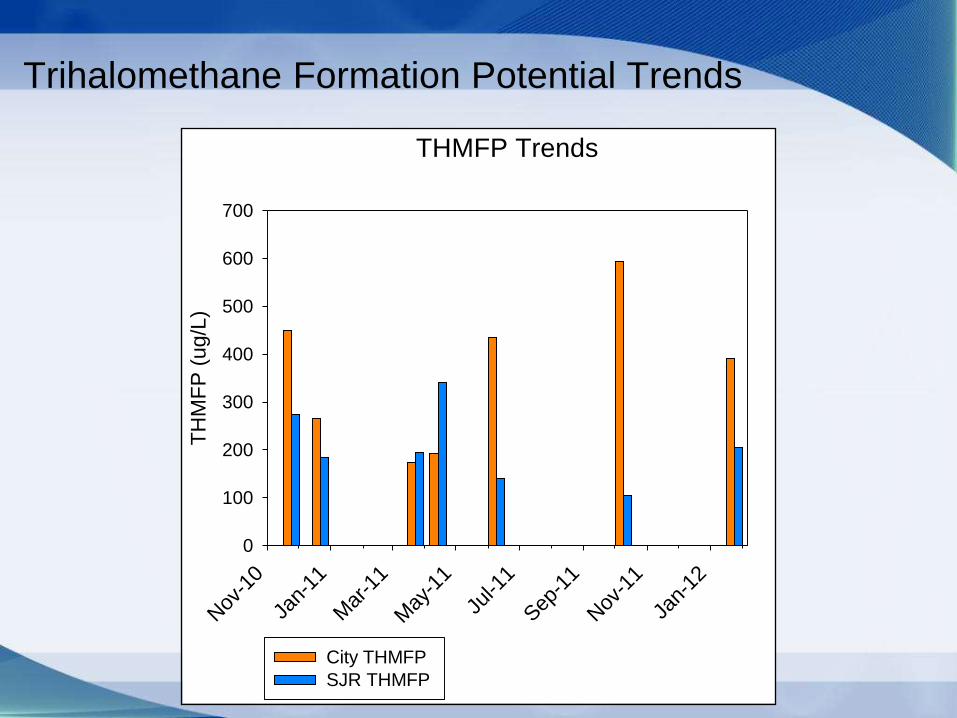
Trihalomethane Formation Potential Trends
THMFP Trends
Nov
-10
Jan-
11
Mar
-11
May
-11
Jul-1
1
Sep
-11
Nov
-11
Jan-
12
TH
MF
P (
ug/L
)
0
100
200
300
400
500
600
700
City THMFP
SJR THMFP
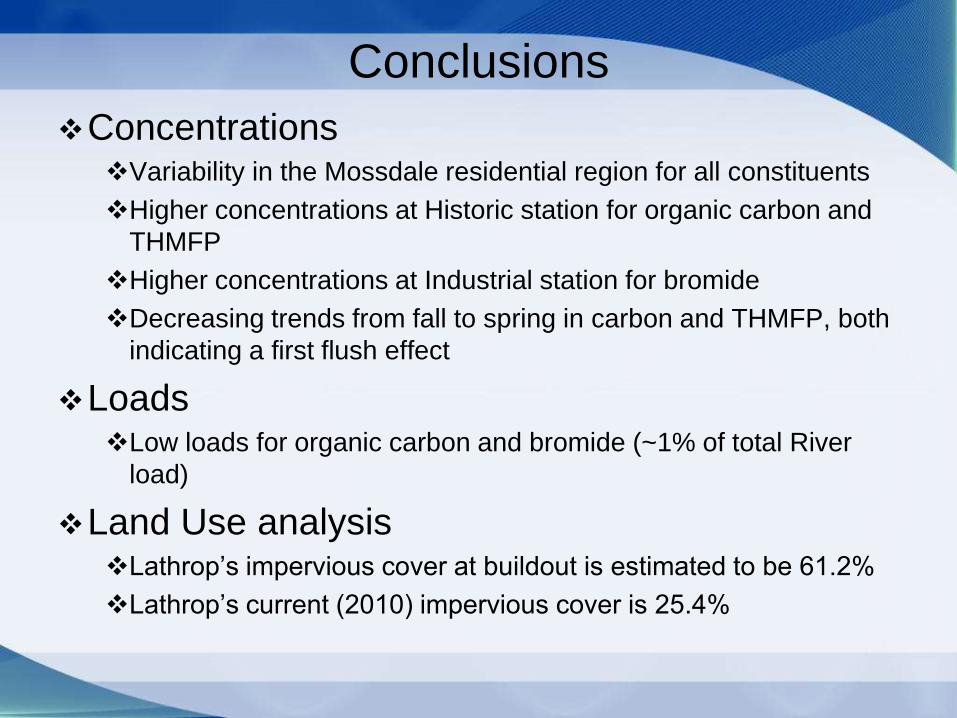
Conclusions
ConcentrationsVariability in the Mossdale residential region for all constituents
Higher concentrations at Historic station for organic carbon and
THMFP
Higher concentrations at Industrial station for bromide
Decreasing trends from fall to spring in carbon and THMFP, both
indicating a first flush effect
LoadsLow loads for organic carbon and bromide (~1% of total River
load)
Land Use analysisLathrop’s impervious cover at buildout is estimated to be 61.2%
Lathrop’s current (2010) impervious cover is 25.4%
Special Thanks to:DES Administrative Support City of Lathrop Staff
Dale Hoffman-Floerke Kirk Cloyd
Eric Oppenheimer Mary Grace Houlihan
Michael Hendrick Stephen Salvatore
Dean Messer Milt Daley
Cindy Garcia O&M support staff
MWQI Field Support MCC Control Systems
David Gonzalez Bob Pitts
Steve San Julian Max Hanson
Mark Bettencourt Dennis
Arin Conner
Eric Haydt MWQI Section
Ken New Carol DiGiorgio
Julia Walle Sonia Miller
Jason Moore
Sacramento Maintenance Yard Joe Christen
Jay Korteum Otome Lindsey
NCRO Flow Data State Water Contractors Specific Projects
Michael Baldwin Committee
Brett Larsen John Coburn