Embed Size (px)
Citation preview
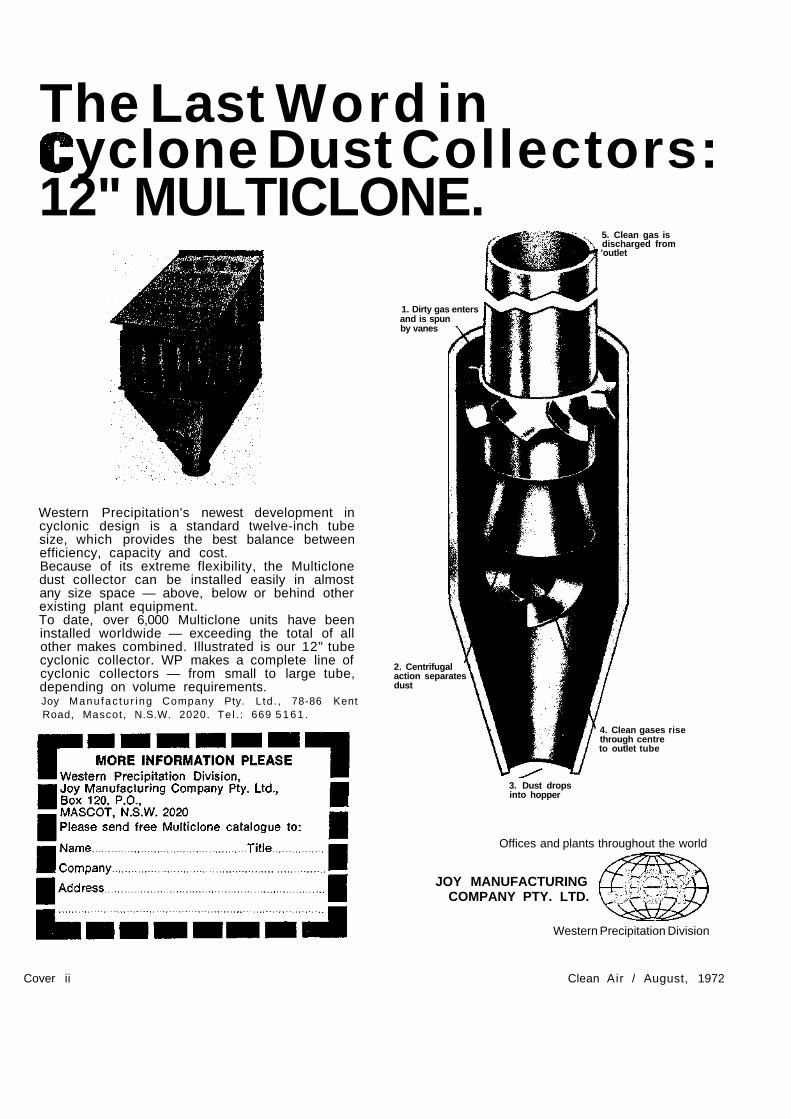
The Last Word in yclone Dust Collectors:
12" MULTICLONE.
1. Dirty gas enters and is spun by vanes
Western Precipitation's newest development in cyclonic design is a standard twelve-inch tube size, which provides the best balance between efficiency, capacity and cost. Because of its extreme flexibility, the Multiclone dust collector can be installed easily in almost any size space — above, below or behind other existing plant equipment. To date, over 6,000 Multiclone units have been installed worldwide — exceeding the total of all other makes combined. Illustrated is our 12" tube cyclonic collector. WP makes a complete line of cyclonic collectors — from small to large tube, depending on volume requirements. Joy Manu fac tu r ing Company Pty. L td. , 78-86 Kent Road, Mascot, N.S.W. 2020. Te l . : 669 5 1 6 1 .
2. Centrifugal action separates dust
5. Clean gas is discharged from 'outlet
4. Clean gases rise through centre to outlet tube
3. Dust drops into hopper
Offices and plants throughout the world
JOY MANUFACTURING COMPANY PTY. LTD.
Western Precipitation Division
Cover ii Clean Air / August, 1972
The company
that puts waste to work
Lucas Recyclers of Australasia Ltd. is totally committed to environmental engineering and the recycling of wastes.
The company is a wholly-owned subsidiary of Unochrome Australia Pty. Ltd., an Australian public company.
It was formed in January 1971, to manufacture and market the Lucas and Calval range of furnaces, under licence to Lucas Furnace Developments Ltd., England, in the areas of Australia, New Zealand, the South Pacific region and South East Asia.
Lucas also operates through Lucas American Recyclers Inc., in San Francisco, Lucas Development Co. Ltd., in Tokyo, Lucas Canadian Recyclers in Montreal and Delta Engineering N.V. in Rotterdam.
The company has the technology and the equipment to successfully recycle many types of waste, without creating further pollution.
The basis of the Lucas system is a highly efficient, controlled system of combustion combined with the recovery of energy generated during the combustion process.
Furnace combustion gases are directed through a heat recovery system and the waste heat is then recycled as process steam, high pressure hot water or hot air.
As Lucas technology advances, so does the company's range of environmental engineering equipment.
New Lucas products and processes are being developed as a result of the
work constantly being carried out at its research and development establishments throughout the world.
The present range of Lucas recycling equipment consists of:
VEHICLE TYRE FURNACE: The Lucas tyre furnace is the only
fully automatic type furnace in the world. Tyres are fed whole into the furnace without any mechanical or chemical preprocessing. Smoke and smell are positively eliminated by the combustion vortex and the scientific control system.
SEWAGE SOLIDS FURNACE: The Lucas Sewage Furnace is a highly
efficient application of the Lucas combustion principle. All of the solids extracted during each stage of the sewage treatment process — primary sedimentation, sludge, screenings, scum and grit — all are reduced to a light,
inert and sterile ash. Smoke and odour are completely eliminated by the combustion vortex and the computerised control system.
LIQUID WASTE INCINERATOR: Liquid waste disposal is one of the
most difficult problems in environmental control. The Lucas combustion principle ensures that liquid waste disposal is completely smoke-free and odourless. The Lucas Liquid Waste Incinerator accepts a wide variation in the properties of incoming liquids.
CALVAL WOOD WASTE FURNACE: The Calval Wood Waste Furnace is
intended for the combustion of all types of wood waste from fine, potentially-explosive sander dust up to large off-cuts. The Calval combustion process ensures that wood waste disposal is completely smoke-free and odourless.
Lucas recycling equipment is also available for treatment of pathological waste and plastic waste.
Lucas
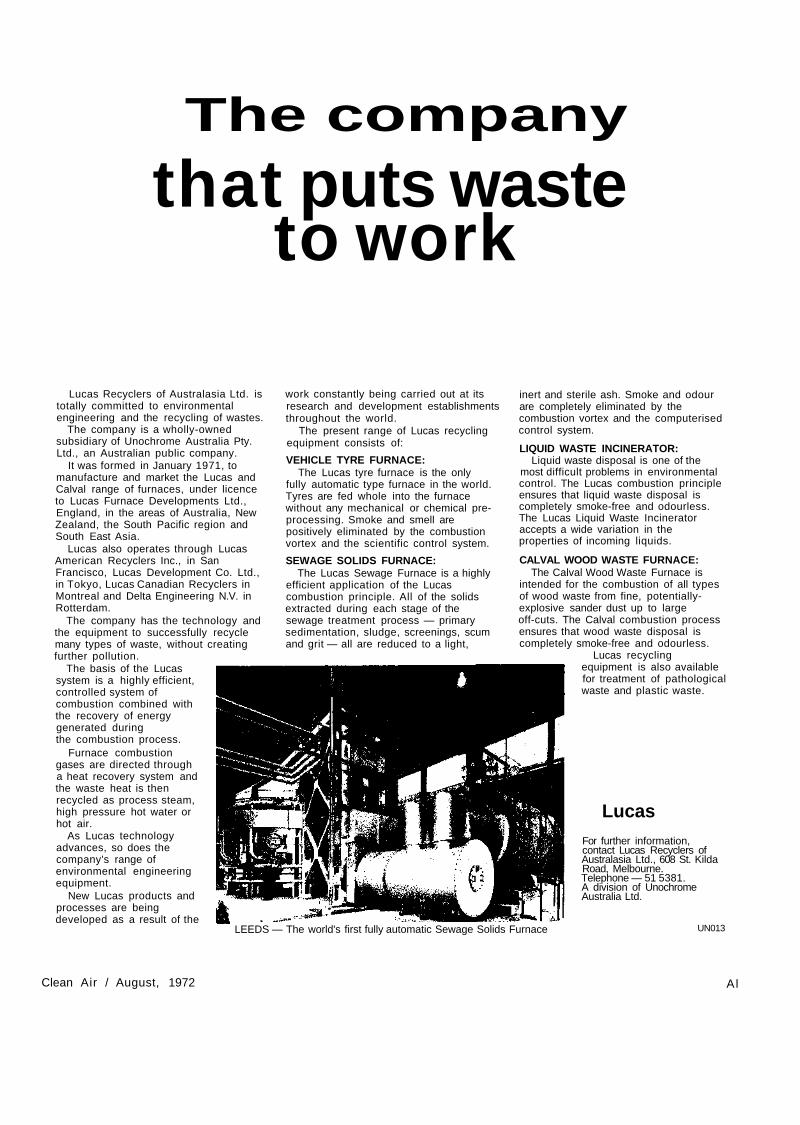
LEEDS — The world's first fully automatic Sewage Solids Furnace
For further information, contact Lucas Recyclers of Australasia Ltd., 608 St. Kilda Road, Melbourne. Telephone — 51 5381. A division of Unochrome Australia Ltd.
UN013
Clean Air / August, 1972 Al

environmental books. . .
Ramsay's Scientific and Medical Book Shop
have Australia's largest and most comprehensive
range of books on the environment.
For your FREE book list write or call.
RAMSAY'S SCIENTIFIC and MEDICAL BOOK SHOP (Division of the Ramsay Group)
182-206 Berkeley St., Carlton, 3053 Telephone 347 4122
This is the DCE Dalamatic Automatic, non-stop Dust Collector.
The Dalamatic uses the basic method of filtering dust-laden air through fabric filters. It differs in 2 important ways: effectiveness, and continuous and automatic operation.
Each filter pad is regularly cleaned in turn, while the Dalamatic is in use, by a brief powerful blast of compressed air. This is done automatically and continuously. No time and money-wasting stoppages for cleaning.
Multiple filter pads are arranged in cells to give four million area modules of approximately 40, 60, 120 or 200 sq. ft. These can be built up in banks and tiers.
With no moving parts, it needs minimal maintenance. Routine inspection is from the clean air side.
SEE US FOR DUST DUST CONTROL PTY. LTD. 70 Park St., Sth. Melbourne 3205 Phone: 699 2611 Sydney: 92 7142
PLEASE WRITE OR CALL FOR FURTHER INFORMATION ON DALAMATIC CONTINUOUS CLEANING FILTER.
A2 Clean Air / August, 1972

U M E ELIMINATION & NEUTRALISATION DUST COLLECTION
H-S-I-MIURA WET MEDIUM VELOCITY VENTURI SCRUBBERS
are designed specifically for each application of Fume Treatment and Dust Collection.
DESIGN FEATURES:
Multiple Entry & Discharge Vanes • No Moving Parts • Medium Pressure drop 6" wg • Medium Gas Velocity 60 ft/sec. • Low Water usage • Single & Multi Stage
H.S.I. MACHINERY DIVISION CNR. SILVERWATER ROAD & EGERTON STREET,
NORTH LIDCOMBE, NSW 2141, Telephone: 648-3633
Environmental Scientific Instruments By:
TRACOR INC.
DOHRMANN ENVIROTECH
BAUSCH & LOMB
WEATHER MEASURE CORPORATION
For:
Sulphur, Phosphorous, CO, Hydrocarbons
in Pollution Monitoring.
Sulphur, Nitrogen, Chlorine.
Particle Counting and Sizing.
Measurement of Climatic Conditions.
Utilising:
Gas Chromatographs with: Flame Photometric, Ultrasonic,
Coulson F.I.D. and other Detectors.
Microcoulometric Titration System.
Image Analysing Equipment.
Wide Range of Sensors, Indicators and Recorders.
Represented by the newly-formed:
R. & D. INSTRUMENTS PTY. LTD. 2 CORR STREET, MOORABBIN, Vic. 3189
TELEPHONE 95 1 8 2 2 o r 95 1 6 6 7
Clean Air / August, 1972 A3

SENSITIVITY from 0.001 to 10 000 ppm
FAST RESPONSE
less than 1 sec for most models
LINEAR RESPONSE
throughout the range of each instrument
MODELS laboratory and field
CONTINUOUS MONITORING
ACCURACY
1% full scale
EXCELLENT STABILITY
calibration remains constant for long periods
EASY OPERATION in a variety of environments
CHEMILUMINESCENT GAS ANALYSERS manufactured by the Thermo Electron Corporation are designed for the measurement of
OXIDES OF NITROGEN AND OZONE Selective measurement of NO and NOi is possible, with negligible interference from H2O, CO2, CO, C2H4, and SO2
Enquire about these analysers from
H. B. SELBY & CO. PTY. LTD. Melbourne Sydney Brisbane Perth Adelaide Hobart
DOWNS COULTER (1950)
PTY. LTD.
Filter Fabrics SYNTHETIC FABRICS FOR DUST & FUME CONTROL
53 Wellington Street, Collingwood
Telephone: 41-3525
For
DIRECT FLANGING Of
HEAVY GAUGE DUCTING Contact
AUSTRALIAN CONSTRUCTION
ENGINEERS CN.S.W.) PTY. LTD.
127 Eldridge Rd.f Bankstown, N.S.W. Phone: Sydney 70 5 3 1 0 Melb. 45 5146
Ductwork and duct sections made and flanged to your requirement or we will flange your own work. Direct flanged (no welding) ductwork, looks better, costs less. 15 to 60 inch diam. 16g. to ¼ inch plate
flanged to 2¾ inch high, ducts to 8 feet long.
A4 Clean Air / August, 1972
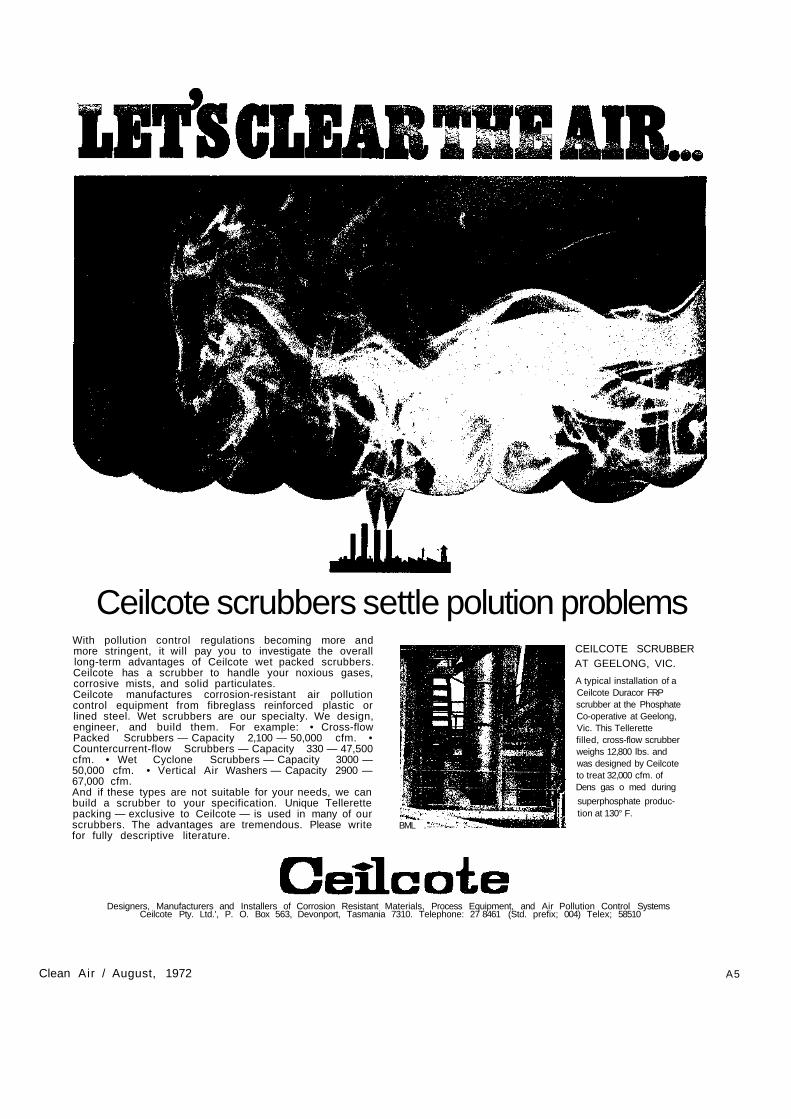
Ceilcote scrubbers settle polution problems With pollution control regulations becoming more and more stringent, it will pay you to investigate the overall long-term advantages of Ceilcote wet packed scrubbers. Ceilcote has a scrubber to handle your noxious gases, corrosive mists, and solid particulates. Ceilcote manufactures corrosion-resistant air pollution control equipment from fibreglass reinforced plastic or lined steel. Wet scrubbers are our specialty. We design, engineer, and build them. For example: • Cross-flow Packed Scrubbers — Capacity 2,100 — 50,000 cfm. • Countercurrent-flow Scrubbers — Capacity 330 — 47,500 cfm. • Wet Cyclone Scrubbers — Capacity 3000 — 50,000 cfm. • Vertical Air Washers — Capacity 2900 — 67,000 cfm. And if these types are not suitable for your needs, we can build a scrubber to your specification. Unique Tellerette packing — exclusive to Ceilcote — is used in many of our scrubbers. The advantages are tremendous. Please write for fully descriptive literature.
CEILCOTE SCRUBBER AT GEELONG, VIC.
A typical installation of a Ceilcote Duracor FRP scrubber at the Phosphate Co-operative at Geelong, Vic. This Tellerette filled, cross-flow scrubber weighs 12,800 lbs. and was designed by Ceilcote to treat 32,000 cfm. of Dens gas o med during
superphosphate production at 130° F.
BML .
Designers, Manufacturers and Installers of Corrosion Resistant Materials, Process Equipment, and Air Pollution Control Systems Ceilcote Pty. Ltd.', P. O. Box 563, Devonport, Tasmania 7310. Telephone: 27 8461 (Std. prefix; 004) Telex; 58510
Clean Air / August, 1972 A5

we bag their dust
Clean Air / August, 1972
Vol. 6 / No. 3 August, 1972
EDITORIAL
C o m m o n w e a l t h Env i ronmenta l Policies? W. Strauss
TECHNICAL PAPERS
JOURNAL OF THE CLEAN AIR SOCIETY OF AUSTRALIA AND NEW ZEALAND President: J.G. Schroder Federal Secretary: Dr. J. Harry, P.O. Box 163 Lidcombe, N.S.W. 2141
39
Air Pollution as an Ecological Factor, M. Treshow
Motor Vehicle Emission Controls for Australia, R. W. Bilger
Assessing Air Pollution at the Source and in the Environment, W. Strauss
Direct Flanging of Heavy Gauge Ducting, F. A. Ward and J. B. Ball
FEATURES
Branch News
Commonwealth Environmental Policies,
New Journal: The Environment This Month,
O.E.C.D., Australia and Air Pollution
Responsibility for Environmental Controls in N.S.W.
41
44
50
54
39
40
40
58
58
EDITOR W. Straass EDITORIAL BOARD W.H. Cock H. Hartmann J. Matter N. Hawthorn EDITORIAL OFFICE Department of Industrial Science University of Melbourne Parkville, V ic , 3052, Australia ADVERTISING H.E. Pett & Co. 29 Crossley Street, Melbourne 3000
'Clean Air' is listed in current contents and is published quarterly, in February, May, August and November Annual Subscription rates (inc. postage) for non-members and libraries: Australia $A2.50 U.S.A. $US3.50 U.K. £1.50p Elsewhere $A3.50 Single copies 0.75 cents Subscriptions and subscriptions enquiries should be directed to the Circulation Manager, Mr. W.H. Cock P.O. Box 79, Greensborough Vic, 3088, Australia
Clean Air / August, 1972 A7
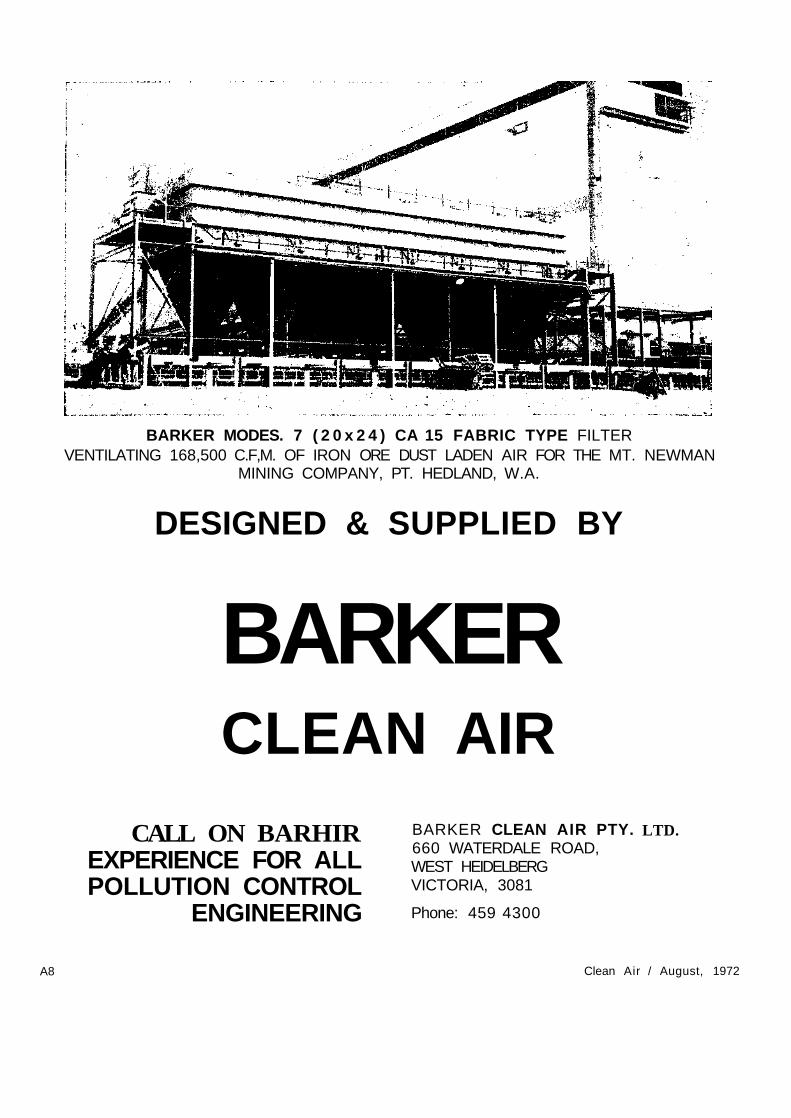
BARKER MODES. 7 ( 2 0 x 2 4 ) CA 15 FABRIC TYPE FILTER VENTILATING 168,500 C.F,M. OF IRON ORE DUST LADEN AIR FOR THE MT. NEWMAN
MINING COMPANY, PT. HEDLAND, W.A.
DESIGNED & SUPPLIED BY
BARKER CLEAN AIR
CALL ON BARHIR EXPERIENCE FOR ALL POLLUTION CONTROL
ENGINEERING
BARKER CLEAN AIR PTY. 660 WATERDALE ROAD, WEST HEIDELBERG VICTORIA, 3081
Phone: 459 4300
LTD.
A8 Clean Air / August, 1972

EDITORIAL
Commonwealth Environmental Policies?
The Minister for the Environment, amongst other duties, presented the first Commonwealth Government statement on environment policy just before he left, supported by State ministers and advisors, for the United Nations Conference on the Human Environment. The statement identifies the Commonwealth as having national responsibility for research, co-operation, and publicity concerning pollution.
It sets into motion four measures; first, the regular meeting of Commonwealth and State ministers of the environment, to be called the Australian Environment Council; second, an advisory council consisting of an academic geneticist, a chemist-executive and an architect, whose task will be to "suggest . . . . matters . . . . it feels it could examine"; third, a land use environment council, to advise where "environmental considerations arise in the Commonwealth's jurisdiction"; and fourth, the introduction of "impact statements" for activities of the Commonwealth or Commonwealth financially supported activities.
These four measures merely underline the Commonwealth's lack of authority and direct power in environmental problems affecting over
BRANCH NEWS
New South Wales Branch
The Air Pollution Course, sponsored by the Society and held at the University of New South Wales has now been completed. It was most successful with 188 registrations. Average attendances were between 100 and 150, and on some nights exceeded this. The course resulted in 7 new organisations and 35 individual members for the Society. Net profit was approximately $1,000, and requests for lectures were received from all parts of New South Wales.
Dr. John T. Middleton lectured to the N.S.W. Branch in May, and Mr. D. H. Lucas addressed the Branch the following week on developments in air pollution control in the U.K., with particular reference to the electric power supply industry. Mr. T. Nossal of Email spoke on August 15, on "Odour Counteraction". The N.S.W. Branch is also participating in the C.E.T.I.A. Conference being held in December 1973.
98% of its citizens, who do not live in territories directly administered by the Commonwealth. Furthermore, they do not show the Commonwealth supporting environmental control measures in the most important way open to it, by financial and economic measures.
In the past usually one State has had the initiative in introducing legislation, such as "Clean Air Acts" crank case blow-by, or warnings on cigarette packets. This was usually followed by other States with very similar measures, when it was found that they had widespread support among a concerned public. A good example of this initiative is the new Environment Protection Act in Victoria, which it appears, will be followed by other States.
But pollution controls do cost money, and here the Federal Government has enormous resources; it could support a division in C.S.I.R.O. (as recommended by the Senate Select Committee on Air Pollution; it could give research grants to Universities and industries which have special problems; it could provide finance for monitoring of pollutants, possibly providing part of this as a "free" service to the States (as in the case of meteorological information), and it could grant realistic tax remissions and depreciation allowances for industry. It is in these positive steps for the 98% of Australians that the Commonwealth initiative is still missing.
W. STRAUSS
Victorian Branch
Mr. B. C. S. Harper, Director of the Westernport Begional Planning Authority, addressed the Branch on "Regional Planning and Resource Management" on the 11th July. The lecture considered the spatial allocation of various activities, and the problems involved in making allocations, and in the trade-offs between conflicting aims which must be clearly defined in order to reach an optimal solution. The air movements of the Westernport region were described, and present knowledge of the influence of industry on the pollution pattern was discussed.
The Annual Dinner of the Victorian Branch was held at the Sciences Club on August 8. Mr. J. C. Fraser, Chairman of the Environment Protection Authority spoke to the members and their wives on the problem of development growth, and the limitations of growth. It was a very enjoyable and successful evening, where many who had met during the Conference were able to renew their friendship.
Clean Air / August, 1972 39
COMMONWEALTH
ENVIRONMENTAL POLICIES
On the 24th May, the Minister for the Environment, Aborigines and the Arts, Mr. Howson, presented the long awaited Commonwealth policy statement on the environment in the Federal Parliament. The more important parts of Mr. Howson's statement are reproduced here.
The Challenge: "The challenge before us all, as a people is very real and I am gratified, that in addition to the concern of Governments, there has developed a lively public conscience on this important subject. Fortunately, action is already being taken on several fronts to deal with pollution, waste disposal and the preservation of our natural environment with its unique flora and fauna. In short the challenge to protect the environment has been accepted."
"So far as the Commonwealth is concerned the question is one of devising a pattern of national development in which environmental objectives go hand in hand with economic, social and cultural goals. Our philosophy is directed to this end — to devising and developing such a pattern in co-operation with the States, with local government, with business and industry and the community as a whole."
A National Problem: "At the outset I should point out, however, that the main responsibility for the environment over the greater part of the continent of Australia lies with the States. That is the constitutional position. Nevertheless, when there is a great problem of national pollution, the Commonwealth must co-ordinate and co-operate with the States.
I would identify the Commonwealth as having a national responsibility: Firstly, to give leadership in researching the problem; secondly, to co-operate with others; thirdly, to act within its powers as necessary; and fourthly, to keep before the Australian people the dangers to their environment.
Action so Far: "Both the Commonwealth and the States have set up, or are setting up, administrative machinery to deal with environmental matters. All have a Minister with a specific responsibility for the environment. These Ministers are meeting together regularly for consultation as the Australian Environment Council. The Council has been constituted by agreement between the Commonwealth and the States and after this was ratified it held its first formal meeting in Sydney last month. The council is to draw up standards and guidelines for its own use and it
is hoped that these will have general recognition throughout the Commonwealth. The Council has already begun to study such important environmental problems as waste disposal and non-destructible, non-returnable, containers and packaging generally. The council has also noted the importance of decentralisation."
Impact Statements: "In this context I wish to announce that the Government has decided to introduce a system of "impact statements" designed to protect the environment. That is to say that when a Commonwealth Minister prepares a submission to the Cabinet on any proposal that has some relevance to the environment that submission must be accompanied by a statement setting out the impact the proposal is likely to make on the environment. This "impact statement" will, I am sure, become an important element in decision-making. I might add that State projects for which Commonwealth financial assistance is sought will also need to be supported by assurances that all environmental factors have been considered and evaluated."
Advisory Committee: The second announcement I wish to make concerns the membership of the special advisory committee which is to be set up to advise the Commonwealth Government in its consideration of environmental problems. This committee will consist of Prof. R. J. Walsh, Professor of Human Genetics, University of New South Wales, who will be Chairman; Mr. L. W. Weickhardt, Chancellor of the University of Melbourne; and Mr. K. W. Shugg, immediate past president of The Royal Australian Institute of Architects. This committee will be free to suggest to me as the Minister for The Environment matters that it feels it could usefully examine."
Land Use: "Hand in hand with conservation, of course, goes land use. The Government has decided to set up a Land Use Advisory Council to advise it in circumstances where environmental considerations arise in the Commonwealth's jurisdiction which could arouse general concern. For example, when proposed industrial undertakings of national importance might appear to conflict with the preservation of such environmental assets as national parks in Commonwealth Territories the Government will be able to seek independent advice from this Council. Consequently, the Government will be able to refer to this council matters relating to any land under the Commonwealth's control within Australia. The members of the council and its charter will be announced in due course.
Who Should Pay: In considering
the general question of pollution, contamination and despolitation of the land the question inevitably arises: "Who pays"? It is not easy to make an exclusive identification of liability because environmental damage is the result of many things — of technological success, of industrial activity and of social habit. A community responsibility has to be recognised."
In brief they (Organisation for Economic Co-operation and Development Principles) embrace the principle that "the polluter pays" — that the costs of pollution control measures should be recognised as part of the total costs of production. They also provide for the principle of harmony — or similarity — of standards to avoid favouring one country — or State — against the other in terms of industrial and trade competition. I believe that the "polluter pays" principle is likely to be adopted by nearly all the developed countries which are our main competitors. This will lead to some increased costs and may lead to some increase in prices. But I venture to say, at this stage, that so far as the Australian public is concerned increased product costs should be outweighed by the reduced social costs which the community is already bearing."
NEW JOURNAL The Environment this Month
A new scientific monthly has been announced with the title "The Environment this Month". It has Arthur G. Bourne as editor and a distinguished editorial board containing such famous names as Thor Hey-erdahl of the Kontiki Museum, Norway, Prof. G. W. Dimbleby, Jaques Piccard, and others.
The subject matter is concerned with questions of environmental quality in a number of areas, including the atmosphere. As part of the journal, a monthly environmental news review is included, although this can be purchased separately. This review will report and record the environmental situation month by month; environmental damage, pollution, misuse of resources, improvements in the environment and new products. The coverage will be very wide and will involve the land, the ocean, freshwater resources, urban and rural environments, wild life conservation, waste disposal and reuse of materials.
The first issue will appear in July, and the cost is $A46.25 p.a. for the Environment this Month, and $A22.00 p. a. for the Environmental News Review only. The sole Australian agents are Ramsay Surgical Limited, 182 Berkeley St., Carlton, Vic, 3053.
Clean Air / August, 1972 40

Michael Treshow
Professor Michael Treshow presented this plenary address to the session on biological effects of atmospheric pollutants at the 1972 International Clean Air Conference.
Dr. Treshow completed his undergraduate studies at the University of California, Los Angeles, in Ornamental Horticulture, and obtained his Ph.D. in 1954 from this University, at Davis and Riverside, in Plant Pathology. He worked subsequently for U.S. Steel Corporation, studying the biological effect of air pollutants, especially fluorides. In 1961 he took up an appointment at the University of Utah, where he is now Professor of Biology. His research in recent years deals primarily with the effects of air pollutants on plant disease and on plant communities.
He is the author of a number of books, the most significant being "Environment and Plant Response" (McGraw Hill 1971).
AIR POLLUTION AS AM ECOLOGICAL FACTOR
The air environment is vital to the health and welfare of man, and it is vital to the health of plants. When air is fouled by smoke, plants become sick and die in proportion to their sensitivity just as surely as though their roots were poisoned or a brisk chill froze their shoots.
The record of air pollution as an ecological factor is permanently inscribed on the blighted forests of the world. Thousands of acres of vital, forested watersheds have been, destroyed in Europe and North America for a hundred years and more when smelter emissions descended over them. One might have thought that a century of devastation would have taught us the incompatibility of air pollution and natural areas; regrettably, it has not. We continue to develop new industries in and near the world's great forests and on significant watersheds; and new losses continue to be reported each year. Ultimately, pollution may be eliminated, but until more complete emission control is achieved, we must do our utmost to reduce its effects using our existing capability. We must select sites where losses are least likely, and install controls commensurate with the hazards. Newly in-dustralizing countries are in an excellent position to benefit from experiences gained at the expense of forest and crop lands in older industrial areas.
The most graphic example of destruction in the United States dates back to the late 1800's before the toxic nature of smelter effluents was adequately recognized. In the Copper Hill of Tennessee, copper mining activity began about 1850, and by 1900 smelter emissions and logging for fuel had denuded 17,000 acres of once lush deciduous forest. Severe plant damage extended over an additional 30,000 acres. Fume injury to white pine was reported up to 20 miles from the centre of the basin. Soil erosion and depletion followed, and much of the area is still unable to support plant growth. The native, oaks, dogwood, and black tupelo have not returned. Studies revealed that even the climate and soil temperatures had been altered. Rainfall was consistently less in the bare zone, and evaporation
three times higher than in the forest. Another vulnerable area was the
upper Columbia River valley along the U.S.-Canadian border. One smelter in Trail, B.C. was emitting approximately 600 tons of sulfur dioxide per day in the early 1900's — not a tremendous amount, but this was in an area forested by plant species which were especially sensitive. By the time control equipment was installed, damage to timber had extended 50 miles into the U.S. down the deep gorge of the upper Columbia River Valley. Ponderosa pine, Western Larch, and Douglas fire were often killed. Timber reproduction was rare and returned slowly only 15 years after controls were installed. Men worked in the smelters exposed to even higher concentrationus with only slight ill effects. More sensitive in-dividuels suffered impaired breathing, considerable irritation, and some overgrowths of the alveoli much like that produced from smoking. But effects were not as great as to the more sensitive plants.
Power plants burning tens of thousands of tons of high sulfur coal each day now contribute further to pollution over many natural areas of achina Mountains of the U.S. through the Ruhr of Germany and into the Erzgebirge Mountains of Bohemia where thousands of acres of spruce forest have been laid bare by the sulfurous fumes. In Bohemia, 2,000 tons of SO2 are expelled daily, and by 1975 this will increase to 3,500 tons. Control procedures consist primarily of the use of tall stacks and of selecting and developing resistant species for reforestation. But this does not provide for the restoration of sensitive herbs and understory species which might be even more important to the watershed and aesthetic beauty than the timber species. Nor does it reduce emissions on a global or even regional scale.
Fluoride, particularly from aluminum plants and the phosphate industry have also been destructive to natural areas. In the Pacific Northwest the problem has existed since the 1940's when one of the first U.S. aluminium reduction plants was built in a Ponderosa pine forest. At the time, biologists had not learned that
41 Clean Air / August, 1972

this species was among the most sensitive to fluoride injury, and over 50 square miles of the trees were critically injured or killed around the reduction plant before a scrubber system was installed which removed the fluorides with reasonable efficiency.
Even after the acute sensitivity of conifers to fluoride was well known, water and power availability remained the main considerations for site selection, and new plants were installed often in the heart of susceptible forests. Timber and under-story species were injured sometimes critically. The industries later installed control equipment which should prove adequate to protect even the most sensitive species, but the damage had been done. The fault lies in poor communication among air pollution biologist, engineer, and meteorologist. Collectively the knowledge to have averted serious losses has been available for decades.
The current threat to forests and crops alike from pollutants now originates mainly from the exhausts of the world's millions of automobiles. When acted on by ultraviolet light energy from the sun, the emissions react photochemically to form ozone and peroxyacetyl nitrate (PAN) which are highly toxic to many plant species.
The threat was first exemplified in forests in the San Bernadino Mountains rimming the Los Angeles Basin where native vegetation has been damaged for nearly 20 years. Ponderosa pine and big cone fir which are dominant in these mountains are especially sensitive. These trees began to decline in the 1950's and by 1969, over 150,000 acres of trees had been damaged. An estimated 1,298,000 individual trees were affected. More sensitive herbs may have been killed out 20 years ago. These plants are vital to maintaining the nutrient balance of the soil and protecting the land from erosion, but their sensitivity to pollutants has been all but ignored.
Decline and mortality, plus a general bronzing and leaf stippling are the obvious expression of oxidant damage. In recent years attention has been turning to such more insidious effects as growth suppression and impaired reproduction. Pronounced suppression of growth has been demonstrated wherever the effects of ozone on growth have been studied. Ray Thompson of the University of California showed in 1970 that Los Angeles smog reduced yields of lemon trees some 30%, orange production was reduced 50% from the ambient concentrations. Clyde Hill of the University of Utah showed that ozone concentrations as low as 10 pphm, lower than those generally capable of causing visible
injury, reduced photosynthesis. Concentrations of 30 pphm reduced photosynthesis of sensitive species over 50%. Ozone concentrations in the range of 10. to 15. pphm which are capable of inhibiting photosynthesis occur frequently in the vicinity of urban areas and such concentrations are not usual in forests and agricultural areas 20 to 50 miles distant. Concentrations in this range are the lowest reported to cause the earliest effects of ozone on man — that of throat irritation.
The long term exposure of natural plant communities to such concentrations are potentially disastrous. There is always the possibility that the dominant forest species are not the most sensitive link in the continued success of the forest. The integrity of the forest biome might be disrupted if other species were particularly sensitive to a pollutant and killed out first. The killing of forest trees can have far reaching consequences as was demonstrated by Herbert Bormann and his colleagues in New Hampshire who showed just how serious a loss of timber might be to the watershed and stability of the biome. They cut all of the trees in a watershed of the Hubbard Brook Forest in New Hampshire and left the cut material to decay. Nothing was burned; nothing was taken away — still the nitrogen loss was doubled in the first year. Concentrations of calcium, magnesium, sodium and potassium in the runoff water rose several fold which caused serious eutrophication and pollution of the streams fed by this watershed. The soil had little capacity to return nutrients that were once locked in the biota. Perhaps most significant, the cumulative water runoff exceeded the expected amount by 40%. This could easily lead to flooding, depleting underground water reserves, and the volume of water available to agriculture, industry and the consumer in the long run.
Desert ecosystems may also be sensitive to certain pollutants, but little research has been conducted. Smelters have been located in the Southwest deserts of the U.S. for over 80 years, but concern has been largely restricted to agricultural crops — cotton, alfalfa, squash and other plants sensitive to sulfur dioxide. Now that huge coal-burning, power generating plants are being built in the south-west of the U.S. to utilize vast coal deposits, attention is turning to the possible effects of their pollution. Over 99% of the particulate emissions will be captured, but the sulfur dioxide and nitrogen oxides will be expelled unabated.
The past year, we have been attempting to determine the threshold concentration at which sulfur
dioxide first injures over 60 of the more important desert plants — plants like Indian rice grass, pinyon pine, sage and cliff rose. We have been fumigating native species both in the green house and in the field and find that even under the more sensitive greenhouse conditions, desert plants are unlikely to be injured by the anticipated sulfur dioxide concentrations. Even the most sensitive species are not injured until the air quality standards are substantially exceeded. We have also been fumigating one of the most dominant species in this part of the desert, Indian rice grass, with sulfur dioxide for periods of six weeks at low concentrations approximating the air quality standard. Here we find that seed germination and early growth, presumably the most sensitive as well as most critical stage of development, is unaffected by the sulfur dioxide at these concentrations. Consequently, it appears that the existing air quality standards are more than adequate to protect the vegetation and integrity of the plant community in this situation. Yet there exists a strong movement to prevent the development of power plants in this desert area, the basis for which is far deeper than the threat to the vigor of plants or health of man.
Despite filters and precipitators to collect the particulate wastes of power plants; and tall stacks, or ultimately some more effective device, to reduce ground level sulfur dioxide concentrations, so many more power plants are needed each year that cumulatively they may provide some threat to the ecosystems of the world. Fossil fuels must continue to be burned to provide for the ever increasing energy demands of the industrialized world. The fly ash which once clothed the landscape in a black mantle of soot has been largely removed, but much of the sulfur dioxide continues to escape into the world atmosphere. Stacks 1,000 and more feet high have reduced local ground level concentrations to where injury to vegetation is insignificant in most areas, but we still know little about the persistence or global dispersal of these emissions, or their long term effects on the ecosystem.
Global pollution is spreading. This is best exemplified in northern Europe where the soils and waters of Sweden are becoming more acid each year presumably from sulfur for nitrogen oxide emissions hundreds of miles away in Great Britain and Germany. The same type of acidification has also been described in the New England States where pollutants from New York and the Appalachians have been accumulating.
Biological effects provide the most meaningful criteria on which air
Clean Air / August, 1972 42
quality standards have been based. This is the value that the U.S. Environmental Protection Agency (EPA) has used in recommending standards to the individual States. The States are then free to either utilize these recommendations or establish even more stringent standards. This has led to some confusion in that each state seems to have a slightly different concept of the quality of air it desires. Some States have been so stringent in their air quality requisites that industry is having a difficult (or even impossible) time meeting them. What is the basis for such standards?
If the EPA standards are adequate to protect the most sensitive plant species and individuals, one might ask the basis for setting more stringent regulations. The answer to this lies in the wave of environmental concern and emotion now sweeping across the United States. Perhaps emotion is a valid value on which to base air quality standards, although some serious consequences might arise if pure air is sought too arduously. Competition on the world market, for instance. So long as all the countries of the world demand the same air quality and corresponding emission controls, the world price for goods should be consistent. But at the moment, the pressure for pollution control is limited largely to relatively few industrial countries, adding to their production costs. These industries are becoming less competitive on the world market. Clearly, industries might well seek areas for future development where standards are less stringent.
In the United States, not only must industries comply with federal and state air quality standards; in instances of increasing frequency, industries meeting these standards are being used by local farmers, the public, or even municipalities for purported losses incurred from concentrations of sulfur dioxide or fluorides even lower than the most stringent state standards. Sympathetic judges and juries are granting generous awards even in the absence of substantiating data to confirm the alleged losses. Thus the emotional basis of clean air is being carried over to the courts, and industry is paying the price for a reputation gained in the early days of environmental apathy. Possibly most seriously, court injunctions to stop construction of a number of nuclear power plants is expected to result in critical power shortages. Similar injunctions may be expected against some of the coal-fired plants.
Early air quality standards were based on biological criteria intended to protect the more sensitive individuals. In the United States these
43
criteria have largely been used and the philosophy of control now extends to the social or emotional criteria where restrictions are imposed on pollution per se, not for the biological hazards, but for the social or aesthetic hazards. In one paradoxical situation, power companies must meet particulate standards which are already exceeded by background dust levels.
Pure air is sought from the single sources which are easy to pinpoint. The feathery plumes of white haze flowing from stacks over 1,000 ft. high are readily identified. Less obvious are the hundreds of thousands of plumes released from the exhausts of automobiles. So far, the social pressure for the control of these emissions has been less intense than against industry, no doubt because less can be done, and the pocket-book of the consumer is affected. Controls have been developed for the automobile but they seem to have had little effect. Cars continue to become more numerous, more fuel is consumed by autos having controls, and the control devices seem to be effective only for the first few thousand miles, so this form of multiple source pollution persists and intensifies. It is from these sources that the real threat to vegetation and man still arises; only when the internal combustion engine
is conquered or replaced will the vegetation of the world's ecosystems be safe from destruction. Even if auto pollution were controlled, equally serious problems would remain. The added cars require greater numbers of roads which are both ugly and costly in tax dollars to maintain. Urban planning requires a total systems approach. Air pollution must not be considered alone.
Concern has been expressed that pollution from an ever expanding industrial and power-based society will destroy man. This need not be the case. The environmental awakening over much of the world has assured that pollution control technology Is entirely capable of reducing emissions to harmless levels if society is willing to take action and pay the prices. The standards set and attainable are adequate to protect even the most sensitive organisms — whether man or plants.
But two problems still persists: (1) Control of emissions from transportation sources, especially the automobile; and (2) compelling the use of known control technology on a world wide basis. Too many nations still are unwilling to pay the necessary price for pollution control; and economic expedience remains more vital to them than environmental protection.
GOT A POLLUTION PROBLEM THAT'S WORRYING YOU ?
WANT TO SAVE YOURSELF TIME AND MONEY ?
Contact the people with the experience and knowhow to
solve your problem
AUSTRALIAN ENVIRONMENTAL CONSULTANTS PTY. LTD.
an organisation devoted to solving pollution problems
through a total service involving:
• Consultation * Problem Evaluation
• Field Testing * Engineering
• Laboratory Analysis * Commissioning
Engineering Office: Laboratory:
7 Palmer St., Jolimont, 3002 Dunstan's Crt., Keon Park, 3073
Melb. 63 9581 63 5899 Melb. 460 1831
Telex 30204
Clean Air / August, 1972

R. W. Bilger MOTOR VEHICLE EMISSION CONTROLS FOR AUSTRALIA
Comparison of recent air pollution data for Sydney with World Health Organization goals indicate that pollution from motor vehicles is the major air pollution problem at the present time and that the 1972 /74 Australian emissions standards for new vehicles are far from sufficient to achieve the control required.
This paper advocates a "Best Practicable Means" approach and the technical and economic feasibility of various levels of control are examined. Recommendations are made for 90 per cent control of carbon monoxide and hydrocarbons and 75 per cent control of nitrogen oxides to become effective in 1977 with an interim standard to be introduced in 1975.
Dr. Bilger is Senior Lecturer in Mechanical Engineering at the University of Sydney. On leave in 1970 he spent a short time as Technical Director of Handley Page Aircraft Ltd. in England and later as a staff consultant to Northern Research and Engineering Corporation, Cambridge, Mass. U.S.A. where he worked on low pollution engines for motor vehicles. He has continued to work actively in this area as well as continuing his research on the thermo-fluid mechanics of combustion processes.
Introduction: It is now common ground that pollutant emissions from motor vehicles in Australia should be controlled in order to protect the environment of our cities. Recent and proposed legislation embodying Australian Design Rules Nos. 26 and 27(D recognize this need and their introduction will make a worthwhile start on controlling the problem of air pollution from this source. However, since the time at which the current legislative programme was formulated there has been a large re-evaluation, by both the scientific community and the public at large, of the magnitude and importance of the air pollution from this cource in our major cities. This has been triggered by two dramatic events —
1. The discovery in Sydney that oxidant levels of more than 15 pphm for a one hour average are not uncommon and that this city has a photochemical smog problem of world scale severity.
2. The adoption by the World Health Organization of stringent long term goals for ambient air quality. These have brought into focus the adverse effects on man and his environment of what were hitherto thought to be low levels of pollution.
The W.H.O. goals and appropriate pollution levels in Sydney are shown in Table 1. Particulate and sulphur dioxide levels primarily associated with industrial activity are only twice the W.H.O. goals for the worst sites and are generally decreasing with time as more industrie.l premises come under control(4). On the other hand, carbon monoxide and photochemical oxidant levels, primarily associated with motor vehicles, are three to five times the W.H.O. goals and are on the increase. There is also concern about pollution from nitrogen dioxide and lead and adoption of long term goals by the W.H.O. for these pollutants can be expected in due course. It can be seen that motor vehicles are the major cause for concern in air pollution control in Sydney at the present time.
Public feeling on this issue is mounting rapidly and it will be assumed here that a consensus exists for a new look at the programme for
emissions control from motor vehicles in Australia. The automobile industry has pledged itself to remove the motor vehicle from the arena of air polluters CO. The Federal and State governments have also made far-reaching pledges on the preservation of the environment^), if public credibility is to be maintained this rhetoric should be followed by appropriate action.
Various approaches are available to control pollution from motor vehicles. We shall confine ourselves here to the approach which regulates emissions from motor vehicles through the use of emission standards, and furthermore to the application of these standards to new vehicles only. This approach has been found to be the most practicable in a large number of countries and has been the approach used to date in Australia (the machinery for it thus exists or is under construction). It is believed that this approach is the least costly way of achieving long-term pollution control. Short term control requires other action and will be considered separately.
The "Best Practicable "Means" Approach Having confined ourselves to setting emission control standards for new vehicles there is still the question of the philosophical approach to be adopted. The "Best Practicable Means" approach is adopted here. This approach is the central tenet of all clean air regulations issued in Australia, where the various Clean Air Acts derive from the British Clean Air and Alkali Acts(9). By "Best Practicable Means" is meant the best technically feasible method of control which can be used without being punitively costly. Emission standards are written so that this method or an equivalent will be used. There is no burden of proof on the control authority to prove that the degree of control required is necessary or that the benefits will definitely outweight the costs. (Nor is there a burden of proof on the polluter to prove that the control will be sufficient). An alternative approach is to demand that the technology be developed regardless of
Clean Air / August, 1972 44

Table 1 Ambient Air Quality Goals and Sydney Values
Reference 3. f U.S. Standard (Ref. 2) for NO2 and proposed U.S. standard (Ref. 6) for Pb. ji^g/m3 at 25° C.
cost so that air quality standards can be met. Air quality standards and goals such as those adopted in the U.S. and by W.H.O.(2,3) are rather arbitrary as knowledge of no-effect levels is far from precise. Costs of air pollution are also ill-defined and it is not appropriate to base emission standards on benefit cost studies. Considerations improvements in air quality and costs and benefits will of course be necessary in basing standards on the "Best Practicable Means" approach; however they will not be paramount. The opinion of the W.H.O. Expert; Committee on Air Quality should be kept in mind —
" . . . exposure to t h e . selected pollutants should bo kept as low as possible as non-effect levels are presently not well defined a n d may not be for a long time to come"'3).
What is Technically Feasible? It cannot be doubted t h a t the 1972
45
U.S. Federal and California standards are technically feasible. Several million vehicles have been built and sold to these standards. These vehicles show a reduction in exhaust hydrocarbons of about 75 per cent, and in carbon monoxide of about 68 per cent, from uncontrolled levels. They also have evaporative emission controls. Nitrogen oxides are not controlled by the Federal legislation, but for California 25 per cent, control is required. Equivalent standards to these could be made effective in Australia in 1975, making allowance for the required 2-3 years lead time in the industry.
The U.S. Federal and California standards for 1973 and 1974 have been generally accepted by the industry si feasible. Hydrocarbon and carbon monoxide control are the same as 1972 requirements but the Federal standards call for a 33% reduction in oxides of nitrogen by 1973 and the Californian standards require a 67%
reduction by 1974. Equivalent standards to these could be made effective in Australia by 1976.
The U.S. Federal standards for 1975 have not been generally accepted by the industry as being technically feasible but with the denial of the year's extension they have become technically feasible in law. These standards require a 97% reduction in hydrocarbons and a 96% reduction in carbon monoxide. The succeeding 1976 standards require, in addition 93% control of nitrogen oxides. This latter requirement has not yet been shown to be feasible but there is a good chance that it will be within the next year or two. The industry's complaint on these standards is that more development time is needed. That they will become technically feasible is a matter of time. If all goes well the earliest that they could be made effective in Australia would bs about 1979.
Clean Air / August, 1972
What are the Costs of Control?
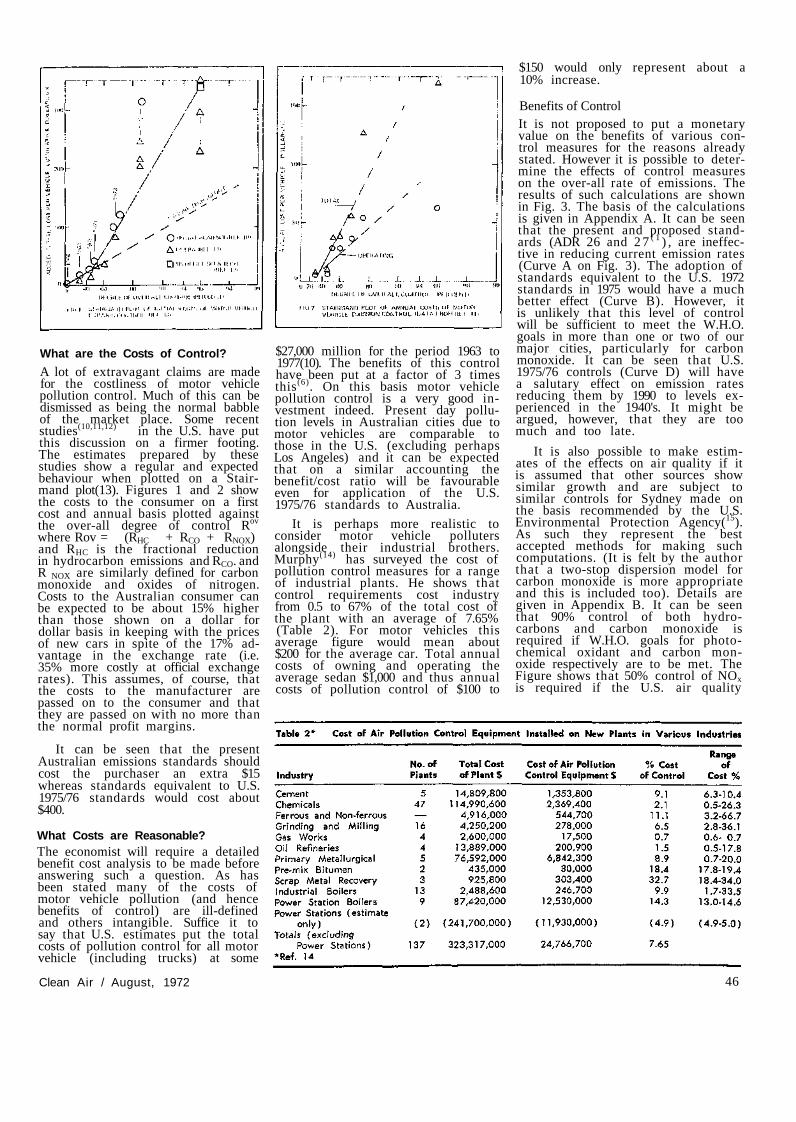
A lot of extravagant claims are made for the costliness of motor vehicle pollution control. Much of this can be dismissed as being the normal babble of the market place. Some recent studies(10,11,12) in the U.S. have put this discussion on a firmer footing. The estimates prepared by these studies show a regular and expected behaviour when plotted on a Stair-mand plot(13). Figures 1 and 2 show the costs to the consumer on a first cost and annual basis plotted against the over-all degree of control Rov
where Rov = (RHC + RCO + RNOX) and RHC is the fractional reduction in hydrocarbon emissions and RCO. and R NOX are similarly defined for carbon monoxide and oxides of nitrogen. Costs to the Australian consumer can be expected to be about 15% higher than those shown on a dollar for dollar basis in keeping with the prices of new cars in spite of the 17% advantage in the exchange rate (i.e. 35% more costly at official exchange rates). This assumes, of course, that the costs to the manufacturer are passed on to the consumer and that they are passed on with no more than the normal profit margins.
It can be seen that the present Australian emissions standards should cost the purchaser an extra $15 whereas standards equivalent to U.S. 1975/76 standards would cost about $400.
What Costs are Reasonable? The economist will require a detailed benefit cost analysis to be made before answering such a question. As has been stated many of the costs of motor vehicle pollution (and hence benefits of control) are ill-defined and others intangible. Suffice it to say that U.S. estimates put the total costs of pollution control for all motor vehicle (including trucks) at some
$27,000 million for the period 1963 to 1977(10). The benefits of this control have been put at a factor of 3 times this(6). On this basis motor vehicle pollution control is a very good investment indeed. Present day pollution levels in Australian cities due to motor vehicles are comparable to those in the U.S. (excluding perhaps Los Angeles) and it can be expected that on a similar accounting the benefit/cost ratio will be favourable even for application of the U.S. 1975/76 standards to Australia.
It is perhaps more realistic to consider motor vehicle polluters alongside their industrial brothers. Murphy(14) has surveyed the cost of pollution control measures for a range of industrial plants. He shows that control requirements cost industry from 0.5 to 67% of the total cost of the plant with an average of 7.65% (Table 2). For motor vehicles this average figure would mean about $200 for the average car. Total annual costs of owning and operating the average sedan $1,000 and thus annual costs of pollution control of $100 to
$150 would only represent about a 10% increase.
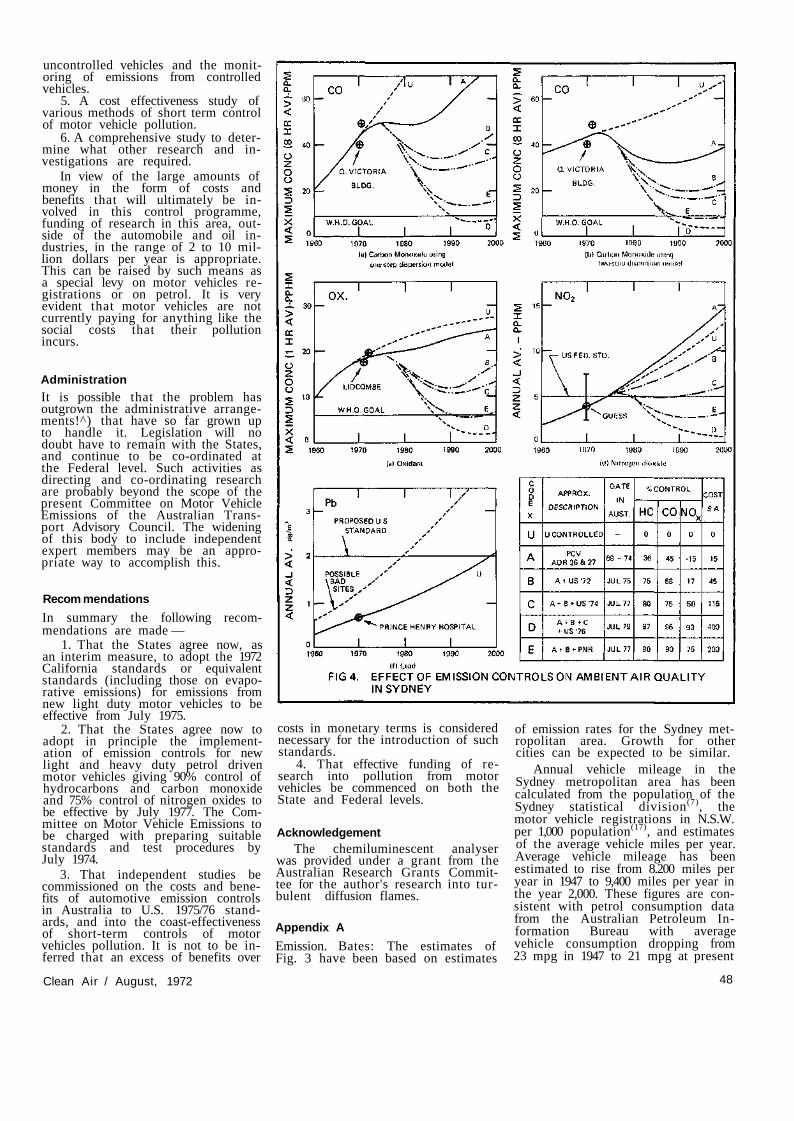
Benefits of Control It is not proposed to put a monetary value on the benefits of various control measures for the reasons already stated. However it is possible to determine the effects of control measures on the over-all rate of emissions. The results of such calculations are shown in Fig. 3. The basis of the calculations is given in Appendix A. It can be seen that the present and proposed standards (ADR 26 and 2 7 ( 1 ) , are ineffective in reducing current emission rates (Curve A on Fig. 3). The adoption of standards equivalent to the U.S. 1972 standards in 1975 would have a much better effect (Curve B). However, it is unlikely that this level of control will be sufficient to meet the W.H.O. goals in more than one or two of our major cities, particularly for carbon monoxide. It can be seen that U.S. 1975/76 controls (Curve D) will have a salutary effect on emission rates reducing them by 1990 to levels experienced in the 1940's. It might be argued, however, that they are too much and too late.
It is also possible to make estimates of the effects on air quality if it is assumed that other sources show similar growth and are subject to similar controls for Sydney made on the basis recommended by the U.S. Environmental Protection Agency(15). As such they represent the best accepted methods for making such computations. (It is felt by the author that a two-stop dispersion model for carbon monoxide is more appropriate and this is included too). Details are given in Appendix B. It can be seen that 90% control of both hydrocarbons and carbon monoxide is required if W.H.O. goals for photochemical oxidant and carbon monoxide respectively are to be met. The Figure shows that 50% control of NOx is required if the U.S. air quality
Clean Air / August, 1972 46

standard of 5 pphm for NO. is to be maintained. However, there is considerable uncertainty as to the levels of NO. at present in the atmosphere in Sydney. NOx also has effects on production of photochemical smog. The present understanding of this complex reaction is that control of NOx if beneficial. The uncertainties in present ambient levels of N02 should be emphasised. (A monitoring programme is being started at the author's laboratory. Some preliminary results are shown in Fig. 5).
It can also be seen from Fig. 3 and Fig. 4 that new car standards are not fully effective for about 10 years and with a 3 year lead time required between formulation and effective date we are currently formulating standards for 1985 to 1990. It should be kept in mind that in the interim pollution levels will be higher than they are today unless short term controls are employed which will be very expensive. In either events the patience of the public is likely to be sorely tried by 1985 and they will have little sympathy for polluting motor vehicles.
Control Programme
The following conclusions can be drawn at this stage —
1. A very good case can be made for the introduction of standards equivalent to the U.S. 1975/76 standards to be made effective in Australia by July 1979. (Plan D of Figs. 3 and 4). At a cost to the consumer of $400 per new vehicle, 1 cent per mile in operating cost and $200 per year total annual cost (including amortisation at 30% of initial cost), these costs are by no means punitive. (It is possible, based on American experience, that benefit cost studies would also show a worth while return on investment).
2. The minimum acceptable programme based on presently available knowledge is for 90% control of hydrocarbons and carbon monoxide and 75% control of nitrogen oxides. Costs to the consumer of $200 on a new vehicle, operating costs of 0.6 cents per mile, and a total annual cost of $120, are entirely reasonable and almost certainly will be outweighed by tangible benefits. Although controls at this level are not exactly equivalent to others on the books elsewhere they are undoubtedly feasible and could be introduced to be effective in Australia by July 1977 (Plan E).
3. If lead-free petrol is not required to meet the requirements of vehicles meeting the new standards, 50% con-quired by January, 1980. trol of lead in petrol should be re-
4. As suitably effective standards cannot be introduced before July 1977 there is a strong case for early implementation of interim standards
which are much more effective than ADR 26 and 27. A suitable standard would be the 1972 California standards which require exhaust limits of 1.5 g/mile of hydrocarbons, 23 g/mile of carbon monoxide, and 3.0 g/mile of nitrogen oxides together with evaporative emissions control. The U.S. Federal test procedure using the 7 mode cycle and bag sampling would be appropriate. Such standards could be made effective by January or at the latest July 1975. (Plan B).
5. Delays in implementation of a suitable programme on new vehicles wlil only mean that more money will have to be spent on short term control measures.
Investigation and Research
It is often implied that no action should be taken until all the facts are thoroughly investigated and all the research is done. And then the story is that the Federal government can't provide the money as it is the States' prerogative and the States can't because they haven't got the money and so on.
Then plain fact of the matter is that immediate action is required without any need for prior research or investigations.
In the long term a vigorous programme of research is required to determine the optimum levels of control and the optimum emissions testing procedure. In the near term research and investigations into the following are required —
1. A benefit cost study of the implementation of U.S. 1975/76 emission controls in Australia effective in 1979.
2. Continuous monitoring of pollutant concentrations in major cities particularly nitrogen dioxide, nitric oxide, non-methane hydrocarbons, lead and asbestos, but also more monitoring of ozone, oxidants and carbon monoxide.
3. Research into driving patterns in Australian cities with particular reference to devising practical emissions testing procedures for use with high control standards.
4. The establishment of comprehensive base data on emissions from
47 Clean A i r / August , 1972
uncontrolled vehicles and the monitoring of emissions from controlled vehicles.
5. A cost effectiveness study of various methods of short term control of motor vehicle pollution.
6. A comprehensive study to determine what other research and investigations are required.
In view of the large amounts of money in the form of costs and benefits that will ultimately be involved in this control programme, funding of research in this area, outside of the automobile and oil industries, in the range of 2 to 10 million dollars per year is appropriate. This can be raised by such means as a special levy on motor vehicles registrations or on petrol. It is very evident that motor vehicles are not currently paying for anything like the social costs that their pollution incurs.
Administration It is possible that the problem has outgrown the administrative arrangements!^) that have so far grown up to handle it. Legislation will no doubt have to remain with the States, and continue to be co-ordinated at the Federal level. Such activities as directing and co-ordinating research are probably beyond the scope of the present Committee on Motor Vehicle Emissions of the Australian Transport Advisory Council. The widening of this body to include independent expert members may be an appropriate way to accomplish this.
Recom mendations
In summary the following recommendations are made —
1. That the States agree now, as an interim measure, to adopt the 1972 California standards or equivalent standards (including those on evaporative emissions) for emissions from new light duty motor vehicles to be effective from July 1975.
2. That the States agree now to adopt in principle the implementation of emission controls for new light and heavy duty petrol driven motor vehicles giving 90% control of hydrocarbons and carbon monoxide and 75% control of nitrogen oxides to be effective by July 1977. The Committee on Motor Vehicle Emissions to be charged with preparing suitable standards and test procedures by July 1974.
3. That independent studies be commissioned on the costs and benefits of automotive emission controls in Australia to U.S. 1975/76 standards, and into the coast-effectiveness of short-term controls of motor vehicles pollution. It is not to be inferred that an excess of benefits over
costs in monetary terms is considered necessary for the introduction of such standards.
4. That effective funding of research into pollution from motor vehicles be commenced on both the State and Federal levels.
Acknowledgement The chemiluminescent analyser
was provided under a grant from the Australian Research Grants Committee for the author's research into turbulent diffusion flames.
Appendix A
Emission. Bates: The estimates of Fig. 3 have been based on estimates
of emission rates for the Sydney metropolitan area. Growth for other cities can be expected to be similar.
Annual vehicle mileage in the Sydney metropolitan area has been calculated from the population of the Sydney statistical division(7), the motor vehicle registrations in N.S.W. per 1,000 population(17), and estimates of the average vehicle miles per year. Average vehicle mileage has been estimated to rise from 8.200 miles per year in 1947 to 9,400 miles per year in the year 2,000. These figures are consistent with petrol consumption data from the Australian Petroleum Information Bureau with average vehicle consumption dropping from 23 mpg in 1947 to 21 mpg at present
Clean Air / August, 1972 48

and 19 mpg in the year 2,000. The rise in motor vehicle registrations per head of population is assumed to flatten out with a level of 600 being reached in the year 2,000. The current rate in the U.S. is about 500 per 1,000 population and still rising as compared with 390 at present in Sydney. No allowance has been made for diesel powered trucks and buses and motor cycles in the motor vehicle population, but these are known to be small. Also country mileage of city vehicles has been neglcted as being mostly balanced by city mileage of country-registered vehicles. Projected estimates for the future are probably most sensitive to population projection. However the population predicted for the year 2,000 of 5.4 million is consistent with predictions of the Sydney Regional Planning Authority.
The distribution of vehicle mileage according to age is shown in Fig. 6. The U.S. data is from the U.S. Department of Commerce figures quoted in Ref. 10. The Australian distribution is assumed and includes the emissions deterioration factor.
The emission reductions due to control measures are taken as independent variable except for Plan A. Here the emission reduction due to crankcase control is assumed at 20% on cydrocarbons and for ADR 26(1)
to be 10% on CO. After the implementation of ADR 27 the total reductions in HC and CO are assumed to be 36% and 45% with a consequent increase of nitrogen oxides of 15%. These figures are consistent with the data of Watson (Ref. 18) and somewhat higher than values calculated by the author. The even higher reductions claimed by Roberts(7) are difficult to credit.
In all of this it is not the absolute figures that are important but figures showing growth and decline. Aceord-
49
ingly the data are normalized with 1970 as the base year and in Fig. 3 are shown as a percentage of that year's emissions.
Appendix B Ambient Air Quality: The estimation of air quality changes from emissions rates is fraught with many difficulties. However, the simple dispersion formulae sanctioned by the U.S. Environmental Protection" Agency(is) are the best available and probably sufficiently accurate for general levels of primary pollutants. The formulae may be expressed —
street cannot follow the general growth of vehicle population, but will for the most congested streets remain relatively constant. Accordingly pollution levels in such streets will follow more closely the emission rates of individual vehicles except that the rising general ambient level will restrict dispersion. It can be shown for this two step dispersion process that the concentrations will vary according to
where I = emission of average vehicle. The value of k = 0.25 was assumed for the CO calculations in Fig. 4.
In all calculations background concentrations were taken as close enough to zero except for carbon monoxide where Cb, = l ppm was used. The base year data used are those shown in Table 1.
This formula was used for all pollutants except photochemical oxidant. For secondary pollutants such as photochemical oxidants which are a product of atmospheric reactions the situation is much more complex. The U.S. Environmental Protection Agency has surveyed a large amount of data and come up with a graphical relationship relating variation in measured oxidant levels to changes in non-methane hydrocarbon emissions. This relationship is given in Appendix J to Reference 15.
Carbon monoxide emitted in city streets is subject to a two-step dispersion process — from the street to the general near ground ambient, and from there general dispersion. Emission rates in city streets will not follow over-all emission rates as the vehicle population in a given city

Werner Strauss ASSESSING AIR POLLUTION AT THE SOURCE AND IN THE ENVIRONMENT
Concentrations of major pollutants in waste gases are of the order of 0.1 to 10%, while at ambient levels these are only of the order of 0.01 to 10 ppm. Simple chemical techniques are available for spot checks, but very different sophisticated physicochemical sensors are required for monitoring pollutants at both levels. This paper reviews present Australian practice and some of the new developments that are being introduced.
Dr. Strauss is Reader in Industrial Science at the University of Melbourne. This paper was read to the Royal Australian Chemical Institute's Analytical Chemistry Symposium, May 1971, and the New Zealand Branch Conference of the Clean Air Society, March 1972.
Introduction: The preservation of an acceptable air environment requires the continuous monitoring of air pollutants in the atmosphere. Furthermore, it is essential to measure pollutants at their source to ensure effective control.
Pollutants are gases and particles which can be present in concentrations which may harm animals (including man), plants and property. It should be noted that these gases and particles originate only partly from man's activities, such as burning of fuels and manufacturing chemicals. To a greater extent they originate in nature, such as the thermal springs in New Zealand or biological degradation of faecal matter. In general, as far as gases originating in nature are concerned, their local concentrations are quite low and they are readily dispersed, but the pollutants generated by man's activities tend, under many circumstances, to be present in concentrations which harm man and his environment.
For these reasons, it is necessary to monitor environmental pollutants on a continuing basis, determining present levels, and whether they are changing in concentration. It is also vitally important to find experimentally, what levels of pollutants, either singly or in combination, will have a harmful effect, in order to determine permissible levels and air quality criteria.
It has long been recognised that it is essential to control a number of air pollutants at their source. This requires careful assessment of their quantity and composition so that suitable control equipment can be installed. To ensure continuing effectiveness of the control system, it is necessary to measure one or more of the most critical emissions continuously; for example, sulphur dioxide and particulate matter.
Emissions and Concentrations of Air Pollutants
The concentration of pollutants near the source, say at the exhaust of a petrol engine or the stack of a thermal power station, is several orders of magnitude higher than the con
centration of the same pollutants after dispersion. Different methods of measurement are, therefore, required for these two concentration levels.
Typical emissions from combustion sources for both mobile and stationary plant, are shown on Table 1, based on a unit of fuel burnt, it is evident that a significant amount of incomplete combustion takes place in internal combustion engines, compared to external combustion systems.
As pointed out above, most "pollutants" are present in nature, although with some exceptions, in very low concentration. Comparative data for typical urban concentrations are shown in Table 2, together with the average measured "background" concentrations. Included in this table are the only published data for a range of pollutants (other than sulphur dioxide) obtained for traffic lanes in Sydney, New South Wales, by the N.S.W. Department of Health(3).
Monitoring Environmental Air Pollution
The Australian Senate Select Committee on Air Pollution(7) was able to report extensive measurements of non-radioactive "fall-out", haze and sulphur dioxide concentrations for Queensland (1969), New South Wales (since 1959), Victoria (since 1960) and South Australia (1966). Measurements of these pollution parameters have been obtained for more than thirty years in the United Kingdom (8).
Fallout is measured by deposit gauges, which can either be of the British standard pattern(4), or of a simple design which is a 6 in. funnel placed on a one gallon bottle. These devices collect the solid particles which are large enough to settle out from the air by gravity, or which are washed out by rain. "Fallout" in Australia varies from about 4 tons/(mile2) (month) in rural areas, to almost 40 tons/(mile-) (month) in heavy industrial areas. The highest values are reported from parts of Port Kembla, while deposition rates of 10 tons/ (mile2) (month) are common in Australian urban areas. In comparison, some English industrial areas have
Clean Air / August, 1972 50

(a) To obtain the emission value, multiply by the %S in fuel. (b ) To obtain the emission value, multiply by % ash in fuel. It should be noted that nearly all solid fuel fired plants are supplier) from 66% to 99% of the solids produced. Typical emissions from a fuel oil fired boi ler ( 2 ) .
with arresters which collect
NOTE: The amount of sulphur oxides is a direct function of the amount of sulphur in the fuel
tons/(mile2) "fallout" over 80 (month) Haze, which is a familiar sight
over our cities during calm inversion conditions, is caused by suspended particles in the atmosphere. Those smoke and dust particles and droplets, whose size approaches the wavelength of light, have a maximum light absorption. This is estimated by drawing a sample of air through a filter paper and then measuring the light reflectance of the stain. The results are reported as the empirical "coefficient of haze-' (Coh units) per 1000 linear feet ranging from 1 (representing a very clear day) to 10, being a very unpleasant, smoggy day (10).
Sulphur dioxide, on a daily average basis, is determined by passing air, after filtration to remove dust (and sulphates), into an 0.03N hydrogen peroxide solution, acidified to pH5. The gas volume being sampled is measured with a domestic bellows gas meter following the absorption. This detects concentrations as low as 0.01 ppm.
It is unfortunate that these methods of measuring air pollution, which are widely used in Australia, do not really measure those pollutants which concern us most. The reason for this is that in recent years coal firing of boilers (both stationary industrial and locomotive), which are the major source of grit, and hence fallout, has virtually ceased. This is reflected in the reduced fallout measured by the N.S.W. Health Department in Sydney. Sulphur dioxide levels measured in Australia are generally low by world standards because sulphur is not a significant constituent of indigenous Australian coat or oil. The major sources of sulphur dioxide are from primary non-ferrous smelting which is carried out at a limited number of locations (e.g. Mt. Isa, Port Pirie, Wollongong), sulphuric acid plants,
51
and the burning of residual oils from Middle East crudes in industrial boilers. Nonetheless, small traces of sulphur dioxide can be a significant factor in forming droplets of photochemical smog haze.
The measure of "haze" by the paper tape sampler method, which is reported to the Senate Select Committee, is invariably carried out at ground or building levels and so can be, at best, a soiling index, rather than a measure of the number of sub-micron sized particles in the lower atmosphere, distributed below the thermal inversion limit, i.e. up to heights of 2000 to 3000 ft.
In Australia, the main source of urban air pollution, which spreads through whole metropolitan regions, is the motor car. Its emissions are carbon monoxide, hydrocarbons, aldehydes, ozone, oxides of nitrogen and particulates as well as traces of the oxides of sulphur.
In the United States, at the present time, there are a large number of monitoring stations, strategically placed in urban and rural locations, participating in the "Continuous Air Monitoring Programme" (CAMP)*. This surveillance system measures the following —
Total suspended particulates Sulphur dioxide Carbon monoxide Total oxidants Total hydrocarbons Nitric Oxide Nitrogen Dioxide. The suspended particulates are
then analysed for fluoride, nitrates, sulphate and ammonium ions; arsenic, beryllium, bithmuth, cadmium, chromium cobalt, copper, iron, lead, manganese, molybdenum, nickel, selenium, tin, vanadium and zinc. Asbestos, boron and silicates are also collected and analysed.
The collection of suspended par
ticulates is carried out by means of high volume samplers (50 ft. 3/min.) using fibreglass or membrane filters. The particulate composition is then determined by standard micro-chemical methods or with a mass spectrometer. The methods used for the gaseous pollutants will be outlined briefly.
Sulphur Dioxide: Elegant instrumental methods are available for rapid, continuous analysis of sulphur dioxide, and are used to supplement the standard 24 hour absorption system. They are based either on the measurement of conductance of a solution of acidified hydrogen peroxide (0.1 ml 30 wt % H202, 1 ml 0.1 NH2 SC4, 0.1 ml wetting agent, diluted to 1 litre), or by measuring the colouration of formaldehyde reagent (West-Gaeke p-rosaniline method). The West-Gaeke method suffers less from interfering materials, and tends to be more reliable, but has a 90% response time of about 10 mins, compared to about 4 mins. for the conductance method. A new development in measuring sulphur dioxide at ambient concentrations is a flame photometric detector, described by Crider(11) in 1965 and by Brody and Chaney(12) in 1966. This produces a response specific to volatile phosphorous and sulphur compounds. The flame detector, designed by Brody and Chaney is arranged so that a photo-multiplier tube views a region above the flame through narrow band optical filters. Sulphur compounds, when introduced into the hydrogen rich flame, produce strong lumine-
* Since 1968, the Sydney area has had 5 monitoring stations, which are equipped with automatic recording monitors measuring sulphur dioxide and smoke haze. At some sites the emissions of hydrogen sulphide, oxides of nitrogen and total oxidants are also recorded continuously. The collected solids at these sites are also analyzed for iron, copper and lead. The stations are located in the Parramatta River Valley, at Randwick and at Little Bay(3).
Clean Air / August, 1972
scent emissions between 300 and 423 Using a narrow band optical filter which permits transmission at 349 ± 5 m , a specific ratio of sulphur to non sulphur compounds between 10,000 and 30,000 : 1 was achieved. This has been applied to the measurement of ambient sulphur dioxide concentration(13).
An important development in sulphur dioxide analysis is a novel method of producing stable concentrations of this gas in a flowing stream of dilutent gas, by using a small sealed Teflon tube filled with liquid sulphur dioxide. The sulphur dioxide diffuses through the walls at a constant rate as long as the temperature is held constant(14).
Hydrocarbon Gases: These are detected and monitored either in a modified gas chromatograph or with a burner/flame ionization detector device.
Carbon Monoxide: This gas is monitored with non-dispersive infrared analysers, using long path length cells. Care must be taken because carbon dioxide, water vapour and hydrocarbons interfere and the response of the instruments is nonlinear.
Carbon Monoxide and Methane: It is important to separate methane (which is not an eye irritant) from other hydrocarbons, as well as to develop a more reliable method of carbon monoxide determination. An automated gas chromatograph, which determines these two gases, has been developed for this reason by workers at the APCO*. This method covers the concentration range from 0.010 to 200 ppm. This is possible by using a pre-column system and a catalytic surface which quantitatively converts CO to CHt.
Nitric Oxide and Nitrogen Dioxide: These are determined in concent-rattions up to l ppm using automated wet chemical methods which incorporate diazo-coupling reactions. The recommended method for the nitrogen dioxide is the absorption of the gas in an alkaline solution (sodium hydroxide and butanol) to which hydrogen peroxide has been added to oxidize the sulphur dioxide and prevent interference. The nitrogen dioxide is then determined by the dia-zotization of sulphanilamide in the presence of phosphoric acid, followed by coupling with N-(l-:naphthyl) ethylene diamine dihydrochloride, in sulphanilic and acetic acid. If the nitric oxide is to be determined as well, the air stream is split, and one part is passed through acidified
* The Air pollution Control Office (APCO) is part of the United States Environmental Protection Agency (EPA), established in December, 1970. It incorporates the former Air Pollution Division in the U.S. Public Health Service, Department of Health, Education and Welfare.
potassium permanganate solution, which converts the NO to NO2 which is then treated as before(15).
Total Oxidants (0-0.5 ppm), which is mainly ozone with some nitrogen dioxide, are determined by the neutral iodide reaction, carried out in an electric cell
The iodine is reduced at the cathode by the reaction:
and the corresponding oxidation reaction occurs at the anode. The resultant current flow in the circuit is sensed by a current amplifier, and the instrument is calibrated to give a "total oxidants" reading.
Ozone by itself will, in the future, be determined in an apparatus using the Rhodamine B reaction(16). However, the early reagent developed by Regener, in which the dyestuff was absorbed on silica gel, was moisture sensitive. A recent development is a chromatographic sheet covered with Rhodamine B, combined with a silicone resin which is a suitable sensor.
Amines (a typical constituent of some odours), can be collected in trace amounts, in hydrochloric acid. They are than extracted with amyl acetic ester, and the extract reacted with ninhydrin, for a photometric amine determination. This applies in particular to the aliphatic series from C1 to C6(17).
Hydrogen Sulphide in concentrations down to 0.05 ppm, can be determined using fluorescein mercuric acetate in 0.01 N sodium hydroxide solution, and measuring the fluorescence with a photofluorometerd8).
New monitoring methods are currently being developed, many of which will be more specific and have greater reliability than the present generation of ambient air pollution measuring instruments. They include methods using the fuel cell principle for measuring carbon monoxide and sulphur dioxide, an automated gas chromatograph for determining carbon monoxide, methan, total hydrocarbons, hydrogen sulphide and certain organic sulphides, atomic absorption spectroscopy for continuous measurement of lead, specific ion electrodes for measurement of fluorides and a method for determining oxides of nitrogen in which ozone is reacted in the gas phase with another gas, producing a measurable luminescence. Lidar (light detection and ranging) instruments for atmospheric particulate concentrations are also being investigated(19,20).
Measuring Pollution at the Source
The relatively high concentrations of
gases occuring at a source of air pollution are measured for one or more reasons.
These are — 1. To ascertain the gas composition
and temperature in order to estimate the resultant ground level concentrations under adverse weather conditions, on which a decision concerning gas cleaning plant or chimney stack height may be based.
2. To determine the volume, constitution, temperature and humidity of the gas, which will determine the type and size of gas cleaning plant that will be required to avoid pollution.
3. To monitor the gases to show that the process and the gas cleaning plant are operating satisfactorily.
In the first two of these, the gases are sampled on a small number of occasions, covering one or a number of cycles of operation of the plant and the analysis is comprehensive, while for the last, one (or a very small number) of constituents and characteristics are measured and recorded on a continuous basis.
In all cases, part of the waste gas stream must be sampled, the size of the sample depending on the method of analysis. If the particulate material in the gases is being collected (and is greater than 1 m) the gases must be sampled at the same velocity as the main gas stream (i.e. iso-kine-tically). Otherwise, too large or too small a portion of the coarser fractions will be in the sample, depending on whether the sampling is too slow or too fast. If all particles in the gas are in the sub-micron size ranges they will follow gas streamlines, and isokinetic sampling will not be needed.
The particules must be collected on a filter pad, which may be paper, glass or quartz fibre or a "membrane" filter, such as Millipore, Gelman or Sartorius. If the gases have a high moisture content it is important to collect the solids at temperatures above the dew point of the gas.
After collection, the particulate matter can be assessed for quantity, particulate size distribution and chemical composition. From the known volume of the gas from which the particles have been collected, their concentration in the gas stream can also be calculated. If particulate concentrations are to be measured and monitored on a continuous basis, or else the optical density of the gas stream is measured(21), a method of collection and assessment over brief time intervals is needed.
In one such instrument, particles are collected in a small electrostatic precipitator, the quantity of dust being determined by the charge carried on the particules (22). An altern-
Clean Air / August, 1972 52

ative method of measuring the dust is to find the resistivity of the deposit. Another semi-continuous method of measuring dust particles is to allow them to settle on a glass window after sampling. The obscuration of light through the dust layer is also a good measure of the dust concentration(23), In all these instruments the system is cleaned intermittently by compressed air jets.
The type of sampling used for gases depends on whether the constituent being measured is a major or a minor component. In the case of a major component, such as carbon monoxide in flue gases, a sample of the gas is analysed. If the gas is present in minor amounts, it is drawn through a suitable absorbent. In all cases, a particle filter has to be used to avoid contamination of the absorbent system.
For measuring components for the first two reasons, chemical methods of analysis are used. Thus, major components in flue gases are usually determined by a simple Orsat apparatus or one of its modifications, using absorption of CO2,02 and CO in turn.
Other constituents, such as hydrogen and methane can also be found by burning the residual gases with air (or oxygen), and finding the reduction in volume and the amount of COs produced.
Sulphur dioxide or other minor components, on the other hand, have to be determined by passing an appreciable quantity of the gas sampled through an absorbent over an extended period.
When continuous monitoring is required, then an automated physical method of measurement is desirable. Thermal conductivity devices are suitable for CO- as CO has almost the same thermal conductivity as air. Unfortunately, SO2 has a thermal conductivity much lower than air and about one half that of CO2. Appreciable amounts of SO-, therefore, cause serious errors in CO- measurements made by this method. Infrared absorption can be used for SO-, CO, CO2, H2O, N-O, and CH„ while UV has been successfully employed for SO(2); and a wide range of other compounds in process streams and waste gases (24) i.e. SO2, NO2, C1-, Br-, F-, H-S, acetone, ammonia, benzene, dim-ethylformamide, furfural, toluene, cyclohexanone and phenol. In general the TJ.V. methods are better at coping with the higher concentrations which occur, in flue gases of such compounds as SO-, compared to the I.R. methods. These methods and their limitations have been reviewed elsewhere'25).
Chemical methods of analysis can also be automated, and recent developments have made these much more reliable, so that they can also be used for flue gas and process gas analysis.
Conclusions
Physical methods and modified classical techniques of analytical chemistry play a most significant role in assessing air pollution at the source and in the environment. Much more remains to be done in developing
accurate instrumentation analysing specific contaminants, but the wider application of sophisticated methods will require a marked reduction in the cost of the instruments.
Even with a new generation of instruments, there will have to be a substantial allocation of financial resources by industry and Government Authorities if an adequate monitoring and control network is to be set up. The combination is vital if we are to maintain the quality of our environment.
53 Clean Air / August, 1972
Table 2. Ambient Concentrat ions of Pollutants Parts per Mil l ion
(Cont inued on page 5 7 )

DIRECT FLANGING OF HEAVY GAUGE DUCTING
F. A. Ward has been involved in the air pollution field for seven years, mainly with the Australian agents of air pollution control equipment suppliers. He is now the Managing Director of Kragg Pty. Ltd., Melbourne.
J. B. Ball has had seventeen years experience in metal forming machinery design with Vickers Ruwolt and is now project engineer with Stevenson and Darragh Pty. Ltd., Melbourne.
The authors built a prototype tube flanging maching in 1969. A number of these machines, which directly flange heavy gauge ducting, have now been sold in Australia and some have been exported overseas.
Introduction: For minimum dust deposition and efficient air flows, for dust control and conveying systems, round ductwork is used wherever possible. Because at dust entrain-ment or conveying velocities, air often spirals through a duct (square or round) round sections are always preferred. In the corners of square ducts the spiralling air flow allows turbulent eddies and a corresponding air velocity drop. This velocity drop invariably causes some precipitation of the airborne solids. Heavy gauge square duct is also more difficult to manufacture and involves the use of more steel, and thus is heavier and more expensive.
Industrial exhaust systems, when built with integral axial flow fans preferably use round ductwork for simplicity and efficiency; the round to square transitional piece of duct is not required. When this transition piece has to be used the air system efficiency suffers and furthermore forming this transition is a difficult operation even for an experienced metal worker.
Both external and internal duct conditions must be considered when deciding upon dust material and its thickness. Mild Steel (M.S.) sheet is usually chosen but other alloys, especially stainless steel, non-ferrous metals, plastics — usually polyvynyl-chloride or fibre reinforced plastic — asbestos, concrete or even wood can be used. However, for most ductwork mild steel is the most suitable material because of price, abrasion resistance, structural strength, ease of manufacture, mainpulation and ability to accept coatings or other surface treatment.
The duct wall thickness (gauge; abbr. ga.) must also be decided. Heavy gauge ductwork is considered to be that which is in excess of 16 ga. (1.58 mm). In this, consideration must be given to satisfactory duct life with internal abrasion, and the external conditions. The structural strength for unsupported lengths and erected weight is also a major structural factor. The deposition of solid matter in the duct on shutting the system down, or some abnormality in operation, will add to this and it is
possible for the duct to become almost completely filled with deposited solids.
Heavy gauge ductwork is normally designed with flanged and bolted joints at regular intervals. In deciding on these, consideration should be given to (1) length of factory manufactured duct easily transported to site; (2) length of duct easily handled and installed on site; (3) ease of removal for maintenance or replacement.
Traditionally these flanges are either ring rolled from hot rolled sections in a ring rolling machine, or the rings are cut from flat plate. Frequently rings rolled from angle iron are used because of material waste when plates are cut and the tendency for ring rolled flat iron to buckle; in fact they tend to form partial cones. The required flange bolt holes are drilled to secure the flanges one to the other. The flange is then fitted over the duct end, aligned with the duct end, at right angles to the plane of the duct, and seal welded to the duct. If the flange section is of a comparatively heavy gauge and the duct is of light gauge material, great care must be taken with the weld. Further, if a flat section ring is being used, additional care is needed to avoid distortion on welding.
Because of time and cost factors with these methods of flanging, ducts are made as long as possible, using the minimum number of flanges. This can defeat some of the advantages of using flanged sections to provide duct lengths which are easily transported to the site, and installed, and are readily maintained or replaced. On the other hand, long welded duct sections are heavy and can be very expensive to install; elaborate lifting gear is needed and there are assembly difficulties due to the lack of manoeuvrability.
The Flanging Machine
As an alternative to the costly methods in general use, a new machine has been developed, which, by cold rolling, directly forms the required flange on the end of heavy gauge round ducts. A plain piece of round duct is loaded into the flanging machine, mechanically locked, hyd-
Clean Air / August, 1972 54
F. A. Ward and J. B. Ball

raulically held against a rotating roll which rotates the duct. The flanging is carried out by another roller which hydraulically moves inside the duct end, initially parallel to the longitudinal surface of the duct, and then in an arc outwards from within the duct, taking the section to become the flange with it. The operation can be halted at any angle between 0° and 90°, although for normal ductwork joints, 90° is used.
Because of the wide range of ducts (up to 5 ft. in dia.) which the machine is capable of working, the over-all dimensions of the machine are large. It stands over 9 ft. in height, is 3 ft. 6 in. wide, and 12 ft. 9 in. long. Its layout is shown in Fig. 1. The weight is approximately 1% tons.
The capacity of the machine has been arranged to cover the normal sizes required for use in heavy gauge ductwork systems. These are —
Duct Diameters: 15 ins. to 60 ins. Duct Lengths: 10 ins. to 96 ins. Material thickness: 16 ga. (0.625
ins., 1.58 mm) to 1/4 in. (0.25 ins., 6.35 mm) Plate (M.S.).
Flange heights up to 2% in. This range of sizes is covered by
the one standard machine, which can be easily adjusted to cater for all the variations in sizes. No additional parts, dies or forming rolls are required. It is possible to extend the diameter rolled as well as the length of the duct handled by modifying the machine.
The main drive motor is 5 H.P. and rotates the main drive roller which in turn rotates the duct, via a 62 : 1 right angled reduction gear box. The hydraulic system pump is operated by a 3 H.P. motor which is capable of generating more than the maximum requirement of 1500 p.s.i.
Fig. 2 shows the machine in operation. Once the duct is placed in the suitably adjusted machine, it is locked into position. It is then rotated by the main drive, and the flanging operation is carried out by advancing the flanging roller, operating this with a lever valve. This valve is positioned so that the operator is looking directly in at the flange being formed whilst operating it. Due to elastic limits of the steel used in the duct, the flange cannot be taken from 0° to 90° in one revolution of the duct, but it is formed at about 20° per revolution. Duct rotation is approximately 60 f.p.m. surface speed. After one end of the duct is flanged, it must be removed and reloaded into the machine if the other end is to be flanged.
Of course, different material thickness, flange height, duct diameter and length, all require adjustment in setting up the machine, but when a number of the same sized duct sec-
tions are to be flanged at the same time, this is a very economical operation. There one end of each duct is flanged first; then, the tail stock is adjusted for the new length, so that the other end can be flanged; the first flange having shortened the duct. For most duct sizes, the most efficient method is to flange the duct with the most common features; perhaps the same thickness but different length and diameter.
As mentioned above, any angle up to 90° can be formed. A further advantage is that flange bolt holes can be drilled or punched in the sheet before rolling and flanging. On flanging, the holes are thrown onto the required pitch circle diameter (P.C.D.). Unless the holes are abnormally large in relation to the flange, or very close to the outer edge, they will remain at their drilled or punched diameter, radially, and elongate around the P.C.D. This is considered an advantage, as it allows some degree of 'play' in aligning the holes. Ideally, all ducts of the same size would be drilled or punched together, assuring that they will be identical when completed.
Because of the relatively high cost
of a flanging machine, only Companies using large quantities of duct sections would have sufficient work to require their own unit. Such Companies are, for example, manufacturers of axial flow fans. In these fans the body of the fan is normally a section of flanged duct. For those with more limited requirements, a more economical system is to have ducts flanged by contract. Thus, direct flanged ducts can be supplied at very competitive prices.
Table 1 shows some cost comparisons (based on Sydney prices).
Applications
Axial Flow Fan Cases: In Australia Fan manufacturers generally use duct sections with a flange at each end. Two Australian companies operate their own flanging machine, whilst others use a machine operating on a contract basis. Axial flow fans not connected in ductwork, such as free standing coolers for operation in hot conditions, or fans with the exhaust side connected to ductwork, can be designed more efficiently by using a small cone inlet. These cone inlets can be directly formed on the fan case
55 Clean Air / August, 1972
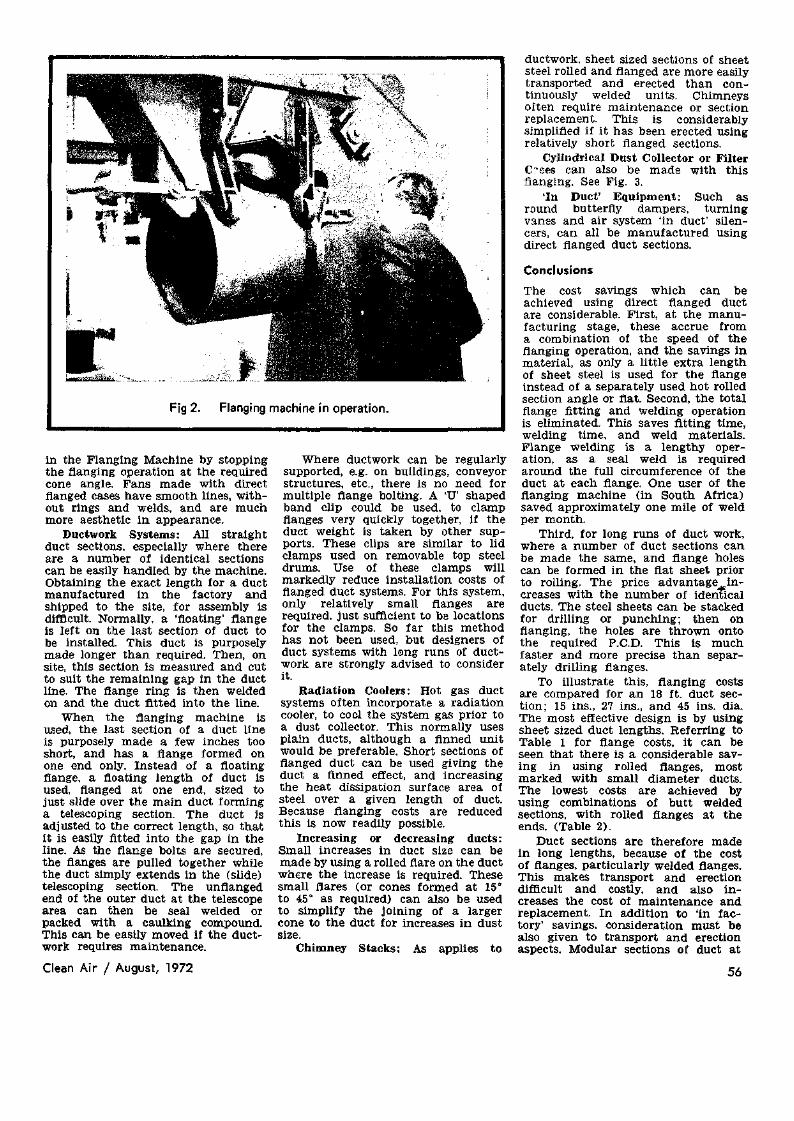


O.E.C.D. AUSTRALIA AND AIR POLLUTION
The O.E.C.D. (Organization for Economic Co-operation and Development) of which Australia is now a full member, has a very active interest in air pollution. Currently working on the problem is the O.E.C.D. Joint Group on Air Pollution from Fuel Combustion in Stationary Sources.
The programme of work by this group is studying the growth of air pollution in the years to 1980 by looking at the following factors.
1. Effects of economic growth on the energy requirements, and fuel combustion, resulting in growth of air pollution, which will be assessed by types of installations, fuels used and resultant pollutants.
2. Alternative methods of controlling pollution, their cost and their effectivenesses. This will require such alternatives as fuel with different sulphur levels, stack gas cleaning processes, better combustion techniques or new methods of combustion, location of plants, and energy policies.
3. The implication of these options will result in proposals so that air pollution can be contained, and so that standards and regulations
set by different governments can be harmonised.
National reports are currently being prepared, using 1968 as a base year and 1980 pollution levels are being forecast using an agreed methodology, assumptions and premises for calculations. A consultants draft is being used as a model for these national reports.
Supplementary information, where available, will also be reported. This, in the case of some O.E.C.D. member countries, may be the estimates of the section beyond 1980, further details of the nature of emissions such as particle size, etc, the levels of emissions above the ground, and the regions in which the emissions occur.
Thirteen countries, the European Common Market and the Stichting CONCAWE have named senior technical personnel to participate in the Joint Group and the secretariat is being provided by the O.E.C.D., headed by Dr. H. Roderick, the head of the Division of International Cooperation in Science.
Responsibility for Environmental Controls in N.S.W.
A Cabinet decision in N.S.W. early this year gave broad powers to the Minister for Environmental Control in N.S.W. (Mr. Beale) the Department and the State Pollution Control Commission.
Although Cabinet decided not to transfer to the Department of the Environment the work of other government departments engaged in anti pollution control administration, the Minister was given the authority to lay down the principles for pollution control and co-ordinate the activities of the other departments.
The State Pollution Control Commission has sweeping powers under its Act and can overide the actions of the other departments. It has been said in some quarters that this will either encourage co-operation or cause inter-departmental friction, and it is only to be hoped that the former will prevail.
1972 CLEAN AIR CONFERENCE PROCEEDINGS Copies can be obtained from the Organizing Secretary, Dr. W. Strauss, Dept. of Industrial Science, University of Melbourne, 35 Royal Pde., Parkville, Vic. 3052!
Price: $A20 or $US24 (Postfree)
SOLID-STATE TIMING DEVICES are designed specifically
for all types of dust
control equipment
• CUSTOM BUILT AT NO EXTRA COST • WIDE RANGE OF TIME DELAYS
• EASY ADJUSTMENTS FOR UNTRAINED OPERATORS • LONG LIFE TIME — USING INTEGRATED CIRCUITS
• VARIOUS TYPES OF HOUSING AVAILABLE
C Thomas Electronics PRINTED CIRCUIT DESIGN, ASSEMBLY & WIRING OF ELECTRONIC CARDS & CARD RACKS
15 GOODACRE AVE., WINSTON HILLS, 2153, N.S.W. TELEPHONE: 639-8790
Clean Air / August, 1972 58


![Gordon Ramsay's ultimate home cooking : [breakfast, lunch, dinner : as seen on Channel Four]](https://img.pdfslide.us/doc/110x75/613cafa3a3339922f86ecd34/gordon-ramsays-ultimate-home-cooking-breakfast-lunch-dinner-as-seen.jpg)