Embed Size (px)
Citation preview
Cerebral Cortex, 2016; 1–13
doi: 10.1093/cercor/bhw287Original Article
O R I G I NA L ART I C L E
The Large-Scale Organization of Object-ResponsiveCortex Is Reflected in Resting-State NetworkArchitectureTalia Konkle1 and Alfonso Caramazza1,2
1Department of Psychology, Harvard University, Cambridge, MA 02138, USA and 2Center for Mind/BrainScience (CIMeC), University of Trento, 38122 Trento, Italy
Address correspondence to Talia Konkle, Department of Psychology, Harvard University, William James Hall #918, 33 Kirkland St, Cambridge, MA 02138,USA. Email: [email protected]
AbstractNeural responses to visually presented objects have a large-scale spatial organization across the cortex, related to thedimensions of animacy and object size. Most proposals about the origins of this organization point to the influence ofdifferential connectivity with other cortical regions as the key organizing force that drives distinctions in object-responsivecortex. To explore this possibility, we used resting-state functional connectivity to examine the relationship betweenstimulus-evoked organization of objects, and distinctions in functional network architecture. Using a data-driven analysis,we found evidence for three distinct whole-brain resting-state networks that route through object-responsive cortex, andthese naturally manifest the tripartite structure of the stimulus-evoked organization. However, object-responsive regionswere also highly correlated with each other at rest. Together, these results point to a nested network architecture, with alocal interconnected network across object-responsive cortex and distinctive subnetworks that specifically route these keyobject distinctions to distinct long-range regions. Broadly, these results point to the viability that long-range connections area driving force of the large-scale organization of object-responsive cortex.
Key words: human fMRI, object organization, occipitotemporal, resting state, ventral stream
IntroductionVisually presented objects evoke distributed systematic pat-terns across occipitotemporal cortex that are similar in bothhumans and nonhuman primates, and are strongly linked toprocessing shape differences (Haxby et al. 2001; Tanaka 2003;Kriegeskorte et al. 2008; for review see Kourtzi and Connor2011; Ungerleider and Bell 2011). Much work has focused oncharacterizing the structure of these neural response patterns,including characterizing their dimensionality (Haxby et al.2011), identifying key dimensions (Kriegeskorte et al. 2008;Op de Beeck et al. 2008; Konkle and Oliva 2012; Konkleand Caramazza 2013), and mapping their spatial topography(Chao et al. 1999; Hasson et al. 2003; Bell et al. 2009; Konkleand Caramazza 2013; Grill-Spector and Weiner et al., 2014;
Weiner et al. 2014). Studies examining the spatial organizationof neural response preferences have found that the topog-raphy is not random, but shows a reproducible and consistentarrangement of clustered selectivities: Within this cortexthere is a mosaic of meso-scale regions with strong responsesfor categories such as faces, bodies, and scenes (Kanwisher2010). These regions are systematically located in a largermacro-scale map of object preferences that show a tripartitedistinction between response preferences for animals, bigobjects, and small objects (Konkle and Caramazza 2013).Important and unanswered questions remain about this top-ography: Why do we see these particular divisions and whydo they have such a consistent spatial organization across thecortical mantle?
© The Author 2016. Published by Oxford University Press. All rights reserved. For Permissions, please e-mail: [email protected]
Cerebral Cortex Advance Access published September 24, 2016 at H
arvard Library on O
ctober 5, 2016http://cercor.oxfordjournals.org/
Dow
nloaded from
Current theories regarding the origins of this systematiclarge-scale topography point to differential connectivity asone of the key organizing forces (Malach et al. 2002; Mahonand Caramazza 2011). One of the earliest proposals suggestedthat spatial arrangement of object regions in occipitotemporalcortex was linked to the retinotopic organization of early vis-ual areas in adjacent occipital cortex (Levy et al. 2001; Hassonet al. 2002; Malach et al. 2002). They found that regionsresponsive to faces were more associated with foveal stimula-tion, while regions responsive to houses were more asso-ciated with peripheral stimulation, and suggested thatdifferential connectivity with early visual cortex mightaccount for the topography and kinds of selectivities observedin adjacent high-level visual cortex. More recently, Mahonand Caramazza (2011) proposed that ventral stream organiza-tion is constrained not only by its relationship with early vis-ual cortex, but perhaps more strongly by relationship to otherlong-range (nonvisual) regions. Specifically, they argued thatfor broad evolutionarily relevant domains such as animalsand tools, innately patterned connections might exist to cre-ate functional routes between different brain regions, forexample, between animate-looking shape information andemotion and social processing regions, and between tool-likeshape information and motor planning and manipulationregions. To what extent are these differential connectivitypredictions borne out in measures of functional networkarchitecture?
A number of different studies have begun to explore thelinks between stimulus-evoked response preferences andfunctional and structural network architecture of theseobject regions (Mahon et al. 2007; Turk-Browne et al. 2010;Zhu et al. 2011; Saygin et al. 2012; Simmons and Martin 2012;Baldassano et al. 2013; Garrido et al. 2013; O’Neil et al. 2014;Stevens et al. 2015; see Kravitz et al. 2013 for review). To date,however, these studies have mostly focused on a particularcategory, for example, either faces, scenes, or tools, targetingmore focal regions within this larger topographic organiza-tion (but see Hutchison et al. 2014). In contrast, here weexplore what functional routes exist between the entirestimulus-evoked organization of objects and the rest of thecortex. Specifically, do any long-range regions show differ-ences in their connectivity structure across this object-responsive cortex, and if so, how do these differentialconnectivities relate to the mirrored tripartite organization ofobject responses? And, conversely, do any long-range regionsshow similarities in their connectivity structure that spanthe major distinctions of the stimulus-evoked objectorganization?
Our approach is to leverage the structure in intrinsic tem-poral correlations between brain regions in a resting state (Foxand Raichle 2007, Biswal et al. 2010; Smith et al. 2013). Such cor-relations between regions are known to reflect a combinationof both direct and indirect pathways. Thus, resting-state struc-tures allow us to explore “functional” network architecture,contrasting with “anatomical” network architecture (Honeyet al. 2009). In the current study, we take this broader func-tional connectivity measure to be an advantage, as both directand indirect connectivity can be driving influences on theorganizational structure of the ventral stream. However, wenote that all differential resting-state structures characterizedbelow should be interpreted carefully, reflecting relative differ-ences in the degree of influence between any set of regions,and should not be taken as evidence for differential white-matter tracts.
Materials and MethodsParticipants
Nineteen human observers with normal or corrected-to-normalvision participated in a 1–2 h fMRI session (age 18–40 years, allright handed). Informed consent was obtained according theprocedures approved by the Institutional Review Board at theUniversity of Trento. The 12 observers who participated inExperiment 1 reflect a subset of the participants from Konkleand Caramazza (2013), for whom a resting-state scan was alsoacquired. The remaining 7 new participants were scanned forthe replication Experiment 2.
MRI Acquisition
Functional magnetic resonance imaging was used to measureblood-oxygen level-dependent responses in all participantsboth during a resting state and while viewing images of objects.Imaging data were acquired on a Bruker BioSpin MedSpec 4 Tscanner using an 8-channel head coil. Functional data were col-lected using an echo-planar 2D imaging sequence (TR: 2000ms,TE: 33ms, Flip angle: 73°, slice thickness = 3mm, gap =0.99mm, with 3 × 3 in plane resolution). Volumes wereacquired in the axial plane parallel to the anterior–posteriorcommissure in 34 slices, with ascending interleaved sliceacquisition.
Resting-State and Stimulus-Driven Protocols
During resting-state scans, observers were instructed to keeptheir eyes closed, think of nothing in particular, and to avoidfalling asleep. Spontaneous resting-state fluctuations weremeasured in one 10-min run (300 volumes) in Experiment 1and in two 5-min runs (150 volumes) in Experiment 2.
During the stimulus scans, responses were measured toobjects that varied in whether they were animate or inanimate(animacy) and whether they were big or small in their typicalsize in the world (real-world size). Observers were shownimages of big animals, small animals, big objects, and smallobjects (e.g., bear, hamster, couch, lightbulb), presented at thesame visual size on the screen (~8° × ~8° visual angle), using astandard blocked design. The stimulus set contained 240unique images (60 per condition) selected to have broad cover-age over the categories, and is available for download on T.K.’swebsite. Each block was 16 s long, in which 16 images wereshown for 800ms each followed by a 200ms blank, presentedin isolation on a white background. A 10 s fixation period inter-vened between each block. Each run had 4 blocks per condition(213 volumes). All 60 images for each condition were presentedonce per run (4 blocks of 15 unique images). Observers wereinstructed to pay attention to each item and to press a buttonwhen an exact image repeated back-to-back, which occurredonce per block. In Experiment 1, there were 6 total runs yielding24 blocks per condition (these data are reported in Konkle andCaramazza 2013); in Experiment 2, there were 4 total runsyielding 16 blocks per condition.
To map early visual organization in Experiment 2, observersviewed bands of flickering checkerboards in blocked design.The conditions included vertical meridian bands (~22° × 2.5°),horizontal meridian bands (~22° × 2.5°), upper and lower hori-zontal bands (~22° × 4.5°, offset ±4.5°), and iso-eccentricitybands covered by a central ring (radius ~1.2° to 2.4°), a periph-eral ring (radius ~5.7° to 9.3°), and an extra wide peripheral ring(inner radius ~9.3°, filling the extent of the screen). Each block
2 | Cerebral Cortex
at Harvard L
ibrary on October 5, 2016
http://cercor.oxfordjournals.org/D
ownloaded from
was 6 s, within which the checkerboard cycled at 8 Hz betweenstates of black-and-white, randomly colored, white-and-black,and random colored. In each 5.7-min run (174 volumes), the 7visual field band conditions and 1 fixation condition wererepeated 7 times with their order randomly permuted withineach repetition. Each run started and ended with a 6 s fixationperiod. Participants’ task was to maintain fixation, and press abutton every time the fixation dot turned red, which happenedonce per block.
Preprocessing
Functional data were analyzed using Brain Voyager QX soft-ware and MATLAB. Resting-state runs were preprocessed withslice scan-time correction, 3D motion correction, spatialsmoothing (6-mm FWHM kernel), and were transformed intoTalairach coordinates. The time course for each voxel was tem-porally filtered to preserve low-frequency fluctuations (0.009–0.008 Hz), and whole-brain and ventricle time courses andmotion correction predictors were subsequently regressed outof the time series of each voxel. For Experiment 2, preproces-sing was separately performed on each run and then the twotime series were concatenated across runs.
Preprocessing of the stimulus runs included slice scan-time correction, 3D motion correction, linear trend removal,temporal high-pass filtering (0.01-Hz cutoff), spatial smooth-ing (6-mm FWHM kernel), and transformation into Talairachcoordinates. To estimate the strength of the response for eachstimulus condition (beta weight), the time course of each vox-el was modeled using a general linear model with square-wave regressors for each condition’s presentation timesconvolved with a gamma-function to approximate the hemo-dynamic response.
Region of interest definitions
In all subjects, we calculated 3-way preference maps for bigobjects, all animals, and small objects within visually activevoxels (all vs. rest, T > 2.0), following Konkle and Caramazza(2013). For each participant, we defined 5 regions of interest(ROIs) to capture the peaks of the animacy × object size organ-ization: 1) parahippocampal cortex (PHC) reflecting big-objectpreferences, 2) fusiform (Fus) cortex reflecting animal prefer-ences; 3) inferior temporal gyrus (ITG), reflecting small-objectpreferences; 4) lateral occipital (LO) cortex reflecting animalpreferences; and 5) cortex near the transverse occipital sulcus(TOS) reflecting big-object preferences. These ROIs were definedseparately for each participant in each hemisphere, using thefollowing procedure. First, the coordinate near the center ofeach zone was manually defined based on both anatomy andfunctional response preferences. Next, within a 12-voxel radiusof these coordinates, we selected the top 50 voxels with thestrongest preference strengths for the corresponding stimuluscondition (defined as the peak response beta weight relative tothe mean of the nonpeak beta weights). These animacy-sizeROIs defined from the stimulus-driven data were used in allsubsequent resting-state analyses.
Foveal and peripheral ROIs were defined by hand for eachparticipant on their inflated cortical surface following the con-trast of central versus peripheral bands, and were constrainedto fall within early visual fields areas V1–V3, which weredefined based on the contrast of horizontal versus vertical mer-idians. No voxels overlapped between any of the ROIs.
Profile-Clustering Analysis
To discover and characterize regions that differentially correl-ate with these functional subdivisions within object-responsivecortex, we developed a profile-clustering analysis. First, weobtained an “Animacy-Size profile” for each voxel in each par-ticipant, defined as the correlation between that voxel’s timecourse and the average time course of each of the 5 animacy-size ROIs. Next, we selected a subset of these voxels with sig-nificant variance in the degree of correlation with each zone.This was assessed for each voxel across Experiment 1 subjectsusing a one-way ANOVA, and was corrected for multiple com-parisons (false discovery rate <0.05). To explore what kind ofprofiles were present in this subset of voxels without presup-posing any specific pattern, we used K-means clustering togroup voxels together based on the similarity of their animacy-size profiles. The K-means algorithm used a correlation dis-tance metric and selected the solution with the least sum-squared error over 10 randomly seeded replicates. The numberof clusters (k) was varied between 2 and 10.
To test the replicability of the clustering results, inExperiment 2 we calculated new animacy-size profiles for theselected voxels used in Experiment 1, and then conducted thesame K-means clustering analysis. To quantify the conver-gence between clustering solutions, we used a signal-detectionmethod. Specifically, for both Experiments 1 and 2, we createda matrix of voxels × voxels with values equal to 1 if the voxelswere assigned to the same cluster and 0 if they were assignedto different clusters. Hit rate was calculated as the percent ofvoxel–voxel pairs that were assigned to the same cluster inExperiment 1 and that were also assigned to the same clusterin Experiment 2. False alarm rate was calculated as the percentof voxel–voxel pairs that were not assigned to the same clusterin E1 but were assigned to the same cluster in E2. Sensitivity(d’) was subsequently calculated as z(Hit)–z(FA). To ensure theconvergence between Experiment 1 and Experiment 2 was notlikely to happen by chance, we conducted a permutation ana-lysis. For each voxel in Experiment 2, we shuffled the animacy-size ROI labels, and computed the convergence of the shuffledsolution with Experiment 1 (holding the Experiment 1 cluster-ing solution constant), over 100 iterations.
ROI Resting-State Analyses
To further analyze the resting-state correlations between thisset of ROIs, we assessed the similarity in the whole-brain rest-ing maps using a paired voxel-wise procedure. For every pair ofvoxels both within an ROI and between any two ROIs, weextracted the rest time courses, and correlated these with allother gray matter voxels, yielding two whole-brain correlationmaps (rMaps). The two seed voxels and the other voxels ineach ROI were excluded from both maps, and then the tworMaps were correlated with each other. These rMap correla-tions were computed for all pairs of voxels within and betweenzones, and the resting-state correlation was averaged acrossvoxel pairs in order to estimate the resting-state relationshipbetween any two ROIs, for each participant.
Next, we empirically computed the distribution of possiblepair-wise rMap correlations, considering all pairs of voxelswithin a gray-matter mask, for each participant. To determineif the animacy-size rMaps were more similar than different, apaired t-test was conducted between the 50th percentile rMapcorrelation and the average observed rMap correlation amongthe animacy-size ROIs.
Resting-State Structure of Object Organization Konkle and Caramazza | 3
at Harvard L
ibrary on October 5, 2016
http://cercor.oxfordjournals.org/D
ownloaded from
For statistical tests, correlation coefficients (r) were trans-formed using Fisher’s z-transformation to represent normallydistributed variable z. Paired t-tests were conducted to test foroverall differences in the rMaps between regions with similarversus different response preferences, by comparing the aver-age strength of TOS-PHC and LO-Fus within-preference linkswith the average strength of TOS-Fus, PHC-LO, TOS-LO, PHC-Fus across-preference links. Targeted t-tests directly comparingpairs of ROI–ROI resting stating correlation strengths arereported in Supplementary Table S1.
To compare the similarity of the resting-state networks foreach of the category-specific regions, we used category-selectiveROIs for faces (fusiform face area/occipital face area, FFA/OFA),bodies (extrastriate body area/fusiform body area, EBA/FBA), andscenes (parahippocampal place area/occipital place area, PPA/OPA), defined in each participant of both experiments. The simi-larities between all pairs of rMaps were computed and analyzedfollowing the same procedure as used for the animacy-size ROIs.To examine whether regions with the same animacy preference(e.g., seeded by face and body regions) had more similar resting-state maps than regions with different animacy preferences(e.g., seeded by face and scene regions), we conducted a t-testover the average strength of the within-animacy links with theaverage strength of the between-animacy links (within-animacylinks: FFA-FBA, EBA-OFA, FFA-OFA, FBA-EBA, FBA-OFA, PPA-OPA; between-animacy links: PPA-FFA, PPA-FBA, PPA-EBA, PPA-OFA, OPA-FFA, OPA-FBA, OPA-OFA, OPA-EBA).
ResultsDistinct Functional Routes Through the Animacy-SizeOrganization
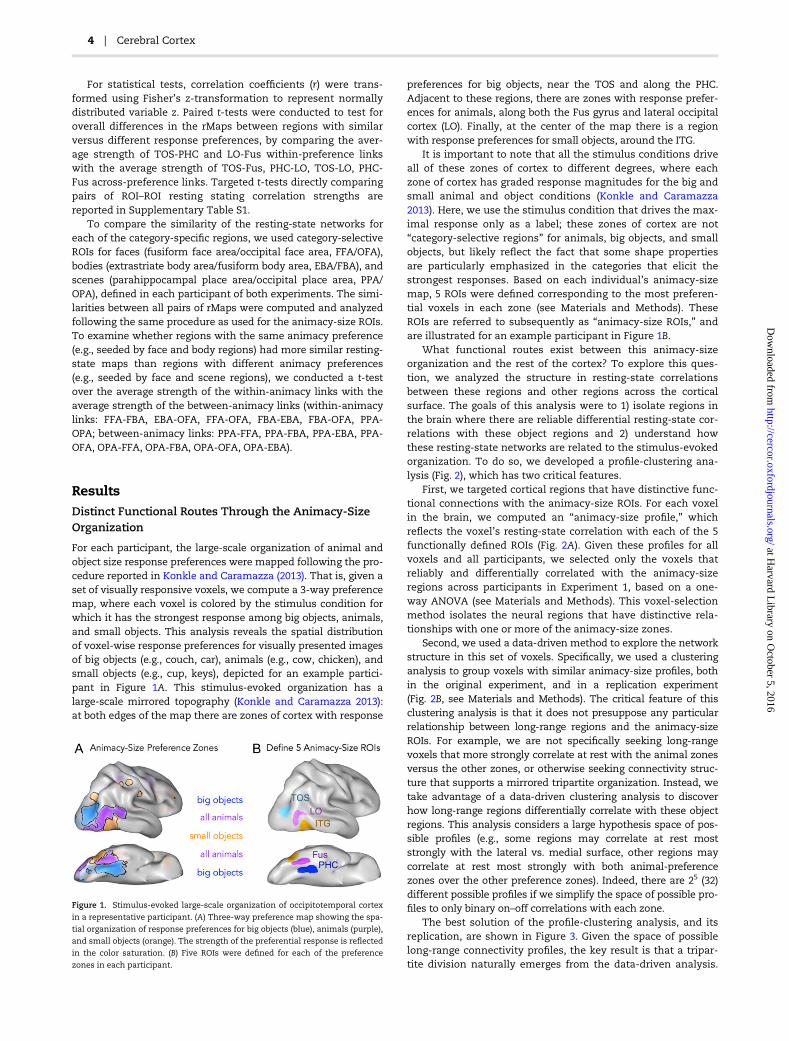
For each participant, the large-scale organization of animal andobject size response preferences were mapped following the pro-cedure reported in Konkle and Caramazza (2013). That is, given aset of visually responsive voxels, we compute a 3-way preferencemap, where each voxel is colored by the stimulus condition forwhich it has the strongest response among big objects, animals,and small objects. This analysis reveals the spatial distributionof voxel-wise response preferences for visually presented imagesof big objects (e.g., couch, car), animals (e.g., cow, chicken), andsmall objects (e.g., cup, keys), depicted for an example partici-pant in Figure 1A. This stimulus-evoked organization has alarge-scale mirrored topography (Konkle and Caramazza 2013):at both edges of the map there are zones of cortex with response
preferences for big objects, near the TOS and along the PHC.Adjacent to these regions, there are zones with response prefer-ences for animals, along both the Fus gyrus and lateral occipitalcortex (LO). Finally, at the center of the map there is a regionwith response preferences for small objects, around the ITG.
It is important to note that all the stimulus conditions driveall of these zones of cortex to different degrees, where eachzone of cortex has graded response magnitudes for the big andsmall animal and object conditions (Konkle and Caramazza2013). Here, we use the stimulus condition that drives the max-imal response only as a label; these zones of cortex are not“category-selective regions” for animals, big objects, and smallobjects, but likely reflect the fact that some shape propertiesare particularly emphasized in the categories that elicit thestrongest responses. Based on each individual’s animacy-sizemap, 5 ROIs were defined corresponding to the most preferen-tial voxels in each zone (see Materials and Methods). TheseROIs are referred to subsequently as “animacy-size ROIs,” andare illustrated for an example participant in Figure 1B.
What functional routes exist between this animacy-sizeorganization and the rest of the cortex? To explore this ques-tion, we analyzed the structure in resting-state correlationsbetween these regions and other regions across the corticalsurface. The goals of this analysis were to 1) isolate regions inthe brain where there are reliable differential resting-state cor-relations with these object regions and 2) understand howthese resting-state networks are related to the stimulus-evokedorganization. To do so, we developed a profile-clustering ana-lysis (Fig. 2), which has two critical features.
First, we targeted cortical regions that have distinctive func-tional connections with the animacy-size ROIs. For each voxelin the brain, we computed an “animacy-size profile,” whichreflects the voxel’s resting-state correlation with each of the 5functionally defined ROIs (Fig. 2A). Given these profiles for allvoxels and all participants, we selected only the voxels thatreliably and differentially correlated with the animacy-sizeregions across participants in Experiment 1, based on a one-way ANOVA (see Materials and Methods). This voxel-selectionmethod isolates the neural regions that have distinctive rela-tionships with one or more of the animacy-size zones.
Second, we used a data-driven method to explore the networkstructure in this set of voxels. Specifically, we used a clusteringanalysis to group voxels with similar animacy-size profiles, bothin the original experiment, and in a replication experiment(Fig. 2B, see Materials and Methods). The critical feature of thisclustering analysis is that it does not presuppose any particularrelationship between long-range regions and the animacy-sizeROIs. For example, we are not specifically seeking long-rangevoxels that more strongly correlate at rest with the animal zonesversus the other zones, or otherwise seeking connectivity struc-ture that supports a mirrored tripartite organization. Instead, wetake advantage of a data-driven clustering analysis to discoverhow long-range regions differentially correlate with these objectregions. This analysis considers a large hypothesis space of pos-sible profiles (e.g., some regions may correlate at rest moststrongly with the lateral vs. medial surface, other regions maycorrelate at rest most strongly with both animal-preferencezones over the other preference zones). Indeed, there are 25 (32)different possible profiles if we simplify the space of possible pro-files to only binary on–off correlations with each zone.
The best solution of the profile-clustering analysis, and itsreplication, are shown in Figure 3. Given the space of possiblelong-range connectivity profiles, the key result is that a tripar-tite division naturally emerges from the data-driven analysis.
Figure 1. Stimulus-evoked large-scale organization of occipitotemporal cortex
in a representative participant. (A) Three-way preference map showing the spa-
tial organization of response preferences for big objects (blue), animals (purple),
and small objects (orange). The strength of the preferential response is reflected
in the color saturation. (B) Five ROIs were defined for each of the preference
zones in each participant.
4 | Cerebral Cortex
at Harvard L
ibrary on October 5, 2016
http://cercor.oxfordjournals.org/D
ownloaded from
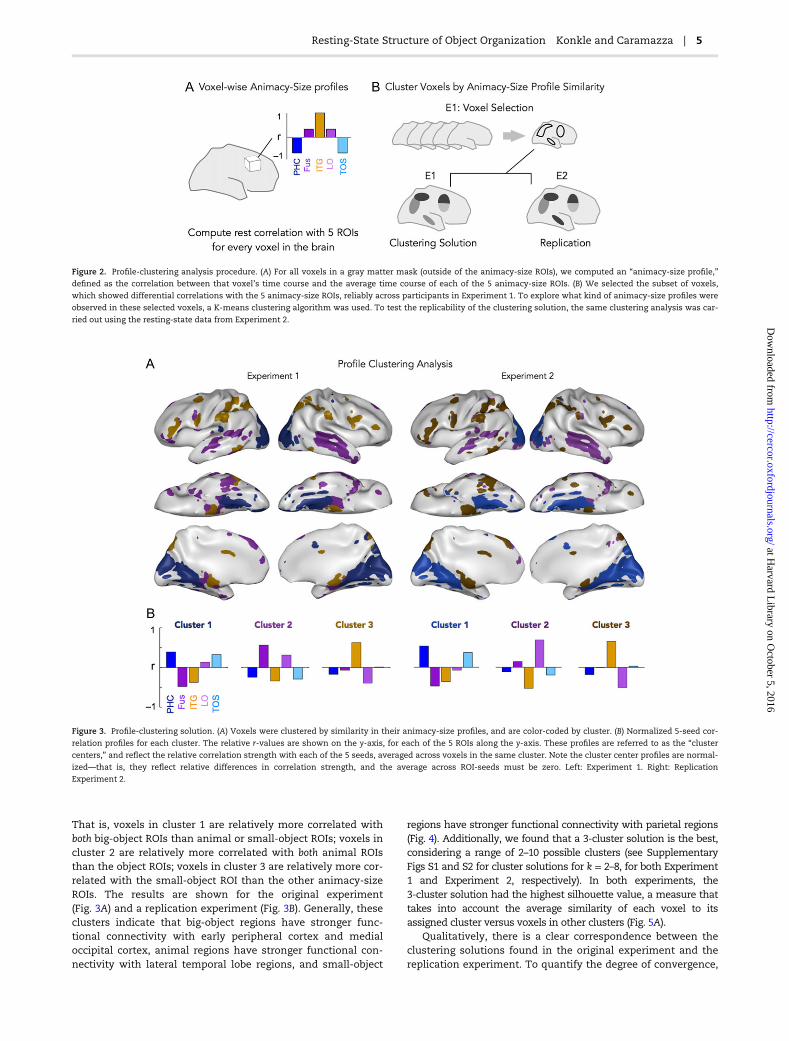
That is, voxels in cluster 1 are relatively more correlated withboth big-object ROIs than animal or small-object ROIs; voxels incluster 2 are relatively more correlated with both animal ROIsthan the object ROIs; voxels in cluster 3 are relatively more cor-related with the small-object ROI than the other animacy-sizeROIs. The results are shown for the original experiment(Fig. 3A) and a replication experiment (Fig. 3B). Generally, theseclusters indicate that big-object regions have stronger func-tional connectivity with early peripheral cortex and medialoccipital cortex, animal regions have stronger functional con-nectivity with lateral temporal lobe regions, and small-object
regions have stronger functional connectivity with parietal regions(Fig. 4). Additionally, we found that a 3-cluster solution is the best,considering a range of 2–10 possible clusters (see SupplementaryFigs S1 and S2 for cluster solutions for k = 2–8, for both Experiment1 and Experiment 2, respectively). In both experiments, the3-cluster solution had the highest silhouette value, a measure thattakes into account the average similarity of each voxel to itsassigned cluster versus voxels in other clusters (Fig. 5A).
Qualitatively, there is a clear correspondence between theclustering solutions found in the original experiment and thereplication experiment. To quantify the degree of convergence,
Figure 2. Profile-clustering analysis procedure. (A) For all voxels in a gray matter mask (outside of the animacy-size ROIs), we computed an “animacy-size profile,”
defined as the correlation between that voxel’s time course and the average time course of each of the 5 animacy-size ROIs. (B) We selected the subset of voxels,
which showed differential correlations with the 5 animacy-size ROIs, reliably across participants in Experiment 1. To explore what kind of animacy-size profiles were
observed in these selected voxels, a K-means clustering algorithm was used. To test the replicability of the clustering solution, the same clustering analysis was car-
ried out using the resting-state data from Experiment 2.
Figure 3. Profile-clustering solution. (A) Voxels were clustered by similarity in their animacy-size profiles, and are color-coded by cluster. (B) Normalized 5-seed cor-
relation profiles for each cluster. The relative r-values are shown on the y-axis, for each of the 5 ROIs along the y-axis. These profiles are referred to as the “cluster
centers,” and reflect the relative correlation strength with each of the 5 seeds, averaged across voxels in the same cluster. Note the cluster center profiles are normal-
ized—that is, they reflect relative differences in correlation strength, and the average across ROI-seeds must be zero. Left: Experiment 1. Right: Replication
Experiment 2.
Resting-State Structure of Object Organization Konkle and Caramazza | 5
at Harvard L
ibrary on October 5, 2016
http://cercor.oxfordjournals.org/D
ownloaded from
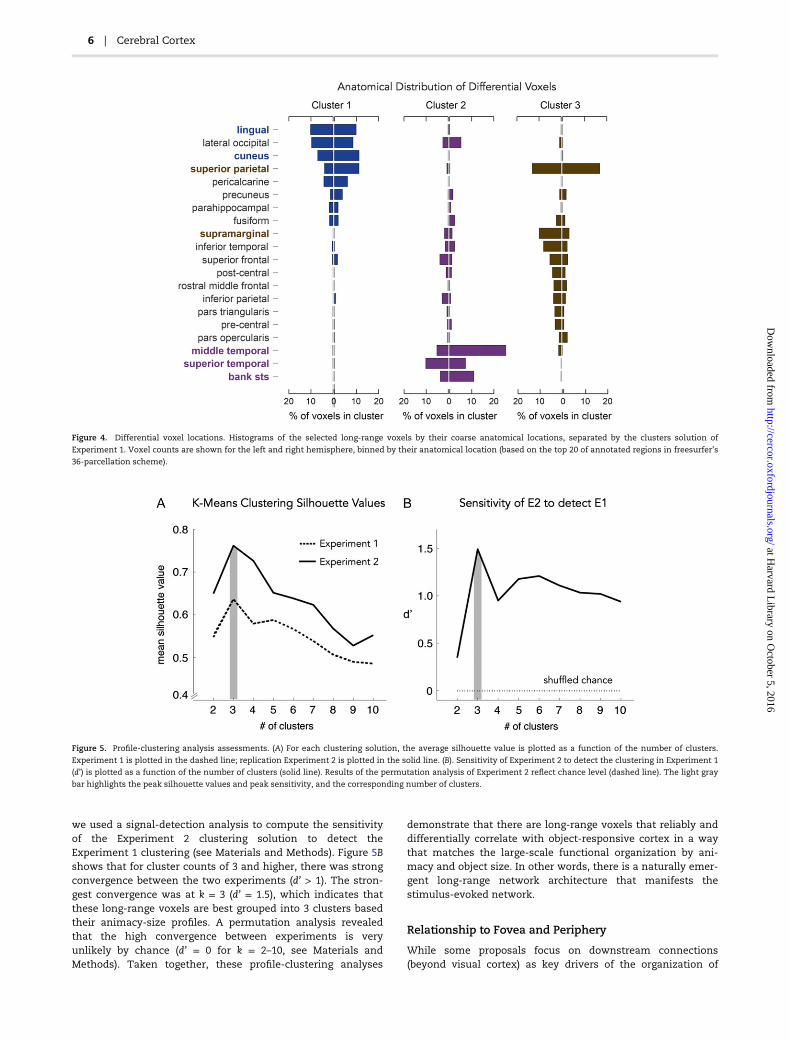
we used a signal-detection analysis to compute the sensitivityof the Experiment 2 clustering solution to detect theExperiment 1 clustering (see Materials and Methods). Figure 5Bshows that for cluster counts of 3 and higher, there was strongconvergence between the two experiments (d’ > 1). The stron-gest convergence was at k = 3 (d’ = 1.5), which indicates thatthese long-range voxels are best grouped into 3 clusters basedtheir animacy-size profiles. A permutation analysis revealedthat the high convergence between experiments is veryunlikely by chance (d’ = 0 for k = 2–10, see Materials andMethods). Taken together, these profile-clustering analyses
demonstrate that there are long-range voxels that reliably anddifferentially correlate with object-responsive cortex in a waythat matches the large-scale functional organization by ani-macy and object size. In other words, there is a naturally emer-gent long-range network architecture that manifests thestimulus-evoked network.
Relationship to Fovea and Periphery
While some proposals focus on downstream connections(beyond visual cortex) as key drivers of the organization of
Figure 4. Differential voxel locations. Histograms of the selected long-range voxels by their coarse anatomical locations, separated by the clusters solution of
Experiment 1. Voxel counts are shown for the left and right hemisphere, binned by their anatomical location (based on the top 20 of annotated regions in freesurfer’s
36-parcellation scheme).
Figure 5. Profile-clustering analysis assessments. (A) For each clustering solution, the average silhouette value is plotted as a function of the number of clusters.
Experiment 1 is plotted in the dashed line; replication Experiment 2 is plotted in the solid line. (B). Sensitivity of Experiment 2 to detect the clustering in Experiment 1
(d’) is plotted as a function of the number of clusters (solid line). Results of the permutation analysis of Experiment 2 reflect chance level (dashed line). The light gray
bar highlights the peak silhouette values and peak sensitivity, and the corresponding number of clusters.
6 | Cerebral Cortex
at Harvard L
ibrary on October 5, 2016
http://cercor.oxfordjournals.org/D
ownloaded from
object cortex (Mahon and Caramazza 2011), other proposalshighlight the relationship with early visual retinotopic organ-ization as a key driving factor (Hasson et al., 2002). Indeed, inthe profile-clustering analysis, some occipital regions wereincluded in the voxel selection, consistent with the idea thatthese early visual regions may differentially correlate withobject-responsive cortex. To test for this relationship directly,in the replication experiment we included visual field mappingprotocol in order to define subject-specific ROIs for foveal andperipheral retinotopic cortex, and for upper and lower visualfield cortex, spanning visual areas V1–V3. Then, we measuredthe resting-state correlations between the animacy-size regionswith these large-scale divisions of retinotopic cortex.
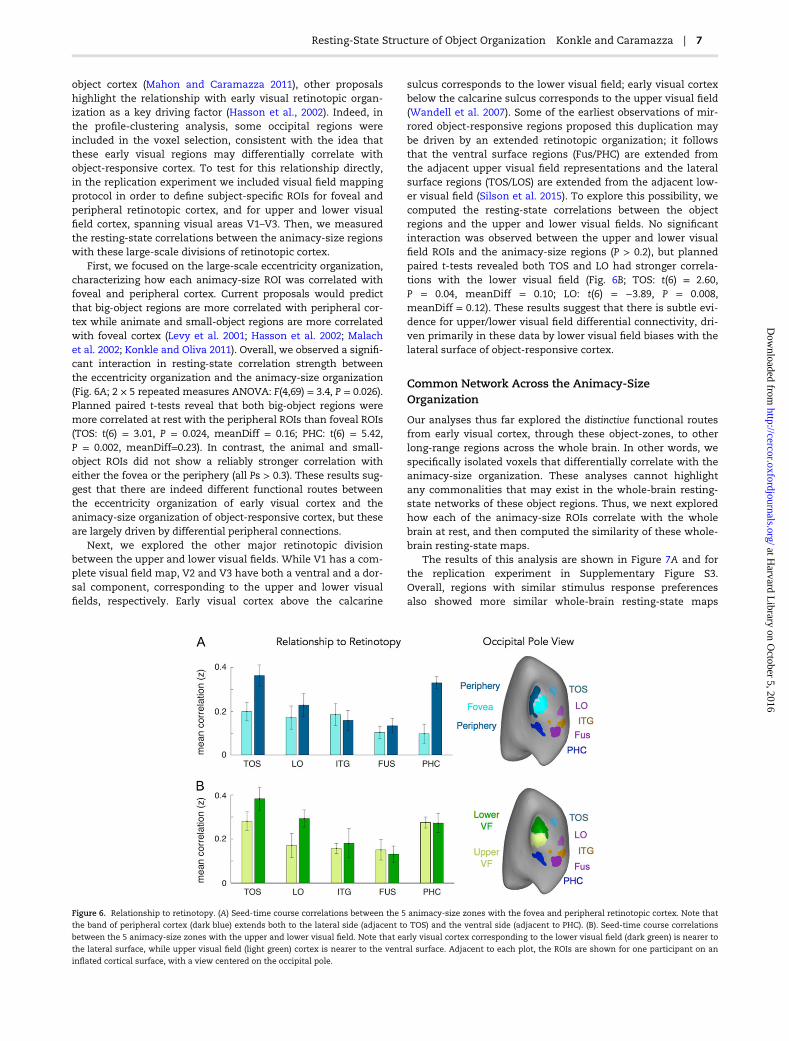
First, we focused on the large-scale eccentricity organization,characterizing how each animacy-size ROI was correlated withfoveal and peripheral cortex. Current proposals would predictthat big-object regions are more correlated with peripheral cor-tex while animate and small-object regions are more correlatedwith foveal cortex (Levy et al. 2001; Hasson et al. 2002; Malachet al. 2002; Konkle and Oliva 2011). Overall, we observed a signifi-cant interaction in resting-state correlation strength betweenthe eccentricity organization and the animacy-size organization(Fig. 6A; 2 × 5 repeated measures ANOVA: F(4,69) = 3.4, P = 0.026).Planned paired t-tests reveal that both big-object regions weremore correlated at rest with the peripheral ROIs than foveal ROIs(TOS: t(6) = 3.01, P = 0.024, meanDiff = 0.16; PHC: t(6) = 5.42,P = 0.002, meanDiff=0.23). In contrast, the animal and small-object ROIs did not show a reliably stronger correlation witheither the fovea or the periphery (all Ps > 0.3). These results sug-gest that there are indeed different functional routes betweenthe eccentricity organization of early visual cortex and theanimacy-size organization of object-responsive cortex, but theseare largely driven by differential peripheral connections.
Next, we explored the other major retinotopic divisionbetween the upper and lower visual fields. While V1 has a com-plete visual field map, V2 and V3 have both a ventral and a dor-sal component, corresponding to the upper and lower visualfields, respectively. Early visual cortex above the calcarine
sulcus corresponds to the lower visual field; early visual cortexbelow the calcarine sulcus corresponds to the upper visual field(Wandell et al. 2007). Some of the earliest observations of mir-rored object-responsive regions proposed this duplication maybe driven by an extended retinotopic organization; it followsthat the ventral surface regions (Fus/PHC) are extended fromthe adjacent upper visual field representations and the lateralsurface regions (TOS/LOS) are extended from the adjacent low-er visual field (Silson et al. 2015). To explore this possibility, wecomputed the resting-state correlations between the objectregions and the upper and lower visual fields. No significantinteraction was observed between the upper and lower visualfield ROIs and the animacy-size regions (P > 0.2), but plannedpaired t-tests revealed both TOS and LO had stronger correla-tions with the lower visual field (Fig. 6B; TOS: t(6) = 2.60,P = 0.04, meanDiff = 0.10; LO: t(6) = −3.89, P = 0.008,meanDiff = 0.12). These results suggest that there is subtle evi-dence for upper/lower visual field differential connectivity, dri-ven primarily in these data by lower visual field biases with thelateral surface of object-responsive cortex.
Common Network Across the Animacy-SizeOrganization
Our analyses thus far explored the distinctive functional routesfrom early visual cortex, through these object-zones, to otherlong-range regions across the whole brain. In other words, wespecifically isolated voxels that differentially correlate with theanimacy-size organization. These analyses cannot highlightany commonalities that may exist in the whole-brain resting-state networks of these object regions. Thus, we next exploredhow each of the animacy-size ROIs correlate with the wholebrain at rest, and then computed the similarity of these whole-brain resting-state maps.
The results of this analysis are shown in Figure 7A and forthe replication experiment in Supplementary Figure S3.Overall, regions with similar stimulus response preferencesalso showed more similar whole-brain resting-state maps
Figure 6. Relationship to retinotopy. (A) Seed-time course correlations between the 5 animacy-size zones with the fovea and peripheral retinotopic cortex. Note that
the band of peripheral cortex (dark blue) extends both to the lateral side (adjacent to TOS) and the ventral side (adjacent to PHC). (B). Seed-time course correlations
between the 5 animacy-size zones with the upper and lower visual field. Note that early visual cortex corresponding to the lower visual field (dark green) is nearer to
the lateral surface, while upper visual field (light green) cortex is nearer to the ventral surface. Adjacent to each plot, the ROIs are shown for one participant on an
inflated cortical surface, with a view centered on the occipital pole.
Resting-State Structure of Object Organization Konkle and Caramazza | 7
at Harvard L
ibrary on October 5, 2016
http://cercor.oxfordjournals.org/D
ownloaded from
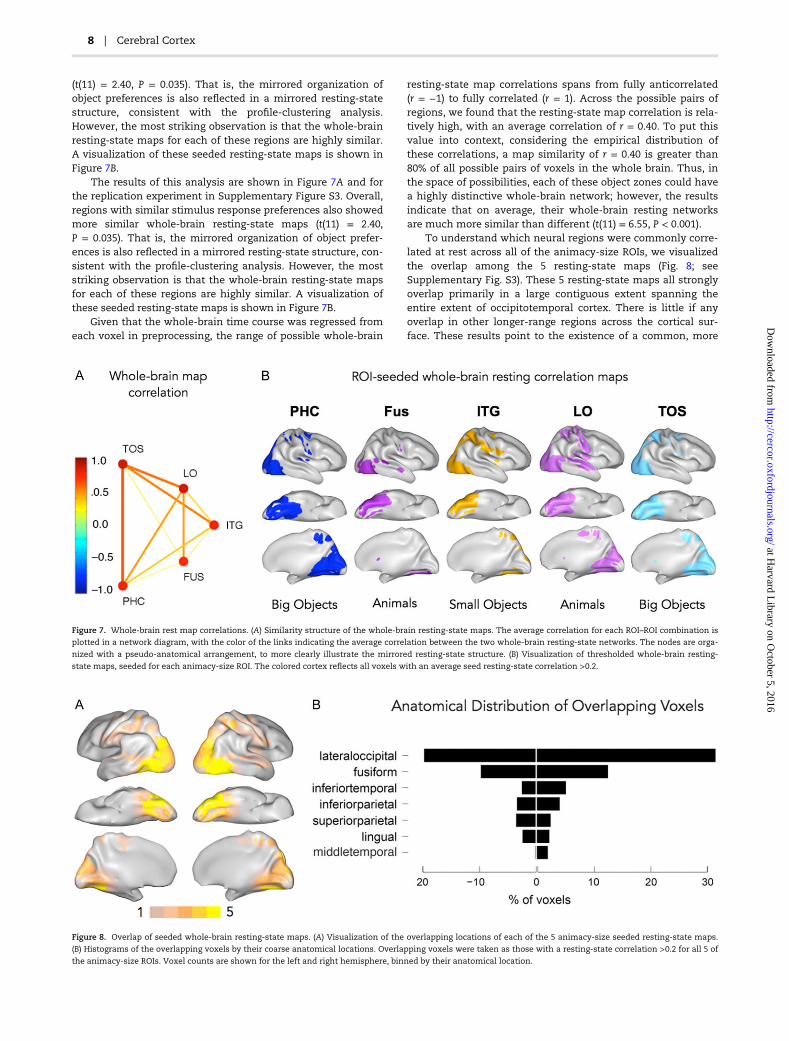
(t(11) = 2.40, P = 0.035). That is, the mirrored organization ofobject preferences is also reflected in a mirrored resting-statestructure, consistent with the profile-clustering analysis.However, the most striking observation is that the whole-brainresting-state maps for each of these regions are highly similar.A visualization of these seeded resting-state maps is shown inFigure 7B.
The results of this analysis are shown in Figure 7A and forthe replication experiment in Supplementary Figure S3. Overall,regions with similar stimulus response preferences also showedmore similar whole-brain resting-state maps (t(11) = 2.40,P = 0.035). That is, the mirrored organization of object prefer-ences is also reflected in a mirrored resting-state structure, con-sistent with the profile-clustering analysis. However, the moststriking observation is that the whole-brain resting-state mapsfor each of these regions are highly similar. A visualization ofthese seeded resting-state maps is shown in Figure 7B.
Given that the whole-brain time course was regressed fromeach voxel in preprocessing, the range of possible whole-brain
resting-state map correlations spans from fully anticorrelated(r = −1) to fully correlated (r = 1). Across the possible pairs ofregions, we found that the resting-state map correlation is rela-tively high, with an average correlation of r = 0.40. To put thisvalue into context, considering the empirical distribution ofthese correlations, a map similarity of r = 0.40 is greater than80% of all possible pairs of voxels in the whole brain. Thus, inthe space of possibilities, each of these object zones could havea highly distinctive whole-brain network; however, the resultsindicate that on average, their whole-brain resting networksare much more similar than different (t(11) = 6.55, P < 0.001).
To understand which neural regions were commonly corre-lated at rest across all of the animacy-size ROIs, we visualizedthe overlap among the 5 resting-state maps (Fig. 8; seeSupplementary Fig. S3). These 5 resting-state maps all stronglyoverlap primarily in a large contiguous extent spanning theentire extent of occipitotemporal cortex. There is little if anyoverlap in other longer-range regions across the cortical sur-face. These results point to the existence of a common, more
Figure 7. Whole-brain rest map correlations. (A) Similarity structure of the whole-brain resting-state maps. The average correlation for each ROI–ROI combination is
plotted in a network diagram, with the color of the links indicating the average correlation between the two whole-brain resting-state networks. The nodes are orga-
nized with a pseudo-anatomical arrangement, to more clearly illustrate the mirrored resting-state structure. (B) Visualization of thresholded whole-brain resting-
state maps, seeded for each animacy-size ROI. The colored cortex reflects all voxels with an average seed resting-state correlation >0.2.
Figure 8. Overlap of seeded whole-brain resting-state maps. (A) Visualization of the overlapping locations of each of the 5 animacy-size seeded resting-state maps.
(B) Histograms of the overlapping voxels by their coarse anatomical locations. Overlapping voxels were taken as those with a resting-state correlation >0.2 for all 5 of
the animacy-size ROIs. Voxel counts are shown for the left and right hemisphere, binned by their anatomical location.
8 | Cerebral Cortex
at Harvard L
ibrary on October 5, 2016
http://cercor.oxfordjournals.org/D
ownloaded from
localized, interconnected network across the extent of object-responsive cortex. This result is interesting in the context ofdifferent connectivity accounts of this organization, as it high-lights that internal structure within the occipitotemporal cortexitself might also contribute to the large-scale clustering andsegregation of response preferences across this cortex (Polkand Farah 1995; Op de Beeck et al. 2008; Behrmann and Plaut2013).
Comparing Category-Selective ROI Networks
One open question from these results is whether the three sub-networks we found routing through occipitotemporal cortexare relatively specific to our particular stimulus categories (ani-mals, big objects, small objects), or whether they are more gen-eric networks that reflect general large-scale routes shared byregions with similar spatial layouts in cortex. To gain someinsight into this issue, we explored the resting-state mapsseeded by meso-scale regions selective for faces, bodies, andscenes. Specifically, we can take advantage of the fact that bothface and body regions fall within the animal-preferring zones(Konkle and Caramazza 2013). Do face and body ROI-seeds yieldhighly distinctive whole-brain networks, even though bothROIs have an animate preference? To the extent that the faceand body networks are highly differentiable, it would suggestthat there are likely (many) more subnetworks through OTCthan we have characterized here. However, to the extent thatthese networks are highly similar, it would suggest that theymay follow a more domain-general, animate-preferring net-work shared by regions with similar spatial layouts in cortex(cf. Weiner et al. 2014; Grill-Spector and Weiner 2014).
To approach this question, we quantified whether face andbody resting-state networks were more similar to each otherthan to scene resting-state networks (see Materials andMethods). On average, the pairs of regions with similar ani-macy preferences (e.g., including FFA and EBA) had more simi-lar resting-state networks than pairs of regions with differentanimacy preferences (e.g., FFA and PPA, EBA and OPA;t(18) = 5.18, P < 0.001). In addition, pairs of regions both of whichpreferred faces (FFA/OFA) or bodies (EBA/FBA) had whole-brainresting-state networks that were as similar as pairs of regionsthat spanned face/body preferences (FFA/FBA, FFA/EBA, OFA/FBA,OFA/EBA; t(17) = −0.73, P = 0.473). However, we also used asupport-vector machine classification analysis to explorewhether it was possible with a more sensitive method to tellapart face-seeded networks from the body-seeded networks,and found that most pairs spanning face and body-seeded rest-ing-state maps could be classified above chance, with theexception of the FFA and FBA (see Supplementary Materials).Taken together, these results point to relatively domain-general, large-scale network distinctions shared by regionswith similar layouts and response preferences, where face- andbody-network differences might be thought of as refinementswithin a common animate-preferring network.
DiscussionHere, we traced the distinctive functional routes between earlyvisual cortex, object zones, and the rest of the brain. Using adata-driven analysis, we show evidence for three distinctivewhole-brain networks, which route through object-responsivecortex, consistent with the major tripartite division revealed bythe stimulus-evoked responses. Specifically, regions with aresponse preference for animals were relatively more
correlated with regions in the temporal lobe, regions with aresponse preference for small objects were relatively more cor-related with parietal cortex along the intraparietal sulcus, andregions with a response preference for big objects were rela-tively more correlated with medial temporal and early periph-eral visual cortex. Furthermore, we also observed that theseobject-responsive regions are part of a common network thatspans the entire occipitotemporal cortex. Considering both thesimilarities and the differences of resting-state structure, theresults point to a nested network architecture, characterized bya common local interconnected network across object-responsive cortex, with three distinct subnetworks of longer-range connections routing through the animal, small-object,and big-object responsive parts of this cortex. Broadly, theseresults provide empirical support for the proposals that arguedifferential network connectivity may drive the consistentlarge-scale organization of object responses across this cortex(Malach et al. 2002; Mahon and Caramazza 2011).
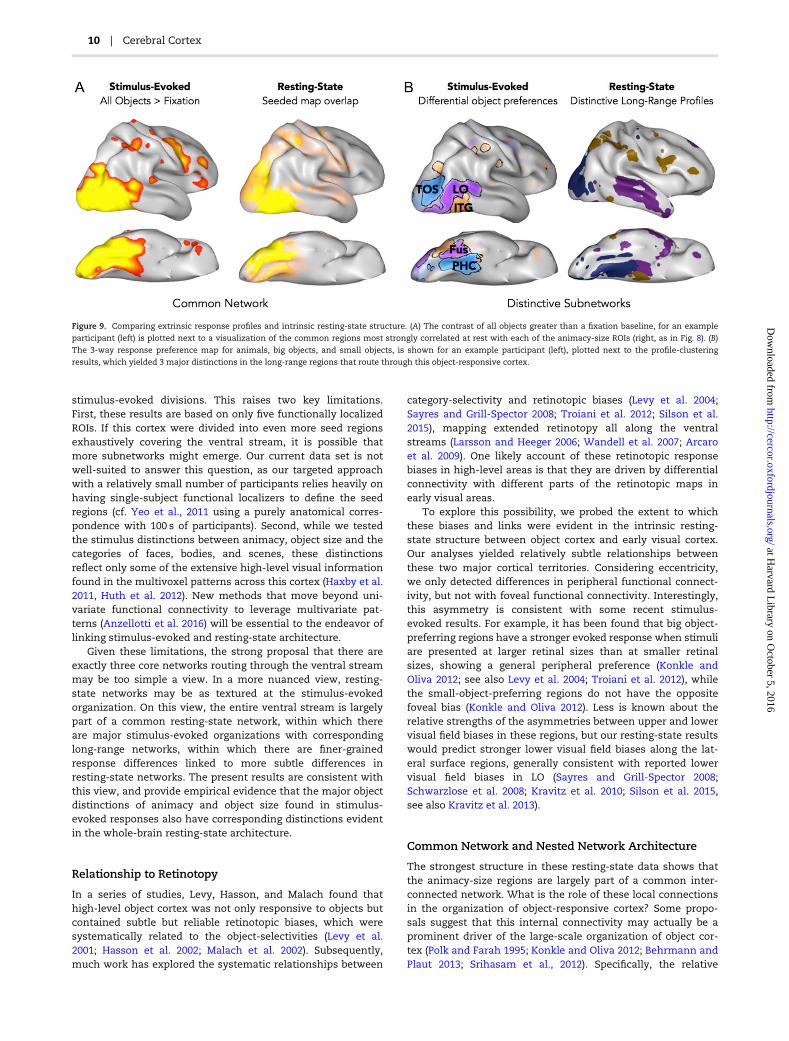
How should one interpret the finding that these regions aresimultaneously part of a common network, but also part of dis-tinctive subnetworks? One observation to consider is that thisnested network architecture identified via resting-state mea-sures bears a strong resemblance to the structure of thestimulus-evoked organization (Fig. 9). That is, all kinds of thesevisual stimuli (animals and objects alike) drive the entireoccipitotemporal cortex relative to fixation, akin to the com-mon network at rest (Fig. 9A). And, particular kinds of objects(e.g., big objects, animals, small objects) drive some parts ofthis cortex relatively more than other parts, and indeed thosesame stimulus differences are linked to the 3 distinctive sub-networks (Fig. 9B). Thus, there is an intriguing match betweenthe hierarchical organization of “extrinsic” activation patternsand the similarity structure of the “intrinsic” network architec-ture. This match between evoked and intrinsic structures alsodovetails with the broader resting-state literature, where themajor task-evoked networks are quite similar to major resting-state networks (Cole et al. 2014; Laumann et al. 2015), withmore subtle task-differences evident within targeted subnet-work components (Hasson et al. 2009, Buckner et al. 2013,Mennes et al. 2013, Krienen et al. 2014).
Relationship to Long-Range Regions
Mahon and Caramazza (2011) proposed that certain evolution-arily relevant domains will manifest in a large-scale spatialorganization across ventral stream, linked to distinctive whole-brain network architecture. However, their account did notarticulate how many domains there are likely to be. Here, wefind evidence for 3 distinctive subnetworks that route throughour animacy-size organization, following the tripartite divisionin the stimulus-evoked responses. Our data-driven analysiscould have yielded a number of distinct long-range regions thatcorrelated with different combinations of the 5 seededanimacy-size ROIs (e.g., a long-range region that correlatedhighly with TOS and LO and not the others); however, thismore intricate structure did not fall out of the data-driven ana-lysis. In addition, face and body-seeded resting-state mapswere much more similar to each other than to scene resting-state maps, indicating that these functional regions are likelypart of the same animacy subnetwork. Taken together, a stronginterpretation of these data is that there are only three corenetworks that route through occipitotemporal cortex.
However, it is important to note that we probed for distinct-ive networks using small seeds regions spanning only a few
Resting-State Structure of Object Organization Konkle and Caramazza | 9
at Harvard L
ibrary on October 5, 2016
http://cercor.oxfordjournals.org/D
ownloaded from
stimulus-evoked divisions. This raises two key limitations.First, these results are based on only five functionally localizedROIs. If this cortex were divided into even more seed regionsexhaustively covering the ventral stream, it is possible thatmore subnetworks might emerge. Our current data set is notwell-suited to answer this question, as our targeted approachwith a relatively small number of participants relies heavily onhaving single-subject functional localizers to define the seedregions (cf. Yeo et al., 2011 using a purely anatomical corres-pondence with 100 s of participants). Second, while we testedthe stimulus distinctions between animacy, object size and thecategories of faces, bodies, and scenes, these distinctionsreflect only some of the extensive high-level visual informationfound in the multivoxel patterns across this cortex (Haxby et al.2011, Huth et al. 2012). New methods that move beyond uni-variate functional connectivity to leverage multivariate pat-terns (Anzellotti et al. 2016) will be essential to the endeavor oflinking stimulus-evoked and resting-state architecture.
Given these limitations, the strong proposal that there areexactly three core networks routing through the ventral streammay be too simple a view. In a more nuanced view, resting-state networks may be as textured at the stimulus-evokedorganization. On this view, the entire ventral stream is largelypart of a common resting-state network, within which thereare major stimulus-evoked organizations with correspondinglong-range networks, within which there are finer-grainedresponse differences linked to more subtle differences inresting-state networks. The present results are consistent withthis view, and provide empirical evidence that the major objectdistinctions of animacy and object size found in stimulus-evoked responses also have corresponding distinctions evidentin the whole-brain resting-state architecture.
Relationship to Retinotopy
In a series of studies, Levy, Hasson, and Malach found thathigh-level object cortex was not only responsive to objects butcontained subtle but reliable retinotopic biases, which weresystematically related to the object-selectivities (Levy et al.2001; Hasson et al. 2002; Malach et al. 2002). Subsequently,much work has explored the systematic relationships between
category-selectivity and retinotopic biases (Levy et al. 2004;Sayres and Grill-Spector 2008; Troiani et al. 2012; Silson et al.2015), mapping extended retinotopy all along the ventralstreams (Larsson and Heeger 2006; Wandell et al. 2007; Arcaroet al. 2009). One likely account of these retinotopic responsebiases in high-level areas is that they are driven by differentialconnectivity with different parts of the retinotopic maps inearly visual areas.
To explore this possibility, we probed the extent to whichthese biases and links were evident in the intrinsic resting-state structure between object cortex and early visual cortex.Our analyses yielded relatively subtle relationships betweenthese two major cortical territories. Considering eccentricity,we only detected differences in peripheral functional connect-ivity, but not with foveal functional connectivity. Interestingly,this asymmetry is consistent with some recent stimulus-evoked results. For example, it has been found that big object-preferring regions have a stronger evoked response when stimuliare presented at larger retinal sizes than at smaller retinalsizes, showing a general peripheral preference (Konkle andOliva 2012; see also Levy et al. 2004; Troiani et al. 2012), whilethe small-object-preferring regions do not have the oppositefoveal bias (Konkle and Oliva 2012). Less is known about therelative strengths of the asymmetries between upper and lowervisual field biases in these regions, but our resting-state resultswould predict stronger lower visual field biases along the lat-eral surface regions, generally consistent with reported lowervisual field biases in LO (Sayres and Grill-Spector 2008;Schwarzlose et al. 2008; Kravitz et al. 2010; Silson et al. 2015,see also Kravitz et al. 2013).
Common Network and Nested Network Architecture
The strongest structure in these resting-state data shows thatthe animacy-size regions are largely part of a common inter-connected network. What is the role of these local connectionsin the organization of object-responsive cortex? Some propo-sals suggest that this internal connectivity may actually be aprominent driver of the large-scale organization of object cor-tex (Polk and Farah 1995; Konkle and Oliva 2012; Behrmann andPlaut 2013; Srihasam et al., 2012). Specifically, the relative
Figure 9. Comparing extrinsic response profiles and intrinsic resting-state structure. (A) The contrast of all objects greater than a fixation baseline, for an example
participant (left) is plotted next to a visualization of the common regions most strongly correlated at rest with each of the animacy-size ROIs (right, as in Fig. 8). (B)
The 3-way response preference map for animals, big objects, and small objects, is shown for an example participant (left), plotted next to the profile-clustering
results, which yielded 3 major distinctions in the long-range regions that route through this object-responsive cortex.
10 | Cerebral Cortex
at Harvard L
ibrary on October 5, 2016
http://cercor.oxfordjournals.org/D
ownloaded from
locations and sizes of different object-preferring regions maybe driven by cooperative–competitive interactions within anintegrated large-scale circuit. These accounts typically suggestthat Hebbian self-organizing mechanisms might naturally seg-regate different kinds of images based primarily on the shapesimilarity and the extent and timing of experience. However, akey challenge for these proposals is that the relative positionsof object-selectivities are remarkably consistent across people.Thus, these experience-driven accounts must also presupposethat the large-scale organization is either anchored by inputand output connections, or it emerges based on an innate pro-tomap that patterns this cortex (Srihasam et al. 2014).
Importantly, whether the organization is anchored by exter-nal connectivity or by an internal protomap, both of these fac-tors likely only provide an initial blueprint of the ultimateobject organization. These mechanisms cannot have evolvedthe specificity required to deal with the richness of the modernvisual world (e.g., letter form selectivity in the visual word-form area, see Dehaene and Cohen 2007 for a clear discussion).Thus, there is little doubt that interconnections within occipito-temporal cortex are involved in sculpting the organizationbased on experience within the lifetime. The key question thenis about the relative specificity of this innate blueprint and thescope of experience-driven plasticity: what is the scale anddetail of these innate long-range connections and internalbiases, and how much room do they leave for learning tochange the large-scale organization?
Origins of Occipitotemporal Organization
Critically, we cannot directly probe the origins of the large-scale organization of object cortex directly, because we arecharacterizing the adult state. As such, we cannot determinewhether the subnetworks reported here are initially in the blue-print of whole-brain network architecture or are pruned tohave this tripartite-network structure via experience. On a pureinnate account, these content divisions are prespecified bystable long-range connections that have been selected for overevolutionary time to facilitate particularly adaptive networkarchitectures (Mahon and Caramazza 2011). On a pureexperience-driven account, the content-distinctions betweendifferent kinds of visual objects emerge due to experience inthe world, likely driven by differences in visual input statisticsand interactions (Hasson et al., 2002; Konkle and Oliva 2012). Inthis scenario, long-range network architecture must be initiallyhighly exuberant (Innocenti and Price 2005), and then undergopruning to match the stimulus-evoked organization followinglocal regional response tuning. A developmental approach willbe required to understand the specificity of these long-rangenetworks and to assess the degree of pruning triggered bydevelopment of object-responsive regions.
Exploration of these questions is beginning to bear fruit. Onthe one hand, congenitally blind individuals—who have had novisual experience in their lifetime—show similar neuralresponse preferences to sighted individuals in some of thesesame “visual” object regions, for example, whether hearing thenames of artifacts versus animals (Mahon et al. 2009), tools(Peelen et al. 2013), or large objects (He et al. 2013), by manuallyexploring objects (Pietrini et al. 2004; Amedi et al. 2010), or byhearing the shape of objects or bodies via auditory substitution(Striem-Amit et al. 2012; Striem-Amit and Amedi 2014). Thus,there is clear evidence that the organization of this object-responsive cortex is not solely driven by visual experience. Onthe other hand, recent evidence has shown that intensive early
visual experience with symbols can systematically modify thelarge-scale organization of high-level visual cortex in monkeys,leading to spatially segregated regions that show symbol-selectivity (Srihasam et al. 2012, 2014). Thus, there is also evi-dence that “new” clustered functional regions can be formedthrough mechanisms of visual experience. However, morework is required to understand why the locations of these newregions are consistent across monkeys, and it is possible thatthese regions are in fact constrained by the available connectiv-ity of those regions to downstream areas necessary for furtherprocessing of the stimulus set (Dehaene and Cohen 2011;Mahon and Caramazza 2011).
Ultimately, a region derives its selectivity and functionalrole through its inputs and outputs, and thus its representa-tional role inherently depends on available connectivity.Different proposals about the organization and functional clus-tering in the ventral stream have emphasized different aspectsof this connectivity—focusing on the role of the primary inputsfrom the visual cortex, the internal connections within theoccipitotemporal cortex, or the downstream connections pro-jecting to nonvisual parts of the brain. The present data cannotarbitrate the relative importance of these different connectionmotifs in driving the organization of object-cortex. However,these data do support the viability of innate whole-brain net-work-level connectivity as a potential driving force of objectorganization, as object-responsive cortex has differential func-tional connections both with early visual cortex and withlonger-range regions, and these connections parallel thestimulus-evoked organization.
Supplementary MaterialSupplementary material can be found at: http://www.cercor.oxfordjournals.org/.
FundingThe Fondazione Cassa di Risparmio di Trento e Rovereto (SMC)and the National Institutes of Health, National Eye Institute(Fellowship F32EY022863-01A1 to T.K.), and this work was con-ducted at the Laboratory for Functional Neuroimaging at theCenter for Mind/Brain Sciences (CIMeC), University of Trento.
NotesConflict of Interest: None declared.
ReferencesAmedi A, Raz N, Azulay H, Malach R, Zohary E. 2010. Cortical
activity during tactile exploration of objects in blind andsighted humans. Restor Neurol Neurosci. 28(2):143–156.
Anzellotti S, Caramzza A, Saxe R. 2016. Multivariate patternconnectivity. bioRxiv 046151. doi:http://dx.doi.org/10.1101/046151.
Arcaro MJ, McMains SA, Singer BD, Kastner S. 2009. Retinotopicorganization of human ventral visual cortex. J Neurosci. 29(34):10638–10652.
Baldassano C, Beck DM, Fei-Fei L. 2013. Differential connectivitywithin the parahippocampal place area. Neuroimage. 75:228–237.
Behrmann M, Plaut DC. 2013. Distributed circuits, not circum-scribed centers, mediate visual recognition. Trends CognSci. 17(5):210–219.
Resting-State Structure of Object Organization Konkle and Caramazza | 11
at Harvard L
ibrary on October 5, 2016
http://cercor.oxfordjournals.org/D
ownloaded from
Bell AH, Hadj-Bouziane F, Frihauf JB, Tootell RB, Ungerleider LG.2009. Object representations in the temporal cortex of mon-keys and humans as revealed by functional magnetic reson-ance imaging. J Neurophysiol. 101(2):688–700.
Biswal BB, Mennes M, Zuo XN, Gohel S, Kelly C, Smith SM,Beckmann CF, Adelstein JS, Buckner RL, Colcombe S, et al.2010. Toward discovery science of human brain function.Proc Natl Acad Sci USA. 107(10):4734–4739.
Buckner RL, Krienen FM, Yeo BT. 2013. Opportunities and lim-itations of intrinsic functional connectivity MRI. NatNeurosci. 16(7):832–837.
Chao LL, Haxby JV, Martin A. 1999. Attribute-based neural sub-strates in temporal cortex for perceiving and knowing aboutobjects. Nat Neurosci. 2(10):913–919.
Cole MW, Bassett DS, Power JD, Braver TS, Petersen SE. 2014.Intrinsic and task-evoked network architectures of thehuman brain. Neuron. 83:238–251.
Dehaene S, Cohen L. 2007. Cultural recycling of cortical maps.Neuron. 56(2):384–398.
Dehaene S, Cohen L. 2011. The unique role of the visual wordform area in reading. Trends Cogn Sci. 15(6):254–262.
Fox MD, Raichle ME. 2007. Spontaneous fluctuations in brainactivity observed with functional magnetic resonanceimaging. Nat Rev Neurosci. 8(9):700–711.
Garrido L, Holmes AJ, Nakayama K. 2013. Functional connectiv-ity patterns predict face selectivity. Program No. 760.22.Neuroscience 2013 Abstracts. San Diego, CA: Society forNeuroscience. Online.
Grill-Spector K, Weiner KS. 2014. The functional architecture ofthe ventral temporal cortex and its role in categorization.Nat Rev Neurosci. 15(8):536–548.
Hasson U, Harel M, Levy I, Malach R. 2003. Large-scale mirror-symmetry organization of human occipito-temporal objectareas. Neuron. 37(6):1027–1041.
Hasson U, Levy I, Behrmann M, Hendler T, Malach R. 2002.Eccentricity bias as an organizing principle for human high-order object areas. Neuron. 34(3):479–490.
Hasson U, Nusbaum HC, Small SL. 2009. Task-dependent organ-ization of brain regions active during rest. Proc Natl Acad SciUSA. 106(26):10841–10846.
Haxby JV, Gobbini MI, Furey ML, Ishai A, Schouten JL, Pietrini P.2001. Distributed and overlapping representations of facesand objects in ventral temporal cortex. Science. 293(5539):2425–2430.
Haxby JV, Guntupalli JS, Connolly AC, Halchenko YO, Conroy BR,Gobbini MI, Hanke M, Ramadge PJ. 2011. A common, high-dimensional model of the representational space in humanventral temporal cortex. Neuron. 72(2):404–416.
He C, Peelen MV, Han Z, Lin N, Caramazza A, Bi Y. 2013.Selectivity for large nonmanipulable objects in scene-selective visual cortex does not require visual experience.Neuroimage. 79:1–9.
Honey CJ, Sporns O, Cammoun L, Gigandet X, Thiran JP, MeuliR, Hagmann P. 2009. Predicting human resting-state func-tional connectivity from structural connectivity. Proc NatlAcad Sci USA. 106(6):2035–2040.
Hutchison RM, Culham JC, Everling S, Flanagan JR, Gallivan JP.2014. Distinct and distributed functional connectivity pat-terns across cortex reflect the domain-specific constraintsof object, face, scene, body, and tool category-selectivemodules in the ventral visual pathway. NeuroImage. 96:216–236.
Huth AG, Nishimoto S, Vu AT, Gallant JL. 2012. A continuoussemantic space describes the representation of thousands
of object and action categories across the human brain.Neuron. 76(6):1210–1224.
Innocenti GM, Price DJ. 2005. Exuberance in the development ofcortical networks. Nat Rev Neurosci. 6(12):955–965.
Kanwisher N. 2010. Functional specificity in the human brain: awindow into the functional architecture of the mind. ProcNatl Acad Sci USA. 107(25):11163–11170.
Konkle T, Caramazza A. 2013. Tripartite organization of theventral stream by animacy and object size. J Neurosci. 33(25):10235–10242.
Konkle T, Oliva A. 2011. Canonical visual size for real-worldobjects. J Exp Psychol Hum Percept Perform. 37(1):23.
Konkle T, Oliva A. 2012. A real-world size organization of objectresponses in occipitotemporal cortex. Neuron. 74(6):1114–1124.
Kourtzi Z, Connor CE. 2011. Neural representations for objectperception: structure, category, and adaptive coding. AnnuRev Neurosci. 34:45–67.
Kravitz DJ, Kriegeskorte N, Baker CI. 2010. High-level visualobject representations are constrained by position. CerebCortex. 20(12):2916–2925.
Kravitz DJ, Saleem KS, Baker CI, Ungerleider LG, Mishkin M. 2013.The ventral visual pathway: an expanded neural frameworkfor the processing of object quality. Trends Cogn Sci. 17(1):26–49.
Kriegeskorte N, Mur M, Ruff DA, Kiani R, Bodurka J, Esteky H,Tanaka K, Bandettini PA. 2008. Matching categorical objectrepresentations in inferior temporal cortex of man andmonkey. Neuron. 60(6):1126–1141.
Krienen FM, Yeo BT, Buckner RL. 2014. Reconfigurable task-dependent functional coupling modes cluster around a corefunctional architecture. Phil Trans R Soc B. 369(1653):20130526.
Larsson J, Heeger DJ. 2006. Two retinotopic visual areas inhuman lateral occipital cortex. J Neurosci. 26(51):13128–13142.
Laumann TO, Gordon EM, Adeyemo B, Snyder AZ, Joo SJ, ChenMY, Petersen SE. 2015. Functional system and areal organ-ization of a highly sampled individual human brain.Neuron. 87(3):657–670.
Levy I, Hasson U, Avidan G, Hendler T, Malach R. 2001. Center–periphery organization of human object areas. Nat Neurosci.4(5):533–539.
Levy I, Hasson U, Harel M, Malach R. 2004. Functional analysisof the periphery effect in human building related areas.Hum Brain Mapp. 22(1):15–26.
Mahon BZ, Anzellotti S, Schwarzbach J, Zampini M, CaramazzaA. 2009. Category-specific organization in the human braindoes not require visual experience. Neuron. 63:397–405.
Mahon BZ, Caramazza A. 2011. What drives the organization ofobject knowledge in the brain? Trends Cogn Sci. 15(3):97–103.
Mahon BZ, Milleville SC, Negri GA, Rumiati RI, Caramazza A,Martin A. 2007. Action-related properties shape object repre-sentations in the ventral stream. Neuron. 55(3):507–520.
Malach R, Levy I, Hasson U. 2002. The topography of high-orderhuman object areas. Trends Cogn Sci. 6(4):176–184.
Mennes M, Kelly C, Colcombe S, Castellanos FX, Milham MP.2013. The extrinsic and intrinsic functional architectures ofthe human brain are not equivalent. Cereb Cortex. 23(1):223–229.
O’Neil EB, Hutchison RM, McLean DA, Köhler S. 2014. Resting-state fMRI reveals functional connectivity between face-selective perirhinal cortex and the fusiform face area relatedto face inversion. NeuroImage. 92:349–355.
12 | Cerebral Cortex
at Harvard L
ibrary on October 5, 2016
http://cercor.oxfordjournals.org/D
ownloaded from
Op de Beeck HP, Haushofer J, Kanwisher NG. 2008. InterpretingfMRI data: maps, modules and dimensions. Nat RevNeurosci. 9(2):123–135.
Peelen MV, Bracci S, Lu X, He C, Caramazza A, Bi Y. 2013. Toolselectivity in left occipitotemporal cortex develops withoutvision. J Cogn Neurosci. 25(8):1225–1234.
Pietrini P, Furey ML, Ricciardi E, Gobbini MI, Wu WHC, Cohen L,Guazzelli M, Haxby JV. 2004. Beyond sensory images: object-based representation in the human ventral pathway. ProcNatl Acad Sci USA. 101(15):5658–5663.
Polk TA, Farah MJ. 1995. Brain localization for arbitrary stimuluscategories: a simple account based on Hebbian learning.Proc Natl Acad Sci USA. 92(26):12370–12373.
Saygin ZM, Osher DE, Koldewyn K, Reynolds G, Gabrieli JD, SaxeRR. 2012. Anatomical connectivity patterns predict faceselectivity in the fusiform gyrus. Nat Neurosci. 15(2):321–327.
Sayres R, Grill-Spector K. 2008. Relating retinotopic and object-selective responses in human lateral occipital cortex. JNeurophysiol. 100(1):249–267.
Schwarzlose RF, Swisher JD, Dang S, Kanwisher N. 2008. Thedistribution of category and location information acrossobject-selective regions in human visual cortex. Proc NatlAcad Sci USA. 105(11):4447–4452.
Silson EH, Chan AWY, Reynolds RC, Kravitz DJ, Baker CI. 2015.A retinotopic basis for the division of high-level scene pro-cessing between lateral and ventral human occipitotem-poral cortex. J Neurosci. 35(34):11921–11935.
Simmons WK, Martin A. 2012. Spontaneous resting-state BOLDfluctuations reveal persistent domain-specific neural net-works. Soc Cogn Affect Neurosci. 7(4):467–475.
Smith SM, Vidaurre D, Beckmann CF, Glasser MF, Jenkinson M,Miller KL, Nichols TE, Robinson EC, Salimi-Khorshidi G,Woolrich MW, et al. 2013. Functional connectomics fromresting-state fMRI. Trends Cogn Sci. 17(12):666–682.
Srihasam K, Mandeville JB, Morocz IA, Sullivan KJ, LivingstoneMS. 2012. Behavioral and anatomical consequences of earlyversus late symbol training in macaques. Neuron. 73(3):608–619.
Srihasam K, Vincent JL, Livingstone MS. 2014. Novel domainformation reveals proto-architecture in inferotemporalcortex. Nat Neurosci. 17(12):1776–1783.
Stevens WD, Tessler MH, Peng CS, Martin A. 2015. Functionalconnectivity constrains the category-related organization ofhuman ventral occipitotemporal cortex. Hum Brain Mapp.DOI:10.1002/hbm.22764.
Striem-Amit E, Amedi A. 2014. Visual cortex extrastriate body-selective area activation in congenitally blind people “see-ing” by using sounds. Curr Biol. 24(6):687–692.
Striem-Amit E, Dakwar O, Reich L, Amedi A. 2012. The large-scale organization of “visual” streams emerges without vis-ual experience. Cereb Cortex. 22(7):1698–1709.
Tanaka K. 2003. Columns for complex visual object features inthe inferotemporal cortex: clustering of cells with similarbut slightly different stimulus selectivities. Cereb Cortex. 13(1):90–99.
Troiani V, Stigliani A, Smith ME, Epstein RA. 2012. Multipleobject properties drive scene-selective regions. Cereb Cortex.24(4):883–897. http://www.ncbi.nlm.nih.gov/pubmed/?term=Face-specific+resting+functional+connectivity+between+the+fusiform+gyrus+and+posterior+superior+temporal+sulcus.
Turk-Browne NB, Norman-Haignere SV, McCarthy G. 2010.Face-specific resting functional connectivity between thefusiform gyrus and posterior superior temporal sulcus.Front Hum Neurosci. 4(4):176.
Ungerleider LG, Bell AH. 2011. Uncovering the visual “alphabet”:advances in our understanding of object perception. VisionRes. 51(7):782–799.
Wandell BA, Dumoulin SO, Brewer AA. 2007. Visual field mapsin human cortex. Neuron. 56(2):366–383.
Weiner KS, Golarai G, Caspers J, Chuapoco MR, Mohlberg H,Zilles K, Amunts K, Grill-Spector K. 2014. The mid-fusiformsulcus: a landmark identifying both cytoarchitectonic andfunctional divisions of human ventral temporal cortex.Neuroimage. 84:453–465.
Yeo BT, Krienen FM, Sepulcre J, Sabuncu MR, Lashkari D,Hollinshead M, Roffman JL, Smoller JW, Zoillei L, PolimeniJR, et al. 2011. The organization of the human cerebral cor-tex estimated by intrinsic functional connectivity. JNeurophys. 106(3):1125–1165.
Zhu Q, Zhang J, Luo YL, Dilks DD, Liu J. 2011. Resting-stateneural activity across face-selective cortical regions isbehaviorally relevant. J Neurosci. 31(28):10323–10330.
Resting-State Structure of Object Organization Konkle and Caramazza | 13
at Harvard L
ibrary on October 5, 2016
http://cercor.oxfordjournals.org/D
ownloaded from