Embed Size (px)
Citation preview
The LAByrinthThe LAByrinthThe LAByrinthThe LAByrinth
Indiana State Department of Health Laboratories Newsletter
INDEX of Articles
SPRING 2017 ISSUE NO. 26
Indiana State
Department of Health
Laboratories
Jerome M. Adams, MD, MPH
Indiana State Health Commissioner
Pam Pontones, MA
Deputy State Health Commissioner
Judith Lovchik, Ph.D, D(ABMM)
Assistant Commissioner
Public Health Protection &
Laboratory Services
Our Mission:
The Indiana State Department of Health Laboratories partners with other public health agencies to provide timely and accurate information needed for
surveillance and outbreak investigations to protect and improve Hoosier health..
CDC’s PulseNet program celebrated its 20th anniversary in 2016. PulseNet USA is a
nationwide collaboration of laboratories that connect foodborne illness cases to detect
outbreaks. An estimated 270,000 illnesses are prevented every year since PulseNet was
implemented.1 There are 83 different laboratories throughout the United States with at
least one PulseNet laboratory in every state.2
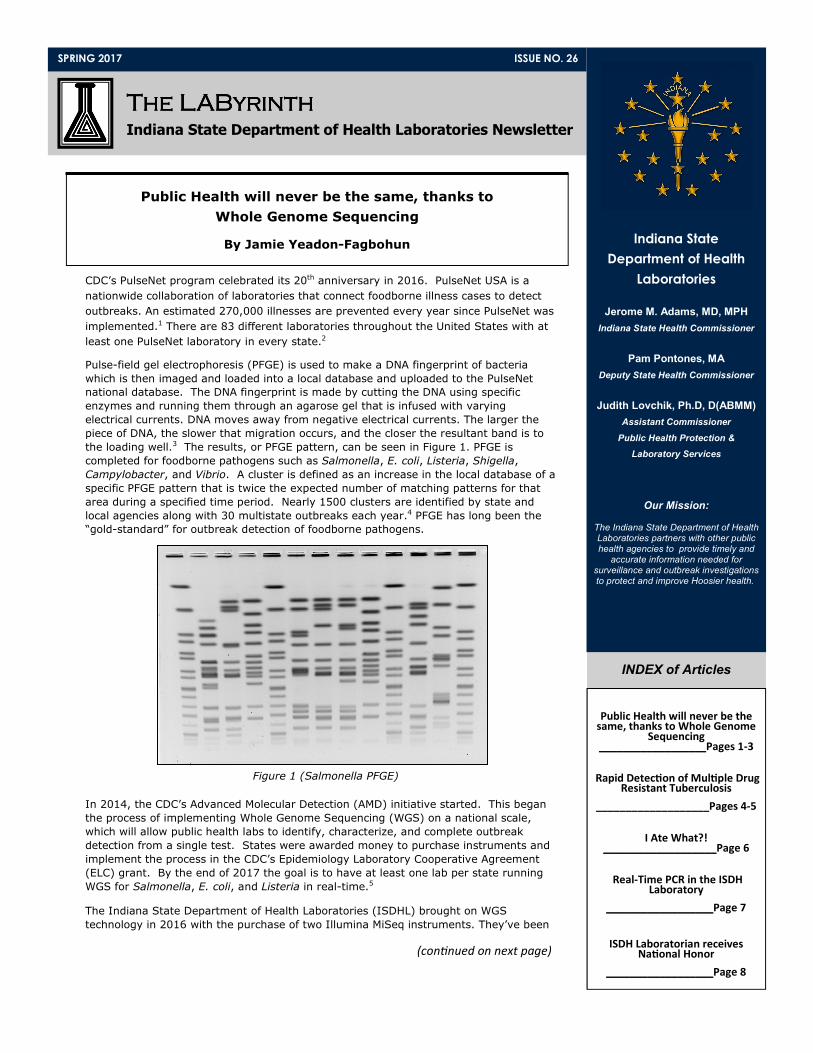
Pulse-field gel electrophoresis (PFGE) is used to make a DNA fingerprint of bacteria
which is then imaged and loaded into a local database and uploaded to the PulseNet
national database. The DNA fingerprint is made by cutting the DNA using specific
enzymes and running them through an agarose gel that is infused with varying
electrical currents. DNA moves away from negative electrical currents. The larger the
piece of DNA, the slower that migration occurs, and the closer the resultant band is to
the loading well.3 The results, or PFGE pattern, can be seen in Figure 1. PFGE is
completed for foodborne pathogens such as Salmonella, E. coli, Listeria, Shigella,
Campylobacter, and Vibrio. A cluster is defined as an increase in the local database of a
specific PFGE pattern that is twice the expected number of matching patterns for that
area during a specified time period. Nearly 1500 clusters are identified by state and
local agencies along with 30 multistate outbreaks each year.4 PFGE has long been the
“gold-standard” for outbreak detection of foodborne pathogens.
In 2014, the CDC’s Advanced Molecular Detection (AMD) initiative started. This began
the process of implementing Whole Genome Sequencing (WGS) on a national scale,
which will allow public health labs to identify, characterize, and complete outbreak
detection from a single test. States were awarded money to purchase instruments and
implement the process in the CDC’s Epidemiology Laboratory Cooperative Agreement
(ELC) grant. By the end of 2017 the goal is to have at least one lab per state running
WGS for Salmonella, E. coli, and Listeria in real-time.5
The Indiana State Department of Health Laboratories (ISDHL) brought on WGS
technology in 2016 with the purchase of two Illumina MiSeq instruments. They’ve been
(con�nued on next page)
Public Health will never be the same, thanks to
Whole Genome Sequencing
By Jamie Yeadon-Fagbohun
Public Health will never be the same, thanks to Whole Genome
Sequencing __________________Pages 1-3
Rapid Detec#on of Mul#ple Drug Resistant Tuberculosis
___________________Pages 4-5
I Ate What?!___________________Page 6
Real-Time PCR in the ISDH Laboratory
__________________Page 7
ISDH Laboratorian receives Na#onal Honor
__________________Page 8
Figure 1 (Salmonella PFGE)
The LAByrinth - ISDH Quarterly Newsletter Page 2
colloquially named Sheldon and Leonard (after the characters from the television show ‘The Big Bang Theory’). We currently
have three staff members certified in WGS for PulseNet organisms. Between June 2016 and February 2017, we completed
sequencing on 250 specimens: 11 Listeria isolates, 89 E. coli isolates, and 150 Salmonella isolates. We are still working on
optimizing our workflow to sequence all of these pathogens in real-time. We are also in the process of training and certify-
ing additional staff members for WGS.
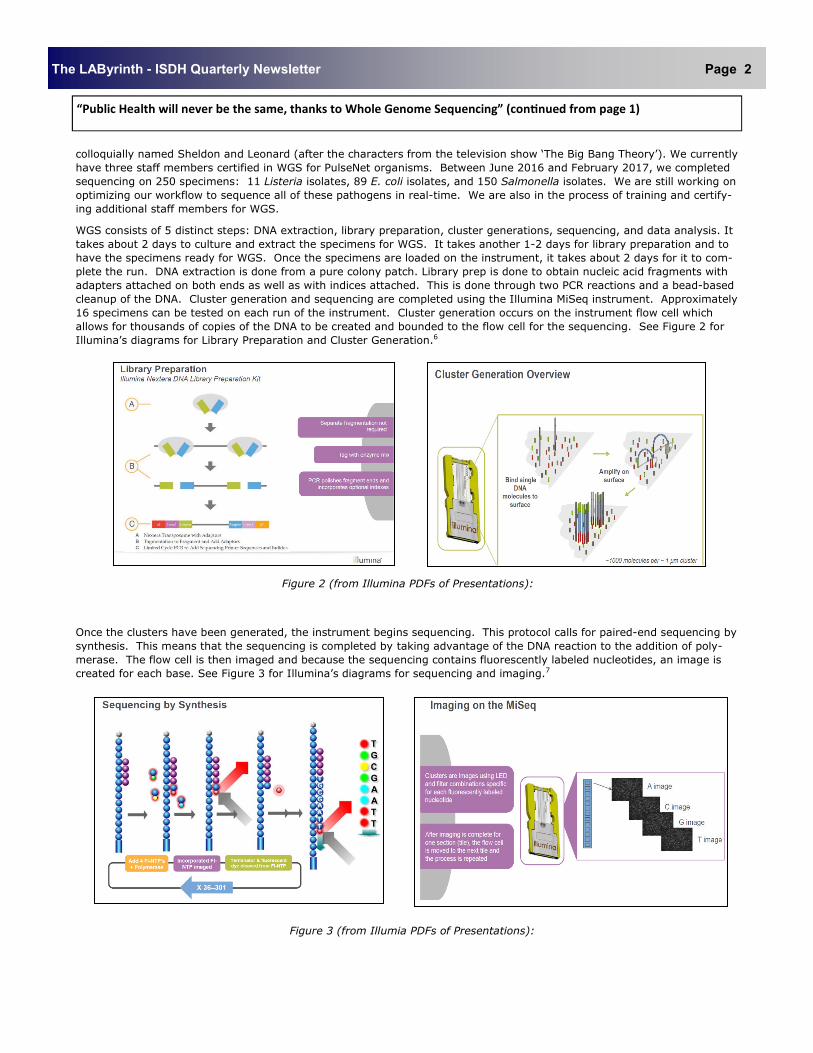
WGS consists of 5 distinct steps: DNA extraction, library preparation, cluster generations, sequencing, and data analysis. It
takes about 2 days to culture and extract the specimens for WGS. It takes another 1-2 days for library preparation and to
have the specimens ready for WGS. Once the specimens are loaded on the instrument, it takes about 2 days for it to com-
plete the run. DNA extraction is done from a pure colony patch. Library prep is done to obtain nucleic acid fragments with
adapters attached on both ends as well as with indices attached. This is done through two PCR reactions and a bead-based
cleanup of the DNA. Cluster generation and sequencing are completed using the Illumina MiSeq instrument. Approximately
16 specimens can be tested on each run of the instrument. Cluster generation occurs on the instrument flow cell which
allows for thousands of copies of the DNA to be created and bounded to the flow cell for the sequencing. See Figure 2 for
Illumina’s diagrams for Library Preparation and Cluster Generation.6
Figure 2 (from Illumina PDFs of Presentations):
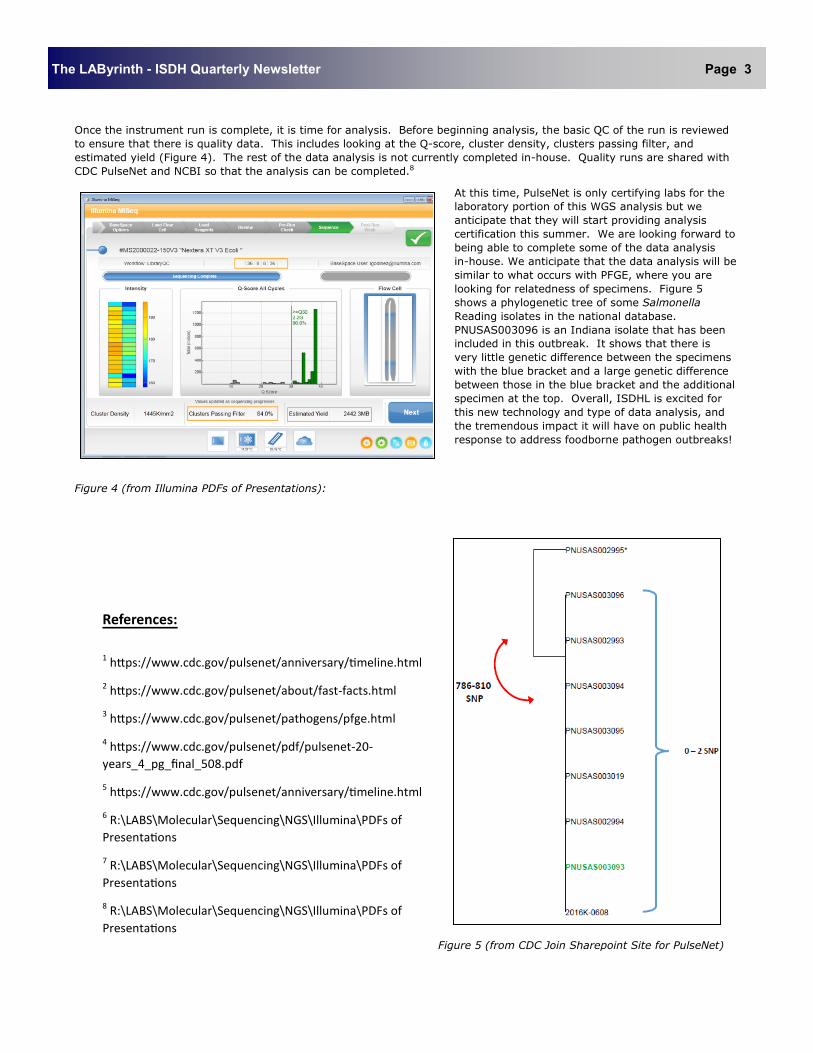
Once the clusters have been generated, the instrument begins sequencing. This protocol calls for paired-end sequencing by
synthesis. This means that the sequencing is completed by taking advantage of the DNA reaction to the addition of poly-
merase. The flow cell is then imaged and because the sequencing contains fluorescently labeled nucleotides, an image is
created for each base. See Figure 3 for Illumina’s diagrams for sequencing and imaging.7
Figure 3 (from Illumia PDFs of Presentations):
“Public Health will never be the same, thanks to Whole Genome Sequencing” (con#nued from page 1)
The LAByrinth - ISDH Quarterly Newsletter Page 3
Once the instrument run is complete, it is time for analysis. Before beginning analysis, the basic QC of the run is reviewed
to ensure that there is quality data. This includes looking at the Q-score, cluster density, clusters passing filter, and
estimated yield (Figure 4). The rest of the data analysis is not currently completed in-house. Quality runs are shared with
CDC PulseNet and NCBI so that the analysis can be completed.8
At this time, PulseNet is only certifying labs for the
laboratory portion of this WGS analysis but we
anticipate that they will start providing analysis
certification this summer. We are looking forward to
being able to complete some of the data analysis
in-house. We anticipate that the data analysis will be
similar to what occurs with PFGE, where you are
looking for relatedness of specimens. Figure 5
shows a phylogenetic tree of some Salmonella
Reading isolates in the national database.
PNUSAS003096 is an Indiana isolate that has been
included in this outbreak. It shows that there is
very little genetic difference between the specimens
with the blue bracket and a large genetic difference
between those in the blue bracket and the additional
specimen at the top. Overall, ISDHL is excited for
this new technology and type of data analysis, and
the tremendous impact it will have on public health
response to address foodborne pathogen outbreaks!
Figure 4 (from Illumina PDFs of Presentations):
Figure 5 (from CDC Join Sharepoint Site for PulseNet)
References:
1 h�ps://www.cdc.gov/pulsenet/anniversary/�meline.html
2 h�ps://www.cdc.gov/pulsenet/about/fast-facts.html
3 h�ps://www.cdc.gov/pulsenet/pathogens/pfge.html
4 h�ps://www.cdc.gov/pulsenet/pdf/pulsenet-20-
years_4_pg_final_508.pdf
5 h�ps://www.cdc.gov/pulsenet/anniversary/�meline.html
6 R:\LABS\Molecular\Sequencing\NGS\Illumina\PDFs of
Presenta�ons
7 R:\LABS\Molecular\Sequencing\NGS\Illumina\PDFs of
Presenta�ons
8 R:\LABS\Molecular\Sequencing\NGS\Illumina\PDFs of
Presenta�ons

The LAByrinth - ISDH Quarterly Newsletter Page 4
The Indiana State Department of Health (ISDH) TB Laboratory utilizes the technique of pyrosequencing to rapidly detect
antibiotic resistance to Mycobacterium tuberculosis complex (MTBC). In contrast to traditional culture-based antimicrobial
susceptibility testing, which requires a pure culture and can take several weeks, pyrosequencing can be performed directly on
processed sputum specimens and can be completed within a few hours.
Pyrosequencing quickly and accurately obtains short sequence data from targeted genes of MTBC. The sequences generated
are compared to sequences of library strains with known antibiotic resistance patterns. This process requires several steps.
First, MTBC DNA is amplified using specific biotinylated-primers spanning the bacterial genome, similar to PCR. Next, the
amplified gene fragments are sequenced with primers specific to the region containing the possible mutations. Like in PCR,
nucleotides are incorporated stepwise; however, in the case of pyrosequencing, the incorporated nucleotides are added one at
a time (ex. A, then G, then C, then T) instead of all at once. Incorporation of a given nucleotide at each step causes the
generation of ATP, which reacts with a luciferin substrate and produces a phosphoretic/luminescent signal that can be de-
tected by the pyrosequencing instrument. If a nucleotide is not incorporated, or if there are additional nucleotides remaining
after the reaction, the enzyme apyrase degrades them in order to prevent false signals. Correlating the identity of the added
nucleotide and the presence of a phosphoretic signal gives us the sequence. The sequencing portion of this procedure is
performed on the Qiagen PyroMark Q24 Pyrosequencer.
The most critical application of this technology in the ISDH TB Laboratory is to identify multiple drug resistant TB (MDR TB),
which is TB that is resistant to a minimum of Rifampin (RIF) and Isoniazid (INH). TB infections are typically treated with four
antibiotics simultaneously, two of which are RIF and INH. Mutations at the gene rpoB account for approximately 90% of RIF
resistant strains, and mutations at katG and inhA account for over 90% of INH resistant strains. The ISDH TB Lab routinely
performs pyrosequencing testing for all three of these loci for all newly identified TB patients.
Step 1 - A DNA segment is amplified and the
template strand is biotinylated. The primer
and single stranded template are incubated
with enzymes and substrate.1
Rapid Detection of Multiple Drug Resistant Tuberculosis (MDR TB)
By Jessica Gentry
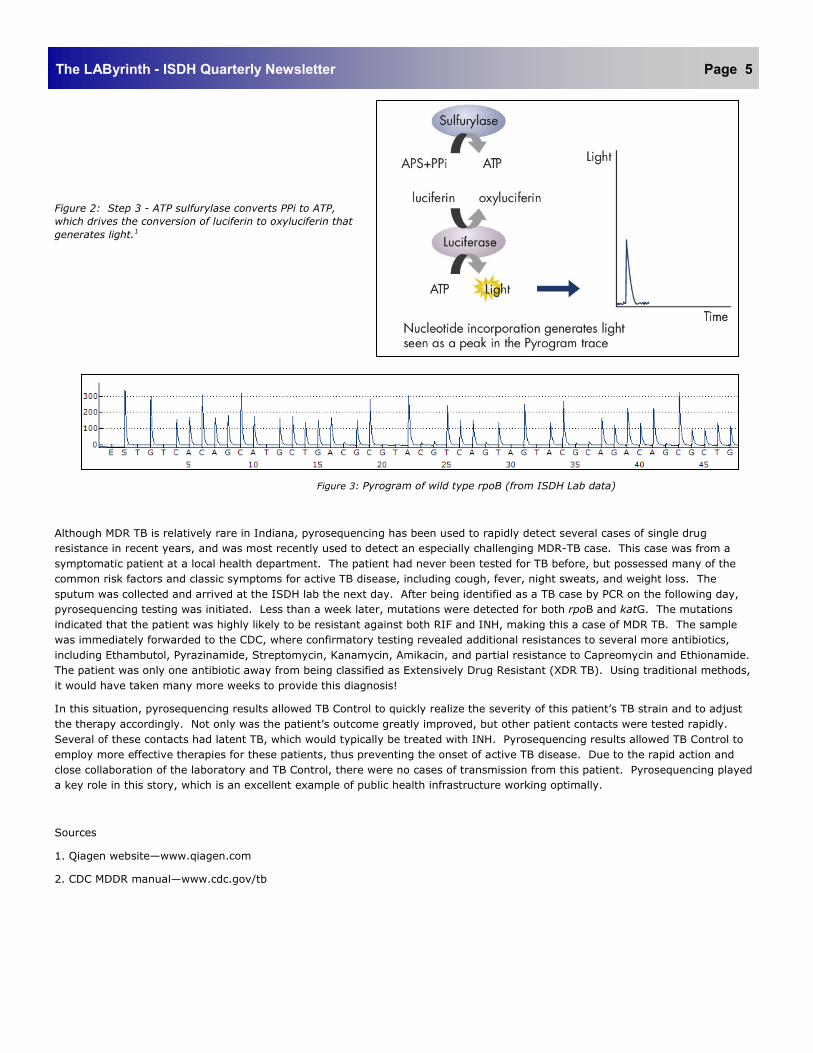
Figure 2: Step 3 - ATP sulfurylase converts PPi to ATP,
which drives the conversion of luciferin to oxyluciferin that
generates light.1
Figure 3: Pyrogram of wild type rpoB (from ISDH Lab data)
Although MDR TB is relatively rare in Indiana, pyrosequencing has been used to rapidly detect several cases of single drug
resistance in recent years, and was most recently used to detect an especially challenging MDR-TB case. This case was from a
symptomatic patient at a local health department. The patient had never been tested for TB before, but possessed many of the
common risk factors and classic symptoms for active TB disease, including cough, fever, night sweats, and weight loss. The
sputum was collected and arrived at the ISDH lab the next day. After being identified as a TB case by PCR on the following day,
pyrosequencing testing was initiated. Less than a week later, mutations were detected for both rpoB and katG. The mutations
indicated that the patient was highly likely to be resistant against both RIF and INH, making this a case of MDR TB. The sample
was immediately forwarded to the CDC, where confirmatory testing revealed additional resistances to several more antibiotics,
including Ethambutol, Pyrazinamide, Streptomycin, Kanamycin, Amikacin, and partial resistance to Capreomycin and Ethionamide.
The patient was only one antibiotic away from being classified as Extensively Drug Resistant (XDR TB). Using traditional methods,
it would have taken many more weeks to provide this diagnosis!
In this situation, pyrosequencing results allowed TB Control to quickly realize the severity of this patient’s TB strain and to adjust
the therapy accordingly. Not only was the patient’s outcome greatly improved, but other patient contacts were tested rapidly.
Several of these contacts had latent TB, which would typically be treated with INH. Pyrosequencing results allowed TB Control to
employ more effective therapies for these patients, thus preventing the onset of active TB disease. Due to the rapid action and
close collaboration of the laboratory and TB Control, there were no cases of transmission from this patient. Pyrosequencing played
a key role in this story, which is an excellent example of public health infrastructure working optimally.
Sources
1. Qiagen website—www.qiagen.com
2. CDC MDDR manual—www.cdc.gov/tb
The LAByrinth - ISDH Quarterly Newsletter Page 5
The LAByrinth - ISDH Quarterly Newsletter Page 6
Have you had a delicious shrimp and rice dish lately? Shellfish, rice, and its cooking water
may all contain arsenic. If it does, and you eat it, your urine can contain arsenic. Should you
be worried?
Maybe your well water contains high amounts of the metal, Chromium. The well may be
contaminated from industrial waste containing hexavalent chromium (Cr6+), or it may
contain a form of chromium that is an essential nutrient (Cr3+). How can you tell?
Those are the questions that a Liquid Chromatograph – Inductively Coupled Plasma/Mass
Spectrometer (LC-ICP/MS) answers. An LC-ICP/MS analyzes different kinds (species) of
Arsenic, Chromium, Mercury and several other metals. Each species may or may not be
harmful; each displays a different toxicity. The Arsenic content found in shellfish usually is
an organic compound and is relatively harmless; the Arsenic in rice or water usually is an
inorganic form, specifically the arsenic species of III (As 3+) or V (As 5+), both of which are
toxic, with As 3+ being about 60 times more toxic of the two. Unfortunately, well water contaminated by Arsenic is
common in Indiana due to geological factors. To remove the arsenic coming from wells, water conditioning companies will
often develop treatment protocols based on the type of Arsenic present, because they need different removal techniques for
each species.
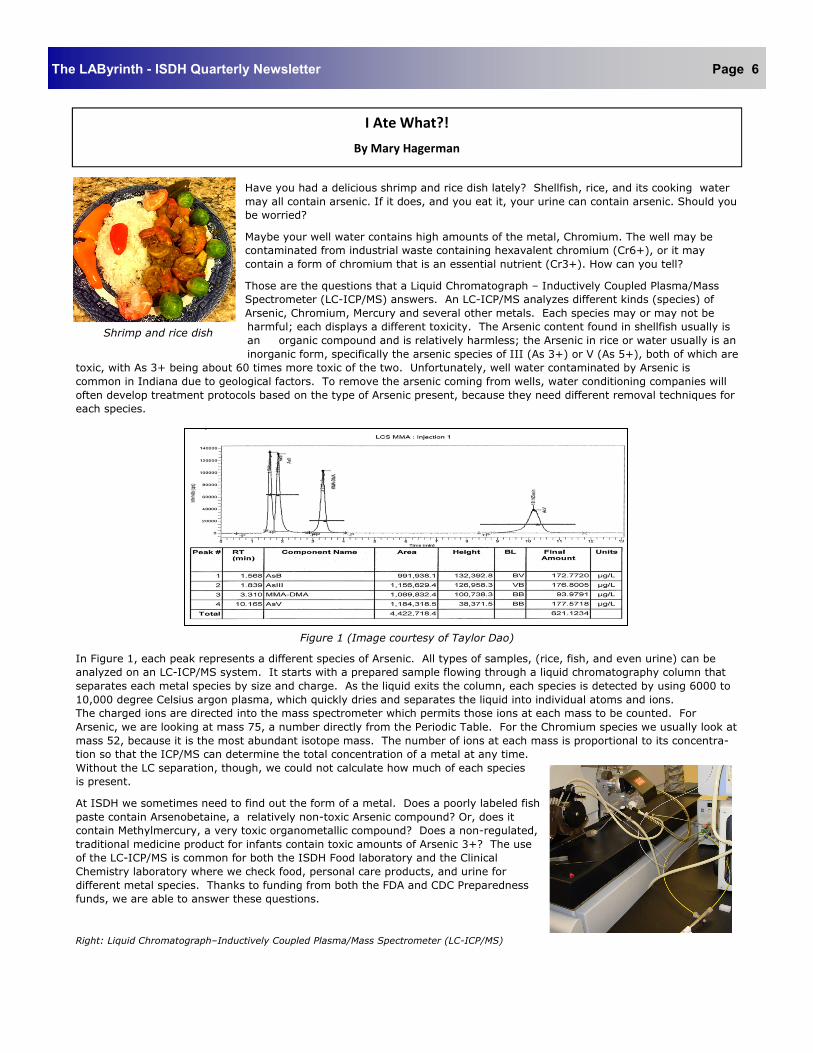
Figure 1 (Image courtesy of Taylor Dao)
In Figure 1, each peak represents a different species of Arsenic. All types of samples, (rice, fish, and even urine) can be
analyzed on an LC-ICP/MS system. It starts with a prepared sample flowing through a liquid chromatography column that
separates each metal species by size and charge. As the liquid exits the column, each species is detected by using 6000 to
10,000 degree Celsius argon plasma, which quickly dries and separates the liquid into individual atoms and ions.
The charged ions are directed into the mass spectrometer which permits those ions at each mass to be counted. For
Arsenic, we are looking at mass 75, a number directly from the Periodic Table. For the Chromium species we usually look at
mass 52, because it is the most abundant isotope mass. The number of ions at each mass is proportional to its concentra-
tion so that the ICP/MS can determine the total concentration of a metal at any time.
Without the LC separation, though, we could not calculate how much of each species
is present.
At ISDH we sometimes need to find out the form of a metal. Does a poorly labeled fish
paste contain Arsenobetaine, a relatively non-toxic Arsenic compound? Or, does it
contain Methylmercury, a very toxic organometallic compound? Does a non-regulated,
traditional medicine product for infants contain toxic amounts of Arsenic 3+? The use
of the LC-ICP/MS is common for both the ISDH Food laboratory and the Clinical
Chemistry laboratory where we check food, personal care products, and urine for
different metal species. Thanks to funding from both the FDA and CDC Preparedness
funds, we are able to answer these questions.
Right: Liquid Chromatograph–Inductively Coupled Plasma/Mass Spectrometer (LC-ICP/MS)
I Ate What?!
By Mary Hagerman
Shrimp and rice dish
The LAByrinth - ISDH Quarterly Newsletter Page 7
Real-Time PCR in the ISDH Laboratory
By Erica Vecchio, MS
Since its discovery by Kleppe and Khorana in the late 1960s1, the use of polymerase chain reaction (PCR) has revolution-
ized the modern diagnostic laboratory. PCR now serves as one of the primary methods for diagnosing and managing
numerous infectious diseases2 and detecting emergent conditions, such as new strains of established pathogens3. In
public health laboratories, which are expected to rapidly and accurately respond to health issues and possible outbreaks,
PCR forms the foundation of molecular diagnostic procedures. In the ISDH Laboratory nearly every department, from the
Food and Dairy area to Biowatch, utilizes PCR at some point during the testing process.
In conventional PCR, a specific DNA (or RNA) sequence is amplified primarily for the purpose of creating multiple copies
of a tiny portion of DNA or in order to compare separate samples for abundance. This is accomplished through a
sequence of events. First, the DNA sequence of interest is heated so the strands of DNA are separated (denaturation).
Next, primers are added and allowed to bind to the end of one strand and the other end of the second strand through
cooling (annealing). Thermostable polymerase enzymes begin to synthesize complementary single-stranded DNA
sequences at the primer points of each strand. Thus, the DNA strands are replicated in opposite directions (elongation).
The entire process is repeated numerous times, usually around 40 or so cycles, until exponential numbers of the DNA
sequence are produced. In the final step, the amplified DNA mixture is cooled and may be stained in an agarose gel for
visualization; the brighter the dyed band, the more DNA copies produced1. When PCR is performed on RNA, the target
RNA must first be converted to DNA before amplification.
Recent advances in technology have improved the efficacy of PCR. At the ISDH Laboratory, QuantStudioTM DX Real-Time
PCR Instruments will soon be introduced into a few departments, including Assay Development, Virology, and
Tuberculosis. Although real-time PCR operates under the same principles as conventional PCR, there are some significant
advantages. Through the addition of fluorescent dyes, PCR product is monitored and measured in real-time during each
cycle by the machine’s instrumentation. Moreover, the ability to accurately measure the amount of amplicon (number of
PCR product molecules) allows the analyst to precisely quantify the amount of initial material in samples. Measurements
are made during the exponential phase of the PCR reaction, which is the optimal point for data analysis. Due to the
accuracy of the real-time PCR process, use of a gel or other post-procedure techniques are unnecessary since analysis is
automatically done during the assay process. Finally, only a single tube is used during the assay, thereby decreasing
possible contamination and analyst effort4.
The use of QuantStudioTM DX will provide rapid, precise, and accurate results for a large number of molecular assays.
Since the testing is performed in real-time, the Laboratory will be able to more realistically analyze possible outcomes
and responses to potential healthcare crises.
References:
1. Rittenhouse-Olson K, De Nardin, E. Molecular biology techniques. In: Zeibig, E., editor. Contemporary clinical immu-
nology and serology. 1st ed. USA: Pearson; 2013. p. 393-406.
2. Espy, MJ. Real-time PCR in clinical microbiology: applications for routine laboratory testing. Clinical microbiology re-
views. 2006; 19(3):165-256.
3. FDA-cleared RT-PCR assays and other molecular assays for influenza viruses [Internet]. Atlanta: Centers for Disease
Control and Prevention. [Cited 2017 March 15]. Available from https://www.cdc.gov/flu/pdf/professionals/diagnosis/
table1-molecular-assays.pdf.
4. QuantStudioTM Dx real-time PCR instrument. USA: Life Technologies; 2014.
About The LAByrinth
The LAByrinth is published quarterly by the editorial staff of Indiana State Department of Health Laboratories.
Produc#on Managers: Chris Grimes, Michael Cross,
Editorial Board: Judith Lovchik, Ph.D, D (ABMM),,
Lauren Dreyling, Haleigh Kampman, and Alex Krug
Director: Judith Lovchik, Ph.D., D (ABMM)
www.in.gov/isdh/24567.htm
The LAByrinth - ISDH Quarterly Newsletter Page 8
550 West 16th Street Indianapolis, IN 46202 Phone 317-921-5500
Fax: 317-927-7801
ISDH Laboratorian receives Na#onal Honor
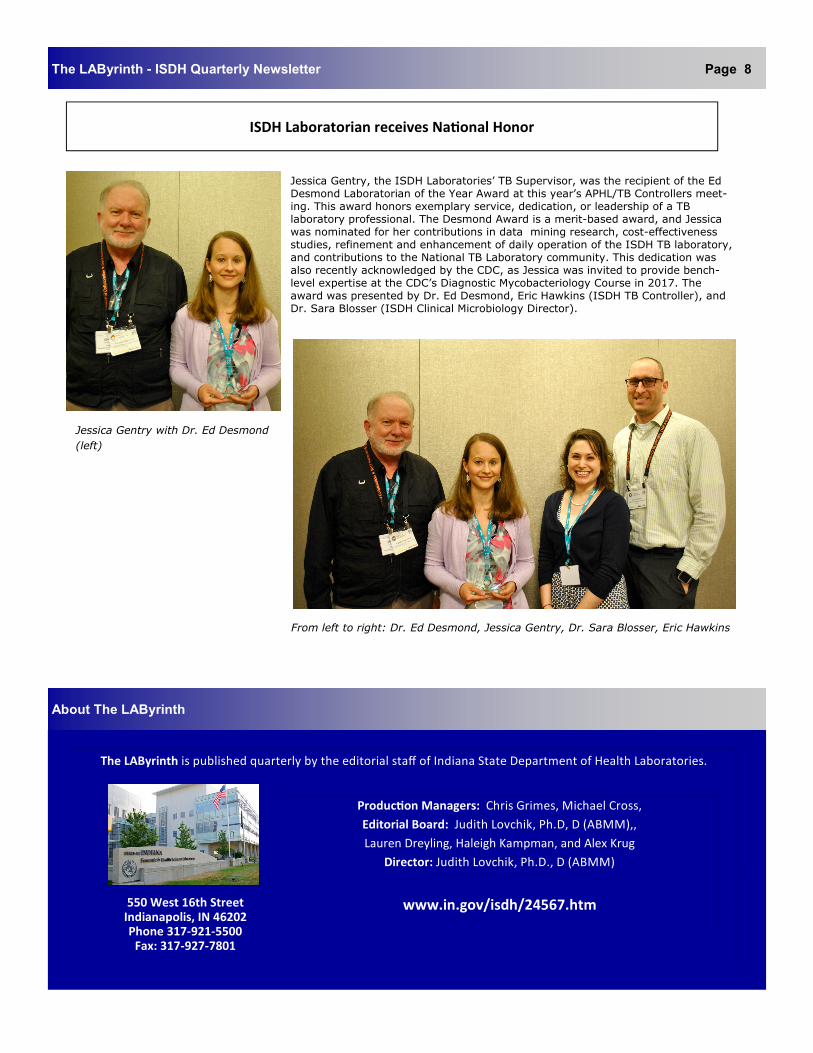
Jessica Gentry, the ISDH Laboratories’ TB Supervisor, was the recipient of the Ed Desmond Laboratorian of the Year Award at this year’s APHL/TB Controllers meet-ing. This award honors exemplary service, dedication, or leadership of a TB laboratory professional. The Desmond Award is a merit-based award, and Jessica was nominated for her contributions in data mining research, cost-effectiveness studies, refinement and enhancement of daily operation of the ISDH TB laboratory, and contributions to the National TB Laboratory community. This dedication was also recently acknowledged by the CDC, as Jessica was invited to provide bench-level expertise at the CDC’s Diagnostic Mycobacteriology Course in 2017. The award was presented by Dr. Ed Desmond, Eric Hawkins (ISDH TB Controller), and Dr. Sara Blosser (ISDH Clinical Microbiology Director).
Jessica Gentry with Dr. Ed Desmond
(left)
From left to right: Dr. Ed Desmond, Jessica Gentry, Dr. Sara Blosser, Eric Hawkins