Embed Size (px)
Citation preview
The Ko�sice meteorite fall: Atmospheric trajectory, fragmentation, and orbit
Ji�r�ı BOROVI�CKA1*, Juraj T�OTH2, Antal IGAZ3, Pavel SPURN�Y1, Pavel KALENDA4,Jakub HALODA5, J�an SVORE �N6, Leonard KORNO�S2, Elizabeth SILBER7,8,
Peter BROWN7,8, and Marek HUS�ARIK6
1Astronomical Institute, Academy of Sciences of the Czech Republic, Ond�rejov, CZ-25165 Czech Republic2Faculty of Mathematics, Physics and Informatics, Comenius University, Mlynsk�a dolina, Bratislava, SK-84248 Slovakia
3Hungarian Astronomical Association, MCSE, Pf. 148, 1300 Budapest, Hungary4Institute of Rock Structure and Mechanics, Academy of Sciences of the Czech Republic, V Hole�sovi�ck�ach 41,
Praha 8, CZ-18209 Czech Republic5Czech Geological Survey, Geologick�a 6, Praha 5, CZ-15200 Czech Republic
6Astronomical Institute, Slovak Academy of Sciences, Tatransk�a Lomnica, SK-05960 Slovakia7Department of Physics and Astronomy, University of Western Ontario, London, Ontario N6A3K7, Canada
8Centre for Planetary Science and Exploration, University of Western Ontario, London, Ontario N6A 5B7, Canada*Corresponding author. E-mail: [email protected]
(Received 13 April 2012; revision accepted 17 November 2012)
Abstract–The Ko�sice meteorite fall occurred in eastern Slovakia on February 28, 2010, 22:25UT. The very bright bolide was imaged by three security video cameras from Hungary.Detailed bolide light curves were obtained through clouds by radiometers on seven camerasof the European Fireball Network. Records of sonic waves were found on six seismic andfour infrasonic stations. An atmospheric dust cloud was observed the next morning beforesunrise. After careful calibration, the video records were used to compute the bolidetrajectory and velocity. The meteoroid, of estimated mass of 3500 kg, entered theatmosphere with a velocity of 15 km s�1 on a trajectory with a slope of 60° to thehorizontal. The largest fragment ceased to be visible at a height of 17 km, where it wasdecelerated to 4.5 km s�1. A maximum brightness of absolute stellar magnitude about �18was reached at a height of 36 km. We developed a detailed model of meteoroid atmosphericfragmentation to fit the observed light curve and deceleration. We found that Ko�sice was aweak meteoroid, which started to fragment under the dynamic pressure of only 0.1 MPaand fragmented heavily under 1 MPa. In total, 78 meteorites were recovered in thepredicted fall area during official searches. Other meteorites were found by privatecollectors. Known meteorite masses ranged from 0.56 g to 2.37 kg. The meteorites wereclassified as ordinary chondrites of type H5 and shock stage S3. The heliocentric orbit had arelatively large semimajor axis of 2.7 AU and aphelion distance of 4.5 � 0.5 AU. Backwardnumerical integration of the preimpact orbit indicates possible large variations of the orbitalelements in the past due to resonances with Jupiter.
INTRODUCTION
A wealth of information can be obtained from thelaboratory analyses of meteorites. Special value is addedif the meteorite fall, i.e., the corresponding bolide, wasobserved instrumentally. This is because bolideobservations provide heliocentric orbits and can placemeteorites into their spatial context within the solar
system. At the same time, bolide measurementsdocument the atmospheric behavior of incomingmeteoroids, providing information on meteoroid bulkproperties, which may differ from the properties ofrecovered meteorites as meteorites represent thestrongest parts of the meteoroid.
Until recently, there were only a handful ofmeteorites with associated instrumental records of their
Meteoritics & Planetary Science 1–23 (2013)
doi: 10.1111/maps.12078
1 © The Meteoritical Society, 2013.

fall. That number has grown rapidly in the recent years,totaling approximately 15 as of 2011 (for detaileddescriptions of some recent cases, see Brown et al. 2011;Spurn�y et al. 2010, 2012). This is in contrast with tensof thousands of cataloged meteorite finds. A recentcompilation and analysis of instrumentally observedmeteorite falls can be found in Popova et al. (2011). Inparticular, that study provides a critical evaluation ofthe bulk strength of incoming meteoroids and showsthat the strength is usually much lower than thestrength of recovered meteorites, although there are bigvariations on a case-by-case basis.
In this paper, we present another piece to thegrowing mosaic of meteorites with known preimpactorbits. On February 28, 2010, a huge bolide appearedover eastern Slovakia. Although the European FireballNetwork (EN) and Slovak Video Network cover thiscountry, bad weather prevented direct imaging of thebolide by dedicated meteor cameras. Fortunately, threesurveillance video cameras in Hungary recorded, at leastpartly, the event. These records allowed us toreconstruct the trajectory of the bolide and recovermeteorites. In addition, the bolide light curve wasrecorded by several EN camera radiometers and seismicstations in the region registered the sonic booms.Infrasonic signatures of the bolide were found at severaldistant stations, at ranges up to 4000 km. Themeteorites were classified as ordinary chondrites of typeH5. The bolide data and the number of recoveredmeteorites show strong evidence for severe atmosphericfragmentation of the meteoroid.
In the next section, we will describe the sequence ofall events related to this bolide including meteoriterecoveries. We then describe the meteorite properties,followed by details of the bolide trajectory, velocity, andlight curve. Next, a model of meteoroid atmosphericflight and fragmentation based on the available data ispresented. Finally, we provide the heliocentric orbit ofthe meteoroid and discuss its possible orbital history.
OVERVIEW OF DATA, THEIR ANALYSIS, AND
SEARCHES FOR METEORITES
The evening of February 28, 2010, was cloudy andrainy in most of central Europe. There were clear skiesonly in the westernmost part of the Czech Republic andaround the southern part of German-Polish border.Slovakia and the surrounding areas were completelycloudy except for some cloud gaps in central Hungary.It was raining in Slovakia and the eastern part of theCzech Republic. Despite these unfavorable conditions,hundreds of people in Eastern Slovakia and Hungarynoticed an intense flash illuminating the countryside atabout 23:25 local time (22:25 UT). Even people inside
their homes and watching TV reported the flash. Atsome places, witnesses reported a cannon-like burst orseries of low frequency blasts a couple of minutes afterthe fireball.
The next morning, on March 1, the skies were clearin the eastern part of the Czech Republic. Severalpeople and several web cameras of the CzechHydrometeorological Institute located at widelyseparated sites photographed an unusual elongatedbluish cloud with fine structure (Fig. 1). The cloud wasvisible in the eastern sky before sunrise and moved fromEast to West, in the opposite direction of low-lyingclouds. It was photographed from sites as far west asPrague-Libu�s and Schl€agl, upper Austria (http://home.eduhi.at/member/nature/). These observations occurredsome 7 h after the fireball.
There was no doubt that a very bright bolideoccurred over Slovakia or Hungary that night. Therewas a full Moon on February 28 and the bolide wasevidently much brighter than the full Moon. Wereceived only one direct sighting of the bolide. MichalBare�s saw the beginning of the bolide low above the
Fig. 1. The atmospheric dust cloud photographed on themorning of March 1 (7 h after the bolide). The upper photowas taken by Du�san Veverka in Brno, the lower photo wastaken by Michael Kro�cil in Dukovany at 6:15 local time.Source: http://ukazy.astro.cz.
2 J. Borovi�cka et al.

eastern horizon from the city of Plze�n (Pilsen). Thebolide disappeared behind clouds and the main flarewas seen only indirectly as a cloud illumination.
The Czech and Slovak Republics are covered by theautonomous cameras of the European Fireball Network(Spurn�y et al. 2007). In Slovakia, cameras of the SlovakVideo Meteor Network (T�oth et al. 2011) are alsopresent. From all these cameras, only the camera atR�u�zov�a, located in the northwestern part of the CzechRepublic, had sufficiently clear skies and was exposingat the time of the bolide. Still, the majority of thebolide was hidden behind clouds close to the horizon.Moreover, the horizon was partly obscured by trees. Inany case, the camera did not image the bolide.
The fireball cameras are also equipped withradiometers measuring continuously the total brightnessof the sky with a sampling frequency of 500 Hz.Radiometers provide detailed light curves and precisetimings of bolides. They are in operation even undercloudy skies, provided that there is no rain or snow.Seven EN cameras recorded the bolide light curve. Thetwo best records are shown in Fig. 2. The Kucha�rovicecamera was located about 350 km from the bolide.Unfortunately, it was rainy at stations closer to thebolide.
The bolide attracted wide attention of people andthe news media in both Hungary and Slovakia. Severalvideo records from surveillance cameras appeared onthe Internet showing strong illumination of streets orparking lots caused by the bolide. Fortunately, within afew days (on March 1 and 3, respectively), two videorecords from Hungary showing part of the bolidebecame available. The first video was taken in €Ork�eny.
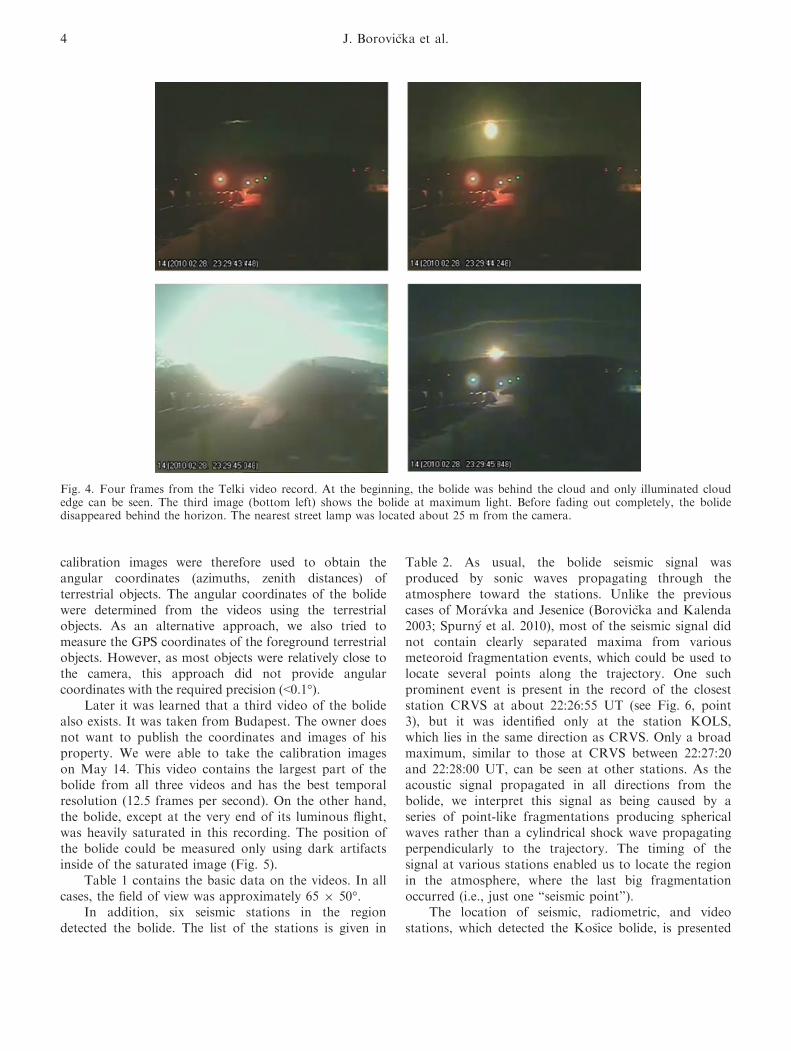
At the beginning, only the illumination of thecountryside was visible. The bolide then entered thecamera field of view and its final luminous stage couldbe seen close to the horizon (Fig. 3). In addition to themain body, one fragment lagging behind the main bodycould be measured on two frames. The second videowas taken in Telki. The bolide appeared from behindthe clouds. After a series of impressive flares, the fadingbolide disappeared behind a hill (Fig. 4). Both videosrecorded at five frames per second.
One of us (AI) visited the sites on March 5 and 6. Thevideo records were copied from the owners and high-resolution nighttime calibration images were taken fromclose to the positions of the video cameras by a CanonDSLR camera. The calibration images contained the sameterrestrial objects (lamps, buildings, trees) as the videorecords and a large number of stars in the sky. The videoswith the bolide contained no stars. The stars on the
Fig. 2. The radiometric light curves of the brightest part ofthe Ko�sice bolide from two independent stations, Kucha�rovice(16.086 E, 48.881 N) and Kun�zak (15.201 E, 49.108 N). Theinstrumental signal is given in linear scale.
Fig. 3. Three frames from the €Ork�eny video record. The topimage shows the scene just before the bolide. The middleframe shows the maximum illumination due to the bolide. Thebottom image shows the first frame where the bolide positioncould be measured, close to the street lamp on the upper left.The lamp was located about 30 m from the camera. In thefollowing frames, the bolide faded and disappeared to thelower left of the lamp. Note that the vertical scale ofthe images was compressed by a factor of two by therecording software.
Ko�sice meteorite trajectory, fragmentation, and orbit 3
calibration images were therefore used to obtain theangular coordinates (azimuths, zenith distances) ofterrestrial objects. The angular coordinates of the bolidewere determined from the videos using the terrestrialobjects. As an alternative approach, we also tried tomeasure the GPS coordinates of the foreground terrestrialobjects. However, as most objects were relatively close tothe camera, this approach did not provide angularcoordinates with the required precision (<0.1°).
Later it was learned that a third video of the bolidealso exists. It was taken from Budapest. The owner doesnot want to publish the coordinates and images of hisproperty. We were able to take the calibration imageson May 14. This video contains the largest part of thebolide from all three videos and has the best temporalresolution (12.5 frames per second). On the other hand,the bolide, except at the very end of its luminous flight,was heavily saturated in this recording. The position ofthe bolide could be measured only using dark artifactsinside of the saturated image (Fig. 5).
Table 1 contains the basic data on the videos. In allcases, the field of view was approximately 65 9 50°.
In addition, six seismic stations in the regiondetected the bolide. The list of the stations is given in
Table 2. As usual, the bolide seismic signal wasproduced by sonic waves propagating through theatmosphere toward the stations. Unlike the previouscases of Mor�avka and Jesenice (Borovi�cka and Kalenda2003; Spurn�y et al. 2010), most of the seismic signal didnot contain clearly separated maxima from variousmeteoroid fragmentation events, which could be used tolocate several points along the trajectory. One suchprominent event is present in the record of the closeststation CRVS at about 22:26:55 UT (see Fig. 6, point3), but it was identified only at the station KOLS,which lies in the same direction as CRVS. Only a broadmaximum, similar to those at CRVS between 22:27:20and 22:28:00 UT, can be seen at other stations. As theacoustic signal propagated in all directions from thebolide, we interpret this signal as being caused by aseries of point-like fragmentations producing sphericalwaves rather than a cylindrical shock wave propagatingperpendicularly to the trajectory. The timing of thesignal at various stations enabled us to locate the regionin the atmosphere, where the last big fragmentationoccurred (i.e., just one “seismic point”).
The location of seismic, radiometric, and videostations, which detected the Ko�sice bolide, is presented
Fig. 4. Four frames from the Telki video record. At the beginning, the bolide was behind the cloud and only illuminated cloudedge can be seen. The third image (bottom left) shows the bolide at maximum light. Before fading out completely, the bolidedisappeared behind the horizon. The nearest street lamp was located about 25 m from the camera.
4 J. Borovi�cka et al.

in Fig. 7. Initially, it was not clear whether the bolideoccurred over Slovakia or Hungary. The firstpreliminary reduction (by JB) of the two video recordswas finished on March 11. It revealed that the bolideflew over the territory of Slovakia, on a steep trajectory,nearly from the West to the East. The last visiblefragment terminated its light a few kilometers west fromthe village of Vy�sn�y Kl�atov, at a height of about 17 km.The meteorite fall was restricted to the region betweenVy�sn�y Kl�atov and Kave�cany, an area of about6 9 3 km size. The analysis of seismic data, finished afew days later (by PK), confirmed this general picture.
In between, on March 12, 2010, JT and LK visiteda number of villages in the region and interviewedabout 30 witnesses. These interviews showed thateverybody who was up at the time of the bolide saw a
very bright light from inside the house and heard noiselike thunder or an airplane. One man from �Saca (13 kmSSW from Vy�sn�y Kl�atov) saw the light, opened thewindow, and heard a thunder-like noise about 15–20 safter the light. The noise consisted of 4 discrete eventslike drum beats. After the first one, there was a pauseof about 2–3 s, then three beats 1 s each, and finally acannonade.
There were no reports of direct meteorite hits oraccidental finds. The area was covered by fresh snow atthat time and was not suitable for searches (the groundwas mostly without snow on February 28, 2010although some remnants of snow were probably presentat that time). The first search was organized on March20, 2010, after most of the snow melted again. Twoteams (led by JS and JT, respectively) of 13 people intotal started their search on a meadow near Vy�sn�yKl�atov. The first meteorite, 27 g of mass (Fig. 8), wasfound by JT after only 45 min of searching by thesecond team. Altogether, 13 meteorites were found intwo days. Other searches were organized the next weekwith the participation of Czech and Hungariancolleagues. The largest meteorite (Fig. 9) was recoveredby T. Krej�cov�a on March 25 on small meadow onmuddy-grass terrain. As of March 28, 2010, 63meteorites were recovered with masses ranging from0.56 g to 2.17 kg. One 3 g sample was analyzed by JHand was classified as an H5 ordinary chondrite. OnMarch 31, a press conference was held in Tatransk�aLomnica, where the meteorite recoveries wereannounced to media. Details of the strewn field werenot released. According to Slovak laws, collectingmeteorites is allowed only by state or academicinstitutions from the Slovak Republic. Several further
Fig. 5. Four partial frames from the Budapest video record.The bottom half of the images were removed to respect thewish of the author of the video. The top image showsthe bolide entering the field of view above the nearest lamp.The second image was taken during the maximum light.At the third image, the camera gain was lowered by theautomatics (compare the images of lamps). The final imageshows the fading bolide split into fragments above thehorizon. Above the fragments, meteor train is shining at theposition of an earlier flare. The nearest street lamp waslocated about 20 m from the camera.
Fig. 6. Seismic record from station CRVS (Z-component).Data were sampled with the frequency of 100 Hz. To enhancethe high frequency content, accelerations computed from pointto point are shown. The first three distinct signal arrivals aremarked by numbers 1–3, while the main, very broad signal ismarked by 4. All marked signals are well above the noiselevel, as confirmed by comparing to more than 10 min of therecord around the time of the bolide.
Ko�sice meteorite trajectory, fragmentation, and orbit 5
searches were organized by the Astronomical Instituteof the Slovak Academy of Sciences and the ComeniusUniversity Bratislava (the same organizers as previoussearches) in April, August, and October, 2010. As aresult of these searches, the number of recoveredmeteorites increased to 77 with a total mass of 4.3 kg.Nevertheless, in 2011 we learned that a number of othermeteorites, including a 2.37 kg piece, were found byprivate collectors from abroad and illegally taken out ofSlovakia. One additional search was performed inOctober 2011 using metal detectors. One 6.5 g meteoritewas found. Additional privately found meteorites werereported in 2012.
The strewn field is located only 5 km from theedges of the major Slovakian town Ko�sice but is mostlyunpopulated. The 78 meteorites recovered in the officialsearches and 140 privately found meteorites, for whichwe received masses and coordinates, occupy an areamore than 5 km long and more than 3 km wide. Thearea consists of ridges and valleys, sometimes with steepslopes. The altitudes range from 300 to 600 m above sealevel. About 90% of the strewn field is covered byforest, mostly of beech trees. Most of the remainingpart is covered by meadows. Only one small settlement,Alp�ınka, lies inside the strewn field (the villages Vy�sn�yKl�atov and Kave�cany are just outside). Alp�ınka islocated in a valley, near the road from Ko�sice toMargecany—the only significant road inside the strewnfield. The whole area is used for recreation. There is agolf course near Alp�ınka and the sport and ski centerJahodn�a lies just north from the strewn field. An
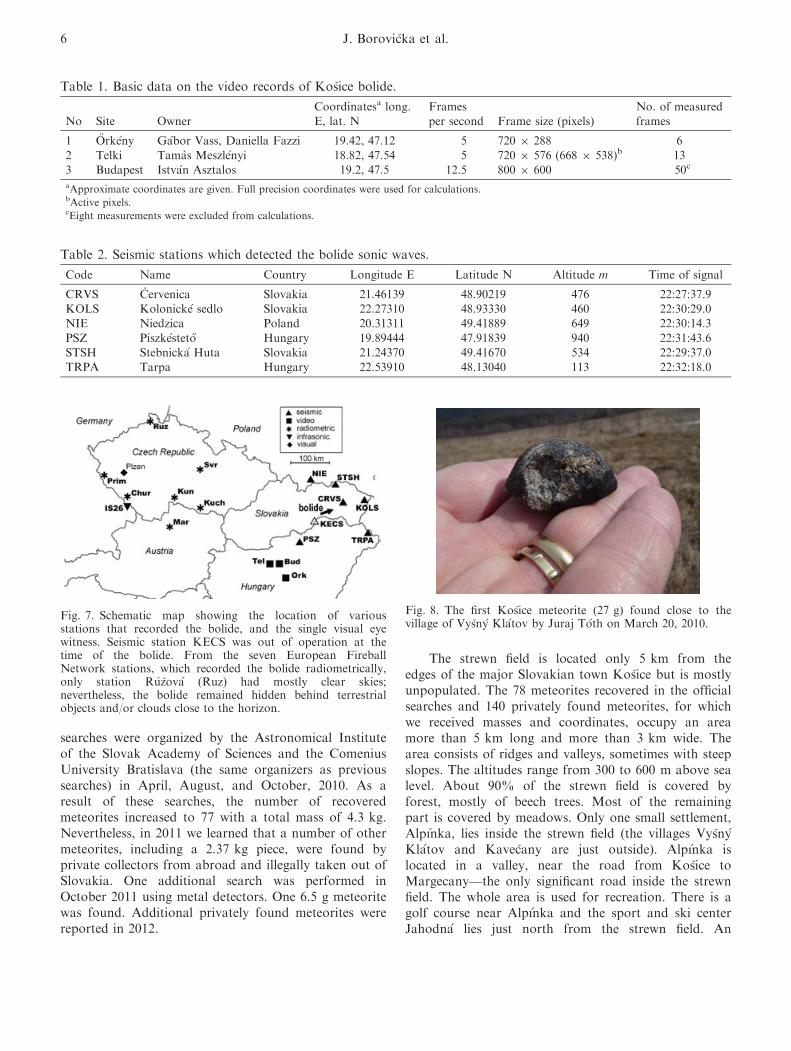
Table 2. Seismic stations which detected the bolide sonic waves.
Code Name Country Longitude E Latitude N Altitude m Time of signal
CRVS �Cervenica Slovakia 21.46139 48.90219 476 22:27:37.9KOLS Kolonick�e sedlo Slovakia 22.27310 48.93330 460 22:30:29.0NIE Niedzica Poland 20.31311 49.41889 649 22:30:14.3
PSZ Piszk�estet}o Hungary 19.89444 47.91839 940 22:31:43.6STSH Stebnick�a Huta Slovakia 21.24370 49.41670 534 22:29:37.0TRPA Tarpa Hungary 22.53910 48.13040 113 22:32:18.0
Fig. 7. Schematic map showing the location of variousstations that recorded the bolide, and the single visual eyewitness. Seismic station KECS was out of operation at thetime of the bolide. From the seven European FireballNetwork stations, which recorded the bolide radiometrically,only station R�u�zov�a (Ruz) had mostly clear skies;nevertheless, the bolide remained hidden behind terrestrialobjects and/or clouds close to the horizon.
Table 1. Basic data on the video records of Ko�sice bolide.
No Site OwnerCoordinatesa long.E, lat. N
Framesper second Frame size (pixels)
No. of measuredframes
1 €Ork�eny G�abor Vass, Daniella Fazzi 19.42, 47.12 5 720 9 288 6
2 Telki Tam�as Meszl�enyi 18.82, 47.54 5 720 9 576 (668 9 538)b 133 Budapest Istv�an Asztalos 19.2, 47.5 12.5 800 9 600 50c
aApproximate coordinates are given. Full precision coordinates were used for calculations.bActive pixels.cEight measurements were excluded from calculations.
Fig. 8. The first Ko�sice meteorite (27 g) found close to thevillage of Vy�sn�y Kl�atov by Juraj T�oth on March 20, 2010.
6 J. Borovi�cka et al.
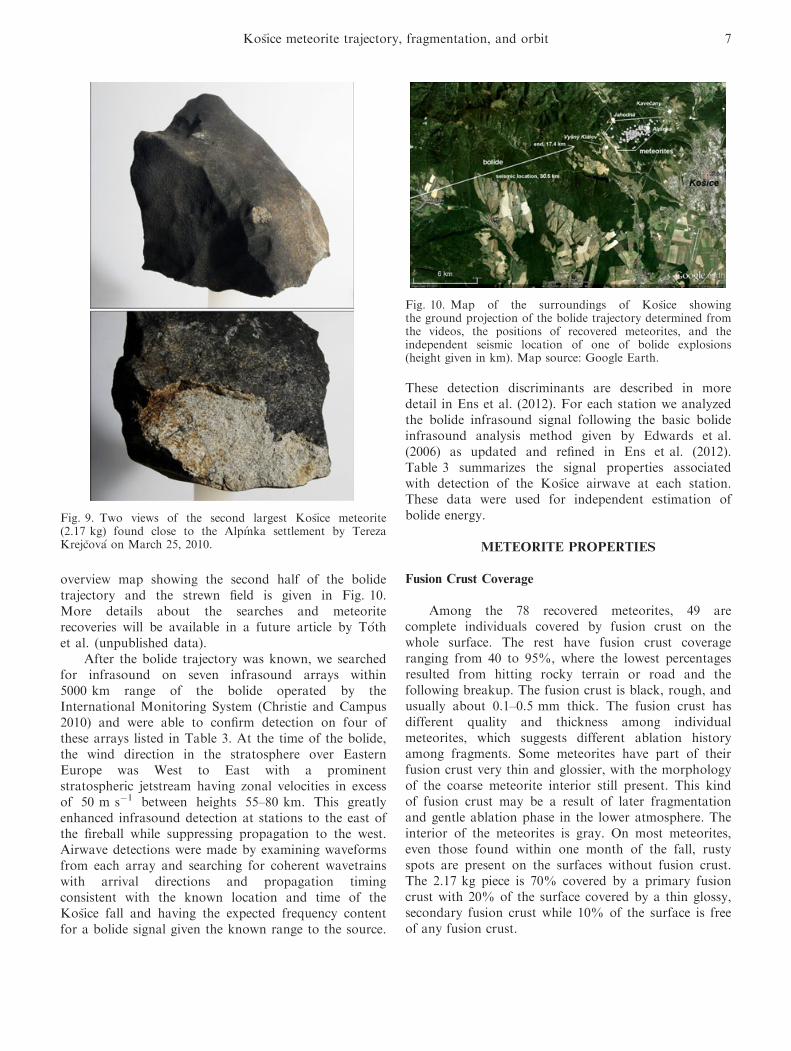
overview map showing the second half of the bolidetrajectory and the strewn field is given in Fig. 10.More details about the searches and meteoriterecoveries will be available in a future article by T�othet al. (unpublished data).
After the bolide trajectory was known, we searchedfor infrasound on seven infrasound arrays within5000 km range of the bolide operated by theInternational Monitoring System (Christie and Campus2010) and were able to confirm detection on four ofthese arrays listed in Table 3. At the time of the bolide,the wind direction in the stratosphere over EasternEurope was West to East with a prominentstratospheric jetstream having zonal velocities in excessof 50 m s�1 between heights 55–80 km. This greatlyenhanced infrasound detection at stations to the east ofthe fireball while suppressing propagation to the west.Airwave detections were made by examining waveformsfrom each array and searching for coherent wavetrainswith arrival directions and propagation timingconsistent with the known location and time of theKo�sice fall and having the expected frequency contentfor a bolide signal given the known range to the source.
These detection discriminants are described in moredetail in Ens et al. (2012). For each station we analyzedthe bolide infrasound signal following the basic bolideinfrasound analysis method given by Edwards et al.(2006) as updated and refined in Ens et al. (2012).Table 3 summarizes the signal properties associatedwith detection of the Ko�sice airwave at each station.These data were used for independent estimation ofbolide energy.
METEORITE PROPERTIES
Fusion Crust Coverage
Among the 78 recovered meteorites, 49 arecomplete individuals covered by fusion crust on thewhole surface. The rest have fusion crust coverageranging from 40 to 95%, where the lowest percentagesresulted from hitting rocky terrain or road and thefollowing breakup. The fusion crust is black, rough, andusually about 0.1–0.5 mm thick. The fusion crust hasdifferent quality and thickness among individualmeteorites, which suggests different ablation historyamong fragments. Some meteorites have part of theirfusion crust very thin and glossier, with the morphologyof the coarse meteorite interior still present. This kindof fusion crust may be a result of later fragmentationand gentle ablation phase in the lower atmosphere. Theinterior of the meteorites is gray. On most meteorites,even those found within one month of the fall, rustyspots are present on the surfaces without fusion crust.The 2.17 kg piece is 70% covered by a primary fusioncrust with 20% of the surface covered by a thin glossy,secondary fusion crust while 10% of the surface is freeof any fusion crust.
Fig. 10. Map of the surroundings of Ko�sice showingthe ground projection of the bolide trajectory determined fromthe videos, the positions of recovered meteorites, and theindependent seismic location of one of bolide explosions(height given in km). Map source: Google Earth.
Fig. 9. Two views of the second largest Ko�sice meteorite(2.17 kg) found close to the Alp�ınka settlement by TerezaKrej�cov�a on March 25, 2010.
Ko�sice meteorite trajectory, fragmentation, and orbit 7
Petrography, Texture, Mineral Chemistry, and
Classification
One polished thin section (21 9 13 mm) wasprepared from meteorite piece no. 15 (3 g). Textural andmineralogical characteristics were studied using a LEICADMLP petrographic microscope. Mineral compositionswere determined using quantitative X-ray wavelengthdispersive spectral analysis on a MICROSPEC 3PCWavelength dispersive X-ray spectroscopy (WDS) systemon a CamScan 3200 scanning electron microscope (SEM)at the Czech Geological Survey. The analyses wereperformed using an accelerating voltage of 15 kV, 20 nAbeam current, 1 lm beam size, and ZAF correctionprocedures for silicate minerals. Analysis of metal grainsand sulfides were performed by using an acceleratingvoltage of 20 kV, 24 nA beam current, 1 lm beam size,and ZAF correction procedures. The counting timeswere 20 or 30 s for all analyzed elements. To avoid Navolatilization during the analysis of glass and plagioclase,the beam size was increased to 5 lm. Combinations ofnatural and synthetic standards were used forcalibration.
The interior of the studied meteorite is fresh lightgray with small brownish veins and taints containingproducts of terrestrial weathering visible on the surface.This is due to slight weathering processes, as the
meteorite was found about three weeks after the fall.Moreover, this meteorite fell close to the road and wasaffected by salt used to melt snow. The meteoriteweathering grade is W0. The chondrules, of around 0.5–1.5 mm in size, are barely visible to the naked eye onthe fresh surface.
The thin section shows a highly recrystallized fine-grained granular texture. Chondrule texture is commonlyindistinct and only parts of the chondrules are clearlyvisible. These observations indicate a relatively highmetamorphic grade for the Ko�sice chondrite.
Olivine grains show sets of planar fractures andobvious undulose extinction. The observed feldspar doesnot show planar fractures, however, displays alsoobvious undulose extinction. The features showing thepresence of maskelynite domains within feldspar werenot found. All these features and the presence ofopaque veins of shock melt and melt pockets indicatestage S3 of shock metamorphism and shock pressures of15–20 GPa (St€offler et al. 1991).
Olivine forms a substantial part of this meteorite.Individual olivine grains and olivine in chondrules showvery homogeneous chemical composition with lowvariations typically between Fa18.1–21.5 with an averagevalue of Fa19.3 (n = 33). Zoning of individual olivinegrains was not observed and this fact reflects a higherstage of thermal metamorphism. The low-Ca pyroxene
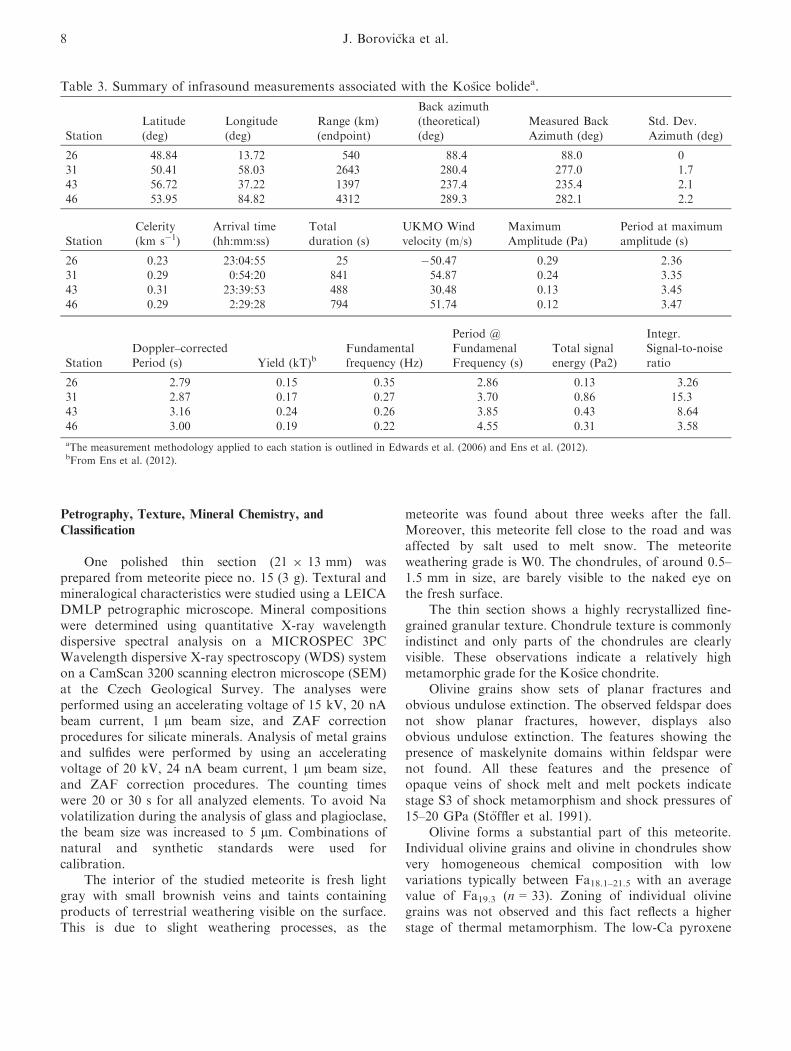
Table 3. Summary of infrasound measurements associated with the Ko�sice bolidea.
Station
Latitude
(deg)
Longitude
(deg)
Range (km)
(endpoint)
Back azimuth(theoretical)
(deg)
Measured Back
Azimuth (deg)
Std. Dev.
Azimuth (deg)
26 48.84 13.72 540 88.4 88.0 031 50.41 58.03 2643 280.4 277.0 1.743 56.72 37.22 1397 237.4 235.4 2.1
46 53.95 84.82 4312 289.3 282.1 2.2
Station
Celerity
(km s�1)
Arrival time
(hh:mm:ss)
Total
duration (s)
UKMO Wind
velocity (m/s)
Maximum
Amplitude (Pa)
Period at maximum
amplitude (s)
26 0.23 23:04:55 25 �50.47 0.29 2.3631 0.29 0:54:20 841 54.87 0.24 3.3543 0.31 23:39:53 488 30.48 0.13 3.45
46 0.29 2:29:28 794 51.74 0.12 3.47
Station
Doppler–correctedPeriod (s) Yield (kT)b
Fundamental
frequency (Hz)
Period @Fundamenal
Frequency (s)
Total signal
energy (Pa2)
Integr.Signal-to-noise
ratio
26 2.79 0.15 0.35 2.86 0.13 3.2631 2.87 0.17 0.27 3.70 0.86 15.343 3.16 0.24 0.26 3.85 0.43 8.64
46 3.00 0.19 0.22 4.55 0.31 3.58
aThe measurement methodology applied to each station is outlined in Edwards et al. (2006) and Ens et al. (2012).bFrom Ens et al. (2012).
8 J. Borovi�cka et al.
composition ranges from Fs16–19.5 with an average valueof Fs17.2 (n = 33). The Wo content of low-Ca pyroxenesvaries between Wo0.8–1.2. The Fa content in olivineobviously matches the Fs content of low-Ca pyroxenefor the H-type chondrites. The high-Ca pyroxene grainsare usually associated with plagioclase as well as olivine.The composition of high-Ca pyroxenes is veryhomogeneous, typically (En48Wo46Fs06). The plagioclasegrains are obviously associated with high-Ca pyroxenegrains with average composition of Ab82An12Or06.Kamacite and taenite were also analyzed in Ko�sicemeteorite. The characteristic Ni content of kamacite isabout 4.8 wt% Ni and for taenite varies in wider rangeof 45–52 wt% Ni. Accessory minerals of this meteoritecomprise chromite, chlorapatite, merrillite, troilite, andpentlandite.
In summary, the Ko�sice meteorite shows all thetypical mineralogical features of H chondrites withbroad recrystallization and homogeneity of mineralchemical composition reflecting the high stage ofthermal metamorphism corresponding to thepetrographic type 5. Based on these data the Ko�sicemeteorite can be classified as type H5.
Meteorites no. 20 (22 g) and no. 58 (6 g) were laterselected for detailed mineralogical analyses done by D.Ozd�ın and P. Uher (unpublished data). The bulk densitiesof meteorites were measured by Kohout et al.(Forthcoming). The average value is 3420 kg m�3.Elemental abundances were measured by Plav�can et al.(unpublished data).
BOLIDE TRAJECTORY, VELOCITY, AND LIGHT
CURVE
In this section we give the final bolide trajectoryand velocity, as they were determined from the analysisof the three video records. We also provide the lightcurve based on the radiometric records.
Trajectory
The bolide trajectory was computed by the leastsquares method of Borovi�cka (1990) using the data fromthe three casual video records. The method takes eachobserved position of the bolide (azimuth and zenithdistance) as a line of sight drawn from the observing sitetoward the fireball path on the plane of the sky andcomputes the bolide trajectory as the straight line in 3-Dspace which minimizes the distances to all the lines ofsight from all stations. In performing this trajectorysolution we made use of all kinds of bolide positions—the positions of the main body, of the fragment visibletoward the end of the trajectory and of the train visiblefor a fraction of second after the bolide flare.
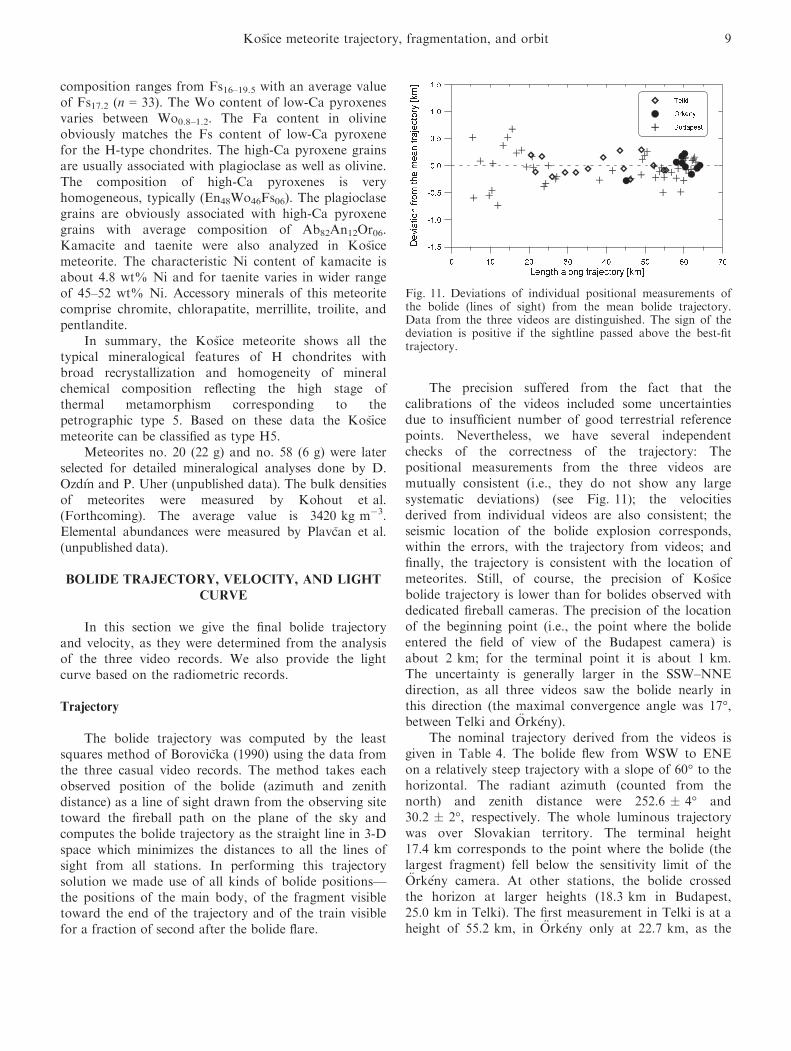
The precision suffered from the fact that thecalibrations of the videos included some uncertaintiesdue to insufficient number of good terrestrial referencepoints. Nevertheless, we have several independentchecks of the correctness of the trajectory: Thepositional measurements from the three videos aremutually consistent (i.e., they do not show any largesystematic deviations) (see Fig. 11); the velocitiesderived from individual videos are also consistent; theseismic location of the bolide explosion corresponds,within the errors, with the trajectory from videos; andfinally, the trajectory is consistent with the location ofmeteorites. Still, of course, the precision of Ko�sicebolide trajectory is lower than for bolides observed withdedicated fireball cameras. The precision of the locationof the beginning point (i.e., the point where the bolideentered the field of view of the Budapest camera) isabout 2 km; for the terminal point it is about 1 km.The uncertainty is generally larger in the SSW–NNEdirection, as all three videos saw the bolide nearly inthis direction (the maximal convergence angle was 17°,between Telki and €Ork�eny).
The nominal trajectory derived from the videos isgiven in Table 4. The bolide flew from WSW to ENEon a relatively steep trajectory with a slope of 60° to thehorizontal. The radiant azimuth (counted from thenorth) and zenith distance were 252.6 � 4° and30.2 � 2°, respectively. The whole luminous trajectorywas over Slovakian territory. The terminal height17.4 km corresponds to the point where the bolide (thelargest fragment) fell below the sensitivity limit of the€Ork�eny camera. At other stations, the bolide crossedthe horizon at larger heights (18.3 km in Budapest,25.0 km in Telki). The first measurement in Telki is at aheight of 55.2 km, in €Ork�eny only at 22.7 km, as the
Fig. 11. Deviations of individual positional measurements ofthe bolide (lines of sight) from the mean bolide trajectory.Data from the three videos are distinguished. The sign of thedeviation is positive if the sightline passed above the best-fittrajectory.
Ko�sice meteorite trajectory, fragmentation, and orbit 9
bolide was too bright to be measured earlier. The train,however, could be measured at a height of 34 km from€Ork�eny.
The seismic location was computed from the timesof arrival of the strongest signal to the seismic stations(see Table 2), using the known time of bolide maximumand the average speed of sound between the heights ofapproximately 30 km and the ground, as computedfrom the actual meteorological measurements. Theresulting position was corrected for the drift caused byhigh altitude winds. The correction was 1 km to thewest and 0.35 km to the north. The final position is20.981°E, 48.714°N, h = 30.5 km with a precision of�2 km. This point lies 1.4 km from the nominal videotrajectory. The two solutions are therefore consistentwithin the postulated errors.
Velocity
The bolide positional measurements on individualvideo frames projected onto the derived trajectorydefine the position (length) along the trajectory as afunction of time. The length was counted from the firstmeasurement on the Budapest video. The video framerates (5 Hz for Telki and €Ork�eny, 12.5 Hz forBudapest) define the relative time scale for each video.To take all videos together, the offset of their timescales had to be determined. This was done byminimizing the time differences for a given length.Finally, the relative time was converted to absolute timeby adjusting the Budapest light curve to the radiometriclight curve (see below). The absolute timing ofradiometers is better than 5 ms. The computer time iscorrected by the PPS signal from the GPS receiver.
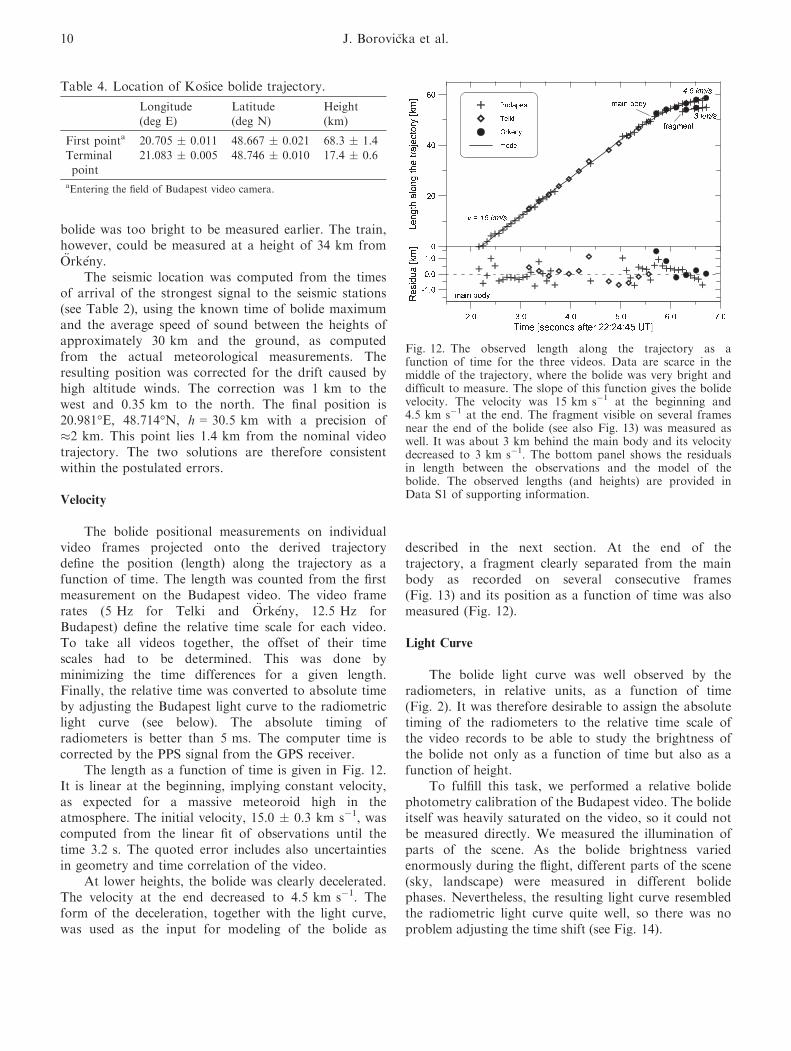
The length as a function of time is given in Fig. 12.It is linear at the beginning, implying constant velocity,as expected for a massive meteoroid high in theatmosphere. The initial velocity, 15.0 � 0.3 km s�1, wascomputed from the linear fit of observations until thetime 3.2 s. The quoted error includes also uncertaintiesin geometry and time correlation of the video.
At lower heights, the bolide was clearly decelerated.The velocity at the end decreased to 4.5 km s�1. Theform of the deceleration, together with the light curve,was used as the input for modeling of the bolide as
described in the next section. At the end of thetrajectory, a fragment clearly separated from the mainbody as recorded on several consecutive frames(Fig. 13) and its position as a function of time was alsomeasured (Fig. 12).
Light Curve
The bolide light curve was well observed by theradiometers, in relative units, as a function of time(Fig. 2). It was therefore desirable to assign the absolutetiming of the radiometers to the relative time scale ofthe video records to be able to study the brightness ofthe bolide not only as a function of time but also as afunction of height.
To fulfill this task, we performed a relative bolidephotometry calibration of the Budapest video. The bolideitself was heavily saturated on the video, so it could notbe measured directly. We measured the illumination ofparts of the scene. As the bolide brightness variedenormously during the flight, different parts of the scene(sky, landscape) were measured in different bolidephases. Nevertheless, the resulting light curve resembledthe radiometric light curve quite well, so there was noproblem adjusting the time shift (see Fig. 14).
Table 4. Location of Ko�sice bolide trajectory.
Longitude(deg E)
Latitude(deg N)
Height(km)
First pointa 20.705 � 0.011 48.667 � 0.021 68.3 � 1.4
Terminalpoint
21.083 � 0.005 48.746 � 0.010 17.4 � 0.6
aEntering the field of Budapest video camera.
Fig. 12. The observed length along the trajectory as afunction of time for the three videos. Data are scarce in themiddle of the trajectory, where the bolide was very bright anddifficult to measure. The slope of this function gives the bolidevelocity. The velocity was 15 km s�1 at the beginning and4.5 km s�1 at the end. The fragment visible on several framesnear the end of the bolide (see also Fig. 13) was measured aswell. It was about 3 km behind the main body and its velocitydecreased to 3 km s�1. The bottom panel shows the residualsin length between the observations and the model of thebolide. The observed lengths (and heights) are provided inData S1 of supporting information.
10 J. Borovi�cka et al.

The absolute calibration of the signal was doneusing the Kun�zak camera; this is the same camerawhich recorded the Martin and Jesenice bolides undersimilar conditions during the full Moon period (seeSpurn�y et al. 2010). Similarly as for Jesenice, theMartin fireball was used for calibration. We computedthe range and zenith distance of the bolide as seenfrom Kun�zak as a function of time. The range wasbetween 416–433 km. The zenith distance was between82.5–89.7° for bolide heights 68–17.5 km. The observedsignal was corrected for instrumental response of theradiometer as a function of zenith angle (measured inthe laboratory) and for bolide range. Furthermore, wecomputed the standard atmospheric extinction as afunction of zenith distance. As part of the light isalways scattered by the upper atmosphere, there is anonnegligible signal even if the source lies on or belowthe horizon. This feature could not be exactlycalibrated but after some trials we estimated that thesignal at the horizon is 0.5% of that in zenith for oursystem.
There is a significant difference between the Martinand Ko�sice bolides in that Martin was detected underclear sky while Ko�sice was detected under a completelycloudy sky in Kun�zak. Nevertheless, the radiometer isalways adjusted to the same signal level during the nightby modifying the high voltage of the photomultiplier.The signal of the bolide is compared with thebackground signal, which was defined by the full Moonin this case. We therefore decided to ignore thedifference between the clear and cloudy night, assumingthat the Moon and the bolide were affected in acomparable way.
The resulting calibrated light curve is shown inFig. 15 together with the modeled light curve (see thenext section). The maximum absolute magnitude of �18was reached at 22:24:49.7 when the bolide was at aheight of 36 km. Owing to the extremely difficultcalibration of the radiometric signal in this case, theabsolute magnitude scale is uncertain by at least onestellar magnitude.
MODEL OF METEOROID ATMOSPHERIC
FRAGMENTATION
The observed light curve and deceleration of the bolidewas used to estimate the initial mass of the meteoroid andits fragmentation history in the atmosphere. The model alsoenabled us to restrict the expected masses and locations offragments reaching the ground and compare them with theactual meteorite recoveries.
The model is based on the fact that meteoroidfragmentation leads to a sudden increase in bolidebrightness, because the total meteoroid surface areaincreases after the fragmentation. A bright flare is
Fig. 13. Part of video frames from Budapest and €Ork�enyclearly showing a fragment separated from the main body inthe final stages of the bolide.
Fig. 14. The rough bolide light curve constructed from theBudapest video was compared with the Kun�zak radiometricsignal. The vertical scale of both curves was shifted to nearlymatch (but the video response was nonlinear due tosaturation). The time scale of the video was adjusted using thefeatures on the light curve.
Fig. 15. The calibrated light curve from the Kun�zakradiometer and the modeled light curve. The observed lightcurve was smoothed by averaging 10 consecutivemeasurements. The height of the bolide in km is given nearsome of the light curve features. The observed light curve isprovided in Data S1.
Ko�sice meteorite trajectory, fragmentation, and orbit 11
produced if a large number of small fragments or dustparticles are released. In contrast to similar modeling weperformed for the Jesenice bolide (Spurn�y et al. 2010),we did not use the schematic shape of the flares but wetried to model the whole light curve more rigorously bysetting up the mass distribution of fragments and/ordust particles released at each fragmentation point. Thedust particles were allowed to be released eitherinstantaneously or gradually, using the meteoroiderosion concept we originally developed for smallmeteoroids (Borovi�cka et al. 2007). The ablation andradiation of individual particles were computedindependently and the summed light curve thencomputed.
The model is a trial-and-error fit of the light curve.We tried to reproduce the major features of the lightcurve by adjusting the times of fragmentation and thenumbers and masses of fragments and dust particles.The deceleration at the end of the trajectory was takeninto account as well. This approach gives us an ideaabout the strength and structure of the originalmeteoroid but surely does not provide an exhaustivedescription of all existing fragments.
Parameters of the Model
The model is based on the standard single-bodytheory of meteoroid ablation, deceleration, andradiation. The single-body model was applied to eachfragment from its birth in the fragmentation of its parentfragment to its own subsequent fragmentation or untilthe velocity decreased below the ablation limit (set at2.5 km s�1). The equations of the single-body theory aregiven in Ceplecha et al. (1998, pp. 348–350). The initialvalues for each fragment are the time, height, velocity,slope of the trajectory, mass, ablation coefficient, andshape-density coefficient (combination of dragcoefficient, shape coefficient, and bulk density). Theintegral solution of the single-body theory we usedrequired that the ablation coefficient and shape-densitycoefficient were kept constant for the entire flight of anyfragment. We assumed that all fragments follow the sametrajectory given in Table 4, with the slope of 60° to thehorizontal. The trajectory was assumed to be straight butthe Earth curvature was taken into account. Atmosphericdensities were taken from the CIRA72 atmosphericmodel. To reduce the number of free parameters we usedthe same ablation coefficient of 0.005 s2 km�2 and thesame bulk density of 3400 kg m�3 for all fragments. Thevalue of bulk density was known from meteoritemeasurements. The value of the ablation coefficient waschosen in accordance with previous studies of theablation of fragments between the fragmentation events(Borovi�cka and Kalenda 2003; Ceplecha and ReVelle
2005). The precision of the deceleration measurementswas not sufficient for an independent computation of theablation coefficient. The value of ΓA (drag coefficienttimes the shape coefficient) was set to 1.0 for the initialmeteoroid high in the atmosphere, 0.8 for fragments bornat medium heights (60–30 km), and 0.7 for fragmentsborn at lower height to account for the decreasing drag inthe denser atmosphere due to the formation of aprotective layer of compressed air in front of thefragments. This decrease was also discussed by Borovi�ckaand Kalenda (2003).
For computing the light curve, the value of thedifferential luminous efficiency, τ, i.e., the fraction ofinstantaneous loss of meteoroid kinetic energy (due toboth deceleration and mass loss) converted intoradiation, must be given. Luminous efficiency is a poorlyknown quantity depending on meteoroid velocity, mass,and perhaps on other quantities. We assumed that τ isdirectly proportional to velocity. As for massdependency, ReVelle and Ceplecha (2001) found thatthere is a steep increase in τ at masses of about 1 kg. Thetypical luminous efficiency for large stony bodies (type Ibolides) was found to be about 5%. For small bodies(gram masses) it was up to 10 times lower. We assumedτ to approach 5% for very large masses (approximately1000 kg) at velocity of 15 km s�1. The lower limit ofτ was important when modeling radiation of smallfragments and dust particles. We were unable to fit theobserved flares with very low values of τ. We had to setthe lower limit at 2.5%. It is possible that values ofτ smaller than 1% are applicable for small meteoroidshigh in the atmosphere but larger values are valid for thesame masses at lower heights, when they separate fromlarger bodies.
Following ReVelle and Ceplecha (2001) we usednatural logarithm and hyperbolic tangent functions tocompute τ:
lns ¼ �1:45þ lnvþ 0:35tanhð0:38lnmÞ; (1)
where v is velocity in km s�1 and m is mass in kg; τ isin percent of kinetic energy loss. In converting radiatedenergy into meteor magnitudes we used the zero-visual-magnitude meteor energy of 1500 watts, valid for theusual vapor temperature of 4500 K (Ceplecha et al.1998, p. 365). At 15 km s�1, τ is 2.5% for 1 g or less,2.75% for 100 g, 3.5% for 1 kg, 4.5% for 10 kg, and5% for 1000 kg or more.
Our mass-dependence term is very similar to that ofCeplecha and ReVelle (2005); nevertheless, the absolutevalues of the intrinsic luminous efficiency coefficientintroduced by Ceplecha and ReVelle (2005) are about3–4 times smaller than in ReVelle and Ceplecha (2001)and do not exceed 1.5% for approximately 100 kg
12 J. Borovi�cka et al.

bodies. Nevertheless, values of τ of about 4% werefound by a single-body analysis of the MORP 219fireball by Gritsevich and Koschny (2011). MORP 219is the only fireball in their sample of three fireballs withrelatively low ablation coefficient, which means it wasnot significantly affected by fragmentation and hencethe single-body analysis may be justified. Note thatCeplecha and ReVelle (2005) assumed that luminousefficiency is also a function of meteor position (relativeto maximum light or trail beginning). We did not needsuch an assumption.
Fragmentation Modes
In our model, fragmentation means that the massof a meteoroid is suddenly converted into one or moreof the following objects:1. Individual daughter fragments of smaller mass. The
mass and physical parameters (ablation coefficient, bulkdensity, ΓA) of each fragment are specified and thefragments are then followed according to single-bodytheory.
2. A group of fragments of the same mass andphysical parameters. This option is similar to theprevious one. Further development is computedonly once and the resulting radiation intensity ismultiplied by the number of fragments. Of course,this approach is an idealization because in realitynot all fragments will be exactly the same. But thecomplexity of the model and computationaldemands are reduced this way.
3. Dust, i.e., a large number of small particles. Thephysical parameters of all particles are assumed tobe the same. Their masses may be either the sameor there is a mass range specified. The former caseis equivalent to the option 2 (group of fragments).The only difference is that the user specifies thetotal mass of the dust, not the number offragments. In the latter case, the lower and uppermass limit and mass distribution index are specified.The code then sorts the particles into mass bins (10bins per order of magnitude of mass) and computesthe number of particles in each bin. Furtherdevelopment for each mass is computed once andthe output light is multiplied by number of particlesin the bin.
4. Eroding fragment or, in other words, a clump ofdust. In this case the dust particles are not releasedand do not start to ablate immediately at thefragmentation point. Instead, they are held togetherin one fragment at the beginning and then releasedgradually. To describe this process, the formalism ofmeteor erosion (Borovi�cka et al. 2007) is used. Thefragment is subject not only to ablation, governed
by ablation coefficient, r, but also to erosion, i.e.,loss of mass in the form of solid particles, governedby the erosion coefficient, g, which has the sameunits as r (s2 km�2 or, equivalently, kg MJ�1) butis larger. At each time step, the mass of releaseddust and the number of particles in each mass binare computed. The procedure is repeated until thefragment is eroded away completely. The ablationand radiation are then computed for each mass binand for each time of release.The initial height and velocity of each fragment or
dust particle are given by the height and velocity oftheir parent fragment at the moment of release. Thesummary mass of all daughter fragments and the dust isequal to the mass of the parent fragment. In practice,the masses of fragments and eroding fragments arespecified and the rest is assumed to be released as adust. The release of dust causes a steep increase inbolide brightness (appearing as a step on the lightcurve), followed immediately by a decline (if theparticles are small). The separation into a large numberof macroscopic fragments causes a smaller step, afterwhich the prefragmentation slope of the light curve isresumed. The formation of an eroding fragment leads toa gradual increase in brightness followed by a gradualdecrease, i.e., a smooth flare (a hump) on the lightcurve is produced. The shape and duration of the flaredepends on the erosion coefficient and on the masses ofthe dust particles. The formalism of erosion can be usedalso for relatively large fragments released gradually.
The appropriate fragmentation times and theinvolved fragmentation modes were selected accordingto the shape of the light curve. The parameters of thefragments and the dust were then tuned to reproducethe observed light curve as well as possible. We used atime step of 0.02 s. The mass of the largest fragmentwas also restricted by the observed deceleration of thebolide.
Application to Ko�sice
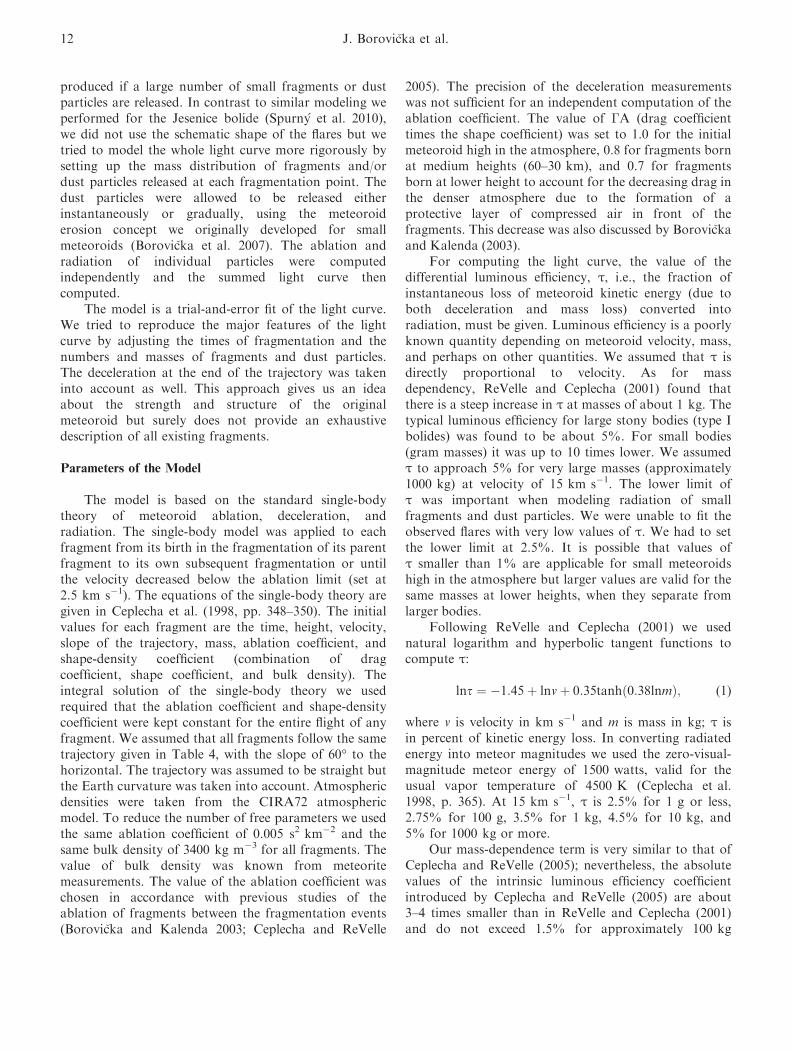
The full details of our best solution are given inTable 5. Of course, we do not claim that it is a uniquesolution. The fragmentation heights have beendetermined well. The masses of the fragments are roughand should be correct within an order of magnitude.Although the number of fragments involved in themodel is relatively large, still it is an idealization andthe reality was surely more complex. Nevertheless, thegeneral behavior described in the following paragraphsshould be correct.
The initial mass of the meteoroid was estimated tobe 3500 kg (corresponding to a diameter of 1.25 m).Owing to the uncertainties in absolute photometry and
Ko�sice meteorite trajectory, fragmentation, and orbit 13
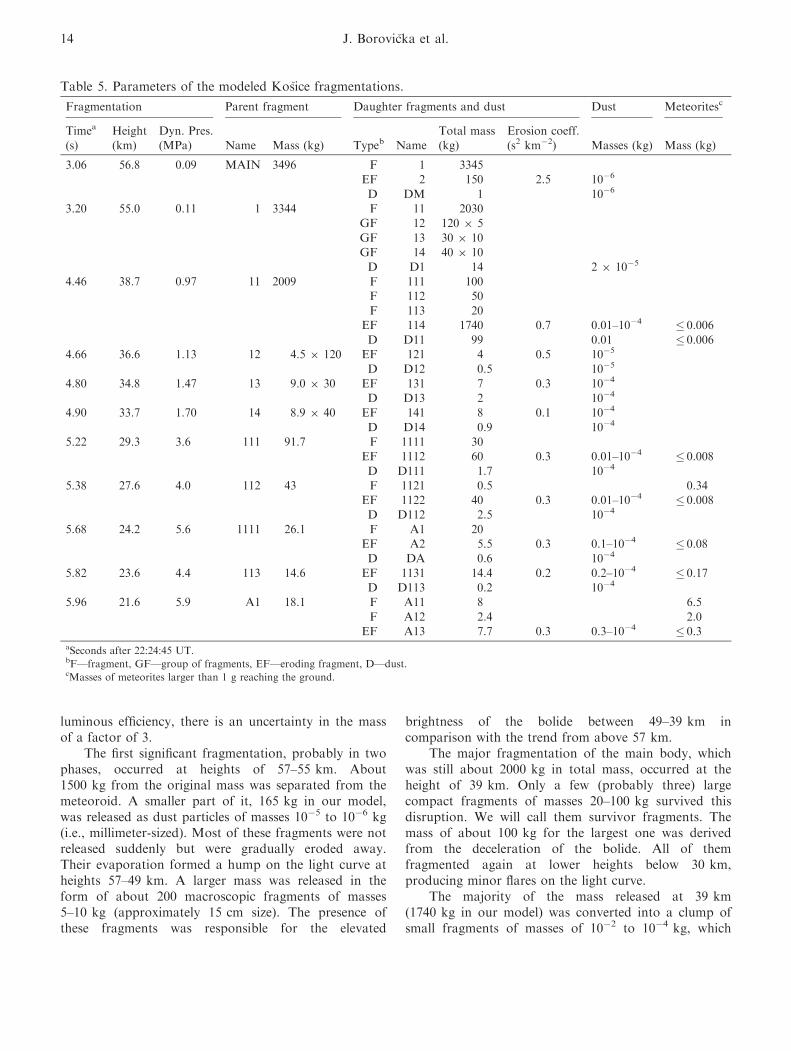
luminous efficiency, there is an uncertainty in the massof a factor of 3.
The first significant fragmentation, probably in twophases, occurred at heights of 57–55 km. About1500 kg from the original mass was separated from themeteoroid. A smaller part of it, 165 kg in our model,was released as dust particles of masses 10�5 to 10�6 kg(i.e., millimeter-sized). Most of these fragments were notreleased suddenly but were gradually eroded away.Their evaporation formed a hump on the light curve atheights 57–49 km. A larger mass was released in theform of about 200 macroscopic fragments of masses5–10 kg (approximately 15 cm size). The presence ofthese fragments was responsible for the elevated
brightness of the bolide between 49–39 km incomparison with the trend from above 57 km.
The major fragmentation of the main body, whichwas still about 2000 kg in total mass, occurred at theheight of 39 km. Only a few (probably three) largecompact fragments of masses 20–100 kg survived thisdisruption. We will call them survivor fragments. Themass of about 100 kg for the largest one was derivedfrom the deceleration of the bolide. All of themfragmented again at lower heights below 30 km,producing minor flares on the light curve.
The majority of the mass released at 39 km(1740 kg in our model) was converted into a clump ofsmall fragments of masses of 10�2 to 10�4 kg, which
Table 5. Parameters of the modeled Ko�sice fragmentations.
Fragmentation Parent fragment Daughter fragments and dust Dust Meteoritesc
Timea
(s)Height(km)
Dyn. Pres.(MPa) Name Mass (kg) Typeb Name
Total mass(kg)
Erosion coeff.(s2 km�2) Masses (kg) Mass (kg)
3.06 56.8 0.09 MAIN 3496 F 1 3345EF 2 150 2.5 10�6
D DM 1 10�6
3.20 55.0 0.11 1 3344 F 11 2030GF 12 120 9 5
GF 13 30 9 10GF 14 40 9 10D D1 14 2 9 10�5
4.46 38.7 0.97 11 2009 F 111 100F 112 50F 113 20
EF 114 1740 0.7 0.01–10�4 � 0.006
D D11 99 0.01 � 0.0064.66 36.6 1.13 12 4.5 9 120 EF 121 4 0.5 10�5
D D12 0.5 10�5
4.80 34.8 1.47 13 9.0 9 30 EF 131 7 0.3 10�4
D D13 2 10�4
4.90 33.7 1.70 14 8.9 9 40 EF 141 8 0.1 10�4
D D14 0.9 10�4
5.22 29.3 3.6 111 91.7 F 1111 30EF 1112 60 0.3 0.01–10�4 � 0.008
D D111 1.7 10�4
5.38 27.6 4.0 112 43 F 1121 0.5 0.34EF 1122 40 0.3 0.01–10�4 � 0.008D D112 2.5 10�4
5.68 24.2 5.6 1111 26.1 F A1 20EF A2 5.5 0.3 0.1–10�4 � 0.08D DA 0.6 10�4
5.82 23.6 4.4 113 14.6 EF 1131 14.4 0.2 0.2–10�4 � 0.17D D113 0.2 10�4
5.96 21.6 5.9 A1 18.1 F A11 8 6.5
F A12 2.4 2.0EF A13 7.7 0.3 0.3–10�4 � 0.3
aSeconds after 22:24:45 UT.bF—fragment, GF—group of fragments, EF—eroding fragment, D—dust.cMasses of meteorites larger than 1 g reaching the ground.
14 J. Borovi�cka et al.
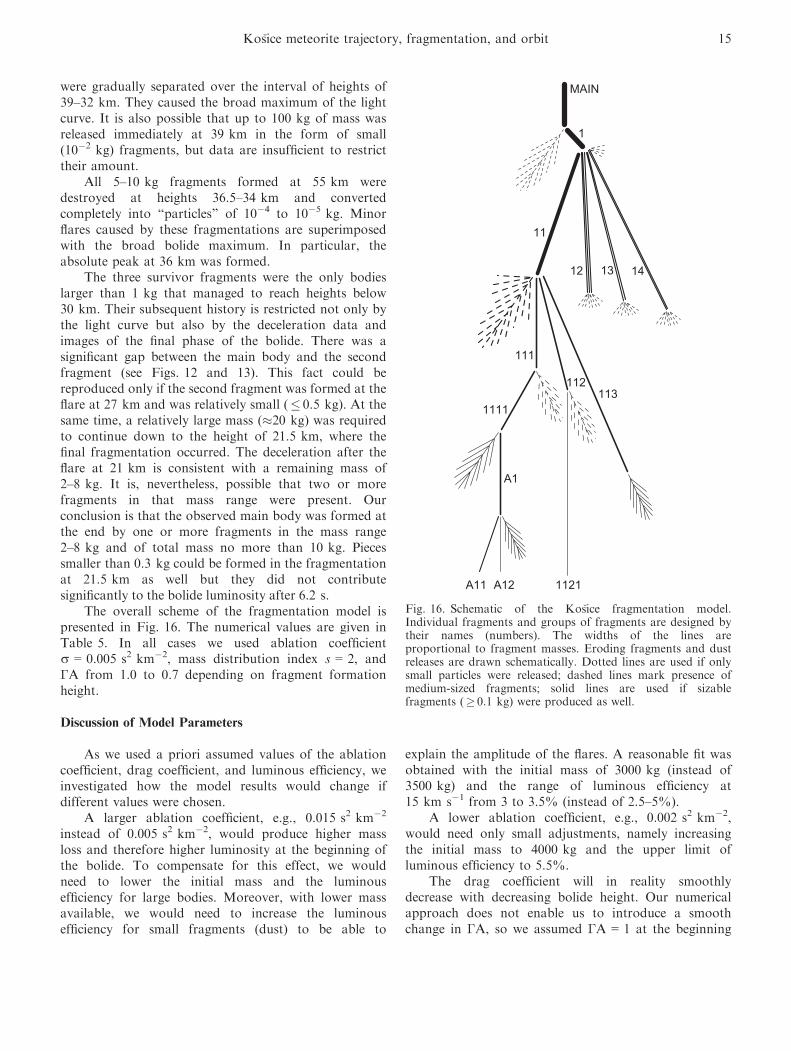
were gradually separated over the interval of heights of39–32 km. They caused the broad maximum of the lightcurve. It is also possible that up to 100 kg of mass wasreleased immediately at 39 km in the form of small(10�2 kg) fragments, but data are insufficient to restricttheir amount.
All 5–10 kg fragments formed at 55 km weredestroyed at heights 36.5–34 km and convertedcompletely into “particles” of 10�4 to 10�5 kg. Minorflares caused by these fragmentations are superimposedwith the broad bolide maximum. In particular, theabsolute peak at 36 km was formed.
The three survivor fragments were the only bodieslarger than 1 kg that managed to reach heights below30 km. Their subsequent history is restricted not only bythe light curve but also by the deceleration data andimages of the final phase of the bolide. There was asignificant gap between the main body and the secondfragment (see Figs. 12 and 13). This fact could bereproduced only if the second fragment was formed at theflare at 27 km and was relatively small (� 0.5 kg). At thesame time, a relatively large mass (�20 kg) was requiredto continue down to the height of 21.5 km, where thefinal fragmentation occurred. The deceleration after theflare at 21 km is consistent with a remaining mass of2–8 kg. It is, nevertheless, possible that two or morefragments in that mass range were present. Ourconclusion is that the observed main body was formed atthe end by one or more fragments in the mass range2–8 kg and of total mass no more than 10 kg. Piecessmaller than 0.3 kg could be formed in the fragmentationat 21.5 km as well but they did not contributesignificantly to the bolide luminosity after 6.2 s.
The overall scheme of the fragmentation model ispresented in Fig. 16. The numerical values are given inTable 5. In all cases we used ablation coefficientr = 0.005 s2 km�2, mass distribution index s = 2, andΓA from 1.0 to 0.7 depending on fragment formationheight.
Discussion of Model Parameters
As we used a priori assumed values of the ablationcoefficient, drag coefficient, and luminous efficiency, weinvestigated how the model results would change ifdifferent values were chosen.
A larger ablation coefficient, e.g., 0.015 s2 km�2
instead of 0.005 s2 km�2, would produce higher massloss and therefore higher luminosity at the beginning ofthe bolide. To compensate for this effect, we wouldneed to lower the initial mass and the luminousefficiency for large bodies. Moreover, with lower massavailable, we would need to increase the luminousefficiency for small fragments (dust) to be able to
explain the amplitude of the flares. A reasonable fit wasobtained with the initial mass of 3000 kg (instead of3500 kg) and the range of luminous efficiency at15 km s�1 from 3 to 3.5% (instead of 2.5–5%).
A lower ablation coefficient, e.g., 0.002 s2 km�2,would need only small adjustments, namely increasingthe initial mass to 4000 kg and the upper limit ofluminous efficiency to 5.5%.
The drag coefficient will in reality smoothlydecrease with decreasing bolide height. Our numericalapproach does not enable us to introduce a smoothchange in ΓA, so we assumed ΓA = 1 at the beginning
MAIN
1
11
12 13 14
111
112113
1111
1121
A1
A11 A12
Fig. 16. Schematic of the Ko�sice fragmentation model.Individual fragments and groups of fragments are designed bytheir names (numbers). The widths of the lines areproportional to fragment masses. Eroding fragments and dustreleases are drawn schematically. Dotted lines are used if onlysmall particles were released; dashed lines mark presence ofmedium-sized fragments; solid lines are used if sizablefragments (� 0.1 kg) were produced as well.
Ko�sice meteorite trajectory, fragmentation, and orbit 15

and ΓA = 0.7 for fragments created at low heights.Assuming ΓA = 0.7 for the whole trajectory wouldrequire an increase in the initial mass to 4500 kg toexplain the luminosity at the beginning. With moremass available, we would also have to lower theluminous efficiency for the dust to 2.25%. Thesechanges are relatively minor despite the severe change inΓA at the beginning. Our stepwise approach to ΓAtherefore does not negatively influence the results.
Finally, we checked if the data can be fitted withthe low values of luminous efficiency given in Ceplechaand ReVelle (2005). We set τ to 0.6–1.4% at 15 km s�1,depending on mass. To explain the observed luminosity,we needed to increase the initial mass to more than11,000 kg and to use a higher ablation coefficient of0.010 s2 km�2. To explain both the deceleration andluminosity in the second half of the trajectory, ΓA waskept 1.0 for the whole trajectory. This solution does notcontradict any observation directly and was able topredict meteorites of reasonable masses, but we considerit rather unrealistic because of the high ΓA at the endand very high initial mass (see the comparison withinfrasonic data below).
In summary, the low precision of decelerationmeasurements does not allow us to restrict the value ofthe ablation coefficient very tightly. In principle it may beanywhere between 0.001 and 0.015 s2 km�2. Thedifferences in radiative output for different values of rcan be compensated by changing the initial mass and thevalue of the differential luminous efficiency. Theluminous efficiency is therefore also not certain butprobably was between 2% and 6% at 15 km s�1.Nevertheless, it is important to note that our main result,the fragmentation positions, is not affected by theseuncertainties. Also the resulting masses of meteorites arenearly the same for all combinations of parameters.
Comparison With the Seismic Record at Station CRVS
After the bolide trajectory was computed, theseismic record at the closest station CRVS, which lies inthe flight direction with only a small side step of about10 km, could be compared with our fragmentationanalysis based on the light curve. As the coordinates ofthe bolide (the leading fragment) are known at any timeT, the expected arrival time at CRVS of the sonic signaloriginated at the time T can be computed (taking intoaccount the distance to the station, average speed ofsound from that height, and the wind drift). The seismicsignal can therefore be assigned to the source height.Direct comparison with the light curve is also possiblebut we must keep in mind that the light curve wasmeasured as a function of time, not height, so any lightproduced by fragments other than the leading one has
the height assigned incorrectly. But the difference issignificant only for some of the flares toward the end ofthe bolide.
The comparison is plotted in Fig. 17. In general, wecan see that the period of strong seismic signalcorresponds quite well with the period of highluminosity of the bolide and the interval where themeteoroid fragmentations were revealed by our analysis.The seismic signal is weaker at higher altitudes but thisis understandable for two reasons. First, the distance tothe station was larger, so the received signal was weakerdue to the inverse square law. Second, the lower densityof the atmosphere was less favorable for generating thesonic signal. Nevertheless, a clear sonic signal wasproduced at least from heights 45 km downwards. Twominor flares on the light curve between 40 and 45 km,which we did not attempt to fit, clearly correspond toseismic signal.
A closer view reveals a small systematic shift betweenthe seismic signal and the light curve/fragmentationpoints. The seismic signal seems to be generated atsomewhat lower heights. The shift is most visible betweenthe last fragmentation point and the distinct seismicsignal marked 3 in Fig. 17. We checked the video recordand there is no sign of any flare at heights below 21 km,which could be attributed to seismic signal 3. We alsochecked that the wind drift was correctly taken intoaccount in our computations. Nevertheless, the differencemay still be caused by the combined error of bothmethods (video and seismic). It is possible that a morerigorous approach to computing the sound propagation(e.g., that of Edwards and Hildebrand 2004) wouldremove the discrepancy. An alternative explanation,although less likely, could be that the blast wave radius(Edwards 2010) of the explosions producing the soundwas of the order of 1–2 km, so that the sound was
Fig. 17. A comparison of the seismic signal at station CRVSwith the fragmentation heights and the light curve. The firstthree sonic arrivals are marked 1–3 (compare to Fig. 6). Seethe text for the explanation how this plot was produced.
16 J. Borovi�cka et al.

effectively generated closer to the station CRVS than wasthe fragmentation point.
In any case, we can conclude that the sonic wavesdetected at CRVS (and other stations too) weregenerated by meteoroid fragmentations producingnearly spherical waves. In contrast, the seismic data ofthe well-observed Neuschwanstein meteorite fall wereinterpreted as being caused mainly by cylindrical linesource blast wave (ReVelle et al. 2004). This does notmean that cylindrical waves were not produced in theKo�sice event. The location of the seismic stationsrelative to the bolide trajectory simply did not allowcylindrical waves to reach the stations. On the otherhand, atmospheric fragmentation was more complexand severe in Ko�sice than in Neuschwanstein. It is alsoremarkable that the sonic energy generated along thetrajectory in the form of spherical waves had a verysimilar pattern to the radiative output. It is clear thatthe same process, namely meteoroid fragmentation andsubsequent deceleration and ablation of dust and smallfragments, produced both the light and the sound. Wecan also say that the seismic data confirmed ourfragmentation analysis.
The weak but distinct sonic arrivals 1 and 2 (seeFigs. 6 and 17) originated at heights below 17.4 kmwhere the bolide ceased to be visible. We interpret thesignal 1, from a height of about 13 km, ascorresponding to the point where the speed of thelargest fragment dropped below the speed of sound. Atthat point the cylindrical waves became spherical andseismic energy accumulated. Signal 2, fromapproximately 15 km, may be sound speed crossing ofanother fragment or a late fragmentation not detectedin light.
Comparison with Meteorite Mass Distribution
The model provided the masses, heights, anddecelerations of all modeled fragments at the momentwhen their velocity decreased to 2.5 km s�1 and theirablation stopped. The mass distribution of the modeledfragments is compared with the mass distribution of therecovered meteorites in Table 6.
The model predicts a gap of total mass formeteorites in the 0.1–1 kg range. This gap seems to bereally observed, as the total recovered mass in the0.1–1 kg range is only slightly larger than in the 0.01–0.1 kg range, although the recovery efficiency must beclearly better for larger masses. On the other hand, withnew meteorites reported, the total number of meteoriteslarger than 0.1 kg already exceeds the modelpredictions. As many of the fragments are outliers inthe strewn field, we suspect that they may be fragmentsformed at high altitudes (>30 km), which were notconsidered in the model.
The meteorite recoveries at low masses are, ofcourse, incomplete. The model predicts huge numbers ofmeteorites smaller than 10 g, from which only a tinypart was recovered. Note, however, that the modelednumbers should be taken as upper limits, as part of thefragments may have been additionally fragmented in theatmosphere. It must be also noted that the bolide lightcurve provided only little hints about the number andmasses of small fragments. The flares could be fittedwith different combinations of fragment mass range,their mass distribution index, and the erosioncoefficient.
Comparison with Meteorite Strewn Field
We can compare not only the mass distribution butalso the actual positions of meteorites on ground to themodel. The predicted meteorite positions were computedby the dark flight code of Ceplecha (1987). The input isthe position, velocity, and deceleration of each fragmentat the moment of ablation stop (assumed to be atvelocity 2.5 km s�1—this assumption is not crucial asthe ablation coefficient was very small) and the highaltitude wind field. We assumed all fragments to followthe same trajectory during the ablation phase. In reality,the fragments gain some lateral velocity during thefragmentation process (e.g., Borovi�cka and Kalenda2003), which leads to larger dispersion in the strewnfield. Nevertheless, we found the effect to be relativelysmall in our case (approximately 100 m) for lateralvelocities up to 0.1 km s�1.
Table 6. Mass distribution of recovered meteorites compared with model output.
Mass range
Recovered meteorites Model prediction
Number Total mass (kg) Number Total mass (kg)
0.1–1 g 3 0.002 2,000,000 5501–10 g 100 0.51 200,000 50010–100 g 96 2.92 240 6.5
0.1–1 kg 17 3.31 12 2.21–10 kg 2 4.54 ~2 � 8.5
Ko�sice meteorite trajectory, fragmentation, and orbit 17
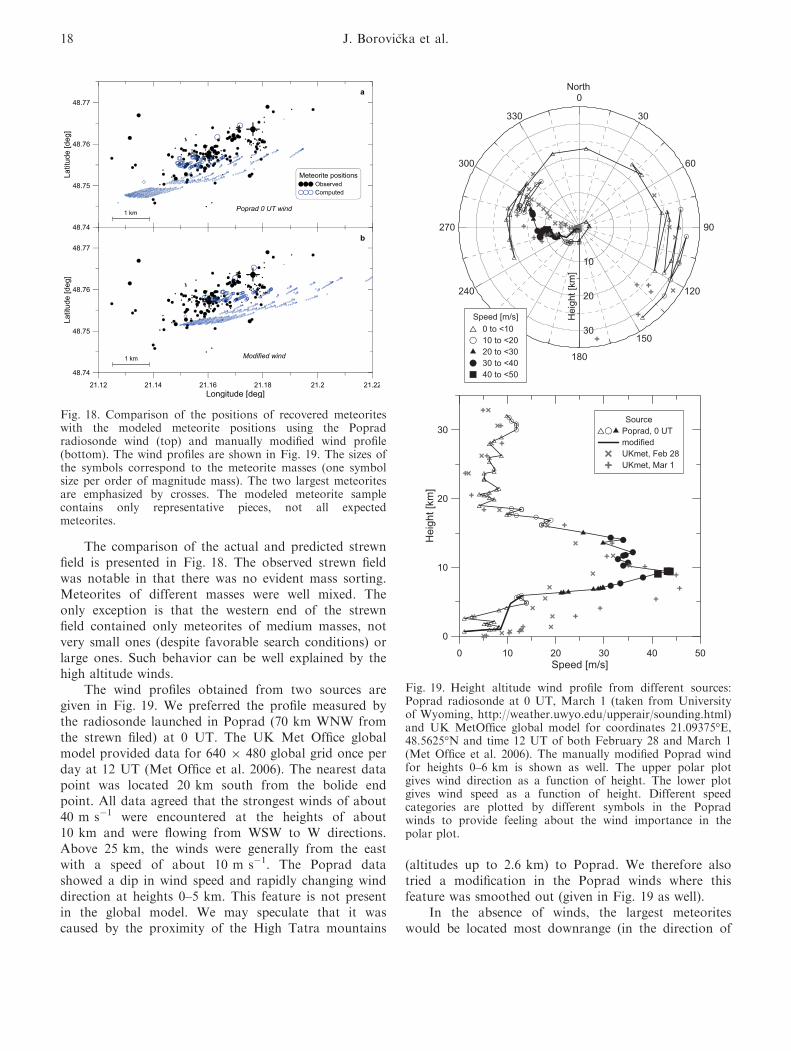
The comparison of the actual and predicted strewnfield is presented in Fig. 18. The observed strewn fieldwas notable in that there was no evident mass sorting.Meteorites of different masses were well mixed. Theonly exception is that the western end of the strewnfield contained only meteorites of medium masses, notvery small ones (despite favorable search conditions) orlarge ones. Such behavior can be well explained by thehigh altitude winds.
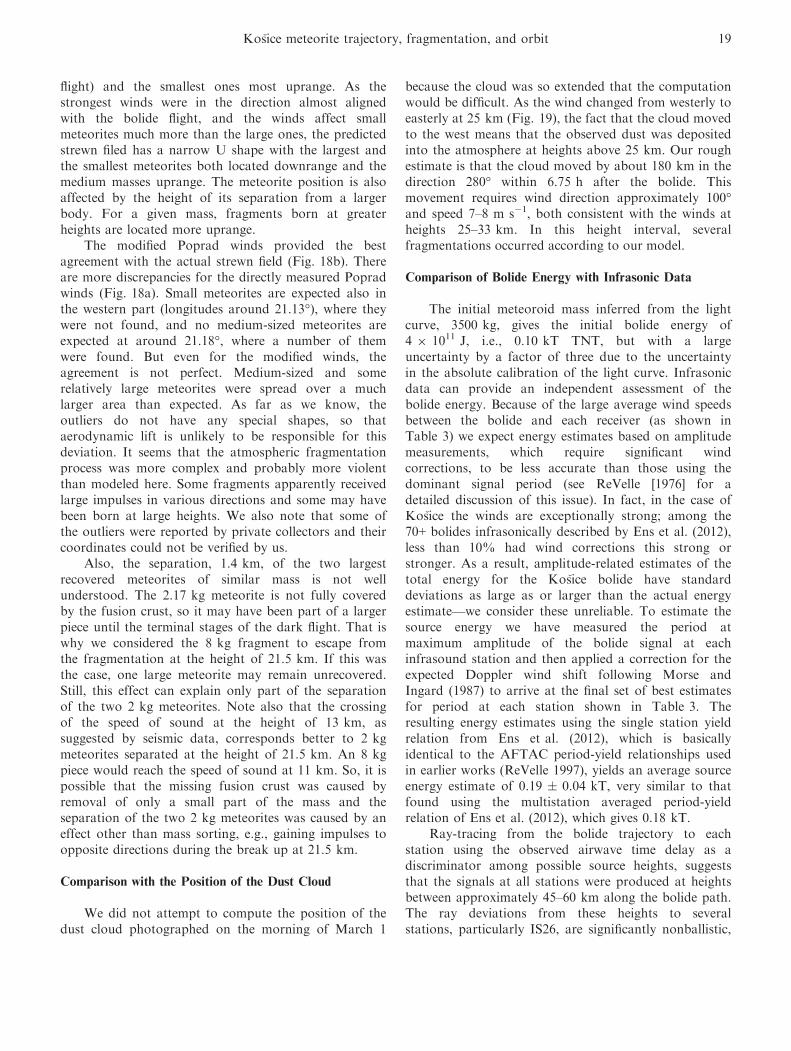
The wind profiles obtained from two sources aregiven in Fig. 19. We preferred the profile measured bythe radiosonde launched in Poprad (70 km WNW fromthe strewn filed) at 0 UT. The UK Met Office globalmodel provided data for 640 9 480 global grid once perday at 12 UT (Met Office et al. 2006). The nearest datapoint was located 20 km south from the bolide endpoint. All data agreed that the strongest winds of about40 m s�1 were encountered at the heights of about10 km and were flowing from WSW to W directions.Above 25 km, the winds were generally from the eastwith a speed of about 10 m s�1. The Poprad datashowed a dip in wind speed and rapidly changing winddirection at heights 0–5 km. This feature is not presentin the global model. We may speculate that it wascaused by the proximity of the High Tatra mountains
(altitudes up to 2.6 km) to Poprad. We therefore alsotried a modification in the Poprad winds where thisfeature was smoothed out (given in Fig. 19 as well).
In the absence of winds, the largest meteoriteswould be located most downrange (in the direction of
Fig. 18. Comparison of the positions of recovered meteoriteswith the modeled meteorite positions using the Popradradiosonde wind (top) and manually modified wind profile(bottom). The wind profiles are shown in Fig. 19. The sizes ofthe symbols correspond to the meteorite masses (one symbolsize per order of magnitude mass). The two largest meteoritesare emphasized by crosses. The modeled meteorite samplecontains only representative pieces, not all expectedmeteorites.
0
30
60
90
120
150
180
210
240
270
300
330
North
10
20
30
Hei
ght [
km]
Speed [m/s]0 to <1010 to <2020 to <3030 to <4040 to <50
SourcePoprad, 0 UTmodifiedUKmet, Feb 28UKmet, Mar 1
0 10 20 30 40 50Speed [m/s]
0
10
20
30H
eigh
t [km
]
Fig. 19. Height altitude wind profile from different sources:Poprad radiosonde at 0 UT, March 1 (taken from Universityof Wyoming, http://weather.uwyo.edu/upperair/sounding.html)and UK MetOffice global model for coordinates 21.09375°E,48.5625°N and time 12 UT of both February 28 and March 1(Met Office et al. 2006). The manually modified Poprad windfor heights 0–6 km is shown as well. The upper polar plotgives wind direction as a function of height. The lower plotgives wind speed as a function of height. Different speedcategories are plotted by different symbols in the Popradwinds to provide feeling about the wind importance in thepolar plot.
18 J. Borovi�cka et al.
flight) and the smallest ones most uprange. As thestrongest winds were in the direction almost alignedwith the bolide flight, and the winds affect smallmeteorites much more than the large ones, the predictedstrewn filed has a narrow U shape with the largest andthe smallest meteorites both located downrange and themedium masses uprange. The meteorite position is alsoaffected by the height of its separation from a largerbody. For a given mass, fragments born at greaterheights are located more uprange.
The modified Poprad winds provided the bestagreement with the actual strewn field (Fig. 18b). Thereare more discrepancies for the directly measured Popradwinds (Fig. 18a). Small meteorites are expected also inthe western part (longitudes around 21.13°), where theywere not found, and no medium-sized meteorites areexpected at around 21.18°, where a number of themwere found. But even for the modified winds, theagreement is not perfect. Medium-sized and somerelatively large meteorites were spread over a muchlarger area than expected. As far as we know, theoutliers do not have any special shapes, so thataerodynamic lift is unlikely to be responsible for thisdeviation. It seems that the atmospheric fragmentationprocess was more complex and probably more violentthan modeled here. Some fragments apparently receivedlarge impulses in various directions and some may havebeen born at large heights. We also note that some ofthe outliers were reported by private collectors and theircoordinates could not be verified by us.
Also, the separation, 1.4 km, of the two largestrecovered meteorites of similar mass is not wellunderstood. The 2.17 kg meteorite is not fully coveredby the fusion crust, so it may have been part of a largerpiece until the terminal stages of the dark flight. That iswhy we considered the 8 kg fragment to escape fromthe fragmentation at the height of 21.5 km. If this wasthe case, one large meteorite may remain unrecovered.Still, this effect can explain only part of the separationof the two 2 kg meteorites. Note also that the crossingof the speed of sound at the height of 13 km, assuggested by seismic data, corresponds better to 2 kgmeteorites separated at the height of 21.5 km. An 8 kgpiece would reach the speed of sound at 11 km. So, it ispossible that the missing fusion crust was caused byremoval of only a small part of the mass and theseparation of the two 2 kg meteorites was caused by aneffect other than mass sorting, e.g., gaining impulses toopposite directions during the break up at 21.5 km.
Comparison with the Position of the Dust Cloud
We did not attempt to compute the position of thedust cloud photographed on the morning of March 1
because the cloud was so extended that the computationwould be difficult. As the wind changed from westerly toeasterly at 25 km (Fig. 19), the fact that the cloud movedto the west means that the observed dust was depositedinto the atmosphere at heights above 25 km. Our roughestimate is that the cloud moved by about 180 km in thedirection 280° within 6.75 h after the bolide. Thismovement requires wind direction approximately 100°and speed 7–8 m s�1, both consistent with the winds atheights 25–33 km. In this height interval, severalfragmentations occurred according to our model.
Comparison of Bolide Energy with Infrasonic Data
The initial meteoroid mass inferred from the lightcurve, 3500 kg, gives the initial bolide energy of4 9 1011 J, i.e., 0.10 kT TNT, but with a largeuncertainty by a factor of three due to the uncertaintyin the absolute calibration of the light curve. Infrasonicdata can provide an independent assessment of thebolide energy. Because of the large average wind speedsbetween the bolide and each receiver (as shown inTable 3) we expect energy estimates based on amplitudemeasurements, which require significant windcorrections, to be less accurate than those using thedominant signal period (see ReVelle [1976] for adetailed discussion of this issue). In fact, in the case ofKo�sice the winds are exceptionally strong; among the70+ bolides infrasonically described by Ens et al. (2012),less than 10% had wind corrections this strong orstronger. As a result, amplitude-related estimates of thetotal energy for the Ko�sice bolide have standarddeviations as large as or larger than the actual energyestimate—we consider these unreliable. To estimate thesource energy we have measured the period atmaximum amplitude of the bolide signal at eachinfrasound station and then applied a correction for theexpected Doppler wind shift following Morse andIngard (1987) to arrive at the final set of best estimatesfor period at each station shown in Table 3. Theresulting energy estimates using the single station yieldrelation from Ens et al. (2012), which is basicallyidentical to the AFTAC period-yield relationships usedin earlier works (ReVelle 1997), yields an average sourceenergy estimate of 0.19 � 0.04 kT, very similar to thatfound using the multistation averaged period-yieldrelation of Ens et al. (2012), which gives 0.18 kT.
Ray-tracing from the bolide trajectory to eachstation using the observed airwave time delay as adiscriminator among possible source heights, suggeststhat the signals at all stations were produced at heightsbetween approximately 45–60 km along the bolide path.The ray deviations from these heights to severalstations, particularly IS26, are significantly nonballistic,
Ko�sice meteorite trajectory, fragmentation, and orbit 19

suggesting that acoustic radiation may have beengenerated by a point source detonation in this heightinterval. Indeed, significant fragmentation was found tostart at the height of 57 km (Table 5; Fig. 15).Consequently, our estimates of the initial bolide energyfrom period measurements alone are larger than thetrue source energy. We can therefore conclude that thebolide energy of 0.1 kT or somewhat larger is inagreement with both the light curve and the infrasoundanalysis. The radiated energy was about 0.0025 kT.
THE PREATMOSPHERIC ORBIT
The preatmospheric orbit of the meteoroid wascomputed by the standard method (Ceplecha 1987)from the bolide radiant and velocity. The orbit is givenin Table 7 and plotted in Fig. 20. The periheliondistance of 0.96 AU was derived with relatively highprecision. The semimajor axis and, consequently,aphelion distance and eccentricity were more difficult todetermine as they were very sensitive to thedetermination of the bolide initial velocity. Theuncertainty of �0.3 km s�1 in initial velocity transformsinto an uncertainty of �0.5 AU in aphelion distance.The resulting aphelion distance of 4.5 � 0.5 AU islarger than for any of the 15 previously determinedorbits of meteorites (see e.g., table 1 of Popova et al.[2011] and table 1 of Brown et al. [2011] and Spurn�yet al. [2011]); the second largest being Park Forest with4.26 � 0.38 AU (Brown et al. 2004). Within the limitsof error, the Ko�sice orbit may even touch the orbit ofJupiter (Fig. 20). Otherwise, the orbit was notexceptional, with low inclination and perihelion close tothe orbit of the Earth.
The uncertainty in semimajor axis put the orbitclose to the strong 3/1 mean motion resonance withJupiter on one side and to the 5/2 or 7/3 resonances onthe other side, and even closer to the weaker 8/3resonance. We have numerically investigated thenominal orbit of the Ko�sice meteorite and also 75 clones
from the narrower uncertainty interval close to thenominal orbit by using the Bulirsch-Stoer algorithmfrom the package Mercury 6 (Chambers 1999). In themodel, the planets Mercury through Neptune wereconsidered as perturbing bodies, while the Earth andMoon were treated separately. We included the fourmost significantly influencing asteroids: Ceres, Pallas,Vesta, and Hygiea (Gal�ad 2002). The backwardintegration period was 100,000 yr unless clear divergencein behavior was noted on a shorter time scale.
The nominal orbit of the Ko�sice meteorite remainedinside Jupiter’s orbit during the interval of integration.The semimajor axis exhibited only small variations from2.75 to 2.45 AU, the eccentricity and inclination showedmuch larger changes, from 0.65 to 0.97 and from 2 to14°, respectively.
Generally, the orbits of clones were not very stable.About 25% of the cloned orbits had aphelia smallerthan Jupiter’s orbit during the whole investigatedinterval. Moreover, about 27% of the clones reachedorbits with semimajor axes larger than 35 AU during theinvestigated time frame. As expected, the Earth andVenus were the most prominent perturbing bodies fororbital evolution, which caused close approaches toJupiter with corresponding dramatic orbital changes.
The orbital evolution of the nominal orbit of themeteorite as well as of several clones representingtypical behavior of the cloned orbits is depicted inFig. 21. The graph of semimajor axis contains thenominal orbit as representative of the evolution of 19clones in the range from 2.2 to 3.2 AU, the other two
Table 7. Geocentric radiant and heliocentric orbit ofKo�sice meteoroid (J2000.0).Geocentric radiant
Right ascension aG = 114.3° � 1.7°Declination dG = +29.0° � 3.0°Velocity vG = 10.3 � 0.5 km s�1
Heliocentric orbitSemimajor axis a = 2.71 � 0.24 AUEccentricity e = 0.647 � 0.032
Perihelion distance q = 0.957 � 0.004 AUAphelion distance Q = 4.5 � 0.5 AUArgument of perihelion x = 204.2 � 1.2°Longitude of ascending node Ω = 340.072 � 0.004°Inclination i = 2.0 � 0.8°
Fig. 20. Projection of the Ko�sice meteoroid orbit into theplane of ecliptic. The dashed lines denote the limits of theorbit within one standard deviation. Orbits of planets Mercuryto Jupiter and the direction to the vernal equinoctial point arealso shown.
20 J. Borovi�cka et al.

curves are examples of another 11 stable orbits witha < 35 AU during the last 100,000 yr. The graphs ofeccentricity, inclination, and perihelion distance inFig. 21 contain only representatives of theaforementioned 19 clones. Most of these orbits haveeccentricities in the interval 0.5–0.8 and inclinationsfrom 2 to 8°. In all graphs, a long periodic influence ofJupiter can be seen, changing the eccentricities from 0.2to nearly 1.0 and inclinations, to almost 15°.
Three Apollo type asteroids, namely 2002 CX58,2009 BC11, and 2000 DO8, have similar osculatingorbits to the Ko�sice meteorite with the Southworth-Hawkins D criterion (Southworth and Hawkins 1963)DSH � 0.10. They might have some connection to themeteorite but a more detailed study would be needed todraw any conclusions.
DISCUSSION
As bad weather prevented regular observation of theKo�sice meteorite fall, we were lucky in obtaining threecasual videos of the bolide. The spatial distribution ofvideo sites was not ideal; nevertheless, the videos enabledus, after careful calibration, to reconstruct the bolide
trajectory, velocity, and orbit, and to compute meteoritefall area. The precision of the orbit is relatively low butis comparable to some other similar cases reconstructedfrom casual records, e.g., Park Forest. Fortunately, thelarge number of fallen meteorites made the meteoriterecovery relatively easy. Finally, the radiometers of theEuropean Network fireball cameras, although located farfrom the bolide and obscured by thick clouds, recordedthe bolide light curve and enabled us to reconstruct thebolide brightness and the fragmentation history of themeteoroid in the atmosphere.
With a maximum brightness of �18 mag, theKo�sice bolide classifies into the superbolide category(Ceplecha et al. 1999). The Ko�sice meteoroid, with aninitial mass of about 3500 kg and diameter of 1.25 m,belongs to the population of relatively massivemeteorite-producing bodies. The kinetic energy at theentry into the atmosphere was almost 0.1 kt TNT (1 ktTNT = 4.185 9 1012 J). The meteoroid was a stonyordinary chondrite of type H5. All these parameterswould suggest that a large meteorite, of the order ofseveral tens of kilograms, could reach the ground.However, this was not the case. The decisive factor wasthe mechanical strength of the meteoroid. This quantity
Fig. 21. Orbital evolution of the nominal orbit of the meteoroid Ko�sice and of one to three clones representing the typicalbehavior of the cloned orbits during the last 100,000 yr. In the graph of semimajor axis, the nominal orbit illustrates theevolution of 19 clones with a in the range from 2.2 to 3.2 AU, the other two curves represent 11 other stable orbits witha < 35 AU. The graphs of eccentricity, inclination, and perihelion distance contain only representatives of the 19 clones witha < 5 AU.
Ko�sice meteorite trajectory, fragmentation, and orbit 21

varies from case to case, even for bodies of the samemineralogical type (Popova et al. 2011). Ko�sice was aweak meteoroid which fragmented heavily under thedynamic pressure of approximately 1 MPa, at theheight of approximately 38 km. In this respect, itresembled the much more massive meteoroids TagishLake (Brown et al. 2002) and Almahata Sitta(Borovi�cka and Charv�at 2009; Jenniskens et al. 2009),which also disrupted catastrophically at similarpressures. Both of them, however, were of differentmineralogical types (carbonaceous chondrite andureilite, respectively). Both of them also disrupted moreseverely, terminating the bolide at approximately 30 kmheight and dropping only small meteorites (<<1 kg) tothe ground. In contrast, parts of Ko�sice were strongenough and although they fragmented further, themaximum encountered dynamic pressure approached6 MPa, a value quite comparable with other ordinarychondrite falls (Popova et al. 2011).
The reason for this severe fragmentation at 1 MPaand even as low as 0.1 MPa must have been, as in othersimilar cases, prefragmentation of the meteoroid fromcollisions in interplanetary space. The meteoroid wasprobably full of internal fractures and cracks, leavingonly a small part of the volume relatively strong. Infact, Peekskill may have been a similar case, as it alsofragmented heavily at low pressures (Ceplecha et al.1996), but the extremely shallow trajectory of Peekskillmakes a direct comparison difficult. Mor�avka disruptedinitially at low pressure, but most of the mass continuedas still relatively large fragments of strengthapproaching 5 MPa (Borovi�cka and Kalenda 2003). Weplan to use our improved meteoroid fragmentationmodel and apply it to some other meteorite falls withgood light curve data and to selected important bolidesto facilitate more comparison.
The heliocentric orbit of Ko�sice was characterizedby a low inclination (2°) and relatively large semimajoraxis (2.7 AU), which places the likely origin of the bodyin the central main asteroid belt near the 8:3 mainmotion resonance with Jupiter. According to Bottkeet al. (2002), 24% of near-Earth objects come from thecentral Main Belt.
Acknowledgments—We thank G. Vass, D. Fazzi, T.Meszl�enyi, and I. Asztalos for providing video records ofthe bolide and allowing us to take calibration images attheir homes. We acknowledge all the MCSE membershelping us during the calibration of the videos. We areobliged to M. Zivci�c, R. Maurers, P. M�onus, P. Moczo,and A. Cipciar for providing the seismic data andJ. Zedn�ık for their conversion. Our thanks go to all whoparticipated in meteorite searches, in particular Z. Barto�s,M. Bodn�arov�a, D. B�uzov�a, D. �Capek, P. Delin�c�ak, T.
Dobrovodsk�y, �S. Gajdo�s, S. Kaniansk�y, J. Koza, Z.Kri�sandov�a, T. Krej�cov�a, A. Ku�cera, Z. Mimovi�cov�a, J.Nedoro�s�c�ık, J. Petr�zala, E. Schunov�a, M. �Sebe�n, J. �Silha,M. �Skreka, D. Tomko, P. Vere�s, J. Vil�agi, and P. Zigo.We thank D. Heinlein, Z. Tyminski, J. Woreczko, and T.Gulon for information about nonofficial meteorite finds.This study was supported by GA�CR grants no. P209/11/1382 and 205/08/0411, SRDA contract no. APVV-0516-10, and VEGA grants no. 1/0636/09 and 2/0022/10 aswell as the institutional research plan AV0Z10030501.
Editorial Handling—Dr. Pavel Povinec
REFERENCES
Borovi�cka J. 1990. The comparison of two methods ofdetermining meteor trajectories from photographs. Bulletinof the Astronomical Institutes of Czechoslovakia 41:391–396.
Borovi�cka J. and Charv�at Z. 2009. Meteosat observation of theatmospheric entry of 2008 TC3 over Sudan and theassociated dust cloud. Astronomy & Astrophysics 507:1015–1022.
Borovi�cka J. and Kalenda P. 2003. The Mor�avka meteoritefall: 4. Meteoroid dynamics and fragmentation in theatmosphere. Meteoritics & Planetary Science 38:1023–1043.
Borovi�cka J., Spurn�y P., and Koten P. 2007. Atmosphericdeceleration and light curves of Draconid meteors andimplications for the structure of cometary dust. Astronomy& Astrophysics 473:661–672.
Bottke W. F., Morbidelli A., Jedicke R., Petit J.-M., LevisonH. F., Michel P., and Metcalfe T. S. 2002. Debiasedorbital and absolute magnitude distribution of the near-Earth objects. Icarus 156:399–433.
Brown P. G., ReVelle D. O., Tagliaferri E., and HildebrandA. R. 2002. An entry model for the Tagish Lake fireballusing seismic, satellite and infrasound records. Meteoritics& Planetary Science 37:661–675.
Brown P., Pack D., Edwards W. N., Revelle D. O., Yoo B.B., Spalding R. E., and Tagliaferri E. 2004. The orbit,atmospheric dynamics, and initial mass of the Park Forestmeteorite. Meteoritics & Planetary Science 39:1781–1796.
Brown P., McCausland P. J. A., Fries M., Silber E., EdwardsW. N., Wong D. K., Weryk R. J., Fries J., and KrzeminskiZ. 2011. The fall of the Grimsby meteorite—I: Fireballdynamics and orbit from radar, video, and infrasoundrecords. Meteoritics & Planetary Science 46:339–363.
Ceplecha Z. 1987. Geometric, dynamic, orbital andphotometric data on meteoroids from photographicfireball networks. Bulletin of the Astronomical Institutes ofCzechoslovakia 38:222–234.
Ceplecha Z. and ReVelle D. O. 2005. Fragmentation model ofmeteoroid motion, mass loss, and radiation in theatmosphere. Meteoritics & Planetary Science 40:35–50.
Ceplecha Z., Brown P., Hawkes R. L., Wertherill G., BeechM., and Mossman K. 1996. Video observations,atmospheric path, orbit and fragmentation record of thefall of the Peekskill meteorite. Earth, Moon, and Planets72:395–404.
Ceplecha Z., Borovi�cka J., Elford G. W., ReVelle D. O.,Hawkes R. L., Porub�can V., and �Simek M. 1998. Meteorphenomena and bodies. Space Science Reviews 84:327–471.
22 J. Borovi�cka et al.
Ceplecha Z., Spalding E. R., Jacobs C., Revelle D. O.,Tagliaferri E., and Brown P. 1999. Superbolides. InMeteoroids 1998, edited by Baggaley W. J. and Porub�canV. Bratislava, Slovakia: Astronomical Institute, SlovakAcademy of Sciences. pp. 37–54.
Chambers J. E. 1999. A hybrid symplectic integrator thatpermits close encounters between massive bodies.Monthly Notices of the Royal Astronomical Society 304:793–799.
Christie D. R. and Campus P. 2010. The IMS infrasoundnetwork: Design and establishment of infrasound stations.In Infrasound monitoring for atmospheric studies, edited byLe Pichon A., Blanc E., and Hauchecorne A. Dordrecht:Springer. pp. 27–73.
Edwards W. N. 2010. Meteor generated infrasound: Theoryversus observations. In Infrasound monitoring foratmospheric studies, edited by Le Pichon A., Blanc E., andHauchecorne A. Dordrecht: Springer. pp. 361–414.
Edwards W. N. and Hildebrand A. R. 2004.SUPRACENTER: Locating fireball terminal bursts in theatmosphere using seismic arrivals. Meteoritics & PlanetaryScience 39:1449–1460.
Edwards W. N., Brown P. G., and ReVelle D. O. 2006.Estimates of meteoroid kinetic energies from observationsof infrasonic airwaves. Journal of Atmospheric and Solar-Terrestrial Physics 68:1136–1160.
Ens T. A., Brown P. G., Edwards W. N., and Silber E. A. 2012.Infrasound production by bolides: A global statistical study.Journal of Atmospheric and Solar-Terrestrial Physics 80:208–229, doi:10.1016/j.jastp. 2012.01.018.
Gal�ad A. 2002. Asteroid encounters suitable for massdeterminations. Astronomy & Astrophysics 391:1115–1122.
Gritsevich M. and Koschny D. 2011. Constraining theluminous efficiency of meteors. Icarus 212:877–884.
Jenniskens P., Shaddad M. H., Numan D., Elsir S., KudodaA. M., Zolensky M. E., Le L., Robinson G. A., FriedrichJ. M., Rumble D., Steele A., Chesley S. R., FitzsimmonsA., Duddy S., Hsieh H. H., Ramsay G., Brown P. G.,Edwards W. N., Tagliaferri E., Boslough M. B., SpaldingR. E., Dantowitz R., Kozubal M., Pravec P., Borovi�ckaJ., Charvat Z., Vaubaillon J., Kuiper J., Albers J., BishopJ. L., Mancinelli R. L., Sandford S. A., Milam S. N.,Nuevo M., and Worden S. P. 2009. The impact andrecovery of asteroid 2008 TC3. Nature 458:485–488.
Kohout T., Havrila K., T�oth J., Hus�arik M., Gritsevich M.,Britt D., Borovi�cka J., Spurn�y P., Igaz A., Korno�s L.,Vere�s P., Koza J., Ku�cera A., Zigo P., Gajdo�s �S., Vil�agiJ., �Capek D., Kri�sandov�a Z., Tomko D., �Silha J.,Schunov�a E., Bodn�arov�a M., B�uzov�a D., and Krej�cov�a T.Forthcoming. Density, porosity and magnetic susceptibilityof the Ko�sice meteorites and homogeneity of H chondriteshowers. Meteoritics & Planetary Science.
Met Office [Swinbank R., O’Neill A., Lorenc A. C., Ballard S.P., Bell R. S., Ingleby N. B., Andrews P. L. F., Barker D.M., Bray J. R., Clayton A. M., Dalby T., Li D., Payne T.J., Saunders F. W., Macpherson B., Cullen M. J. P.,Davies T., and Mawson M. H.]. Stratospheric Assimilated
Data [Internet]. NCAS British Atmospheric Data Centre,2006. Last accessed March 17, 2010. Available from http://badc.nerc.ac.uk/view/badc.nerc.ac.uk__ATOM__dataent_ASSIM
Morse P. M. and Ingard K. U. 1987. Theoretical acoustics.Princeton, New Jersey: Princeton University Press. pp. 699–700.
Popova O., Borovi�cka J., Hartmann W. K., Spurn�y P., GnosE., Nemtchinov I., and Trigo-Rodr�ıguez J. 2011. Very lowstrengths of interplanetary meteoroids and small asteroids.Meteoritics & Planetary Science 46:1525–1550.
Revelle D. O. 1976. On meteor-generated infrasound. Journalof Geophysical Research 81(7):1217–1230.
ReVelle D. O. 1997. Historical detection of atmosphericimpacts by large bolides using acoustic-gravity waves.Annals of the New York Academy of Sciences 822:284–302.
ReVelle D. O. and Ceplecha Z. 2001. Bolide physical theorywith application to PN and EN fireballs. Proceedings of theMeteoroids 2001 Conference, ESA SP-495. pp. 507–512.
ReVelle D. O., Brown P. G., and Spurn�y P. 2004. Entrydynamics and acoustics/infrasonic/seismic analysis for theNeuschwanstein meteorite fall. Meteoritics & PlanetaryScience 39:1605–1626.
Southworth R. B. and Hawkins G. S. 1963. Statistics ofmeteor streams. Smithsonian Contributions to Astrophysics7:261–285.
Spurn�y P., Borovi�cka J., and Shrben�y L. 2007. Automation ofthe Czech part of the European Fireball Network:Equipment, methods and first results. In Near Earthobjects, our celestial neighbors: Opportunity and risk,Proceedings of IAU Symposium 236, edited by ValsecchiG. B., Vokrouhlick�y D., and Milani A. Cambridge, UK:Cambridge University Press. pp. 121–130.
Spurn�y P., Borovi�cka J., Kac J., Kalenda P., Atanackov J.,Kladnik G., Heinlein D., and Grau T. 2010. Analysis ofinstrumental observations of the Jesenice meteorite fall onApril 9, 2009. Meteoritics & Planetary Science 45:1392–1407.
Spurn�y P., Bland P. A., Shrben�y L., Towner M. C.,Borovi�cka J., Bevan A. W. R., and Vaughan D. 2011.The Mason Gully meteorite fall in SW Australia: Fireballtrajectory and orbit from photographic records (abstract#5101). Meteoritics & Planetary Science 46:A220.
Spurn�y P., Bland P. A., Shrben�y L., Borovi�cka J., CeplechaZ., Singelton A., Bevan A. W. R., Vaughan D., TownerM. C., McClafferty T. P., Toumi R., and Deacon G. 2012.The Bunburra Rockhole meteorite fall in SW Australia:fireball trajectory, luminosity, dynamics, orbit, and impactposition from photographic and photoelectric records.Meteoritics & Planetary Science 47:163–175.
St€offler D., Keil K., and Scott E. R. D. 1991. Shockmetamorphism of ordinary chondrites. Geochimica etCosmochimica Acta 55:3845–3867.
T�oth J., Korno�s L., Vere�s P., �Silha J., Kalman�cok D., ZigoP., and Vil�agi J. 2011. All-sky video orbits of Lyrids2009. Publications of the Astronomical Society of Japan63:311–314.
SUPPORTING INFORMATION
Additional supporting information may be found inthe online version of this article:
Data S1. Positions of Ko�sice bolide from videorecords.
Ko�sice meteorite trajectory, fragmentation, and orbit 23