Embed Size (px)
Citation preview
M e a s u r i n g P a r t y S y s t e m : R e v i s i t i n g C o m p e t i t i v e n e s s
a n d V o l a t i l i t y i n P a r l i a m e n t a r y P a r t y S y s t e m s
Jin-Young Kwak * Kenneth Janda
A M X i g t f t l X1128S 2 S g±H
2010. 8
THE KOREAN JOURNAL OF AREA STUDIES Vol. 28 No. 2. August 2010
M e a s u r i n g P a r t y S y s t e m :
Revisiting Competitiveness and Volatility in Parliamentary Party
Systems* ^
Jin-Young Kwak** | Konkuk University
Kenneth Janda | Northwestern University
(ABSTRACT)
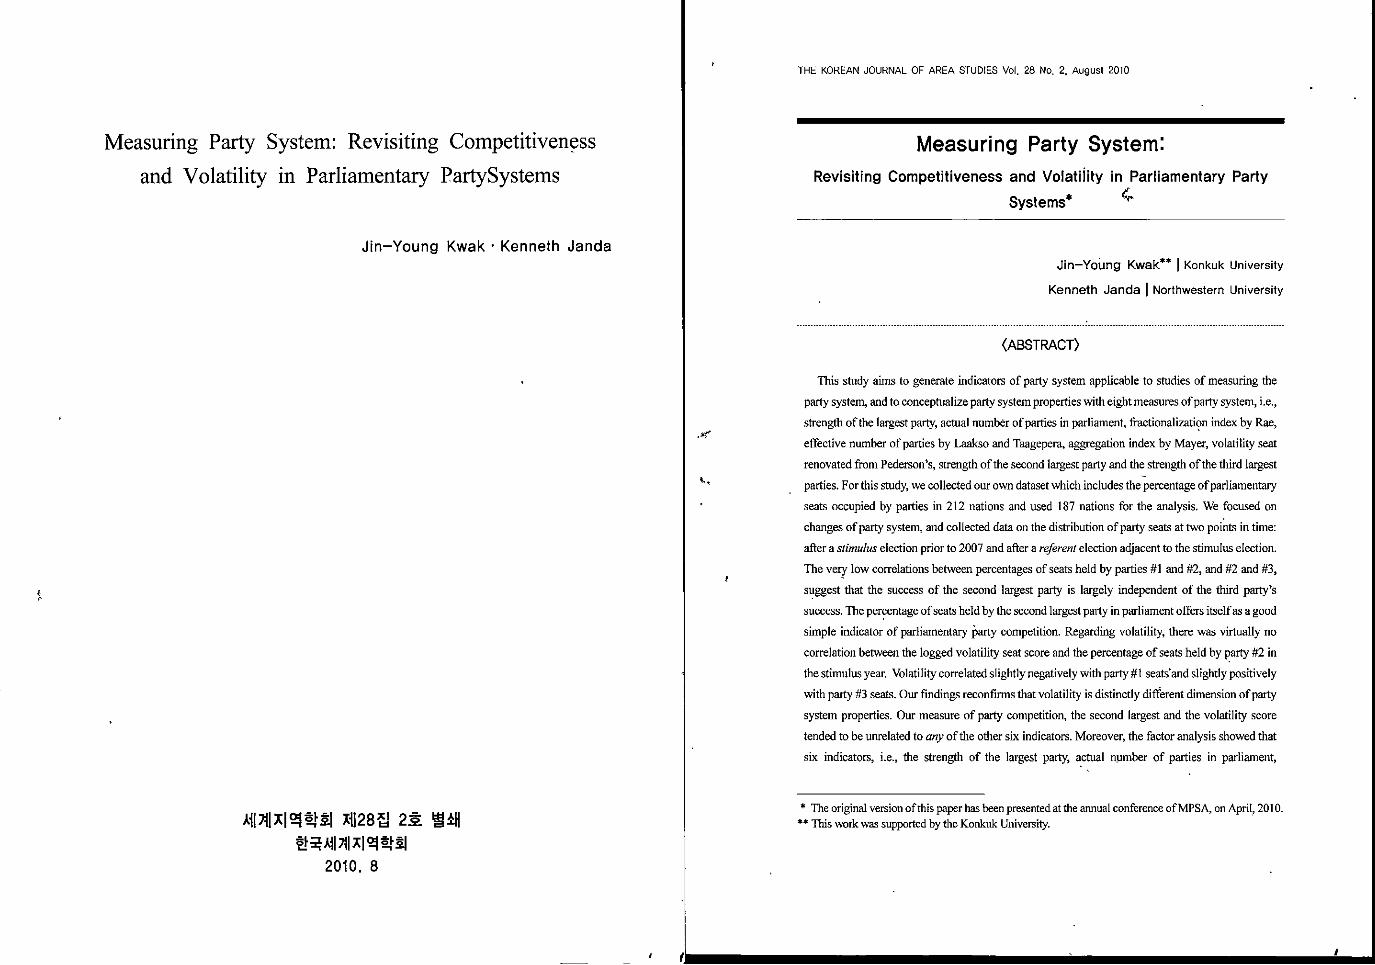
This study aims to generate indicators of party system applicable to studies of measuring the
party system, and to conceptualize party system properties with eight measures ofparty system, i.e.,
strength of the largest party, actual number of parties in parliament, fractionalization index by Rae,
effective number of parties by Laakso and Taagepera, aggregation index by Mayer, volatility seat
renovated from Pederson's, strength of the second largest party and the strength of the third largest
parties. For this study, we collected our own dataset which includes the percentage of parliamentary
seats occupied by parties in 212 nations and used 187 nations for the analysis. We focused on
changes ofparty system, and collected data on the distribution ofparty seats at two points in time:
after a stimulus election prior to 2007 and after a referent election adjacent to the stimulus election.
The very low correlations between percentages of seats held by parties #1 and #2, and #2 and #3,
suggest that the success of the second largest party is largely independent of the third party's
success. The percentage of seats held by the second largest party in parliament offers itself as a good
simple indicator of parliamentary party competition. Regarding volatility, there was virtually no
correlation between the logged volatility seat score and the percentage of seats held by party #2 in
the stimulus year. Volatility correlated slightly negatively with party # 1 seats'and slightly positively
with party #3 seats. Our findings reconfirms that volatility is distinctly different dimension ofparty
system properties. Our measure of party competition, the second largest and the volatility score
tended to be unrelated to any of the other six indicators. Moreover, the factor analysis showed that
six indicators, i.e., the strength of the largest party, actual number of parties in parliament,
* The original version of this paper has been presented at the annual conference of MPSA, on April, 2010. ** This work was supported by the Konkuk University.
22 II THE KOREAN JOURNAL OF AREA STUDIES Vol. 28 No. 2, August 2010
fractionalization, effective number of parties, aggregation index, and the strength of the third largest
party, load on Factor 1, which could be named as party system fragmentation. The strength of the
second largest party load on Factor 2, which could be named as "Party system competitiveness."
However, the volatility measure again did not correlate systematically and sufficiently with any of
the other indicators. This confirms that we could use volatility for another independent indicator for
measuring party system.
Key words: Party system, competitiveness, volatility, fractionalization
I . Introduction
Contemporary party theorists agree that a modern state cannot practice democracy without
competitive political parties.2) A United Nations publication says,. "In many countries today,
political patties are an essential part of the apparatus of governance3)
However, people across the world have a love-hate relationship with political parties. Parties
are highly valued by most scholars for enabling popular control of government but are distrusted
by many leaders and citizens.4) As two experts write, "The widespread perception that parties are
procedurally necessary for the effective functioning of democracy does not translate into their
being widely supported or respected.5) Ambivalent judgments about the role of parties in-
government appear in these conflicting statements by other party scholars. One praises their
2) See, for example, Peter Mair, "Comparing Party Systems," in Comparing Democracies 2: New Challenges in the Study of Elections and Voting, ed. Lawrence LeDuc, Richard G. Niemi, and Pippa Norris (London: Sage, 2002), pp. 88 - 107.
3) Democratic Governance Group* A Handbook on Working With Political Parties. (New York: United Nations Bureau for Development Policy, United Nations Development Programme, 2006), p."9. See also Michelle Kuenzi and Gina Lambright, "Party Systems and Democratic Consolidation in Africa's Electoral Regimes," Party Politics, Vol. 11 (July 2005), pp.423-446.
4) After analyzing trends in survey data in advanced industrial democracies, Dalton and Weldon find that "weakening parry ties are nearly universal." Russell J. Dalton, and Steven Weldon, "Is the Parry Over? Spreading Antipathy Toward Political Parties," Public Opinion Pros, (May, 2005). http://www.cses.org/resources/results/POP_May2005.htm
5) Ingrid van Biezen and Michael Saward, "Democratic Theorists and Party Scholars: Why They Don't Talk to Each Other, and Why They Should," Perspectives on Politics, Vol. 6 (March, 2008), p. 21.
Jin-Young Kwak • Kenneth Janda II 23
contributions to democratic theory,6) but another thinks that parties have not delivered on their
promised contributions.7)
While we usually agree with the importance of political parties in democratization and
democratic consolidation, it is not easy to find the research that attempts to show those contributions
of political parties. 8) Part of the causes' could come out of the absence of available data which
contain the major variables for understanding party systems worldwide. The other part of the causes
could be found in difficulties of developing indicators for measuring party system.
This study aims to generate the operationalized indicators ofparty system9) with self-collected
parliamentary party system data. In fact, the previous studies of party- systems have used
indicators mainly based on electoral results such as the percentage of votes each party earned in
elections. However, when we seek to analyze the party system, we'd better look at the
parliamentary party system, the seats of each party in the parliament, which ismore related to the
political system governability.
The purpose of this study is to generate indicators ofparty system relevant to measure the
party system, and to identifying the concepts of party properties by empirical testing of those
indicators ofparty system with other alternative measures. For thisjstudy, we collected dataset
which includes % of parliamentary seats occupied by parties in 18*9 nations10) and used 187
nations for the analysis-.
6) Richard Herrera, "The Origins of Opinion of American Party Activists," Party Politics, Vol. 5 (April 1999), p. 237.
7) S. C. Stokes, "Political Parties and Democracy," in Annual Review of Political Science, Vol. 2 (1999), p. 263.
8) Vicky Randall and Lars Svasand, "The Contribution of Parties to Democracy and Democratic Consolidation," Democratization, Vol. 9 (2002), p. 3.
9) Newcomers to comparative party politics are sometimes surprised to learn that political parties and party systems are different units of analysis, and they often have difficulty distinguishing the study of parties from party systems. The distinction was formalized in Maurice Duverger's pioneering 1951 study, Les Partis Politiques, which was divided into Book I, "Party Structure," and Book II, "Party Systems." Other texts since have followed that format. Ware's, Political Parties and Party Systems (1996) adopts a similar format. See also Giovanni Sartori, Parties and Party Systems: A Framework for Analysis (London: Cambridge University Press, 1976); and Jan-Erik Lane and Svante O. Ersson, Politics and Society in Western Europe, 3rd Edition. (London: SAGE Publications, 1994), p. 180.
10) Our dataset include 212 nations. However, for measuring party system competitiveness and-volatility, we include 187nations which have the data of % of seats by #1, #2, and #3 parties of two different elections.
24 II THE KOREAN JOURNAL OF AREA STUDIES Vol. 28 No. 2, August 2010
n. The Dimensions of Party System
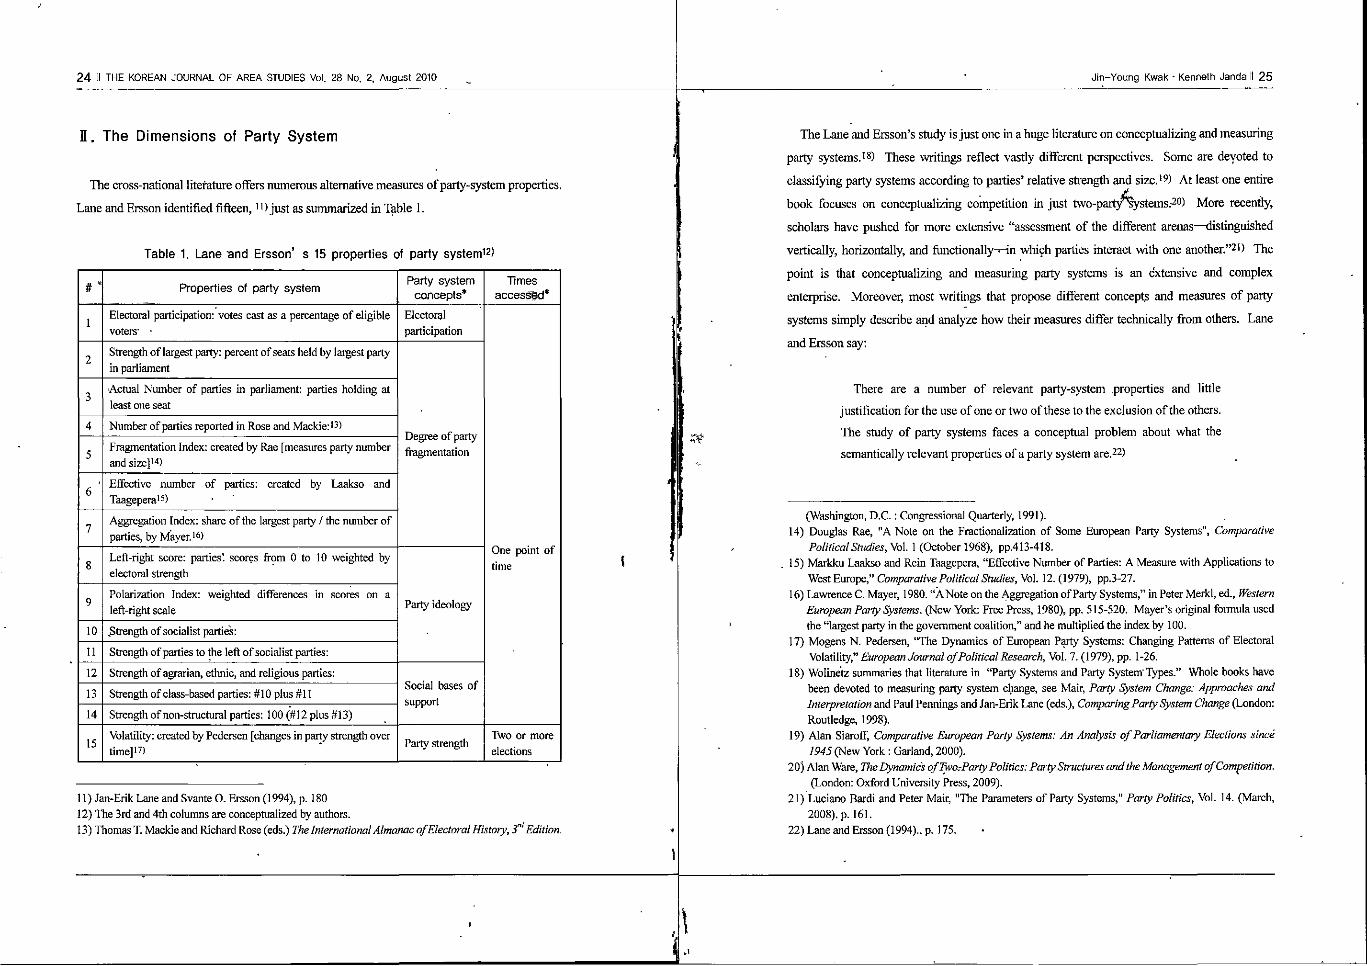
The cross-national literature offers numerous alternative measures of party-system properties.
Lane and Ersson identified fifteen,]') just as summarized in Table 1.
Table 1. Lane "and Ersson' s 15 properties of party system12)
# s
1
2
3
4
5
6 '
7
8
9
10
11
12
13
14
15
Properties of party system
Electoral participation: votes cast as a percentage of eligible voters' •
Strength of largest party: percent of seats held by largest party in parliament
Actual Number of parties in parliament: parties holding at least one seat
Number of parties reported in Rose and Mackie:13)
Fragmentation Index: created by Rae [measures party number and size]14)
Effective number of parties: created by Laakso and Taagepera15)
Aggregation Index: share of the largest party / the number of parties, by Mayer.16)
Left-right score: parties' scores from 0 to 10 weighted by electoral strength
Polarization Index: weighted differences in scores on a left-right scale
.Strength of socialist parties:
Strength of parties to the left of socialist parties:
Strength of agrarian, ethnic, and religious parties:
Strength of class-based parties: #10 plus #11
Strength of non-structural parties: 100 (#12 plus #13)
Volatility: created by Pedersen [changes in party strength over time]17)
Party system concepts*
Electoral participation
Degree ofparty fragmentation
Party ideology
Social bases of support
Party strength
Times accessed*
One point of time
Two or more elections
11) Jan-Erik Lane and Svante O. Ersson (1994), p. 180 12) The 3rd and 4th columns are conceptualized by authors. 13) Thomas T. Mackie and Richard Rose (eds.) The International Almanac of Electoral History, 3rdEdition.
Jin-Young Kwak • Kenneth Janda II 25
The Lane and Ersson's study is just one in a huge literature on conceptualizing and measuring
party systems.18) These writings reflect vastly different perspectives. Some are devoted to
classifying party systems according to parties' relative strength and size.19) At least one entire
book focuses on conceptualizing competition in just two-party^ystems.-20) More recently,
scholars have pushed for more extensive "assessment of the different arenas—distinguished
vertically, horizontally, and functionally^-in which parties interact with one another."2') The
point is that conceptualizing and measuring party systems is an extensive and complex
enterprise. Moreover, most writings that propose different concepts and measures of party
systems simply describe and analyze how their measures differ technically from others. Lane
and Ersson say:
There are a number of relevant party-system .properties and little
justification for the use of one or two of these to the exclusion of the others.
The study of party systems faces a conceptual problem about what the
semantically relevant properties of a party system are.22)
(Washington, D.C.: Congressional Quarterly, 1991). 14) Douglas Rae, "A Note on the Fractionalization of Some European Party Systems", Comparative
PoliticalStudies,No\. 1 (October 1968), pp.413-418. 15) Markku Laakso and Rein Taagepera, "Effective Number of Parties: A Measure with Applications to
West Europe," Comparative Political Studies, Vol. 12. (1979), pp.3-27. 16) Lawrence C. Mayer, 1980. "A Note on the Aggregation of Party Systems," in Peter Merkl, ed., Western
European Party Systems. (New York: Free Press, 1980), pp. 515-520. Mayer's original formula used the "largest party in the government coalition," and he multiplied the index by 100.
17) Mogens N. Pedersen, "The Dynamics of European Party Systems: Changing Patterns of Electoral Volatility," European Journal of Political Research, Vol. 7. (1979), pp. 1-26.
18) Wolinetz summaries that literature in "Party Systems and Party System" Types." Whole books have been devoted to measuring party system change, see Mair, Party System Change: Approaches and Interpretation and Paul Pennings and Jan-Erik Lane (eds.), Comparing Party System Change (London: Routledge, 1998).
19) Alan Siaroff, Comparative European Party Systems: An Analysis of Parliamentary Elections since 1945 (New York : Garland, 2000).
2 0) Alan Ware, The Dynamics ofTworParty Politics: Party Structures and the Management of Competition. (London: Oxford University Press, 2009).
21) Luciano Bardi and Peter Mair, "The Parameters of Party Systems," Party Politics, Vol. 14. (March, 2008). p. 161.
22) Lane and Ersson (1994)., p. 175.
26 II THE KOREAN JOURNAL OF AREA STUDIES Vol. 28 No. 2, August 2010 Jin-Young Kwak • Kenneth Janda II 27
Although we do not try to achieve definitive results in our empirical analysis ofparty system
effects on governing, we hope to cpntribute to understanding by analyzing the alternative
measures laid out by Lane and Ersson. We skip their measure of electoral participation^ 1),
which pertains to voters not to parties. The next six measures (#2 through #7) deal in some way
with the number and strength of parties—fitting under the broader concept of degree ofparty
fragmentation. Four items (#8 through #11) involve estimating party ideology, and three (#12
through #14) rely on estimating social bases of support. All of the first fourteen measures assess
party systems at just one point in time. Only #15, volatility, measures changes in party strength
over two or more elections, making it truly different from the others.
After computing intercorrelations among all fifteen indicators for 201 elections from 1945 to
1989 in 16 countries, Lane and Ersson found that the six strength and competition measures
co-varied together as did most of the several policy and social support measures.23) They said,
however, "Volatility does not co-vary with any of the other party system dimension, which
reflects the circumstance that volatility stands forparty system instability in general."24) We
build on these findings in identifying attributes ofparty systems in 189 countries.
I . Parliamentary Party Data •
1. Focusing on Parliamentary Party Systems
Most scholars contend that a party "system" requires more than one party. Sartori's definition
is typical: a party system is "the system of interactions resulting from inter-party competition."25)
Earlier and later writers agree that a party system requires competition between at, least two
parties.26) However, often the same writers blithely talk about a one-party system.27) In the
23) Lane and Ersson (1994). p. 180. However, the left-right scores and polarization index correlated only -.42.
24) Ibid.tp. 181. 25) Giovanni Sartori (1976), p. 44. Emphasis removed. 26) Alan Ware (1996), p. 7; and Steven B. Wolinetz, '(2006), p. 52 27) G. Sartori (1976), however, avoids speaking of a one-party system, which he refers to instead as a
"party-state system," p. 45
3fr
concluding essay to his edited book on comparative political parties, an eminent scholar once
wrote, "Only the co-existence of at least one other competitive group makes a political party
real."28) Nevertheless, his book included a chapter on the "Communist Party of the Soviet
Union"—a one-party state. ™
In truth, comparative party scholars repeatedly refer to one-party, two-party, and multiparty
systems, -so we need a definition that accommodates one-party systems—such as China.
Accordingly, we define a party system as the pattern of interactions of one or more political
parties with government, citizens, and other parties. In short, we broaden the concept of a party
system to include as actors the government and the public—not just competing parties. We
narrow the concept's application in this study to parties in parliaments, excluding elections.
In countries with competitive elections, political parties operate most publicly during election
campaigns.29) Parties are more widely visible 'in parliamentary than presidential elections.
Virtually all countries have parliaments or legislatures, while relatively few countries elect
presidents.30) Moreover, parties are banned from presidential elections in some countries.31)
Parliaments, in contrast, offer a nearly universal basis for cross-national analysis of political
parties. Unfortunately, data for parliamentary elections often go unreported in smaller countries.
28) Sigmund Neumann (ed.), Modern Political Parties: Approaches to Comparative Politics. (Chicago: University of Chicago Press, 1965), p. 395.
29) Here, a political party is defined an organization that seeks to place its avowed representatives in government positions. 'To place" means through competitive elections or political appointments, which occurs in authoritarian governments. "Avowed representatives" means that candidates must"
• compete under the party's name'or publicly identify with the party when in office. "Government positions," for our purposes, means seats in a parliament or legislature. See Kenneth Janda, Political Parties: A Cross-National Survey. (1980), p. 5.
30) For discussion of presidential and parliamentarism see Jose Antonio Cheibub, Zachary Elkins, and Tom Ginsburg, "Beyond Presidentialism and Parliamentarism: On the Hybridization of Constitutional Form," Prepared for the Comparative Constitutional Law Roundtable, George Washington University Law School. Washington, DC. (March 6, 2009). For discussions of their effects on party government see George Tsebelis, Tsebelis, George, "Veto Players and Institutional Analysis," Governance, Vol. 13. (October, 2000). pp. 441474.; and Paul Webb, "Presidential" Rule and the Erosion of Party Government in Parliamentary Systems: The Case of the United Kingdom ," [Original'Title La "presidenzializzazione" e 1'erosione del governo di partito nei sistemi parlamentari: il caso del Regno Unito "] Rivista Italiana di ScienzaPolitico, Vol. 34. (December, 2004), pp. 347-377.
31) National constitutions in some twenty countries prohibit presidents from affiliating with political parties. See Kenneth Janda,'Adopting Party Law. (Washington DC: National Democratic Institute, 2005), p. 21.
28 II THE KOREAN JOURNAL OF AREA STUDIES Vol. 28 No. 2, August 2010
Fortunately, one can almost always learn the percentage distribution of parliamentary party seats
after elections. Needing to score as many polities as possible on features of their party systems,
we collected data on the percentage ofparty seats held in lower chambers, not on the percentage
of votes cast for parties in parliamentary elections.
The percentage of party seats held in parliament is also theoretically -more relevant to our
research than the percentage ofparty votes. Because most electoral systems distort translating
votes won to seats won, party success in elections does not necessarily produce party control of
parliament. In presidential systems—which pomprise about 25 percent of the 212 countries in
our population—party success in legislative elections does not even correspond to heading the
government. Granted that parties play different roles in presidential than parliamentary
governments, parties in parliament play a more direct role in government than parties in
elections.32) So both practical and theoretical considerations led to collecting data on
parliamentary parties.
To assess the effect of parliamentary party systems on governing, we need to focus on changes
ofparty system rather than a property ofparty system at one point of time. Thus we collected
data on the distribution ofparty seats at two points in time: after a stimulus election prior to 2007
and after a referent election adjacent to the stimulus election.
We collected our own data for this research from various Internet resources. By far the most
important sources for the stimulus election were Adam Carr Election Archives33) and Wikipedia
Election Results by Country.34) Finding data for the referent election proved to be more difficult,
forcing us to scour the Internet for information. The Inter-Parliamentary Union35) helped
considerably, as did the African Elections Database.36)
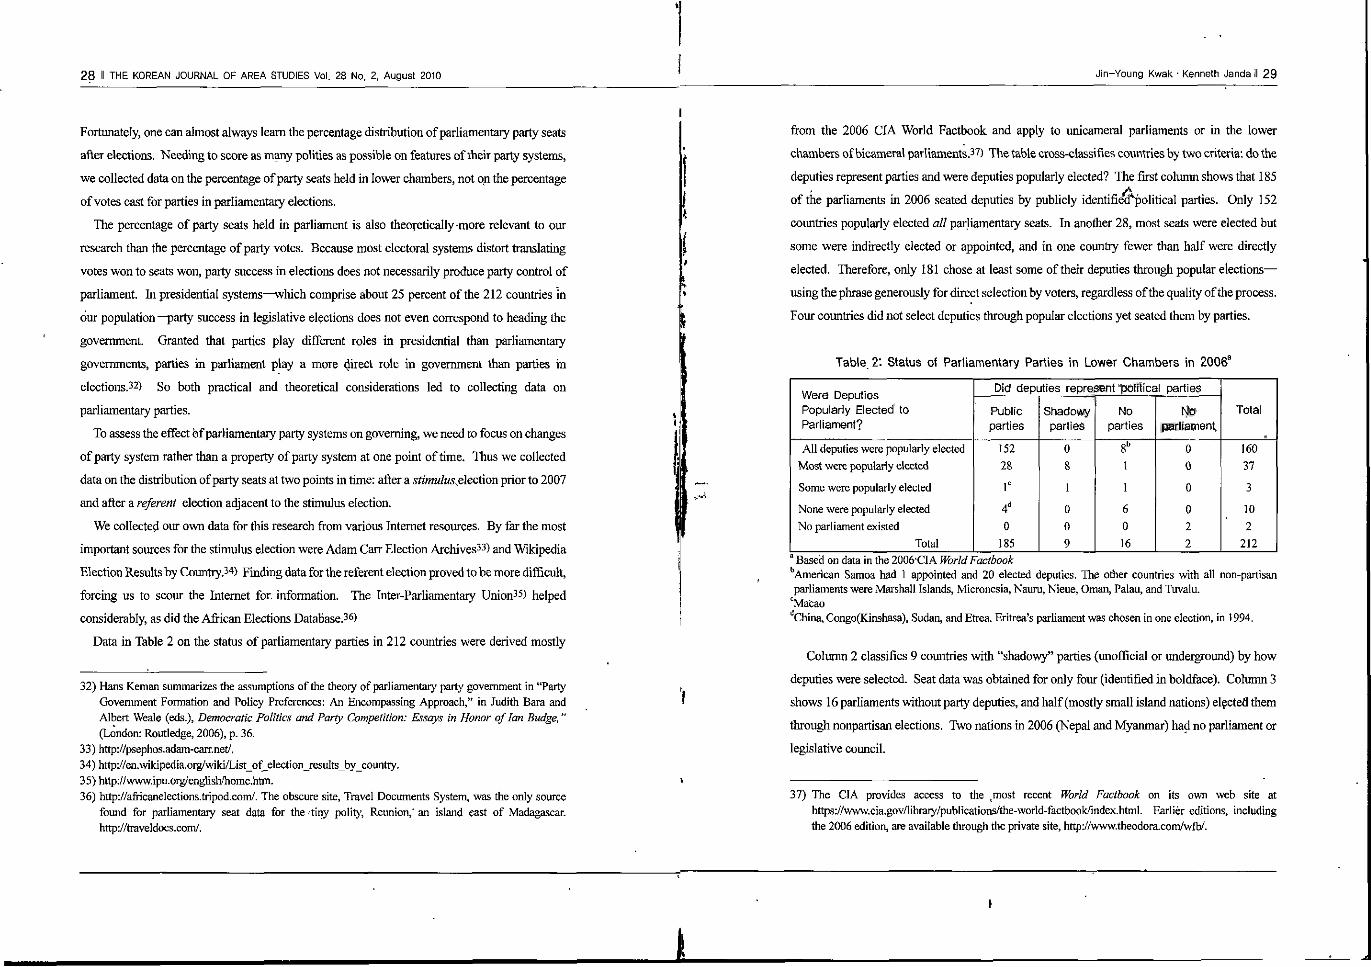
Data in Table 2 on the status of parliamentary parties in 212 countries were derived mostly
32) Hans Keman summarizes the assumptions of the theory of parliamentary party government in "Party Government Formation and Policy Preferences: An Encompassing Approach," in Judith Bara and Albert Weale (eds.), Democratic Politics and Party Competition: Essays in Honor of Ian Budge," (London: Routledge, 2006), p. 36.
33) http://psephos.adam-carr.net/. 34) http://en.wikipedia.org/wiki/List_of_election_resuIts_by_country. 35) http://www.ipu.org/english/home.htm. 36) http://africanelections.tripod.com/. The obscure site, Travel Documents System, was the only source
found for parliamentary seat data for the -tiny polity, Reunion,' an island east of Madagascar. http://traveldocs.com/.
Jin-Young Kwak • Kenneth Janda II 29
from the 2006 CIA World Factbook and apply to unicameral parliaments or in the lower
chambers of bicameral parliaments.37) The table cross-classifies countries by two criteria: do the
deputies represent parties and were deputies popularly elected? The first column shows that 185 J*
of the parliaments in 2006 seated deputies by publicly identified*political parties. Only 152
countries popularly elected all parliamentary seats. In another 28, most seats were elected but
some were indirectly elected or appointed, and in one country fewer than half were directly
elected. Therefore, only 181 chose at least some of their deputies through popular elections—
using the phrase generously for direct selection by voters, regardless of the quality of the process.
Four countries did not select deputies through popular elections yet seated them by parties.
Table 2: Status of Parliamentary Parties in Lower Chambers in 2006a
Were Deputies Popularly Elected to Parliament?
All deputies were popularly elected Most were popularly elected
Some were popularly elected
None were popularly elected No parliament existed
Total
Did deputies represent political parties
Public parties
152 28
r
4d
0 185
Shadowy parties
0 8
1
0 0 9
No parties
8b
1
1
6 0 16
No parliament
0 0
0
0 2 2
Total
160
37
3
10 2
212 Based on data in the 2006'CIA World Factbook
bAmerican Samoa had 1 appointed and 20 elected deputies. The other countries with all non-partisan parliaments were Marshall Islands, Micronesia, Nauru, Nieue, Oman, Palau, and Tuvalu.
cMacao dChina, Congo(Kinshasa), Sudan, and Etrea. Eritrea's parliament was chosen in one election, in 1994.
Column 2 classifies 9 countries with "shadowy" parties (unofficial or underground) by how
deputies were selected. Seat data was obtained for only four (identified in boldface). Column 3
shows 16 parliaments without party deputies, and half (mostly small island nations) elected them
through nonpartisan elections. Two nations in 2006 (Nepal and Myanmar) had no parliament or
legislative council.
37) The CIA provides access to the tmost recent World Factbook on its own web site at https://www.cia.gov/library/publications/the-world-factbook/index.html. Earlier editions, including the 2006 edition, are available through the private site, http://www.theodora.com/wfb/.
30 Ii THE KOREAN JOURNAL OF AREA STUDIES Vol. 28 No. 2, August 2010
2. Parliamentary Party Data After Stimulus Elections
Although party seat data are more readily available than party vote data, obtaining even party
seat data for 212 polities after the'stimulus election was challenging and tedious. Despite the
abundance of Internet resources on the world's countries, party politics are not well covered in
many smaller countries. We narrowed the task by collecting data on only the three largest
parliamentary parties elected in a national election held prior to 2007—the starting year of our
study. With one exception, we fixed 2005 as the last date for a stimulus election. The distribution
of years in which stimulus elections were held is reported in Table 3. It shows that about 20
percent of the stimulus elections were held in 2005 and almost 85 percent occurred from 2002 to
2005. The earliest elections (1992,1994, and 1996) were in Angola, Eritrea, and the Palestinian
Territories (respectively). Ten nations (Bhutan, Brunei, Libya, Myanmar, Nepal, Oman, Qatar,
Saudi Arabia, Somalia, and United Arab Emirates) did not hold elections to elect a parliament or
legislative council, although all but Nepal and Myanmar had such a body.
Table 3: Dates for the Stimulus Elections
year
Frequency
Percent
1992
I
.5
1994
1
.5
1996
1
.5
2000
3
1.4
2001
19
9.0
2002
44
20.8
2003
36
17.0
2004
51
24.1
2005"
45
21.2
Total Elections
202
94.8
No elections
10
5.2
Total Countries
212
100.0
8 Includes the January 25,2006 election in the Palestinian Territories
As implied by Table 2, some of the 202 elections in Table 3 were non-partisan, and elected no
party deputies. In all, we scored 189 countries for seats held by the three largest parties after the
stimulus election. Table 4 reports that the three largest parties in those countries held an average
82.5 percent of all the parliamentary seats. The median was 89 percent, meaning that in half the
countries the three largest parties accounted for nearly 90 percent of all Jhe seats in parliament.
While we exclude some parliamentary representation by focusing on the top three parties, we
don't miss much.
However, we do miss a lot of small parliamentary parties. A separate count of the total number
of parties seated in parliament revealed that the average parliament seated 6.7 parties, with a high
Jin-Young Kwak • Kenneth Janda II 31
of 39 in Colombia. In few countries, however, do any parties ranking fourth or lower hold an
appreciable percentage of seats. As disclosed in Table 4, the largest party in 189 parliaments
after the stimulus election averaged almost 51.7 percent of the seats, compared with about 23.2
percent for the next largest and 7.6 percent for the third. In one country (Malta), the second
largest party held 49.3 percent of the seats to 50.7 for the-largest party. The close division of
parliamentary seats in Malta between its two largest parties implies a high degree of interparty
competition. Later we rely on the percentage of seats held By the second largest party as a prime
indicator ofparty system competitiveness.
Table 4: Seats Held by Three Largest Parties after Stimulus Elections in 189 Countries
Largest party % of seats
Second party % of seats
Third parry % ofseats
Sum of all three parties
Minimum
7.0a
.0b
.0C
11.0d
Mean
51.7
23.2
7.6
82.5
Maximum
100.0
49.3
24.0
100.0
"Some countries (e.g., Belarus, Macao and Kyrgyzstan) elected few deputies by parties, resulting in the largest party having a tiny percentage of all parliamentary seats.
'The "second largest" party got 0 percent ofseats in 11 one-party parliaments. ""The "third largest" party held 0 percent ofseats in 27 two-party parliaments. dParty deputies accounted for just 11 percent of all parliamentary seats in Belarus.
3. Parliamentary Party Data After Referent Elections
To evaluate party system stability, we compare how the three largest parties in the stimulus
election performed in a referent election—a temporally adjacent election. Initially, we thought
that the referent election should be prior to the stimulus election. One can argue to the contrary
that stability should be assessed over the lifespan of the parliament responsible for governance in
target year, not for a prior period. For some nations, moreover, an election after 2005 may more
accurately represent the party systems' maturity.
Practical considerations resolved the argument in many cases. Elections prior to 2005 often
occurred many years earlier and involved defunct parties. Elections after 2005 sometimes
reflected more comparable party systems. The wide range of dates in Table 5 hints at our
difficulty in choosing referent elections. Although we favored choosing earlier elections, we
32 II THE KOREAN JOURNAL OF AREA STUDIES Vol. 28 No. 2, August 2010
chose post-2005 elections for about 35 percent of the polities. In two cases (Cuba and Pakistan)
we choose 2008. Also in two cases, we were forced to choose years before 1990 (Angola, 1986
and Rwanda, 1988). .Eritrea's parliament, elected in 1994, has had no election since. The 11
polities that had no reference elections match the 10 polities in Table 5 that had no stimulus
elections plus Afghanistan, which had an election in 2005 but none (to date) afterward.
Table 5: Dates for the Referent Elections
Year
Frequency
Percent
1986
1
.5
1988
1
.5
1993
2
.9
1995
1
.5
1996
4
1.9
1997
7
3.3
1998
14
6.6
1999
32
15.1
2000
28
13.2
Year
Frequency
Percent
$301
18
8.5
2002
12
5.7
2003
4
1.9
"20TJ5
1
.5
2006
44
20.8
Total countries =
2007
30
14.2
212
2008
2
.9
Total Elections3
201
94.8
No Elections
11
5.2
"Eritrea had only one election, in 1994.
Although the Internet provided useful sources of information on parliamentary party
compositions, the data had to be sifted and analyzed before determining how many seats each
party held, and even which party was which. Different sources sometimes reported different
figures. Often the sources differed on party names. Too often the parties experienced splits or
mergers between elections, making it difficult to trace parties across elections and posing
difficulties in deciding how to allocate percentages after party splits. We checked the party labels
with references ofparty system from various sources and asked country experts' help for tracing
party changes.
Coir scoring results for parliamentary seats following the referent election are presented in
Table 6. The scoring procedures used in Tables 4 and 6 need explanation. Whereas Table 4
reports on the three largest parties according to their size after the stimulus election, Table 6
reports on the same three parties regardless of rank after the referent election. For example, the
Jin-Young Kwak • Kenneth Janda II 33
Mexican PRI was the largest party after the 2003 stimulus election, holding 45 percent of the
seats. After the 2006 referent election, the PRI won only 24 percent, making it the second largest.
Nevertheless, we compared the PRI's seat percentages in,2003 with 2006. The process was
reversed for the Mexican PAN, the second largest party in 2003 with 30 percent of the seats but
the largest party in 2006, with 41 percent. The PRI's percentage in Table 6 is included among the
largest parties after the stimulus election and the PAN's percentage is counted among the second
largest parties.
Table 6: Seats Held by Three Largest Parties after Referent Elections in 189 Countries
Size Status in Stimulus Year
Largest party % ofseats
Second party % ofseats
Third party % of seats'
Sum of all three parties
Minimum
.0
.0
.0
.0
Mean
42.4
23.0
7.8
73.2
Maximum
100.0
100.0
55.0
100.0
Often the largest party after the stimulus election was no longer the largest after the referent
election, causing the mean percentage of seats held by the largest party's to drop substantially
(51.7 versus 42.4) between Table 4 and 6. In some dramatic cases; parties holding a
parliamentary majority after the stimulus election held no seats at all after the referent election.
Nevertheless; the correlation is substantial (r = .60) between the percent of seats held by the
largest party in the stimulus election and that party's performance in the referent election (p<.05).
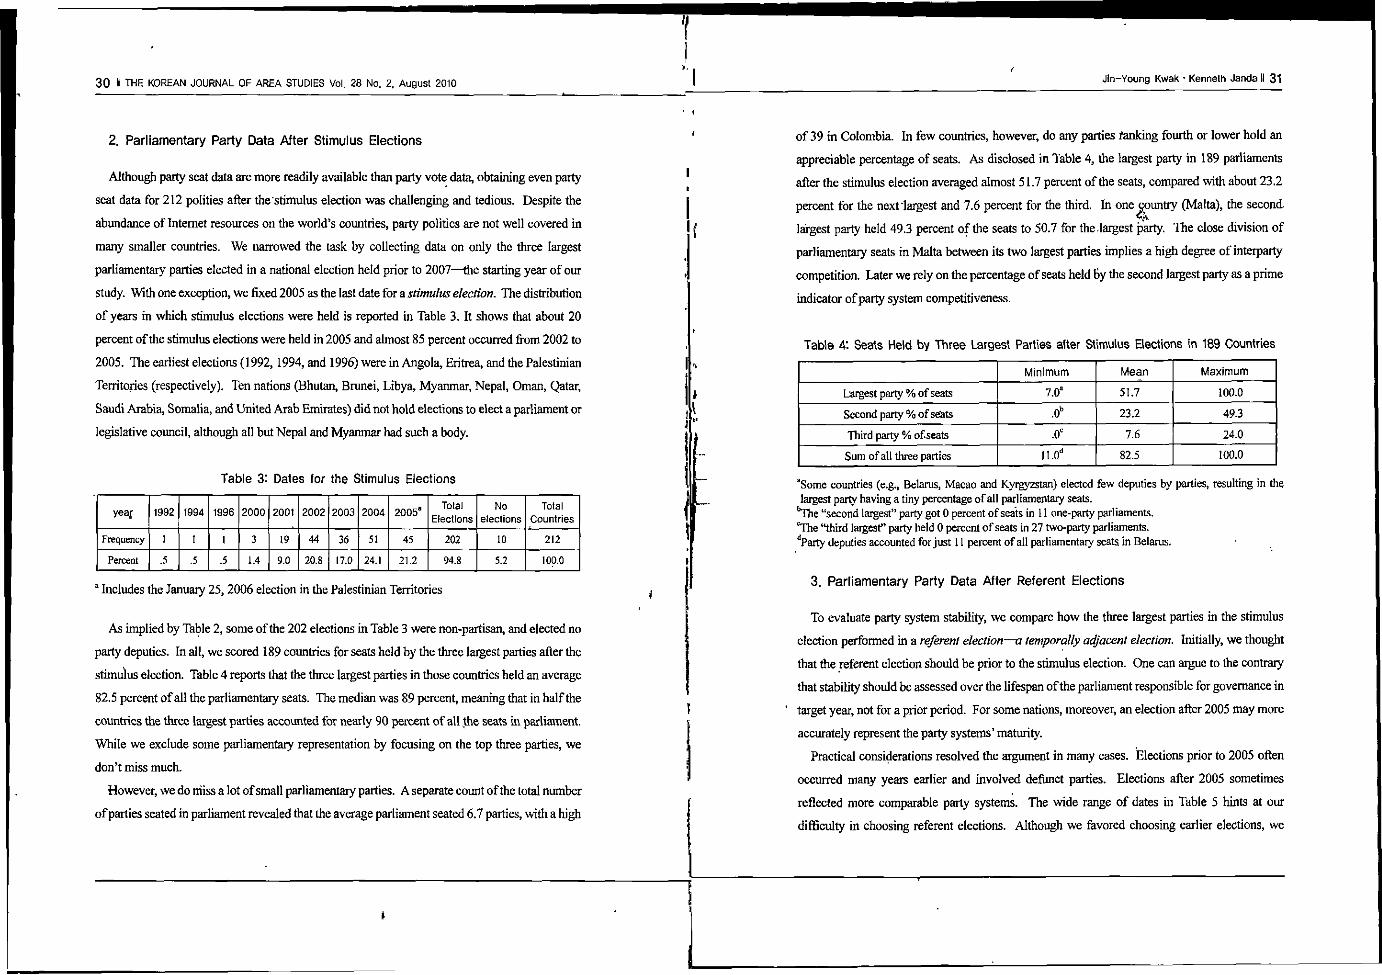
Figure la graphs that correlation, for all 189 party systems. Figures lb and lc graph the
correlations of .52 and .48 between the seats won by the second and third parties in the stimulus
elections and the referent elections (p<.05). Note that the maximum percentage of seats held
after the stimulus election is logically limited to 49.9 percent for-the second largest party and to
33.3 percent for the third largest party. Note also that their seat percentages are not bounded for
the referent election, that is, they can win greater seat percentages in referent elections.
34 II THE KOREAN JOURNAL OF AREA STUDIES Vol. 28 No. 2, August 2010
Figure ,nd 1: Correlation Plots for the 1st, 2na, and 3rd Largest Parties in Parliament after
the Stimulus Election, and How They Fared in the Referent Election
<Figure la> <Figure lb> <Figure lc>
; HI.
i t "s
* i
""
F-.60
„ 0
-Mi o %S*B t*f%
e4°° o
° o ° 0 ° • v »
*°s2r y&>a r
•hr, ' *.'
°D * "got, D
° °» /
„ «- *
°
° B
£ _ £ f „
t •"* £
r«.52 °
/ ' ° s °'' -Z*̂ » s $" /
J4tfi' '$£&•."
^ a , = s ° Ptrtv'iftln nlmaluf y*« Party <T3%\n mtim>ilui* Piiiy *3 R tn H*mulnt ytfcr
We use these six variables (three measures of party strength in two different elections) in
deriving alternative measures of parliamentary party systems. '
IV. Testing Party System Indicators
1. Party System Competition
We collected data on parliamentary party distribution in order to generate measures ofparty
system competition. Table 7 reports statistics for percentage ofseats held by the top three parties
in the 187 polities that had deputies seated by parties even in parliaments for which some seats
were appointed. The minimum value of 7 percent for the largest party in parliament comes from
the stimulus election of 2004 in Belarus, where most seats in the stimulus election were won by
nonparty groups, except for the 7 percent won by the Communist Party. The maximum value of
100 percent for the second largest party in a reference election is attributed to Monaco, where a
party that won all the seats in 1998 was not the largest party in 2003.
Jin-Young Kwak • Kenneth Janda II 35
\,
Table 7: Means and Standard Deviations for Percent Seats Held by the Original Top
Three Parties in Both Elections
Party #1 % in stimulus year
Party #1 % in referent year
Party #2 % in stimulus year
Party #2 % in referent year
Party #3 % in stimulus year
Party #3 % in referent year
N
187
187
187
187
187
187
Minimum
7.0
.0
.0
.0
.0
.0
Maximum ft*
100.0
100.0
49.3
100.0
24.0
55.0
Mean
51.7'
42.2
23.3
22.9
7.6
7.8
Std. Dev.
20.9
28.2
12.5
21.0
6.3
9.9
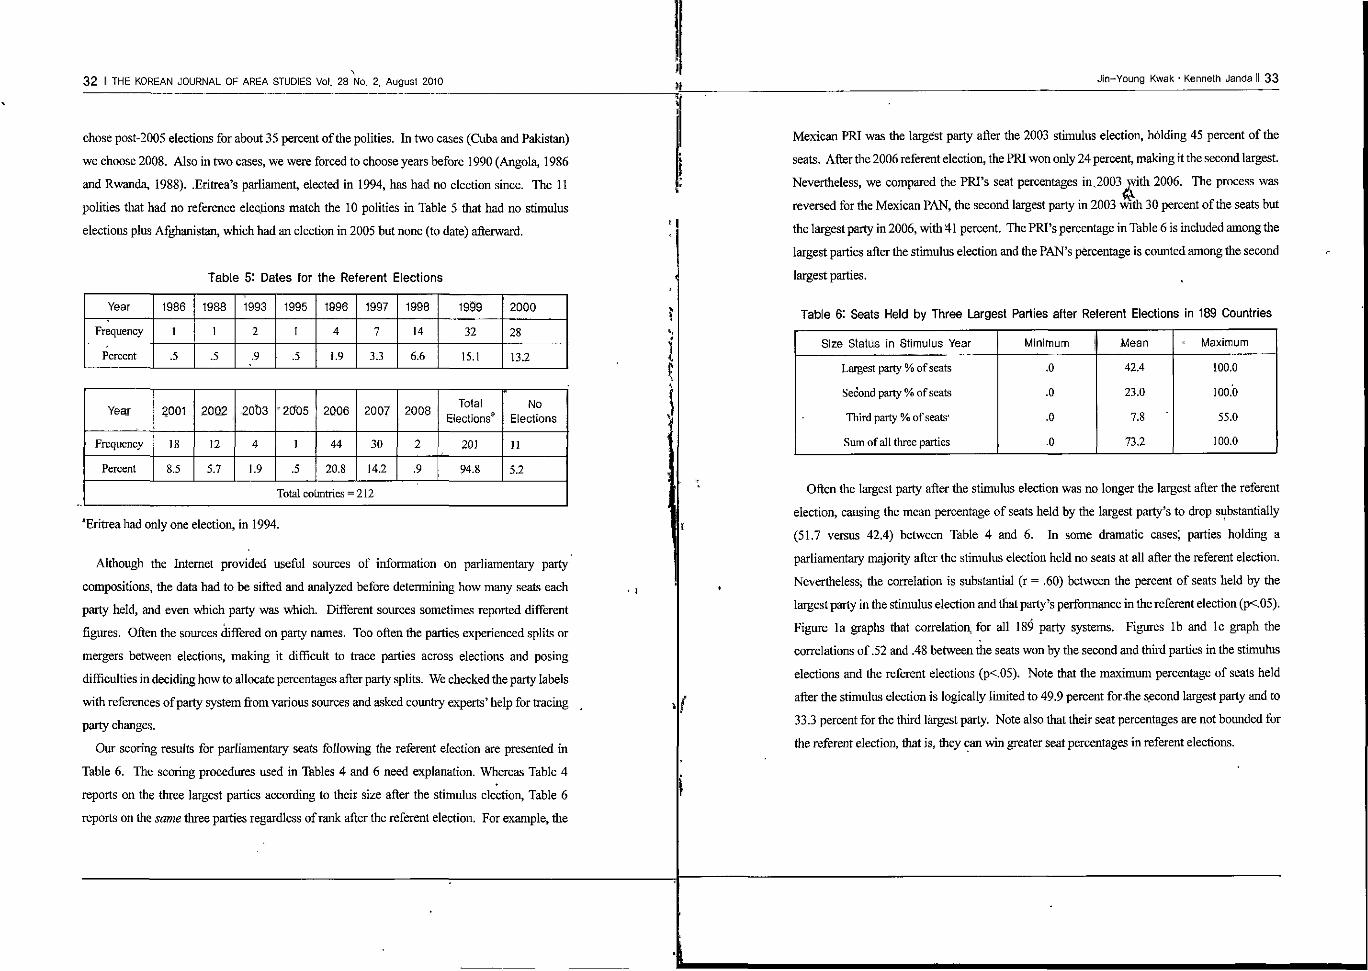
Figures 2a and 2b are histograms that graph the distribution of the percentages ofseats held by
the largest parties in the stimulus year and by the same parties in the referent years, superimposed
with the line for a normal curve. The figures reflect the data in the first two rows of Table 7. Two
features stand out in these distributions. (1) The percentage distribution in the stimulus year is
unimodal, fairly symmetrical, and approximately normal around a mean of 51.7. (2) The
comparable distribution for the same parties in the referent year has a much lower mean (42.2)
and higher standard deviation (28.2 v. 20.9). Note also that more than 15 of the largest parties in
the stimulus year held virtually no seats in the referent year.
Figures 2a and 2b: Histograms for Seat % Held by Party #1, Both Years
<Figure 2a: stimulus yr>' <Figure 2b: referent yr>
isii ins tas aa nio i»< Pjrtv f LXIn itfflwlui vur
i i vsa nn tis aa IWJJ Pirty «. % In reftteitt yttr
Figures 2a arid 2b differ because they do not simply display the percentage ofseats held by the
36 II THE KOREAN JOURNAL OF AREA STUDIES Vol. 28 No. 2. August 2010
"largest party" in each year. Instead, they track how well party #1 (the largest party in the
stimulus year) fared in the referent year. The designation as "party #1" derives from its status in
the stimulus year, and it is not a ranking that carries over to the referent year. In fact, party #1
might fall to second place, third place, or further in percentage ofseats held in the referent year.
Indeed, the data implies that this often occurs, and the correlation is only .56 between the seats
that party #1 won in both years (p<.05).
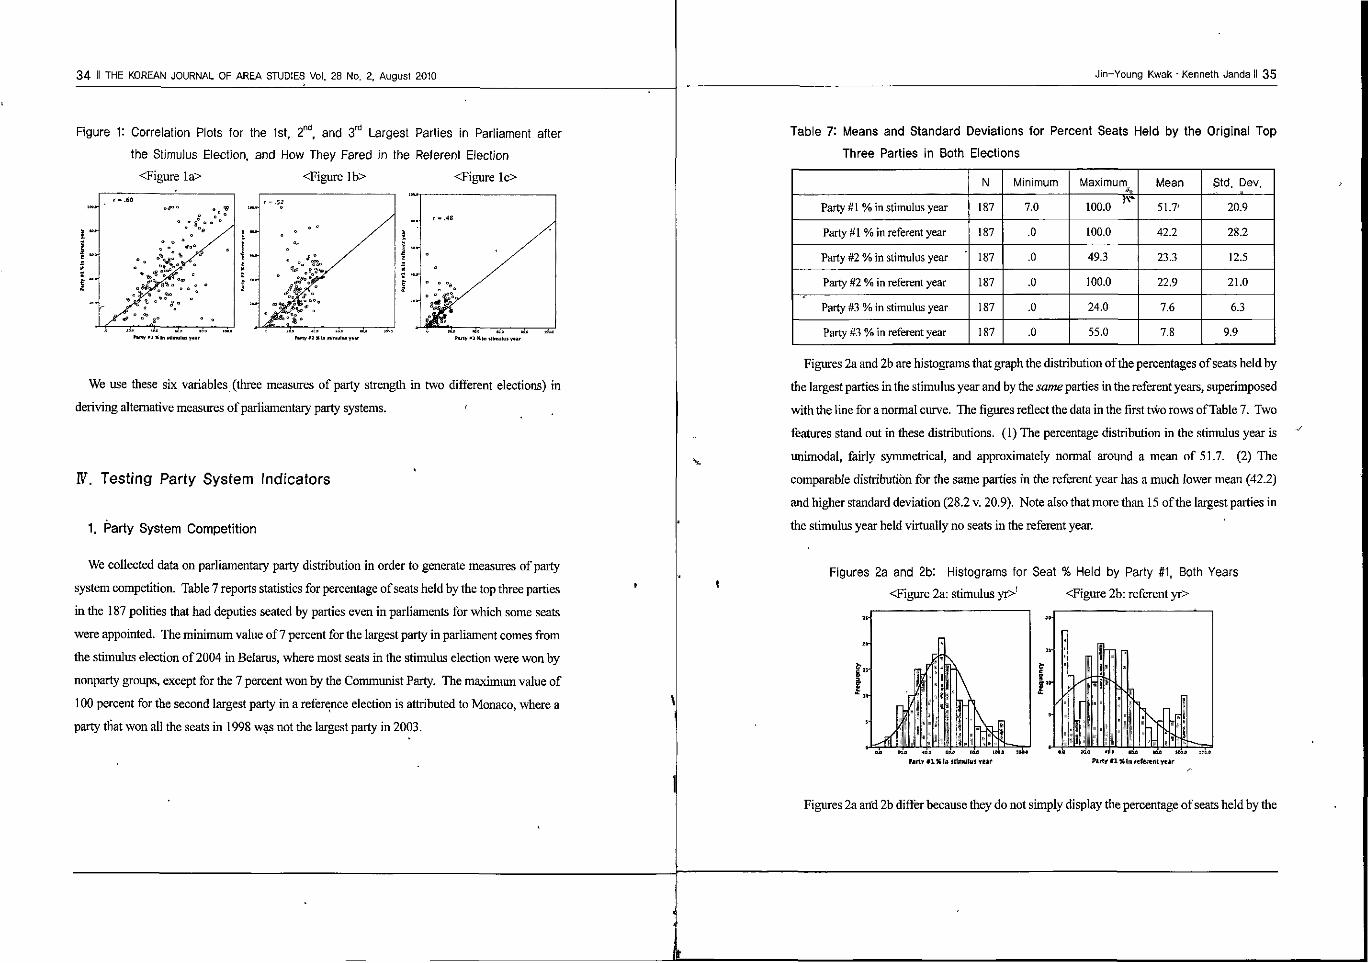
Much the same story is repeated in Figures 3a and 3b, histograms that graph the distribution of
the percentages ofseats held by the second largest parties in the stimulus year and by the same
parties in the referent years. The figures reflect the data in rows three and four of Table 7. The
average second-place party in the stimulus year held 23 percent of the seats. Again, the
distribution is unimodal, roughly symmetrical, and also roughly normal. One party (the MLP in
Malta) held 49.3 percent of the seats, just short of making it party #1 instead ofparty #2. More
than 10 parties lie in the other tail, of the distribution, holding virtually no seats and reflecting that
a single party monopolizes some parliaments. More than 40 #2 parties held virtually no seats
after the referent election. The correlation is .52 between the seats that party #2 won in both
years (p<.05).
Figures 3a and 3b: Hislograms for Seat % Held by Party #2, Both Years
<Figure 3a: stimulus yr> <Figure 3b: referent yr>
n..
Ida H« i»» *ae Ptrty »2 Kin stimulus ycv
**" fi
Kr *
3
i h ElHl-i —m r lac an tan ism I«M> Hon • rtett« M In reftrem yen
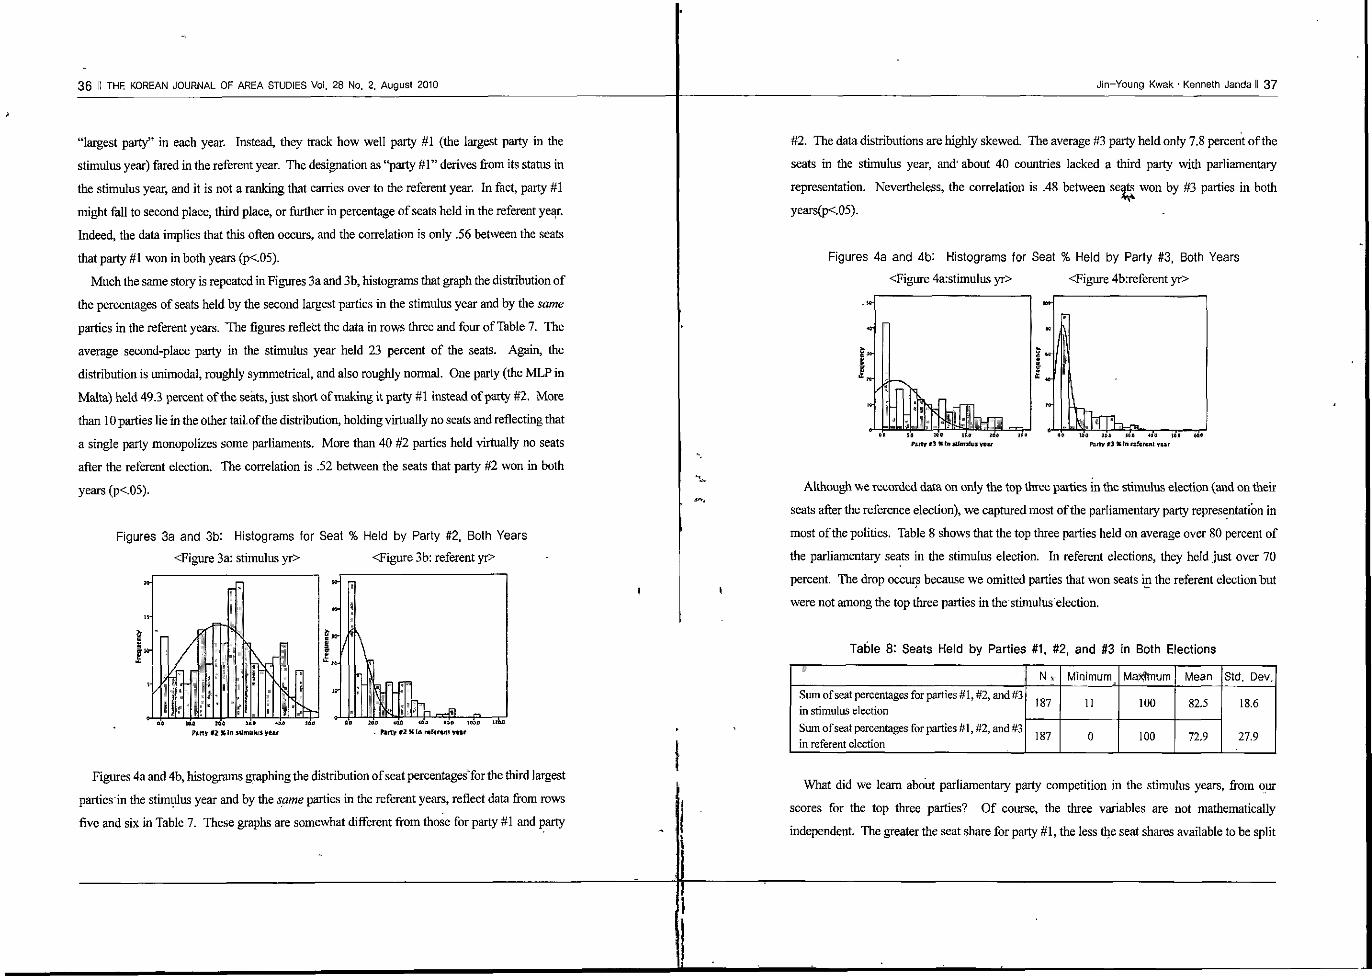
Figures 4a and 4b, histograms graphing the distribution of seat percentagesfor the third largest
parties in the stimulus year and by the same parties in the referent years, reflect data from rows
five and six in Table 7. These graphs are somewhat different from those for party #1 and party
Jin-Young Kwak • Kenneth Janda II 37
#2. The data distributions are highly skewed. The average #3 party held only 7.8 percent of the
seats in the stimulus year, and' about 40 countries lacked a third party with parliamentary
representation. Nevertheless, the correlation is .48 between seats won by #3 parties in both
years(p<.05).
Figures 4a and 4b: Histograms for Seat % Held by Party #3, Both Years
<Figure 4a:stimulus yr> <Figure 4b:referent yr>
60 14 ioa IIB Party « J % tin tUmului veir
Jlil lit Nt MH 10 0 64* Piutv*3 Kin liferent war
Although we recorded data on only the top three parties in the stimulus election (and on their
seats after the reference election), we captured most of the parliamentary party representation in
most of the polities. Table 8 shows that the top three parties held on average over 80 percent of
the parliamentary seats in the stimulus election. In referent elections, they held just over 70
percent. The drop occurs because we omitted parties that won seats in the referent election but
were not among the top three parties in the stimulus'election.
Table 8: Seats Held by Parties #1, #2, and #3 in Both Elections
Sum of seat percentages for parties #1, #2, and #3 in stimulus election Sum of seat percentages for parties #1, #2, and #3 in referent election
Nv
187
187
Minimum
11
0
Maximum
100
100
Mean
82.5
72.9
Std. Dev.
18.6
27.9
What did we learn about parliamentary party competition in the stimulus years, from our
scores for the top three parties? Of course, the three variables are not mathematically
independent. The greater the seat share for party #1, the less the seat shares available to be split
38 H THE KOREAN JOURNAL OF AREA STUDIES Vol. 28 No. 2, August 2010
between parties #2 and #3. But the correlations were somewhat-surprising. The correlation was
-.58 between party #1 and party #3, but the correlation between party #1 and party #2 was only
-.30(p<.05). So it seems that the largest parties tend to suck parliamentary representation from
parties other than its largest challenger. The very low correlation (+. 11) between percentages of
seats held by parties #2 and #3 (p<-05) suggests that the success of the second largest party is
largely independent of the third party's success.
All these statistical results showed that the percentage ofseats held by the second largest party
in parliament offers itself as a good simple indicator of parliamentary party competition. We
define party system competition as the prospect that the largest party (which usually forms the
government) can be replaced by a rival party. The percentage of seats held by the second largest
party in the parliament could be the indicator ofparty competition.
2. Party System Volatility
In ordinary discourse, the term "volatile" means inconstant, fleeting, capable of quick
change. It has the same meaning in describing party systems but has been applied separately to
party votes and seats. Electoral volatility, as popularized by Pedersen, assesses changes in
percentages of votes cast for all parties in adjacent elections.38) Seat volatility refers to changes
in percentages of parliamentary seats for all parties in adjacent elections. Of course, measures of
electoral and seat volatility tend to be highly correlated; Ersson and Lane find they correlate .77
for measures for 18 European countries.39)
We collected data on how well those parties were represented after the referent election to
assess parliamentary party system volatility. Table 8 summarizes the continuity of parties #1, #2,
38) Pedersen (1979). Lane and Ersson also refer to electoral volatility as "net" volatility, see Jan-Erik Lane with Svante Ersson, "Party System Instability in Europe: Persistent Differences in Volatility between West and East?" Democratization, Vol. 14, (February, 2007), pp. 92-110. Powell and Tucker dissect Pedersen's formula to measure two types of volatility: type A captures volatility from party entry and exit, and type B captures volatility among stable parties. See Eleanor Neff Powell and Joshua A. Tucker, "New Approaches to Electoral Volatility: Evidence from Postcommunist Countries," Paper prepared for delivery at the 2009 Meeting of the American Political Science Association, Toronto, Canada. We do not distinguish between their types for we count both types of volatility.
39) See Svante Ersson and Jan-Erik Lane, "Electoral Instability and Party System Change in Western Europe," in Paul Pennings and Jan-Erik Lane (eds.), Comparing Party System Change (London: Routledge, 1998), p.29.
m»
Jin-Young Kwak • Kenneth Janda II 39
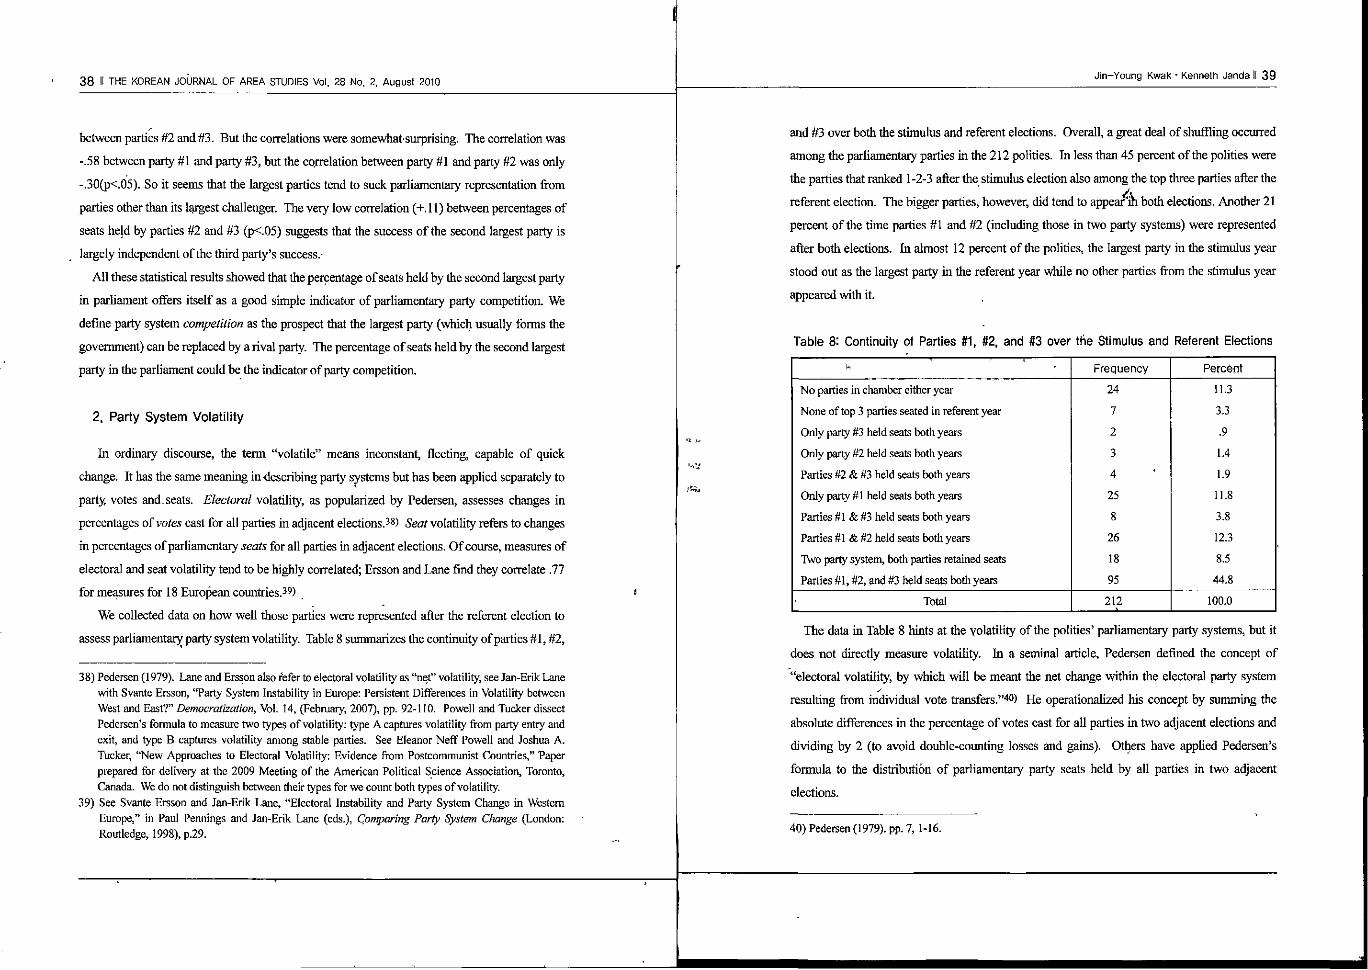
and #3 over both the stimulus and referent elections. Overall, a great deal of shuffling occurred
among the parliamentary parties in the 212 polities. In less than 45 percent of the polities were
the parties that ranked 1-2-3 after the stimulus election also among the top three parties after the
referent election. The bigger parties, however, did tend to appear in both elections. Another 21
percent of the time parties #1 and #2 (including those in two party systems) were represented
after both elections. In almost 12 percent of the polities, the largest party in the stimulus year
stood out as the largest party in the referent year while no other parties from the stimulus year
appeared with it.
Table 8: Continuity ol Parties #1, #2, and #3 over the Stimulus and Referent Elections
%
No parties in chamber either year
None of top 3 parties seated in referent year
Only parry #3 held seats both years
Only party #2 held seats both years
Parties #2 & #3 held seats both years
Only party #1 held seats both years
Parties #1 & #3 held seats both years
Parties #1 & #2 held seats both years
Two party system, both parties retained seats
Parties #1, #2, and #3 held seats both years
Total
Frequency
24
7
2
3
4
25
8
26
18
95
212
Percent
11.3
3.3
.9
1.4
1.9
11.8
3.8
12.3
8.5
44.8
100.0
The data in Table 8 hints at the volatility of the polities' parliamentary party systems, but it
does not directly measure volatility. In a seminal article, Pedersen defined the concept of
"electoral volatility, by which will be meant the net change within the electoral party system
resulting from individual vote transfers."40) He operationalized his concept by summing the
absolute differences in the percentage of votes cast for all parties in two adjacent elections and
dividing by 2 (to avoid double-counting losses and gains). Others have applied Pedersen's
formula to the distribution of parliamentary party seats held by all parties in two adjacent
elections.
40) Pedersen (1979). pp. 7,1-16.
40 II THE KOREAN JOURNAL OF AREA STUDIES Vol. 28 No. 2, August 2010
We measure parliamentary party volatility with a comparable formula but one that adjusts for
the share of seats won by k parties in adjacent elections when not all parties are included in
calculating changes in seat shares. It replaces-2 in the divisor in Pedersen's formula with the sum
of the seats won in each election by the set of parties (k) included in the calculation. The
modified formula no longer ranges from 0 to 100 but from 0 to 1 and can be interpreted as the
proportion of change in seat percentages held by k parties in two adjacent elections.
Volatility^ = P * > " A"-"H 2 > * > + 2 > « ' - " \f=l M
Where ps© = percentage ofseats in stimulus year pi(t-ij = percentage of seats in reference year k= 3, number of parties for which we collected data ,
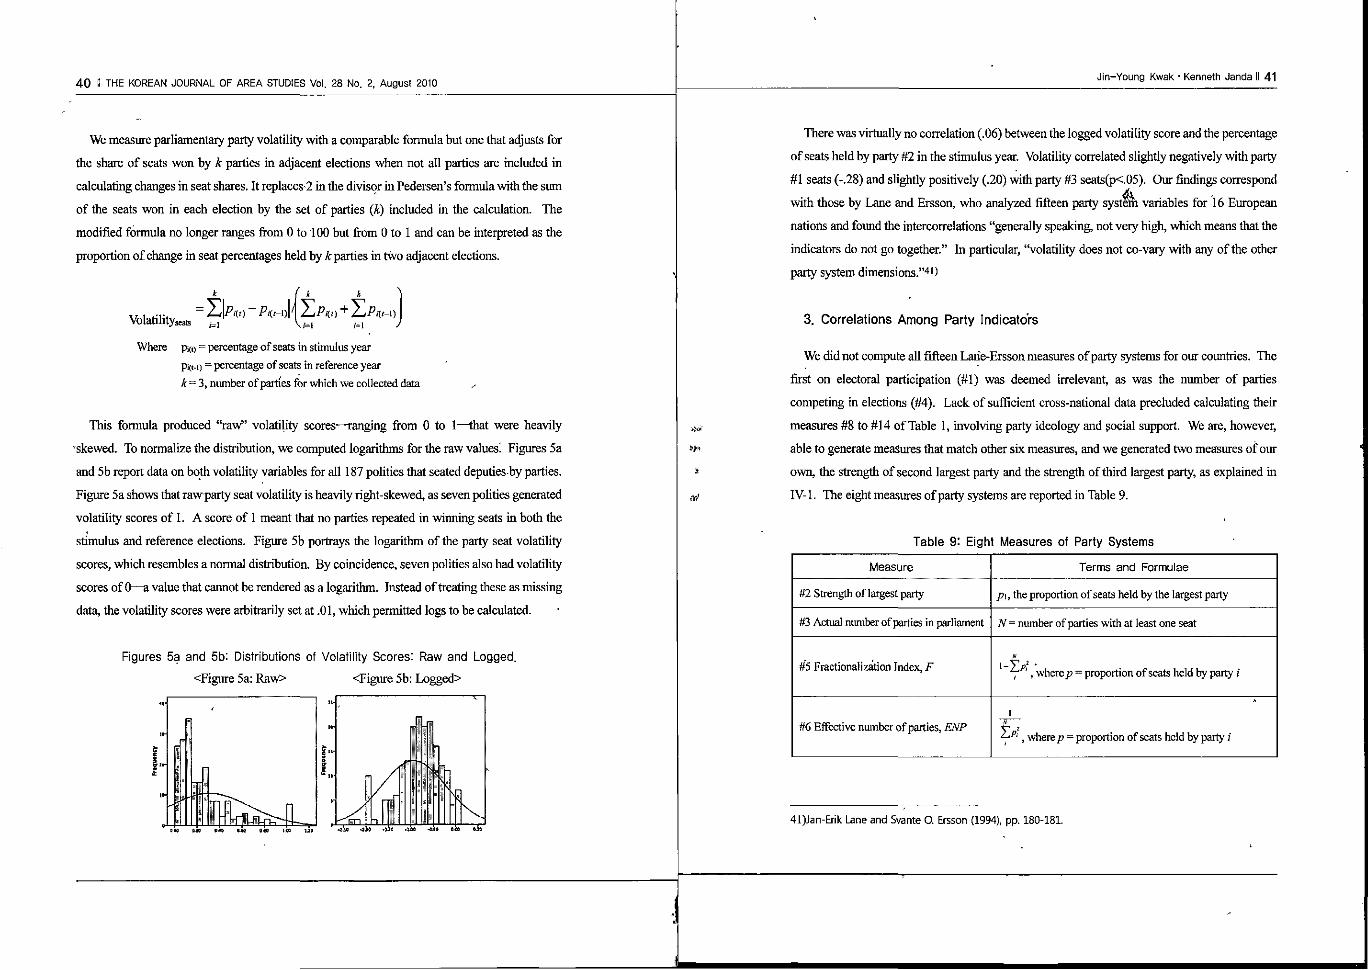
This formula produced "raw" volatility scores—ranging from 0 to 1—that were heavily Tskewed. To normalize the distribution, we computed logarithms for the raw values^ Figures 5a
and 5b report data on both volatility variables for all 187 polities that seated deputies by parties.
Figure 5a shows that rawparty seat volatility is heavily right-skewed, as seven polities generated
volatility scores of 1. A score of 1 meant that no parties repeated in winning seats in both the
stimulus and reference elections. Figure 5b portrays the logarithm of the party seat volatility
scores, which resembles a normal distribution. By coincidence, seven polities also had volatility
scores of 0—a value that cannot be rendered as a logarithm. Instead of treating these as missing
data, the volatility scores were arbitrarily set at .01, which permitted logs to be calculated.
Figures 5a and 5b: Distributions of Volatility Scores: Raw and Logged.
<Figure 5a: Raw> <Figure 5b: Logged>
IN Me »» an atp 1*0 uo
Jin-Young Kwak • Kenneth Janda II 41
erf
There was virtually no correlation (.06) between the logged volatility score and the percentage
ofseats held by party #2 in the stimulus year. Volatility correlated slightly negatively with party
#1 seats (-.28) and slightly positively (.20) with party #3 seats(p<.05). Our findings correspond
with those by Lane and Ersson, who analyzed fifteen party systern variables for 16 European
nations and found the intercorreiations "generally speaking, not very high, which means that the
indicators do not go together." In particular, "volatility does not co-vary with any of the other
party system dimensions."41)
3. Correlations Among Party Indicators
We did not compute all fifteen Larie-Ersson measures ofparty systems for our countries. The
first on electoral participation (#1) was deemed irrelevant, as was the number of parties
competing in elections (#4). Lack of sufficient cross-national data precluded calculating their
measures #8 to #14 of Table 1, involving party ideology and social support. We are, however,
able to generate measures that match other six measures, and we generated two measures of our
own, the strength of second largest party and the strength of third largest party, as explained in
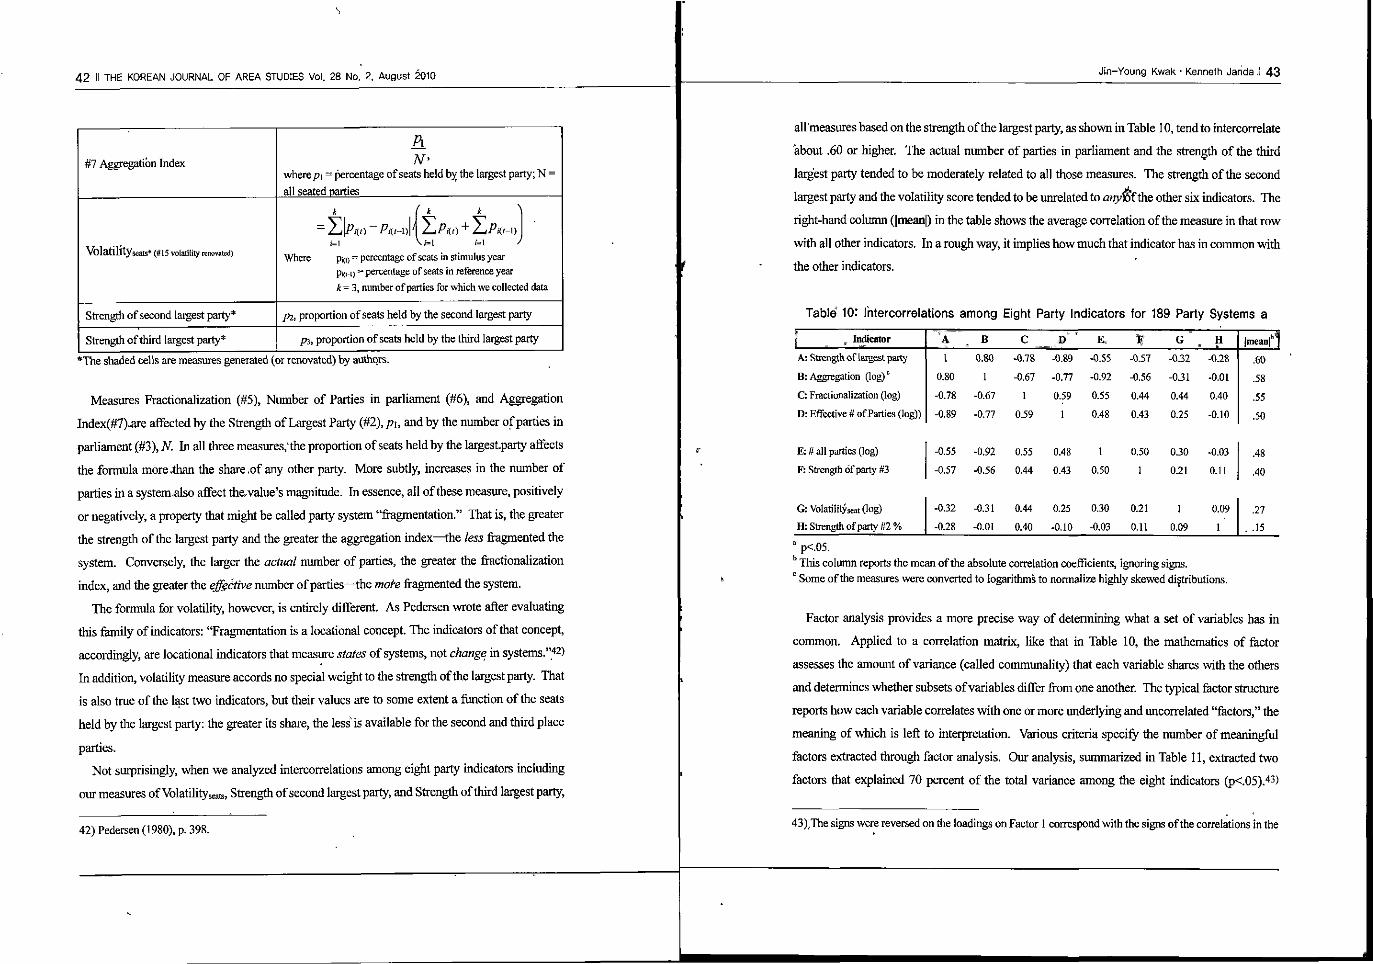
IV-1. The eight measures ofparty systems are reported in Table 9.
Table 9: Eight Measures ot Party Systems
Measure
#2 Strength of largest party
#3 Actual number of parties in parliament
#5 Fractionalization Index, F
#6 Effective number of parties, ENP
Terms and Formulae
p\, the proportion ofseats held by the largest party
N= number of parties with at least one seat
, ', where p = proportion ofseats held by party /
l
^Pi, where p - proportion ofseats held by party /
41)Jan-Erik Lane and Svante O. Ersson (1994), pp. 180-181.
42 II THE KOREAN JOURNAL OF AREA STUDIES Vol. 28 No. 2, August 2010
#7 Aggregation Index
Volatility seals* (#15 volatility renovated)
Strength of second largest party11
Strength of third largest party*
EL
N' whereat = percentage ofseats held by the largest party; N:
all seated parties
;=i Vi=i ;=i J Where pno = percentage ofseats in stimulus year
Pi(ii) "* percentage ofseats in reference year k = 3, number of parties for which we collected data
p2, proportion ofseats held by the second largest party
pi, proportion of seats held by the third largest party
*The shaded cells are measures generated (or renovated) by authors.
Measures Fractionalization (#5), Number of Parties in parliament (#6), and Aggregation
Index(#7)are affected by the Strength of Largest Party (#2), p\, and by the number of parties in
parliament (#3), N. In all three measurevthe proportion of seats held by the largestparty affects
the formula more .than die share ,of any other party. More subtly, increases in the number of
parties in a system-also affect the,value's magnitude. In essence, all of these measure, positively
or negatively, a property that might be called party system "fragmentation." That is, the greater
the strength of the largest party and the greater the aggregation index—the less fragmented the
system. Conversely, the larger the actual number of parties, the greater the fractionalization
index, and the greater the effective number of parties—the mote fragmented the system.
The formula for volatility, however, is entirely different. As Pedersen wrote after evaluating
this family of indicators: "Fragmentation is a locational concept. The indicators of that concept,
accordingly, are locational indicators that measure states of systems, not change in systems."42)
In addition, volatility measure accords no special weight to the strength of the largest party. That
is also true of the last two indicators, but their values are to some extent a function of the seats
held by the largest party: the greater its share, the less'is available for the second and third place
parties.
Not surprisingly, when we analyzed intercorrelations among eight party indicators including
our measures of Volatility seats, Strength of second largest party, and Strength of third largest party,
42) Pedersen (1980), p. 398.
Jin-Young Kwak • Kenneth Janda II 43
all'measures based on the strength of the largest party, as shown in Table 10, tend to intercorrelate
about .60 or higher. The actual number of parties in parliament and the strength of the third
largest party tended to be moderately related to all those measures. The strength of the second
largest party and the volatility score tended to be unrelated to anym the other six indicators. The
right-hand column (|mean|) in the table shows the average correlation of the measure in that row
with all other indicators. In a rough way, it implies how much that indicator has in common with
the other indicators.
Table 10: Intercorrelations among Eight Party Indicators tor 189 Party Systems a
f „ Mentor
A: Strength of largest party
B: Aggregation (log)'
C: Fractionalization (log)
D: Effective # of Parties (log))
E; # all parties (log)
F: Strength ofparty #3
G: Volatilityseat (log) H: Strength ofparty #2 %
"A
1
0.80
-0.78
-0.89
-0.55
-0.57
-0.32
-0.28
B 0.80
1
-0.67
-0.77
-0.92 -0.56
-0.31 -0.01
c -0.78
-0.67 1
0.59
0.55 0.44
0.44
0.40
D -0.89
-0.77
0.59
1
0.48
0.43
0.25
-0.10
E,
-0.55
-0.92
0.55 0.48
1
0.50
0.30
-0.03
F; -0.57
-0.56
0.44
0.43
0.50
1
0.21
0.11
G
-0.32
-0.31
0.44
0.25
0.30
0.21
1 0.09
- I1
-0.28
-0.01
0.40
-0.10
-0.03 0.11
0.09 1
|mean| j
.60
.58
.55
.50
.48
.40
.27 . .15
a p<.05. This column reports the mean of the absolute correlation coefficients, ignoring signs.
c Some of the measures were converted to logarithms to normalize highly skewed distributions.
Factor analysis provides a more precise way of determining what a set of variables has in
common. Applied to a correlation matrix, like that in Table 10, the mathematics of factor
assesses the amount of variance (called communality) that each variable shares with the others
and determines whether subsets of variables differ from one another. The typical factor structure
reports how each variable correlates with one or more underlying and uncorrelated "factors," the
meaning of which is left to interpretation. Various criteria specify the number of meaningful
factors extracted through factor analysis. Our analysis, summarized in Table 11, extracted two
factors that explained 70 percent of the total variance among the eight indicators (p<.05).43)
43),The signs were reversed on the loadings on Factor 1 correspond with the signs of the correlations in the
44 II THE KOREAN JOURNAL OF AREA STUDIES Vol. 28 No. 2, August 2010
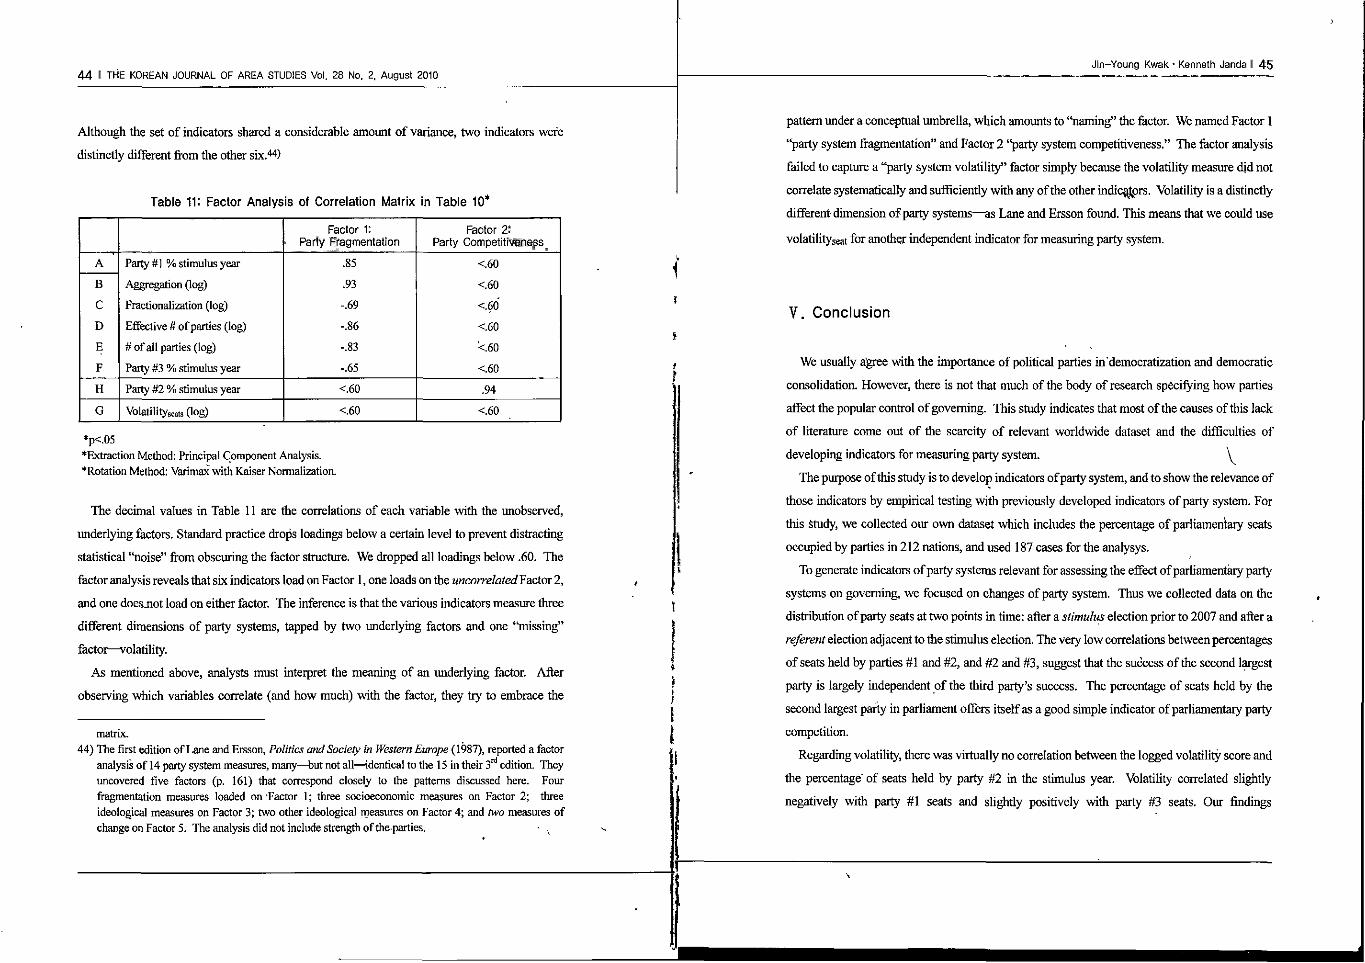
Although the set of indicators shared a considerable amount of variance, two indicators were
distinctly different from the other six.44)
Table 11: Factor Analysis of Correlation Matrix in Table 10*
A
B
C
D
E
F
H
G
Party #1 % stimulus year
Aggregation (log)
Fractionalization (log)
Effective # of parties (log)
# of all parties (log)
Party #3 % stimulus year
Party #2 % stimulus year
Volatilityseats (log)
Factor 1: Parly Fragmentation
.85
.93
-.69
-.86
-.83
-.65
<.60
<.60
Factor 2i Party Competitiveness _
<.60
<.60
<.60
<.60
<60
<.60
.94
<.60
*p<.05 *Extraction Method: Principal Component Analysis. •Rotation Method: Varimax with Kaiser Normalization.
The decimal values in Table 11 are the correlations of each variable with the unobserved,
underlying factors. Standard practice drops loadings below a certain level to prevent distracting
statistical "noise" from obscuring the factor structure. We dropped all loadings below .60. The
factor analysis reveals that six indicators load on Factor 1, one loads on the uncorrelated¥actor 2,
and one doesjiot load on either factor. The inference is that the various indicators measure three
different dimensions of party systems, tapped by two underlying factors and one "missing"
factor—volatility.
As mentioned above, analysts must interpret the meaning of an underlying factor. After
observing which variables correlate (and how much) with the factor, they try to embrace the
matrix. 44) The first edition of Lane and Ersson, Politics and Society in Western Europe (1987), reported a factor
analysis of 14 party system measures, many—but not all—identical to the 15 in their 3rd edition. They uncovered five factors (p. 161) that correspond closely to the patterns discussed here. Four fragmentation measures loaded on Factor 1; three socioeconomic measures on Factor 2; three ideological measures on Factor 3; two other ideological measures on Factor 4; and two measures of change on Factor 5. The analysis did not include strength of theparties. • v
Jin-Young Kwak • Kenneth Janda II 45
pattern under a conceptual umbrella, which amounts to ''naming" the factor. We named Factor 1
"party system fragmentation" and Factor 2 "party system competitiveness." The factor analysis
failed to capture a "party system volatility" factor simply because the volatility measure did not
correlate systematically and sufficiently with any of the other indicators. Volatility is a distinctly
different-dimension ofparty systems—as Lane and Ersson found. This means that we could use
volatilitySeat for another independent indicator for measuring party system.
V. Conclusion
We usually agree with the importance of political parties in democratization and democratic
consolidation. However, there is not that much of the body of research specifying how parties
affect the popular control of governing. This study indicates that most of the causes of this lack
of literature come out of the scarcity of relevant worldwide dataset and the difficulties of
developing indicators for measuring party system. \
The purpose of this study is to develop indicators ofparty system, and to show the relevance of
those indicators by empirical testing with previously developed indicators ofparty system. For
this study, we collected our own dataset which includes the percentage of parliamentary seats
occupied by parties in 212 nations, and used 187 cases for the analysys.
To generate indicators ofparty systems relevant for assessing the effect of parliamentary party
systems on governing, we focused on changes ofparty system. Thus we collected data on the
distribution ofparty seats at two points in time: after a stimulus election prior to 2007 and after a
referent election adjacent to the stimulus election. The very low correlations between percentages
ofseats held by parties #1 and #2, and #2 and #3, suggest that the success of the second largest
party is largely independent of the third party's success. The percentage of seats held by the
second largest party in parliament offers itself as a good simple indicator of parliamentary party
competition.
Regarding volatility, there was virtually no correlation between the logged volatility score and
the percentage' of seats held by party #2 in the stimulus year. Volatility correlated slightly
negatively with party #1 seats and slightly positively with party #3 seats. Our findings
46 II THE KOREAN JOURNAL OF AREA STUDIES Vol. 28 No. 2, August 2010
reconfirmed that the volatility is distinctly different dimension ofparty systems.
With previously developed party system indicators, we tried to measure intercorrelations of
eight party measures. Our measure of party competition, the second largest and the volatility
score tended to be unrelated to any of the other six indicators. Moreover, the factor analysis
showed that six indicators, i.e., the strength of the largest party, actual'number of parties in
parliament, ffactionalization, effective number of parties, aggregation index, and the strength of
the third largest party, load on Factor 1, which could be named as party system fragmentation.
The strength of the second largest party load on Factor 2, which could be named as "Party system
competitiveness." However, the volatility measure again did not correlate systematically and
sufficiently with any of the other indicators. This reconfirms that we could use volatility for
another independent indicator for measuring on dimension ofparty system.
References
Bara, Judith and Albert Weale.,2006. eds., Democratic Politics and Party Competition: Essays in
Honor of Ian Budge," London: Routledge..
Bardi, Luciano and Peter Mair, 2008. "The Parameters of Party Systems," Party Politics, Vol. 14.
March, pp.147-166.
Birch, Sarah. 2003. Electoral Systems and Political Transformation in Post-Communist Europe.
Basingstoke: Palgrave-Macmillan. Chapter 6.
Cheibub, Jose Antonio Zachary Elkins, and Tom Ginsburg, 2009. "Beyond Presidentialism and
Parliamentarism: On the Hybridization of Constitutional Form," Prepared for the
Comparative Constitutional Law Roundtable, George Washington University Law
School. Washington, DC. March 6.
CIA, World Factbook https://www.cia.gov/library/pubhcations/the-world-factbook/index.htmi.
Earlier editions, including the 2006 edition, are available through the private site,
http://www.theodora.com/wfb/.
Dalton, Russell J. and Steven Weldon, 2005. "Is the Party Over? Spreading Antipathy Toward
Political Parties," Public Opinion Pros, May. http://www.cses.org/resources/results/
Jin-Young Kwak • Kenneth Janda II 47
POP_May2005.htm
Democratic Governance Group. 2006. A Handbook on Working With Political Parties. New
York: United Nations Bureau for Development Policy, United Nations Development
Programme. *$•
Ersson, Svante and Jan-Erik Lane, 1998. "Electoral Instability and Party System Change in
Western Europe," in Paul Pennings and Jan-Erik Lane, eds., Comparing Party System
Change. London: Routledge
Herrera, Richard. 1999. "The Origins of Opinion of American Party Activists," Party Politics,
Vol. 5. April, pp.237-252.
Janda, Kenneth. 1980. Political Parties: A Cross-National Survey. New York: the Free Press.
2005. Adopting Party Law. Washington DC: National Democratic Institute
Keman, Hans. ,2006. "Party Government Formation and Policy Preferences: An Encompassing
Approach," in Judith Bara and Albert Weale. Eds., Democratic Politics and Party
Competition: Essays in Honor of Ian Budge," London: Routledge. pp.,,33-55
Kuenzi, Michelle and Gina Lambright. 2005. "Party Systems and Democratic Consolidation in
Africa's Electoral Regimes," Party Politics, Vol. 11. July. pp. 423-446.
Laakso, Markku and Rein Taagepera, 1979. "Effective Number of Parties: A Measure with
Applications to West Europe," Comparative Political Studies, Vol. 12. pp. 3-27.
Lane, Jan-Erik and Svante O. Ersson, 1994. Politics and Society in Western Europe, ^Edition.
London: SAGE Publications.
, 2007. "Party System Instability in Europe: Persistent Differences in Volatility between
West and East?" Democratization, Vol.14, February, pp.92-110.
Mackie, Thomas T. and Richard Rose. 1991. eds., The International Almanac of Electoral
History, J Edition. Washington, D.C.: Congressional Quarterly.
Mair, Peter, 1998. Party System Change: Approaches and Interpretation. London: Routledge.
, 2002. "Comparing Party Systems," in Comparing Democracies 2: New Challenges in
the Study of Elections and Voting, eds., Lawrence LeDuc, Richard G. Niemi, and Pippa
Norris . London: Sage. pp. 88-107.
Mayer, Lawrence C. 1980. "A Note on the Aggregation of Party Systems," in Peter Merkl, ed.,
Western European Party Systems. New York, Free Press, pp. 515-520.
Neumann Sigmund 1965. ed., Modern Political Parties: Approaches to Comparative Politics.
48 II THE KOREAN JOURNAL OF AREA STUDIES Vol. 28 No. 2, August 2010
Chicago: Universityof Chicago Press.
Pedersen, Mogens N. 1979. "The Dynamics of European Party Systems: Changing Patterns of
Electoral Volatility," European Journal of Political Research, Vol. 7. pp. 1 -26.
1980. "On Measuring Party System Change: A Methodological Critique and a
Suggestion," Comparative Political Studies, Voll 12. January, p. 398.
Pennings, Paul and Jan-Erik Lane. 1998. eds., Comparing Party System Change. London:
Routledge.
Powell, Eleanor Neff and Joshua A. Tucker, "New Approaches to Electoral Volatility: Evidence
from Postcommunist Countries," Paper prepared for delivery at the 2009 Meeting of the
American Political Science Association, Toronto, Canada
Rae, Douglas. 1968. "A Note on the Fractionalization of Some European Party Systems",
Comparative Political Studies, Vol. 1. October, pp.413-418.
Randall, Vicky and Lars Svasand, 2002. "The, Contribution of Parties to Democracy and
Democratic Consolidation," Democratization? Vol. 9. pp. 1-10.
Sartori, Giovanni. 1976. Parties and Party Systems." A Framework for Analysis. London:
Cambridge University Press
Siaroff, Alan. 2000. Comparative European Party Systems: An Analysis of Parliamentary
Elections since 1945: New York: Garland.
Stokes, S. C. 1999. "Political Parties and Democracy," in Annual Review of Political
Science,Volume 2. pp. 243-267.
Tsebelis, George, 2000."Veto Players and Institutional Analysis," Governance, Vol. 13. October.
pp., 441-474.
Van Biezen, Ingrid and Michael Saward, 2008. "Democratic Theorists and Party Scholars: Why
They Don't Talk to Each Other, and Why They Should," Perspectives on Politics, Vol.
6. March, pp. 21-35.
Ware, Alan. 1996. Political Parties and Party Systems. New York: Oxford University Press.
, 2009. The Dynamics of Two-Party Politics: Party Structures and the Management of
Competition. London: Oxford University Press.
Webb, Paul. 2004. "Presidential" Rule and the Erosion of Party Government in Parliamentary
Systems: The Case of the United Kingdom," [Original Title La "presidenzializzazione"
e l'erosione del governo di partite ne'i sistemi parlamentari: il caso'del Regno Unito "]
Jin-Young Kwak • Kenneth Janda II 49
Rivista Italiana di Scienza Politico, Vol. 34. December, pp. 347-377.
Wolinetz, Steven B. 2006. "Party Systems and Party System Types," in Richard S. Katz and
William Crotty eds., Handbook of Party Politics. London: SAGE Publications.
African Elections Database, http://africanelections.tripod.com/.
Wikipedia Election Results by Country. http://en.wakipedia.org/vrtki/List_of_election_results_
by_country.
Adam Carr Election Archives, http://psephos.adam-carr.net/.
Travel Document System, http://traveldocs.com/.
Inter-Parliamentary Union, http://www.ipu.org/english/home.htm.
-^-31^:2010.07.15
^A r<_ : 2010.08.02
^ W ^ : 2010.08.23