Embed Size (px)
Citation preview
The Knowledge Economy, Intangible Investment and Growth
Jonathan HaskelImperial College Business School,
Imperial College [email protected]
British Embassy, Berlin 17th June 2011
1

Can Europe grow out of trouble? The enduring productivity deficit
19811982
19831984
19851986
19871988
19891990
19911992
19931994
19951996
19971998
19992000
20012002
20032004
20052006
20072008
20092010
201170
80
90
100
110
120
130
140
150
GDP per hour US v EU(1995=100)
level GDP per hour, EU level GDP per hour, US
2Source: EUKLEMS and The Conference Board

The R&D deficit…
3
1991 1992 1993 1994 1995 1996 1997 1998 1999 2000 2001 2002 2003 2004 2005 2006 2007 20080.00
0.50
1.00
1.50
2.00
2.50
Business R&D as % of GDP
UKGermanyUS
%o
of G
DP
Source: OECD STI indicators

…and now with China
4
1991 1992 1993 1994 1995 1996 1997 1998 1999 2000 2001 2002 2003 2004 2005 2006 2007 20080.00
0.50
1.00
1.50
2.00
2.50
Business R&D as % of GDP
ChinaUKGermanyUS
%o
of G
DP
Source: OECD STI indicators
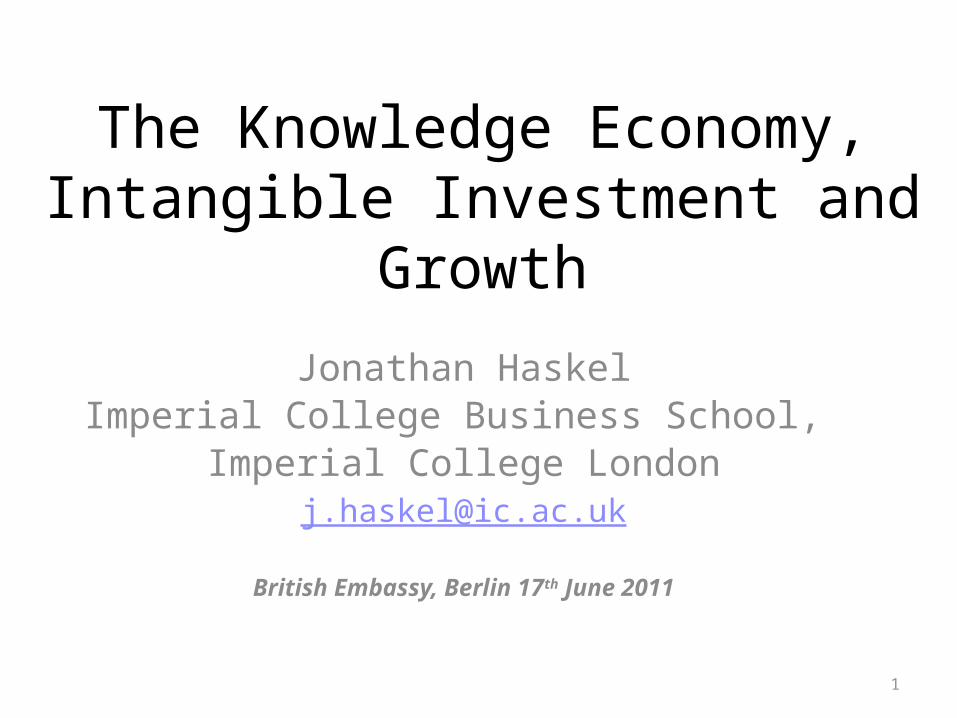
Driving growth in knowledge economies
• GDP per worker driven by – Physical capital deepening
• Within the firm: ICT • Outside the firm: infrastructure
– Human capital deepening• General education of labour force• Immigration
– Ideas/innovation/intangible capital deepening • Use of ideas
– Within the firm: investment » in R&D » and non-R&D (software, design, training, branding, organisation)
– From outside the firm: open innovation

So, why is Europe lagging?• Composition
– Larger public sector in Europe brings average down? – Too much financial services?
• Physical capital?– Lower computer adoption?
• Human capital?• Ideas/Innovation/Intangible capital?
– Low R&D. But is R&D the whole story?
6

Measuring all intangible investment
• Knowledge investment is more than just R&D– Software– Innovative property
• Scientific R&D• Design• Financial services product development• Artistic originals
– Economic competencies• Marketing• Training• Firm organisational capital

Greece
Slova
k Republic Ita
ly
Czech
RepublicJap
an
Australi
aSp
ain
Portuga
l
Sweden
Canad
a
Austria
Denmark
United St
ates
German
y
France
Finlan
d
United Kingd
om0.00
5.00
10.00
15.00
20.00
25.00
Tangible and Intangible Investment (% of 2006 market sector GDP)
Tangible Investment Intangible Investment
Intangible/tangible investment varies significantly across countries
Source: OECD/COINVEST project

How does composition of intangible investment vary?(Investment by intangible asset share in GDP, 2005 selected countries)
2.23 0.83 1.98 1.41 0.73 1.43 1.42
6.07
3.27
5.483.18 3.58
4.732.90
2.81
3.48
4.44
3.30 2.84
5.86
5.36
0
2
4
6
8
10
12
14
Japa
n
Port
ugal
Swed
en
Fran
ce
Ger
man
y US
UK
%GDP
Software and databases R&D and other intellectual property products Brand equity, firm training, organisational capital
Source: OECD/COINVEST project

Manufacturing is not manufacturing any more…
Intangible and Tangible investment as a share of VA by industry and by country, 2006
(VA adj for Intangibles)
0%5%
10%15%20%25%30%35%40%45%50%
UK Germany Sweden UK Germany Sweden UK Germany Sweden
Manufacturing Financial and business svc Retail hotel transport
Intangible Tangible
Source: COINVEST

Knowledge is the key to growth(growth accounting, 1995-06)
0.30 0.22 0.18 0.40-0.15
1.40
0.910.64 0.83
0.430.68
0.90
1.231.33
0.950.69 0.88
1.30
0.690.82
0.330.48 0.37
-0.5
0.0
0.5
1.0
1.5
2.0
2.5
3.0
3.5
4.0
4.5
Swed
en UK US
Japa
n
Fran
ce
Ger
man
y
% Labour quality Physical capital deepening Multifactor productivity Intangible capital deepening
11Source: OECD/COINVEST project

Policy?

Strict employment protection correlated with low intangible investment…
13Source: COINVEST
Aus tral ia
Aus tria
Canada
Czech Republic
Denmark
Finland
France
Germany
Greece
Italy
Japan
Netherlands
Slovak ia
Spain
Sweden
UK
US.0
2.0
4.0
6.0
8.1
.12
Inta
ngib
le in
vest
men
t as
% o
f GD
P
.5 1 1.5 2 2.5 3OECD index of employment protection strictness
Intangible investment and employment protection strictness

…as is many days to start a business.
14Source: COINVEST
Aus tral ia
Aus tria
Canada
Czech Republic
Denmark
Finland
France
Germany
Greece
Italy
Japan
Netherlands
Slovak ia
Spain
Sweden
UK
US
.02
.04
.06
.08
.1.1
2In
tang
ible
inve
stm
ent a
s %
of G
DP
0 50 100 150World Bank index of days to start a business ( 2004 )
Intangible investment and days to start a business

Government R&D can help…
15Source: COINVEST
Aus tria
Canada
Czech Republic
Denmark
Finland
France
Germany
Greece
Italy
Netherlands
Slovak ia
Spain
Sweden
UK
US.0
2.0
4.0
6.0
8.1
.12
Inta
ngib
le in
vest
men
t as
% o
f GD
P
1 2 3 4 5Goverment R & D spend as % of total government spend ( 2004 )
Intangible investment and goverment R & D spend

…and note that strictness positively correlated with tangibles. ….
16Source: COINVEST
Aus tral ia
Aus tria
Canada
Czech Republic
Denmark
FinlandFrance
Germany
Greece
Italy
JapanNetherlands
Slovak ia
SpainSweden
UK
US
.1.1
5.2
.25
.3Ta
ngib
le in
vest
men
t as
% o
f GD
P
.5 1 1.5 2 2.5 3OECD index of employment protection strictness
Tangible investment and employment protection strictness

Implications• Key importance of knowledge
– Knowledge = Intangibles and TFP = major contributors to growth – It’s not just R&D– Manufacturing is not manufacturing any more
• Policy : what not to do– Stop obsessing about manufacturing and just R&D
• Policy: what to do– All investment needs long term tax and regime certainty. Bank
regulation?– Government Science Budgets and public R&D will help– Employment regulation
• Part of overall social contract• Helps tangibles, hurts intangibles• So the choice: do we want growth from catch-up or innovation?

spares

Manufactur-ing Sweden
Manufactur-ing Germany
Manufactur-ing UK
Retail Sweden
Retail Ger-many
Retail UK Financial and business svcs
Sweden
Financial and business svcs
Germany
Financial and business svcs
UK
Intangible cap deep
1.21 0.58 0.50 0.33 0.21 0.24 0.23 0.41 0.54
Tangible cap deep
0.43 0.24 0.21 0.77 0.35 0.49 0.42 0.45 0.23
Labour quality
0.12 0.07 0.17 0.12 -0.01 0.16 0.075 -0.03 0.12
Intermedi-ate Inputs
1.65 3.10 1.70 1.42 1.16 1.22 1.19 -0.04 2.40
TFP 0.79 0.56 1.06 0.84 0.63 0.60 0.62 -1.24 0.81
-1
0
1
2
3
4
5
1.210.58 0.50 0.33 0.21 0.24 0.23 0.41 0.54
0.430.24 0.21 0.77
0.35 0.49 0.42 0.45 0.23
1.65 3.101.70 1.42
1.161.22 1.19
-0.04
2.40
0.790.56
1.06 0.84
0.630.60 0.62
-1.24
0.81
Components of Labour Productivity GrowthTFP Intermediate Inputs Labour quality Tangible cap deep Intangible cap deep
19
Manufacturing: Ge leads, but mostly intermediates. Sw intangible basedRetail: Sw leads. TFP importantFinBizServices: UK lead, intangibles important

Manufacturing Sweden
Manufacturing Germany
Manufacturing UK
Retail Sweden Retail Ger-many
Retail UK Financial and business svcs
Sweden
Financial and business svcs
UK
Intangible cap deep
29% 13% 14% 9% 9% 9% 9% 13%
Tangible cap deep
10% 5% 6% 22% 15% 18% 17% 5%
Labour quality
0.0285714285714286
0.0153846153846154
0.0467032967032969
0.0344827586206897
-0.0042735042
7350427
0.0590405904059041
0.0297029702970298
0.0293040293040293
Interme-diate In-puts
39% 68% 47% 41% 50% 45% 47% 59%
TFP 19% 12% 29% 24% 27% 22% 24% 20%
5%15%25%35%45%55%65%75%85%95%
29%13% 14% 9% 9% 9% 9% 13%
10%
5% 6% 22% 15% 18% 17% 5%
39%68%
47%41%
50%45% 47% 59%
19% 12%29% 24% 27% 22% 24% 20%
Components of Labour Productivity Growth, %TFP Intermediate Inputs Labour quality Tangible cap deep Intangible cap deep
20

1995 1996 1997 1998 1999 2000 2001 2002 2003 20040.07
0.08
0.09
0.1
0.11
0.12
0.13
0.14
0.15
0.16
Total Intangible Investment to MSVA(MSVA excluding real estate and adjusted for intangibles)
FRA_COI
GER_COI
PRT
SWE
UK_COI
FRA_CHS
GER_CHS
UK_CHS
21

0.00%
2.00%
4.00%
6.00%
8.00%
10.00%
12.00%
14.00%
0 10000 20000 30000 40000 50000
Inta
ngib
le In
vest
men
t (%
GD
P)
GDP per capita (PPP $)
Intangible Investment and GDP per Capita (2001-04)
SK
CZ
EL
USJPUK
AUSE
FINL
DKFR
DEAU
IT
ES
Source: Hao et al. (2009) for Germany, France, Italy and Spain; CHS (2009) for the US , Marrano et al. (2009) for the UK, Jalava et al. (2007) for Finland, Fukao et al. (2009) for Japan, Edquist (2009) for Sweden, Van Rooijen-Horsten et al. (2008) for the Netherlands and Barnes and McClure (2009) for Australia. GDP per capita is from the Total Economy Database of The Conference Board. 22

Sweden and UK are most intangible intensive….with Germany following…..
.08
.1.1
2.1
4.1
6
1995 2000 2005year
FRA GER PRT SWE UK
VA excluding real estate and adjusted for intangiblesTotal Intangible Investment to Market Sector Value Added
23
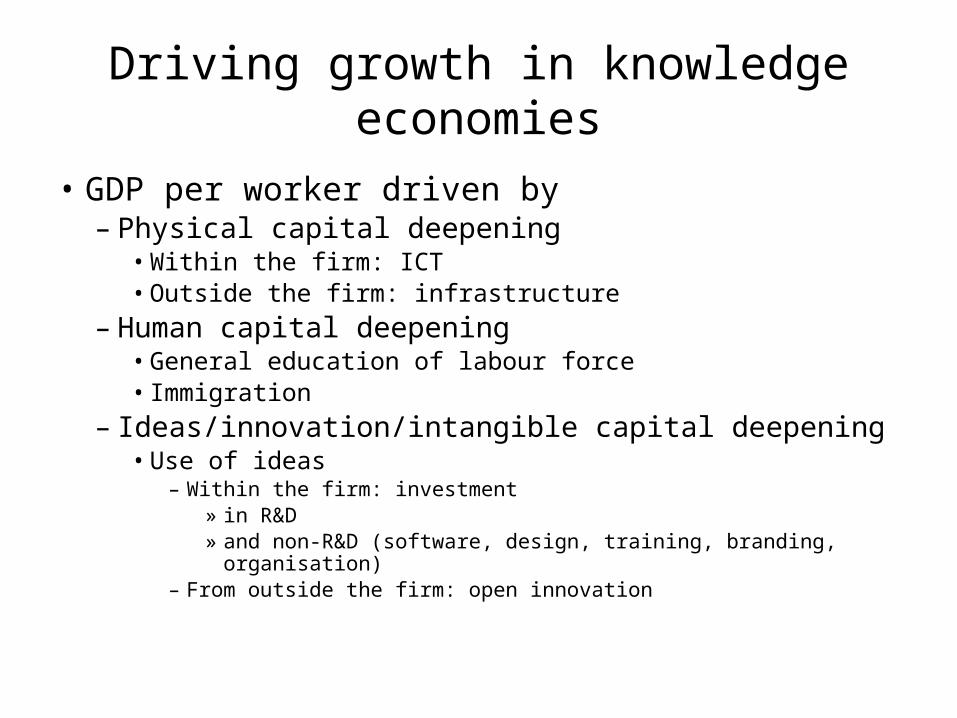
In which industries do countries invest of their intangible capital?Ge most intangible investment in manufacturing, UK in services
France UK Germany Sweden 0%
10%
20%
30%
40%
50%
60%
70%
80%
90%
100%
51.1%
29.0%
70.0%
48.0%
48.9%
71.0%
30.0%
52.0%
% of Total Intangible Investment, 2005
Mkt Svcs Mfr
24

Intangible contributionsRetail: similar; Mfr: Sweden high; Finance: UK high
Components of Labour Productivity Growth, %
29%13% 14% 9% 9% 9% 9% 13%
10%
5% 6% 22% 15% 18% 17% 5%
39%68%
47%41%
50%45% 47% 59%
19% 12%29% 24% 27% 22% 24% 20%
-20%
0%
20%
40%
60%
80%
100%
Intangible cap deep Tangible cap deep Labour quality Intermediate Inputs TFP
TFP 19% 12% 29% 24% 27% 22% 24% 20%
Intermediate Inputs 39% 68% 47% 41% 50% 45% 47% 59%
Labour quality 3% 2% 5% 3% 0% 6% 3% 3%
Tangible cap deep 10% 5% 6% 22% 15% 18% 17% 5%
Intangible cap deep 29% 13% 14% 9% 9% 9% 9% 13%
Sweden Germany UK Sweden Germany UK Sweden UK
Manufacturing Retail Financial and business svcs

An innovation gap?
26
EU
-27
(2
)
Ge
rma
ny
Luxe
mb
ou
rg
Be
lgiu
m
Port
ug
al
Ire
lan
d
Est
on
ia
Au
stri
a
Cyp
rus
Cze
ch R
ep
ub
lic
Sw
ed
en
Ita
ly
Fin
lan
d
De
nm
ark
Slo
ven
ia
Fra
nce
Un
ite
d K
ing
do
m
Ne
the
rla
nd
s
Sp
ain
Ma
lta
Slo
vaki
a
Ro
ma
nia
Bu
lga
ria
Lith
ua
nia
Hu
ng
ary
Pola
nd
Latv
ia
No
rwa
y
Cro
ati
a
US
A
0
25
50
75
100
% of enterprises reporting process or product innovation 2006-8
% o
f e
nte
rpri
ses

![BOURBON/RYE $6 [24,600] THE LOUNGE MENU · East Imperial Soda Water / East Imperial Burma Tonic Water / East Imperial Grapefruit Tonic / East Imperial Yuzu Tonic / East Imperial Thai](https://img.pdfslide.us/doc/110x75/5e6ccd6cbdaeea1277122949/bourbonrye-6-24600-the-lounge-menu-east-imperial-soda-water-east-imperial.jpg)