Embed Size (px)
Citation preview
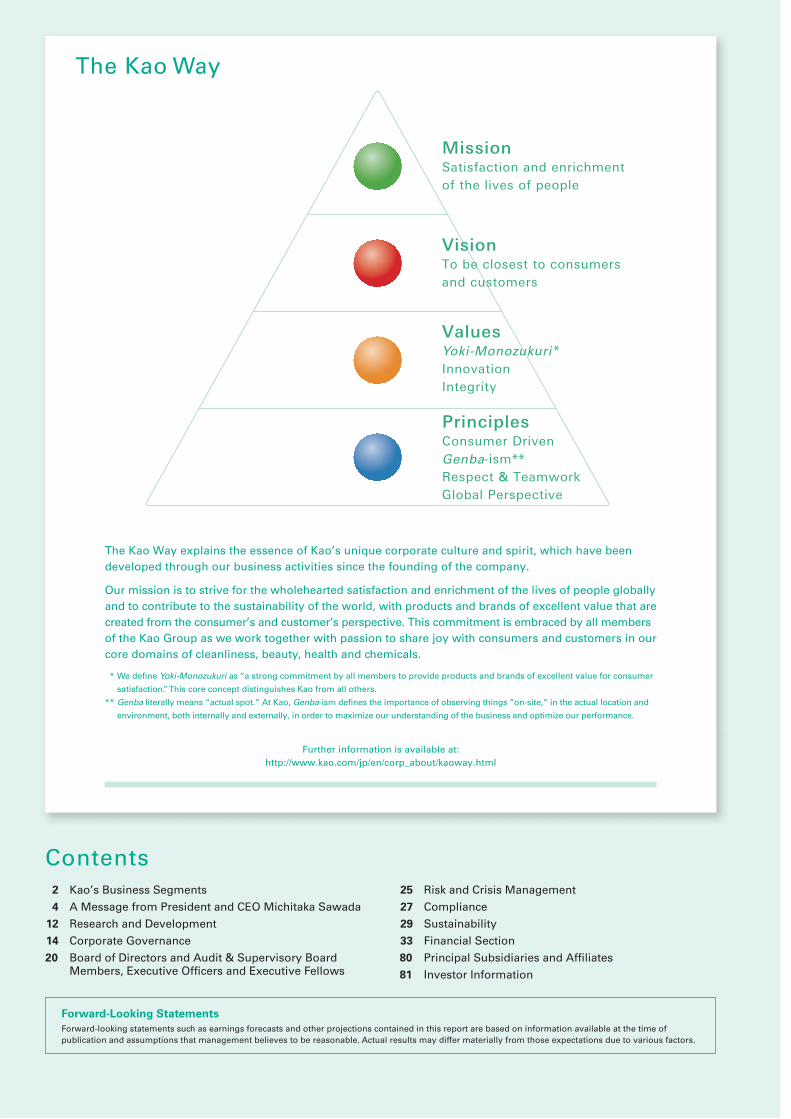
The Kao Way
The Kao Way explains the essence of Kao’s unique corporate culture and spirit, which have been
developed through our business activities since the founding of the company.
Our mission is to strive for the wholehearted satisfaction and enrichment of the lives of people globally
and to contribute to the sustainability of the world, with products and brands of excellent value that are
created from the consumer’s and customer’s perspective. This commitment is embraced by all members
of the Kao Group as we work together with passion to share joy with consumers and customers in our
core domains of cleanliness, beauty, health and chemicals.
* We defi ne Yoki-Monozukuri as “a strong commitment by all members to provide products and brands of excellent value for consumer
satisfaction.” This core concept distinguishes Kao from all others.
** Genba literally means “actual spot.” At Kao, Genba-ism defi nes the importance of observing things “on-site,” in the actual location and
environment, both internally and externally, in order to maximize our understanding of the business and optimize our performance.
Forward-Looking StatementsForward-looking statements such as earnings forecasts and other projections contained in this report are based on information available at the time of publication and assumptions that management believes to be reasonable. Actual results may differ materially from those expectations due to various factors.
Further information is available at:
http://www.kao.com/jp/en/corp_about/kaoway.html
Contents 2 Kao’s Business Segments
4 A Message from President and CEO Michitaka Sawada
12 Research and Development
14 Corporate Governance
20 Board of Directors and Audit & Supervisory Board Members, Executive Offi cers and Executive Fellows
25 Risk and Crisis Management
27 Compliance
29 Sustainability
33 Financial Section
80 Principal Subsidiaries and Affi liates
81 Investor Information
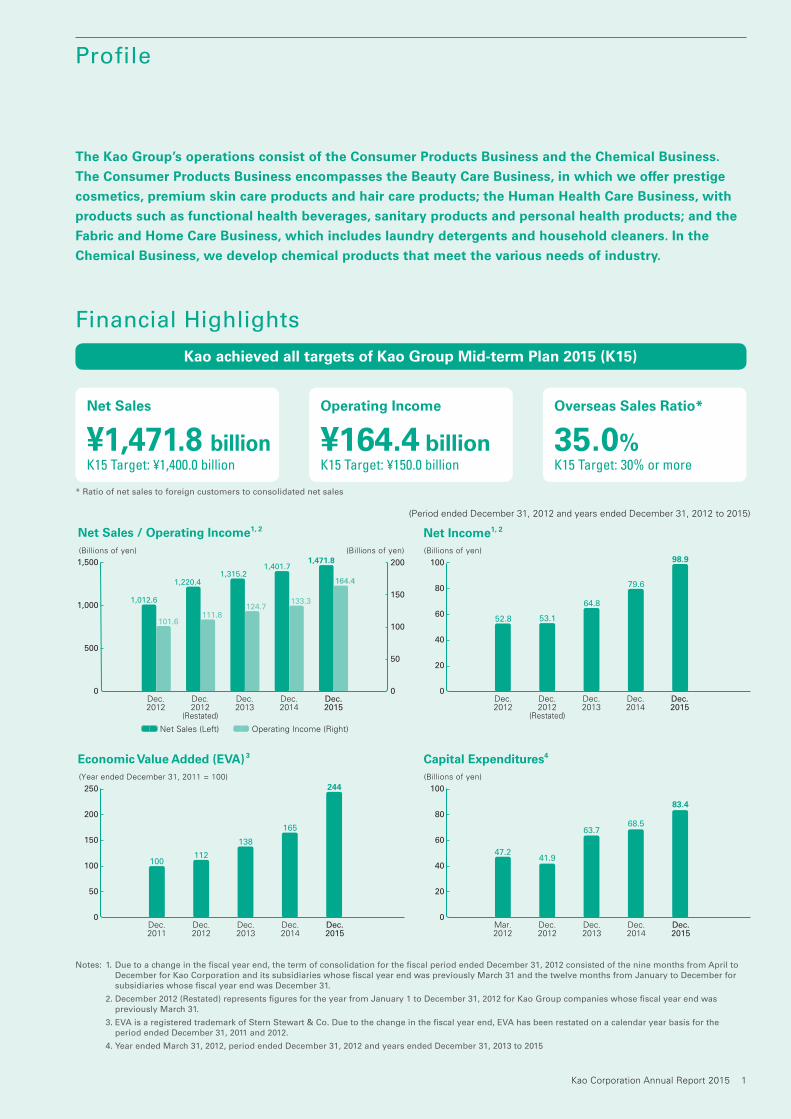
* Ratio of net sales to foreign customers to consolidated net sales
Financial Highlights
(Period ended December 31, 2012 and years ended December 31, 2012 to 2015)
Net Sales / Operating Income1, 2
(Billions of yen)
Net Sales (Left) Operating Income (Right)
1,500
1,000
500
0
(Billions of yen)(Billions of yen)
Net Income1, 2
(Billions of yen)(Year ended December 31, 2011 = 100)
100
80
60
20
0
200
150
100
50
0
40
Economic Value Added (EVA)3
Dec.2012
52.8
Dec.2012
(Restated)
53.1
Dec.2014
Dec.2015
79.6
Dec.2011
Dec.2012
100112
Dec.2013
138
Dec.2014
165
Dec.2013
Dec.2012
Dec.2012
(Restated)
1,012.6
Dec.2014
1,315.2
98.9
Dec.2015
244
Dec.2015
1,401.71,471.8
Dec.2013
1,220.4
64.8
0
50
200
150
100
250
Capital Expenditures4
Mar.2012
Dec.2012
47.241.9
Dec.2013
63.7
Dec.2014
68.5
Dec.2015
83.4
0
20
80
60
40
100
101.6111.8
124.7133.3
164.4
The Kao Group’s operations consist of the Consumer Products Business and the Chemical Business.
The Consumer Products Business encompasses the Beauty Care Business, in which we offer prestige
cosmetics, premium skin care products and hair care products; the Human Health Care Business, with
products such as functional health beverages, sanitary products and personal health products; and the
Fabric and Home Care Business, which includes laundry detergents and household cleaners. In the
Chemical Business, we develop chemical products that meet the various needs of industry.
Profile
Notes: 1. Due to a change in the fi scal year end, the term of consolidation for the fi scal period ended December 31, 2012 consisted of the nine months from April to December for Kao Corporation and its subsidiaries whose fi scal year end was previously March 31 and the twelve months from January to December for subsidiaries whose fi scal year end was December 31.
2. December 2012 (Restated) represents fi gures for the year from January 1 to December 31, 2012 for Kao Group companies whose fi scal year end was previously March 31.
3. EVA is a registered trademark of Stern Stewart & Co. Due to the change in the fi scal year end, EVA has been restated on a calendar year basis for the period ended December 31, 2011 and 2012.
4. Year ended March 31, 2012, period ended December 31, 2012 and years ended December 31, 2013 to 2015
Kao Corporation Annual Report 2015 1
¥1,471.8 billionK15 Target: ¥1,400.0 billion
Net Sales
¥164.4 billionK15 Target: ¥150.0 billion
Operating Income
35.0%K15 Target: 30% or more
Overseas Sales Ratio*
Kao achieved all targets of Kao Group Mid-term Plan 2015 (K15)
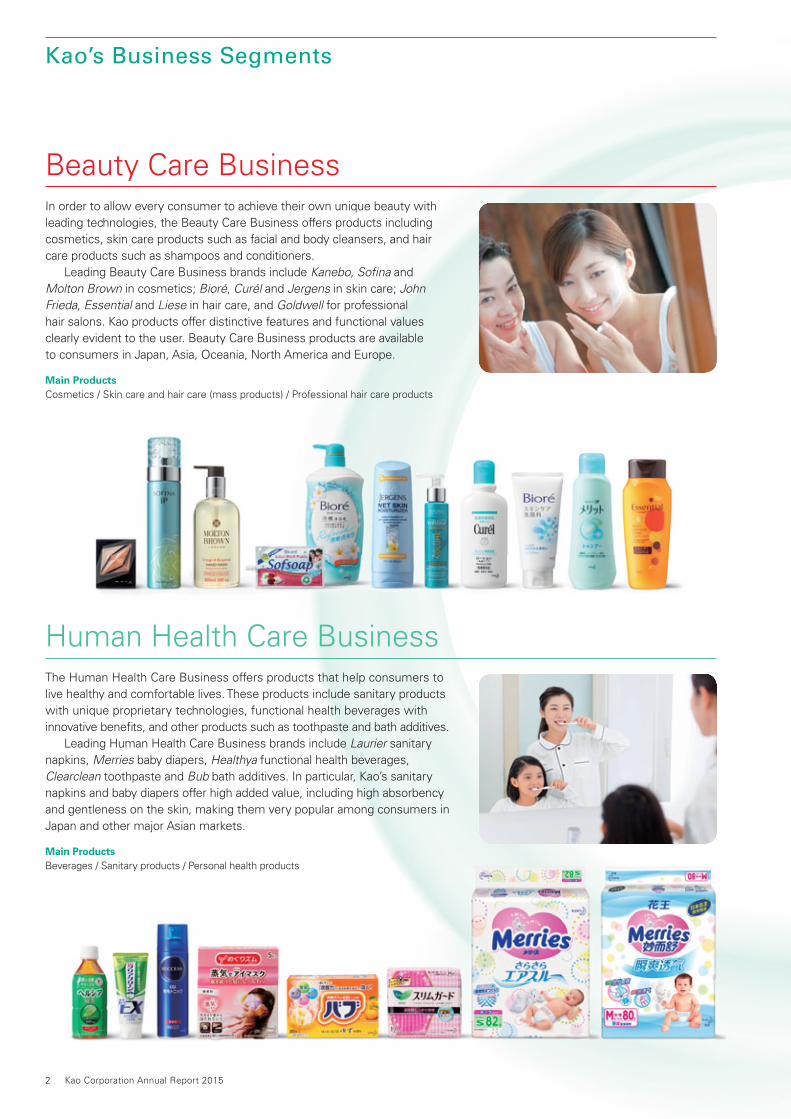
Kao’s Business Segments
Beauty Care Business
Human Health Care Business
In order to allow every consumer to achieve their own unique beauty with leading technologies, the Beauty Care Business offers products including cosmetics, skin care products such as facial and body cleansers, and hair care products such as shampoos and conditioners. Leading Beauty Care Business brands include Kanebo, Sofi na and Molton Brown in cosmetics; Bioré, Curél and Jergens in skin care; John Frieda, Essential and Liese in hair care, and Goldwell for professional hair salons. Kao products offer distinctive features and functional values clearly evident to the user. Beauty Care Business products are available to consumers in Japan, Asia, Oceania, North America and Europe.
Main ProductsCosmetics / Skin care and hair care (mass products) / Professional hair care products
The Human Health Care Business offers products that help consumers to live healthy and comfortable lives. These products include sanitary products with unique proprietary technologies, functional health beverages with innovative benefi ts, and other products such as toothpaste and bath additives. Leading Human Health Care Business brands include Laurier sanitary napkins, Merries baby diapers, Healthya functional health beverages, Clearclean toothpaste and Bub bath additives. In particular, Kao’s sanitary napkins and baby diapers offer high added value, including high absorbency and gentleness on the skin, making them very popular among consumers in Japan and other major Asian markets.
Main ProductsBeverages / Sanitary products / Personal health products
Main ProductsBeverages / Sanitary products / Peersonal health products
2 Kao Corporation Annual Report 2015

Chemical Business
Fabric and Home Care BusinessThe Fabric and Home Care Business offers fabric care products such as laundry detergents and fabric softeners, as well as home care products such as dishwashing detergents and kitchen cleaners. These products are designed for quality, functionality and ease of use, allowing consumers to enjoy a clean and comfortable lifestyle. Leading Fabric and Home Care Business brands include Attack laundry detergent, Haiter laundry bleach and Magiclean household cleaner, all widely used in Japan, Asia and Oceania. As environmental awareness has grown in recent years, and social changes see more women working outside the home, Kao has continued to offer new laundry choices, including liquid detergent with powerful cleaning properties, and single-rinse options that reduce the time needed to do laundry.
Main ProductsLaundry detergents and fabric treatments / Products for kitchen, bath, toilet and living room care
The Chemical Business offers a broad variety of chemical products to the world, including oleo chemicals manufactured from natural fats and oils, surfactants, toners and toner binders, and fragrances and aroma chemicals. Products such as Kalcol fatty alcohol, Emal surfactant, and Mighty high performance superplasticizer (for concrete) enrich people’s lives across a broad range of industries globally, including information technology, electronics, pulp and paper, food, pharmaceuticals, civil engineering and construction. The Chemical Business supplies products to business customers around the world – both outside the Group, and internally to the Consumer Products Business. Kao’s Chemical Business is contributing to the creation of new value.
Main ProductsOleo chemicals / Performance chemicals / Specialty chemicals
y
Main Productskitchen, bath, toilet Laundry ddetetergents and fabric trereaatmente s / Products for
and living rrooom care
Kao Corporation Annual Report 2015 3
A Message from President and CEO Michitaka Sawada
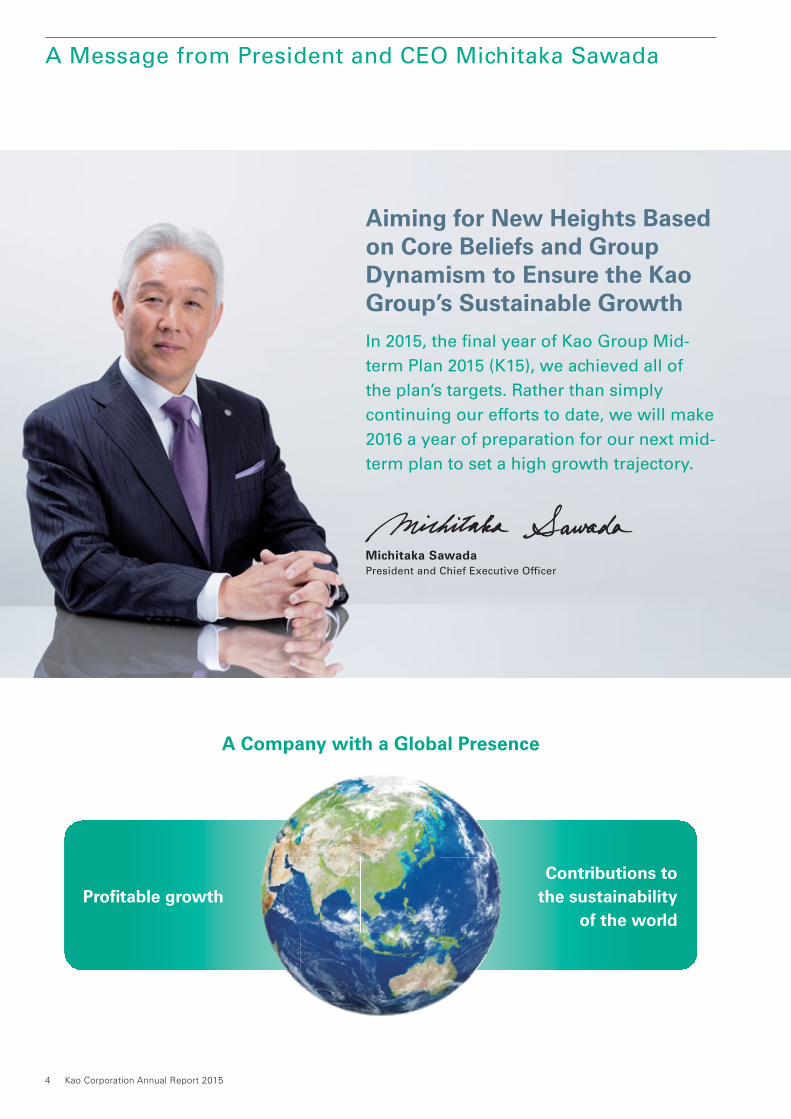
Contributions tothe sustainability
of the worldProfi table growth
A Company with a Global Presence
Aiming for New Heights Based on Core Beliefs and Group Dynamism to Ensure the Kao Group’s Sustainable Growth
In 2015, the fi nal year of Kao Group Mid-
term Plan 2015 (K15), we achieved all of
the plan’s targets. Rather than simply
continuing our efforts to date, we will make
2016 a year of preparation for our next mid-
term plan to set a high growth trajectory.
Michitaka SawadaPresident and Chief Executive Officer
4 Kao Corporation Annual Report 2015
The Direction of the Kao Group
The Kao Group aims to be a company with a global presence as
it works for both sustained “profi table growth” by increasing
the added value of its products and “contributions to the
sustainability of the world” by making proposals to resolve
social issues such as the environment, health, the aging society
and hygiene through its business activities and by conducting
social contribution activities.
The Kao Group aims to be a company with a global presence by adhering to the
Kao Way, our corporate philosophy. After four years of working in this direction,
I feel we are making steady progress in increasing our global presence. There are
many perspectives on how to measure global presence, but I want the Kao Group
to show the greatest presence through our strengths in research and development.
Global recognition as a company that continually spurs innovation has deep
signifi cance for us.
In addition to being recognized for being innovative, we want to be known for
our ongoing core belief in delivering returns to our stakeholders by achieving and
accomplishing the mid-term plans that we announce. No other Japanese company
has increased dividends for 26 consecutive periods, and in 2015 we achieved our
sixth consecutive fi scal year1 of increases in consolidated net sales and profi ts.
As a result, our management indicator Economic Value Added (EVA)2 reached
record highs in terms of both the increase from the previous year and absolute
value, refl ecting a double-digit increase in net operating profi t after tax (NOPAT) and
1. Excluding the effect of the change in the fi scal year-end in 20122. EVA is a registered trademark of Stern Stewart & Co.
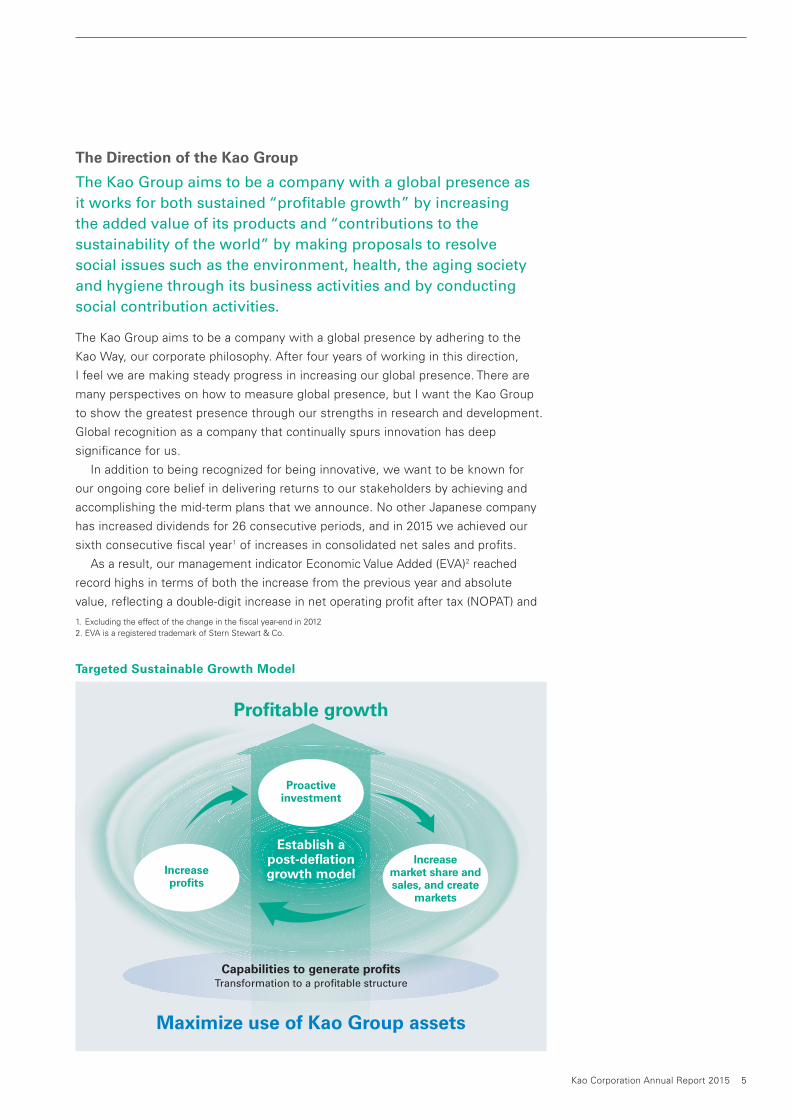
Targeted Sustainable Growth Model
Proactiveinvestment
Increaseprofi ts
Increasemarket share and sales, and create
markets
Capabilities to generate profi tsTransformation to a profi table structure
Profi table growth
Maximize use of Kao Group assets
Establish apost-defl ationgrowth model
Kao Corporation Annual Report 2015 5
our ability to minimize the increase in capital invested by maximizing our utilization of
assets. In addition, ROE increased by 2.4 points compared with the previous year to
14.8 percent. Through results like these, we aim to stand out as an exemplary global
company in management direction as well.
The next mid-term plan will not take the approach of simply continuing the efforts
we have made so far. Rather, we will consider what is necessary to make a leap to the
next stage and to pave the way to becoming a company with a truly global presence.
This will require a considerable amount of preparation. We are now conducting a
Group-wide review of the achievements and issues of K15. At the same time, we are
methodically preparing K20, a mid-term plan that will begin in 2017 and deal with
various changes in the external business environment.
Summary of K15
The Kao Group has made further progress in maximizing the use of our assets in order to steadily improve our capabilities to generate profi ts. As expected, the sustainable growth model is beginning to generate a positive cycle.
Achievements of K15
We achieved all of the targets of K15. The fact that we achieved ¥164.4 billion in
operating income in 2015, which not only exceeded our target of ¥150.0 billion but
was also a 23.3 percent increase from the previous year, is proof of the effectiveness
of the sustainable growth model we have been working on under K15. The essential
point of this model is that through maximizing the use of Kao Group assets and the
synergy generated by effective deployment of expenditures, we are transitioning to
a profi table structure, or in other words, improving our capabilities to generate
profi ts. One success of K15 is that all employees now feel personal responsibility
for utilizing assets and put this approach into practice in their work.
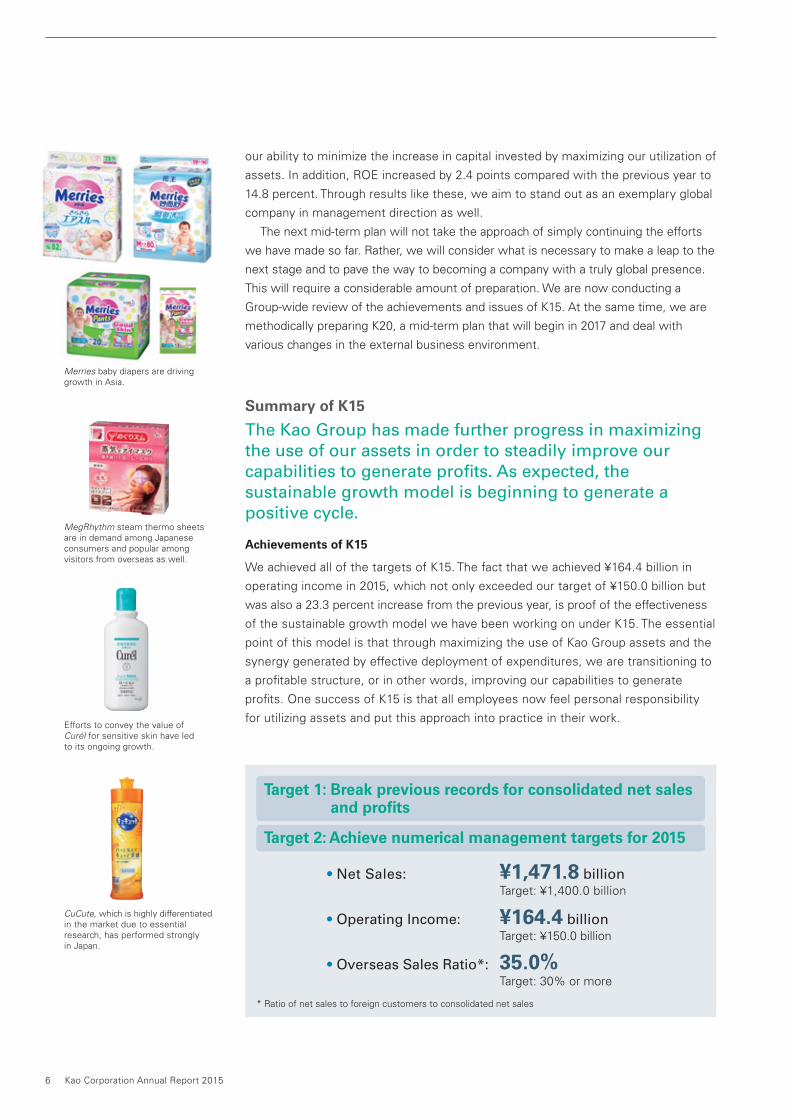
Target 1: Break previous records for consolidated net sales and profi ts
Target 2: Achieve numerical management targets for 2015
• Net Sales: ¥1,471.8 billionTarget: ¥1,400.0 billion
• Operating Income: ¥164.4 billion Target: ¥150.0 billion
• Overseas Sales Ratio*: 35.0%
Target: 30% or more
* Ratio of net sales to foreign customers to consolidated net sales
6 Kao Corporation Annual Report 2015
Merries baby diapers are driving growth in Asia.
MegRhythm steam thermo sheets are in demand among Japanese consumers and popular among visitors from overseas as well.
Efforts to convey the value of Curél for sensitive skin have led to its ongoing growth.
CuCute, which is highly differentiated in the market due to essential research, has performed strongly in Japan.
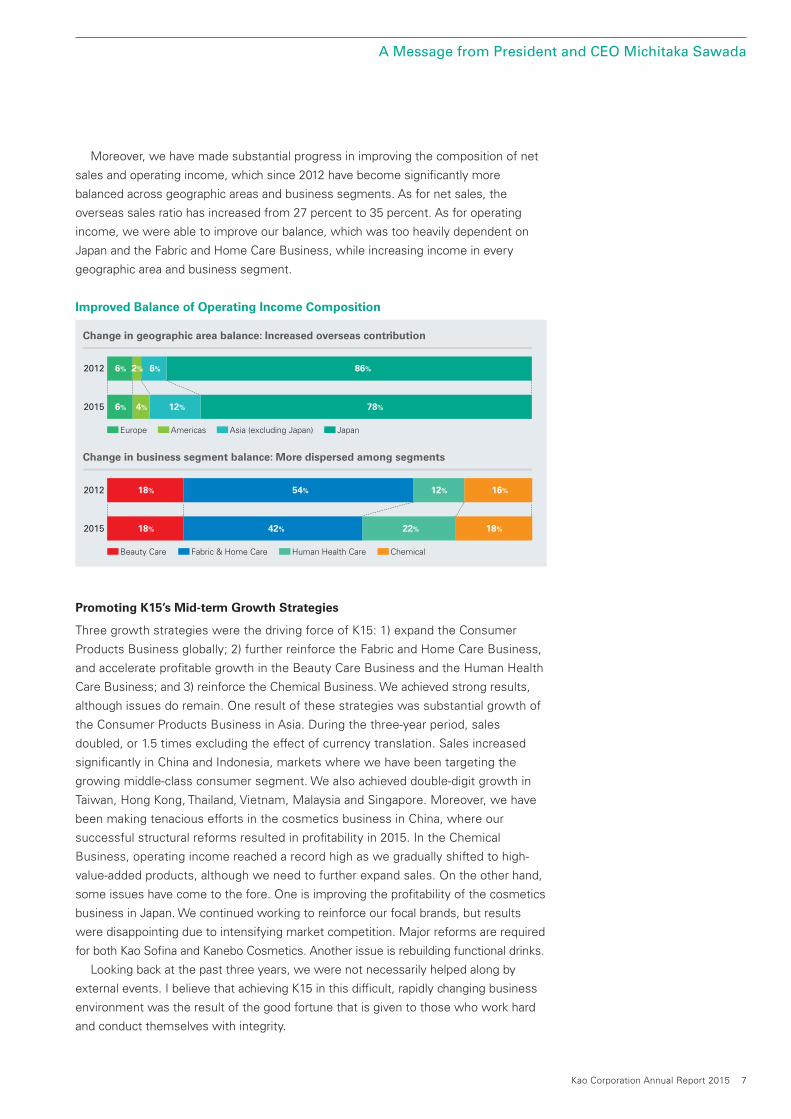
Moreover, we have made substantial progress in improving the composition of net
sales and operating income, which since 2012 have become signifi cantly more
balanced across geographic areas and business segments. As for net sales, the
overseas sales ratio has increased from 27 percent to 35 percent. As for operating
income, we were able to improve our balance, which was too heavily dependent on
Japan and the Fabric and Home Care Business, while increasing income in every
geographic area and business segment.
Promoting K15’s Mid-term Growth Strategies
Three growth strategies were the driving force of K15: 1) expand the Consumer
Products Business globally; 2) further reinforce the Fabric and Home Care Business,
and accelerate profi table growth in the Beauty Care Business and the Human Health
Care Business; and 3) reinforce the Chemical Business. We achieved strong results,
although issues do remain. One result of these strategies was substantial growth of
the Consumer Products Business in Asia. During the three-year period, sales
doubled, or 1.5 times excluding the effect of currency translation. Sales increased
signifi cantly in China and Indonesia, markets where we have been targeting the
growing middle-class consumer segment. We also achieved double-digit growth in
Taiwan, Hong Kong, Thailand, Vietnam, Malaysia and Singapore. Moreover, we have
been making tenacious efforts in the cosmetics business in China, where our
successful structural reforms resulted in profi tability in 2015. In the Chemical
Business, operating income reached a record high as we gradually shifted to high-
value-added products, although we need to further expand sales. On the other hand,
some issues have come to the fore. One is improving the profi tability of the cosmetics
business in Japan. We continued working to reinforce our focal brands, but results
were disappointing due to intensifying market competition. Major reforms are required
for both Kao Sofi na and Kanebo Cosmetics. Another issue is rebuilding functional drinks.
Looking back at the past three years, we were not necessarily helped along by
external events. I believe that achieving K15 in this diffi cult, rapidly changing business
environment was the result of the good fortune that is given to those who work hard
and conduct themselves with integrity.
A Message from President and CEO Michitaka Sawada
Improved Balance of Operating Income Composition
86%2% 6%6%2012
2015
2012
2015
78%4% 12%6%
54% 12% 16%18%
42% 22% 18%18%
Change in geographic area balance: Increased overseas contribution
Change in business segment balance: More dispersed among segments
JapanAmericas Asia (excluding Japan)Europe
Beauty Care Human Health CareFabric & Home Care Chemical
Kao Corporation Annual Report 2015 7
Future Directions and Positioning in 2016
We intend to fulfi ll our role as a leading company, which will increase our corporate value. The Kao Group will use 2016 to prepare for K20, a mid-term plan that will begin in 2017, and the greater progress it will entail. We will act based on our core beliefs and display group dynamism.
We will use 2016 to fully prepare to take our next step, which will be “discontinuous.” In
other words, our next step will not be a continuation of what we have done in the past.
We must look back on what we could and could not accomplish under K15 from the
perspective of maximizing the use of our assets, which has been a recurring theme.
Displaying Group Dynamism
Under K15, we have been focusing on maximizing the use of our assets. We are now
able to make quite high-level use of our assets, so taking on the further challenge of
maximizing our assets to display group dynamism will be a major theme from now on.
Some may feel that a focus on group dynamism will dilute the strengths of the
individual. However, the group dynamism we aim for in the Kao Group entails making
greater use of our potential and assets and maximizing them to boldly take on
challenges that lead to the creation of new business opportunities. The Kao Group has
numerous research assets with the power to generate strong synergy between the
Chemical Business and the Consumer Products Business. I believe that having these
two businesses that can generate synergy is a unique advantage for Kao, and a feature
that separates us from our global peers.
If you think only of short-term, immediate profi t, one view is that it is a good idea to
get rid of dormant assets and underperforming businesses. At Kao, we believe that
making skillful changes in tune with the times to poorly performing products and
businesses enables them to resurface. Conversely, there may be cases where
products and services that are currently making good progress slow down or stall.
Conducting businesses that are complementary at a high level is a strength of Japanese
companies and an essential element of Kao’s style.
Core Beliefs Unique to Kao
Our core beliefs encompass not only our attitude toward “Yoki-Monozukuri,” or
providing products and brands of excellent value created from the customer’s
perspective, but also our objectives of continuously raising dividends, increasing sales
and profi ts, and achieving our management plans. Furthermore, I am convinced that
these core beliefs will support our efforts to achieve sustainable growth. In 2016, in
addition to increasing sales and profi ts for the seventh consecutive year and achieving
our announced forecast, we will continue to fi rmly maintain our core belief in
sustainable growth as we further strengthen our abilities to generate profi ts by
deepening our sustainable growth model and creating and offering profi table new
businesses. Moreover, we will engage in proactive investment for growth, including
M&A. We also have a core belief in making sustainable returns to our stakeholders.
We intend to be thorough in making returns to our employees (continuous increases in
compensation and benefi ts), returns to society (payment of taxes, providing
employment, social contributions) and returns to our shareholders (continuous
increases in dividends).
8 Kao Corporation Annual Report 2015
Core Initiatives and Areas of Focus in 2016
During 2016, we will work on three broad themes that will lead into K20. The fi rst is
strengthening and expanding existing businesses. We will ensure that growing
businesses continue to grow even further and put poorly performing businesses on a
growth trajectory. In the cosmetics business, we will put the major reforms of Kao
Sofi na that we started in November 2015 on track, and in 2016 we will conduct major
reforms at Kanebo Cosmetics as well, among other measures for rapid rebuilding. For
food and beverage products in the Human Health Care Business, we will rebuild
Healthya (functional drinks) and consider entering food and health-related businesses.
In the Consumer Products Business in the Americas and Europe, we will focus on
using our original technologies to add higher value to products for “discontinuous”
growth that is more than simply an extension of our growth to date.
The second theme is creating new businesses. We will display the group dynamism
of the Kao Group, for example to take a new approach in the domain of hygiene, at the
intersection of the business fi elds of cleanliness, beauty and health. We will also focus
on proactive M&A to expand and create businesses.
The third theme is accelerating expansion outside Japan. We want to use our
achievements in Asia as a lever for proactively expanding into new countries.
Taking a bird’s eye view of the socioeconomic environment, structural changes are
forecast to occur worldwide, with shifts in the center of the economy, changes in
consumer preferences and other factors. By positioning 2016 as a year of preparation,
we will not only acquire the ability to adapt to whatever changes may occur, but also
turn the changes that do occur into opportunities for progress.
Kao’s Essential Research
Kao’s essential research is rooted in its knowledge of surface science. We use matrix management of R&D for innovation in each business fi eld, which leads to innovative products.
Research and development is the source of our ability to create products and brands
of excellent value, and our foremost core belief. Based on our belief that excellent
products are created in a background environment of diverse scientifi c expertise
and technologies, our research covers a truly broad range of fi elds. I think that
having expertise in and the seeds of technologies for both humans (biological science)
and materials (material science) makes Kao a distinctive company, not just in Japan
but worldwide. Using matrix management for research and development is also a
unique feature. Both product development research and fundamental research are
closely connected to each business division. This promotes linkage of technologies
through cross-divisional collaboration.
In addition, the pursuit of the essence of things from a scientifi c standpoint, or in
other words essential research, is key to Kao’s R&D. Our essential research is rooted
in surface science. Surface science is at the core of Kao, and the control of surfaces
opens up unlimited possibilities. For example, applying fabric softener to the surface of
fi bers makes them feel fl uffy, while spreading an oil fi lm over the surface of the skin
creates a skin barrier. Adding a mechanism for breaking down a dirty surface creates
A Message from President and CEO Michitaka Sawada
Kao Corporation Annual Report 2015 9
detergent. In the fi nal analysis, surface science applies to everything, even enabling
precise control at the nano level. The nano surfactant control technology developed for
our chemical products is being used in our consumer products research.
R&D is not always immediately successful, but I regularly tell our researchers to
carry on their work with confi dence and peace of mind because there is no such thing
as failure in developing technologies. Product development is linked to consumers, so
you can fail if you do not understand their needs, but technology development may still
be used for another product at some point in the future. Technologies that cannot
immediately be turned into products are fi led away for the time being, using methods
that allow them to be shared among our researchers. Then, three years or fi ve years
later, when things have changed, they can be taken out of that fi le and applied to a
new product. Skillfully combining research assets that have been deepened through
essential research can help to create new worlds. I want to use these results to create
new value from the consumer’s perspective and to further stimulate markets.
Securing Stakeholder Support and Trust
We will promote further reform of corporate governance and conduct corporate activities that regularly refer to the Kao Way, the source of Kao’s efforts for sustainability.
Ongoing Enhancement of Corporate Governance
Behind the successful completion of K15 were three changes we made to our
organizational management. The fi rst was delegating authority and accelerating
decision-making. We have implemented management improvements and the
Management Committee has decided that when we are on the fence about, for
example, an investment opportunity, our default stance will be action rather than
hesitation. The second is enhancement of governance. In July 2015, we released a
Report Concerning Corporate Governance that explains the status of implementation
of the principles of the Corporate Governance Code established by the Tokyo Stock
Exchange. Currently, Kao has six independent offi cers – three Outside Directors
and three Outside Audit & Supervisory Board Members – to provide a framework
for an exchange of opinions based on an objective view of the company. We are
aware of the need for greater diversity in the composition of the Board of Directors.
The third is enhancement of employee mindset. Through measures such as Top Talk,
a message I post on the company intranet, and Genba Roundtable sessions, where
employees engage in exchange of opinions with management, I share the
direction of the Kao Group, the Kao Sustainability Statement and other matters
with employees.
Respecting Human Rights and Promoting Diversity in the Workplace
Under the Kao Way, our corporate philosophy, the Kao Group respects diversity of
culture, nationality, belief, race and gender in the workplace. In addition to providing
training and promotions based on employees’ motivation and capabilities, since 1990
we have had an ongoing support system for diverse ways of working to promote
active participation by women.
In light of the global community’s growing interest in human rights, we held
discussions with related internal divisions and outside experts that led to the
10 Kao Corporation Annual Report 2015
* Net cash provided by operating activities
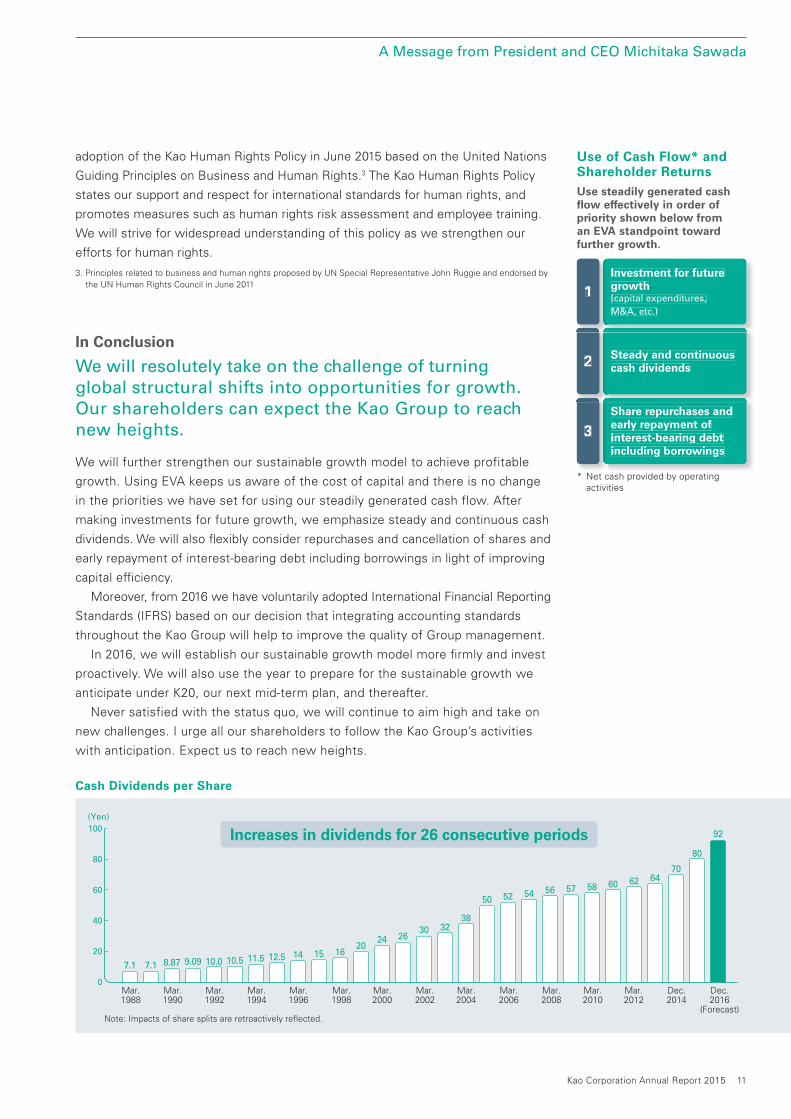
Use of Cash Flow* and Shareholder Returns
Investment for futuregrowth(capital expenditures,
M&A, etc.)
1
Steady and continuous cash dividends2
Share repurchases and early repayment of interest-bearing debt including borrowings
3
Use steadily generated cash fl ow effectively in order of priority shown below from an EVA standpoint toward further growth.
adoption of the Kao Human Rights Policy in June 2015 based on the United Nations
Guiding Principles on Business and Human Rights.3 The Kao Human Rights Policy
states our support and respect for international standards for human rights, and
promotes measures such as human rights risk assessment and employee training.
We will strive for widespread understanding of this policy as we strengthen our
efforts for human rights.
3. Principles related to business and human rights proposed by UN Special Representative John Ruggie and endorsed by the UN Human Rights Council in June 2011
In Conclusion
We will resolutely take on the challenge of turning global structural shifts into opportunities for growth. Our shareholders can expect the Kao Group to reach new heights.
We will further strengthen our sustainable growth model to achieve profitable
growth. Using EVA keeps us aware of the cost of capital and there is no change
in the priorities we have set for using our steadily generated cash flow. After
making investments for future growth, we emphasize steady and continuous cash
dividends. We will also fl exibly consider repurchases and cancellation of shares and
early repayment of interest-bearing debt including borrowings in light of improving
capital effi ciency.
Moreover, from 2016 we have voluntarily adopted International Financial Reporting
Standards (IFRS) based on our decision that integrating accounting standards
throughout the Kao Group will help to improve the quality of Group management.
In 2016, we will establish our sustainable growth model more fi rmly and invest
proactively. We will also use the year to prepare for the sustainable growth we
anticipate under K20, our next mid-term plan, and thereafter.
Never satisfied with the status quo, we will continue to aim high and take on
new challenges. I urge all our shareholders to follow the Kao Group’s activities
with anticipation. Expect us to reach new heights.
Cash Dividends per Share
(Yen)
0
20
40
60
100
80
Mar.1990
Mar.1988
Mar.1992
Mar.1994
Mar.1996
Mar.1998
Mar.2000
Mar.2002
Mar.2004
Mar.2006
Mar.2008
Mar.2010
Mar.2012
Dec.2014
Dec.2016
(Forecast)Note: Impacts of share splits are retroactively reflected.
7.1 7.1 8.87 9.09 10.0 10.5 11.5 12.5 14 15 1620
24 2630 32
38
50 52 54 56 57 58 60 62 6470
80
92
A Message from President and CEO Michitaka Sawada
Increases in dividends for 26 consecutive periods
Kao Corporation Annual Report 2015 11
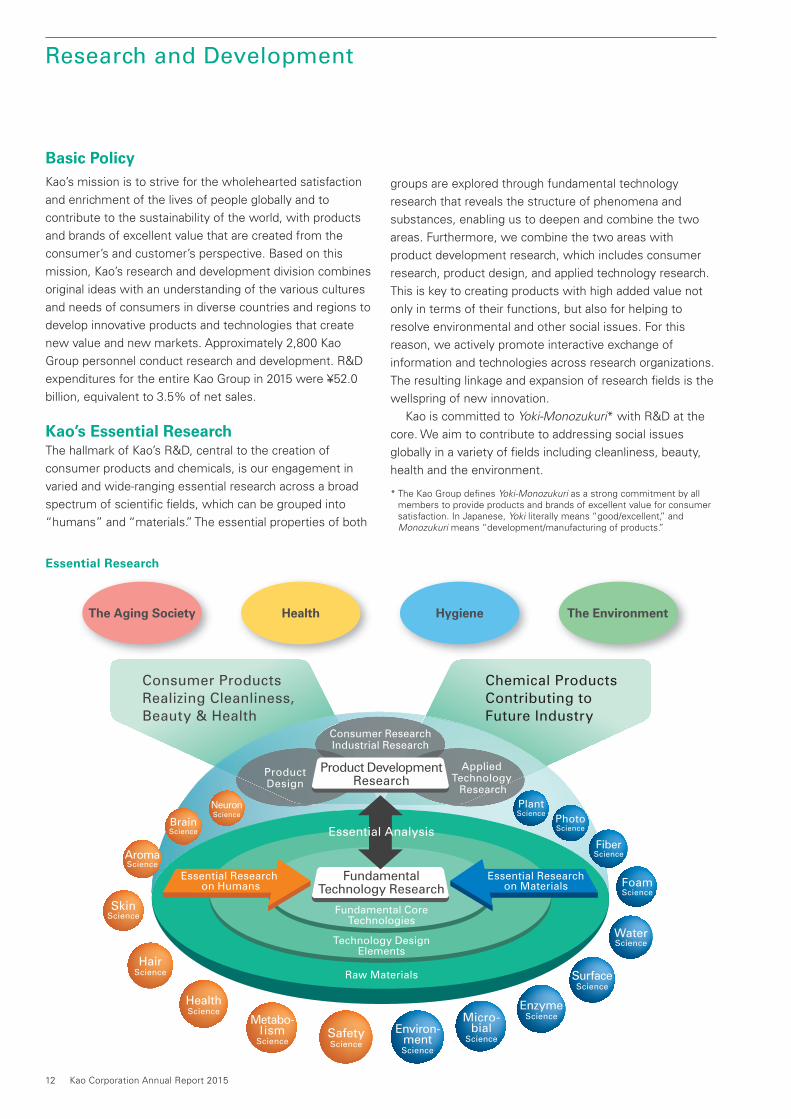
Research and Development
The Aging Society Health Hygiene The Environment
Basic PolicyKao’s mission is to strive for the wholehearted satisfaction
and enrichment of the lives of people globally and to
contribute to the sustainability of the world, with products
and brands of excellent value that are created from the
consumer’s and customer’s perspective. Based on this
mission, Kao’s research and development division combines
original ideas with an understanding of the various cultures
and needs of consumers in diverse countries and regions to
develop innovative products and technologies that create
new value and new markets. Approximately 2,800 Kao
Group personnel conduct research and development. R&D
expenditures for the entire Kao Group in 2015 were ¥52.0
billion, equivalent to 3.5% of net sales.
Kao’s Essential ResearchThe hallmark of Kao’s R&D, central to the creation of
consumer products and chemicals, is our engagement in
varied and wide-ranging essential research across a broad
spectrum of scientifi c fi elds, which can be grouped into
“humans” and “materials.” The essential properties of both
groups are explored through fundamental technology
research that reveals the structure of phenomena and
substances, enabling us to deepen and combine the two
areas. Furthermore, we combine the two areas with
product development research, which includes consumer
research, product design, and applied technology research.
This is key to creating products with high added value not
only in terms of their functions, but also for helping to
resolve environmental and other social issues. For this
reason, we actively promote interactive exchange of
information and technologies across research organizations.
The resulting linkage and expansion of research fi elds is the
wellspring of new innovation.
Kao is committed to Yoki-Monozukuri* with R&D at the
core. We aim to contribute to addressing social issues
globally in a variety of fi elds including cleanliness, beauty,
health and the environment.
* The Kao Group defi nes Yoki-Monozukuri as a strong commitment by all members to provide products and brands of excellent value for consumer satisfaction. In Japanese, Yoki literally means “good/excellent,” and Monozukuri means “development/manufacturing of products.”
12 Kao Corporation Annual Report 2015
Essential Research
Beauty Care Business
Basic Policy
Kao conducts essential research for a deep understanding of the true nature of the skin and hair of people around the world and develops materials and formulations that give rise to new functions. By doing so, we aim to help consumers achieve healthy, beautiful skin and hair, and to offer beauty proposals tailored to diverse lifestyles.
2015 R&D expenditures:
¥23.9 billion
Human Health Care Business
Basic Policy
Kao researches the body and mind to improve quality of life by making the most of people’s natural vitality.
2015 R&D expenditures:
¥11.9 billion
Fabric and Home Care Business
Basic Policy
Kao’s research and development spans a wide range of fi elds from household products that meet the diverse needs of consumers to products for professional use where a high level of cleanliness and hygiene is required.
2015 R&D expenditures:
¥7.1 billion
Chemical Business
Basic Policy
Kao’s research and development strives for more substantive R&D results in areas including oils and fats, surfactants and polymers to produce chemical products distinguished by their ability to meet diverse needs in a wide range of industries.
2015 R&D expenditures:
¥9.1 billion
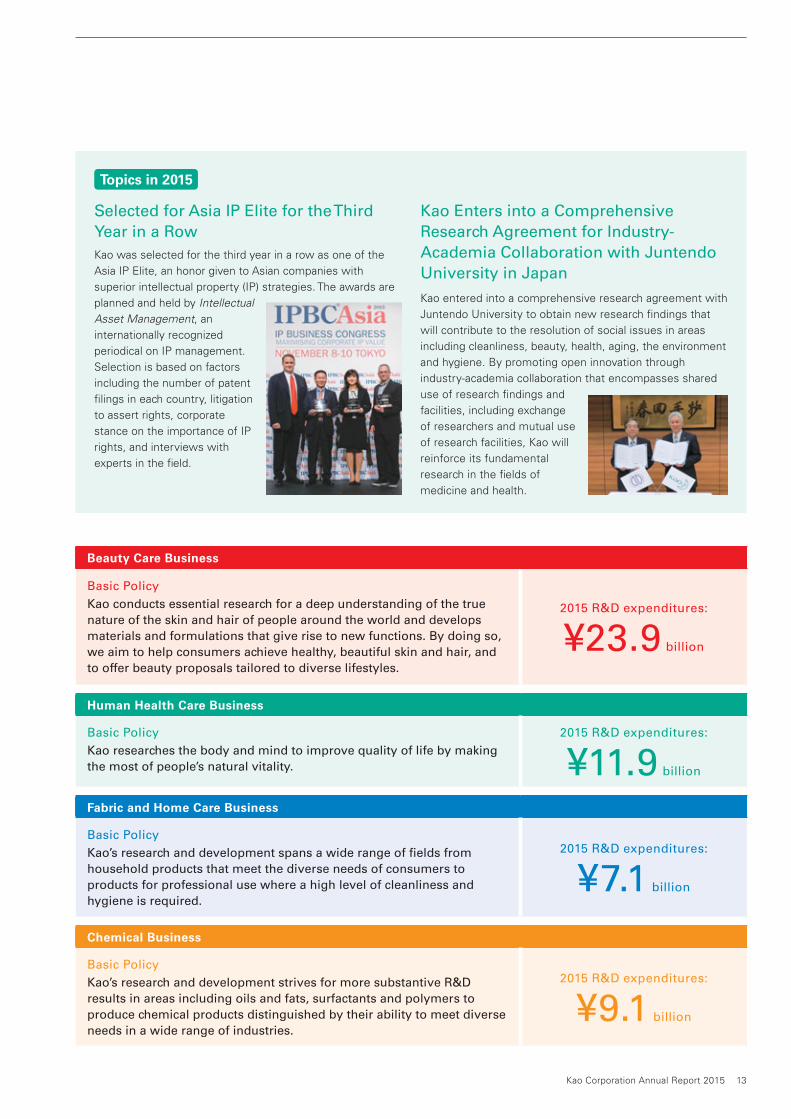
Selected for Asia IP Elite for the Third Year in a Row
Kao was selected for the third year in a row as one of the
Asia IP Elite, an honor given to Asian companies with
superior intellectual property (IP) strategies. The awards are
planned and held by Intellectual
Asset Management, an
internationally recognized
periodical on IP management.
Selection is based on factors
including the number of patent
fi lings in each country, litigation
to assert rights, corporate
stance on the importance of IP
rights, and interviews with
experts in the fi eld.
Kao Enters into a Comprehensive Research Agreement for Industry-Academia Collaboration with Juntendo University in Japan
Kao entered into a comprehensive research agreement with
Juntendo University to obtain new research fi ndings that
will contribute to the resolution of social issues in areas
including cleanliness, beauty, health, aging, the environment
and hygiene. By promoting open innovation through
industry-academia collaboration that encompasses shared
use of research fi ndings and
facilities, including exchange
of researchers and mutual use
of research facilities, Kao will
reinforce its fundamental
research in the fi elds of
medicine and health.
Topics in 2015
Kao Corporation Annual Report 2015 13
Basic Stance and Structure
Kao’s basic stance on measures related to corporate
governance is to implement the necessary policies and
fulfill its accountability by setting up and operating a
management structure and internal control system in
order to rapidly realize efficient, sound, fair and highly
transparent management with the aim of continuously
increasing corporate value and achieving the long-term
targets and mid-term plan.
In accordance with this stance, Kao works to improve
governance as a company with an Audit & Supervisory
Board by strengthening the supervisory function of the
Board of Directors and the auditing function of the Audit
& Supervisory Board. An overview of Kao’s governance
structure is given in the following chart.
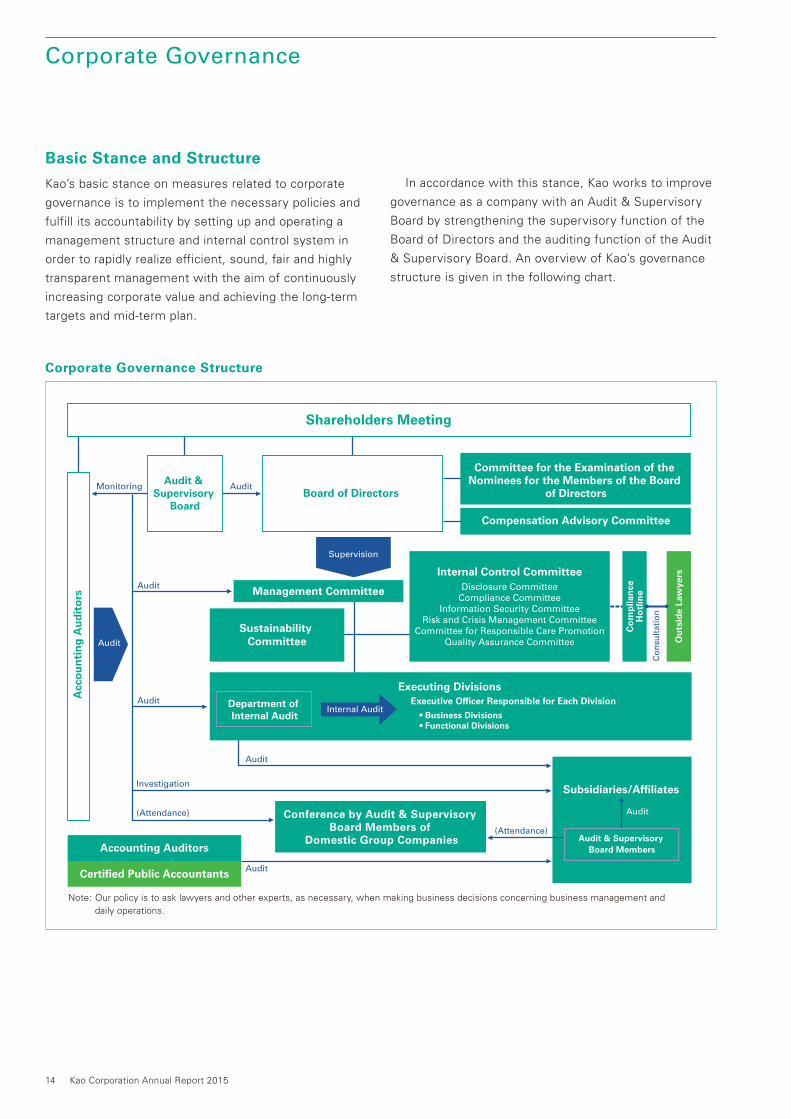
Corporate Governance Structure
Shareholders Meeting
Audit & Supervisory
Board
Committee for the Examination of the Nominees for the Members of the Board
of Directors
Compensation Advisory Committee
Management Committee
Conference by Audit & Supervisory Board Members of
Domestic Group Companies
Subsidiaries/Affiliates
Audit & Supervisory Board Members
Sustainability CommitteeAudit
Internal Audit
Audit
Audit
Audit
Co
nsu
ltat
ion
AuditMonitoring
Audit
Investigation
Note: Our policy is to ask lawyers and other experts, as necessary, when making business decisions concerning business management and
daily operations.
(Attendance)
(Attendance)
Supervision
Department of Internal Audit
Executive Officer Responsible for Each Division
• Business Divisions• Functional Divisions
Executing Divisions
Board of Directors
Acc
ou
nti
ng
Au
dit
ors
Accounting Auditors
Certified Public Accountants Audit
Co
mp
lian
ceH
otl
ine
Ou
tsid
e La
wye
rsInternal Control CommitteeDisclosure Committee
Compliance CommitteeInformation Security Committee
Risk and Crisis Management CommitteeCommittee for Responsible Care Promotion
Quality Assurance Committee
Corporate Governance
14 Kao Corporation Annual Report 2015
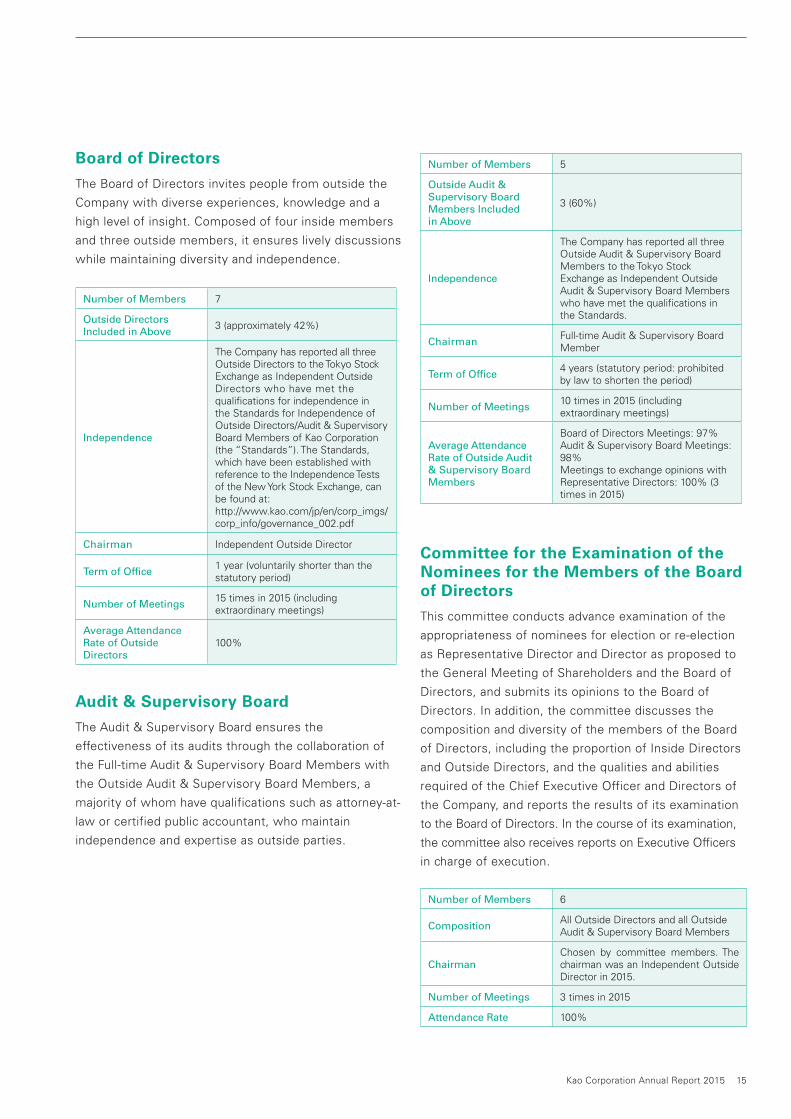
Number of Members 5
Outside Audit &Supervisory BoardMembers Includedin Above
3 (60%)
Independence
The Company has reported all three Outside Audit & Supervisory Board Members to the Tokyo Stock Exchange as Independent Outside Audit & Supervisory Board Members who have met the qualifi cations in the Standards.
ChairmanFull-time Audit & Supervisory Board Member
Term of Offi ce4 years (statutory period: prohibited by law to shorten the period)
Number of Meetings10 times in 2015 (including extraordinary meetings)
Average AttendanceRate of Outside Audit& Supervisory BoardMembers
Board of Directors Meetings: 97%Audit & Supervisory Board Meetings: 98%Meetings to exchange opinions with Representative Directors: 100% (3 times in 2015)
Board of Directors
The Board of Directors invites people from outside the
Company with diverse experiences, knowledge and a
high level of insight. Composed of four inside members
and three outside members, it ensures lively discussions
while maintaining diversity and independence.
Committee for the Examination of the Nominees for the Members of the Board of Directors
This committee conducts advance examination of the
appropriateness of nominees for election or re-election
as Representative Director and Director as proposed to
the General Meeting of Shareholders and the Board of
Directors, and submits its opinions to the Board of
Directors. In addition, the committee discusses the
composition and diversity of the members of the Board
of Directors, including the proportion of Inside Directors
and Outside Directors, and the qualities and abilities
required of the Chief Executive Officer and Directors of
the Company, and reports the results of its examination
to the Board of Directors. In the course of its examination,
the committee also receives reports on Executive Offi cers
in charge of execution.
Number of Members 6
CompositionAll Outside Directors and all Outside Audit & Supervisory Board Members
ChairmanChosen by committee members. The chairman was an Independent Outside Director in 2015.
Number of Meetings 3 times in 2015
Attendance Rate 100%
Number of Members 7
Outside DirectorsIncluded in Above
3 (approximately 42%)
Independence
The Company has reported all three Outside Directors to the Tokyo Stock Exchange as Independent Outside Directors who have met the qualifi cations for independence in the Standards for Independence of Outside Directors/Audit & Supervisory Board Members of Kao Corporation (the “Standards”). The Standards, which have been established with reference to the Independence Tests of the New York Stock Exchange, can be found at:http://www.kao.com/jp/en/corp_imgs/corp_info/governance_002.pdf
Chairman Independent Outside Director
Term of Offi ce1 year (voluntarily shorter than thestatutory period)
Number of Meetings15 times in 2015 (including extraordinary meetings)
Average AttendanceRate of OutsideDirectors
100%
Audit & Supervisory Board
The Audit & Supervisory Board ensures the
effectiveness of its audits through the collaboration of
the Full-time Audit & Supervisory Board Members with
the Outside Audit & Supervisory Board Members, a
majority of whom have qualifications such as attorney-at-
law or certified public accountant, who maintain
independence and expertise as outside parties.
Kao Corporation Annual Report 2015 15
Compensation Advisory Committee
This committee examines the compensation system and
remuneration levels for Directors and Executive Officers
and submits the results of its examinations to the Board
of Directors.
Number of Members 9
Composition
Chairman of the Board of Directors (position currently vacant), all Representative Directors, all Outside Directors and all Outside Audit & Supervisory Board Members
ChairmanChosen by committee members. The chairman was an Independent Outside Director in 2015.
Number of Meetings3 times in 2015 including preparatory discussions.
Compensation System See next page
Support System for Outside Directors and Outside Audit & Supervisory Board Members
To allow for active discussions at meetings of the Board
of Directors, the Board of Directors Secretariat provides
Outside Directors and Outside Audit & Supervisory
Board Members with sufficient explanations by
distributing materials on matters such as the
background, purposes and content of the respective
agenda items, as necessary, prior to meetings of the
Board of Directors. Furthermore, under this support
system, in addition to support staff, administrative
divisions such as Internal Audit, the Legal and
Compliance Department and the Accounting and Finance
Department provide Outside Audit & Supervisory Board
Members with assistance upon request.
2) Clearly working out and implementing risk
management for Kanebo Cosmetics, a subsidiary that
faced the management crisis of a voluntary product
recall in July 2013. As the parent company of a
consumer goods business group, we put the recovery
and care of customers first, with an unwavering
stance of wholeheartedly providing fair and equitable
compensation and support; and
3) Ambitious initiatives for further growth and the
investment to fund them, amid strong performance
consisting of six consecutive fiscal years of increases
in sales and profits.
In these discussions, I give my opinion whenever I
have doubts about proposals for execution. So far,
however, I have enthusiastically supported the
decisions that have been made.
I have been a member of Kao’s
Board of Directors for more
than three years, with
expectations placed on my
global experience as an
executive of a company that,
like Kao, is a manufacturer.
During that period, I have
mainly been involved in
discussions of:
1) Ongoing consideration of
further innovations in and
execution of corporate governance; in other words,
consideration of the corporate governance system
we consider best for Kao’s sustained growth under
our present conditions;
Comment from an Independent Outside Director
Toru NagashimaIndependent Outside Director, Senior Advisor, Teijin Limited
16 Kao Corporation Annual Report 2015
Compensation System for Members of the Board of Directors, Audit & Supervisory Board Members and Executive Officers
Kao’s compensation system for members of the Board
of Directors, Audit & Supervisory Board Members and
Executive Officers is aimed at (1) securing and retaining
diverse and excellent personnel to establish and improve
competitive advantages; (2) promoting prioritized
measures for lasting increases in corporate value; and
(3) sharing interests in common with shareholders.
Remuneration of members of the Board of Directors,
other than Outside Directors, and Executive Offi cers
consists of base salary, a bonus as short-term incentive
compensation, and stock options as long-term incentive
compensation, and is designed to provide an impetus for
continuing annual improvement in business results and
medium-to-long-term growth. Linkage of remuneration to
business results increases with rank, based on the
responsibility for duties and business results of each
position. An overview of the components of remuneration
is as shown below.
(1) Base salary
Paid as fixed monthly remuneration in an amount
determined in accordance with duties as an Executive
Officer and rank.
(2) Bonus as short-term incentive compensation
When the full amount is paid, the bonus is set at 50% of
base salary for the President and Chief Executive Offi cer,
40% of base salary for the Chairman of the Board of
Directors and Executive Offi cers with titles other than the
Chief Executive Offi cer, and 30% of base salary for other
Executive Offi cers. The rate of payment of the bonus is
set within a range of 0-200%, depending on the degree
of achievement of targets for net sales and income (gross
profi t less selling, general and administrative expenses),
the degree of their improvement from the previous year,
and the degree of achievement of the target for Economic
Value Added (EVA), the Company’s main management
metric, which takes capital cost into account.
(3) Stock options as long-term incentive compensation
Set at around 30% of base salary for each position.
Kao’s true value lies in its “Yoki-Monozukuri*,”
backed by research and technological development.
Therefore, I always listen to these innovative
proposals with excitement. For Kao’s products and
brands of excellent value to be used by people
worldwide, I have been urging my fellow Directors to
tell a story – in other words, to build a business
model that not only creates excellent products
through Yoki-Monozukuri but also conveys their
excellence to the public. Last year, we started a
project to communicate Kao’s value. We considered
how to accurately convey the essential value of Kao’s
products to our partners in the retail industry and the
consumers who actually use the products. We are
now carrying out those measures. I am pleased that
my experience seems to have been useful in these
discussions. Conversely, I would also like Kao to aim
for Yoki-Monozukuri and a new business model from
the viewpoint of its markets and its customers.
Stimulating discussion at Board of Directors
meetings is a topic that is often raised. At Kao, the
President puts forth immediate and medium-to-long-
term issues and regularly directs the itinerary for
discussions are held at Board meetings throughout
the year. As a result, we Outside Officers, including
Audit & Supervisory Board Members, are always
aware of the progress and purposes of current
discussions, enabling us to participate with a grasp
of the bigger picture. With this broad perspective, I
would like to make my next proposal to Kao as it
aims to become a company with a global presence: I
suggest that the company should look beyond its
past successes in Japan to discover and cultivate
human assets who can perform on a global level for
the growth that will take Kao to the next stage.
* See note on page 12
Corporate Governance
Kao Corporation Annual Report 2015 17
Compensation for Outside Directors, who are
independent from the execution of business operations,
consists of fixed monthly remuneration only.
The compensation system and compensation
standards for members of the Board of Directors and
Executive Officers are examined by the Compensation
Advisory Committee, which is chaired by an Outside
Director, and determined by resolution of the Board of
Directors from the standpoint of ensuring the objectivity
and transparency of the determination process. The
Compensation Advisory Committee is composed of the
Chairman of the Board of Directors, all Representative
Directors, all Outside Directors and all Outside Audit &
Supervisory Board Members. Independent Directors
and Audit & Supervisory Board Members constitute a
majority of the members of the committee, which
meets at least once a year during the remuneration
adjustment period.
Compensation for Audit & Supervisory Board
Members consists of fixed monthly remuneration.
Compensation standards are determined at meetings of
the Audit & Supervisory Board.
Compensation standards for members of the Board of
Directors, Executive Officers and Audit & Supervisory
Board Members are determined after ascertaining
standards at other major manufacturers of a similar size,
industry category and business type to the Company
each year using officer compensation survey data from
an external survey organization.
The Company has no retirement bonus system for
Directors or Audit & Supervisory Board Members.
Response to the Corporate Governance CodeWith regard to Japan’s Corporate Governance Code (the
“Code”), which was established by the Tokyo Stock
Exchange in June 2015, Kao released a Report
Concerning Corporate Governance, which covers the
status of implementation of each principle of the Code,
in Japanese and English in July 2015. The stated aim of
the Code is to seek “‘growth-oriented governance’ by
promoting timely and decisive decision-making based
upon transparent and fair decision-making.” This is in
alignment with the stance on measures to improve
corporate governance that Kao has been promoting to
increase its corporate value, and it will sincerely
implement this aim, based firmly on the intent of the
principles established in the Code. To ensure a better
understanding of the status of Kao’s implementation of
the principles required to be disclosed under the Code,
Kao’s Report Concerning Corporate Governance arranges
its corporate governance measures to date and their
current status in a systematic fashion for publication,
rather than the order published in the Code. Moreover,
the Report Concerning Corporate Governance is not
complete once it has been submitted. The content is
updated as necessary, earnestly incorporating advice
and opinions received through dialogue with investors in
Japan and overseas. Since the July 2015 revision, the
report has been updated five times.
Kao will continue to further enhance corporate
governance and review it according to the business
environment with the aim of ongoing development and
maximization of corporate value from a medium-to-long-
term standpoint.
(For Reference)
The Chairman of the Board of Directors of Kao reported
on the Company’s stance on corporate governance and
its current status at the December 22, 2015 meeting of
the Council of Experts Concerning the Follow-up of
Japan’s Stewardship Code and Japan’s Corporate
Governance Code (an organizational body established by
the Tokyo Stock Exchange and the Financial Services
Agency to follow up on the status of diffusion and
establishment of Japan’s Stewardship Code and
Corporate Governance Code, and to discuss and propose
measures necessary to further enhance the corporate
governance of listed companies).
http://www.fsa.go.jp/en/refer/councils/follow-up/index.html
18 Kao Corporation Annual Report 2015
We at Governance for Owners Japan KK have
been engaging in constructive dialogue with
Kao Corporation on behalf of our global
institutional investor clients for more than
five years since 2010. Although there was a
voluntary product recall by Kanebo Cosmetics, a
subsidiary of Kao, in 2013, Kao’s clear policies
and conscientious explanations minimized its
downward impact, and as a result Kao’s
shareholder value (stock price) has more than
tripled during this period.
We would summarize our impression of
Kao’s corporate governance as the manifestation
of the “Innovation” expressed in the Kao Way.
When we began our dialogue with Kao, its
Board of Directors was made up of 13 Inside
Directors and two Independent Outside
Directors. The composition of the Board has
changed substantially, now consisting of three
Inside Directors, two Independent Outside
Directors and one Non-Independent Outside
Director, and the position of chairman is held
by an Independent Outside Director rather
than an Inside Director.* We realize that these
changes have been the result of ongoing
reexamination, as well as trial and error.
For example, we have learned about the
circumstances that led to the inclusion of
a non-independent bank executive as an
Outside Director. This was a result of Kao’s
emphasis on diversity, with Directors from
the fields of manufacturing, finance and
management consulting, all possessing the
global experience required by the Board of
Directors as their common thread. We have
also been told about the various methods
used to enhance discussions at Board of
Directors meetings, as well as the process of
trial and error used in setting the scope of
the Committee for the Examination of the
Nominees for the Members of the Board of
Directors. Hearing about these matters, we
believe that because Kao has gone through
such processes, it has developed unique,
firmly grounded corporate governance. The
results have been sustained growth and
increased corporate value, which in turn have
earned approbation from institutional
investors outside the company.
Innovation in corporate governance has no
end. For example, we have discussed the
necessity of diversity – in gender, nationality
or otherwise – among the members of the
Board of Directors, based on factors such as
the nature of Kao’s businesses and its further
expansion outside Japan. We also believe
ongoing discussion is required to select the
most appropriate form of corporate organization
for Kao. Global institutional investors, including
our company’s clients, will remain closely
attentive to Kao’s initiatives to contribute
to sustainability – including social and
environmental issues – while working for
profitable growth, as it has advocated.
We look forward to Kao’s continued use of
“Innovation” to resolve these issues.
* As of April 2016, there are four Inside Directors and all Outside Directors are independent.
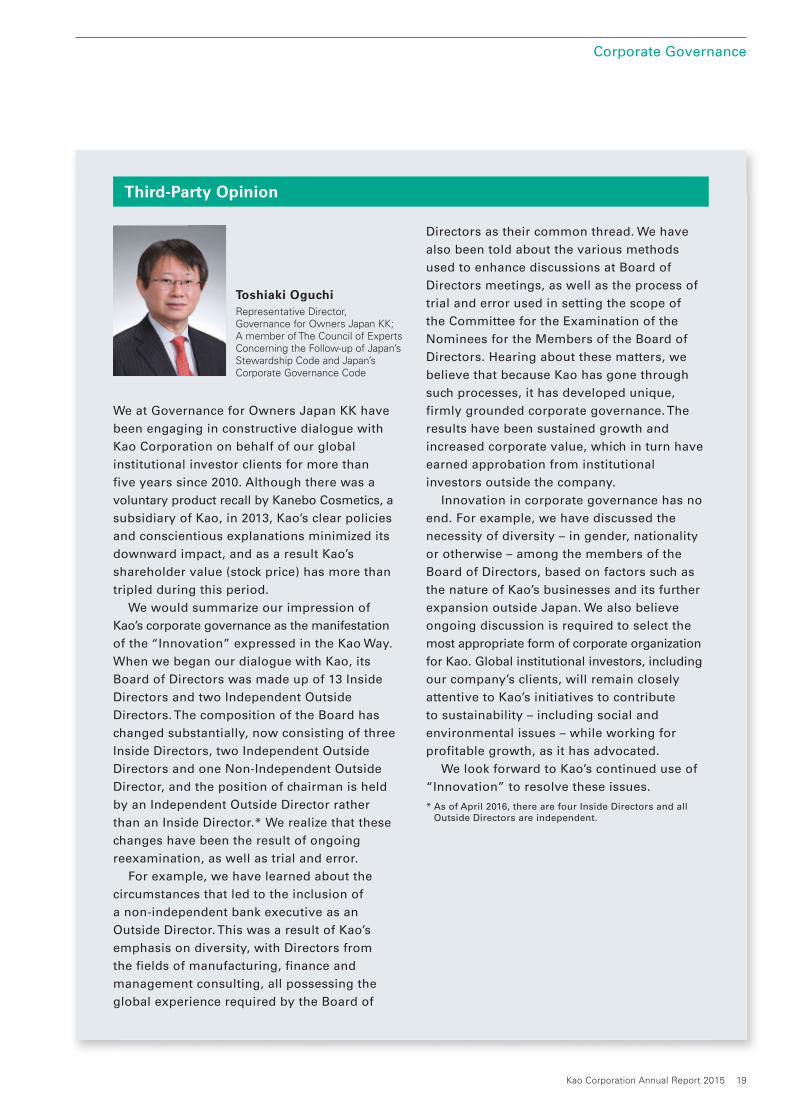
Third-Party Opinion
Toshiaki OguchiRepresentative Director, Governance for Owners Japan KK;A member of The Council of Experts Concerning the Follow-up of Japan’s Stewardship Code and Japan’s Corporate Governance Code
Corporate Governance
Kao Corporation Annual Report 2015 19
Toshiaki Takeuchi1
Representative Director
Apr. 1981 Joined the CompanyMar. 2009 Vice President, Corporate Planning, Kao Customer Marketing Co., Ltd.Mar. 2010 Member of the Board, Executive Offi cer, Kao Customer Marketing Co., Ltd.May 2011 Member of the Board, Senior Managing Executive Offi cer, Kao Customer
Marketing Co., Ltd.May 2012 Representative Director, Senior Managing Executive Offi cer, Kao
Customer Marketing Co., Ltd.Jun. 2012 Executive Offi cer Apr. 2013 Representative Director, Executive Vice President, Kao Customer
Marketing Co., Ltd. Mar. 2014 Member of the Board, Representative Director, Managing Executive
Offi cer, President, Kao Customer Marketing Co., Ltd. (current)Jan. 2016 Representative Director, Senior Managing Executive Offi cer;
Representative Director, President, Kao Group Customer Marketing Co., Ltd. (current)
Board of Directors
(As of April 1, 2016)
Board of Directors and Audit & Supervisory Board Members
Michitaka Sawada1 Representative Director
Apr. 1981 Joined the CompanyMar. 1999 Manager, Materials Development Research LaboratoriesJul. 2003 Vice President, Sanitary Products Research LaboratoriesJun. 2006 Executive Offi cer, Vice President, Global Research & DevelopmentApr. 2007 Vice President, Global Research & Development, Human Health Care Jun. 2008 Member of the Board, Executive Offi cer Jun. 2012 Representative Director, President and Chief Executive Offi cer (current)Jan. 2014 Responsible for Product Quality ManagementJan. 2016 Responsible for Corporate Strategy (current)
Katsuhiko Yoshida1
Representative Director
Apr. 1979 Joined the CompanyApr. 2007 President, Human Health Care Business UnitJun. 2007 Executive Offi cerApr. 2010 President, Fabric and Home Care Business UnitJun. 2012 Managing Executive Offi cer (current)Mar. 2014 Member of the Board, Representative Director, President, Consumer
Products; Responsible for Kao Professional Services Co., Ltd. (current)Mar. 2015 Representative Director, Senior Managing Executive Offi cer (current)
Yoshihiro Hasebe1
Director
Apr. 1990 Joined the CompanyMar. 2008 Director, Research and Development – Fabric and Home Care Research – Household Products ResearchMar. 2011 Vice President, Research and Development – Beauty Research – Hair Beauty ResearchJan. 2014 Vice President, Research and Development – Core Technology; Vice President, Research and Development – Eco-Innovation Research Mar. 2014 Executive Offi cer, Vice President, Research and Development Mar. 2015 Senior Vice President, Research and Development (current)Jan. 2016 Managing Executive Offi cer (current)Mar. 2016 Member of the Board (current)
20 Kao Corporation Annual Report 2015
Sonosuke Kadonaga2
Independent 3
President, Intrinsics,Dean, Department of Management, Kenichi Ohmae Graduate School of Business, Business Breakthrough University
Apr. 1976 Joined Chiyoda CorporationJun. 1981 Master of Science in Chemical Engineering, Massachusetts Institute of
Technology, School of Engineering, U.S.A. Aug. 1986 Joined McKinsey & Company, Inc., JapanJul. 2009 President, Intrinsics (current)Jun. 2012 Member of the Board, Kao Corporation (current)Mar. 2014 Chairman of the Board of Directors (current)
Notes: 1. Holds the post of Executive Offi cer concurrently 2. Outside Director 3. Reported to Tokyo Stock Exchange, Inc. as Independent Director
as set forth in the Regulations of Tokyo Stock Exchange, Inc.
Toru Nagashima2
Independent 3
Senior Advisor, Teijin Limited
Apr. 1965 Joined Teijin LimitedJul. 1974 Courses taken in the MBA Program, University of Utah, U.S.A. Oct. 1975 Seconded to Polynova S.A., MexicoJun. 2000 Member of the Board, and CESHO (Chief Environment, Safety & Health
Offi cer), Teijin LimitedApr. 2001 Member of the Board, CMO (Chief Marketing Offi cer) and General
Manager of Corporate Strategy & Planning Offi ce, Teijin LimitedJun. 2001 Managing Director, CMO (Chief Marketing Offi cer) and General Manager
of Corporate Strategy & Planning Offi ce, Teijin LimitedNov. 2001 President & Representative Director, COO, Teijin LimitedJun. 2002 President & Representative Director, CEO, Teijin LimitedJun. 2008 Chairman of the Board, Teijin LimitedMar. 2013 Member of the Board, Kao Corporation (current)Apr. 2013 Senior Advisor, Member of the Board, Teijin LimitedJun. 2013 Senior Advisor, Teijin Limited (current)
Masayuki Oku2
Independent 3
Chairman of the Board, Sumitomo Mitsui Financial Group, Inc.
Apr. 1968 Joined Sumitomo BankMay 1975 LL.M., University of Michigan Law School, U.S.A.Jan. 1991 Branch Manager, Chicago Branch, Sumitomo BankJun. 1994 Director, Sumitomo BankNov. 1998 Managing Director, Sumitomo BankJun. 1999 Managing Director and Managing Executive Offi cer, Sumitomo BankJan. 2001 Senior Managing Director and Senior Managing Executive Offi cer,
Sumitomo BankApr. 2001 Senior Managing Director and Senior Managing Executive Offi cer,
Sumitomo Mitsui Banking CorporationDec. 2002 Senior Managing Director, Sumitomo Mitsui Financial Group, Inc.Jun. 2003 Deputy President and Executive Offi cer,
Sumitomo Mitsui Banking CorporationJun. 2005 Chairman of the Board, Sumitomo Mitsui Financial Group, Inc. (current),
and President and Chief Executive Offi cer, Sumitomo Mitsui Banking Corporation
Mar. 2014 Member of the Board, Kao Corporation (current)
Kao Corporation Annual Report 2015 21
Audit & Supervisory Board Members
Shoji KobayashiFull-time Audit & Supervisory Board Member
Apr. 1979 Joined the CompanyJun. 2006 Executive Offi cer Apr. 2007 Vice President, Chemical Business UnitJun. 2010 President, Chemical Business UnitMar. 2013 Full-time Audit & Supervisory Board Member (current)
Toshiharu Numata Full-time Audit & Supervisory Board Member
Apr. 1989 Joined the CompanyJun. 2005 Executive Offi cerJun. 2006 Member of the Board, Executive Offi cer; and Senior Vice President,
Research and DevelopmentJun. 2008 Member of the Board, Executive Vice President; Senior Vice President,
Research and Development; and Responsible for Chemical Business, Product Quality Management; and TCR Promotion
May 2012 Member of the Board, Managing Executive Offi cer; Senior Vice President, Research and Development; and Responsible for Chemical Business Unit, Product Quality Management; TCR Promotion; and China Business
Jun. 2012 Senior Managing Executive Offi cer; President, Consumer Products and Chemical Business, China; Chairman of the Board and Chief Executive Offi cer, Kao (China) Holding Co., Ltd.; Chairman of the Board, Kao Commercial (Shanghai) Co., Ltd.; and Chairman of the Board, Kanebo Cosmetics (China) Co., Ltd.
Mar. 2015 Full-time Audit & Supervisory Board Member (current)
Yumiko Waseda1
Independent 2
Audit & Supervisory Board Member,Attorney-at-Law
Apr. 1985 Registered as an attorney-at-law; Joined Masayuki Matsuda Law & Patent Offi ces (now Mori Hamada & Matsumoto, a law fi rm)
Apr. 2013 Joined Tokyo Roppongi Law & Patent Offi cesJan. 2014 Partner, Tokyo Roppongi Law & Patent Offi ces (current)Mar. 2014 Audit & Supervisory Board Member, Kao Corporation (current)
Norio Igarashi1
Independent 2
Audit & Supervisory Board Member,Certifi ed Public Accountant, Professor, Yokohama National University
Apr. 1977 Registered as Certifi ed Public Accountant Jul. 1988 Partner, Aoyama Audit Corporation and Price WaterhouseApr. 2007 Professor, Graduate School of International Social Sciences, Yokohama
National University (current)Mar. 2013 Audit & Supervisory Board Member, Kao Corporation (current)
22 Kao Corporation Annual Report 2015
Notes: 1. Outside Audit & Supervisory Board Member 2. Reported to Tokyo Stock Exchange, Inc. as Independent Audit &
Supervisory Board Member as set forth in the Regulations of Tokyo Stock Exchange, Inc.
Board of Directors and Audit & Supervisory Board Members
Toraki Inoue1
Independent 2
Audit & Supervisory Board Member, Certifi ed Public Accountant, Representative Director, President, Accounting Advisory Co., Ltd.
Oct. 1980 Entered Arthur AndersenDec. 1985 Registered as Certifi ed Public AccountantJun. 1987 Resided in New York Offi ce of Arthur AndersenOct. 1995 National Partner of Arthur AndersenOct. 1997 Worldwide Partner of Arthur AndersenJul. 1999 Representative Partner, Asahi & Co.Jul. 2008 Toraki Inoue Certifi ed Public Accountant Offi ce (current)Jun. 2010 Representative Director, President, Accounting Advisory Co., Ltd. (current)Mar. 2016 Audit & Supervisory Board Member, Kao Corporation (current)
Kao Corporation Annual Report 2015 23
Executive Officers
Michitaka Sawada President and Chief Executive Offi cer
Responsible for Corporate Strategy
Katsuhiko Yoshida Senior Managing Executive Offi cer
President, Consumer ProductsResponsible for Kao Professional Services Co., Ltd.
Toshiaki TakeuchiSenior Managing Executive Offi cer
Representative Director, President, Kao Group Customer Marketing Co., Ltd.Representative Director, President, Kao Customer Marketing Co., Ltd.
Masumi NatsusakaManaging Executive Offi cer
Responsible for Beauty Care BusinessPresident, Beauty Care – Cosmetics Business UnitRepresentative Director, President, Kanebo Cosmetics Inc.
Motohiro Morimura Managing Executive Offi cer
Senior Vice President, Supply Chain ManagementResponsible for TCR Promotion
Yasushi Aoki Managing Executive Offi cer
Senior Vice President, Human Capital DevelopmentRepresentative Director, Chairman of the Board, Kanebo Cosmetics Inc. Senior Executive Offi cer, Senior Vice President, Human Resources and Administration, Kanebo Cosmetics Inc.President, Kao Group Corporate Pension Fund
Hideko Aoki Managing Executive Offi cer
Senior Vice President, Product Quality Management
Kozo Saito Managing Executive Offi cer
President, Consumer Products – International Business ManagementChairman of the Board, Kao USA Inc.
Yoshihiro Hasebe Managing Executive Offi cer
Senior Vice President, Research and Development
Yoshimichi Saita Senior Vice President, Media Planning and Management
Vice President, Media Planning and Management – Product Public Relations
Kenji MiyawakiSenior Vice President, Marketing Research and Development
Kazuyoshi Aoki Senior Vice President, Accounting and Finance
Tadaaki Sugiyama Senior Vice President, Legal and Compliance
Masakazu Negoro President, Chemical Business UnitChairman of the Board, Fatty Chemical (Malaysia) Sdn. Bhd.Chairman of the Board, Pilipinas Kao, Inc.Presidente, Kao Chemicals Europe, S.L.
Hideki Tanaka Senior Vice President, Procurement
Takehiko ShintoRepresentative Director, Executive Vice President, Kao Group Customer Marketing Co., Ltd.Representative Director, President, Kanebo Cosmetics Sales Inc.
Jun Shida Vice President, Research and Development – Development Research – Health Care and Household
Yasushi Wada Vice President, Supply Chain Management – Demand and Supply Planning Center
Tomoharu Matsuda President, Beauty Care – Skin Care and Hair Care Business Unit
Masayuki AbeSenior Vice President, Enterprise Information Solutions
Naoki Komoda President, Fabric and Home Care Business Unit
Hitoshi Hosokawa Vice President, Research and Development – Development Research – Skin Care, Hair Care and Cosmetics
Hiroyuki YamashitaVice President, Supply Chain Management – Technology Development CenterVice President, Supply Chain Management – Demand and Supply Planning Center – Human Health Care
Minoru Nakanishi Regional Executive Offi cer, President, Consumer Products, Greater ChinaChairman of the Board and President, Kao (China) Holding Co., Ltd.Chairman of the Board, Kao Commercial (Shanghai) Co., Ltd.Chairman of the Board, Kanebo Cosmetics (China) Co., Ltd.
Akemi Ishiwata Senior Vice President, Corporate Communications
Satoru Tanaka President, Human Health Care Business Unit
Shigeru Ueyama Senior Vice President, Corporate Strategy
Executive Fellows
Yoshinori Takema Corporate Executive Fellow
Takuji Yasukawa Corporate Executive Fellow
Minoru Utsumi Corporate Executive Fellow
Yuji Furui Corporate Executive FellowDoctor of Medical Science
Chiaki Mukai Corporate Executive FellowAstronaut; Doctor of Medical Science
Executive Officers and Executive Fellows(As of April 1, 2016)
24 Kao Corporation Annual Report 2015
In addition, Kao specifies major Company-wide risks as
“corporate risks” and appoints a person to appropriately
manage each risk.
When a crisis occurs, Kao responds promptly to
minimize injury and damage by establishing an
organization for countermeasures centered on this
person in charge of corporate risks, and on departments
concerned with risk or subsidiaries and affiliates for
other risks. In addition, depending on the magnitude
of the impact on the Kao Group as a whole, Kao also
establishes a countermeasures headquarters with the
President and Chief Executive Officer or other person
as its general manager.
Management of the abovementioned risks and crises is
reported to and discussed at the Meeting of the Board of
Directors or the Management Committee on a regular
basis as well as in a timely fashion whenever necessary.
Basic Policy and Organization
Kao regards the potential negative impact on its
management targets and business activities as a “risk”
and the manifestation of such risk as a “crisis,” and has
established an organization for appropriate risk and crisis
management.
Based on the Risk and Crisis Management Policy, the
Risk and Crisis Management Committee, chaired by the
member of the Board of Directors or Executive Officer in
charge of risk and crisis management, ascertains the
progress of cross-divisional Company-wide risk
management and establishes a system and operating
plans for risk and crisis management activities.
Based on this policy and plan, departments concerned
with risk or subsidiaries and affiliates appropriately manage
risk by ascertaining and assessing risks, formulating and
implementing necessary countermeasures.
Risk and Crisis Management
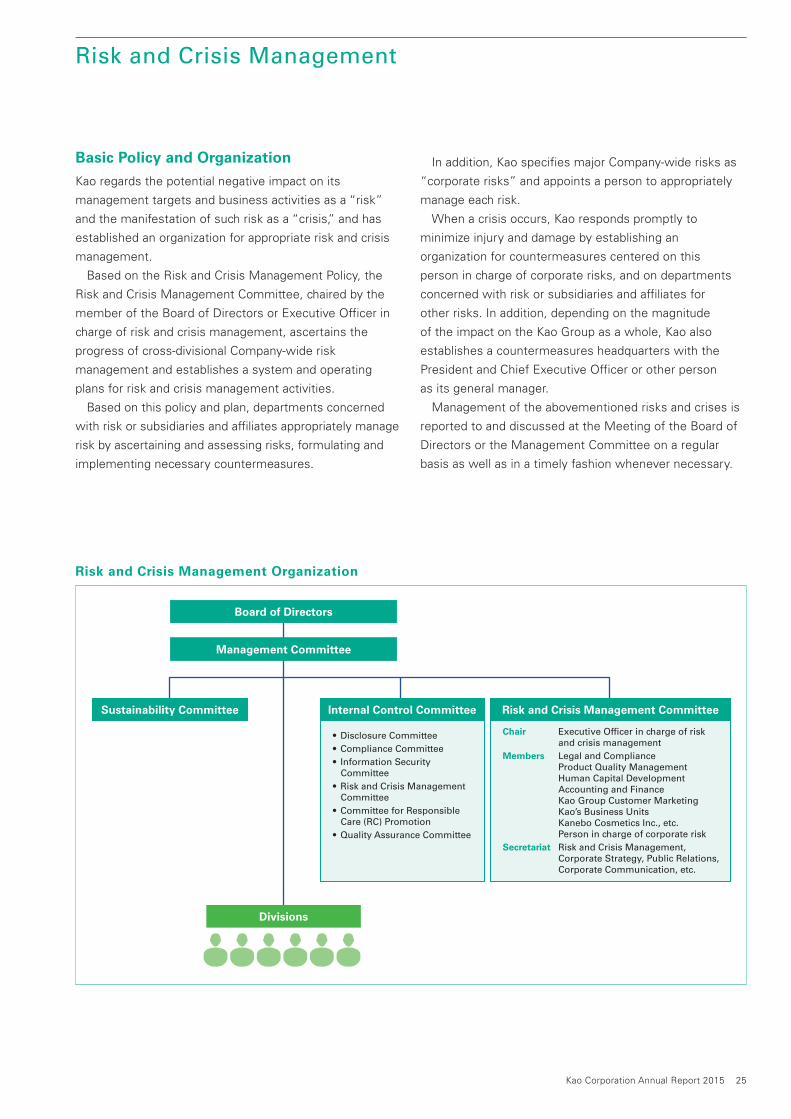
Board of Directors
Management Committee
Sustainability Committee
Divisions
Risk and Crisis Management Committee
Chair Executive Officer in charge of risk and crisis management
Members Legal and Compliance Product Quality Management Human Capital Development Accounting and Finance Kao Group Customer Marketing Kao’s Business Units Kanebo Cosmetics Inc., etc. Person in charge of corporate risk
Secretariat Risk and Crisis Management, Corporate Strategy, Public Relations, Corporate Communication, etc.
Internal Control Committee
• Disclosure Committee
• Compliance Committee
• Information Security Committee
• Risk and Crisis Management Committee
• Committee for Responsible Care (RC) Promotion
• Quality Assurance Committee
Risk and Crisis Management Organization
Kao Corporation Annual Report 2015 25
2. Identifying Risks That Could Seriously Affect Achievement of Management Targets and Business Activities, and Strengthening Countermeasures
For operational risks, Kao conducts risk surveys at key
divisions and subsidiaries in Japan as well as at Kao Group
companies outside Japan to identify events that could
seriously affect Kao Group business activities, factors in their
occurrence, current countermeasures and issues.
Risk surveys at Kao Group companies outside Japan in
2015 ascertained the establishment of organizations to deal
with emergency situations, the creation of action plans and
the implementation status of education and training in order to
confirm that such companies are going through the PDCA
cycle in dealing with emergency situations that affect lives and
business continuity. As a result, we were able to understand
the differences in the response levels of Kao Group companies
outside Japan with regard to their establishment of
organizations to deal with social disorder caused by factors
such as terrorist attacks, which have occurred in many
countries in recent years, and pandemics of new types of
influenza or other diseases.
In 2016, we will work to enhance the level of response of
the entire Kao Group to emergency situations related to social
disorder or pandemics by revising global guidelines and
strengthening response organizations at Kao Group companies
outside Japan.
3. Strengthening the Business Continuity Plan (BCP)*
We have been working to strengthen our supply chain to
ensure delivery of products to customers by revising our
raw materials procurement, production and logistics
systems assuming a large-scale earthquake that may strike
in the future.
In 2015, we considered alternate locations for continuing
the functions of headquarters, assuming a situation in which
we were unable to secure key personnel or use main
locations due to an earthquake with an epicenter in the
Tokyo metropolitan area. In addition, we identified issues
such as a response organization and standards for business
continuity assuming a pandemic of a new type of influenza
or other disease, and made revisions.
In 2016, we will deal with these issues in greater depth
to strengthen the BCP.
* A plan for continuing key corporate activities through procedures to decide in advance which operations and functions should be continued, and which methods should be applied to continue activities, assuming various situations that cause the interruption and/or shutdown of business activities due to various events and the factors in their occurrence
Priority Themes1. Building a New Risk and Crisis Management
Organization
The globalization of our business increases the uncertainty
and complexity of the management environment, as well as
the scale and speed of the impact on business activities
when a risk becomes manifest. In light of this situation, Kao
worked as follows in 2015 to build a new risk and crisis
management organization.
(1) Expanding the Scope for Strengthening Risk ManagementThe scope for strengthening risk management was
expanded to include not only the former operational risks
such as accidents and disasters, product problems and
issues with compliance, but also strategy risks that would
hinder the achievement of short-term and mid-term plans
as well as risks involving trust in the Company, which are
closely related to these risks.
(2) Clarifying Major Risks to Be Handled by Management and Building an Organization for ResponseKao has specified major Company-wide risks as “corporate
risks,” appointed an Executive Officer in charge of
managing such risks, and built a new organization to
promote risk management.
Corporate risks include not only risks that have an
impact on business continuity, such as an earthquake with
an epicenter in the Tokyo metropolitan area, for which Kao
has been enhancing countermeasures, but also other risks
such as those related to management strategy.
(3) Strengthening the Organization and Initial Response When a Crisis OccursPreviously, dealing with risks has mainly been consideration
of risk reduction activities to prevent the manifestation
of risks and activities to minimize their impact. For major
risks, in addition to these risk reduction activities, we
have decided to strengthen the organization and our initial
response when a crisis occurs, assuming the manifestation
of such risks.
In 2016, we will further strengthen our risk reduction
activities and implement speedy and appropriate
responses under our new risk and crisis management
organization when a crisis occurs.
Risk and Crisis Management
26 Kao Corporation Annual Report 2015
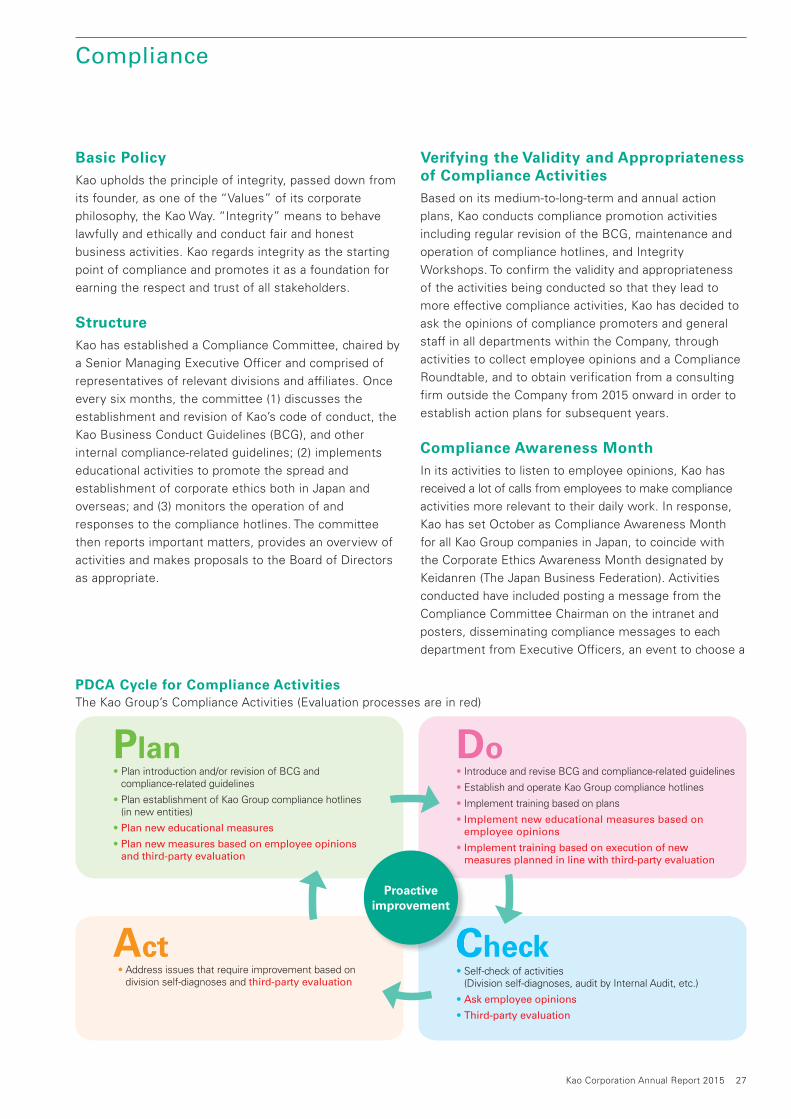
Verifying the Validity and Appropriateness of Compliance Activities Based on its medium-to-long-term and annual action
plans, Kao conducts compliance promotion activities
including regular revision of the BCG, maintenance and
operation of compliance hotlines, and Integrity
Workshops. To confirm the validity and appropriateness
of the activities being conducted so that they lead to
more effective compliance activities, Kao has decided to
ask the opinions of compliance promoters and general
staff in all departments within the Company, through
activities to collect employee opinions and a Compliance
Roundtable, and to obtain verification from a consulting
firm outside the Company from 2015 onward in order to
establish action plans for subsequent years.
Compliance Awareness MonthIn its activities to listen to employee opinions, Kao has
received a lot of calls from employees to make compliance
activities more relevant to their daily work. In response,
Kao has set October as Compliance Awareness Month
for all Kao Group companies in Japan, to coincide with
the Corporate Ethics Awareness Month designated by
Keidanren (The Japan Business Federation). Activities
conducted have included posting a message from the
Compliance Committee Chairman on the intranet and
posters, disseminating compliance messages to each
department from Executive Officers, an event to choose a
Basic PolicyKao upholds the principle of integrity, passed down from
its founder, as one of the “Values” of its corporate
philosophy, the Kao Way. “Integrity” means to behave
lawfully and ethically and conduct fair and honest
business activities. Kao regards integrity as the starting
point of compliance and promotes it as a foundation for
earning the respect and trust of all stakeholders.
StructureKao has established a Compliance Committee, chaired by
a Senior Managing Executive Officer and comprised of
representatives of relevant divisions and affiliates. Once
every six months, the committee (1) discusses the
establishment and revision of Kao’s code of conduct, the
Kao Business Conduct Guidelines (BCG), and other
internal compliance-related guidelines; (2) implements
educational activities to promote the spread and
establishment of corporate ethics both in Japan and
overseas; and (3) monitors the operation of and
responses to the compliance hotlines. The committee
then reports important matters, provides an overview of
activities and makes proposals to the Board of Directors
as appropriate.
Plan Do
Act Check
• Plan introduction and/or revision of BCG and compliance-related guidelines
• Plan establishment of Kao Group compliance hotlines (in new entities)
• Plan new educational measures
• Plan new measures based on employee opinions and third-party evaluation
• Address issues that require improvement based on division self-diagnoses and third-party evaluation
• Introduce and revise BCG and compliance-related guidelines
• Establish and operate Kao Group compliance hotlines
• Implement training based on plans
• Implement new educational measures based onemployee opinions
• Implement training based on execution of new measures planned in line with third-party evaluation
• Self-check of activities(Division self-diagnoses, audit by Internal Audit, etc.)
• Ask employee opinions
• Third-party evaluation
Im
Proactiveimprovement
PDCA Cycle for Compliance ActivitiesThe Kao Group’s Compliance Activities (Evaluation processes are in red)
Compliance
Kao Corporation Annual Report 2015 27
selected at the end of 2014, bringing the cumulative
participation rate to 85% (9,360 of 11,000 employees).
Integrity Workshops will continue to be conducted in
2016, mainly in areas where they have not yet been held.
Establishing and Operating Compliance Hotlines In accordance with the needs of each country or region,
the Kao Group either sets up both internal and external
hotlines or operates only an external hotline. After
properly confirming the caller’s needs, the company will
investigate the matter while taking steps to protect the
caller’s privacy to the fullest extent possible. The company
will obtain consent from the caller when third-party
confirmation is necessary. The company will also ensure
that the caller suffers no disadvantage as a result of a
report or consultation made in good faith. In 2015, there
were 196 calls to the hotlines in the Kao Group, including
companies outside Japan, none of which concerned
serious matters. About 70% of the calls were consultations
about workplace communication.
Selected as One of the World’s Most Ethical Companies for Ten Consecutive YearsKao has been selected as one of the 2016 World’s Most
Ethical Companies, as announced by the U.S. think tank
Ethisphere Institute in March 2016. The company has been
on this list since the inception of the list in 2007. Among
both Japanese companies and global manufacturers of
daily consumer goods and chemicals, Kao is the only
company to be chosen for ten consecutive years. This
year, 131 companies worldwide were selected. This
recognition reflects that the spirit of integrity passed
down from Kao’s founding continues to be implemented
by all Kao Group members through practice of the Kao
Way and the BCG.
compliance logo through intranet voting, sharing case
studies, and a test to review the BCG. Employees
expressed opinions that the vote on the logo enhanced a
feeling of unity among the Group companies, and that the
month offered a novel opportunity to reflect on
compliance once each year. In 2016, Compliance
Awareness Month will be held throughout the entire Kao
Group, including Group companies outside Japan.
Implementing Guidelines for ComplianceIn the BCG, Kao has made clear its strong stance against
bribery by specifying that bribes shall not be given to or
received from any party, regardless of affiliation.
Furthermore, the BCG prohibits “facilitation payments,”
which are small payments to government officials.
In addition, the Kao Group has introduced the Kao Anti-
Bribery Guidelines, which include detailed anti-bribery
rules applicable Group-wide as well as operating
procedures for entertainment, giving and receiving gifts,
and other matters geared to the business, country or
region. The Kao Group has also introduced the Kao
Guidelines for Avoiding Conflicts of Interest, which set
forth requirements for approval and notification to deal
with specific circumstances where a conflict of interest
may arise such as competitive activities, transactions,
monetary loans and personal investments by executives
and employees.
In 2015, the Kao Business Conduct Guidelines
Casebook, a collection of case studies in a question-and-
answer format that was previously issued in Japanese
and English, was made available in local versions in 17
languages and distributed to employees in each country
or region. Moreover, the BCG was revised in April 2016
with updated content to incorporate the Kao Group’s
measures since 2013 and its approach to its operating
environment.
Accelerating the Spread of Integrity WorkshopsTo deepen understanding of the BCG and other
compliance-related rules, group training is conducted for
new employees, newly appointed managers, executives
in Japan and employees of Group companies outside
Japan. A BCG refresher test is also conducted every year
so that employees review its content (participation rate:
95.2% (33,508 of 35,175 employees)). Moreover,
Integrity Workshops for BCG training have been held
since 2008. In 2015, workshops were held at Group
companies in Europe, mainly conducted by 16 instructors
Compliance
28 Kao Corporation Annual Report 2015
World’s Most Ethical Companies presentation
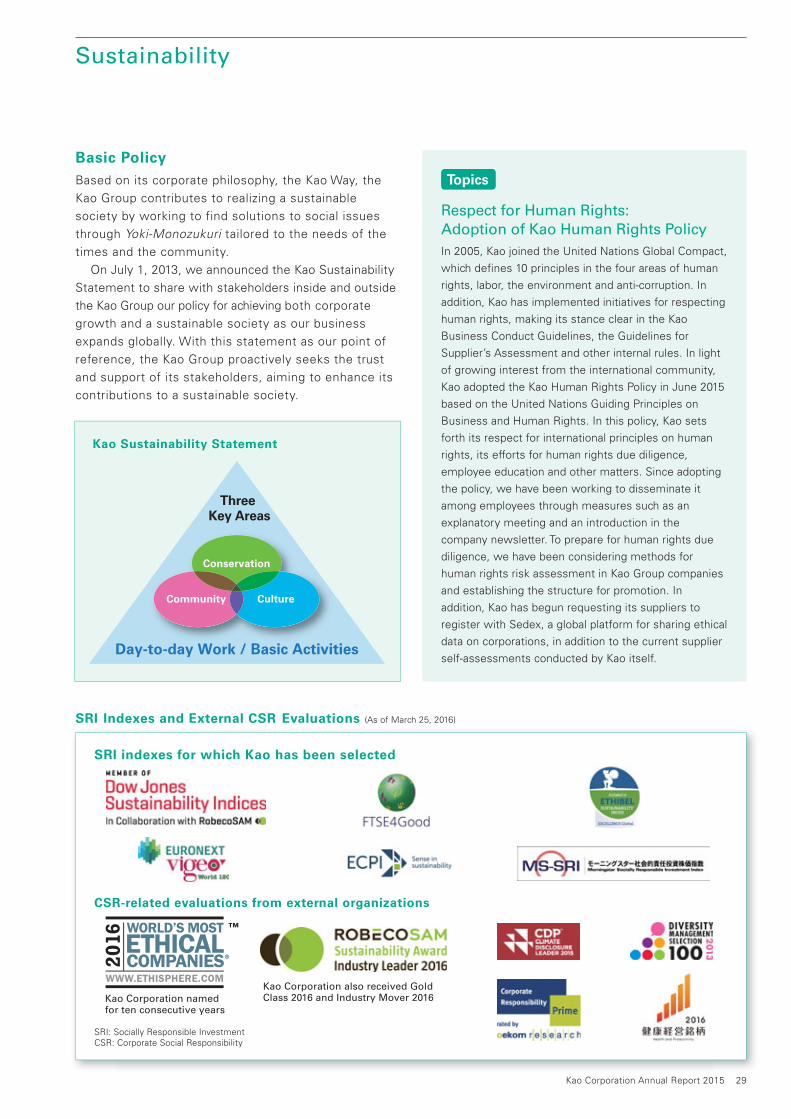
Basic PolicyBased on its corporate philosophy, the Kao Way, the
Kao Group contributes to realizing a sustainable
society by working to find solutions to social issues
through Yoki-Monozukuri tailored to the needs of the
times and the community.
On July 1, 2013, we announced the Kao Sustainability
Statement to share with stakeholders inside and outside
the Kao Group our policy for achieving both corporate
growth and a sustainable society as our business
expands globally. With this statement as our point of
reference, the Kao Group proactively seeks the trust
and support of its stakeholders, aiming to enhance its
contributions to a sustainable society.
Respect for Human Rights: Adoption of Kao Human Rights Policy
In 2005, Kao joined the United Nations Global Compact,
which defi nes 10 principles in the four areas of human
rights, labor, the environment and anti-corruption. In
addition, Kao has implemented initiatives for respecting
human rights, making its stance clear in the Kao
Business Conduct Guidelines, the Guidelines for
Supplier’s Assessment and other internal rules. In light
of growing interest from the international community,
Kao adopted the Kao Human Rights Policy in June 2015
based on the United Nations Guiding Principles on
Business and Human Rights. In this policy, Kao sets
forth its respect for international principles on human
rights, its efforts for human rights due diligence,
employee education and other matters. Since adopting
the policy, we have been working to disseminate it
among employees through measures such as an
explanatory meeting and an introduction in the
company newsletter. To prepare for human rights due
diligence, we have been considering methods for
human rights risk assessment in Kao Group companies
and establishing the structure for promotion. In
addition, Kao has begun requesting its suppliers to
register with Sedex, a global platform for sharing ethical
data on corporations, in addition to the current supplier
self-assessments conducted by Kao itself.
Kao Sustainability Statement
Day-to-day Work / Basic Activities
Community Culture
Conservation
Three Key Areas
Sustainability
SRI Indexes and External CSR Evaluations (As of March 25, 2016)
SRI indexes for which Kao has been selected
CSR-related evaluations from external organizations
Kao Corporation also received Gold Class 2016 and Industry Mover 2016Kao Corporation named
for ten consecutive years
Topics
Kao Corporation Annual Report 2015 29
SRI: Socially Responsible InvestmentCSR: Corporate Social Responsibility
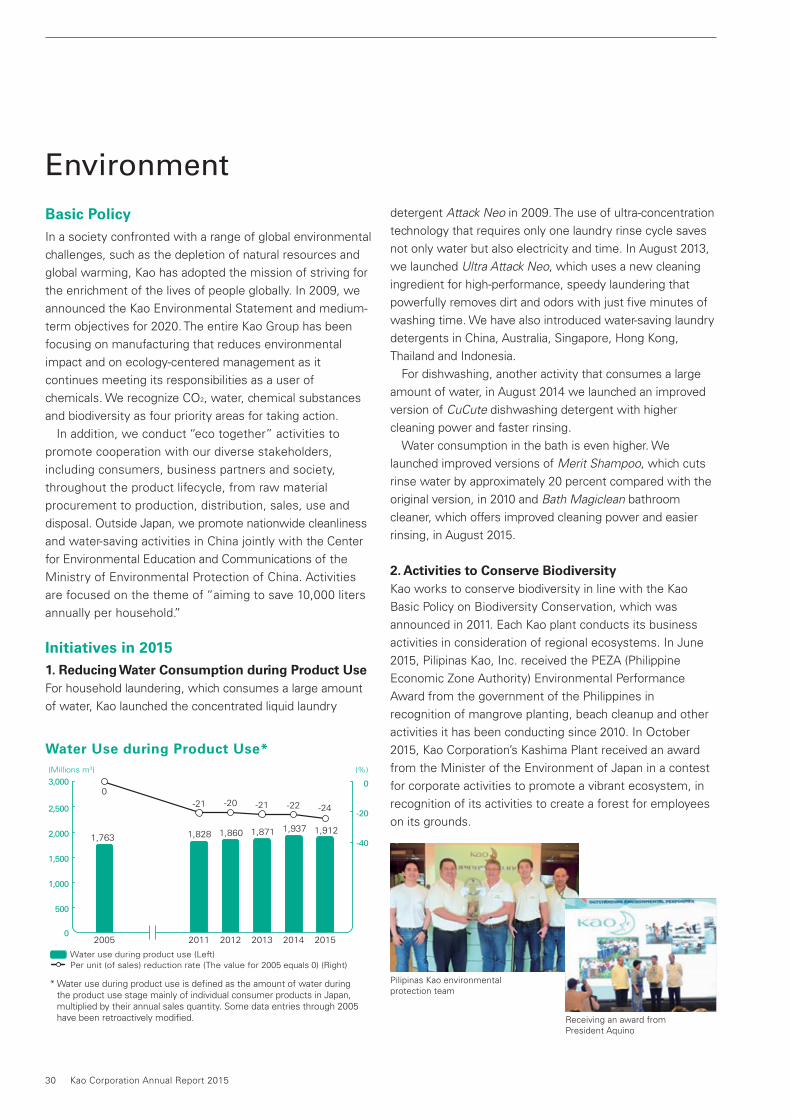
detergent Attack Neo in 2009. The use of ultra-concentration
technology that requires only one laundry rinse cycle saves
not only water but also electricity and time. In August 2013,
we launched Ultra Attack Neo, which uses a new cleaning
ingredient for high-performance, speedy laundering that
powerfully removes dirt and odors with just five minutes of
washing time. We have also introduced water-saving laundry
detergents in China, Australia, Singapore, Hong Kong,
Thailand and Indonesia.
For dishwashing, another activity that consumes a large
amount of water, in August 2014 we launched an improved
version of CuCute dishwashing detergent with higher
cleaning power and faster rinsing.
Water consumption in the bath is even higher. We
launched improved versions of Merit Shampoo, which cuts
rinse water by approximately 20 percent compared with the
original version, in 2010 and Bath Magiclean bathroom
cleaner, which offers improved cleaning power and easier
rinsing, in August 2015.
2. Activities to Conserve BiodiversityKao works to conserve biodiversity in line with the Kao
Basic Policy on Biodiversity Conservation, which was
announced in 2011. Each Kao plant conducts its business
activities in consideration of regional ecosystems. In June
2015, Pilipinas Kao, Inc. received the PEZA (Philippine
Economic Zone Authority) Environmental Performance
Award from the government of the Philippines in
recognition of mangrove planting, beach cleanup and other
activities it has been conducting since 2010. In October
2015, Kao Corporation’s Kashima Plant received an award
from the Minister of the Environment of Japan in a contest
for corporate activities to promote a vibrant ecosystem, in
recognition of its activities to create a forest for employees
on its grounds.
Basic PolicyIn a society confronted with a range of global environmental
challenges, such as the depletion of natural resources and
global warming, Kao has adopted the mission of striving for
the enrichment of the lives of people globally. In 2009, we
announced the Kao Environmental Statement and medium-
term objectives for 2020. The entire Kao Group has been
focusing on manufacturing that reduces environmental
impact and on ecology-centered management as it
continues meeting its responsibilities as a user of
chemicals. We recognize CO2, water, chemical substances
and biodiversity as four priority areas for taking action.
In addition, we conduct “eco together” activities to
promote cooperation with our diverse stakeholders,
including consumers, business partners and society,
throughout the product lifecycle, from raw material
procurement to production, distribution, sales, use and
disposal. Outside Japan, we promote nationwide cleanliness
and water-saving activities in China jointly with the Center
for Environmental Education and Communications of the
Ministry of Environmental Protection of China. Activities
are focused on the theme of “aiming to save 10,000 liters
annually per household.”
Initiatives in 20151. Reducing Water Consumption during Product Use For household laundering, which consumes a large amount
of water, Kao launched the concentrated liquid laundry
Environment
201520142013201220112005
(Millions m3) (%)
0
500
1,000
1,500
2,000
2,500
3,000
-40
-20
0
1,828 1,860 1,871 1,937 1,9121,763
0
Water use during product use (Left)Per unit (of sales) reduction rate (The value for 2005 equals 0) (Right)
-21 -20 -21 -22 -24
* Water use during product use is defined as the amount of water during the product use stage mainly of individual consumer products in Japan, multiplied by their annual sales quantity. Some data entries through 2005 have been retroactively modified.
Water Use during Product Use*
30 Kao Corporation Annual Report 2015
Pilipinas Kao environmental protection team
Receiving an award from President Aquino
will promote measures such as confirmation of supply chain
risks using Sedex.3
Specific activities are as follows.
1. Procurement of Sustainable Raw MaterialsUnder its procurement guidelines, Kao has declared a goal
of switching to procurement of sustainable raw materials for
palm oil, paper and pulp by 2020 as an initiative toward zero
deforestation. Kao has joined the Roundtable on Sustainable
Palm Oil and received supply chain certification at its related
plants for procurement of certified palm oil and palm kernel
oil. By 2020, Kao aims to purchase only sustainable palm oil
and palm kernel oil that is traceable to the plantation. As of
the end of 2015, Kao has confirmed traceability to the mill,
and efforts for confirmation to the plantation are continuing.
As for procurement of paper and pulp, by 2020 Kao aims to
purchase only recycled paper or sustainably sourced paper
and pulp for use in its consumer products, packaging and
office paper, and has achieved a progress rate of 96%
toward that goal as of the end of 2015. In particular, by 2020
Kao aims to purchase only pulp for raw materials that is
traceable to the source.
2. Sustainable Sourcing of Plant ResourcesIn recognition of the problems of the scarcity of plant
resources and plunder of resources, Kao purchases plant
resources in consideration of ABS4 and continues initiatives
to diversify sourcing routes and to convert from natural to
cultivated plants, considering the natural environment and
local communities at their source
3. Initiatives to Reduce Dependence on Petrochemical Resources in Packaging
Kao continues efforts to reduce total volume of plastics
used through minimization of container size and
development of refill containers, while promoting use of
biomass materials such as plant-based polyethylene in
containers and packaging.
Notes: 1. CDP (Carbon Disclosure Project) refers to cooperation between institutional investors and major corporations in natural capital initiatives and promotion of disclosure of greenhouse gas emissions, and water and forest conservation activities.
2. The CDP Supply Chain Project refers to cooperation between the CDP and corporations, with corporations requesting their suppliers to disclose information regarding natural capital initiatives; this project affects the entire supply chain.
3. Sedex (Supplier Ethical Data Exchange) is a large-scale, global platform for the sharing of information relating to labor standards, health and safety, environmental protection and business practices, aimed at promoting the adoption and maintenance of ethical business practices in global supply chains.
4. ABS (Access and Benefit Sharing) refers to access to genetic resources and the fair and equitable sharing of benefits arising from their utilization, as defined by the Convention on Biological Diversity.
Basic Policy Kao is further enhancing its competitiveness in global
markets with the aim of becoming a company with a
global presence. We conduct procurement of raw
materials that is not only fair and impartial, based on legal
compliance and the highest ethics, but that also contributes
to corporate growth, with attention to product quality
and stable procurement. With the aim of contributing to
the sustainability of the world, which we have adopted as
part of the mission of the Kao Way, we give full consideration
to preservation of natural resources, conservation, safety
and human rights as we strive to fulfill our corporate
social responsibilities.
InitiativesSustainable Procurement of Raw Materials In recognition of the risks to sustainable development from
scarcity of resources, degradation of biodiversity, climate
change and other environmental problems, as well as
human rights issues such as forced labor, Kao strives for
sustainable procurement of raw materials. These initiatives
require comprehensive engagement of the supply chain. In
particular, we work toward climate change mitigation and
conservation of water resources by participating in the CDP1
Supply Chain Project2 and requiring major suppliers to
disclose and reduce greenhouse gas emissions and use
water resources appropriately. We also conduct activities to
conserve forest resources.
In addition, in cooperation with our suppliers, we are
streamlining distribution and reducing the environmental
impact of procured products. In particular, based on its
awareness of the dependence of its businesses on natural
capital, Kao is committed to zero deforestation at the source
in its procurement of raw materials including palm oil and
paper. Over the medium-to-long term, Kao strives to reduce
its use of natural capital by reducing the amount of raw
materials used in its business and shifting to alternative raw
materials such as algae or other non-edible biomass
sources. Moreover, in consideration of human rights and
ethical issues that have emerged due to globalization, Kao
Supply Chain
Traceability of Paper and Pulp
2013* 2014 2015
Amount purchased (tons) 100 127 147
Traceability rate 3% 78% 96%
* The value for amount purchased in 2013 equals 100.
Sustainability
Kao Corporation Annual Report 2015 31
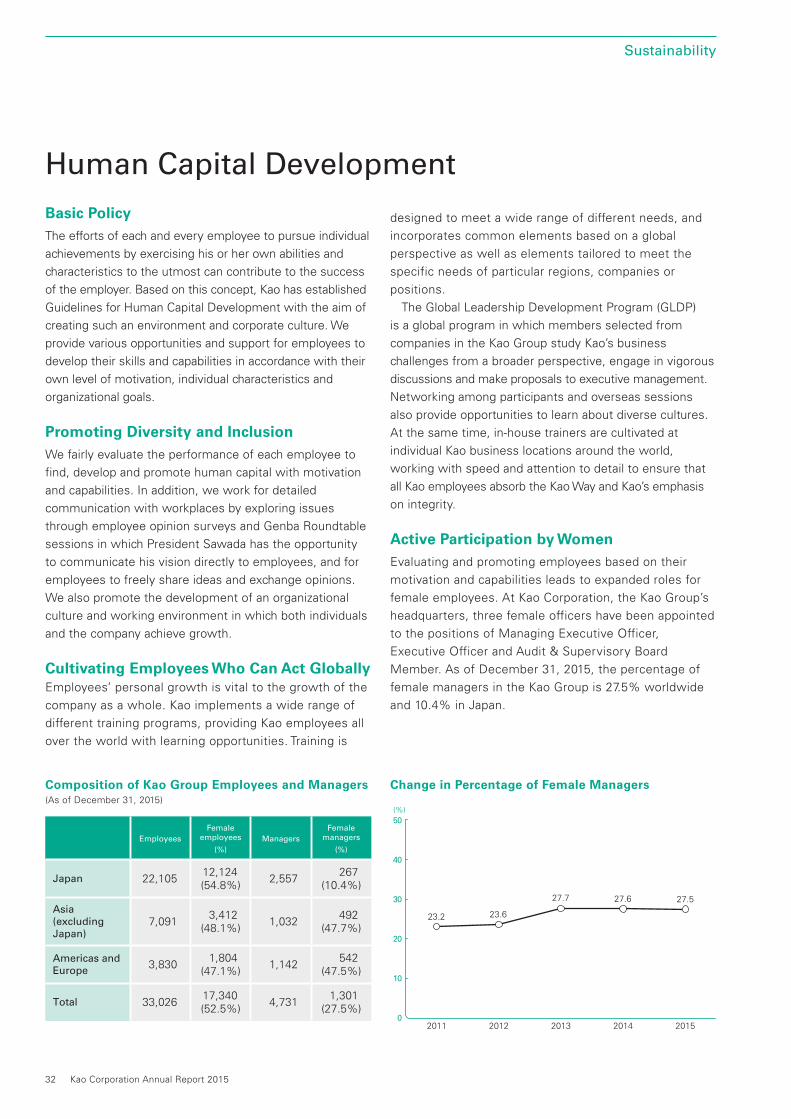
designed to meet a wide range of different needs, and
incorporates common elements based on a global
perspective as well as elements tailored to meet the
specific needs of particular regions, companies or
positions.
The Global Leadership Development Program (GLDP)
is a global program in which members selected from
companies in the Kao Group study Kao’s business
challenges from a broader perspective, engage in vigorous
discussions and make proposals to executive management.
Networking among participants and overseas sessions
also provide opportunities to learn about diverse cultures.
At the same time, in-house trainers are cultivated at
individual Kao business locations around the world,
working with speed and attention to detail to ensure that
all Kao employees absorb the Kao Way and Kao’s emphasis
on integrity.
Active Participation by WomenEvaluating and promoting employees based on their
motivation and capabilities leads to expanded roles for
female employees. At Kao Corporation, the Kao Group’s
headquarters, three female officers have been appointed
to the positions of Managing Executive Officer,
Executive Officer and Audit & Supervisory Board
Member. As of December 31, 2015, the percentage of
female managers in the Kao Group is 27.5% worldwide
and 10.4% in Japan.
Basic Policy The efforts of each and every employee to pursue individual
achievements by exercising his or her own abilities and
characteristics to the utmost can contribute to the success
of the employer. Based on this concept, Kao has established
Guidelines for Human Capital Development with the aim of
creating such an environment and corporate culture. We
provide various opportunities and support for employees to
develop their skills and capabilities in accordance with their
own level of motivation, individual characteristics and
organizational goals.
Promoting Diversity and InclusionWe fairly evaluate the performance of each employee to
find, develop and promote human capital with motivation
and capabilities. In addition, we work for detailed
communication with workplaces by exploring issues
through employee opinion surveys and Genba Roundtable
sessions in which President Sawada has the opportunity
to communicate his vision directly to employees, and for
employees to freely share ideas and exchange opinions.
We also promote the development of an organizational
culture and working environment in which both individuals
and the company achieve growth.
Cultivating Employees Who Can Act Globally Employees’ personal growth is vital to the growth of the
company as a whole. Kao implements a wide range of
different training programs, providing Kao employees all
over the world with learning opportunities. Training is
Human Capital Development
Composition of Kao Group Employees and Managers (As of December 31, 2015)
(%)
20152014201320122011
27.527.627.7
23.623.2
0
20
10
30
40
50
Change in Percentage of Female Managers
Employees
Femaleemployees
(%)
Managers
Femalemanagers
(%)
Japan 22,10512,124(54.8%)
2,557267
(10.4%)
Asia(excluding Japan)
7,0913,412
(48.1%)1,032
492(47.7%)
Americas and Europe
3,8301,804
(47.1%)1,142
542(47.5%)
Total 33,02617,340(52.5%)
4,7311,301
(27.5%)
Sustainability
32 Kao Corporation Annual Report 2015
Financial Section
11-Year Summary 34 Management Discussion and Analysis 36
Consolidated Financial Statements 46
Notes to Consolidated Financial Statements 52
Independent Auditor’s Report 79
Kao Corporation Annual Report 2015 33
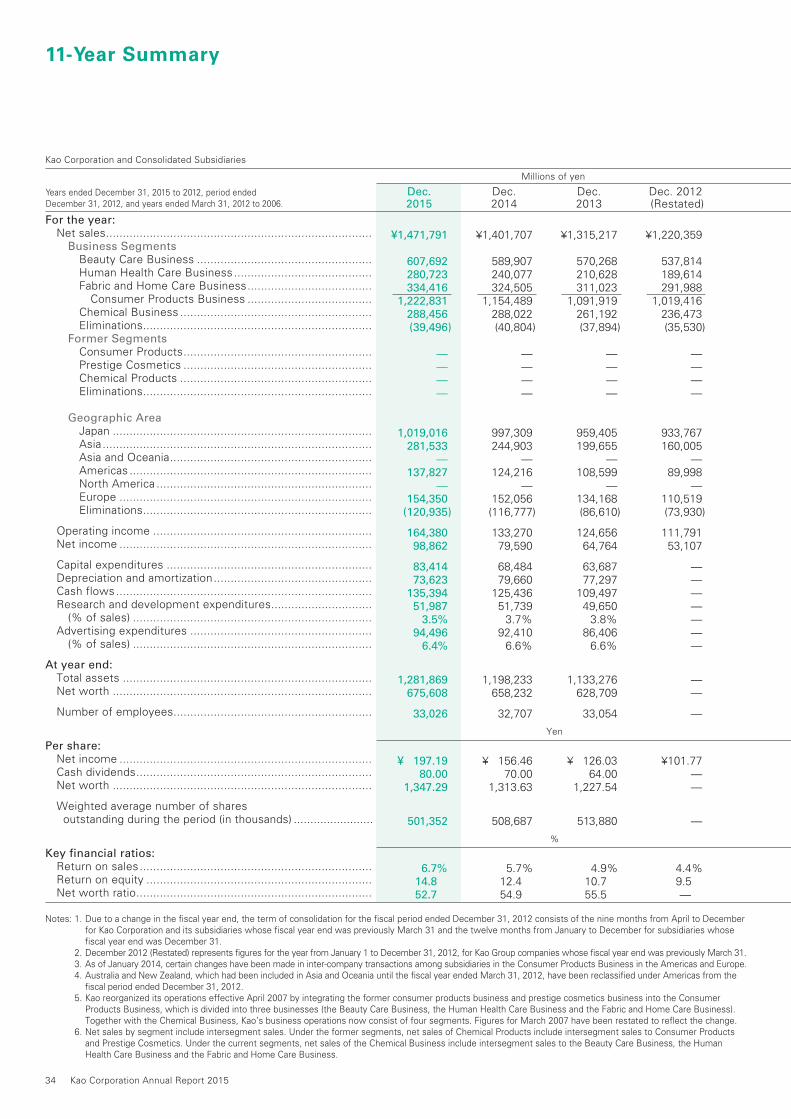
Kao Corporation and Consolidated Subsidiaries
Millions of yen
Dec. Dec. Dec. Dec. 2012 2015 2014 2013 (Restated)
For the year: Net sales ............................................................................... Business Segments Beauty Care Business .................................................... Human Health Care Business ......................................... Fabric and Home Care Business ..................................... Consumer Products Business ..................................... Chemical Business ......................................................... Eliminations .................................................................... Former Segments Consumer Products ........................................................ Prestige Cosmetics ........................................................ Chemical Products ......................................................... Eliminations ....................................................................
Geographic Area Japan ............................................................................. Asia ................................................................................ Asia and Oceania ............................................................ Americas ........................................................................ North America ................................................................ Europe ........................................................................... Eliminations ....................................................................
Operating income ................................................................. Net income ...........................................................................
Capital expenditures ............................................................. Depreciation and amortization ............................................... Cash flows ............................................................................ Research and development expenditures.............................. (% of sales) ....................................................................... Advertising expenditures ...................................................... (% of sales) .......................................................................
At year end: Total assets .......................................................................... Net worth .............................................................................
Number of employees...........................................................
Yen
Per share: Net income ........................................................................... Cash dividends ...................................................................... Net worth .............................................................................
Weighted average number of shares outstanding during the period (in thousands) ........................
%
Key financial ratios: Return on sales ..................................................................... Return on equity ................................................................... Net worth ratio ......................................................................
¥1,315,217
570,268 210,628 311,023 1,091,919 261,192 (37,894)
— — — —
959,405 199,655 — 108,599 — 134,168 (86,610)
124,656 64,764
63,687 77,297 109,497 49,650 3.8% 86,406 6.6%
1,133,276 628,709
33,054
¥ 126.03 64.00 1,227.54
513,880
4.9% 10.7 55.5
¥1,401,707
589,907 240,077 324,505 1,154,489 288,022 (40,804)
— — — —
997,309 244,903 — 124,216 — 152,056 (116,777)
133,270 79,590
68,484 79,660 125,436 51,739 3.7% 92,410 6.6%
1,198,233 658,232
32,707
¥ 156.46 70.00 1,313.63
508,687
5.7% 12.4 54.9
¥1,471,791
607,692 280,723 334,416 1,222,831 288,456 (39,496)
— — — —
1,019,016 281,533 — 137,827 — 154,350 (120,935)
164,380 98,862
83,414 73,623 135,394 51,987 3.5% 94,496 6.4%
1,281,869 675,608
33,026
¥ 197.19 80.00 1,347.29
501,352
6.7% 14.8 52.7
¥1,220,359
537,814 189,614 291,988 1,019,416 236,473 (35,530)
— — — —
933,767 160,005 — 89,998 — 110,519 (73,930)
111,791 53,107
— — — — — — —
— —
—
¥101.77 — —
—
4.4% 9.5 —
Notes: 1. Due to a change in the fiscal year end, the term of consolidation for the fiscal period ended December 31, 2012 consists of the nine months from April to December for Kao Corporation and its subsidiaries whose fiscal year end was previously March 31 and the twelve months from January to December for subsidiaries whose fiscal year end was December 31.
2. December 2012 (Restated) represents figures for the year from January 1 to December 31, 2012, for Kao Group companies whose fiscal year end was previously March 31. 3. As of January 2014, certain changes have been made in inter-company transactions among subsidiaries in the Consumer Products Business in the Americas and Europe. 4. Australia and New Zealand, which had been included in Asia and Oceania until the fiscal year ended March 31, 2012, have been reclassified under Americas from the
fiscal period ended December 31, 2012. 5. Kao reorganized its operations effective April 2007 by integrating the former consumer products business and prestige cosmetics business into the Consumer
Products Business, which is divided into three businesses (the Beauty Care Business, the Human Health Care Business and the Fabric and Home Care Business). Together with the Chemical Business, Kao’s business operations now consist of four segments. Figures for March 2007 have been restated to reflect the change.
6. Net sales by segment include intersegment sales. Under the former segments, net sales of Chemical Products include intersegment sales to Consumer Products and Prestige Cosmetics. Under the current segments, net sales of the Chemical Business include intersegment sales to the Beauty Care Business, the Human Health Care Business and the Fabric and Home Care Business.
11-Year Summary
Years ended December 31, 2015 to 2012, period ended December 31, 2012, and years ended March 31, 2012 to 2006.
34 Kao Corporation Annual Report 2015
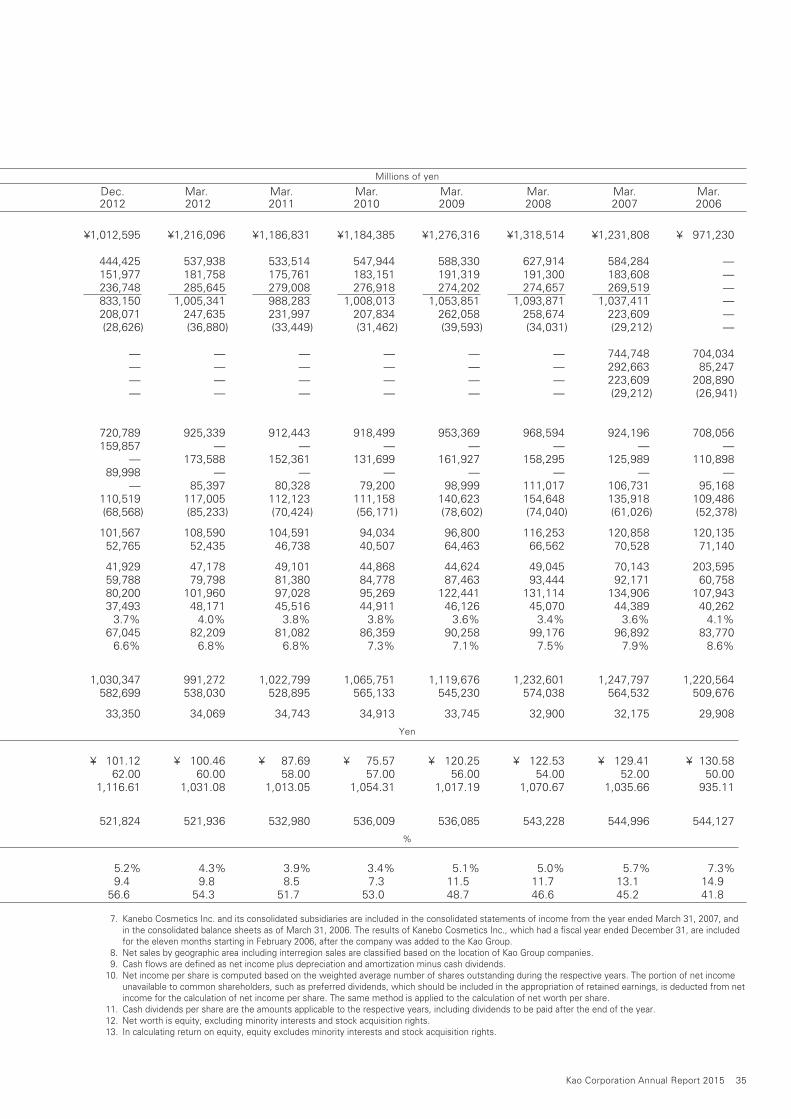
Millions of yen
Dec. Mar. Mar. Mar. Mar. Mar. Mar. Mar.2012 2012 2011 2010 2009 2008 2007 2006
Yen
%
¥1,216,096 537,938 181,758 285,645 1,005,341 247,635 (36,880) — — — — 925,339 — 173,588 — 85,397 117,005 (85,233)
108,590 52,435
47,178 79,798 101,960 48,171 4.0% 82,209 6.8%
991,272 538,030
34,069
¥ 100.46 60.00 1,031.08
521,936
4.3% 9.8 54.3
¥1,012,595
444,425 151,977 236,748 833,150 208,071 (28,626)
— — — —
720,789 159,857 — 89,998 — 110,519 (68,568)
101,567 52,765
41,929 59,788 80,200 37,493 3.7% 67,045 6.6%
1,030,347 582,699
33,350
¥ 101.12 62.00 1,116.61
521,824
5.2% 9.4 56.6
¥1,186,831 533,514 175,761 279,008 988,283 231,997 (33,449) — — — — 912,443 — 152,361 — 80,328 112,123 (70,424)
104,591 46,738
49,101 81,380 97,028 45,516 3.8% 81,082 6.8%
1,022,799 528,895
34,743
¥ 87.69 58.00 1,013.05
532,980
3.9% 8.5 51.7
¥1,276,316 588,330 191,319 274,202 1,053,851 262,058 (39,593) — — — — 953,369 — 161,927 — 98,999 140,623 (78,602)
96,800 64,463
44,624 87,463 122,441 46,126 3.6% 90,258 7.1%
1,119,676 545,230
33,745
¥ 120.25 56.00 1,017.19
536,085
5.1% 11.5 48.7
¥1,184,385 547,944 183,151 276,918 1,008,013 207,834 (31,462) — — — — 918,499 — 131,699 — 79,200 111,158 (56,171)
94,034 40,507
44,868 84,778 95,269 44,911 3.8% 86,359 7.3%
1,065,751 565,133
34,913
¥ 75.57 57.00 1,054.31
536,009
3.4% 7.3 53.0
7. Kanebo Cosmetics Inc. and its consolidated subsidiaries are included in the consolidated statements of income from the year ended March 31, 2007, and in the consolidated balance sheets as of March 31, 2006. The results of Kanebo Cosmetics Inc., which had a fiscal year ended December 31, are included for the eleven months starting in February 2006, after the company was added to the Kao Group.
8. Net sales by geographic area including interregion sales are classified based on the location of Kao Group companies. 9. Cash flows are defined as net income plus depreciation and amortization minus cash dividends. 10. Net income per share is computed based on the weighted average number of shares outstanding during the respective years. The portion of net income
unavailable to common shareholders, such as preferred dividends, which should be included in the appropriation of retained earnings, is deducted from net income for the calculation of net income per share. The same method is applied to the calculation of net worth per share.
11. Cash dividends per share are the amounts applicable to the respective years, including dividends to be paid after the end of the year. 12. Net worth is equity, excluding minority interests and stock acquisition rights. 13. In calculating return on equity, equity excludes minority interests and stock acquisition rights.
¥1,318,514 627,914 191,300 274,657 1,093,871 258,674 (34,031) — — — — 968,594 — 158,295 — 111,017 154,648 (74,040)
116,253 66,562
49,045 93,444 131,114 45,070 3.4% 99,176 7.5%
1,232,601 574,038
32,900
¥ 122.53 54.00 1,070.67
543,228
5.0% 11.7 46.6
¥1,231,808 584,284 183,608 269,519 1,037,411 223,609 (29,212) 744,748 292,663 223,609 (29,212) 924,196 — 125,989 — 106,731 135,918 (61,026)
120,858 70,528
70,143 92,171 134,906 44,389 3.6% 96,892 7.9%
1,247,797 564,532
32,175
¥ 129.41 52.00 1,035.66
544,996
5.7% 13.1 45.2
¥ 971,230 — — — — — — 704,034 85,247 208,890 (26,941) 708,056 — 110,898 — 95,168 109,486 (52,378)
120,135 71,140
203,595 60,758 107,943 40,262 4.1% 83,770 8.6%
1,220,564 509,676
29,908
¥ 130.58 50.00 935.11
544,127
7.3% 14.9 41.8
Kao Corporation Annual Report 2015 35
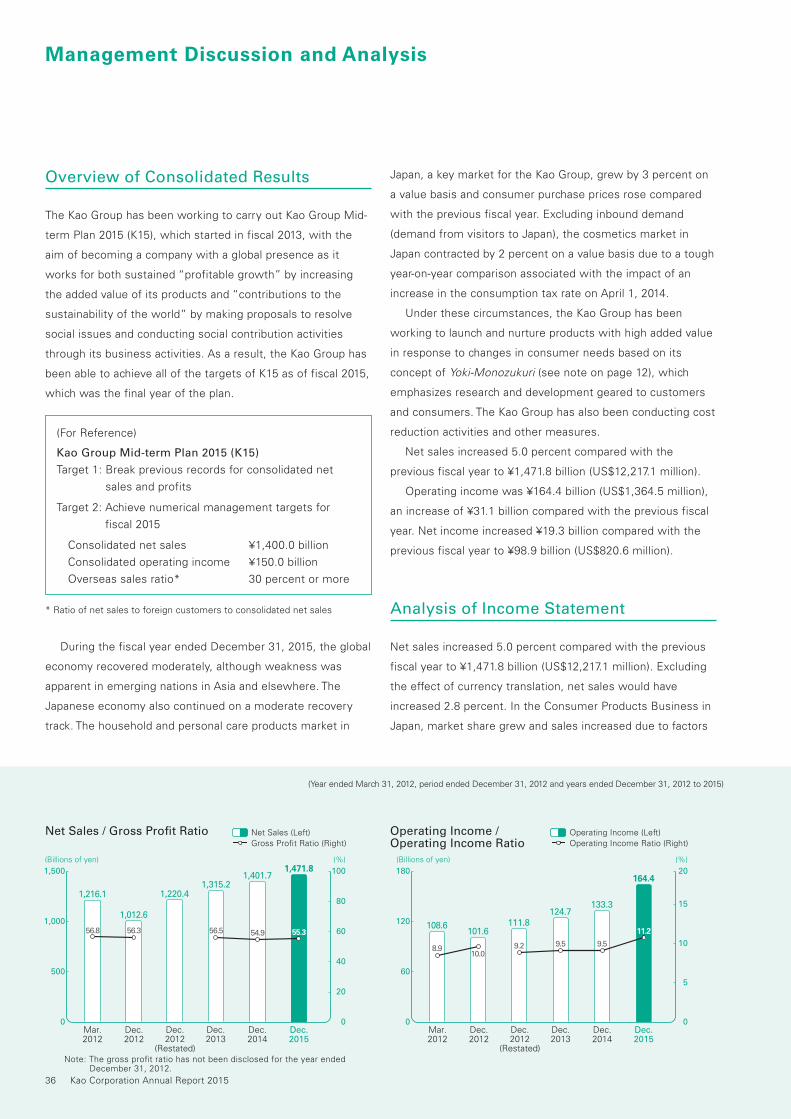
Overview of Consolidated Results
The Kao Group has been working to carry out Kao Group Mid-
term Plan 2015 (K15), which started in fiscal 2013, with the
aim of becoming a company with a global presence as it
works for both sustained “profitable growth” by increasing
the added value of its products and “contributions to the
sustainability of the world” by making proposals to resolve
social issues and conducting social contribution activities
through its business activities. As a result, the Kao Group has
been able to achieve all of the targets of K15 as of fiscal 2015,
which was the final year of the plan.
(For Reference)
Kao Group Mid-term Plan 2015 (K15)
Target 1: Break previous records for consolidated net
sales and profits
Target 2: Achieve numerical management targets for
fiscal 2015
Consolidated net sales ¥1,400.0 billion
Consolidated operating income ¥150.0 billion
Overseas sales ratio* 30 percent or more
* Ratio of net sales to foreign customers to consolidated net sales
During the fiscal year ended December 31, 2015, the global
economy recovered moderately, although weakness was
apparent in emerging nations in Asia and elsewhere. The
Japanese economy also continued on a moderate recovery
track. The household and personal care products market in
Japan, a key market for the Kao Group, grew by 3 percent on
a value basis and consumer purchase prices rose compared
with the previous fiscal year. Excluding inbound demand
(demand from visitors to Japan), the cosmetics market in
Japan contracted by 2 percent on a value basis due to a tough
year-on-year comparison associated with the impact of an
increase in the consumption tax rate on April 1, 2014.
Under these circumstances, the Kao Group has been
working to launch and nurture products with high added value
in response to changes in consumer needs based on its
concept of Yoki-Monozukuri (see note on page 12), which
emphasizes research and development geared to customers
and consumers. The Kao Group has also been conducting cost
reduction activities and other measures.
Net sales increased 5.0 percent compared with the
previous fiscal year to ¥1,471.8 billion (US$12,217.1 million).
Operating income was ¥164.4 billion (US$1,364.5 million),
an increase of ¥31.1 billion compared with the previous fiscal
year. Net income increased ¥19.3 billion compared with the
previous fiscal year to ¥98.9 billion (US$820.6 million).
Analysis of Income Statement
Net sales increased 5.0 percent compared with the previous
fiscal year to ¥1,471.8 billion (US$12,217.1 million). Excluding
the effect of currency translation, net sales would have
increased 2.8 percent. In the Consumer Products Business in
Japan, market share grew and sales increased due to factors
Management Discussion and Analysis
(Year ended March 31, 2012, period ended December 31, 2012 and years ended December 31, 2012 to 2015)
56.8
Net Sales (Left)Gross Profit Ratio (Right)
Net Sales / Gross Profit Ratio
Mar.2012
Dec.2012
(Restated)
Dec.2012
1,216.1
56.5
Dec.2014
1,315.2
56.3
1,012.6
Note: The gross profit ratio has not been disclosed for the year ended December 31, 2012.
Dec.2013
1,220.4
54.9
Dec.2015
1,401.7
55.3
1,471.8(Billions of yen) (%)
1,500
1,000
0
500
100
80
60
0
20
40
8.9
Operating Income (Left)Operating Income Ratio (Right)
Mar.2012
Dec.2012
(Restated)
Dec.2012
Operating Income /Operating Income Ratio
108.6
9.5
Dec.2014
124.7
10.0
101.6
Dec.2013
9.2
111.8
9.5
Dec.2015
133.3
11.2
164.4
(Billions of yen) (%)
180
120
0
60
20
15
10
0
5
36 Kao Corporation Annual Report 2015
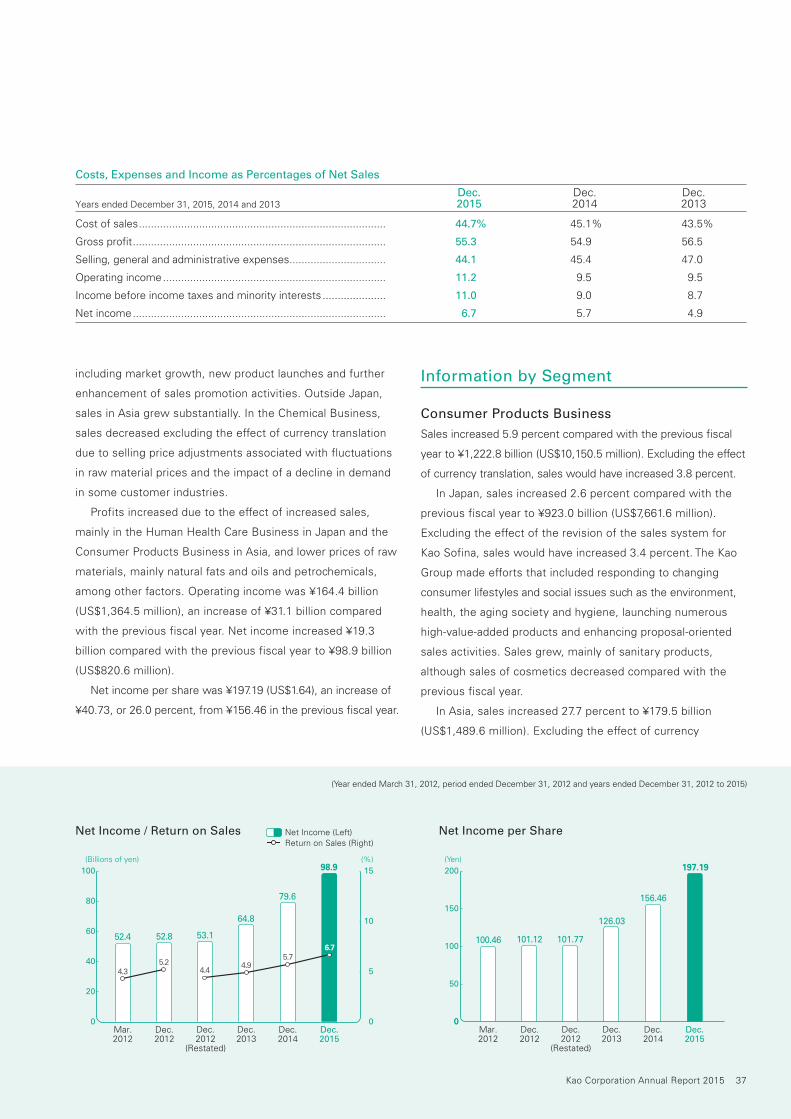
including market growth, new product launches and further
enhancement of sales promotion activities. Outside Japan,
sales in Asia grew substantially. In the Chemical Business,
sales decreased excluding the effect of currency translation
due to selling price adjustments associated with fluctuations
in raw material prices and the impact of a decline in demand
in some customer industries.
Profits increased due to the effect of increased sales,
mainly in the Human Health Care Business in Japan and the
Consumer Products Business in Asia, and lower prices of raw
materials, mainly natural fats and oils and petrochemicals,
among other factors. Operating income was ¥164.4 billion
(US$1,364.5 million), an increase of ¥31.1 billion compared
with the previous fiscal year. Net income increased ¥19.3
billion compared with the previous fiscal year to ¥98.9 billion
(US$820.6 million).
Net income per share was ¥197.19 (US$1.64), an increase of
¥40.73, or 26.0 percent, from ¥156.46 in the previous fiscal year.
Information by Segment
Consumer Products Business
Sales increased 5.9 percent compared with the previous fiscal
year to ¥1,222.8 billion (US$10,150.5 million). Excluding the effect
of currency translation, sales would have increased 3.8 percent.
In Japan, sales increased 2.6 percent compared with the
previous fiscal year to ¥923.0 billion (US$7,661.6 million).
Excluding the effect of the revision of the sales system for
Kao Sofina, sales would have increased 3.4 percent. The Kao
Group made efforts that included responding to changing
consumer lifestyles and social issues such as the environment,
health, the aging society and hygiene, launching numerous
high-value-added products and enhancing proposal-oriented
sales activities. Sales grew, mainly of sanitary products,
although sales of cosmetics decreased compared with the
previous fiscal year.
In Asia, sales increased 27.7 percent to ¥179.5 billion
(US$1,489.6 million). Excluding the effect of currency
Costs, Expenses and Income as Percentages of Net Sales
Dec. Dec. Dec.Years ended December 31, 2015, 2014 and 2013 2015 2014 2013
Cost of sales .................................................................................. 44.7% 45.1% 43.5%
Gross profit .................................................................................... 55.3 54.9 56.5
Selling, general and administrative expenses ................................ 44.1 45.4 47.0
Operating income .......................................................................... 11.2 9.5 9.5
Income before income taxes and minority interests ..................... 11.0 9.0 8.7
Net income .................................................................................... 6.7 5.7 4.9
(Year ended March 31, 2012, period ended December 31, 2012 and years ended December 31, 2012 to 2015)
52.8
5.24.4
Net Income (Left)Return on Sales (Right)
Mar.2012
Dec.2012
52.4
4.3
Net Income / Return on Sales
Dec.2014
Dec.2012
(Restated)
64.8
4.9
53.1
Dec.2013
Dec.2015
79.6
5.7
98.9
6.7
(Billions of yen) (%)
100
80
60
0
40
20
15
10
5
0
101.12
Dec.2012
100.46
Net Income per Share
Dec.2014
Dec.2012
(Restated)
101.77
Dec.2013
126.03
Dec.2015
156.46
Mar.2012
197.19(Yen)
00
50
100
150
200
Kao Corporation Annual Report 2015 37
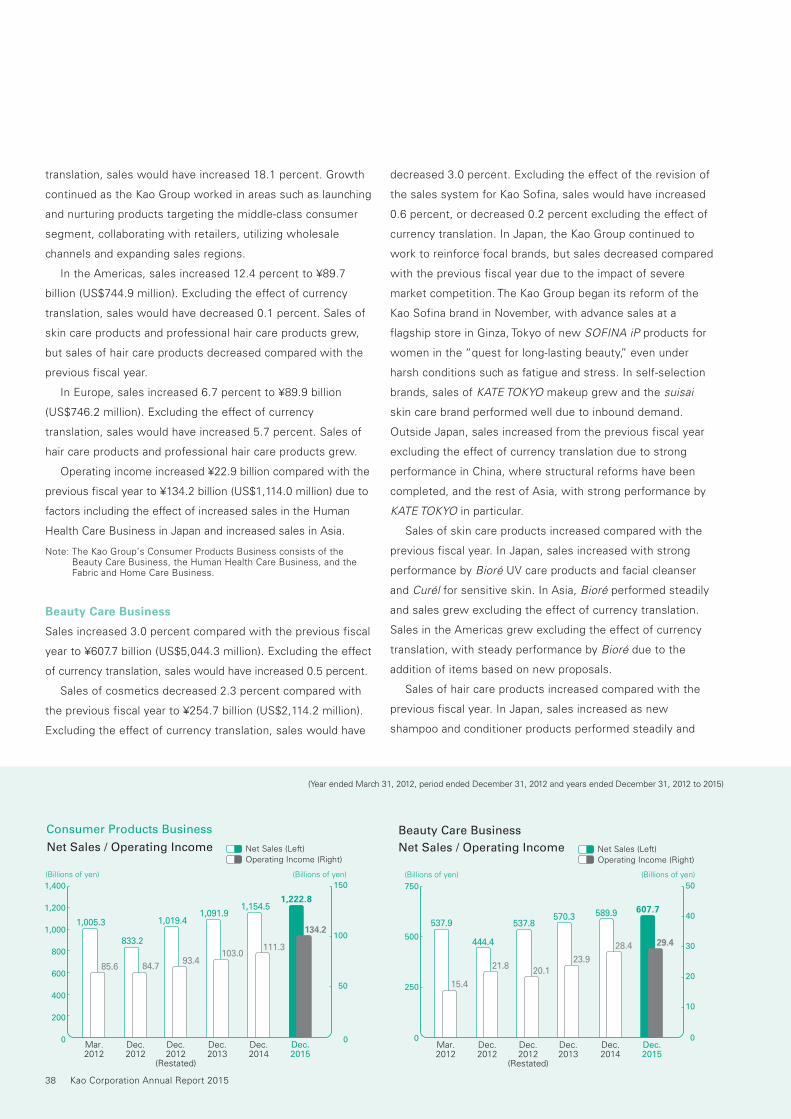
translation, sales would have increased 18.1 percent. Growth
continued as the Kao Group worked in areas such as launching
and nurturing products targeting the middle-class consumer
segment, collaborating with retailers, utilizing wholesale
channels and expanding sales regions.
In the Americas, sales increased 12.4 percent to ¥89.7
billion (US$744.9 million). Excluding the effect of currency
translation, sales would have decreased 0.1 percent. Sales of
skin care products and professional hair care products grew,
but sales of hair care products decreased compared with the
previous fiscal year.
In Europe, sales increased 6.7 percent to ¥89.9 billion
(US$746.2 million). Excluding the effect of currency
translation, sales would have increased 5.7 percent. Sales of
hair care products and professional hair care products grew.
Operating income increased ¥22.9 billion compared with the
previous fiscal year to ¥134.2 billion (US$1,114.0 million) due to
factors including the effect of increased sales in the Human
Health Care Business in Japan and increased sales in Asia.
Note: The Kao Group’s Consumer Products Business consists of the Beauty Care Business, the Human Health Care Business, and the Fabric and Home Care Business.
Beauty Care Business
Sales increased 3.0 percent compared with the previous fiscal
year to ¥607.7 billion (US$5,044.3 million). Excluding the effect
of currency translation, sales would have increased 0.5 percent.
Sales of cosmetics decreased 2.3 percent compared with
the previous fiscal year to ¥254.7 billion (US$2,114.2 million).
Excluding the effect of currency translation, sales would have
decreased 3.0 percent. Excluding the effect of the revision of
the sales system for Kao Sofina, sales would have increased
0.6 percent, or decreased 0.2 percent excluding the effect of
currency translation. In Japan, the Kao Group continued to
work to reinforce focal brands, but sales decreased compared
with the previous fiscal year due to the impact of severe
market competition. The Kao Group began its reform of the
Kao Sofina brand in November, with advance sales at a
flagship store in Ginza, Tokyo of new SOFINA iP products for
women in the “quest for long-lasting beauty,” even under
harsh conditions such as fatigue and stress. In self-selection
brands, sales of KATE TOKYO makeup grew and the suisai
skin care brand performed well due to inbound demand.
Outside Japan, sales increased from the previous fiscal year
excluding the effect of currency translation due to strong
performance in China, where structural reforms have been
completed, and the rest of Asia, with strong performance by
KATE TOKYO in particular.
Sales of skin care products increased compared with the
previous fiscal year. In Japan, sales increased with strong
performance by Bioré UV care products and facial cleanser
and Curél for sensitive skin. In Asia, Bioré performed steadily
and sales grew excluding the effect of currency translation.
Sales in the Americas grew excluding the effect of currency
translation, with steady performance by Bioré due to the
addition of items based on new proposals.
Sales of hair care products increased compared with the
previous fiscal year. In Japan, sales increased as new
shampoo and conditioner products performed steadily and
(Year ended March 31, 2012, period ended December 31, 2012 and years ended December 31, 2012 to 2015)
Mar.2012
Dec.2012
444.4
21.8
Dec.2014
Dec.2012
(Restated)
589.9
28.4
537.8
20.1
Net Sales (Left)Operating Income (Right)
Net Sales / Operating Income
Beauty Care Business
537.9
15.4
Dec.2013
570.3
23.9
Dec.2015
607.7
29.4
0
250
500
750
0
10
20
30
40
50(Billions of yen) (Billions of yen)
Mar.2012
Dec.2012
1,005.3
85.6
833.2
84.7
Dec.2012
(Restated)
1,019.4
93.4
Dec.2013
1,091.9
103.0
Net Sales (Left)Operating Income (Right)
Net Sales / Operating Income
Consumer Products Business
Dec.2014
1,154.5
111.3
Dec.2015
1,222.8
134.2
0
50
100
150(Billions of yen) (Billions of yen)
0
200
400
600
800
1,000
1,400
1,200
38 Kao Corporation Annual Report 2015
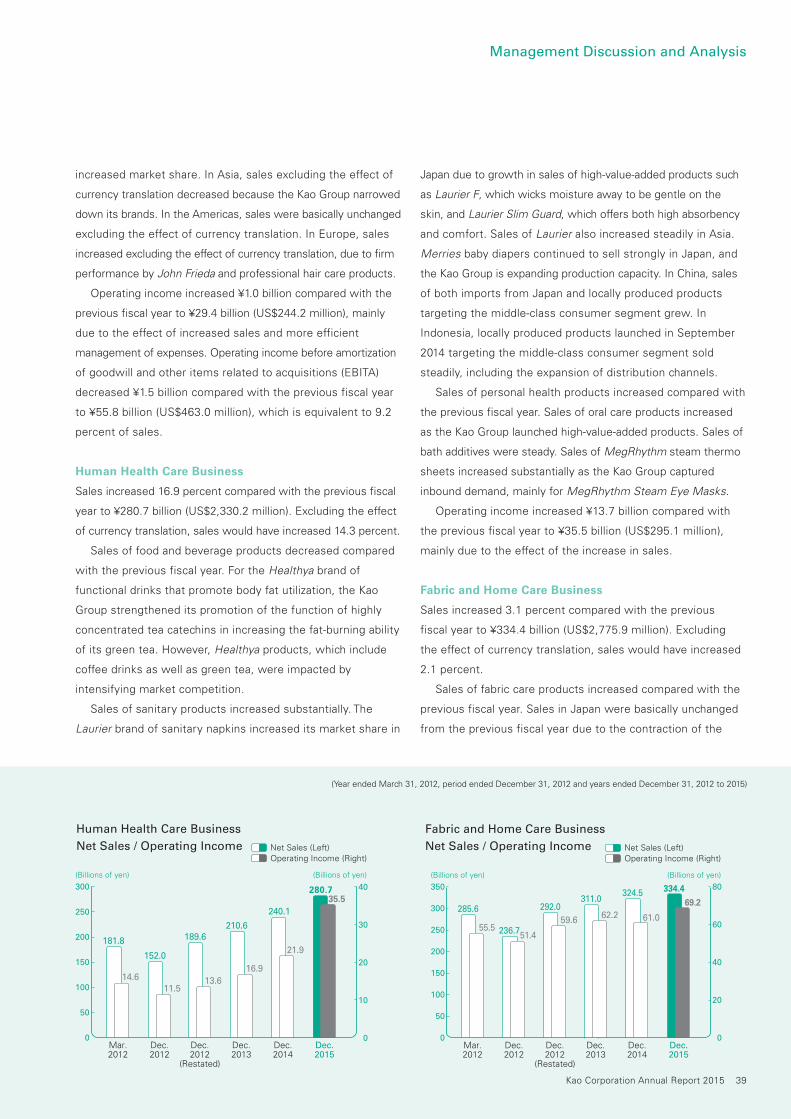
increased market share. In Asia, sales excluding the effect of
currency translation decreased because the Kao Group narrowed
down its brands. In the Americas, sales were basically unchanged
excluding the effect of currency translation. In Europe, sales
increased excluding the effect of currency translation, due to firm
performance by John Frieda and professional hair care products.
Operating income increased ¥1.0 billion compared with the
previous fiscal year to ¥29.4 billion (US$244.2 million), mainly
due to the effect of increased sales and more efficient
management of expenses. Operating income before amortization
of goodwill and other items related to acquisitions (EBITA)
decreased ¥1.5 billion compared with the previous fiscal year
to ¥55.8 billion (US$463.0 million), which is equivalent to 9.2
percent of sales.
Human Health Care Business
Sales increased 16.9 percent compared with the previous fiscal
year to ¥280.7 billion (US$2,330.2 million). Excluding the effect
of currency translation, sales would have increased 14.3 percent.
Sales of food and beverage products decreased compared
with the previous fiscal year. For the Healthya brand of
functional drinks that promote body fat utilization, the Kao
Group strengthened its promotion of the function of highly
concentrated tea catechins in increasing the fat-burning ability
of its green tea. However, Healthya products, which include
coffee drinks as well as green tea, were impacted by
intensifying market competition.
Sales of sanitary products increased substantially. The
Laurier brand of sanitary napkins increased its market share in
Japan due to growth in sales of high-value-added products such
as Laurier F, which wicks moisture away to be gentle on the
skin, and Laurier Slim Guard, which offers both high absorbency
and comfort. Sales of Laurier also increased steadily in Asia.
Merries baby diapers continued to sell strongly in Japan, and
the Kao Group is expanding production capacity. In China, sales
of both imports from Japan and locally produced products
targeting the middle-class consumer segment grew. In
Indonesia, locally produced products launched in September
2014 targeting the middle-class consumer segment sold
steadily, including the expansion of distribution channels.
Sales of personal health products increased compared with
the previous fiscal year. Sales of oral care products increased
as the Kao Group launched high-value-added products. Sales of
bath additives were steady. Sales of MegRhythm steam thermo
sheets increased substantially as the Kao Group captured
inbound demand, mainly for MegRhythm Steam Eye Masks.
Operating income increased ¥13.7 billion compared with
the previous fiscal year to ¥35.5 billion (US$295.1 million),
mainly due to the effect of the increase in sales.
Fabric and Home Care Business
Sales increased 3.1 percent compared with the previous
fiscal year to ¥334.4 billion (US$2,775.9 million). Excluding
the effect of currency translation, sales would have increased
2.1 percent.
Sales of fabric care products increased compared with the
previous fiscal year. Sales in Japan were basically unchanged
from the previous fiscal year due to the contraction of the
Mar.2012
Dec.2012
181.8
14.6
152.0
11.5
Dec.2014
Dec.2012
(Restated)
240.1
21.9
189.6
13.6
Net Sales (Left)Operating Income (Right)
Net Sales / Operating Income
Human Health Care Business
Dec.2013
210.6
16.9
Dec.2015
280.735.5
(Billions of yen) (Billions of yen)
0
50
100
150
300
200
250
0
10
20
40
30
Mar.2012
Dec.2012
285.6
55.5 236.751.4
Dec.2014
Dec.2012
(Restated)
324.5
61.0292.0
59.6
Net Sales (Left)Operating Income (Right)
Net Sales / Operating Income
Fabric and Home Care Business
Dec.2013
311.0
62.2
Dec.2015
334.4
69.2
0
50
200
300
150
250
100
350
0
20
40
60
80
(Billions of yen) (Billions of yen)
(Year ended March 31, 2012, period ended December 31, 2012 and years ended December 31, 2012 to 2015)
Kao Corporation Annual Report 2015 39
Management Discussion and Analysis
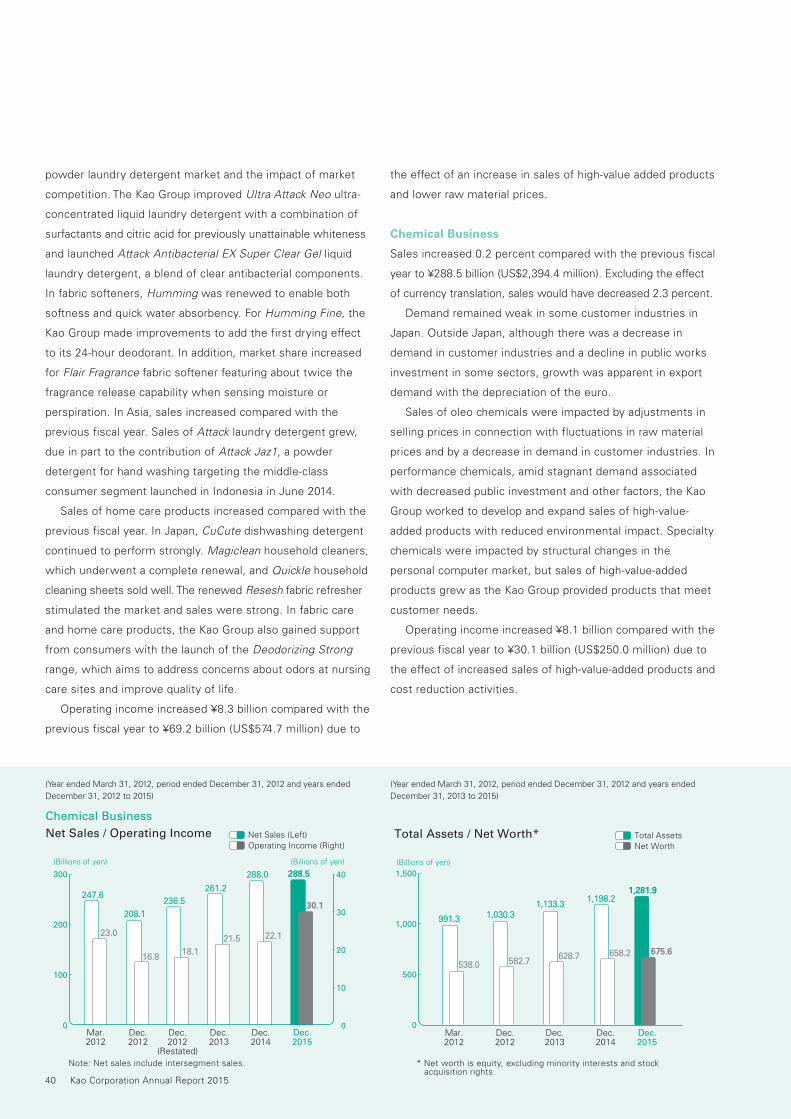
powder laundry detergent market and the impact of market
competition. The Kao Group improved Ultra Attack Neo ultra-
concentrated liquid laundry detergent with a combination of
surfactants and citric acid for previously unattainable whiteness
and launched Attack Antibacterial EX Super Clear Gel liquid
laundry detergent, a blend of clear antibacterial components.
In fabric softeners, Humming was renewed to enable both
softness and quick water absorbency. For Humming Fine, the
Kao Group made improvements to add the first drying effect
to its 24-hour deodorant. In addition, market share increased
for Flair Fragrance fabric softener featuring about twice the
fragrance release capability when sensing moisture or
perspiration. In Asia, sales increased compared with the
previous fiscal year. Sales of Attack laundry detergent grew,
due in part to the contribution of Attack Jaz1, a powder
detergent for hand washing targeting the middle-class
consumer segment launched in Indonesia in June 2014.
Sales of home care products increased compared with the
previous fiscal year. In Japan, CuCute dishwashing detergent
continued to perform strongly. Magiclean household cleaners,
which underwent a complete renewal, and Quickle household
cleaning sheets sold well. The renewed Resesh fabric refresher
stimulated the market and sales were strong. In fabric care
and home care products, the Kao Group also gained support
from consumers with the launch of the Deodorizing Strong
range, which aims to address concerns about odors at nursing
care sites and improve quality of life.
Operating income increased ¥8.3 billion compared with the
previous fiscal year to ¥69.2 billion (US$574.7 million) due to
the effect of an increase in sales of high-value added products
and lower raw material prices.
Chemical Business
Sales increased 0.2 percent compared with the previous fiscal
year to ¥288.5 billion (US$2,394.4 million). Excluding the effect
of currency translation, sales would have decreased 2.3 percent.
Demand remained weak in some customer industries in
Japan. Outside Japan, although there was a decrease in
demand in customer industries and a decline in public works
investment in some sectors, growth was apparent in export
demand with the depreciation of the euro.
Sales of oleo chemicals were impacted by adjustments in
selling prices in connection with fluctuations in raw material
prices and by a decrease in demand in customer industries. In
performance chemicals, amid stagnant demand associated
with decreased public investment and other factors, the Kao
Group worked to develop and expand sales of high-value-
added products with reduced environmental impact. Specialty
chemicals were impacted by structural changes in the
personal computer market, but sales of high-value-added
products grew as the Kao Group provided products that meet
customer needs.
Operating income increased ¥8.1 billion compared with the
previous fiscal year to ¥30.1 billion (US$250.0 million) due to
the effect of increased sales of high-value-added products and
cost reduction activities.
(Year ended March 31, 2012, period ended December 31, 2012 and years ended
December 31, 2012 to 2015)
(Year ended March 31, 2012, period ended December 31, 2012 and years ended
December 31, 2013 to 2015)
Mar.2012
Dec.2012
247.6
23.0
208.1
16.8
Dec.2014
Dec.2012
(Restated)
288.0
22.1
236.5
18.1
Note: Net sales include intersegment sales.
Net Sales (Left)Operating Income (Right)
Net Sales / Operating Income
Chemical Business
Dec.2013
261.2
21.5
Dec.2015
288.5
30.1
0
100
200
300
0
10
20
30
40
(Billions of yen) (Billions of yen)
Mar.2012
Dec.2012
* Net worth is equity, excluding minority interests and stock acquisition rights.
991.3
538.0
1,030.3
582.7
Dec.2014
Dec.2013
1,198.2
658.2
1,133.3
628.7
(Billions of yen)
Total AssetsNet Worth
Total Assets / Net Worth*
Dec.2015
1,281.9
675.6
0
500
1,000
1,500
40 Kao Corporation Annual Report 2015
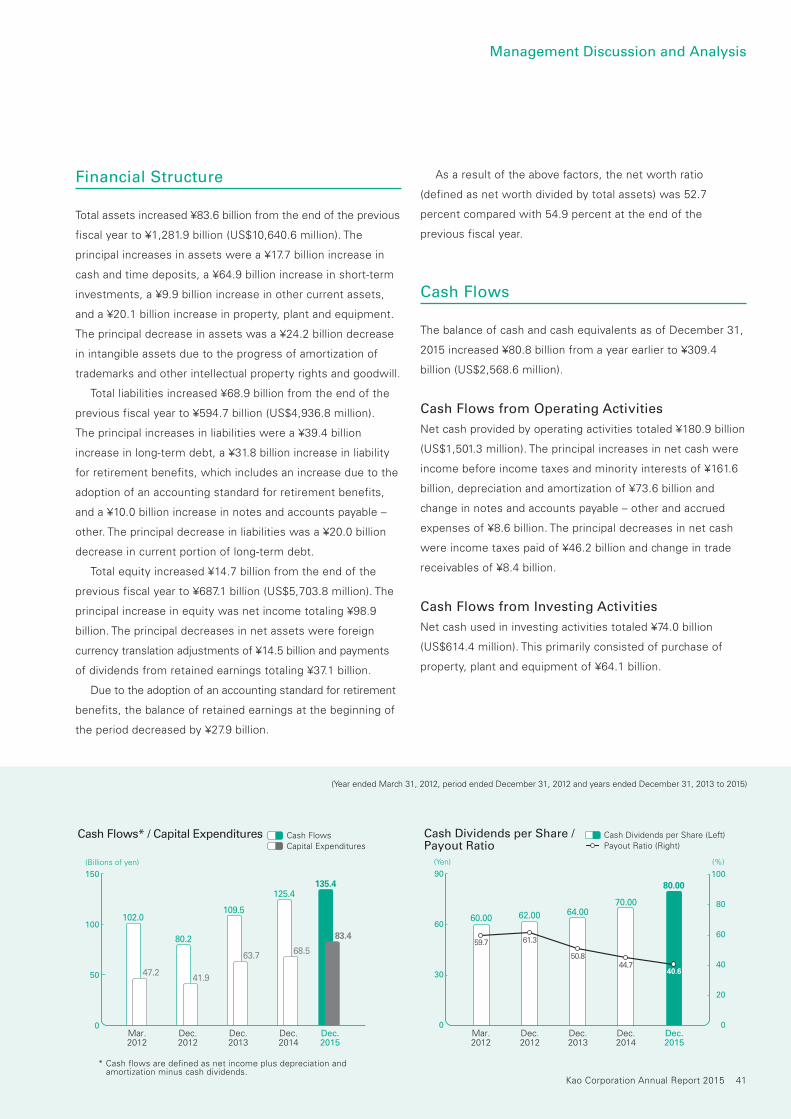
Financial Structure
Total assets increased ¥83.6 billion from the end of the previous
fiscal year to ¥1,281.9 billion (US$10,640.6 million). The
principal increases in assets were a ¥17.7 billion increase in
cash and time deposits, a ¥64.9 billion increase in short-term
investments, a ¥9.9 billion increase in other current assets,
and a ¥20.1 billion increase in property, plant and equipment.
The principal decrease in assets was a ¥24.2 billion decrease
in intangible assets due to the progress of amortization of
trademarks and other intellectual property rights and goodwill.
Total liabilities increased ¥68.9 billion from the end of the
previous fiscal year to ¥594.7 billion (US$4,936.8 million).
The principal increases in liabilities were a ¥39.4 billion
increase in long-term debt, a ¥31.8 billion increase in liability
for retirement benefits, which includes an increase due to the
adoption of an accounting standard for retirement benefits,
and a ¥10.0 billion increase in notes and accounts payable –
other. The principal decrease in liabilities was a ¥20.0 billion
decrease in current portion of long-term debt.
Total equity increased ¥14.7 billion from the end of the
previous fiscal year to ¥687.1 billion (US$5,703.8 million). The
principal increase in equity was net income totaling ¥98.9
billion. The principal decreases in net assets were foreign
currency translation adjustments of ¥14.5 billion and payments
of dividends from retained earnings totaling ¥37.1 billion.
Due to the adoption of an accounting standard for retirement
benefits, the balance of retained earnings at the beginning of
the period decreased by ¥27.9 billion.
As a result of the above factors, the net worth ratio
(defined as net worth divided by total assets) was 52.7
percent compared with 54.9 percent at the end of the
previous fiscal year.
Cash Flows
The balance of cash and cash equivalents as of December 31,
2015 increased ¥80.8 billion from a year earlier to ¥309.4
billion (US$2,568.6 million).
Cash Flows from Operating Activities
Net cash provided by operating activities totaled ¥180.9 billion
(US$1,501.3 million). The principal increases in net cash were
income before income taxes and minority interests of ¥161.6
billion, depreciation and amortization of ¥73.6 billion and
change in notes and accounts payable – other and accrued
expenses of ¥8.6 billion. The principal decreases in net cash
were income taxes paid of ¥46.2 billion and change in trade
receivables of ¥8.4 billion.
Cash Flows from Investing Activities
Net cash used in investing activities totaled ¥74.0 billion
(US$614.4 million). This primarily consisted of purchase of
property, plant and equipment of ¥64.1 billion.
Mar.2012
Dec.2012
80.2
41.9
Dec.2014
Dec.2013
125.4
68.5
109.5
63.7
Cash FlowsCapital Expenditures
Cash Flows* / Capital Expenditures
* Cash flows are defined as net income plus depreciation and amortization minus cash dividends.
102.0
47.2
Dec.2015
135.4
83.4
0
50
100
150
(Billions of yen)
64.00
50.8
Mar.2012
Dec.2012
62.00
59.7 61.3
60.00
Cash Dividends per Share (Left)Payout Ratio (Right)
Cash Dividends per Share / Payout Ratio
Dec.2014
Dec.2013
70.00
44.7
Dec.2015
80.00
40.6
0
30
60
90
0
20
40
60
80
100
(Yen) (%)
(Year ended March 31, 2012, period ended December 31, 2012 and years ended December 31, 2013 to 2015)
Kao Corporation Annual Report 2015 41
Management Discussion and Analysis
Cash Flows from Financing Activities
Net cash used in financing activities totaled ¥20.6 billion
(US$171.0 million). This primarily consisted of ¥38.4 billion for
payments of cash dividends, including to minority shareholders.
In March 2015, the Kao Group repaid loans totaling ¥20.0
billion but borrowed ¥40.0 billion with the objective of
maintaining an appropriate capital cost ratio and reinforcing
its financial base to invest for growth.
Basic Policies Regarding Distribution of Profits and Dividends for the Period
In order to achieve profitable growth, Kao Corporation secures
an internal reserve for capital investment and acquisitions
from a medium-to-long-term management perspective and
places priority on providing shareholders with steady and
continuous dividends. In addition, Kao Corporation flexibly
considers share repurchase and retirement of treasury stock
from the standpoint of improving capital efficiency.
In accordance with these policies, Kao Corporation announced
a year-end dividend for fiscal 2015 of ¥42.00 (US$0.35) per share,
an increase of ¥6.00 per share compared with the previous
fiscal year. Consequently, cash dividends for the fiscal year
increased ¥10.00 per share compared with the previous fiscal
year, resulting in a total of ¥80.00 (US$0.66) per share. The
consolidated payout ratio was 40.6 percent.
For the fiscal year ending December 31, 2016, Kao Corporation
plans to pay total cash dividends of ¥92.00 per share, an increase
of ¥12.00 per share compared with the fiscal year ended
December 31, 2015. Although the operating environment is
challenging, this plan is in accordance with Kao Corporation’s
basic policies regarding distribution of profits, and free cash
flow and other factors have also been taken into consideration.
As a result, Kao Corporation is aiming for its 27th consecutive
fiscal year of increases in dividends.
EVA
Economic Value Added (EVA®) is the Kao Group’s main
management metric, defined as net operating profit after tax
(NOPAT) less a charge for the cost of capital employed in the
business. We believe EVA indicates “true” profit. Continuously
increasing EVA raises corporate value, which is consistent
with the long-term interest of not only shareholders but other
stakeholders as well. The Kao Group aims to conduct business
activities that expand the scale of its business while also
increasing EVA, and uses EVA for business performance
evaluation, performance-based compensation and strategic
decision-making. During the fiscal year ended December 31,
2015, EVA increased to 244 from 165 in the previous year due
to double-digit growth in NOPAT and the Kao Group’s ability to
minimize the increase in invested capital by maximizing the
use of its assets. As a result, EVA for the year set new record
highs in terms of both the amount of improvement and the
absolute value. EVA is expressed as an index with the year
ended December 31, 2011 as 100. The Kao Group conducted
the following EVA-related activities during the fiscal year.
Investing for Growth: During the fiscal year ended December
31, 2015, the Kao Group invested aggressively for future
growth. The Kao Group expanded the capacity of production
lines inside and outside Japan, mainly for sanitary products,
and a new factory in China for the Chemical Business was
completed and started production. The Kao Group also
relocated its Odawara Research Laboratories and invested in
reform of cosmetics business. Research and development
expenditures were ¥52.0 billion (US$431.5 million), which was
the equivalent of 3.5 percent of net sales, remaining at a high
level relative to net sales.
Increasing Profit: During the fiscal year ended December 31,
2015, the Consumer Products Business in Japan, excluding
cosmetics, continued to increase its market share, and the
Consumer Products Business performed well in Asia. As a
result, sales grew substantially, leading to an increase in
profit. In addition, cost reduction activities and the benefits
from the stabilization of raw material prices at a low level
contributed significantly to improvement in NOPAT.
Financial Improvement: Free cash flow* increased ¥25.5
billion to ¥106.8 billion (US$886.9 million) for the fiscal year
ended December 31, 2015. The Kao Group has set priorities
for how it will deploy this free cash flow. Investments for
mergers and acquisitions and additional capital expenditures
42 Kao Corporation Annual Report 2015
for future growth are the top priorities, followed by stable and
continuous dividends. Kao Corporation increased cash dividends
per share for the fiscal year by ¥10.00 to ¥80.00 (US$0.66) for
the 26th consecutive year of growth in cash dividends.
* Free cash flow: Net cash provided by operating activities + Net cash used in investing activities
Business Risks and Other Risks
Various risks arise in the course of a company’s business. The
Kao Group takes reasonable measures to mitigate risks by
preventing the occurrence of, diversifying and hedging them.
In the event a risk manifests itself, the Kao Group responds
appropriately and works to minimize its impact.
However, unanticipated situations may occur that exert a
significant impact on the Kao Group’s business results and
financial condition. The risks described below are not a
comprehensive list of risks the Kao Group faces. Other risks
exist and may have an impact on investment decisions. Any
statements below concerning the future are judgments made
by Kao Corporation as of the submission of its securities
report to the Ministry of Finance on March 25, 2016.
(1) Consumer Products Business
1. Response to Changes in Consumer Needs
The Kao Group’s Consumer Products Business is affected by
business cycles and changes in consumers’ values in the
market of each country. The Consumer Products Business
maintains and improves brand value by understanding
changes in consumer needs and using the comprehensive
strength of the Kao Group’s product development and
manufacturing in working to create high-value-added products
and provide services through approaches in areas including
the environment, health, the aging society and hygiene.
However, as a consequence of uncertainties in these business
activities due to various factors, the Consumer Products
Business may be unable to provide products and services that
respond to changes in consumer needs and brand value could
decrease. This could have an impact on the Kao Group’s
business results and financial condition.
2. Response to Changes in Retailing
The Kao Group’s Consumer Products Business is affected by
changes in the structure of retailing, including progress in the
creation of new corporate groups through retail industry
mergers and integration in the market and the emergence of
new retail channels. The Consumer Products Business
conducts sales activities and makes new offerings that respond
to these structural changes. However, as a consequence of
uncertainties in these business activities due to various
factors, the Consumer Products Business may be unable to
conduct sales activities or make new offerings that respond
to these structural changes. This could have an impact on the
Kao Group’s business results and financial condition.
(2) Chemical Business
The Kao Group’s Chemical Business is affected by factors
including trends in customer demand and fluctuations in raw
material prices. The Chemical Business promotes creation of
high-value added products that match customer needs, conducts
research and development of products in consideration of the
environment, and provides such products while working to
reduce costs and deal with product prices. However, as a
consequence of uncertainties in these business activities due
to various factors, the Chemical Business may be unable to
provide products that match customer needs or respond to
matters such as fluctuations in raw material prices. This could
have an impact on the Kao Group’s business results and
financial condition.
(3) Business Acquisitions, Business Alliances and Mergers
The Kao Group may implement business acquisitions, business
alliances, mergers or other such measures. When implementing
them, the Kao Group makes decisions after thoroughly assessing
economic value and its partner companies. However, due to
various unforeseeable uncertainties in its business activities,
the Kao Group may be unable to produce the results it initially
expected. This could have an impact on the Kao Group’s
business results and financial condition.
(4) Overseas Business Expansion
As one of its growth strategies, the Kao Group is conducting
operations in markets in Asia, the Americas, Europe and
elsewhere, with a particular emphasis on strengthening its
Kao Corporation Annual Report 2015 43
Management Discussion and Analysis
operations in countries where higher economic growth rates
and market expansion are forecast. However, the Kao Group
may be unable to strengthen its operations as a consequence
of uncertainties due to various factors in the course of business
including the occurrence of a slowdown in economic growth
or uncertain political or social conditions, intensifying competition,
the inability to conduct sufficient cost management or the
emergence of problems in relationships with retail outlets, sales
agents or other trading partners. This could have an impact on
the Kao Group’s business results and financial condition.
(5) Procurement of Raw Materials
Market prices for natural fats and oils and petroleum-related
materials used as raw materials for products of the Kao Group
are affected by factors including geopolitical risks, the balance
between supply and demand, abnormal weather and exchange
rate fluctuations. The Kao Group has moved to reduce the
effect of increases in raw material prices through measures
including cost reductions and passing on increases in raw
material costs into product prices. In addition, the Kao Group is
conducting development of substitute raw materials for natural
fats and oils through research into advanced effective utilization
of non-edible raw materials. However, unexpectedly radical
changes in market conditions and pricing could have an impact
on the Kao Group’s business results and financial condition.
(6) Product Quality
The Kao Group designs and manufactures products from the
viewpoint of consumers, in compliance with related laws and
regulations and voluntary standards. In the development
stage prior to market launch, the Kao Group conducts
thorough safety testing and survey research to confirm the
safety of products. After market launch, the Kao Group works
to further improve quality by incorporating the opinions and
desires of consumers through its consumer communication
centers. However, the unanticipated occurrence of a serious
quality problem or concerns about product safety or reliability
resulting from new scientific knowledge would not only cause
difficulties for the relevant brand, but would also have a major
impact on the reputation of all of the Kao Group’s products.
This could have an impact on the Kao Group’s business
results and financial condition.
(7) Response to Natural Disasters, Accidents and
Other Incidents
To deal with earthquakes and other natural disasters, the
Kao Group has formulated disaster countermeasures for its
production facilities and primary offices and a business
continuity plan (BCP), and will continue to strengthen and
reinforce them in the future. However, the occurrence and
consequent damage of an earthquake on a scale exceeding
assumptions that hinder the supply of products to the market
due to problems in areas such as securing raw materials and
maintaining production, among other impediments, could
have a serious impact on the Kao Group’s business results
and financial condition. In addition, the emergence of major
changes in demand trends due to a worsening economic
environment associated with the earthquake could have a
serious impact on the Kao Group’s business results and
financial condition. Furthermore, the occurrence of an
explosion or fire at production facilities, information system
malfunction, problems at a supplier of raw materials,
dysfunction of social infrastructures such as electric power
and water, environmental pollution from harmful substances,
the spread of infectious disease, terrorism, political change,
riots and other incidents could hinder the supply of products
to the market. This could have a serious impact on the Kao
Group’s reputation, business results and financial condition.
(8) Currency Exchange Rate Fluctuations
Foreign currency-denominated transactions are affected by
changes in currency exchange rates. The Kao Group hedges
foreign exchange risk through various measures such as
settlement of transactions through foreign currency accounts,
foreign exchange contracts, and currency swaps to mitigate
the effect on business results. The Kao Group does not engage
in derivative transactions for the purpose of speculation.
However, because items on the financial statements of
overseas consolidated subsidiaries are translated into
Japanese yen, substantial variance in the exchange rate from
the expected rate at the time of conversion will have an impact
on the Kao Group’s business results and financial condition.
44 Kao Corporation Annual Report 2015
(9) Impact of Deferred Tax Assets and Impairment
The Kao Group records various tangible and intangible fixed
assets and deferred tax assets including assets used in the
course of business and goodwill incurred in corporate
acquisitions. The Kao Group may not generate the expected cash
flow due to divergence from planned future business results, a
decline in market value or other factors. This could have an impact
on the Kao Group’s business results and financial condition.
(10) Securing Human Capital
The Kao Group strives to secure diverse, superior human
capital to achieve its business goals globally. Human capital
with advanced expertise in areas such as research and
development, production technologies, marketing and sales
activities are indispensable in aiming for the Yoki-Monozukuri
(see note on page 12) that consumers support. However, an
inability to secure the necessary human capital due to
changes in employment conditions or other factors could have
an impact on the Kao Group’s business results and financial
condition.
(11) Compliance with Laws and Regulations
In the course of its business activities, the Kao Group must
comply with a variety of laws and regulations concerning
areas such as standards for product quality and safety, the
environment and chemical substances, as well as accounting
standards, tax law and regulations related to labor and
transactions. The Kao Group has constructed a compliance
system and strives to comply with all related laws and
regulations. However, a serious legal violation by the Kao
Group or by a consignee or other party could have an impact
on the Kao Group’s reputation, business results and financial
condition. Moreover, a change in current laws and regulations,
or new laws and regulations could restrict the Kao Group’s
business activities, require investment for compliance, or
otherwise affect the Kao Group. This could have an impact on
the Kao Group’s business results and financial condition.
(12) Information Management
The Kao Group possesses confidential information related to
matters including research and development, production,
marketing and sales, as well as the personal information of
numerous customers used for product development, sales
promotion and other purposes. The Kao Group conducts
thorough information management using guidelines for
handling information and implements appropriate security
measures for its information systems, including both
hardware and software. However, a leak of confidential or
personal information held by the Kao Group resulting from an
attack on its server, unlawful access, a computer virus or
other factor that exceeds expectations could have an impact
on the Kao Group’s reputation, business results and financial
condition.
(13) Litigation
The Kao Group conducts diverse businesses globally, and
various types of litigation may be brought against it. The result
of such litigation could have an impact on the Kao Group’s
business results and financial condition.
Kao Corporation Annual Report 2015 45
Management Discussion and Analysis
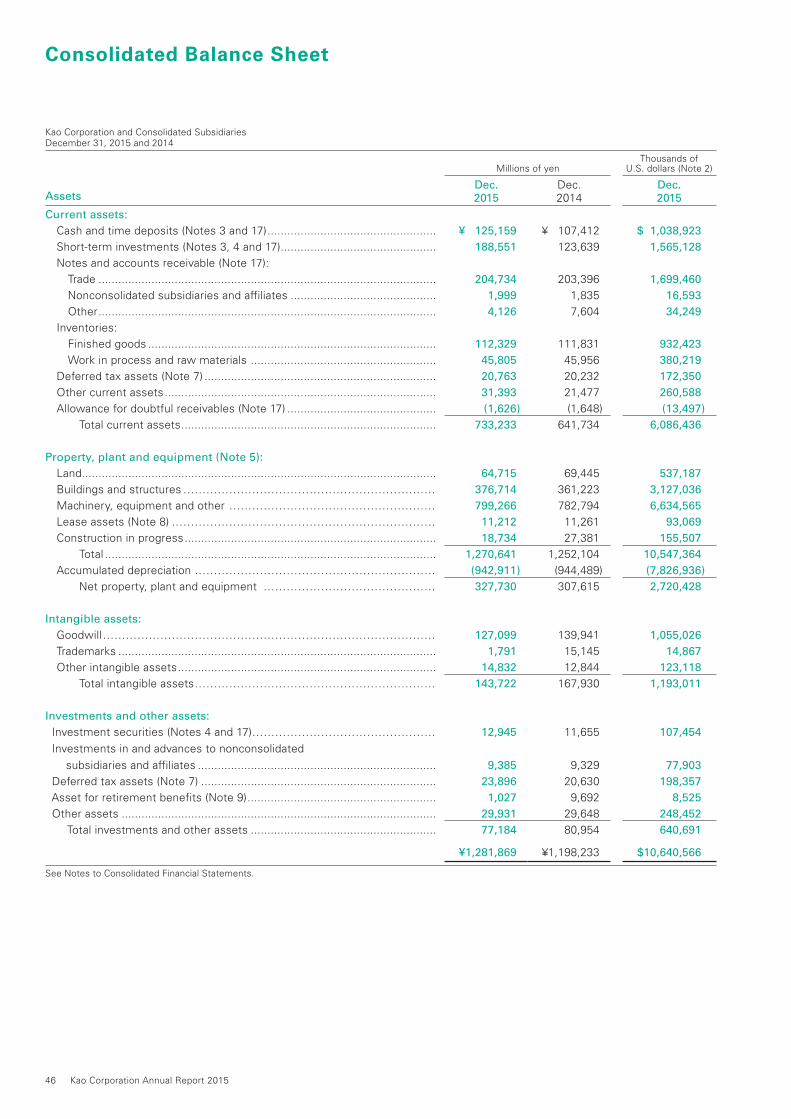
Kao Corporation and Consolidated SubsidiariesDecember 31, 2015 and 2014
Millions of yenThousands of
U.S. dollars (Note 2)
AssetsDec. 2015
Dec. 2014
Dec. 2015
Current assets:
Cash and time deposits (Notes 3 and 17) ................................................... ¥ 125,159 ¥ 107,412 $ 1,038,923
Short-term investments (Notes 3, 4 and 17)............................................... 188,551 123,639 1,565,128
Notes and accounts receivable (Note 17):
Trade ...................................................................................................... 204,734 203,396 1,699,460
Nonconsolidated subsidiaries and affiliates ............................................ 1,999 1,835 16,593
Other ...................................................................................................... 4,126 7,604 34,249
Inventories:
Finished goods ....................................................................................... 112,329 111,831 932,423
Work in process and raw materials ........................................................ 45,805 45,956 380,219
Deferred tax assets (Note 7) ...................................................................... 20,763 20,232 172,350
Other current assets .................................................................................. 31,393 21,477 260,588
Allowance for doubtful receivables (Note 17) ............................................. (1,626) (1,648) (13,497)
Total current assets ............................................................................. 733,233 641,734 6,086,436
Property, plant and equipment (Note 5):
Land........................................................................................................... 64,715 69,445 537,187
Buildings and structures ………………………………………………………… 376,714 361,223 3,127,036
Machinery, equipment and other ……………………………………………… 799,266 782,794 6,634,565
Lease assets (Note 8) …………………………………………………………… 11,212 11,261 93,069
Construction in progress ............................................................................ 18,734 27,381 155,507
Total .................................................................................................... 1,270,641 1,252,104 10,547,364
Accumulated depreciation ……………………………………………………… (942,911) (944,489) (7,826,936)
Net property, plant and equipment ……………………………………… 327,730 307,615 2,720,428
Intangible assets:
Goodwill …………………………………………………………………………… 127,099 139,941 1,055,026
Trademarks ................................................................................................ 1,791 15,145 14,867
Other intangible assets .............................................................................. 14,832 12,844 123,118
Total intangible assets ……………………………………………………… 143,722 167,930 1,193,011
Investments and other assets:
Investment securities (Notes 4 and 17)………………………………………… 12,945 11,655 107,454
Investments in and advances to nonconsolidated
subsidiaries and affiliates ........................................................................ 9,385 9,329 77,903
Deferred tax assets (Note 7) ....................................................................... 23,896 20,630 198,357
Asset for retirement benefits (Note 9) ......................................................... 1,027 9,692 8,525
Other assets ............................................................................................... 29,931 29,648 248,452
Total investments and other assets ........................................................ 77,184 80,954 640,691
¥1,281,869 ¥1,198,233 $10,640,566
See Notes to Consolidated Financial Statements.
Consolidated Balance Sheet
46 Kao Corporation Annual Report 2015
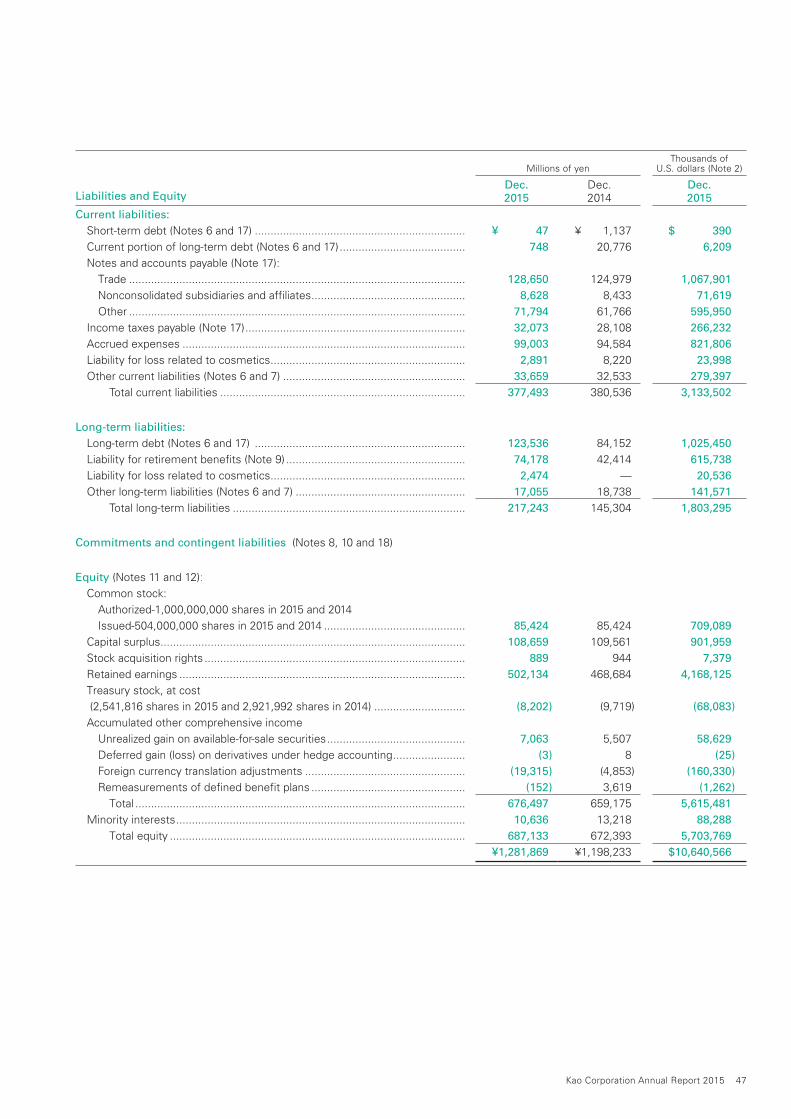
Millions of yenThousands of
U.S. dollars (Note 2)
Liabilities and EquityDec. 2015
Dec. 2014
Dec. 2015
Current liabilities:
Short-term debt (Notes 6 and 17) ................................................................... ¥ 47 ¥ 1,137 $ 390
Current portion of long-term debt (Notes 6 and 17) ........................................ 748 20,776 6,209
Notes and accounts payable (Note 17):
Trade ........................................................................................................... 128,650 124,979 1,067,901
Nonconsolidated subsidiaries and affiliates ................................................. 8,628 8,433 71,619
Other ........................................................................................................... 71,794 61,766 595,950
Income taxes payable (Note 17) ...................................................................... 32,073 28,108 266,232
Accrued expenses .......................................................................................... 99,003 94,584 821,806
Liability for loss related to cosmetics .............................................................. 2,891 8,220 23,998
Other current liabilities (Notes 6 and 7) .......................................................... 33,659 32,533 279,397
Total current liabilities .............................................................................. 377,493 380,536 3,133,502
Long-term liabilities:
Long-term debt (Notes 6 and 17) ................................................................... 123,536 84,152 1,025,450
Liability for retirement benefits (Note 9) ......................................................... 74,178 42,414 615,738
Liability for loss related to cosmetics .............................................................. 2,474 — 20,536
Other long-term liabilities (Notes 6 and 7) ...................................................... 17,055 18,738 141,571
Total long-term liabilities .......................................................................... 217,243 145,304 1,803,295
Commitments and contingent liabilities (Notes 8, 10 and 18)
Equity (Notes 11 and 12):
Common stock:
Authorized-1,000,000,000 shares in 2015 and 2014
Issued-504,000,000 shares in 2015 and 2014 ............................................. 85,424 85,424 709,089
Capital surplus ................................................................................................. 108,659 109,561 901,959
Stock acquisition rights ................................................................................... 889 944 7,379
Retained earnings ........................................................................................... 502,134 468,684 4,168,125
Treasury stock, at cost
(2,541,816 shares in 2015 and 2,921,992 shares in 2014) ............................. (8,202) (9,719) (68,083)
Accumulated other comprehensive income
Unrealized gain on available-for-sale securities ............................................ 7,063 5,507 58,629
Deferred gain (loss) on derivatives under hedge accounting ....................... (3) 8 (25)
Foreign currency translation adjustments ................................................... (19,315) (4,853) (160,330)
Remeasurements of defined benefit plans ................................................. (152) 3,619 (1,262)
Total ......................................................................................................... 676,497 659,175 5,615,481
Minority interests ............................................................................................ 10,636 13,218 88,288
Total equity .............................................................................................. 687,133 672,393 5,703,769
¥1,281,869 ¥1,198,233 $10,640,566
Kao Corporation Annual Report 2015 47
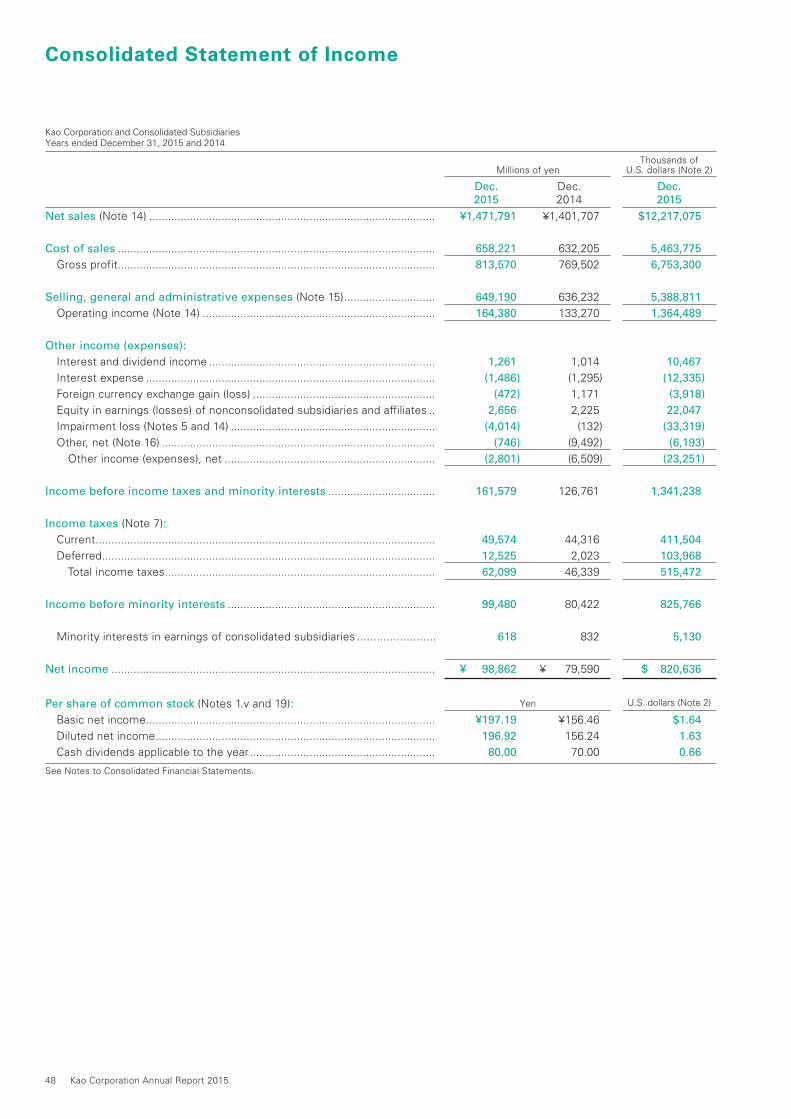
Consolidated Statement of Income
Kao Corporation and Consolidated SubsidiariesYears ended December 31, 2015 and 2014
Millions of yenThousands of
U.S. dollars (Note 2)
Dec. 2015
Dec. 2014
Dec. 2015
Net sales (Note 14) ........................................................................................... ¥1,471,791 ¥1,401,707 $12,217,075
Cost of sales ..................................................................................................... 658,221 632,205 5,463,775
Gross profit..................................................................................................... 813,570 769,502 6,753,300
Selling, general and administrative expenses (Note 15) ............................. 649,190 636,232 5,388,811
Operating income (Note 14) .......................................................................... 164,380 133,270 1,364,489
Other income (expenses):
Interest and dividend income ........................................................................ 1,261 1,014 10,467
Interest expense ............................................................................................ (1,486) (1,295) (12,335)
Foreign currency exchange gain (loss) .......................................................... (472) 1,171 (3,918)
Equity in earnings (losses) of nonconsolidated subsidiaries and affiliates .. 2,656 2,225 22,047
Impairment loss (Notes 5 and 14) ................................................................. (4,014) (132) (33,319)
Other, net (Note 16) ....................................................................................... (746) (9,492) (6,193)
Other income (expenses), net ................................................................... (2,801) (6,509) (23,251)
Income before income taxes and minority interests .................................. 161,579 126,761 1,341,238
Income taxes (Note 7):
Current ............................................................................................................ 49,574 44,316 411,504
Deferred.......................................................................................................... 12,525 2,023 103,968
Total income taxes...................................................................................... 62,099 46,339 515,472
Income before minority interests .................................................................. 99,480 80,422 825,766
Minority interests in earnings of consolidated subsidiaries ........................ 618 832 5,130
Net income ....................................................................................................... ¥ 98,862 ¥ 79,590 $ 820,636
Per share of common stock (Notes 1.v and 19): Yen U.S. dollars (Note 2)
Basic net income ............................................................................................ ¥197.19 ¥156.46 $1.64
Diluted net income ......................................................................................... 196.92 156.24 1.63
Cash dividends applicable to the year ........................................................... 80.00 70.00 0.66
See Notes to Consolidated Financial Statements.
48 Kao Corporation Annual Report 2015
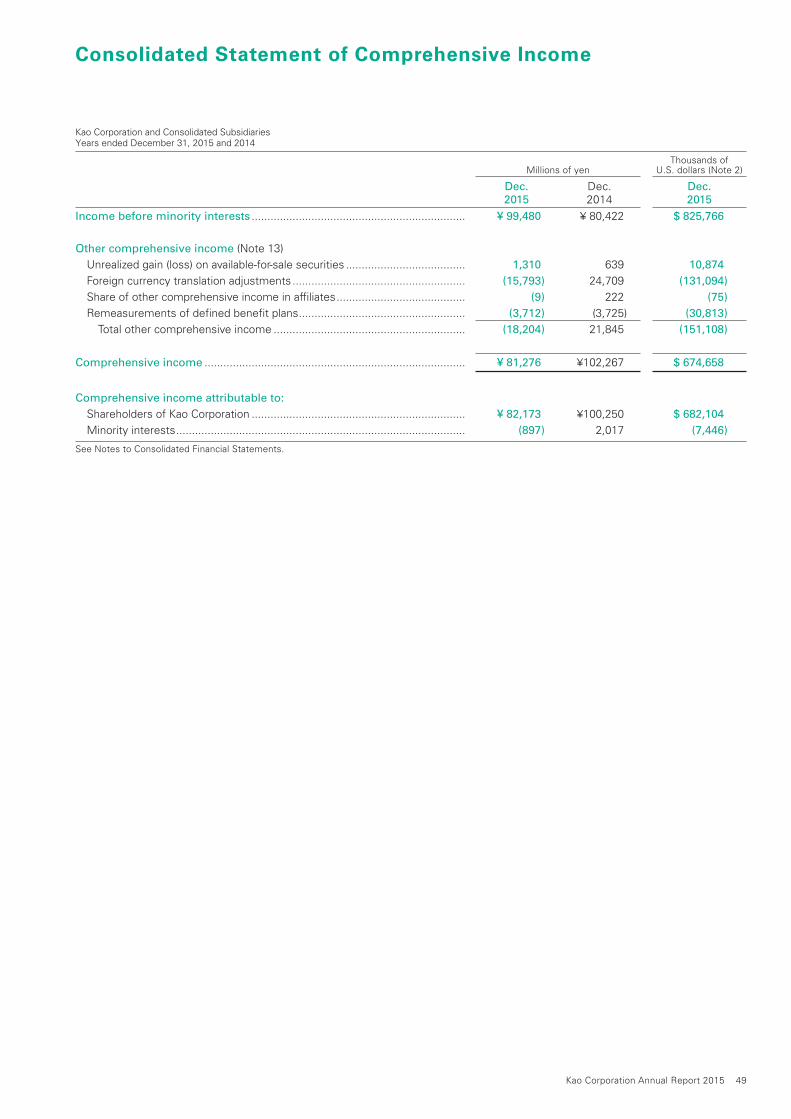
Consolidated Statement of Comprehensive Income
Kao Corporation and Consolidated SubsidiariesYears ended December 31, 2015 and 2014
Millions of yenThousands of
U.S. dollars (Note 2)
Dec. 2015
Dec. 2014
Dec. 2015
Income before minority interests .................................................................... ¥ 99,480 ¥ 80,422 $ 825,766
Other comprehensive income (Note 13)
Unrealized gain (loss) on available-for-sale securities ...................................... 1,310 639 10,874
Foreign currency translation adjustments ....................................................... (15,793) 24,709 (131,094)
Share of other comprehensive income in affiliates ......................................... (9) 222 (75)
Remeasurements of defined benefit plans ..................................................... (3,712) (3,725) (30,813)
Total other comprehensive income ............................................................. (18,204) 21,845 (151,108)
Comprehensive income ................................................................................... ¥ 81,276 ¥102,267 $ 674,658
Comprehensive income attributable to:
Shareholders of Kao Corporation .................................................................... ¥ 82,173 ¥100,250 $ 682,104
Minority interests ............................................................................................ (897) 2,017 (7,446)
See Notes to Consolidated Financial Statements.
Kao Corporation Annual Report 2015 49
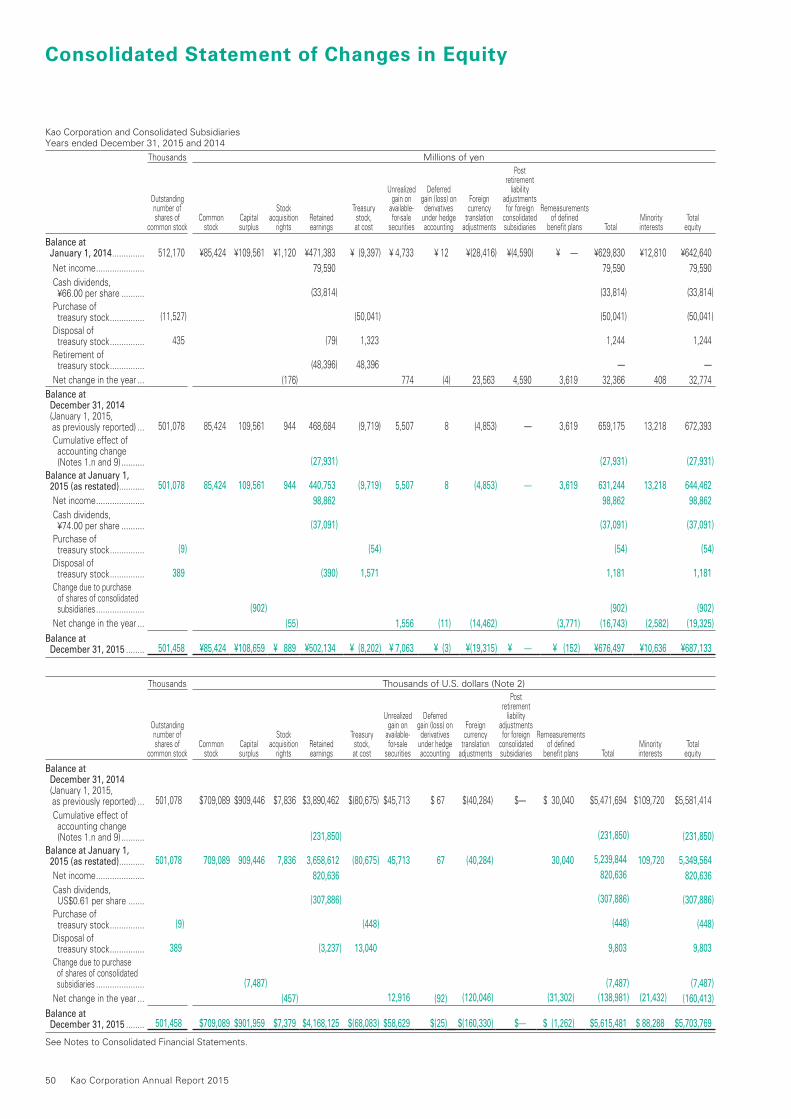
Consolidated Statement of Changes in Equity
Kao Corporation and Consolidated SubsidiariesYears ended December 31, 2015 and 2014
Thousands Millions of yen
Outstanding number of shares of
common stockCommon
stockCapital surplus
Stock acquisition
rightsRetained earnings
Treasury stock, at cost
Unrealized gain on
available-for-sale
securities
Deferred gain (loss) on derivatives
under hedge accounting
Foreign currency
translation adjustments
Post retirement
liability adjustments for foreign
consolidated subsidiaries
Remeasurements of defined
benefit plans TotalMinority interests
Total equity
Balance at January 1, 2014 .............. 512,170 ¥85,424 ¥109,561 ¥1,120 ¥471,383 ¥ (9,397) ¥ 4,733 ¥ 12 ¥(28,416) ¥(4,590) ¥ — ¥629,830 ¥12,810 ¥642,640 Net income ..................... 79,590 79,590 79,590 Cash dividends,
¥66.00 per share .......... (33,814) (33,814) (33,814) Purchase of
treasury stock ............... (11,527) (50,041) (50,041) (50,041) Disposal of
treasury stock ............... 435 (79) 1,323 1,244 1,244 Retirement of
treasury stock ............... (48,396) 48,396 — — Net change in the year ... (176) 774 (4) 23,563 4,590 3,619 32,366 408 32,774 Balance at December 31, 2014
(January 1, 2015, as previously reported) ... 501,078 85,424 109,561 944 468,684 (9,719) 5,507 8 (4,853) — 3,619 659,175 13,218 672,393
Cumulative effect of accounting change
(Notes 1.n and 9) .......... (27,931) (27,931) (27,931)Balance at January 1, 2015 (as restated) ........... 501,078 85,424 109,561 944 440,753 (9,719) 5,507 8 (4,853) — 3,619 631,244 13,218 644,462 Net income ..................... 98,862 98,862 98,862 Cash dividends,
¥74.00 per share .......... (37,091) (37,091) (37,091) Purchase of
treasury stock ............... (9) (54) (54) (54) Disposal of
treasury stock ............... 389 (390) 1,571 1,181 1,181 Change due to purchase
of shares of consolidated subsidiaries ..................... (902) (902) (902)
Net change in the year ... (55) 1,556 (11) (14,462) (3,771) (16,743) (2,582) (19,325) Balance at December 31, 2015 ........ 501,458 ¥85,424 ¥108,659 ¥ 889 ¥502,134 ¥ (8,202) ¥ 7,063 ¥ (3) ¥(19,315) ¥ — ¥ (152) ¥676,497 ¥10,636 ¥687,133
Thousands Thousands of U.S. dollars (Note 2)
Outstanding number of shares of
common stockCommon
stockCapital surplus
Stock acquisition
rightsRetained earnings
Treasury stock, at cost
Unrealized gain on
available-for-sale
securities
Deferred gain (loss) on derivatives
under hedge accounting
Foreign currency
translation adjustments
Post retirement
liability adjustments for foreign
consolidated subsidiaries
Remeasurements of defined
benefit plans TotalMinority interests
Total equity
Balance at December 31, 2014
(January 1, 2015, as previously reported) ... 501,078 $709,089 $909,446 $7,836 $3,890,462 $(80,675) $45,713 $ 67 $(40,284) $— $ 30,040 $5,471,694 $109,720 $5,581,414
Cumulative effect of accounting change
(Notes 1.n and 9) .......... (231,850) (231,850) (231,850)Balance at January 1, 2015 (as restated) ........... 501,078 709,089 909,446 7,836 3,658,612 (80,675) 45,713 67 (40,284) 30,040 5,239,844 109,720 5,349,564 Net income ..................... 820,636 820,636 820,636 Cash dividends, US$0.61 per share ....... (307,886) (307,886) (307,886) Purchase of treasury stock ............... (9) (448) (448) (448) Disposal of
treasury stock ............... 389 (3,237) 13,040 9,803 9,803 Change due to purchase
of shares of consolidated subsidiaries ..................... (7,487) (7,487) (7,487)
Net change in the year ... (457) 12,916 (92) (120,046) (31,302) (138,981) (21,432) (160,413)Balance at December 31, 2015 ........ 501,458 $709,089 $901,959 $7,379 $4,168,125 $(68,083) $58,629 $(25) $(160,330) $— $ (1,262) $5,615,481 $ 88,288 $5,703,769
See Notes to Consolidated Financial Statements.
50 Kao Corporation Annual Report 2015
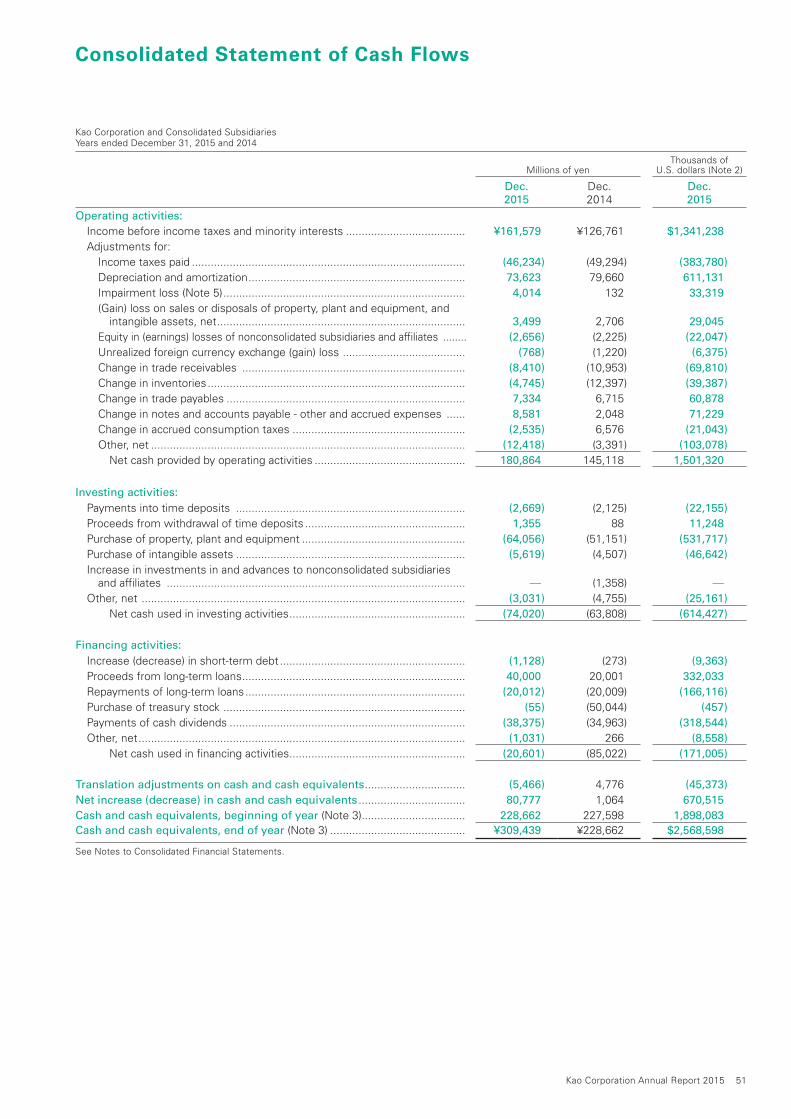
Consolidated Statement of Cash Flows
Kao Corporation and Consolidated Subsidiaries Years ended December 31, 2015 and 2014
Millions of yenThousands of
U.S. dollars (Note 2)
Dec. 2015
Dec. 2014
Dec. 2015
Operating activities:
Income before income taxes and minority interests ...................................... ¥161,579 ¥126,761 $1,341,238
Adjustments for:
Income taxes paid ....................................................................................... (46,234) (49,294) (383,780)
Depreciation and amortization ..................................................................... 73,623 79,660 611,131
Impairment loss (Note 5) ............................................................................. 4,014 132 33,319
(Gain) loss on sales or disposals of property, plant and equipment, and intangible assets, net ............................................................................... 3,499 2,706 29,045
Equity in (earnings) losses of nonconsolidated subsidiaries and affiliates ........ (2,656) (2,225) (22,047)
Unrealized foreign currency exchange (gain) loss ....................................... (768) (1,220) (6,375)
Change in trade receivables ....................................................................... (8,410) (10,953) (69,810)
Change in inventories .................................................................................. (4,745) (12,397) (39,387)
Change in trade payables ............................................................................ 7,334 6,715 60,878
Change in notes and accounts payable - other and accrued expenses ...... 8,581 2,048 71,229
Change in accrued consumption taxes ....................................................... (2,535) 6,576 (21,043)
Other, net .................................................................................................... (12,418) (3,391) (103,078)
Net cash provided by operating activities ................................................ 180,864 145,118 1,501,320
Investing activities:
Payments into time deposits ......................................................................... (2,669) (2,125) (22,155)
Proceeds from withdrawal of time deposits ................................................... 1,355 88 11,248
Purchase of property, plant and equipment .................................................... (64,056) (51,151) (531,717)
Purchase of intangible assets ......................................................................... (5,619) (4,507) (46,642)
Increase in investments in and advances to nonconsolidated subsidiaries and affiliates ............................................................................................... — (1,358) —
Other, net ....................................................................................................... (3,031) (4,755) (25,161)
Net cash used in investing activities ........................................................ (74,020) (63,808) (614,427)
Financing activities:
Increase (decrease) in short-term debt ........................................................... (1,128) (273) (9,363)
Proceeds from long-term loans ....................................................................... 40,000 20,001 332,033
Repayments of long-term loans ...................................................................... (20,012) (20,009) (166,116)
Purchase of treasury stock ............................................................................. (55) (50,044) (457)
Payments of cash dividends ........................................................................... (38,375) (34,963) (318,544)
Other, net ........................................................................................................ (1,031) 266 (8,558)
Net cash used in financing activities ........................................................ (20,601) (85,022) (171,005)
Translation adjustments on cash and cash equivalents ................................ (5,466) 4,776 (45,373)
Net increase (decrease) in cash and cash equivalents .................................. 80,777 1,064 670,515
Cash and cash equivalents, beginning of year (Note 3)................................. 228,662 227,598 1,898,083 Cash and cash equivalents, end of year (Note 3) ........................................... ¥309,439 ¥228,662 $2,568,598
See Notes to Consolidated Financial Statements.
Kao Corporation Annual Report 2015 51
Kao Corporation and Consolidated Subsidiaries Years ended December 31, 2015 and 2014
a) Basis of presenting consolidated financial statementsThe accompanying consolidated financial statements have been prepared in accordance with the provisions set forth in the Japanese Financial Instruments and Exchange Law and its related accounting regulations, and in accordance with accounting principles generally accepted in Japan (“Japanese GAAP”), which are different in certain respects as to application and disclosure requirements of International Financial Reporting Standards. In preparing the consolidated financial statements, certain reclassifications and rearrangements have been made to the consolidated financial statements issued in Japan in order to present them in a form that is more familiar to readers outside Japan. Certain financial statement items of the previous fiscal year were reclassified to conform to the presentation for the current fiscal year. The preparation of financial statements in accordance with generally accepted accounting principles requires management to make estimates and assumptions that affect the reported amounts of assets, liabilities and disclosure of contingent assets and liabilities at the date of the financial statements and the reported amounts of revenues and expenses during the reporting period. Actual results could differ from these estimates.
b) Consolidation and accounting for investments in nonconsolidated subsidiaries and affiliates The accompanying consolidated financial statements include the accounts of Kao Corporation (the “Company”) and its significant subsidiaries (collectively, the “Companies"). Investments in most of the nonconsolidated subsidiaries and affiliates over which the Companies have the ability to exercise significant influence (mainly 20-50 percent owned companies) are accounted for using the equity method. Under the control and influence concepts, companies in which the parent company and/or its consolidated subsidiaries, directly or indirectly, are able to exercise control over operations are fully consolidated, and other companies over which the Company and/or its consolidated subsidiaries have the ability to exercise significant influence are accounted for using the equity method. Investments in the remaining subsidiaries and affiliates are stated at cost except for write-downs recorded for the value of investments that have been permanently impaired. If the equity method of accounting had been applied to these investments, the effect on the accompanying consolidated financial statements would not be material. All significant intercompany balances and transactions have been eliminated in consolidation. All material unrealized profit included in assets resulting from transactions within the Companies is eliminated. The excess of cost of investments in the subsidiaries and affiliates over the fair value of the net assets of the acquired subsidiary and affiliate at the dates of acquisition, consolidation goodwill, is being amortized over an estimated period not exceeding 20 years.
c) Unification of accounting policies applied to foreign subsidiaries for the consolidated financial statementsThe accounting standard for unification of accounting policies applied to foreign subsidiaries for the consolidated financial statements requires: (1) the accounting policies and procedures applied to a parent company and its subsidiaries for similar
transactions and events under similar circumstances should, in principle, be unified for the preparation of the consolidated financial statements, (2) financial statements prepared by foreign subsidiaries in accordance with either International Financial Reporting Standards or the generally accepted accounting principles in the United States of America tentatively may be used for the consolidation process, (3) however, the following items should be adjusted in the consolidation process so that net income is accounted for in accordance with Japanese GAAP, unless they are not material: 1) Amortization of goodwill 2) Scheduled amortization of actuarial gain or loss of pensions that has been recorded in equity through other comprehensive income 3) Expensing capitalized development costs of R&D 4) Cancellation of the fair value model of accounting for property, plant, and equipment and investment properties and incorporation of the cost model of accounting 5) Exclusion of minority interests from net income, if contained in net income
d) Unification of accounting policies applied to foreign affiliated companies for the equity methodThe accounting standard requires adjustments to be made to conform the affiliate’s accounting policies for similar transactions and events under similar circumstances to those of the parent company when the affiliate’s financial statements are used in applying the equity method unless it is impracticable to determine such adjustments. In addition, financial statements prepared by foreign affiliated companies in accordance with either International Financial Reporting Standards or the generally accepted accounting principles in the United States of America tentatively may be used in applying the equity method if the following items are adjusted so that net income is accounted for in accordance with Japanese GAAP, unless they are not material: 1) Amortization of goodwill 2) Scheduled amortization of actuarial gain or loss on pensions
that has been recorded in equity through other comprehensive income
3) Expensing capitalized development costs of R&D 4) Cancellation of the fair value model of accounting for property,
plant, and equipment and investment properties and incorporation of the cost model of accounting
5) Exclusion of minority interests from net income, if contained in net income
e) Business combinationsThe accounting standard for business combinations requires companies to account for business combinations in accordance with the following policies: 1) Business combinations should be accounted for by the
purchase method except combinations of entities under common control and joint ventures.
2) In-process research and development (IPR&D) acquired in the business combination should be capitalized as an intangible asset.
3) The acquirer should recognize a bargain purchase gain in profit or loss immediately on the acquisition date after reassessing and confirming that all of the assets acquired and all of the liabilities assumed have been identified after a review of the procedures used in the purchase price allocation.
1 Summary of Significant Accounting Policies
Notes to Consolidated Financial Statements
52 Kao Corporation Annual Report 2015
Under the accounting standard for business divestitures, in a business divestiture where the interests of the investor no longer continue and the investment is settled, the difference between the fair value of the consideration received for the transferred business and the book value of net assets transferred to the separated business is recognized as a gain or loss on business divestiture in the statement of income. In a business divestiture where the interests of the investor continue and the investment is not settled, no such gain or loss on business divestiture is recognized.
The “Accounting Standard for Business Combinations” (ASBJ Statement No. 21 issued by the Accounting Standards Board of Japan (ASBJ), in September 2013, hereinafter “Business Combinations Accounting Standard”), “Accounting Standard for Consolidated Financial Statements” (ASBJ Statement No. 22 issued in September 2013, hereinafter “Consolidation Accounting Standard”) and “Accounting Standard for Business Divestitures” (ASBJ Statement No. 7 issued in September 2013, hereinafter “Business Divestitures Accounting Standard”) could be adopted as of the beginning of fiscal years starting on or after April 1, 2014. Accordingly, the Company has early adopted these accounting standards (except as provided in Article 39 of the Consolidation Accounting Standard) as of the fiscal year ended December 31, 2015. Under these accounting standards, the Company records the difference caused by changes in the Company’s equity shares in subsidiaries that it continues to control as capital surplus and records acquisition-related expenses as expenses during the fiscal year in which the expenses were incurred. With regard to business combinations conducted on or after the beginning of the fiscal year ended December 31, 2015, the Company has changed its accounting method to reflect the revised allocation of acquisition costs arising from settlement of provisional accounting treatment in the quarterly consolidated financial statement in which the business combination occurs. The Company has adopted these accounting standards as of the beginning of the fiscal year ended December 31, 2015 and has applied them thereafter in accordance with the transitional handling set forth in Article 58-2 (4) of the Business Combinations Accounting Standard, Article 44-5 (4) of the Consolidation Accounting Standard and Article 57-4 (4) of the Business Divestitures Accounting Standard. The impact of these changes on the consolidated financial statements was immaterial.
f) Cash equivalents For purposes of the consolidated statement of cash flows, cash equivalents are short-term investments that are readily convertible into cash and that are exposed to insignificant risk of changes in value. Cash equivalents include time deposits, commercial paper, investment trusts in bonds and receivables that are represented as short-term investments, all of which mature or become due within three months of the date of acquisition.
g) Allowance for doubtful receivablesTo provide for potential loss on trade receivables, loans and other receivables, the Company and its domestic consolidated subsidiaries provide an allowance for the expected amount of unrecoverable receivables.
Allowances for ordinary debt are computed based on the historical rate of default. For specified receivables, such as those where recovery is doubtful, the Company and its domestic consolidated subsidiaries consider the likelihood of recovery on an individual basis and record an allowance for the amount of debt expected to be unrecoverable. Foreign consolidated subsidiaries mainly record an allowance for the amount of specified receivables expected to be unrecoverable.
h) Inventories The accounting standard for measurement of inventories requires that inventories held for sale in the ordinary course of business be measured at the lower of cost or net selling value, which is defined as the selling price less additional estimated manufacturing costs and estimated direct selling expenses. The replacement cost may be used in place of the net selling value, if appropriate. Cost of inventories is determined principally by the average method. The cost of inventories held by certain foreign consolidated subsidiaries is determined by the first-in, first-out method.
i) Short-term investments and investment securitiesShort-term investments and investment securities are classified and accounted for, depending on management's intent, as follows: i) held-to-maturity debt securities, which are expected to be held to maturity with the positive intent and ability to hold to maturity, are reported at amortized cost and ii) available-for-sale securities, which are not classified as the aforementioned securities, are reported at fair value, with unrealized gains and losses, net of applicable taxes, reported in a separate component of equity. Non-marketable available-for-sale securities are stated at cost determined by the moving-average method. For other than temporary declines in fair value, investment securities are reduced to net realizable value by a charge to income.
j) Property, plant and equipmentProperty, plant and equipment are stated at cost. Depreciation of property, plant and equipment is computed under the straight-line method over the estimated useful lives, principally ranging from 21 to 35 years for buildings and structures and 7 or 9 years for machinery and equipment.
k) Intangible assetsGoodwill and trademarks are amortized on a straight-line basis over 15 or 20 years, and 10 years, respectively.
l) Long-lived assetsThe Companies review their long-lived assets for impairment whenever events or changes in circumstances indicate the carrying amount of an asset or asset group may not be recoverable. An impairment loss would be recognized if the carrying amount of an asset or asset group exceeds the sum of the undiscounted future cash flows expected to result from the continued use and eventual disposition of the asset or asset group. The impairment loss would be measured as the amount by which the carrying amount of the asset exceeds its recoverable amount, which is the higher of the discounted cash flows from the continued use and eventual disposition of the asset or the net selling price at disposition.
Kao Corporation Annual Report 2015 53
m) Liability for loss related to cosmeticsTo provide for payment of compensation-related and other expenses, the estimated substantive amount of actual loss related to cosmetics as of the end of the fiscal year is recorded.
n) Retirement and pension plansThe Company and most domestic consolidated subsidiaries have a cash balance plan and a defined contribution pension plan covering substantially all of their employees. The cash balance plan is linked to market interest rates and treated as a defined benefit plan. The pension plan also covers employees of certain nonconsolidated subsidiaries and affiliates in Japan. In addition, these companies may pay an early retirement allowance to employees who retire early. Certain domestic consolidated subsidiaries have a defined benefit plan that provides for a lump-sum payment to terminated employees. The subsidiaries may pay an additional lump-sum payment that is not subject to actuarial calculations under the accounting standard for retirement benefits. Certain foreign subsidiaries have defined contribution plans and/or defined benefit plans. Some of these foreign subsidiaries apply the “corridor approach” in calculating actuarial gain or loss. Certain foreign subsidiaries also have local employees’ retirement benefit plans and provide for the amount to recognize the liability for these employees’ retirement benefits, primarily determined on an actuarial basis. The unrecognized transitional obligation, the unrecognized net actuarial gain or loss and the unrecognized prior service cost are being amortized over 15, 10 and 15 years, respectively. These amortizations are recognized in cost of sales and selling, general and administrative expenses in the consolidated statement of income. In May 2012, the ASBJ issued ASBJ Statement No. 26, “Accounting Standard for Retirement Benefits” and ASBJ Guidance No. 25, “Guidance on Accounting Standard for Retirement Benefits”, which replaced the accounting standard for retirement benefits that had been issued by the Business Accounting Council in 1998 with an effective date of April 1, 2000, and the other related practical guidance, and were followed by partial amendments from time to time through 2009. Major changes are as follows:
(a) Under the revised accounting standard, actuarial gains and losses and past service costs that are yet to be recognized in profit or loss are recognized within equity (accumulated other comprehensive income), after adjusting for tax effects, and any resulting deficit or surplus is recognized as a liability (liability for retirement benefits) or asset (asset for retirement benefits).
(b) The revised accounting standard does not change how to recognize actuarial gains and losses and past service costs in profit or loss. Those amounts are recognized in profit or loss over a certain period no longer than the expected average remaining service period of the employees. However, actuarial gains and losses and past service costs that arose in the current period and have not yet been recognized in profit or loss are included in other comprehensive income, and actuarial gains and losses and past service costs that were recognized in other comprehensive income in prior periods and then recognized in profit or loss in the current period shall be treated as reclassification adjustments.
(c) The revised accounting standard also made certain amendments relating to the method of attributing expected benefit to periods and relating to the discount rate and expected future salary increases.
The revised accounting standard and guidance for (a) and (b) above are effective for the end of annual periods beginning on or after April 1, 2013, and for (c) above are effective for the beginning of annual periods beginning on or after April 1, 2014, or for the beginning of annual periods beginning on or after April 1, 2015, subject to certain disclosure in March 2015, both with earlier application being permitted from the beginning of annual periods beginning on or after April 1, 2013. However, no retrospective application of this accounting standard to consolidated financial statements in prior periods is required.
The Company applied the revised accounting standard and the guidance for (a) and (b) above from the fiscal year ended December 31, 2014. Furthermore, the Company applied the revised accounting standard and guidance for (c) above from the beginning of the fiscal year ended December 31, 2015, as provided in the main clause of Article 35 of the Retirement Benefits Accounting Standard and the main clause of Article 67 of the Retirement Benefits Guidance, and revised the methods for calculating retirement benefit obligations and service costs as follows. The method for attributing projected benefits to periods changed from the straight-line basis to the benefit formula basis. In addition, determination of the discount rate changed from a method based on the number of years for the underlying obligations approximating the average remaining years of service of the eligible employees to a method that uses several discount rates that are set for each expected retirement benefit payment period. In accordance with the transitional handling set forth in Article 37 of the Retirement Benefits Accounting Standard, the effect associated with the change in the method of calculating retirement benefit obligations and service costs was recognized by adjusting retained earnings at the beginning of the fiscal year ended December 31, 2015. As a result, liability for retirement benefits increased by ¥32,906 million (US$273,146 thousand), asset for retirement benefits decreased by ¥9,692 million (US$80,452 thousand) and retained earnings decreased by ¥27,931 million (US$231,850 thousand) at the beginning of the fiscal year ended December 31, 2015. The effect of this change on operating income and income before income taxes and minority interests for the fiscal year was immaterial. Net worth per share increased by ¥55.70 (US$0.46). The effect of this change on net income per share and diluted net income per share for the fiscal year was immaterial.
o) Asset retirement obligationsThe accounting standard for asset retirement obligations defines an asset retirement obligation as a legal obligation imposed either by law or contract that results from the acquisition, construction, development and the normal operation of a tangible fixed asset and is associated with the retirement of such tangible fixed asset. The asset retirement obligation is recognized as the sum of the discounted cash flows required for the future asset retirement and is recorded in the period in which the obligation is incurred if a reasonable estimate can be made. If a reasonable estimate of the asset retirement obligation cannot be made in the period the
54 Kao Corporation Annual Report 2015
asset retirement obligation is incurred, the liability should be recognized when a reasonable estimate of asset retirement obligation can be made. Upon initial recognition of a liability for an asset retirement obligation, an asset retirement cost is capitalized by increasing the carrying amount of the related fixed asset by the amount of the liability. The asset retirement cost is subsequently allocated to expense through depreciation over the remaining useful life of the asset. Over time, the liability is accreted to its present value each period. Any subsequent revisions to the timing or the amount of the original estimate of undiscounted cash flows are reflected as an increase or a decrease in the carrying amount of the liability and the capitalized amount of the related asset retirement cost.
p) Stock optionsThe accounting standard for stock options requires companies to recognize compensation expense for employee stock options based on the fair value at the date of grant and over the vesting period as consideration for receiving goods or services. The standard also requires companies to account for stock options granted to non-employees based on the fair value of either the stock option or the goods or services received. In the balance sheet, the stock option is presented as a stock acquisition right as a separate component of equity until exercised. The standard covers equity-settled, share-based payment transactions, but does not cover cash-settled, share-based payment transactions. In addition, the standard allows unlisted companies to measure options at their intrinsic value if they cannot reliably estimate fair value.
q) Leases The accounting standard for lease transactions requires that all finance lease transactions should be capitalized to recognize lease assets and lease obligations in the balance sheet. All other leases are accounted for as operating leases.
r) Income taxes The Companies provide for income taxes applicable to all items included in the consolidated statement of income regardless of when such taxes are payable. Income taxes based on temporary differences between tax and financial reporting purposes are reflected as deferred income taxes in the consolidated financial statements using the asset and liability method. The Company and certain subsidiaries file tax returns under the consolidated taxation system, which allows tax payments to be based on the consolidated profits or losses.
s) Foreign currency transactionsAll short-term and long-term monetary receivables and payables denominated in foreign currencies are translated into Japanese yen at the exchange rates at the balance sheet date. The foreign exchange gains and losses from translation are recognized in the consolidated statement of income to the extent that they are not hedged by foreign exchange derivatives.
t) Foreign currency financial statements The balance sheet accounts of the consolidated foreign subsidiaries are translated into Japanese yen at the current exchange rate as of the balance sheet date except for equity, which is translated at the historical rate. Differences arising from such translation are shown as “Foreign currency translation
adjustments” in a separate component of equity. Revenue and expense accounts of the consolidated foreign subsidiaries are translated into Japanese yen at the average exchange rate.
u) Derivatives and hedging activitiesThe Companies use derivative financial instruments to manage their exposures to fluctuations in foreign exchange and interest rates. Foreign exchange forward contracts, foreign currency swaps and interest rate swaps are utilized by the Companies to reduce foreign currency exchange and interest rate risks. The Companies do not enter into derivatives for trading purposes or speculative purposes. Derivative financial instruments and foreign currency transactions are classified and accounted for as follows: a) all derivatives are recognized as either assets or liabilities and measured at fair value, and gains or losses on derivative transactions are recognized in the consolidated statement of income, and b) for derivatives used for hedging purposes, if derivatives qualify for hedge accounting because of high correlation and effectiveness between the hedging instruments and the hedged items, gains or losses on derivatives are deferred until maturity of the hedged transactions. Short-term and long-term loan receivables denominated in foreign currencies, for which foreign exchange forward contracts or foreign currency swaps are used to hedge the foreign currency fluctuations, are translated at the contracted rate if the forward contracts or the swap contracts qualify for specific hedge accounting. The interest rate swaps which qualify for hedge accounting and meet specific matching criteria are not remeasured at market value but the differential paid or received under the swap agreements is recognized and included in interest expense or income as incurred.
v) Per share informationBasic net income per share is computed by dividing net income available to common shareholders by the weighted-average number of common shares outstanding for the period, retroactively adjusted for stock splits. Diluted net income per share of common stock reflects the potential dilution that could occur if securities or other contracts to issue common stock were converted or exercised into common stock or resulted in the issuance of common stock. Cash dividends per share presented in the accompanying consolidated statement of income are dividends applicable to the respective years including dividends to be paid after the end of the year.
w) Accounting changes and error correctionsThe accounting standard for accounting changes and error corrections requires the following: 1) Changes in Accounting Policies
When a new accounting policy is applied following revision of an accounting standard, the new policy is applied retrospectively unless the revised accounting standard includes specific transitional provisions, in which case the entity shall comply with the specific transitional provisions.
2) Changes in PresentationWhen the presentation of financial statements is changed, prior period financial statements are reclassified in accordance with the new presentation.
Kao Corporation Annual Report 2015 55
Notes to Consolidated Financial Statements
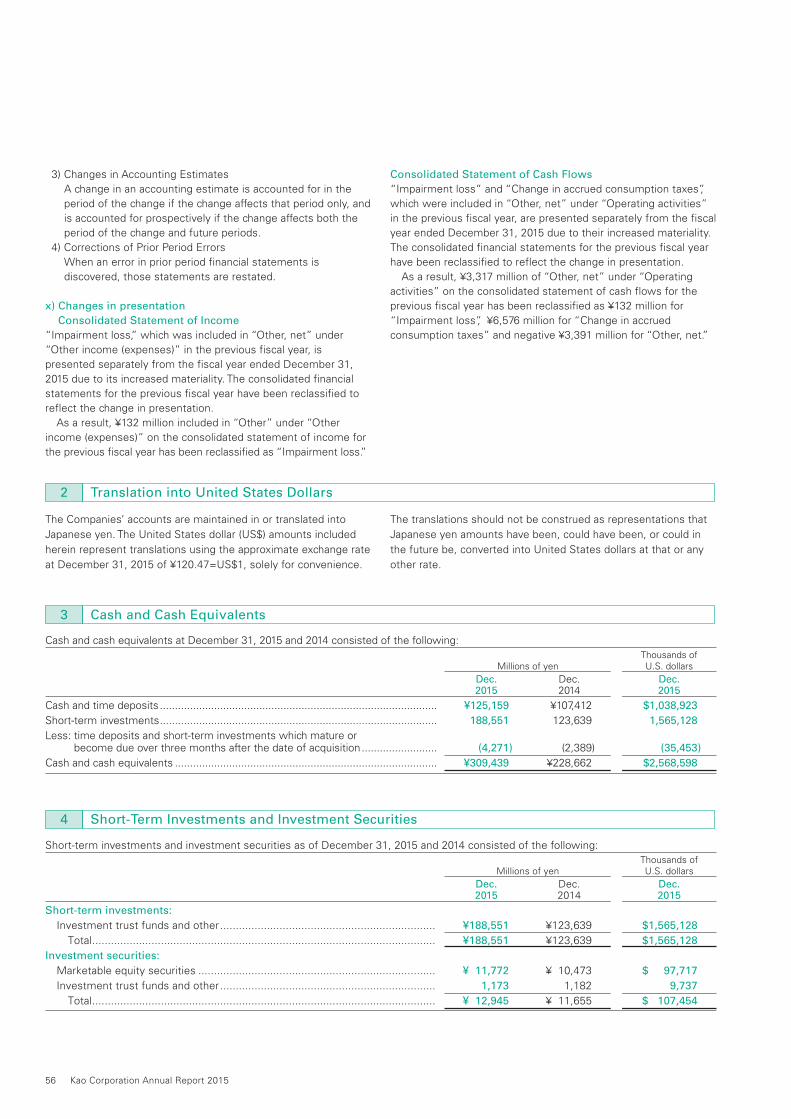
Short-term investments and investment securities as of December 31, 2015 and 2014 consisted of the following: Thousands of Millions of yen U.S. dollars
Dec. Dec. Dec. 2015 2014 2015
Short-term investments:
Investment trust funds and other ..................................................................... ¥188,551 ¥123,639 $1,565,128
Total .............................................................................................................. ¥188,551 ¥123,639 $1,565,128
Investment securities:
Marketable equity securities ............................................................................ ¥ 11,772 ¥ 10,473 $ 97,717
Investment trust funds and other ..................................................................... 1,173 1,182 9,737
Total .............................................................................................................. ¥ 12,945 ¥ 11,655 $ 107,454
4 Short-Term Investments and Investment Securities
The Companies’ accounts are maintained in or translated into
Japanese yen. The United States dollar (US$) amounts included
herein represent translations using the approximate exchange rate
at December 31, 2015 of ¥120.47=US$1, solely for convenience.
The translations should not be construed as representations that
Japanese yen amounts have been, could have been, or could in
the future be, converted into United States dollars at that or any
other rate.
3) Changes in Accounting EstimatesA change in an accounting estimate is accounted for in the period of the change if the change affects that period only, and is accounted for prospectively if the change affects both the period of the change and future periods.
4) Corrections of Prior Period ErrorsWhen an error in prior period financial statements is discovered, those statements are restated.
x) Changes in presentation Consolidated Statement of Income“Impairment loss,” which was included in “Other, net” under “Other income (expenses)” in the previous fiscal year, is presented separately from the fiscal year ended December 31, 2015 due to its increased materiality. The consolidated financial statements for the previous fiscal year have been reclassified to reflect the change in presentation. As a result, ¥132 million included in “Other” under “Other income (expenses)” on the consolidated statement of income for the previous fiscal year has been reclassified as “Impairment loss.”
Consolidated Statement of Cash Flows“Impairment loss” and “Change in accrued consumption taxes”, which were included in “Other, net” under “Operating activities” in the previous fiscal year, are presented separately from the fiscal year ended December 31, 2015 due to their increased materiality. The consolidated financial statements for the previous fiscal year have been reclassified to reflect the change in presentation. As a result, ¥3,317 million of “Other, net” under “Operating activities” on the consolidated statement of cash flows for the previous fiscal year has been reclassified as ¥132 million for “Impairment loss”, ¥6,576 million for “Change in accrued consumption taxes” and negative ¥3,391 million for “Other, net.”
2 Translation into United States Dollars
3 Cash and Cash Equivalents
Cash and cash equivalents at December 31, 2015 and 2014 consisted of the following: Thousands of Millions of yen U.S. dollars
Dec. Dec. Dec. 2015 2014 2015
Cash and time deposits ............................................................................................ ¥125,159 ¥107,412 $1,038,923
Short-term investments ............................................................................................ 188,551 123,639 1,565,128
Less: time deposits and short-term investments which mature or become due over three months after the date of acquisition ......................... (4,271) (2,389) (35,453)
Cash and cash equivalents ....................................................................................... ¥309,439 ¥228,662 $2,568,598
56 Kao Corporation Annual Report 2015
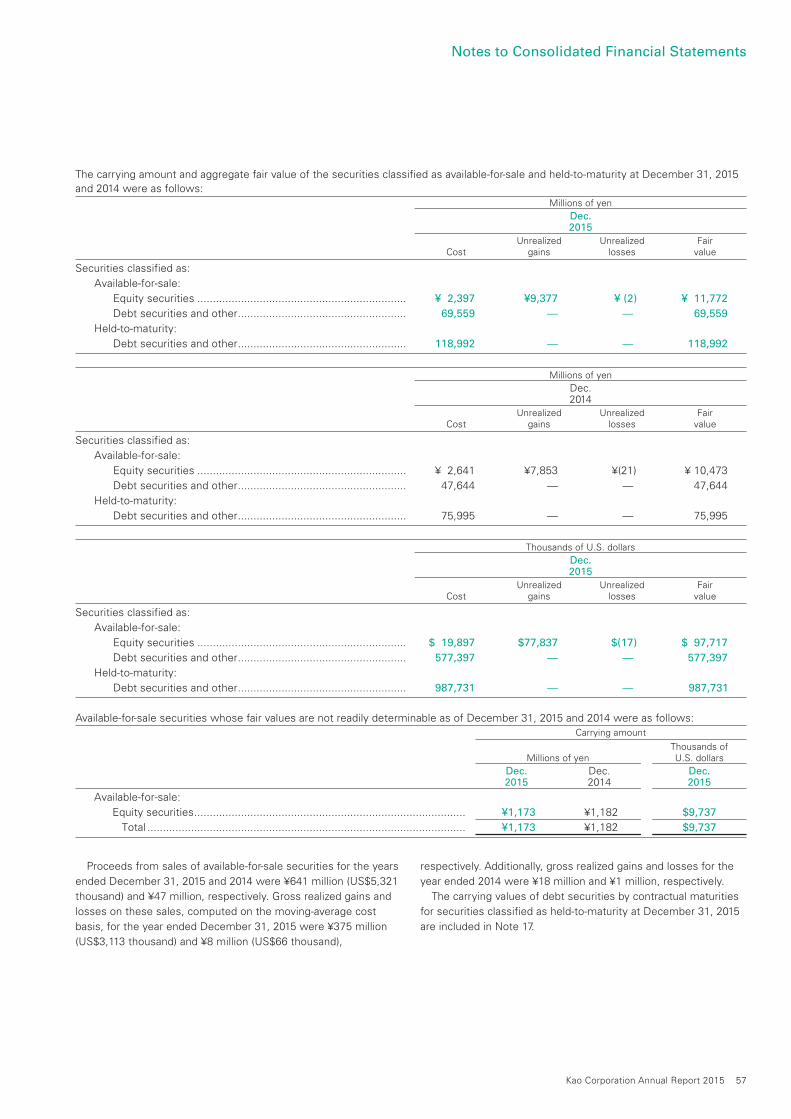
Proceeds from sales of available-for-sale securities for the years
ended December 31, 2015 and 2014 were ¥641 million (US$5,321
thousand) and ¥47 million, respectively. Gross realized gains and
losses on these sales, computed on the moving-average cost
basis, for the year ended December 31, 2015 were ¥375 million
(US$3,113 thousand) and ¥8 million (US$66 thousand),
respectively. Additionally, gross realized gains and losses for the
year ended 2014 were ¥18 million and ¥1 million, respectively.
The carrying values of debt securities by contractual maturities
for securities classified as held-to-maturity at December 31, 2015
are included in Note 17.
The carrying amount and aggregate fair value of the securities classified as available-for-sale and held-to-maturity at December 31, 2015 and 2014 were as follows: Millions of yen
Dec. 2015 Unrealized Unrealized Fair Cost gains losses value
Securities classified as:
Available-for-sale:
Equity securities ................................................................... ¥ 2,397 ¥9,377 ¥ (2) ¥ 11,772
Debt securities and other ...................................................... 69,559 — — 69,559
Held-to-maturity:
Debt securities and other ...................................................... 118,992 — — 118,992
Millions of yen
Dec. 2014 Unrealized Unrealized Fair Cost gains losses value
Securities classified as:
Available-for-sale:
Equity securities ................................................................... ¥ 2,641 ¥7,853 ¥(21) ¥ 10,473
Debt securities and other ...................................................... 47,644 — — 47,644
Held-to-maturity:
Debt securities and other ...................................................... 75,995 — — 75,995
Thousands of U.S. dollars
Dec. 2015 Unrealized Unrealized Fair Cost gains losses value
Securities classified as:
Available-for-sale:
Equity securities ................................................................... $ 19,897 $77,837 $(17) $ 97,717
Debt securities and other ...................................................... 577,397 — — 577,397
Held-to-maturity:
Debt securities and other ...................................................... 987,731 — — 987,731
Available-for-sale securities whose fair values are not readily determinable as of December 31, 2015 and 2014 were as follows: Carrying amount
Thousands of Millions of yen U.S. dollars
Dec. Dec. Dec. 2015 2014 2015
Available-for-sale:
Equity securities ....................................................................................... ¥1,173 ¥1,182 $9,737
Total ...................................................................................................... ¥1,173 ¥1,182 $9,737
Kao Corporation Annual Report 2015 57
Notes to Consolidated Financial Statements
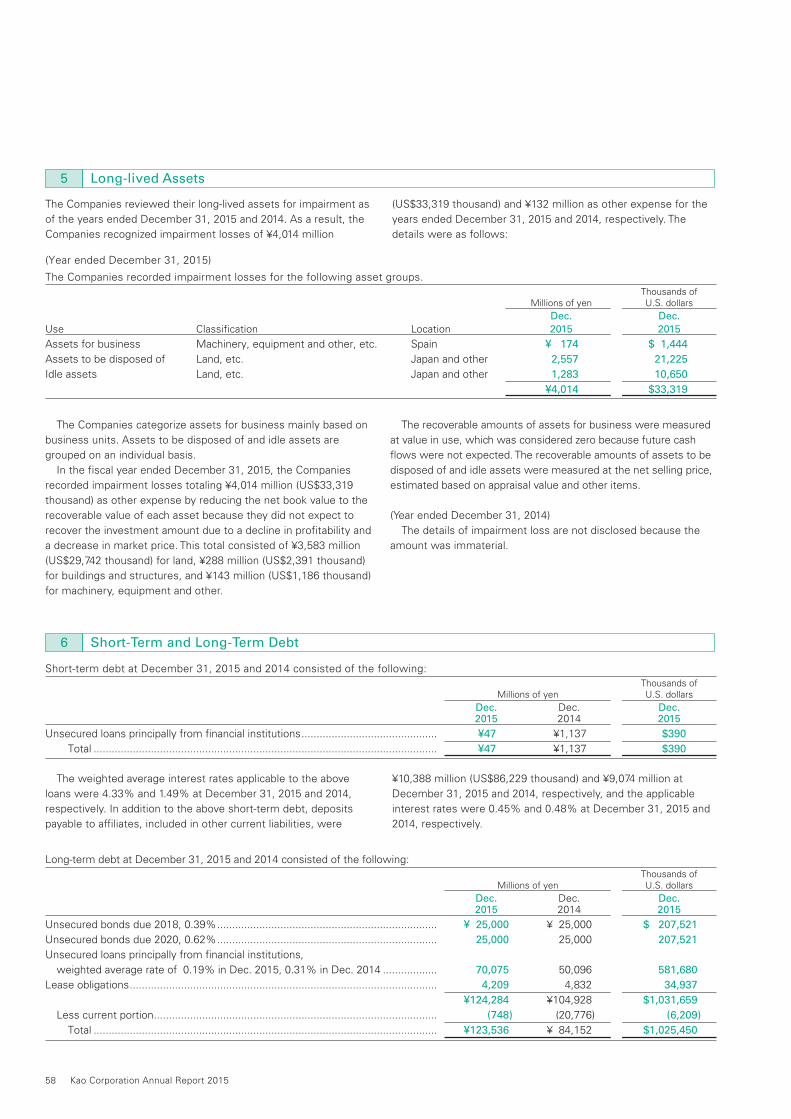
Long-term debt at December 31, 2015 and 2014 consisted of the following: Thousands of Millions of yen U.S. dollars
Dec. Dec. Dec. 2015 2014 2015
Unsecured bonds due 2018, 0.39% ......................................................................... ¥ 25,000 ¥ 25,000 $ 207,521
Unsecured bonds due 2020, 0.62% ......................................................................... 25,000 25,000 207,521
Unsecured loans principally from financial institutions,
weighted average rate of 0.19% in Dec. 2015, 0.31% in Dec. 2014 .................. 70,075 50,096 581,680
Lease obligations ...................................................................................................... 4,209 4,832 34,937
¥124,284 ¥104,928 $1,031,659
Less current portion .............................................................................................. (748) (20,776) (6,209)
Total .................................................................................................................. ¥123,536 ¥ 84,152 $1,025,450
Short-term debt at December 31, 2015 and 2014 consisted of the following: Thousands of Millions of yen U.S. dollars
Dec. Dec. Dec. 2015 2014 2015
Unsecured loans principally from financial institutions ............................................. ¥47 ¥1,137 $390
Total .................................................................................................................. ¥47 ¥1,137 $390
The weighted average interest rates applicable to the above
loans were 4.33% and 1.49% at December 31, 2015 and 2014,
respectively. In addition to the above short-term debt, deposits
payable to affiliates, included in other current liabilities, were
¥10,388 million (US$86,229 thousand) and ¥9,074 million at
December 31, 2015 and 2014, respectively, and the applicable
interest rates were 0.45% and 0.48% at December 31, 2015 and
2014, respectively.
6 Short-Term and Long-Term Debt
The Companies categorize assets for business mainly based on
business units. Assets to be disposed of and idle assets are
grouped on an individual basis.
In the fiscal year ended December 31, 2015, the Companies
recorded impairment losses totaling ¥4,014 million (US$33,319
thousand) as other expense by reducing the net book value to the
recoverable value of each asset because they did not expect to
recover the investment amount due to a decline in profitability and
a decrease in market price. This total consisted of ¥3,583 million
(US$29,742 thousand) for land, ¥288 million (US$2,391 thousand)
for buildings and structures, and ¥143 million (US$1,186 thousand)
for machinery, equipment and other.
The recoverable amounts of assets for business were measured
at value in use, which was considered zero because future cash
flows were not expected. The recoverable amounts of assets to be
disposed of and idle assets were measured at the net selling price,
estimated based on appraisal value and other items.
(Year ended December 31, 2014)
The details of impairment loss are not disclosed because the
amount was immaterial.
The Companies reviewed their long-lived assets for impairment as
of the years ended December 31, 2015 and 2014. As a result, the
Companies recognized impairment losses of ¥4,014 million
(US$33,319 thousand) and ¥132 million as other expense for the
years ended December 31, 2015 and 2014, respectively. The
details were as follows:
5 Long-lived Assets
(Year ended December 31, 2015)
The Companies recorded impairment losses for the following asset groups. Thousands of Millions of yen U.S. dollars
Dec. Dec.Use Classification Location 2015 2015
Assets for business Machinery, equipment and other, etc. Spain ¥ 174 $ 1,444
Assets to be disposed of Land, etc. Japan and other 2,557 21,225
Idle assets Land, etc. Japan and other 1,283 10,650
¥4,014 $33,319
58 Kao Corporation Annual Report 2015
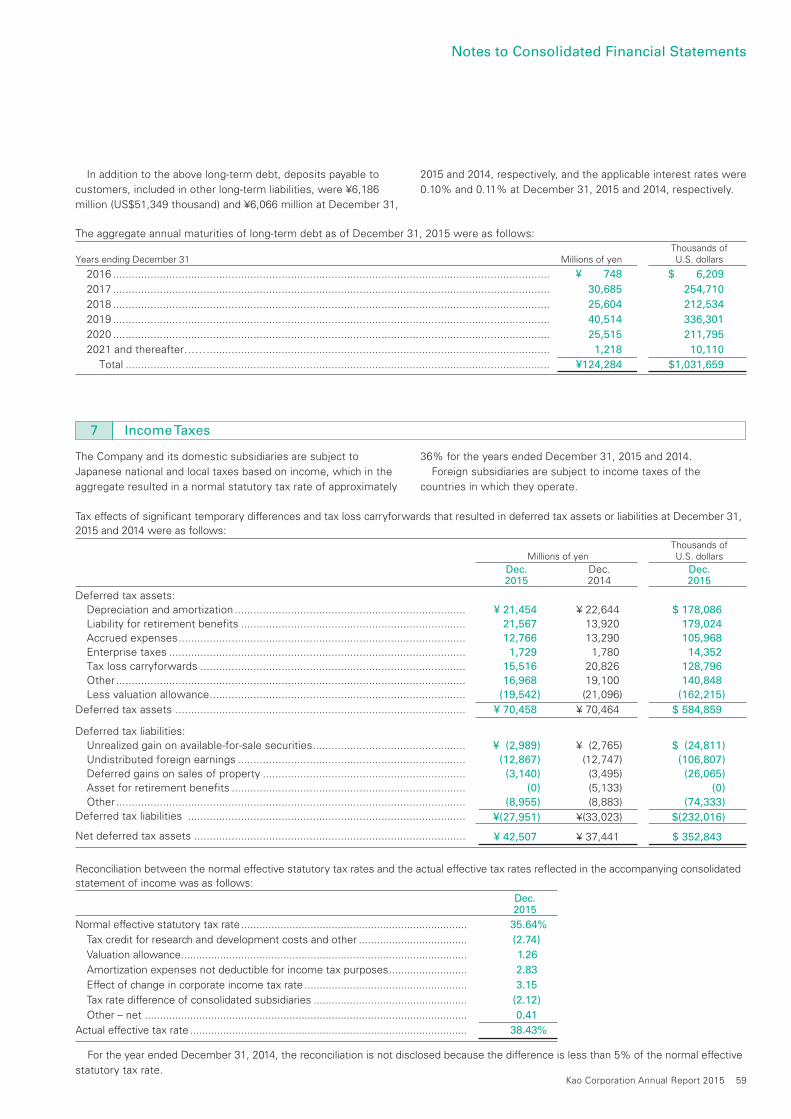
The Company and its domestic subsidiaries are subject to
Japanese national and local taxes based on income, which in the
aggregate resulted in a normal statutory tax rate of approximately
36% for the years ended December 31, 2015 and 2014.
Foreign subsidiaries are subject to income taxes of the
countries in which they operate.
7 Income Taxes
Tax effects of significant temporary differences and tax loss carryforwards that resulted in deferred tax assets or liabilities at December 31, 2015 and 2014 were as follows: Thousands of Millions of yen U.S. dollars
Dec. Dec. Dec. 2015 2014 2015
Deferred tax assets: Depreciation and amortization .......................................................................... ¥ 21,454 ¥ 22,644 $ 178,086 Liability for retirement benefits ........................................................................ 21,567 13,920 179,024 Accrued expenses ............................................................................................ 12,766 13,290 105,968 Enterprise taxes ............................................................................................... 1,729 1,780 14,352 Tax loss carryforwards ..................................................................................... 15,516 20,826 128,796 Other ................................................................................................................ 16,968 19,100 140,848 Less valuation allowance .................................................................................. (19,542) (21,096) (162,215)
Deferred tax assets ............................................................................................. ¥ 70,458 ¥ 70,464 $ 584,859
Deferred tax liabilities: Unrealized gain on available-for-sale securities ................................................. ¥ (2,989) ¥ (2,765) $ (24,811) Undistributed foreign earnings ......................................................................... (12,867) (12,747) (106,807) Deferred gains on sales of property ................................................................. (3,140) (3,495) (26,065) Asset for retirement benefits ........................................................................... (0) (5,133) (0) Other ................................................................................................................ (8,955) (8,883) (74,333)Deferred tax liabilities ......................................................................................... ¥(27,951) ¥(33,023) $(232,016)
Net deferred tax assets ....................................................................................... ¥ 42,507 ¥ 37,441 $ 352,843
Reconciliation between the normal effective statutory tax rates and the actual effective tax rates reflected in the accompanying consolidated statement of income was as follows:
Dec. 2015
Normal effective statutory tax rate ........................................................................... 35.64%
Tax credit for research and development costs and other .................................... (2.74)
Valuation allowance ............................................................................................... 1.26
Amortization expenses not deductible for income tax purposes .......................... 2.83
Effect of change in corporate income tax rate ...................................................... 3.15
Tax rate difference of consolidated subsidiaries ................................................... (2.12)
Other – net ........................................................................................................... 0.41
Actual effective tax rate ............................................................................................ 38.43%
The aggregate annual maturities of long-term debt as of December 31, 2015 were as follows: Thousands ofYears ending December 31 Millions of yen U.S. dollars
2016 ............................................................................................................................................ ¥ 748 $ 6,209
2017 ............................................................................................................................................ 30,685 254,710
2018 ............................................................................................................................................ 25,604 212,534
2019 ............................................................................................................................................ 40,514 336,301
2020 ............................................................................................................................................ 25,515 211,795
2021 and thereafter…… .............................................................................................................. 1,218 10,110
Total ........................................................................................................................................ ¥124,284 $1,031,659
In addition to the above long-term debt, deposits payable to
customers, included in other long-term liabilities, were ¥6,186
million (US$51,349 thousand) and ¥6,066 million at December 31,
2015 and 2014, respectively, and the applicable interest rates were
0.10% and 0.11% at December 31, 2015 and 2014, respectively.
For the year ended December 31, 2014, the reconciliation is not disclosed because the difference is less than 5% of the normal effective
statutory tax rate.Kao Corporation Annual Report 2015 59
Notes to Consolidated Financial Statements
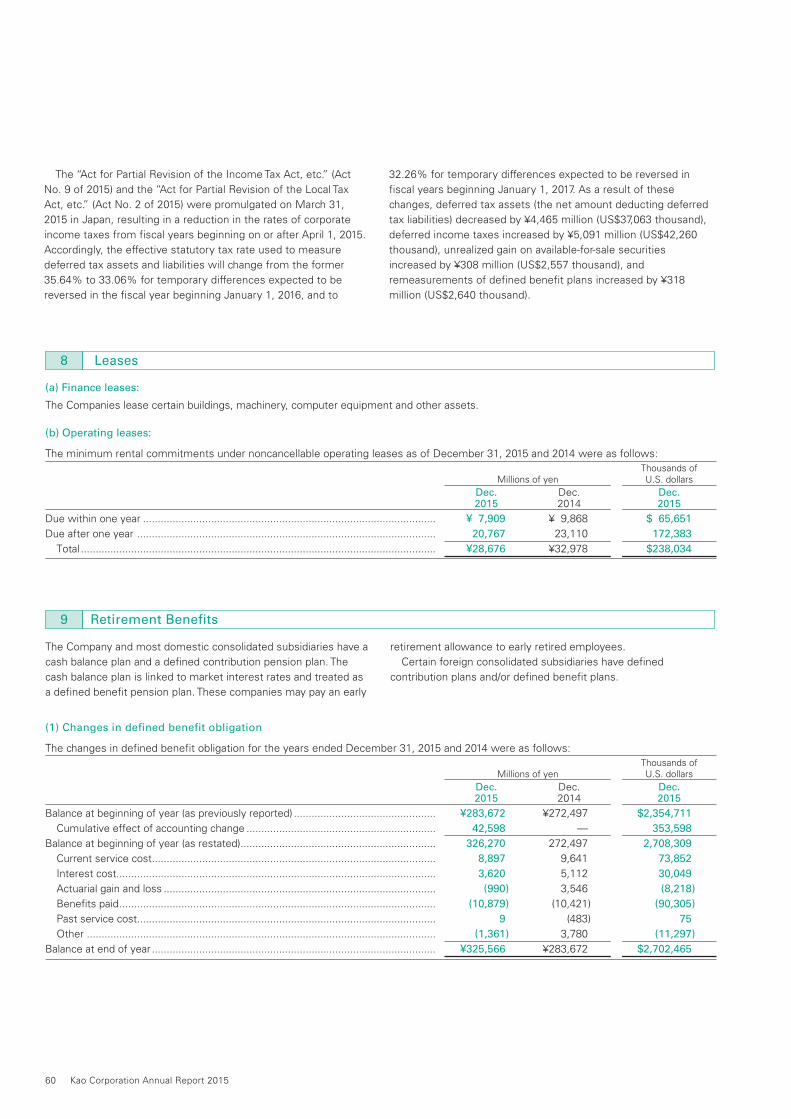
8 Leases
(a) Finance leases:
The Companies lease certain buildings, machinery, computer equipment and other assets.
(b) Operating leases:
The minimum rental commitments under noncancellable operating leases as of December 31, 2015 and 2014 were as follows: Thousands of Millions of yen U.S. dollars
Dec. Dec. Dec. 2015 2014 2015
Due within one year ................................................................................................... ¥ 7,909 ¥ 9,868 $ 65,651
Due after one year ..................................................................................................... 20,767 23,110 172,383
Total ........................................................................................................................ ¥28,676 ¥32,978 $238,034
The Company and most domestic consolidated subsidiaries have a
cash balance plan and a defined contribution pension plan. The
cash balance plan is linked to market interest rates and treated as
a defined benefit pension plan. These companies may pay an early
retirement allowance to early retired employees.
Certain foreign consolidated subsidiaries have defined
contribution plans and/or defined benefit plans.
9 Retirement Benefits
(1) Changes in defined benefit obligation
The changes in defined benefit obligation for the years ended December 31, 2015 and 2014 were as follows: Thousands of Millions of yen U.S. dollars
Dec. Dec. Dec. 2015 2014 2015
Balance at beginning of year (as previously reported) ................................................ ¥283,672 ¥272,497 $2,354,711
Cumulative effect of accounting change ................................................................ 42,598 — 353,598
Balance at beginning of year (as restated) .................................................................. 326,270 272,497 2,708,309
Current service cost................................................................................................ 8,897 9,641 73,852
Interest cost............................................................................................................ 3,620 5,112 30,049
Actuarial gain and loss ............................................................................................ (990) 3,546 (8,218)
Benefits paid ........................................................................................................... (10,879) (10,421) (90,305)
Past service cost..................................................................................................... 9 (483) 75
Other ...................................................................................................................... (1,361) 3,780 (11,297)
Balance at end of year ................................................................................................ ¥325,566 ¥283,672 $2,702,465
The “Act for Partial Revision of the Income Tax Act, etc.” (Act
No. 9 of 2015) and the “Act for Partial Revision of the Local Tax
Act, etc.” (Act No. 2 of 2015) were promulgated on March 31,
2015 in Japan, resulting in a reduction in the rates of corporate
income taxes from fiscal years beginning on or after April 1, 2015.
Accordingly, the effective statutory tax rate used to measure
deferred tax assets and liabilities will change from the former
35.64% to 33.06% for temporary differences expected to be
reversed in the fiscal year beginning January 1, 2016, and to
32.26% for temporary differences expected to be reversed in
fiscal years beginning January 1, 2017. As a result of these
changes, deferred tax assets (the net amount deducting deferred
tax liabilities) decreased by ¥4,465 million (US$37,063 thousand),
deferred income taxes increased by ¥5,091 million (US$42,260
thousand), unrealized gain on available-for-sale securities
increased by ¥308 million (US$2,557 thousand), and
remeasurements of defined benefit plans increased by ¥318
million (US$2,640 thousand).
60 Kao Corporation Annual Report 2015
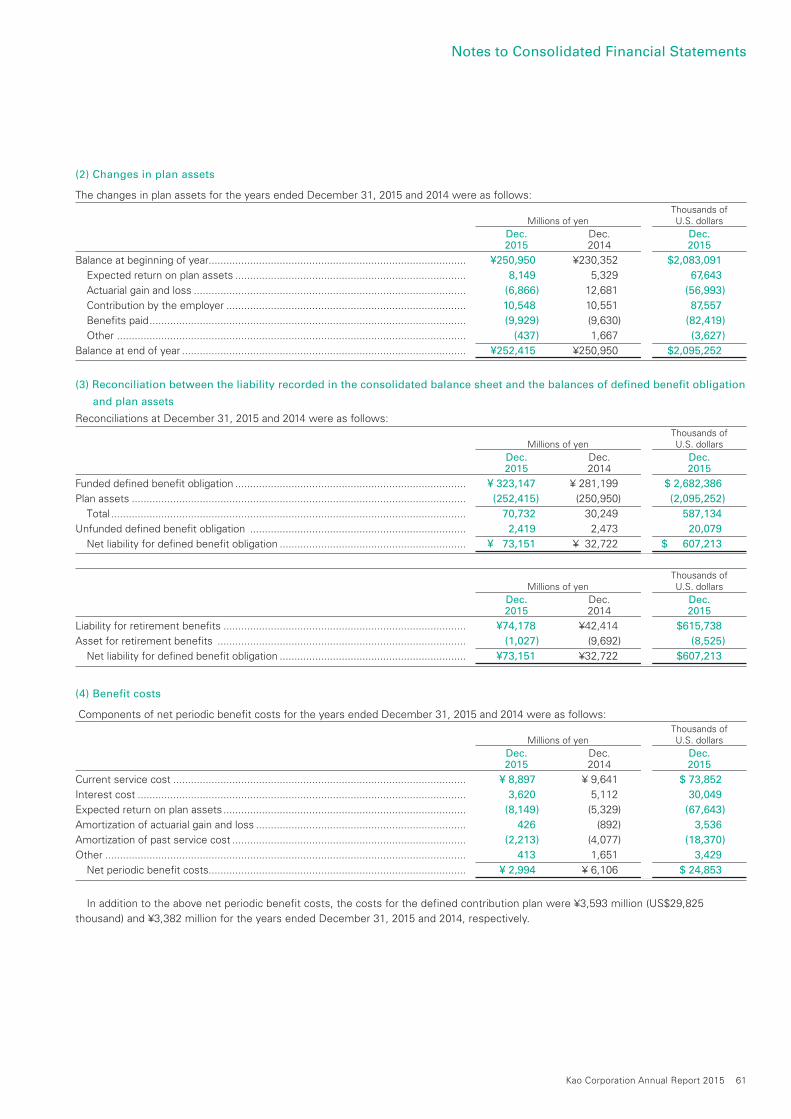
(2) Changes in plan assets
The changes in plan assets for the years ended December 31, 2015 and 2014 were as follows: Thousands of Millions of yen U.S. dollars
Dec. Dec. Dec. 2015 2014 2015
Balance at beginning of year....................................................................................... ¥250,950 ¥230,352 $2,083,091
Expected return on plan assets .............................................................................. 8,149 5,329 67,643
Actuarial gain and loss ............................................................................................ (6,866) 12,681 (56,993)
Contribution by the employer ................................................................................. 10,548 10,551 87,557
Benefits paid ........................................................................................................... (9,929) (9,630) (82,419)
Other ...................................................................................................................... (437) 1,667 (3,627)
Balance at end of year ................................................................................................ ¥252,415 ¥250,950 $2,095,252
(3) Reconciliation between the liability recorded in the consolidated balance sheet and the balances of defined benefit obligation
and plan assets
Reconciliations at December 31, 2015 and 2014 were as follows: Thousands of Millions of yen U.S. dollars
Dec. Dec. Dec. 2015 2014 2015
Funded defined benefit obligation .............................................................................. ¥ 323,147 ¥ 281,199 $ 2,682,386
Plan assets ................................................................................................................. (252,415) (250,950) (2,095,252)
Total ........................................................................................................................ 70,732 30,249 587,134
Unfunded defined benefit obligation ......................................................................... 2,419 2,473 20,079
Net liability for defined benefit obligation ............................................................... ¥ 73,151 ¥ 32,722 $ 607,213
Thousands of Millions of yen U.S. dollars
Dec. Dec. Dec. 2015 2014 2015
Liability for retirement benefits .................................................................................. ¥74,178 ¥42,414 $615,738
Asset for retirement benefits .................................................................................... (1,027) (9,692) (8,525)
Net liability for defined benefit obligation ............................................................... ¥73,151 ¥32,722 $607,213
(4) Benefit costs
Components of net periodic benefit costs for the years ended December 31, 2015 and 2014 were as follows: Thousands of Millions of yen U.S. dollars
Dec. Dec. Dec. 2015 2014 2015
Current service cost ................................................................................................... ¥ 8,897 ¥ 9,641 $ 73,852
Interest cost ............................................................................................................... 3,620 5,112 30,049
Expected return on plan assets .................................................................................. (8,149) (5,329) (67,643)
Amortization of actuarial gain and loss ....................................................................... 426 (892) 3,536
Amortization of past service cost ............................................................................... (2,213) (4,077) (18,370)
Other .......................................................................................................................... 413 1,651 3,429
Net periodic benefit costs ....................................................................................... ¥ 2,994 ¥ 6,106 $ 24,853
In addition to the above net periodic benefit costs, the costs for the defined contribution plan were ¥3,593 million (US$29,825
thousand) and ¥3,382 million for the years ended December 31, 2015 and 2014, respectively.
Kao Corporation Annual Report 2015 61
Notes to Consolidated Financial Statements
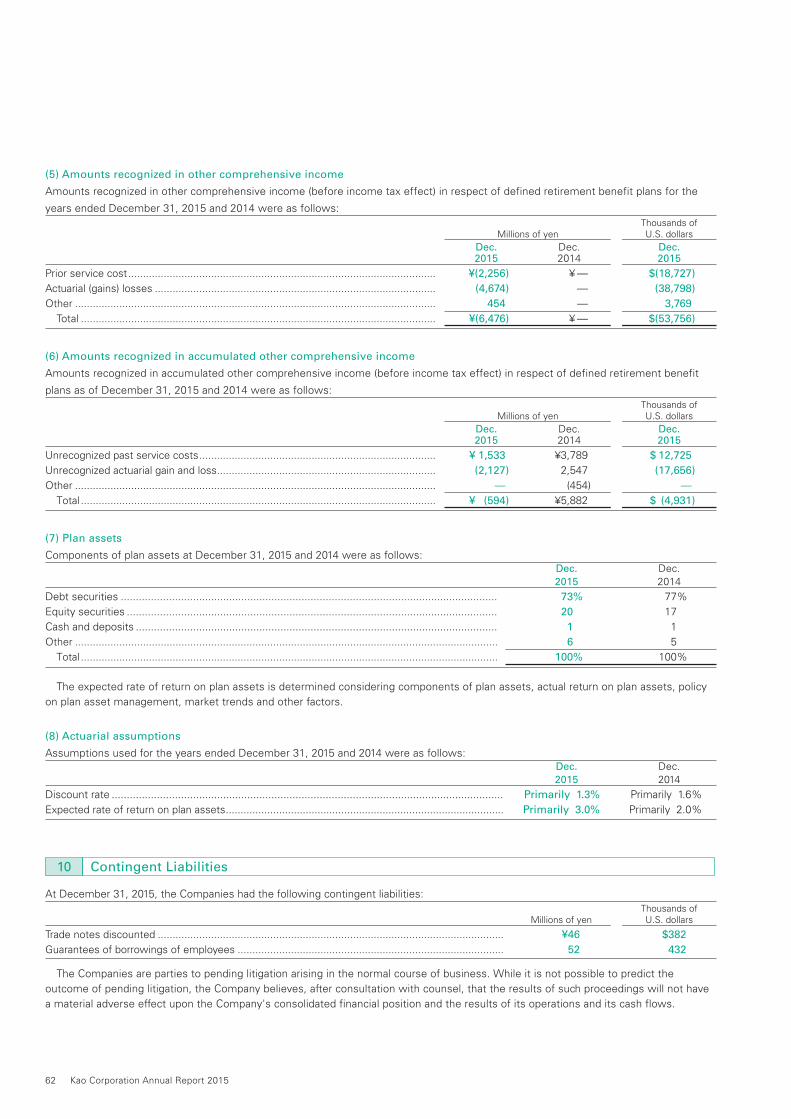
(5) Amounts recognized in other comprehensive income
Amounts recognized in other comprehensive income (before income tax effect) in respect of defined retirement benefit plans for the
years ended December 31, 2015 and 2014 were as follows: Thousands of Millions of yen U.S. dollars
Dec. Dec. Dec. 2015 2014 2015
Prior service cost ........................................................................................................ ¥(2,256) ¥ — $(18,727)
Actuarial (gains) losses ............................................................................................... (4,674) — (38,798)
Other .......................................................................................................................... 454 — 3,769
Total ........................................................................................................................ ¥(6,476) ¥ — $(53,756)
(6) Amounts recognized in accumulated other comprehensive income
Amounts recognized in accumulated other comprehensive income (before income tax effect) in respect of defined retirement benefit
plans as of December 31, 2015 and 2014 were as follows: Thousands of Millions of yen U.S. dollars
Dec. Dec. Dec. 2015 2014 2015
Unrecognized past service costs ................................................................................ ¥ 1,533 ¥3,789 $ 12,725
Unrecognized actuarial gain and loss .......................................................................... (2,127) 2,547 (17,656)
Other .......................................................................................................................... — (454) —
Total ........................................................................................................................ ¥ (594) ¥5,882 $ (4,931)
(7) Plan assets
Components of plan assets at December 31, 2015 and 2014 were as follows: Dec. Dec. 2015 2014
Debt securities ............................................................................................................................. 73% 77%
Equity securities ........................................................................................................................... 20 17
Cash and deposits ........................................................................................................................ 1 1
Other ............................................................................................................................................... 6 5
Total ............................................................................................................................................. 100% 100%
The expected rate of return on plan assets is determined considering components of plan assets, actual return on plan assets, policy
on plan asset management, market trends and other factors.
(8) Actuarial assumptions
Assumptions used for the years ended December 31, 2015 and 2014 were as follows: Dec. Dec. 2015 2014
Discount rate .................................................................................................................................. Primarily 1.3% Primarily 1.6%
Expected rate of return on plan assets .............................................................................................. Primarily 3.0% Primarily 2.0%
10 Contingent Liabilities
At December 31, 2015, the Companies had the following contingent liabilities: Thousands of Millions of yen U.S. dollars
Trade notes discounted ..................................................................................................................... ¥46 $382
Guarantees of borrowings of employees .......................................................................................... 52 432
The Companies are parties to pending litigation arising in the normal course of business. While it is not possible to predict the
outcome of pending litigation, the Company believes, after consultation with counsel, that the results of such proceedings will not have
a material adverse effect upon the Company's consolidated financial position and the results of its operations and its cash flows.
62 Kao Corporation Annual Report 2015
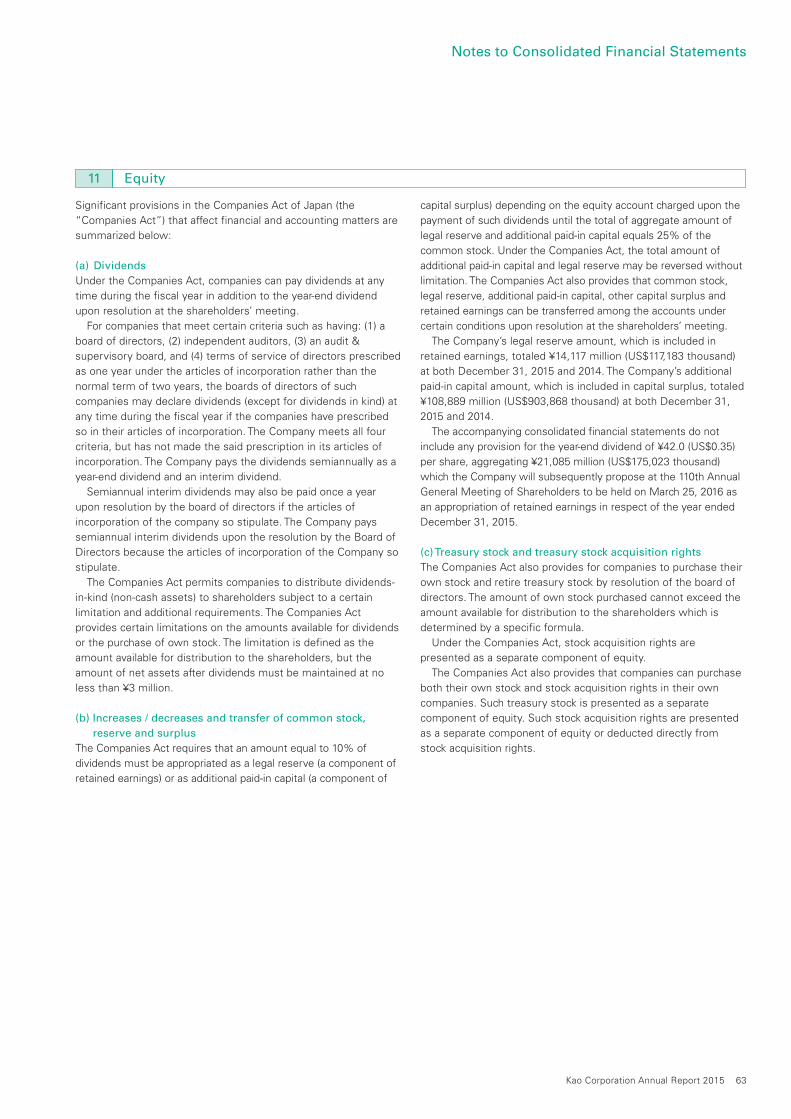
11 Equity
Significant provisions in the Companies Act of Japan (the
“Companies Act”) that affect financial and accounting matters are
summarized below:
(a) Dividends
Under the Companies Act, companies can pay dividends at any
time during the fiscal year in addition to the year-end dividend
upon resolution at the shareholders’ meeting.
For companies that meet certain criteria such as having: (1) a
board of directors, (2) independent auditors, (3) an audit &
supervisory board, and (4) terms of service of directors prescribed
as one year under the articles of incorporation rather than the
normal term of two years, the boards of directors of such
companies may declare dividends (except for dividends in kind) at
any time during the fiscal year if the companies have prescribed
so in their articles of incorporation. The Company meets all four
criteria, but has not made the said prescription in its articles of
incorporation. The Company pays the dividends semiannually as a
year-end dividend and an interim dividend.
Semiannual interim dividends may also be paid once a year
upon resolution by the board of directors if the articles of
incorporation of the company so stipulate. The Company pays
semiannual interim dividends upon the resolution by the Board of
Directors because the articles of incorporation of the Company so
stipulate.
The Companies Act permits companies to distribute dividends-
in-kind (non-cash assets) to shareholders subject to a certain
limitation and additional requirements. The Companies Act
provides certain limitations on the amounts available for dividends
or the purchase of own stock. The limitation is defined as the
amount available for distribution to the shareholders, but the
amount of net assets after dividends must be maintained at no
less than ¥3 million.
(b) Increases / decreases and transfer of common stock,
reserve and surplus
The Companies Act requires that an amount equal to 10% of
dividends must be appropriated as a legal reserve (a component of
retained earnings) or as additional paid-in capital (a component of
capital surplus) depending on the equity account charged upon the
payment of such dividends until the total of aggregate amount of
legal reserve and additional paid-in capital equals 25% of the
common stock. Under the Companies Act, the total amount of
additional paid-in capital and legal reserve may be reversed without
limitation. The Companies Act also provides that common stock,
legal reserve, additional paid-in capital, other capital surplus and
retained earnings can be transferred among the accounts under
certain conditions upon resolution at the shareholders’ meeting.
The Company’s legal reserve amount, which is included in
retained earnings, totaled ¥14,117 million (US$117,183 thousand)
at both December 31, 2015 and 2014. The Company’s additional
paid-in capital amount, which is included in capital surplus, totaled
¥108,889 million (US$903,868 thousand) at both December 31,
2015 and 2014.
The accompanying consolidated financial statements do not
include any provision for the year-end dividend of ¥42.0 (US$0.35)
per share, aggregating ¥21,085 million (US$175,023 thousand)
which the Company will subsequently propose at the 110th Annual
General Meeting of Shareholders to be held on March 25, 2016 as
an appropriation of retained earnings in respect of the year ended
December 31, 2015.
(c) Treasury stock and treasury stock acquisition rights
The Companies Act also provides for companies to purchase their
own stock and retire treasury stock by resolution of the board of
directors. The amount of own stock purchased cannot exceed the
amount available for distribution to the shareholders which is
determined by a specific formula.
Under the Companies Act, stock acquisition rights are
presented as a separate component of equity.
The Companies Act also provides that companies can purchase
both their own stock and stock acquisition rights in their own
companies. Such treasury stock is presented as a separate
component of equity. Such stock acquisition rights are presented
as a separate component of equity or deducted directly from
stock acquisition rights.
Kao Corporation Annual Report 2015 63
Notes to Consolidated Financial Statements
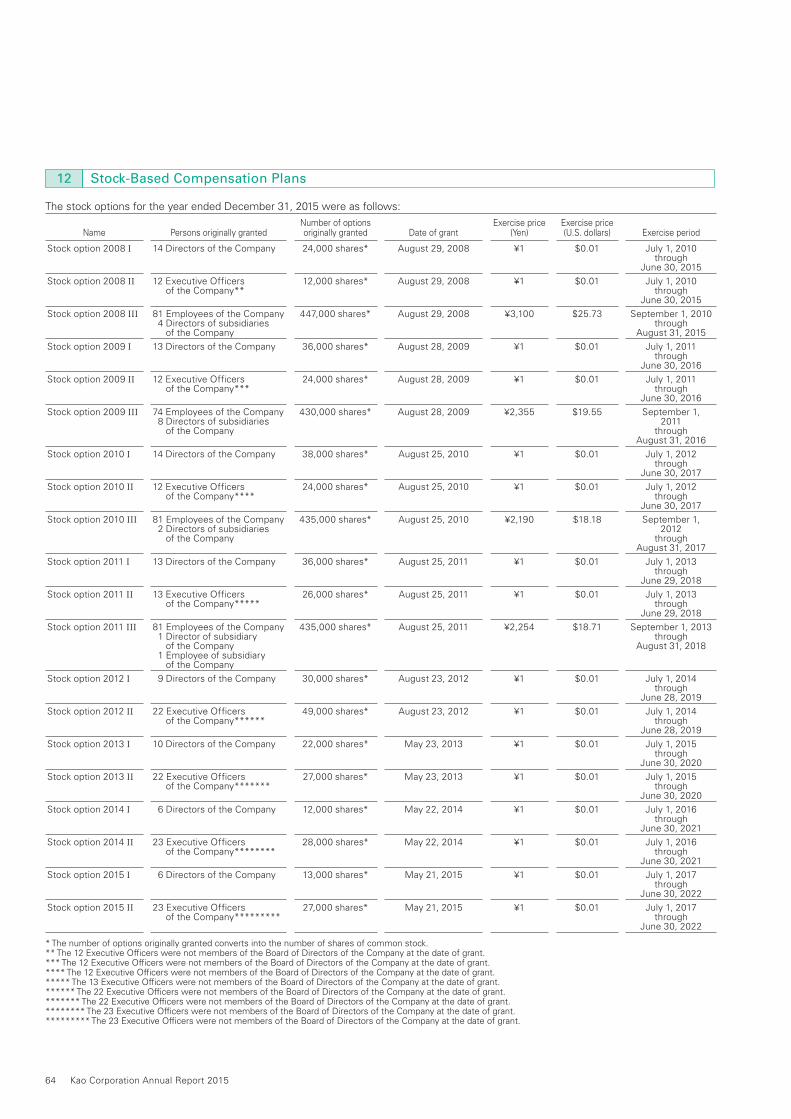
12 Stock-Based Compensation Plans
The stock options for the year ended December 31, 2015 were as follows:
Name Persons originally grantedNumber of options originally granted Date of grant
Exercise price (Yen)
Exercise price (U.S. dollars) Exercise period
Stock option 2008 I 14 Directors of the Company 24,000 shares* August 29, 2008 ¥1 $0.01 July 1, 2010through
June 30, 2015
Stock option 2008 II 12 Executive Officers of the Company**
12,000 shares* August 29, 2008 ¥1 $0.01 July 1, 2010through
June 30, 2015
Stock option 2008 III 81 Employees of the Company 4 Directors of subsidiaries of the Company
447,000 shares* August 29, 2008 ¥3,100 $25.73 September 1, 2010through
August 31, 2015
Stock option 2009 I 13 Directors of the Company 36,000 shares* August 28, 2009 ¥1 $0.01 July 1, 2011through
June 30, 2016
Stock option 2009 II 12 Executive Officers of the Company***
24,000 shares* August 28, 2009 ¥1 $0.01 July 1, 2011through
June 30, 2016
Stock option 2009 III 74 Employees of the Company 8 Directors of subsidiaries of the Company
430,000 shares* August 28, 2009 ¥2,355 $19.55 September 1,2011
throughAugust 31, 2016
Stock option 2010 I 14 Directors of the Company 38,000 shares* August 25, 2010 ¥1 $0.01 July 1, 2012through
June 30, 2017
Stock option 2010 II 12 Executive Officers of the Company****
24,000 shares* August 25, 2010 ¥1 $0.01 July 1, 2012through
June 30, 2017
Stock option 2010 III 81 Employees of the Company 2 Directors of subsidiaries of the Company
435,000 shares* August 25, 2010 ¥2,190 $18.18 September 1,2012
throughAugust 31, 2017
Stock option 2011 I 13 Directors of the Company 36,000 shares* August 25, 2011 ¥1 $0.01 July 1, 2013through
June 29, 2018
Stock option 2011 II 13 Executive Officers of the Company*****
26,000 shares* August 25, 2011 ¥1 $0.01 July 1, 2013through
June 29, 2018
Stock option 2011 III 81 Employees of the Company 1 Director of subsidiary of the Company 1 Employee of subsidiary of the Company
435,000 shares* August 25, 2011 ¥2,254 $18.71 September 1, 2013through
August 31, 2018
Stock option 2012 I 9 Directors of the Company 30,000 shares* August 23, 2012 ¥1 $0.01 July 1, 2014through
June 28, 2019
Stock option 2012 II 22 Executive Officers of the Company******
49,000 shares* August 23, 2012 ¥1 $0.01 July 1, 2014through
June 28, 2019
Stock option 2013 I 10 Directors of the Company 22,000 shares* May 23, 2013 ¥1 $0.01 July 1, 2015through
June 30, 2020
Stock option 2013 II 22 Executive Officers of the Company*******
27,000 shares* May 23, 2013 ¥1 $0.01 July 1, 2015through
June 30, 2020
Stock option 2014 I 6 Directors of the Company 12,000 shares* May 22, 2014 ¥1 $0.01 July 1, 2016through
June 30, 2021
Stock option 2014 II 23 Executive Officers of the Company********
28,000 shares* May 22, 2014 ¥1 $0.01 July 1, 2016through
June 30, 2021
Stock option 2015 I 6 Directors of the Company 13,000 shares* May 21, 2015 ¥1 $0.01 July 1, 2017through
June 30, 2022
Stock option 2015 II 23 Executive Officers of the Company*********
27,000 shares* May 21, 2015 ¥1 $0.01 July 1, 2017through
June 30, 2022
* The number of options originally granted converts into the number of shares of common stock.** The 12 Executive Officers were not members of the Board of Directors of the Company at the date of grant.*** The 12 Executive Officers were not members of the Board of Directors of the Company at the date of grant.**** The 12 Executive Officers were not members of the Board of Directors of the Company at the date of grant.***** The 13 Executive Officers were not members of the Board of Directors of the Company at the date of grant.****** The 22 Executive Officers were not members of the Board of Directors of the Company at the date of grant.******* The 22 Executive Officers were not members of the Board of Directors of the Company at the date of grant.******** The 23 Executive Officers were not members of the Board of Directors of the Company at the date of grant.********* The 23 Executive Officers were not members of the Board of Directors of the Company at the date of grant.
64 Kao Corporation Annual Report 2015
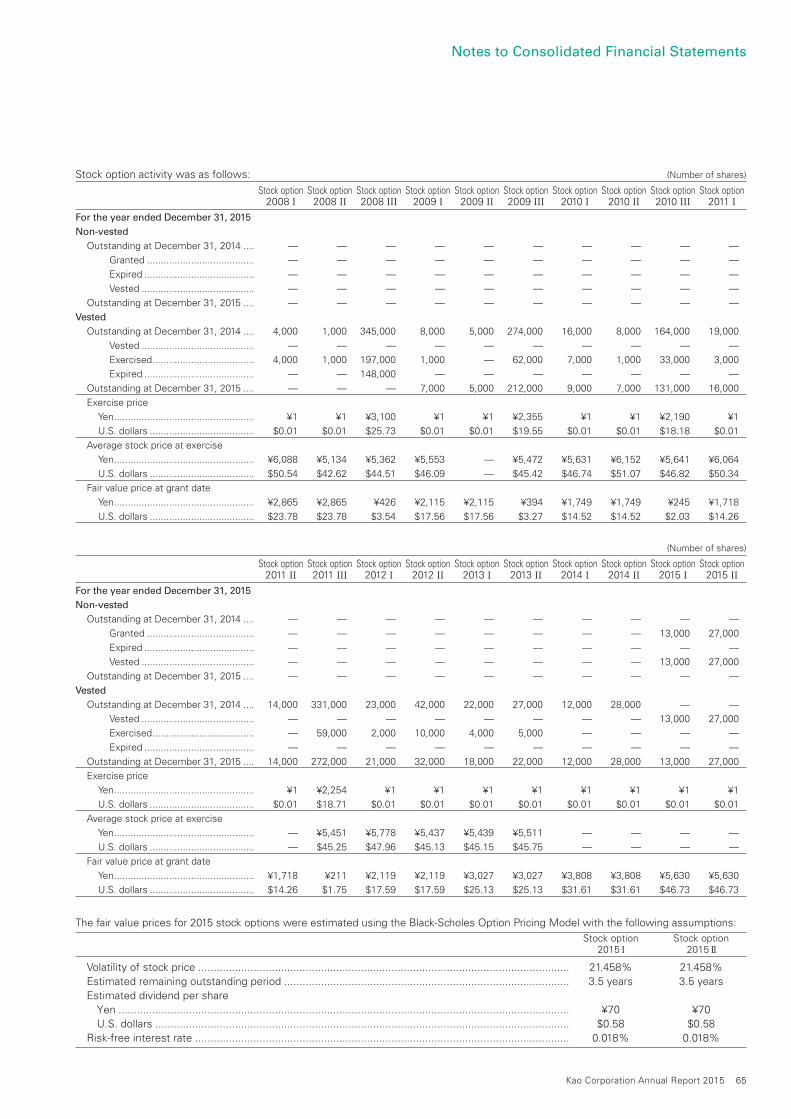
Stock option activity was as follows: (Number of shares)
Stock option2008 I
Stock option2008 II
Stock option2008 III
Stock option2009 I
Stock option2009 II
Stock option2009 III
Stock option2010 I
Stock option2010 II
Stock option2010 III
Stock option2011 I
For the year ended December 31, 2015
Non-vested
Outstanding at December 31, 2014 .... — — — — — — — — — —
Granted ....................................... — — — — — — — — — —
Expired ........................................ — — — — — — — — — —
Vested ......................................... — — — — — — — — — —
Outstanding at December 31, 2015 .... — — — — — — — — — —
Vested
Outstanding at December 31, 2014 .... 4,000 1,000 345,000 8,000 5,000 274,000 16,000 8,000 164,000 19,000
Vested ......................................... — — — — — — — — — —
Exercised ..................................... 4,000 1,000 197,000 1,000 — 62,000 7,000 1,000 33,000 3,000
Expired ........................................ — — 148,000 — — — — — — —
Outstanding at December 31, 2015 .... — — — 7,000 5,000 212,000 9,000 7,000 131,000 16,000
Exercise price
Yen ................................................... ¥1 ¥1 ¥3,100 ¥1 ¥1 ¥2,355 ¥1 ¥1 ¥2,190 ¥1
U.S. dollars ...................................... $0.01 $0.01 $25.73 $0.01 $0.01 $19.55 $0.01 $0.01 $18.18 $0.01
Average stock price at exercise
Yen ................................................... ¥6,088 ¥5,134 ¥5,362 ¥5,553 — ¥5,472 ¥5,631 ¥6,152 ¥5,641 ¥6,064
U.S. dollars ...................................... $50.54 $42.62 $44.51 $46.09 — $45.42 $46.74 $51.07 $46.82 $50.34
Fair value price at grant date
Yen ................................................... ¥2,865 ¥2,865 ¥426 ¥2,115 ¥2,115 ¥394 ¥1,749 ¥1,749 ¥245 ¥1,718
U.S. dollars ...................................... $23.78 $23.78 $3.54 $17.56 $17.56 $3.27 $14.52 $14.52 $2.03 $14.26
(Number of shares)
Stock option2011 II
Stock option2011 III
Stock option2012 I
Stock option2012 II
Stock option2013 I
Stock option2013 II
Stock option2014 I
Stock option2014 II
Stock option2015 I
Stock option2015 II
For the year ended December 31, 2015
Non-vested
Outstanding at December 31, 2014 .... — — — — — — — — — —
Granted ....................................... — — — — — — — — 13,000 27,000
Expired ........................................ — — — — — — — — — —
Vested ......................................... — — — — — — — — 13,000 27,000
Outstanding at December 31, 2015 .... — — — — — — — — — —
Vested
Outstanding at December 31, 2014 .... 14,000 331,000 23,000 42,000 22,000 27,000 12,000 28,000 — —
Vested ......................................... — — — — — — — — 13,000 27,000
Exercised ..................................... — 59,000 2,000 10,000 4,000 5,000 — — — —
Expired ........................................ — — — — — — — — — —
Outstanding at December 31, 2015 .... 14,000 272,000 21,000 32,000 18,000 22,000 12,000 28,000 13,000 27,000
Exercise price
Yen ................................................... ¥1 ¥2,254 ¥1 ¥1 ¥1 ¥1 ¥1 ¥1 ¥1 ¥1
U.S. dollars ...................................... $0.01 $18.71 $0.01 $0.01 $0.01 $0.01 $0.01 $0.01 $0.01 $0.01
Average stock price at exercise
Yen ................................................... — ¥5,451 ¥5,778 ¥5,437 ¥5,439 ¥5,511 — — — —
U.S. dollars ...................................... — $45.25 $47.96 $45.13 $45.15 $45.75 — — — —
Fair value price at grant date
Yen ................................................... ¥1,718 ¥211 ¥2,119 ¥2,119 ¥3,027 ¥3,027 ¥3,808 ¥3,808 ¥5,630 ¥5,630
U.S. dollars ...................................... $14.26 $1.75 $17.59 $17.59 $25.13 $25.13 $31.61 $31.61 $46.73 $46.73
The fair value prices for 2015 stock options were estimated using the Black-Scholes Option Pricing Model with the following assumptions:
Stock option Stock option 2015 I 2015 II
Volatility of stock price ......................................................................................................................... 21.458% 21.458% Estimated remaining outstanding period ............................................................................................. 3.5 years 3.5 years Estimated dividend per share Yen ................................................................................................................................................... ¥70 ¥70 U.S. dollars ....................................................................................................................................... $0.58 $0.58 Risk-free interest rate .......................................................................................................................... 0.018% 0.018%
Kao Corporation Annual Report 2015 65
Notes to Consolidated Financial Statements
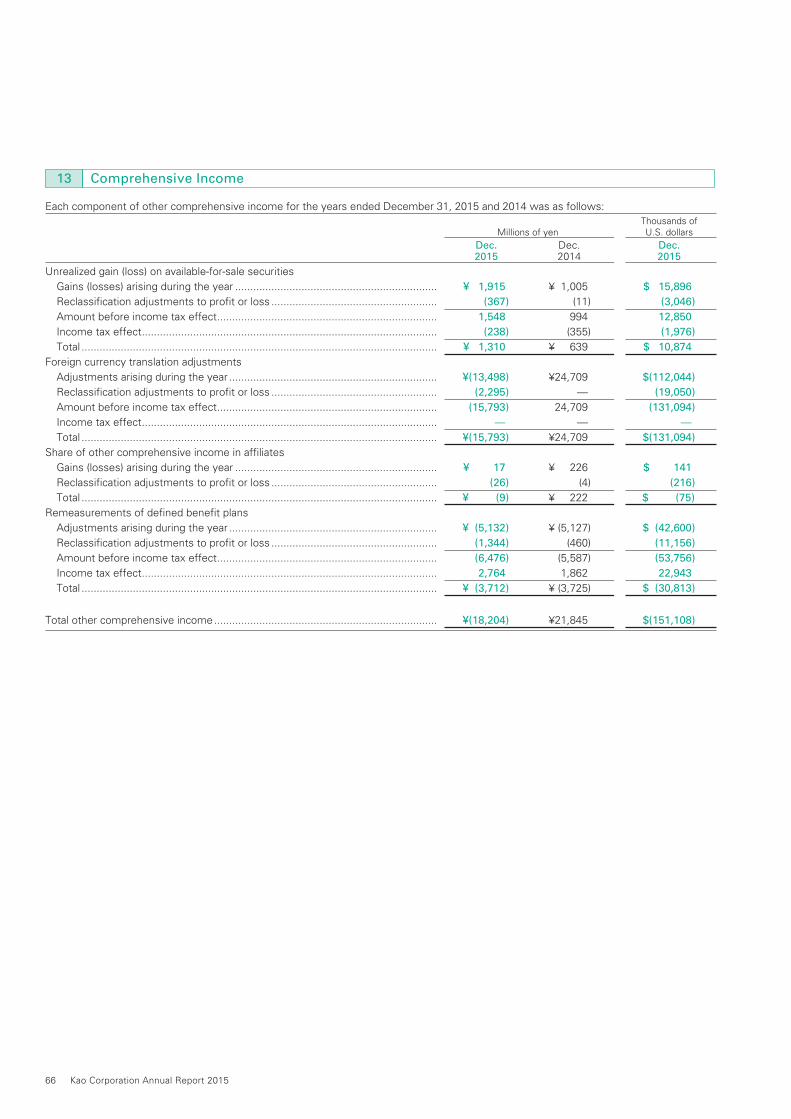
13 Comprehensive Income
Each component of other comprehensive income for the years ended December 31, 2015 and 2014 was as follows: Thousands of Millions of yen U.S. dollars
Dec. Dec. Dec. 2015 2014 2015
Unrealized gain (loss) on available-for-sale securities
Gains (losses) arising during the year ................................................................... ¥ 1,915 ¥ 1,005 $ 15,896
Reclassification adjustments to profit or loss ....................................................... (367) (11) (3,046)
Amount before income tax effect ......................................................................... 1,548 994 12,850
Income tax effect .................................................................................................. (238) (355) (1,976)
Total ...................................................................................................................... ¥ 1,310 ¥ 639 $ 10,874
Foreign currency translation adjustments
Adjustments arising during the year ..................................................................... ¥(13,498) ¥24,709 $(112,044)
Reclassification adjustments to profit or loss ....................................................... (2,295) — (19,050)
Amount before income tax effect ......................................................................... (15,793) 24,709 (131,094)
Income tax effect .................................................................................................. — — —
Total ...................................................................................................................... ¥(15,793) ¥24,709 $(131,094)
Share of other comprehensive income in affiliates
Gains (losses) arising during the year ................................................................... ¥ 17 ¥ 226 $ 141
Reclassification adjustments to profit or loss ....................................................... (26) (4) (216)
Total ...................................................................................................................... ¥ (9) ¥ 222 $ (75)
Remeasurements of defined benefit plans
Adjustments arising during the year ..................................................................... ¥ (5,132) ¥ (5,127) $ (42,600)
Reclassification adjustments to profit or loss ....................................................... (1,344) (460) (11,156)
Amount before income tax effect ......................................................................... (6,476) (5,587) (53,756)
Income tax effect .................................................................................................. 2,764 1,862 22,943
Total ...................................................................................................................... ¥ (3,712) ¥ (3,725) $ (30,813)
Total other comprehensive income .......................................................................... ¥(18,204) ¥21,845 $(151,108)
66 Kao Corporation Annual Report 2015
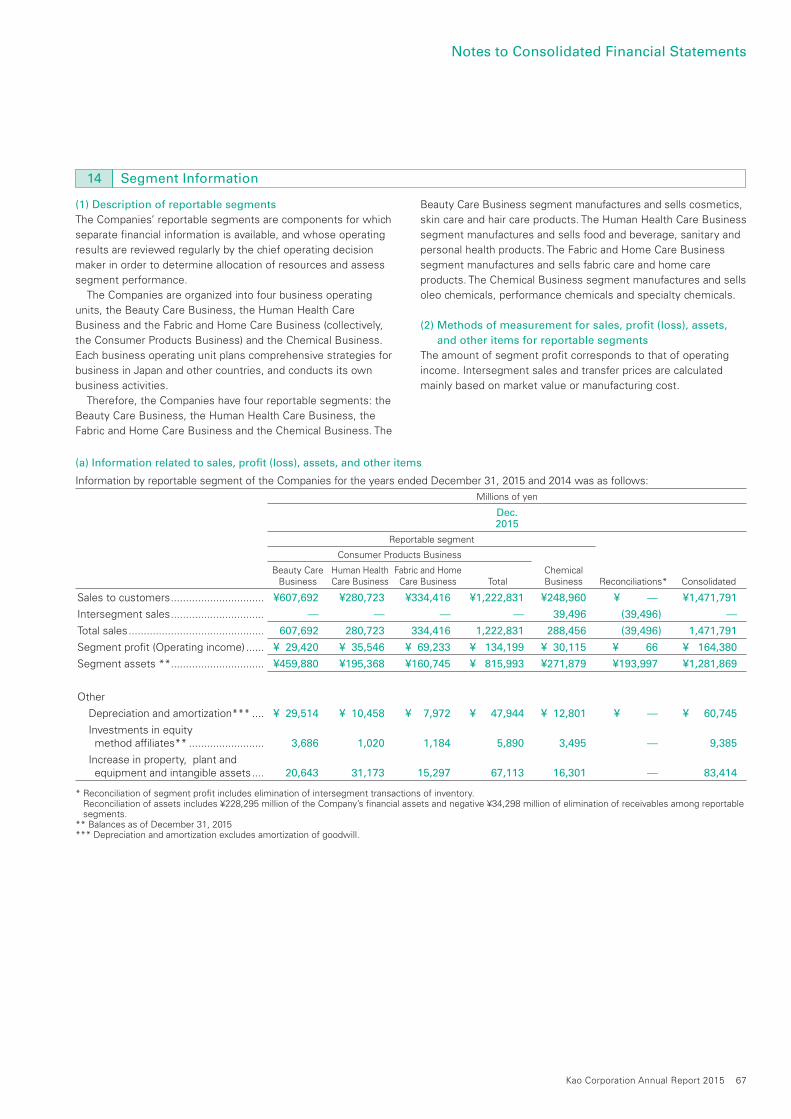
(1) Description of reportable segments
The Companies’ reportable segments are components for which
separate financial information is available, and whose operating
results are reviewed regularly by the chief operating decision
maker in order to determine allocation of resources and assess
segment performance.
The Companies are organized into four business operating
units, the Beauty Care Business, the Human Health Care
Business and the Fabric and Home Care Business (collectively,
the Consumer Products Business) and the Chemical Business.
Each business operating unit plans comprehensive strategies for
business in Japan and other countries, and conducts its own
business activities.
Therefore, the Companies have four reportable segments: the
Beauty Care Business, the Human Health Care Business, the
Fabric and Home Care Business and the Chemical Business. The
Beauty Care Business segment manufactures and sells cosmetics,
skin care and hair care products. The Human Health Care Business
segment manufactures and sells food and beverage, sanitary and
personal health products. The Fabric and Home Care Business
segment manufactures and sells fabric care and home care
products. The Chemical Business segment manufactures and sells
oleo chemicals, performance chemicals and specialty chemicals.
(2) Methods of measurement for sales, profit (loss), assets,
and other items for reportable segments
The amount of segment profit corresponds to that of operating
income. Intersegment sales and transfer prices are calculated
mainly based on market value or manufacturing cost.
14 Segment Information
(a) Information related to sales, profit (loss), assets, and other items
Information by reportable segment of the Companies for the years ended December 31, 2015 and 2014 was as follows:
Millions of yen
Dec.2015
Reportable segment
Consumer Products Business
Beauty Care Business
Human Health Care Business
Fabric and Home Care Business Total
Chemical Business Reconciliations* Consolidated
Sales to customers ............................... ¥607,692 ¥280,723 ¥334,416 ¥1,222,831 ¥248,960 ¥ — ¥1,471,791
Intersegment sales ............................... — — — — 39,496 (39,496) —
Total sales ............................................. 607,692 280,723 334,416 1,222,831 288,456 (39,496) 1,471,791
Segment profit (Operating income) ...... ¥ 29,420 ¥ 35,546 ¥ 69,233 ¥ 134,199 ¥ 30,115 ¥ 66 ¥ 164,380
Segment assets ** ............................... ¥459,880 ¥195,368 ¥160,745 ¥ 815,993 ¥271,879 ¥193,997 ¥1,281,869
Other
Depreciation and amortization*** .... ¥ 29,514 ¥ 10,458 ¥ 7,972 ¥ 47,944 ¥ 12,801 ¥ — ¥ 60,745
Investments in equity method affiliates** ......................... 3,686 1,020 1,184 5,890 3,495 — 9,385
Increase in property, plant and equipment and intangible assets .... 20,643 31,173 15,297 67,113 16,301 — 83,414
* Reconciliation of segment profit includes elimination of intersegment transactions of inventory. Reconciliation of assets includes ¥228,295 million of the Company’s financial assets and negative ¥34,298 million of elimination of receivables among reportable segments.
** Balances as of December 31, 2015*** Depreciation and amortization excludes amortization of goodwill.
Kao Corporation Annual Report 2015 67
Notes to Consolidated Financial Statements
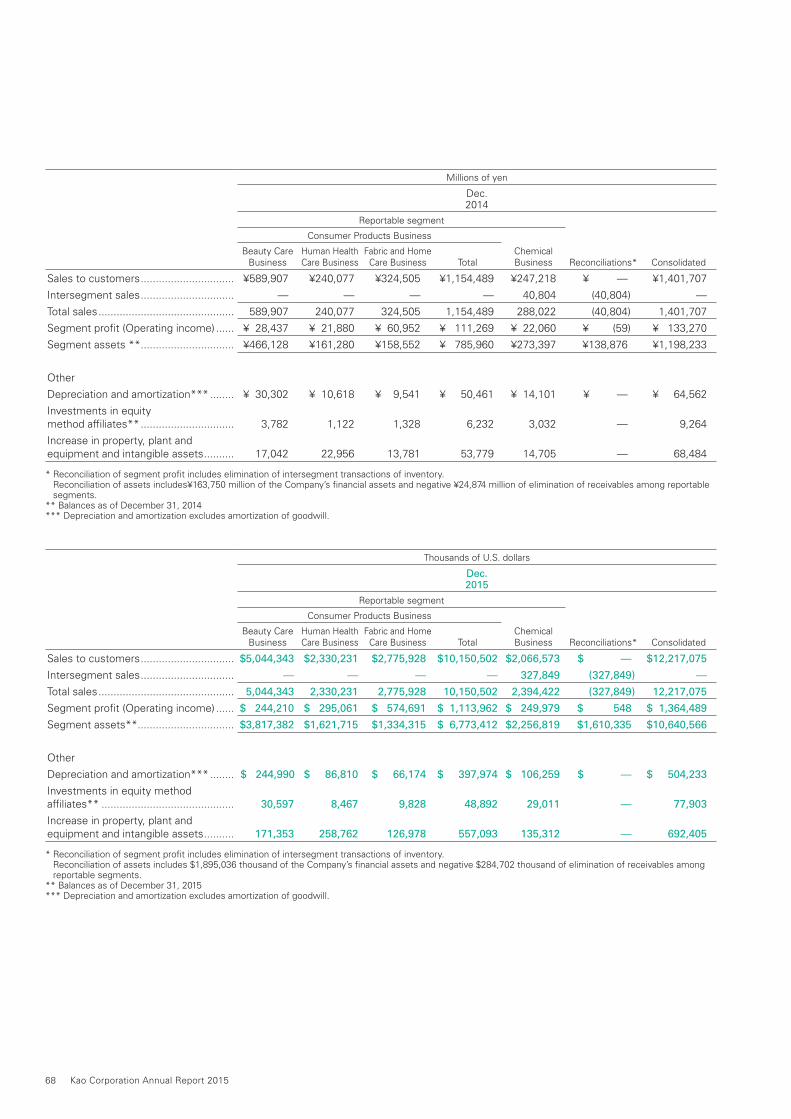
Millions of yen
Dec.2014
Reportable segment
Consumer Products Business
Beauty Care Business
Human Health Care Business
Fabric and Home Care Business Total
Chemical Business Reconciliations* Consolidated
Sales to customers ............................... ¥589,907 ¥240,077 ¥324,505 ¥1,154,489 ¥247,218 ¥ — ¥1,401,707
Intersegment sales ............................... — — — — 40,804 (40,804) —
Total sales ............................................. 589,907 240,077 324,505 1,154,489 288,022 (40,804) 1,401,707
Segment profit (Operating income) ...... ¥ 28,437 ¥ 21,880 ¥ 60,952 ¥ 111,269 ¥ 22,060 ¥ (59) ¥ 133,270
Segment assets ** ............................... ¥466,128 ¥161,280 ¥158,552 ¥ 785,960 ¥273,397 ¥138,876 ¥1,198,233
Other
Depreciation and amortization*** ........ ¥ 30,302 ¥ 10,618 ¥ 9,541 ¥ 50,461 ¥ 14,101 ¥ — ¥ 64,562
Investments in equity method affiliates** ............................... 3,782 1,122 1,328 6,232 3,032 — 9,264
Increase in property, plant and equipment and intangible assets .......... 17,042 22,956 13,781 53,779 14,705 — 68,484
* Reconciliation of segment profit includes elimination of intersegment transactions of inventory. Reconciliation of assets includes¥163,750 million of the Company’s financial assets and negative ¥24,874 million of elimination of receivables among reportable segments.
** Balances as of December 31, 2014*** Depreciation and amortization excludes amortization of goodwill.
Thousands of U.S. dollars
Dec.2015
Reportable segment
Consumer Products Business
Beauty Care Business
Human Health Care Business
Fabric and Home Care Business Total
Chemical Business Reconciliations* Consolidated
Sales to customers ............................... $5,044,343 $2,330,231 $2,775,928 $10,150,502 $2,066,573 $ — $12,217,075
Intersegment sales ............................... — — — — 327,849 (327,849) —
Total sales ............................................. 5,044,343 2,330,231 2,775,928 10,150,502 2,394,422 (327,849) 12,217,075
Segment profit (Operating income) ...... $ 244,210 $ 295,061 $ 574,691 $ 1,113,962 $ 249,979 $ 548 $ 1,364,489
Segment assets** ................................ $3,817,382 $1,621,715 $1,334,315 $ 6,773,412 $2,256,819 $1,610,335 $10,640,566
Other
Depreciation and amortization*** ........ $ 244,990 $ 86,810 $ 66,174 $ 397,974 $ 106,259 $ — $ 504,233
Investments in equity method affiliates** ............................................ 30,597 8,467 9,828 48,892 29,011 — 77,903
Increase in property, plant and equipment and intangible assets .......... 171,353 258,762 126,978 557,093 135,312 — 692,405
* Reconciliation of segment profit includes elimination of intersegment transactions of inventory. Reconciliation of assets includes $1,895,036 thousand of the Company’s financial assets and negative $284,702 thousand of elimination of receivables among reportable segments.
** Balances as of December 31, 2015*** Depreciation and amortization excludes amortization of goodwill.
68 Kao Corporation Annual Report 2015
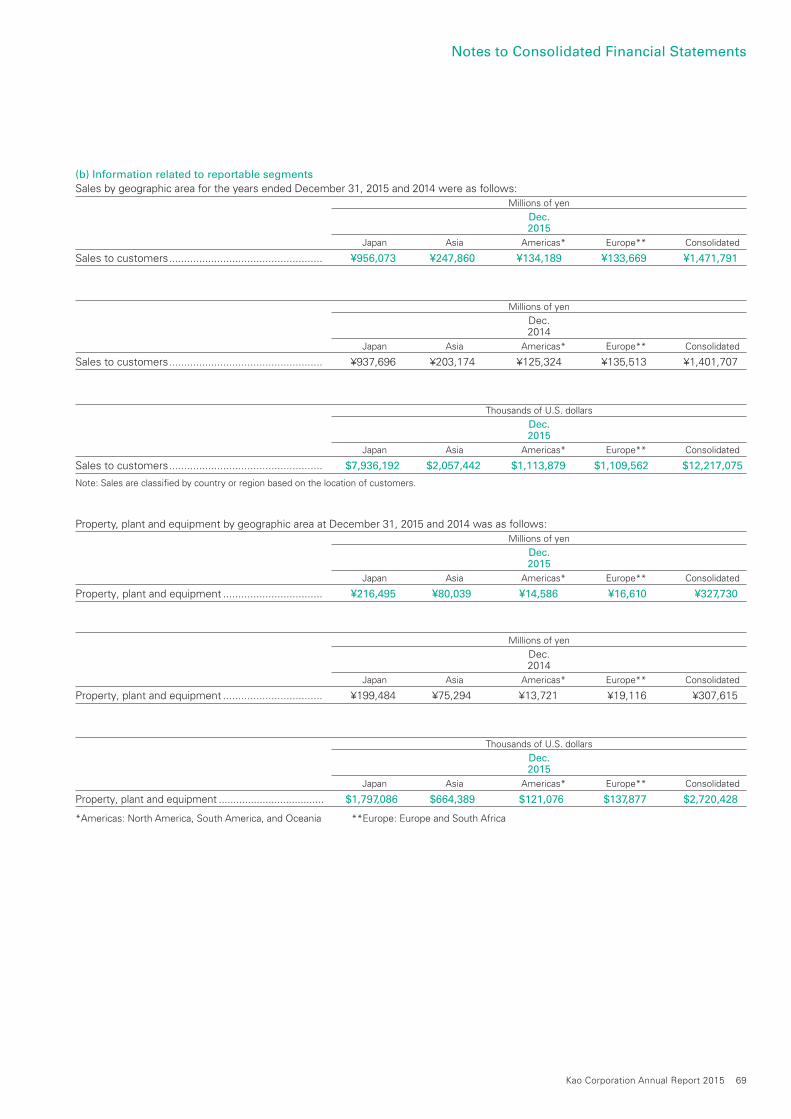
(b) Information related to reportable segmentsSales by geographic area for the years ended December 31, 2015 and 2014 were as follows: Millions of yen
Dec. 2015
Japan Asia Americas* Europe** Consolidated
Sales to customers ................................................... ¥956,073 ¥247,860 ¥134,189 ¥133,669 ¥1,471,791
Millions of yen
Dec. 2014
Japan Asia Americas* Europe** Consolidated
Sales to customers ................................................... ¥937,696 ¥203,174 ¥125,324 ¥135,513 ¥1,401,707
Thousands of U.S. dollars
Dec. 2015
Japan Asia Americas* Europe** Consolidated
Sales to customers ................................................... $7,936,192 $2,057,442 $1,113,879 $1,109,562 $12,217,075
Note: Sales are classified by country or region based on the location of customers.
Property, plant and equipment by geographic area at December 31, 2015 and 2014 was as follows: Millions of yen
Dec. 2015
Japan Asia Americas* Europe** Consolidated
Property, plant and equipment ................................. ¥216,495 ¥80,039 ¥14,586 ¥16,610 ¥327,730
Millions of yen
Dec. 2014
Japan Asia Americas* Europe** Consolidated
Property, plant and equipment ................................. ¥199,484 ¥75,294 ¥13,721 ¥19,116 ¥307,615
Thousands of U.S. dollars
Dec. 2015
Japan Asia Americas* Europe** Consolidated
Property, plant and equipment .................................... $1,797,086 $664,389 $121,076 $137,877 $2,720,428
*Americas: North America, South America, and Oceania **Europe: Europe and South Africa
Kao Corporation Annual Report 2015 69
Notes to Consolidated Financial Statements
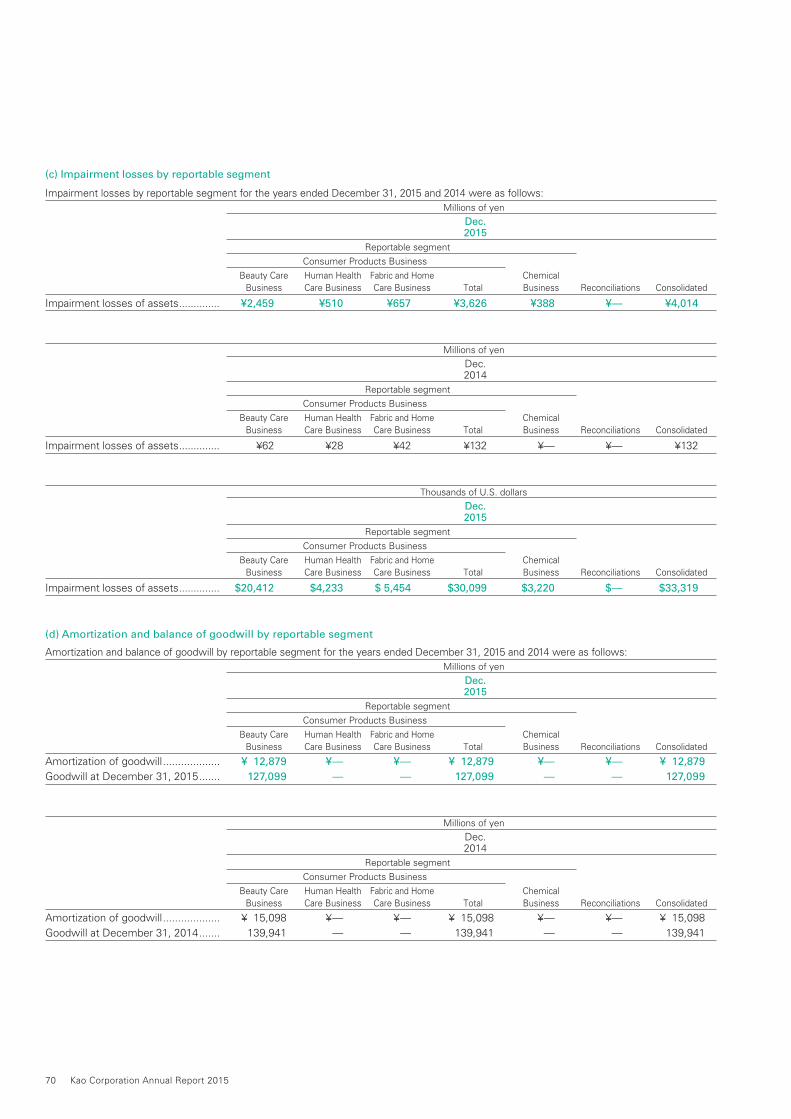
(c) Impairment losses by reportable segment
Impairment losses by reportable segment for the years ended December 31, 2015 and 2014 were as follows: Millions of yen
Dec. 2015
Reportable segment
Consumer Products Business
Beauty Care Human Health Fabric and Home Chemical Business Care Business Care Business Total Business Reconciliations Consolidated
Impairment losses of assets .............. ¥2,459 ¥510 ¥657 ¥3,626 ¥388 ¥— ¥4,014
Millions of yen
Dec. 2014
Reportable segment
Consumer Products Business
Beauty Care Human Health Fabric and Home Chemical Business Care Business Care Business Total Business Reconciliations Consolidated
Impairment losses of assets .............. ¥62 ¥28 ¥42 ¥132 ¥— ¥— ¥132
Thousands of U.S. dollars
Dec. 2015
Reportable segment
Consumer Products Business
Beauty Care Human Health Fabric and Home Chemical Business Care Business Care Business Total Business Reconciliations Consolidated
Impairment losses of assets .............. $20,412 $4,233 $ 5,454 $30,099 $3,220 $— $33,319
(d) Amortization and balance of goodwill by reportable segment
Amortization and balance of goodwill by reportable segment for the years ended December 31, 2015 and 2014 were as follows: Millions of yen
Dec. 2015
Reportable segment
Consumer Products Business
Beauty Care Human Health Fabric and Home Chemical Business Care Business Care Business Total Business Reconciliations Consolidated
Amortization of goodwill ................... ¥ 12,879 ¥— ¥— ¥ 12,879 ¥— ¥— ¥ 12,879
Goodwill at December 31, 2015 ....... 127,099 — — 127,099 — — 127,099
Millions of yen
Dec. 2014
Reportable segment
Consumer Products Business
Beauty Care Human Health Fabric and Home Chemical Business Care Business Care Business Total Business Reconciliations Consolidated
Amortization of goodwill ................... ¥ 15,098 ¥— ¥— ¥ 15,098 ¥— ¥— ¥ 15,098
Goodwill at December 31, 2014 ....... 139,941 — — 139,941 — — 139,941
70 Kao Corporation Annual Report 2015
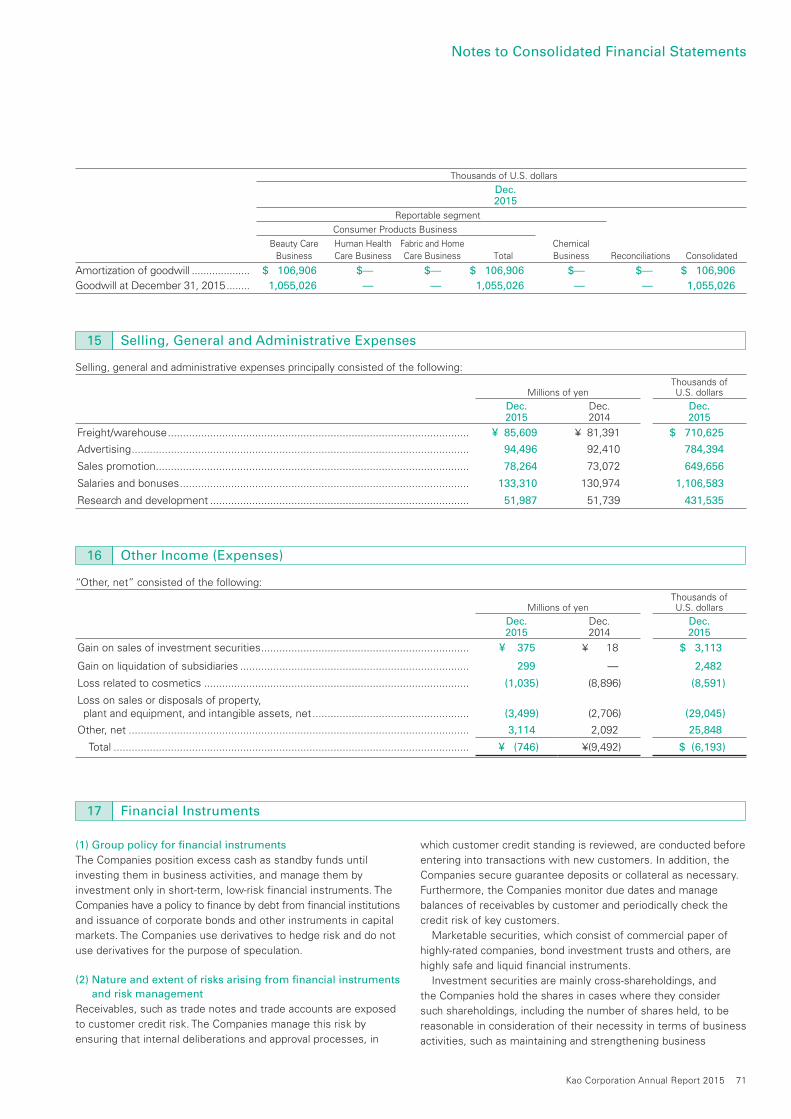
Thousands of U.S. dollars
Dec. 2015
Reportable segment
Consumer Products Business
Beauty Care Human Health Fabric and Home Chemical Business Care Business Care Business Total Business Reconciliations Consolidated
Amortization of goodwill .................... $ 106,906 $— $— $ 106,906 $— $— $ 106,906
Goodwill at December 31, 2015 ........ 1,055,026 — — 1,055,026 — — 1,055,026
Selling, general and administrative expenses principally consisted of the following:
Millions of yenThousands of U.S. dollars
Dec.2015
Dec.2014
Dec.2015
Freight/warehouse .................................................................................................... ¥ 85,609 ¥ 81,391 $ 710,625
Advertising ................................................................................................................ 94,496 92,410 784,394
Sales promotion ........................................................................................................ 78,264 73,072 649,656
Salaries and bonuses ................................................................................................ 133,310 130,974 1,106,583
Research and development ...................................................................................... 51,987 51,739 431,535
“Other, net” consisted of the following:
Millions of yenThousands of U.S. dollars
Dec.2015
Dec.2014
Dec.2015
Gain on sales of investment securities ..................................................................... ¥ 375 ¥ 18 $ 3,113
Gain on liquidation of subsidiaries ............................................................................ 299 — 2,482
Loss related to cosmetics ........................................................................................ (1,035) (8,896) (8,591)
Loss on sales or disposals of property, plant and equipment, and intangible assets, net .................................................... (3,499) (2,706) (29,045)
Other, net ................................................................................................................. 3,114 2,092 25,848
Total ...................................................................................................................... ¥ (746) ¥(9,492) $ (6,193)
15 Selling, General and Administrative Expenses
16 Other Income (Expenses)
(1) Group policy for financial instruments
The Companies position excess cash as standby funds until
investing them in business activities, and manage them by
investment only in short-term, low-risk financial instruments. The
Companies have a policy to finance by debt from financial institutions
and issuance of corporate bonds and other instruments in capital
markets. The Companies use derivatives to hedge risk and do not
use derivatives for the purpose of speculation.
(2) Nature and extent of risks arising from financial instruments and risk management
Receivables, such as trade notes and trade accounts are exposed
to customer credit risk. The Companies manage this risk by
ensuring that internal deliberations and approval processes, in
which customer credit standing is reviewed, are conducted before
entering into transactions with new customers. In addition, the
Companies secure guarantee deposits or collateral as necessary.
Furthermore, the Companies monitor due dates and manage
balances of receivables by customer and periodically check the
credit risk of key customers.
Marketable securities, which consist of commercial paper of
highly-rated companies, bond investment trusts and others, are
highly safe and liquid financial instruments.
Investment securities are mainly cross-shareholdings, and
the Companies hold the shares in cases where they consider
such shareholdings, including the number of shares held, to be
reasonable in consideration of their necessity in terms of business
activities, such as maintaining and strengthening business
17 Financial Instruments
Kao Corporation Annual Report 2015 71
Notes to Consolidated Financial Statements
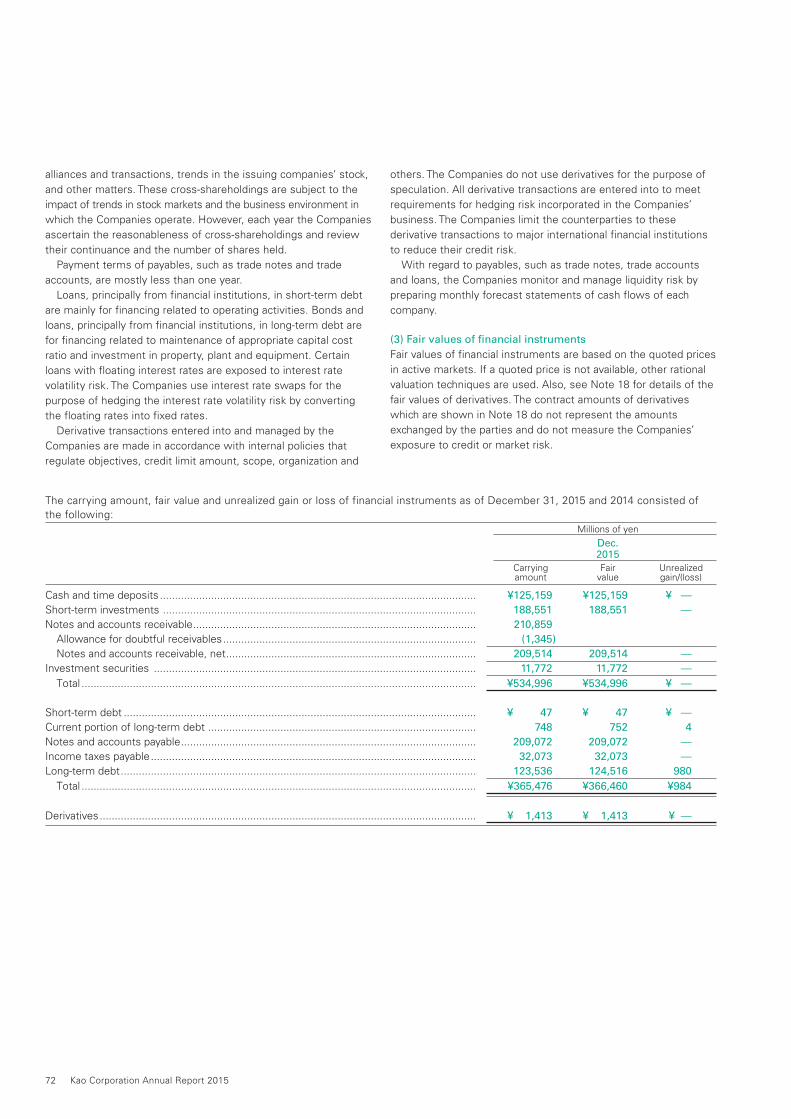
alliances and transactions, trends in the issuing companies’ stock,
and other matters. These cross-shareholdings are subject to the
impact of trends in stock markets and the business environment in
which the Companies operate. However, each year the Companies
ascertain the reasonableness of cross-shareholdings and review
their continuance and the number of shares held.
Payment terms of payables, such as trade notes and trade
accounts, are mostly less than one year.
Loans, principally from financial institutions, in short-term debt
are mainly for financing related to operating activities. Bonds and
loans, principally from financial institutions, in long-term debt are
for financing related to maintenance of appropriate capital cost
ratio and investment in property, plant and equipment. Certain
loans with floating interest rates are exposed to interest rate
volatility risk. The Companies use interest rate swaps for the
purpose of hedging the interest rate volatility risk by converting
the floating rates into fixed rates.
Derivative transactions entered into and managed by the
Companies are made in accordance with internal policies that
regulate objectives, credit limit amount, scope, organization and
others. The Companies do not use derivatives for the purpose of
speculation. All derivative transactions are entered into to meet
requirements for hedging risk incorporated in the Companies’
business. The Companies limit the counterparties to these
derivative transactions to major international financial institutions
to reduce their credit risk.
With regard to payables, such as trade notes, trade accounts
and loans, the Companies monitor and manage liquidity risk by
preparing monthly forecast statements of cash flows of each
company.
(3) Fair values of financial instruments
Fair values of financial instruments are based on the quoted prices
in active markets. If a quoted price is not available, other rational
valuation techniques are used. Also, see Note 18 for details of the
fair values of derivatives. The contract amounts of derivatives
which are shown in Note 18 do not represent the amounts
exchanged by the parties and do not measure the Companies’
exposure to credit or market risk.
The carrying amount, fair value and unrealized gain or loss of financial instruments as of December 31, 2015 and 2014 consisted of the following: Millions of yen
Dec. 2015 Carrying Fair Unrealized amount value gain/(loss)
Cash and time deposits ......................................................................................................... ¥125,159 ¥125,159 ¥ — Short-term investments ........................................................................................................ 188,551 188,551 —Notes and accounts receivable .............................................................................................. 210,859 Allowance for doubtful receivables .................................................................................... (1,345) Notes and accounts receivable, net ................................................................................... 209,514 209,514 — Investment securities ........................................................................................................... 11,772 11,772 —
Total ................................................................................................................................... ¥534,996 ¥534,996 ¥ —
Short-term debt ..................................................................................................................... ¥ 47 ¥ 47 ¥ — Current portion of long-term debt ......................................................................................... 748 752 4Notes and accounts payable .................................................................................................. 209,072 209,072 — Income taxes payable ............................................................................................................ 32,073 32,073 —Long-term debt ...................................................................................................................... 123,536 124,516 980
Total ................................................................................................................................... ¥365,476 ¥366,460 ¥984
Derivatives ............................................................................................................................. ¥ 1,413 ¥ 1,413 ¥ —
72 Kao Corporation Annual Report 2015
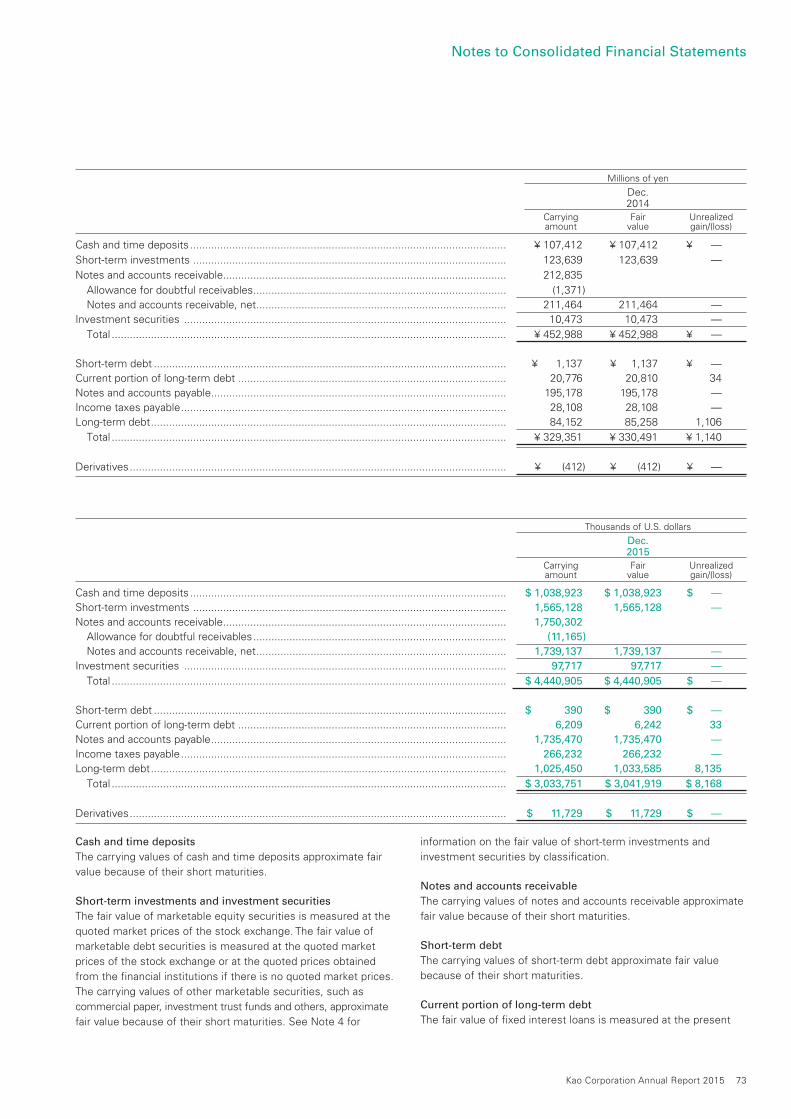
Millions of yen
Dec. 2014 Carrying Fair Unrealized amount value gain/(loss)
Cash and time deposits ......................................................................................................... ¥ 107,412 ¥ 107,412 ¥ —
Short-term investments ........................................................................................................ 123,639 123,639 —
Notes and accounts receivable .............................................................................................. 212,835
Allowance for doubtful receivables .................................................................................... (1,371) Notes and accounts receivable, net ................................................................................... 211,464 211,464 — Investment securities ........................................................................................................... 10,473 10,473 —
Total ................................................................................................................................... ¥ 452,988 ¥ 452,988 ¥ —
Short-term debt ..................................................................................................................... ¥ 1,137 ¥ 1,137 ¥ — Current portion of long-term debt ......................................................................................... 20,776 20,810 34Notes and accounts payable .................................................................................................. 195,178 195,178 — Income taxes payable ............................................................................................................ 28,108 28,108 —Long-term debt ...................................................................................................................... 84,152 85,258 1,106
Total ................................................................................................................................... ¥ 329,351 ¥ 330,491 ¥ 1,140
Derivatives ............................................................................................................................. ¥ (412) ¥ (412) ¥ —
Thousands of U.S. dollars
Dec. 2015 Carrying Fair Unrealized amount value gain/(loss)
Cash and time deposits ......................................................................................................... $ 1,038,923 $ 1,038,923 $ — Short-term investments ........................................................................................................ 1,565,128 1,565,128 —Notes and accounts receivable .............................................................................................. 1,750,302 Allowance for doubtful receivables .................................................................................... (11,165) Notes and accounts receivable, net ................................................................................... 1,739,137 1,739,137 — Investment securities ........................................................................................................... 97,717 97,717 —
Total ................................................................................................................................... $ 4,440,905 $ 4,440,905 $ —
Short-term debt ..................................................................................................................... $ 390 $ 390 $ — Current portion of long-term debt ......................................................................................... 6,209 6,242 33Notes and accounts payable .................................................................................................. 1,735,470 1,735,470 — Income taxes payable ............................................................................................................ 266,232 266,232 —Long-term debt ...................................................................................................................... 1,025,450 1,033,585 8,135
Total ................................................................................................................................... $ 3,033,751 $ 3,041,919 $ 8,168
Derivatives ............................................................................................................................. $ 11,729 $ 11,729 $ —
Cash and time deposits
The carrying values of cash and time deposits approximate fair
value because of their short maturities.
Short-term investments and investment securities
The fair value of marketable equity securities is measured at the
quoted market prices of the stock exchange. The fair value of
marketable debt securities is measured at the quoted market
prices of the stock exchange or at the quoted prices obtained
from the financial institutions if there is no quoted market prices.
The carrying values of other marketable securities, such as
commercial paper, investment trust funds and others, approximate
fair value because of their short maturities. See Note 4 for
information on the fair value of short-term investments and
investment securities by classification.
Notes and accounts receivable
The carrying values of notes and accounts receivable approximate
fair value because of their short maturities.
Short-term debt
The carrying values of short-term debt approximate fair value
because of their short maturities.
Current portion of long-term debt
The fair value of fixed interest loans is measured at the present
Kao Corporation Annual Report 2015 73
Notes to Consolidated Financial Statements
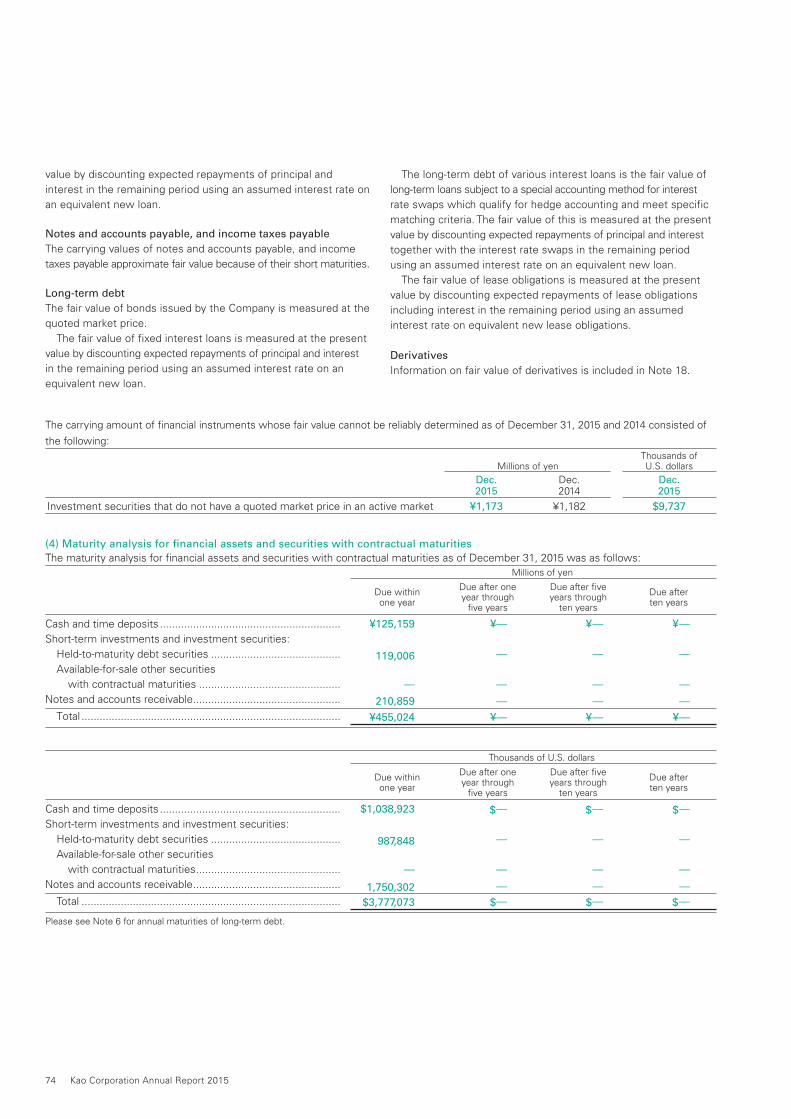
The carrying amount of financial instruments whose fair value cannot be reliably determined as of December 31, 2015 and 2014 consisted of
the following:
Millions of yenThousands of U.S. dollars
Dec.2015
Dec.2014
Dec.2015
Investment securities that do not have a quoted market price in an active market ¥1,173 ¥1,182 $9,737
(4) Maturity analysis for financial assets and securities with contractual maturitiesThe maturity analysis for financial assets and securities with contractual maturities as of December 31, 2015 was as follows: Millions of yen
Cash and time deposits ............................................................ ¥125,159 ¥— ¥— ¥—
Short-term investments and investment securities:
Held-to-maturity debt securities ........................................... 119,006 — — —
Available-for-sale other securities
with contractual maturities ............................................... — — — —
Notes and accounts receivable ................................................. 210,859 — — — Total ...................................................................................... ¥455,024 ¥— ¥— ¥—
Due after fiveyears through
ten years
Due afterten years
Due after oneyear through
five years
Due withinone year
value by discounting expected repayments of principal and
interest in the remaining period using an assumed interest rate on
an equivalent new loan.
Notes and accounts payable, and income taxes payable
The carrying values of notes and accounts payable, and income
taxes payable approximate fair value because of their short maturities.
Long-term debt
The fair value of bonds issued by the Company is measured at the
quoted market price.
The fair value of fixed interest loans is measured at the present
value by discounting expected repayments of principal and interest
in the remaining period using an assumed interest rate on an
equivalent new loan.
The long-term debt of various interest loans is the fair value of
long-term loans subject to a special accounting method for interest
rate swaps which qualify for hedge accounting and meet specific
matching criteria. The fair value of this is measured at the present
value by discounting expected repayments of principal and interest
together with the interest rate swaps in the remaining period
using an assumed interest rate on an equivalent new loan.
The fair value of lease obligations is measured at the present
value by discounting expected repayments of lease obligations
including interest in the remaining period using an assumed
interest rate on equivalent new lease obligations.
Derivatives
Information on fair value of derivatives is included in Note 18.
Thousands of U.S. dollars
Cash and time deposits ............................................................ $1,038,923 $— $— $—
Short-term investments and investment securities:
Held-to-maturity debt securities ........................................... 987,848 — — —
Available-for-sale other securities
with contractual maturities ................................................ — — — —
Notes and accounts receivable ................................................. 1,750,302 — — — Total ...................................................................................... $3,777,073 $— $— $— Please see Note 6 for annual maturities of long-term debt.
Due after fiveyears through
ten years
Due afterten years
Due after oneyear through
five years
Due withinone year
74 Kao Corporation Annual Report 2015
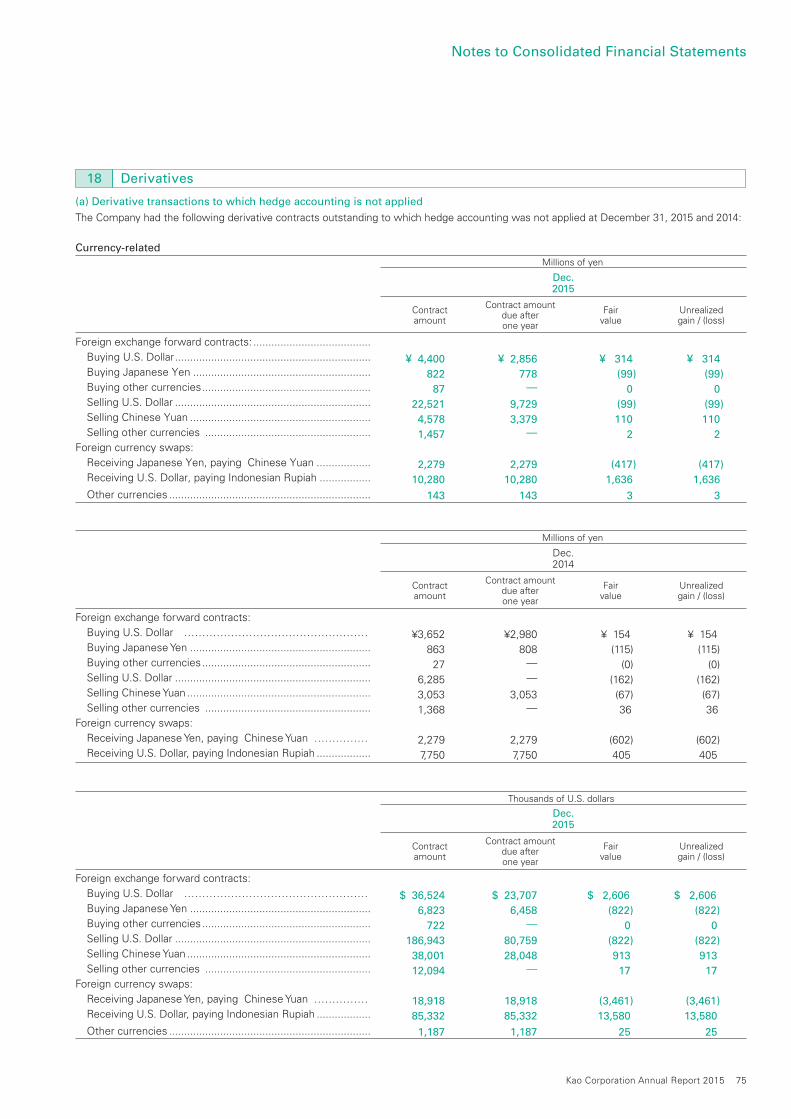
18 Derivatives
(a) Derivative transactions to which hedge accounting is not applied
The Company had the following derivative contracts outstanding to which hedge accounting was not applied at December 31, 2015 and 2014:
Currency-related Millions of yen
Foreign exchange forward contracts: .......................................
Buying U.S. Dollar ................................................................. ¥ 4,400 ¥ 2,856 ¥ 314 ¥ 314 Buying Japanese Yen ........................................................... 822 778 (99) (99) Buying other currencies ........................................................ 87 — 0 0
Selling U.S. Dollar ................................................................. 22,521 9,729 (99) (99) Selling Chinese Yuan ............................................................ 4,578 3,379 110 110
Selling other currencies ....................................................... 1,457 — 2 2
Foreign currency swaps:
Receiving Japanese Yen, paying Chinese Yuan .................. 2,279 2,279 (417) (417) Receiving U.S. Dollar, paying Indonesian Rupiah ................. 10,280 10,280 1,636 1,636
Other currencies ................................................................... 143 143 3 3
Fairvalue
Unrealizedgain / (loss)
Contract amount due after one year
Contract amount
Dec.2015
Thousands of U.S. dollars
Foreign exchange forward contracts:
Buying U.S. Dollar …………………………………………… $ 36,524 $ 23,707 $ 2,606 $ 2,606 Buying Japanese Yen ............................................................ 6,823 6,458 (822) (822) Buying other currencies ........................................................ 722 — 0 0 Selling U.S. Dollar ................................................................. 186,943 80,759 (822) (822) Selling Chinese Yuan ............................................................. 38,001 28,048 913 913 Selling other currencies ....................................................... 12,094 — 17 17Foreign currency swaps:
Receiving Japanese Yen, paying Chinese Yuan …………… 18,918 18,918 (3,461) (3,461) Receiving U.S. Dollar, paying Indonesian Rupiah .................. 85,332 85,332 13,580 13,580 Other currencies ................................................................... 1,187 1,187 25 25
Fairvalue
Unrealizedgain / (loss)
Contract amount due after one year
Contract amount
Dec.2015
Millions of yen
Foreign exchange forward contracts:
Buying U.S. Dollar …………………………………………… ¥3,652 ¥2,980 ¥ 154 ¥ 154 Buying Japanese Yen ............................................................ 863 808 (115) (115) Buying other currencies ........................................................ 27 — (0) (0) Selling U.S. Dollar ................................................................. 6,285 — (162) (162) Selling Chinese Yuan ............................................................. 3,053 3,053 (67) (67) Selling other currencies ....................................................... 1,368 — 36 36Foreign currency swaps:
Receiving Japanese Yen, paying Chinese Yuan …………… 2,279 2,279 (602) (602) Receiving U.S. Dollar, paying Indonesian Rupiah .................. 7,750 7,750 405 405
Fairvalue
Unrealizedgain / (loss)
Contract amount due after one year
Contract amount
Dec.2014
Kao Corporation Annual Report 2015 75
Notes to Consolidated Financial Statements
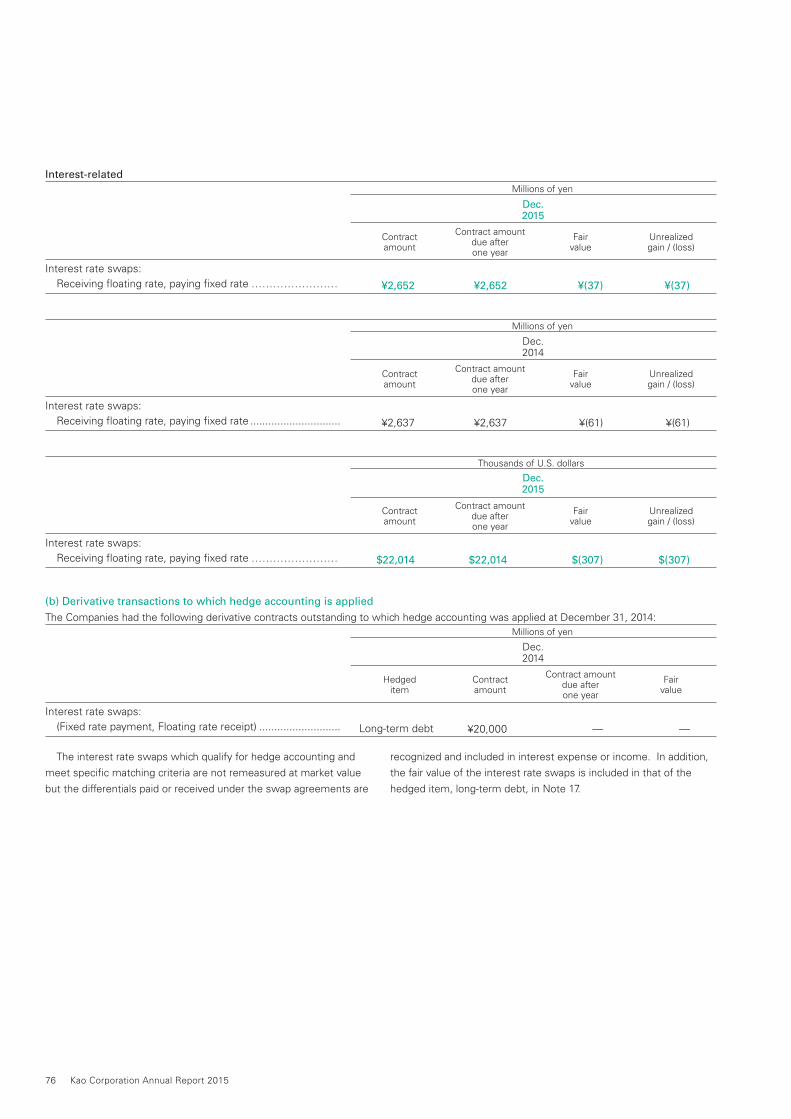
Interest-related Millions of yen
Interest rate swaps:
Receiving floating rate, paying fixed rate …………………… ¥2,652 ¥2,652 ¥(37) ¥(37)
Fairvalue
Unrealizedgain / (loss)
Contract amount due after one year
Contract amount
Dec.2015
Millions of yen
Interest rate swaps:
Receiving floating rate, paying fixed rate .............................. ¥2,637 ¥2,637 ¥(61) ¥(61)
Fairvalue
Unrealizedgain / (loss)
Contract amount due after one year
Contract amount
Dec.2014
(b) Derivative transactions to which hedge accounting is applied
The Companies had the following derivative contracts outstanding to which hedge accounting was applied at December 31, 2014: Millions of yen
Interest rate swaps:
(Fixed rate payment, Floating rate receipt) ........................... Long-term debt ¥20,000 — —
The interest rate swaps which qualify for hedge accounting and
meet specific matching criteria are not remeasured at market value
but the differentials paid or received under the swap agreements are
recognized and included in interest expense or income. In addition,
the fair value of the interest rate swaps is included in that of the
hedged item, long-term debt, in Note 17.
Contract amount due afterone year
Fair value
Contract amount
Hedgeditem
Dec.2014
Thousands of U.S. dollars
Interest rate swaps:
Receiving floating rate, paying fixed rate …………………… $22,014 $22,014 $(307) $(307)
Fairvalue
Unrealizedgain / (loss)
Contract amount due after one year
Contract amount
Dec.2015
76 Kao Corporation Annual Report 2015
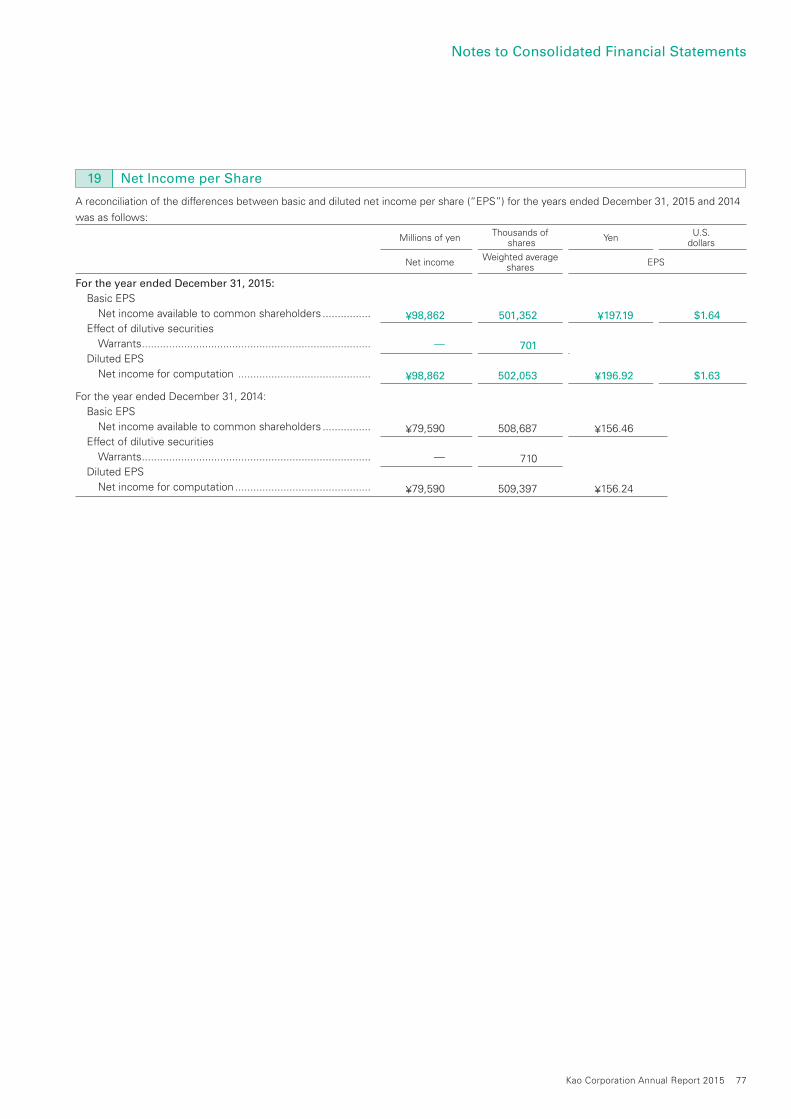
19 Net Income per Share
A reconciliation of the differences between basic and diluted net income per share (“EPS”) for the years ended December 31, 2015 and 2014
was as follows:
For the year ended December 31, 2015:
Basic EPS
Net income available to common shareholders ................ ¥98,862 501,352 ¥197.19 $1.64 Effect of dilutive securities
Warrants ............................................................................ — 701
Diluted EPS
Net income for computation ............................................ ¥98,862 502,053 ¥196.92 $1.63
For the year ended December 31, 2014:
Basic EPS
Net income available to common shareholders ................ ¥79,590 508,687 ¥156.46 Effect of dilutive securities
Warrants ............................................................................ — 710 Diluted EPS
Net income for computation ............................................. ¥79,590 509,397 ¥156.24
YenU.S.
dollarsThousands of
sharesMillions of yen
EPSWeighted average
sharesNet income
Kao Corporation Annual Report 2015 77
Notes to Consolidated Financial Statements
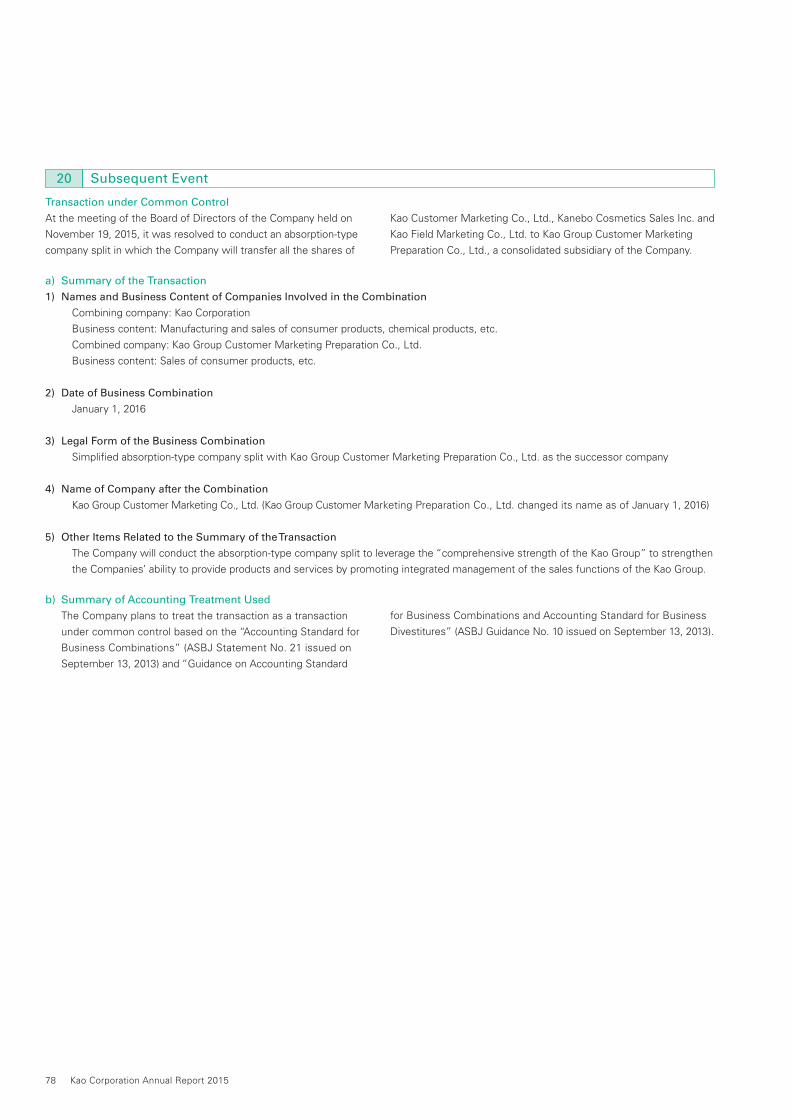
20 Subsequent Event
Transaction under Common Control
At the meeting of the Board of Directors of the Company held on
November 19, 2015, it was resolved to conduct an absorption-type
company split in which the Company will transfer all the shares of
Kao Customer Marketing Co., Ltd., Kanebo Cosmetics Sales Inc. and
Kao Field Marketing Co., Ltd. to Kao Group Customer Marketing
Preparation Co., Ltd., a consolidated subsidiary of the Company.
b) Summary of Accounting Treatment Used
The Company plans to treat the transaction as a transaction
under common control based on the “Accounting Standard for
Business Combinations” (ASBJ Statement No. 21 issued on
September 13, 2013) and “Guidance on Accounting Standard
for Business Combinations and Accounting Standard for Business
Divestitures” (ASBJ Guidance No. 10 issued on September 13, 2013).
a) Summary of the Transaction
1) Names and Business Content of Companies Involved in the Combination
Combining company: Kao Corporation
Business content: Manufacturing and sales of consumer products, chemical products, etc.
Combined company: Kao Group Customer Marketing Preparation Co., Ltd.
Business content: Sales of consumer products, etc.
2) Date of Business Combination
January 1, 2016
3) Legal Form of the Business Combination
Simplified absorption-type company split with Kao Group Customer Marketing Preparation Co., Ltd. as the successor company
4) Name of Company after the Combination
Kao Group Customer Marketing Co., Ltd. (Kao Group Customer Marketing Preparation Co., Ltd. changed its name as of January 1, 2016)
5) Other Items Related to the Summary of the Transaction
The Company will conduct the absorption-type company split to leverage the “comprehensive strength of the Kao Group” to strengthen
the Companies’ ability to provide products and services by promoting integrated management of the sales functions of the Kao Group.
78 Kao Corporation Annual Report 2015
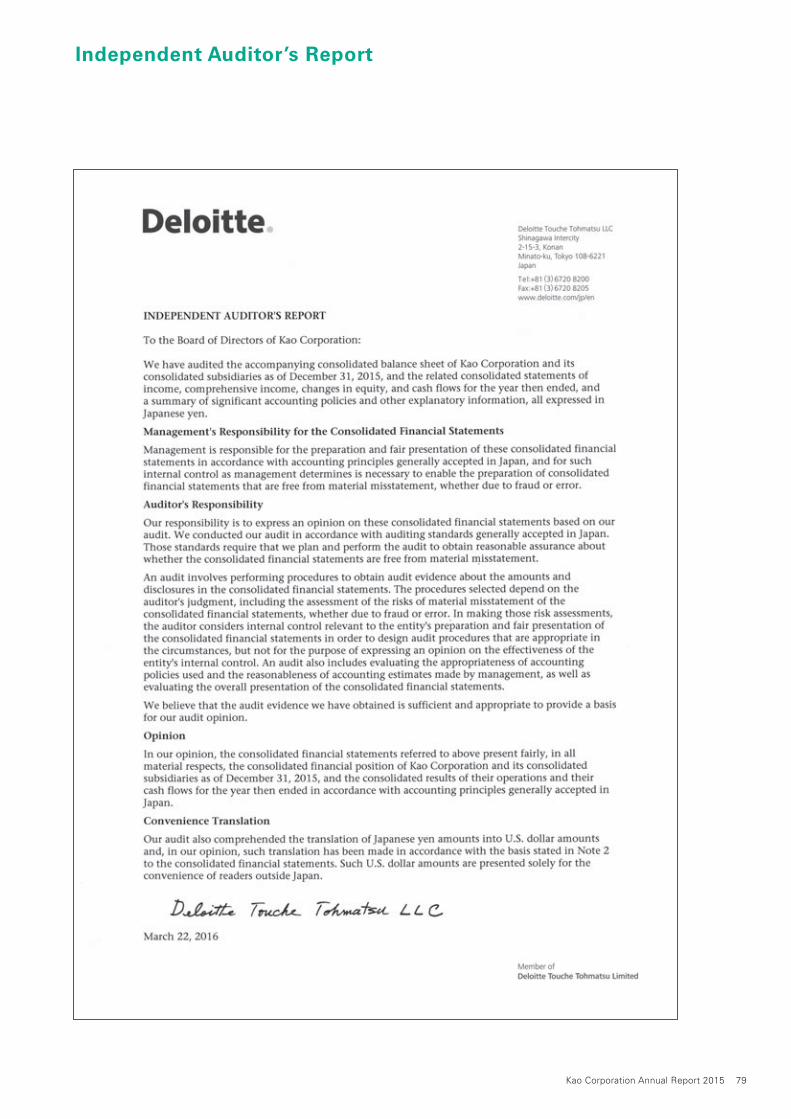
Independent Auditor’s Report
Kao Corporation Annual Report 2015 79
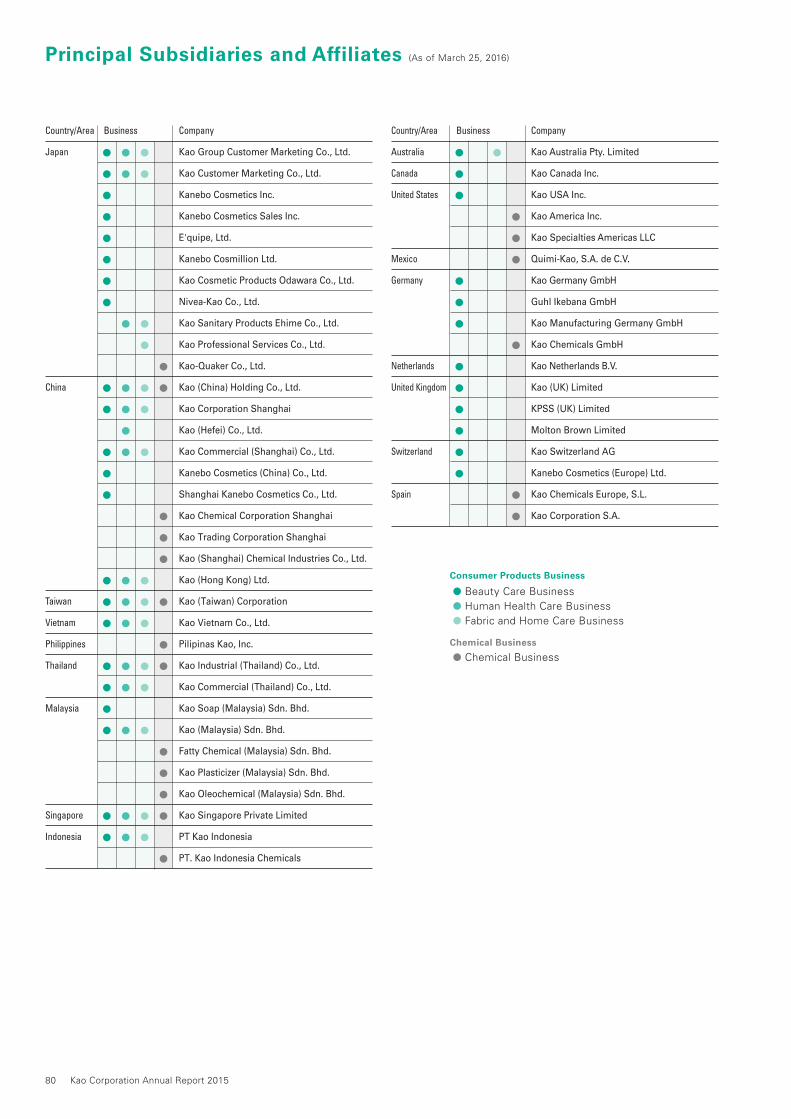
Country/Area
Japan
China
Taiwan
Vietnam
Philippines
Thailand
Malaysia
Singapore
Indonesia
Country/Area
Australia
Canada
United States
Mexico
Germany
Netherlands
United Kingdom
Switzerland
Spain
Company
Kao Group Customer Marketing Co., Ltd.
Kao Customer Marketing Co., Ltd.
Kanebo Cosmetics Inc.
Kanebo Cosmetics Sales Inc.
E'quipe, Ltd.
Kanebo Cosmillion Ltd.
Kao Cosmetic Products Odawara Co., Ltd.
Nivea-Kao Co., Ltd.
Kao Sanitary Products Ehime Co., Ltd.
Kao Professional Services Co., Ltd.
Kao-Quaker Co., Ltd.
Kao (China) Holding Co., Ltd.
Kao Corporation Shanghai
Kao (Hefei) Co., Ltd.
Kao Commercial (Shanghai) Co., Ltd.
Kanebo Cosmetics (China) Co., Ltd.
Shanghai Kanebo Cosmetics Co., Ltd.
Kao Chemical Corporation Shanghai
Kao Trading Corporation Shanghai
Kao (Shanghai) Chemical Industries Co., Ltd.
Kao (Hong Kong) Ltd.
Kao (Taiwan) Corporation
Kao Vietnam Co., Ltd.
Pilipinas Kao, Inc.
Kao Industrial (Thailand) Co., Ltd.
Kao Commercial (Thailand) Co., Ltd.
Kao Soap (Malaysia) Sdn. Bhd.
Kao (Malaysia) Sdn. Bhd.
Fatty Chemical (Malaysia) Sdn. Bhd.
Kao Plasticizer (Malaysia) Sdn. Bhd.
Kao Oleochemical (Malaysia) Sdn. Bhd.
Kao Singapore Private Limited
PT Kao Indonesia
PT. Kao Indonesia Chemicals
●
●
●
●
●
●
●
●
●
●
●
●
●
●
●
●
●
●
●
●
●
●
●
●
●
●
●
●
●
●
●
●
●
●
●
●
●
●
●
●
●
●
●
●
●
●
●
●
●
●
●
●
●
●
●
●
●
●
●
●
●
●
●
●
●
●
●
●
●
●
●
●
●
●
●
●
●
●
●
●
●
●
●
●
Consumer Products Business
● Beauty Care Business
● Human Health Care Business
● Fabric and Home Care Business
Chemical Business
● Chemical Business
Business Business Company
Kao Australia Pty. Limited
Kao Canada Inc.
Kao USA Inc.
Kao America Inc.
Kao Specialties Americas LLC
Quimi-Kao, S.A. de C.V.
Kao Germany GmbH
Guhl Ikebana GmbH
Kao Manufacturing Germany GmbH
Kao Chemicals GmbH
Kao Netherlands B.V.
Kao (UK) Limited
KPSS (UK) Limited
Molton Brown Limited
Kao Switzerland AG
Kanebo Cosmetics (Europe) Ltd.
Kao Chemicals Europe, S.L.
Kao Corporation S.A.
Principal Subsidiaries and Affiliates (As of March 25, 2016)
80 Kao Corporation Annual Report 2015
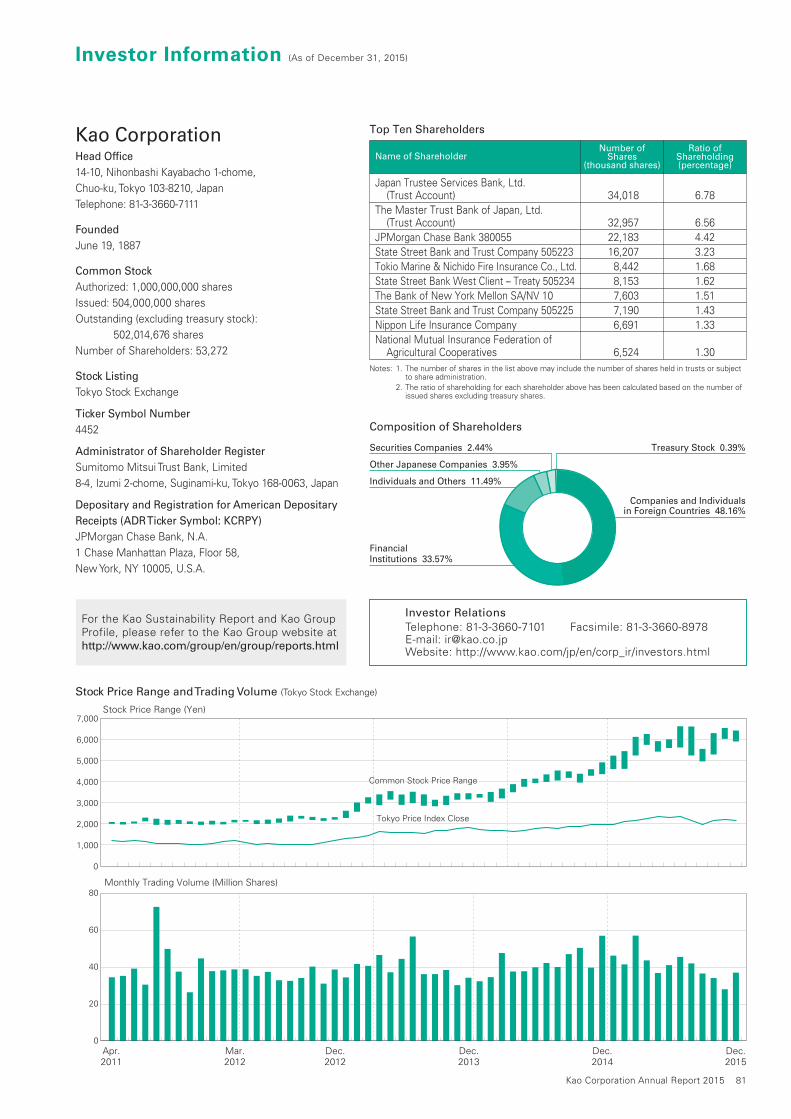
Companies and Individualsin Foreign Countries 48.16%
Financial Institutions 33.57%
Other Japanese Companies 3.95%
Treasury Stock 0.39%Securities Companies 2.44%
Individuals and Others 11.49%
Top Ten Shareholders
Number of Ratio of Name of Shareholder Shares Shareholding (thousand shares) (percentage)
Japan Trustee Services Bank, Ltd. (Trust Account) 34,018 6.78 The Master Trust Bank of Japan, Ltd. (Trust Account) 32,957 6.56 JPMorgan Chase Bank 380055 22,183 4.42 State Street Bank and Trust Company 505223 16,207 3.23 Tokio Marine & Nichido Fire Insurance Co., Ltd. 8,442 1.68 State Street Bank West Client – Treaty 505234 8,153 1.62 The Bank of New York Mellon SA/NV 10 7,603 1.51 State Street Bank and Trust Company 505225 7,190 1.43 Nippon Life Insurance Company 6,691 1.33 National Mutual Insurance Federation of Agricultural Cooperatives 6,524 1.30 Notes: 1. The number of shares in the list above may include the number of shares held in trusts or subject to share administration. 2. The ratio of shareholding for each shareholder above has been calculated based on the number of issued shares excluding treasury shares.
Composition of Shareholders
Apr.2011
Mar.2012
Dec.2012
Dec.2013
Dec.2015
Dec.2014
Monthly Trading Volume (Million Shares)
Stock Price Range (Yen)
Common Stock Price Range
Tokyo Price Index Close
0
1,000
2,000
3,000
5,000
4,000
6,000
7,000
0
20
40
60
80
Stock Price Range and Trading Volume (Tokyo Stock Exchange)
Investor RelationsTelephone: 81-3-3660-7101 Facsimile: 81-3-3660-8978E-mail: [email protected]: http://www.kao.com/jp/en/corp_ir/investors.html
For the Kao Sustainability Report and Kao Group Profile, please refer to the Kao Group website athttp://www.kao.com/group/en/group/reports.html
Kao Corporation Head Office
14-10, Nihonbashi Kayabacho 1-chome,
Chuo-ku, Tokyo 103-8210, Japan
Telephone: 81-3-3660-7111
Founded
June 19, 1887
Common Stock
Authorized: 1,000,000,000 shares
Issued: 504,000,000 shares
Outstanding (excluding treasury stock):
502,014,676 shares
Number of Shareholders: 53,272
Stock Listing
Tokyo Stock Exchange
Ticker Symbol Number
4452
Administrator of Shareholder Register
Sumitomo Mitsui Trust Bank, Limited
8-4, Izumi 2-chome, Suginami-ku, Tokyo 168-0063, Japan
Depositary and Registration for American Depositary
Receipts (ADR Ticker Symbol: KCRPY)
JPMorgan Chase Bank, N.A.
1 Chase Manhattan Plaza, Floor 58,
New York, NY 10005, U.S.A.
Investor Information (As of December 31, 2015)
Kao Corporation Annual Report 2015 81