Embed Size (px)
Citation preview
ORIGINAL REPORTS
The “July Effect” Does Not Have ClinicalRelevance in Liver Transplantation
Farah Karipineni, MD,* Hinaben Panchal, MD,† Kamran Khanmoradi, MD,* Afshin Parsikhia, MD,*and Jorge Ortiz, MD,*
*Department of Surgery, Albert Einstein Hospital, Philadelphia, Pennsylvania; and †Department of PediatricCardiology, North Shore Long Island Jewish Medical Center, New Hyde Park, New York
In the beginning of the academic year, medical errors areoften attributed to inexperienced medical staff. This potentialseasonal influence on health care outcomes is termed the“July effect.” No study has demonstrated the July effect inliver transplantation. We reviewed retrospectively collecteddata from the United Network for Organ Sharing for patientswho underwent liver transplantation from October 1987 toJune 2011 to determine if surgical outcomes were worse inJuly compared with rest of the year. We found no clinicaldifference in early graft survival (91.11% vs 90.72%,p ¼ 0.045) and no difference in early patient survival(94.71% vs 94.42%, p ¼ 0.057). Survival at 1 year, 3 years,and 5 years was also compared and no notable differenceswere detected. Because the Model for End-stage Liver Disease(MELD) score implementation in 2002 affected the acuity ofliver transplant recipients, we further stratified our data tocompare pre- and post-MELD survival to remove subjectivityas a confounding factor. MELD stratification revealed noseasonal difference in outcomes. There was no difference inrate of graft failure and acute and chronic rejection betweengroups. Our findings show no evidence of the July effect inliver transplantation. Each July, thousands of medical resi-dents take on new responsibilities in patient care. It has beensuggested that these new practitioners may produce errorsthat contribute to worse patient outcomes in the beginning ofthe academic year—a phenomenon called the “July effect.”Currently, there are few research studies with controversial
Financial support: No grants or financial contributions were obtained. This work wassupported in part by Health Resources and services Administration contract 234-2005-370011C. The content is responsibility of the authors alone and does notnecessarily reflect the views or policies of the Department of Health and HumanServices, nor does mention trade names, commercial products, or organizationsimply endorsement by U. S. Government.
Author contributions: Farah Karipineni, Drafting article and critical revision of thearticle; Hinaben Panchal, Statistics and data analysis/interpretation; KamranKhanmoradi, Approval of the article; Afshin Parsikhia, Critical revision of thearticle; Jorge Ortiz, Concept/design, critical revision of the article, and approval ofthe article.
Correspondence: Inquiries to Farah Karipineni, MD, MPH, Department of Surgery,Albert Einstein Medical Center, Klein 510, 5501 Old York Road, Philadelphia,Pennsylvania; e-mail: [email protected]
Journal of Surgical Education � & 2013 Association of Program DiElsevier Inc. All rights reserved.
evidence of poorer outcomes in July, and no articles addressthe effect of new medical staff in the setting of livertransplantation. Our study compares short-, medium-, andlong-term graft and patient survival between July and Augustand the remaining months using national data. We alsoexamine survival before and after the implementation of theMELD scoring system to determine its effect on outcomes inthe beginning of the academic year. ( J Surg 70:669-679.JC 2013 Association of Program Directors in Surgery.Published by Elsevier Inc. All rights reserved.)
KEY WORDS: July, house staff, errors, transplant, survival
COMPETENCIES: Medical Knowledge, Practice-BasedLearning and Improvement, Systems-Based Practice
INTRODUCTION
During the month of July, medical errors are oftenattributed to the arrival of inexperienced residents,1-6
fellows, and attending physicians. This potential seasonalinfluence on outcomes is termed the “July effect.”Several studies have been limited by small sample size,7-13
poor geographic representation,7-13,17,18,21 and short timespan.9-13,18 Many have found no difference in out-comes.7,8,10,12-18,21-25 Others have reported differencessupporting the July effect relative to increased costs, longerhospital stays, and higher complication rates.1,9-11,14,17-20,23
Study by Englesbe et al.9 employed the American College ofSurgeons National Surgical Quality Improvement Programand found an 18% increased risk-adjusted surgical morbid-ity and a 41% increased risk-adjusted surgical mortalityduring the months of July and August.To date, the July effect has not been evaluated in liver
transplantation. Our purpose was to determine if the outcomeswere worse in July compared with the other 11 months of theyear. We reviewed retrospectively collected data from the UnitedNetwork for Organ Sharing (UNOS) for liver transplantationsperformed from October 1987 to June 2011. Demographicattributes of both donors and recipients were compared, and
rectors in Surgery. Published by 1931-7204/$30.00http://dx.doi.org/10.1016/j.jsurg.2013.04.012
669
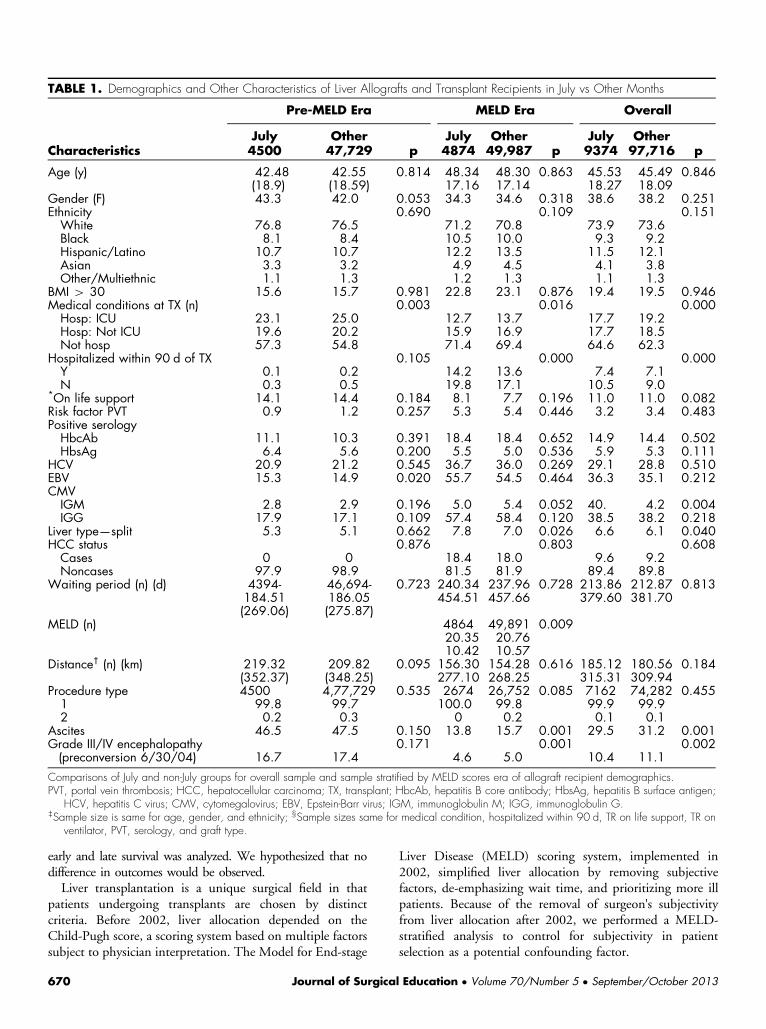
TABLE 1. Demographics and Other Characteristics of Liver Allografts and Transplant Recipients in July vs Other Months
Pre-MELD Era MELD Era Overall
July Other July Other July OtherCharacteristics 4500 47,729 p 4874 49,987 p 9374 97,716 p
Age (y) 42.48 42.55 0.814 48.34 48.30 0.863 45.53 45.49 0.846(18.9) (18.59) 17.16 17.14 18.27 18.09
Gender (F) 43.3 42.0 0.053 34.3 34.6 0.318 38.6 38.2 0.251Ethnicity 0.690 0.109 0.151White 76.8 76.5 71.2 70.8 73.9 73.6Black 8.1 8.4 10.5 10.0 9.3 9.2Hispanic/Latino 10.7 10.7 12.2 13.5 11.5 12.1Asian 3.3 3.2 4.9 4.5 4.1 3.8Other/Multiethnic 1.1 1.3 1.2 1.3 1.1 1.3
BMI 4 30 15.6 15.7 0.981 22.8 23.1 0.876 19.4 19.5 0.946Medical conditions at TX (n) 0.003 0.016 0.000Hosp: ICU 23.1 25.0 12.7 13.7 17.7 19.2Hosp: Not ICU 19.6 20.2 15.9 16.9 17.7 18.5Not hosp 57.3 54.8 71.4 69.4 64.6 62.3
Hospitalized within 90 d of TX 0.105 0.000 0.000Y 0.1 0.2 14.2 13.6 7.4 7.1N 0.3 0.5 19.8 17.1 10.5 9.0
*On life support 14.1 14.4 0.184 8.1 7.7 0.196 11.0 11.0 0.082Risk factor PVT 0.9 1.2 0.257 5.3 5.4 0.446 3.2 3.4 0.483Positive serologyHbcAb 11.1 10.3 0.391 18.4 18.4 0.652 14.9 14.4 0.502HbsAg 6.4 5.6 0.200 5.5 5.0 0.536 5.9 5.3 0.111
HCV 20.9 21.2 0.545 36.7 36.0 0.269 29.1 28.8 0.510EBV 15.3 14.9 0.020 55.7 54.5 0.464 36.3 35.1 0.212CMVIGM 2.8 2.9 0.196 5.0 5.4 0.052 40. 4.2 0.004IGG 17.9 17.1 0.109 57.4 58.4 0.120 38.5 38.2 0.218
Liver type—split 5.3 5.1 0.662 7.8 7.0 0.026 6.6 6.1 0.040HCC status 0.876 0.803 0.608Cases 0 0 18.4 18.0 9.6 9.2Noncases 97.9 98.9 81.5 81.9 89.4 89.8
Waiting period (n) (d) 4394-184.51(269.06)
46,694-186.05(275.87)
0.723 240.34 237.96 0.728 213.86 212.87 0.813454.51 457.66 379.60 381.70
MELD (n) 4864 49,891 0.00920.35 20.7610.42 10.57
Distance† (n) (km) 219.32(352.37)
209.82(348.25)
0.095 156.30 154.28 0.616 185.12 180.56 0.184277.10 268.25 315.31 309.94
Procedure type 4500 4,77,729 0.535 2674 26,752 0.085 7162 74,282 0.4551 99.8 99.7 100.0 99.8 99.9 99.92 0.2 0.3 0 0.2 0.1 0.1
Ascites 46.5 47.5 0.150 13.8 15.7 0.001 29.5 31.2 0.001Grade III/IV encephalopathy(preconversion 6/30/04)
0.171 0.001 0.00216.7 17.4 4.6 5.0 10.4 11.1
Comparisons of July and non-July groups for overall sample and sample stratified by MELD scores era of allograft recipient demographics.PVT, portal vein thrombosis; HCC, hepatocellular carcinoma; TX, transplant; HbcAb, hepatitis B core antibody; HbsAg, hepatitis B surface antigen;
HCV, hepatitis C virus; CMV, cytomegalovirus; EBV, Epstein-Barr virus; IGM, immunoglobulin M; IGG, immunoglobulin G.‡Sample size is same for age, gender, and ethnicity; §Sample sizes same for medical condition, hospitalized within 90 d, TR on life support, TR on
ventilator, PVT, serology, and graft type.
early and late survival was analyzed. We hypothesized that nodifference in outcomes would be observed.Liver transplantation is a unique surgical field in that
patients undergoing transplants are chosen by distinctcriteria. Before 2002, liver allocation depended on theChild-Pugh score, a scoring system based on multiple factorssubject to physician interpretation. The Model for End-stage
670 Journal of Surgica
Liver Disease (MELD) scoring system, implemented in2002, simplified liver allocation by removing subjectivefactors, de-emphasizing wait time, and prioritizing more illpatients. Because of the removal of surgeon's subjectivityfrom liver allocation after 2002, we performed a MELD-stratified analysis to control for subjectivity in patientselection as a potential confounding factor.
l Education � Volume 70/Number 5 � September/October 2013
STUDY DESIGN AND METHODS
We obtained deidentified liver transplant data from 1987 to2011 from the UNet database. This database is a nationalsystem containing data from every organ donation andtransplant event occurring in the United States since 1986.A complete description of UNet is available at the UNOSwebsite. The data were received in SAS (.sas7bdat) filewritten in characters encoding (Windows-1252), which wasretrieved using SPSS (into.sav files). All statistical analyseswere performed with SPSS (version 20.0; IBM SPSS Inc.,Chicago, IL) on MAC OS X Lion 10.7.3(11D5D)platform.Patients who underwent liver transplantation from
January 1, 1988 to December 31, 2010 were enrolled.The survival analysis included retrospectively collectedright-censored data of total transplantations (N ¼107,074), of which 9374 were performed during Julyand 97,700 during other months. For the purpose ofMELD stratification, we grouped cases up to February2002 (n ¼ 52,229) into pre-MELD era, and those fromMarch 2002 to December 2010 into MELD era (n ¼54,845). We studied the safety of liver transplantation inJuly by examining short- and long-term liver allograft andpatient survival stratified by MELD era in cases occurringover a period of more than 2 decades.
STATISTICAL ANALYSIS
We performed Kaplan-Meier analysis with MELD score erastratification to determine whether there was an era effect inour results. To determine survival differences, we analyzedearly graft loss and patient death within 30 days of livertransplantation as well as long-term survivals at 1 year,3 years, and 5 years.We compared our predetermined outcomes of July with
the other 11 months of the year individually, as well ascollectively. Because many surgical training and workingopportunities may begin in late July, we also considered thebeginning of academic training as the months of July andAugust together. We compared graft and patient survival inthese 2 months with the other 10 months overall. Graftsurvival was defined as the time to graft loss, and patientsurvival was defined as the time to patient death. Survivaldistributions were compared using the Cox-Mantel log-rankstatistics and chi-square statistics. Additionally, we ran theCox regression multivariate survival analysis adjusting forconfounding factors.We compared donor, recipient, and graft characteristics
for both groups. Predictive variables for predeterminedoutcomes were determined using multivariate analysis fora significant value of inclusion of p o 0.1. Numericalvariables including age, total warm ischemia time, total coldischemia time, MELD scores, length of stay or
Journal of Surgical Education � Volume 70/Number 5 � September
posttransplant hospitalization, and waiting days on the trans-plant list were compared using the 2-tailed Student t-test forindependent samples. All values were recorded as mean andstandard deviation (Tables 1 and 2). Nominal variablesincluding gender, age group, body mass index (BMI) category,ethnicity, complications at transplant, causes of graft failure,hepatocellular carcinoma status, and donor type were com-pared using chi-square statistics and recorded as percentage ofthe total number within the group. Probability values were2-tailed, and type I error rate was set at 0.05.
RESULTS
Recipient Characteristics
Recipient variables are displayed in Table 1. Analysis of thesame variables combining July and August to the other 10months is displayed in Table 2 and revealed no clinicallyrelevant differences from the original analysis. The propor-tion of patients in the intensive care unit (ICU) at trans-plantation (17.7% vs 19.2%) and hospitalized but not inICU (17.7% vs 18.5%) were minimally but significantlylower in the July group than the non-July group (p o0.0001). Less than half as many patients in the July grouprequired blood transfusion of 5 or more units for portalhypertensive bleeds (0.8% vs 1.7%, respectively, p o0.0001).In the pre-MELD era, there was no statistical difference
in the recipient data, with the exception of finding relativelyfewer recipients in the ICU and hospitalized but not in theICU at transplantation in July (23.1% vs 25.0% and 19.6%vs 20.2%, p ¼ 0.003) than in other months.In the MELD era, there were also fewer recipients in the
ICU and hospitalized but not in the ICU at transplantation(12.7% vs 13.7% and 15.9% vs 16.9%, p ¼ 0.016) in July.A relatively higher number of transplantations involved splitliver in July compared with the other group (7.8% vs 7.0%,p ¼ 0.026). Fewer transplant recipients had ascites andgrade III/IV encephalopathy in the July group (13.8%% vs15.7%, p ¼ 0. 001 and 4.6% vs 5.0%, p ¼ 0.001,respectively).
Donor Characteristics
Donor characteristics are displayed in Table 3. Analysiscombining July and August compared with other monthswas also performed and revealed no clinically significantdifferences (Table 4). There were more living donors (4.5%vs 3.0%, p ¼ 0.012) and fewer female donors (38.7% vs40.3%, p ¼ 0.003) in July compared with other months.Fewer donors had hypertension and BMI higher than 30 inthe July group (18.1% vs 20.6% and 11.9% vs 13.3%,respectively, p o 0.0001). There was a lower proportion ofextended criteria donors in July than the non-July group(18.3% vs 20.5%, p o 0.0001).
/October 2013 671
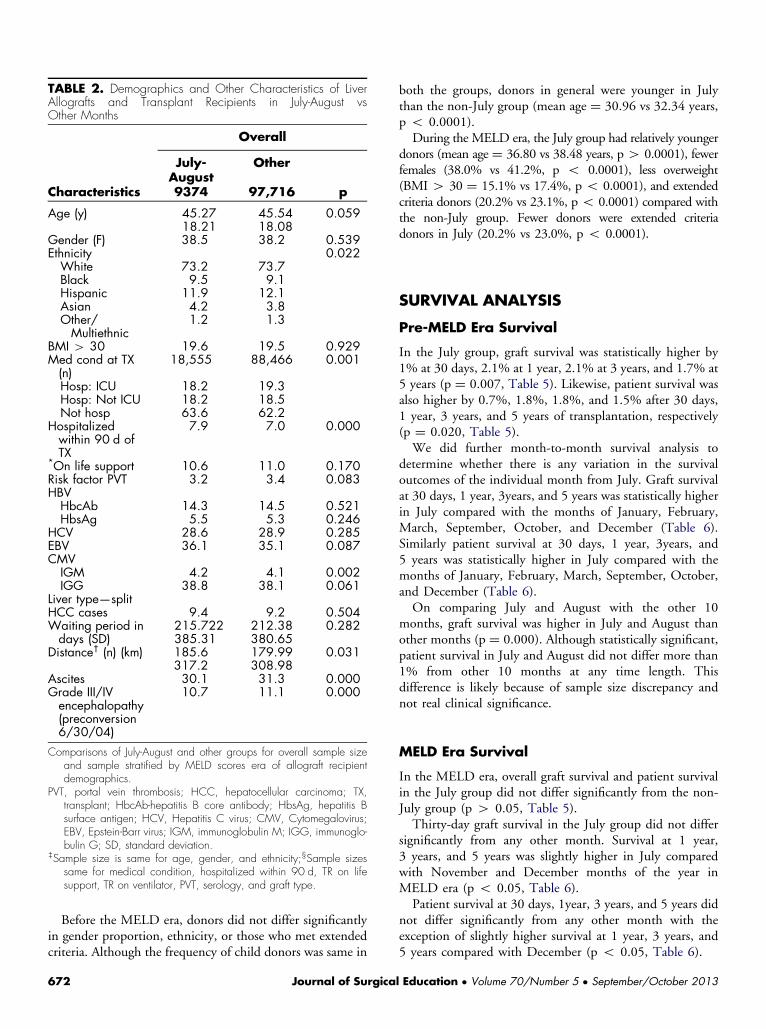
TABLE 2. Demographics and Other Characteristics of LiverAllografts and Transplant Recipients in July-August vsOther Months
Overall
July-August
Other
Characteristics 9374 97,716 p
Age (y) 45.27 45.54 0.05918.21 18.08
Gender (F) 38.5 38.2 0.539Ethnicity 0.022White 73.2 73.7Black 9.5 9.1Hispanic 11.9 12.1Asian 4.2 3.8Other/Multiethnic
1.2 1.3
BMI 4 30 19.6 19.5 0.929Med cond at TX(n)
18,555 88,466 0.001
Hosp: ICU 18.2 19.3Hosp: Not ICU 18.2 18.5Not hosp 63.6 62.2
Hospitalizedwithin 90 d ofTX
7.9 7.0 0.000
*On life support 10.6 11.0 0.170Risk factor PVT 3.2 3.4 0.083HBVHbcAb 14.3 14.5 0.521HbsAg 5.5 5.3 0.246
HCV 28.6 28.9 0.285EBV 36.1 35.1 0.087CMVIGM 4.2 4.1 0.002IGG 38.8 38.1 0.061
Liver type—splitHCC cases 9.4 9.2 0.504Waiting period indays (SD)
215.722 212.38 0.282385.31 380.65
Distance† (n) (km) 185.6 179.99 0.031317.2 308.98
Ascites 30.1 31.3 0.000Grade III/IVencephalopathy(preconversion6/30/04)
10.7 11.1 0.000
Comparisons of July-August and other groups for overall sample sizeand sample stratified by MELD scores era of allograft recipientdemographics.
PVT, portal vein thrombosis; HCC, hepatocellular carcinoma; TX,transplant; HbcAb-hepatitis B core antibody; HbsAg, hepatitis Bsurface antigen; HCV, Hepatitis C virus; CMV, Cytomegalovirus;EBV, Epstein-Barr virus; IGM, immunoglobulin M; IGG, immunoglo-bulin G; SD, standard deviation.
‡Sample size is same for age, gender, and ethnicity;§Sample sizessame for medical condition, hospitalized within 90 d, TR on lifesupport, TR on ventilator, PVT, serology, and graft type.
Before the MELD era, donors did not differ significantlyin gender proportion, ethnicity, or those who met extendedcriteria. Although the frequency of child donors was same in
672 Journal of Surgica
both the groups, donors in general were younger in Julythan the non-July group (mean age ¼ 30.96 vs 32.34 years,p o 0.0001).During the MELD era, the July group had relatively younger
donors (mean age ¼ 36.80 vs 38.48 years, p4 0.0001), fewerfemales (38.0% vs 41.2%, p o 0.0001), less overweight(BMI 4 30 ¼ 15.1% vs 17.4%, p o 0.0001), and extendedcriteria donors (20.2% vs 23.1%, p o 0.0001) compared withthe non-July group. Fewer donors were extended criteriadonors in July (20.2% vs 23.0%, p o 0.0001).
SURVIVAL ANALYSIS
Pre-MELD Era Survival
In the July group, graft survival was statistically higher by1% at 30 days, 2.1% at 1 year, 2.1% at 3 years, and 1.7% at5 years (p ¼ 0.007, Table 5). Likewise, patient survival wasalso higher by 0.7%, 1.8%, 1.8%, and 1.5% after 30 days,1 year, 3 years, and 5 years of transplantation, respectively(p ¼ 0.020, Table 5).We did further month-to-month survival analysis to
determine whether there is any variation in the survivaloutcomes of the individual month from July. Graft survivalat 30 days, 1 year, 3years, and 5 years was statistically higherin July compared with the months of January, February,March, September, October, and December (Table 6).Similarly patient survival at 30 days, 1 year, 3years, and5 years was statistically higher in July compared with themonths of January, February, March, September, October,and December (Table 6).On comparing July and August with the other 10
months, graft survival was higher in July and August thanother months (p ¼ 0.000). Although statistically significant,patient survival in July and August did not differ more than1% from other 10 months at any time length. Thisdifference is likely because of sample size discrepancy andnot real clinical significance.
MELD Era Survival
In the MELD era, overall graft survival and patient survivalin the July group did not differ significantly from the non-July group (p 4 0.05, Table 5).Thirty-day graft survival in the July group did not differ
significantly from any other month. Survival at 1 year,3 years, and 5 years was slightly higher in July comparedwith November and December months of the year inMELD era (p o 0.05, Table 6).Patient survival at 30 days, 1year, 3 years, and 5 years did
not differ significantly from any other month with theexception of slightly higher survival at 1 year, 3 years, and5 years compared with December (p o 0.05, Table 6).
l Education � Volume 70/Number 5 � September/October 2013
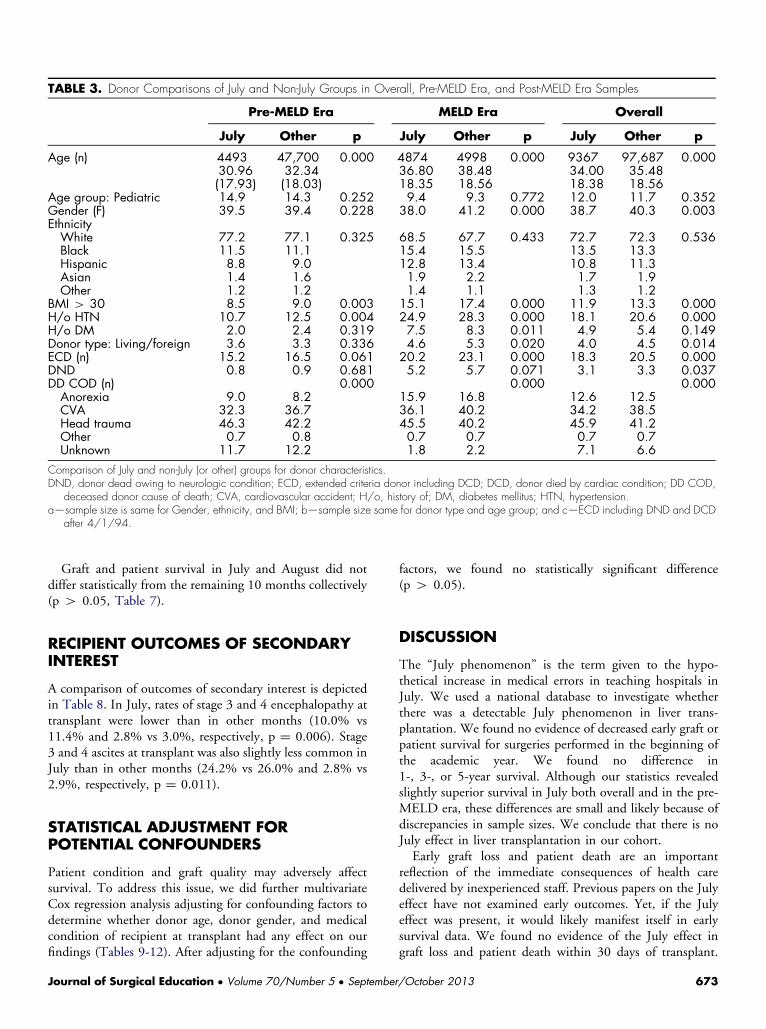
TABLE 3. Donor Comparisons of July and Non-July Groups in Overall, Pre-MELD Era, and Post-MELD Era Samples
Pre-MELD Era MELD Era Overall
July Other p July Other p July Other p
Age (n) 4493 47,700 0.000 4874 4998 0.000 9367 97,687 0.00030.96 32.34 36.80 38.48 34.00 35.48(17.93) (18.03) 18.35 18.56 18.38 18.56
Age group: Pediatric 14.9 14.3 0.252 9.4 9.3 0.772 12.0 11.7 0.352Gender (F) 39.5 39.4 0.228 38.0 41.2 0.000 38.7 40.3 0.003EthnicityWhite 77.2 77.1 0.325 68.5 67.7 0.433 72.7 72.3 0.536Black 11.5 11.1 15.4 15.5 13.5 13.3Hispanic 8.8 9.0 12.8 13.4 10.8 11.3Asian 1.4 1.6 1.9 2.2 1.7 1.9Other 1.2 1.2 1.4 1.1 1.3 1.2
BMI 4 30 8.5 9.0 0.003 15.1 17.4 0.000 11.9 13.3 0.000H/o HTN 10.7 12.5 0.004 24.9 28.3 0.000 18.1 20.6 0.000H/o DM 2.0 2.4 0.319 7.5 8.3 0.011 4.9 5.4 0.149Donor type: Living/foreign 3.6 3.3 0.336 4.6 5.3 0.020 4.0 4.5 0.014ECD (n) 15.2 16.5 0.061 20.2 23.1 0.000 18.3 20.5 0.000DND 0.8 0.9 0.681 5.2 5.7 0.071 3.1 3.3 0.037DD COD (n) 0.000 0.000 0.000Anorexia 9.0 8.2 15.9 16.8 12.6 12.5CVA 32.3 36.7 36.1 40.2 34.2 38.5Head trauma 46.3 42.2 45.5 40.2 45.9 41.2Other 0.7 0.8 0.7 0.7 0.7 0.7Unknown 11.7 12.2 1.8 2.2 7.1 6.6
Comparison of July and non-July (or other) groups for donor characteristics.DND, donor dead owing to neurologic condition; ECD, extended criteria donor including DCD; DCD, donor died by cardiac condition; DD COD,
deceased donor cause of death; CVA, cardiovascular accident; H/o, history of; DM, diabetes mellitus; HTN, hypertension.a—sample size is same for Gender, ethnicity, and BMI; b—sample size same for donor type and age group; and c—ECD including DND and DCD
after 4/1/94.
Graft and patient survival in July and August did notdiffer statistically from the remaining 10 months collectively(p 4 0.05, Table 7).
RECIPIENT OUTCOMES OF SECONDARYINTEREST
A comparison of outcomes of secondary interest is depictedin Table 8. In July, rates of stage 3 and 4 encephalopathy attransplant were lower than in other months (10.0% vs11.4% and 2.8% vs 3.0%, respectively, p ¼ 0.006). Stage3 and 4 ascites at transplant was also slightly less common inJuly than in other months (24.2% vs 26.0% and 2.8% vs2.9%, respectively, p ¼ 0.011).
STATISTICAL ADJUSTMENT FORPOTENTIAL CONFOUNDERS
Patient condition and graft quality may adversely affectsurvival. To address this issue, we did further multivariateCox regression analysis adjusting for confounding factors todetermine whether donor age, donor gender, and medicalcondition of recipient at transplant had any effect on ourfindings (Tables 9-12). After adjusting for the confounding
Journal of Surgical Education � Volume 70/Number 5 � September
factors, we found no statistically significant difference(p 4 0.05).
DISCUSSION
The “July phenomenon” is the term given to the hypo-thetical increase in medical errors in teaching hospitals inJuly. We used a national database to investigate whetherthere was a detectable July phenomenon in liver trans-plantation. We found no evidence of decreased early graft orpatient survival for surgeries performed in the beginning ofthe academic year. We found no difference in1-, 3-, or 5-year survival. Although our statistics revealedslightly superior survival in July both overall and in the pre-MELD era, these differences are small and likely because ofdiscrepancies in sample sizes. We conclude that there is noJuly effect in liver transplantation in our cohort.Early graft loss and patient death are an important
reflection of the immediate consequences of health caredelivered by inexperienced staff. Previous papers on the Julyeffect have not examined early outcomes. Yet, if the Julyeffect was present, it would likely manifest itself in earlysurvival data. We found no evidence of the July effect ingraft loss and patient death within 30 days of transplant.
/October 2013 673
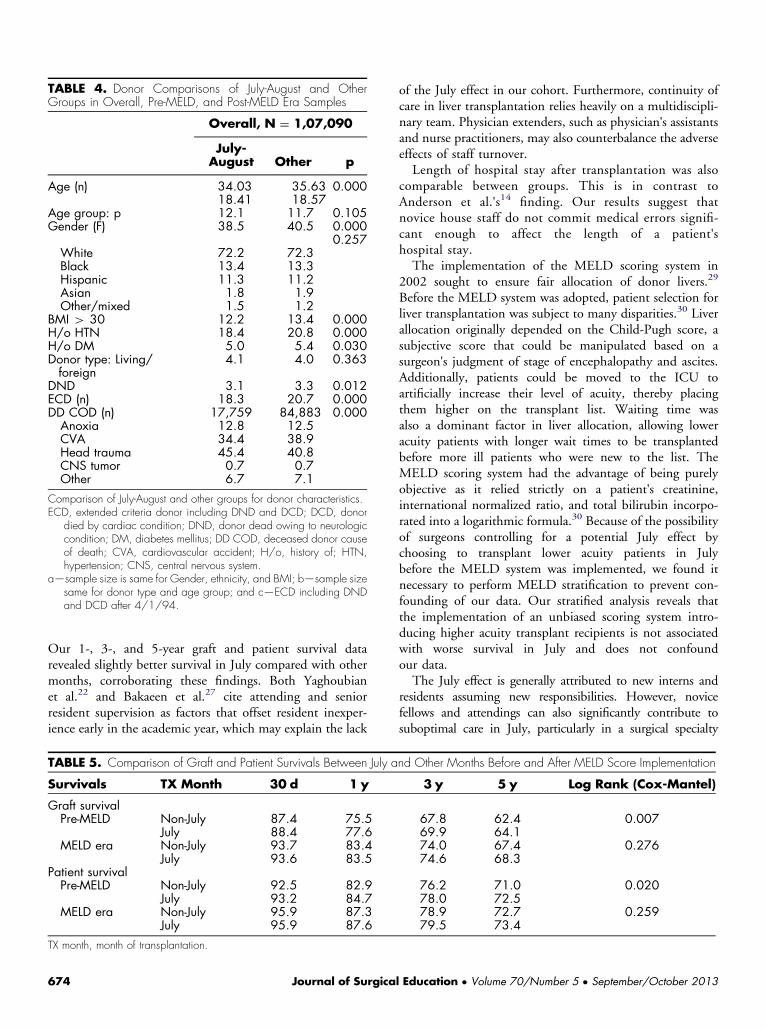
TABLE 4. Donor Comparisons of July-August and OtherGroups in Overall, Pre-MELD, and Post-MELD Era Samples
Overall, N ¼ 1,07,090
July-August Other p
Age (n) 34.03 35.63 0.00018.41 18.57
Age group: p 12.1 11.7 0.105Gender (F) 38.5 40.5 0.000
0.257White 72.2 72.3Black 13.4 13.3Hispanic 11.3 11.2Asian 1.8 1.9Other/mixed 1.5 1.2
BMI 4 30 12.2 13.4 0.000H/o HTN 18.4 20.8 0.000H/o DM 5.0 5.4 0.030Donor type: Living/foreign
4.1 4.0 0.363
DND 3.1 3.3 0.012ECD (n) 18.3 20.7 0.000DD COD (n) 17,759 84,883 0.000Anoxia 12.8 12.5CVA 34.4 38.9Head trauma 45.4 40.8CNS tumor 0.7 0.7Other 6.7 7.1
Comparison of July-August and other groups for donor characteristics.ECD, extended criteria donor including DND and DCD; DCD, donor
died by cardiac condition; DND, donor dead owing to neurologiccondition; DM, diabetes mellitus; DD COD, deceased donor causeof death; CVA, cardiovascular accident; H/o, history of; HTN,hypertension; CNS, central nervous system.
a—sample size is same for Gender, ethnicity, and BMI; b—sample sizesame for donor type and age group; and c—ECD including DNDand DCD after 4/1/94.
Our 1-, 3-, and 5-year graft and patient survival datarevealed slightly better survival in July compared with othermonths, corroborating these findings. Both Yaghoubianet al.22 and Bakaeen et al.27 cite attending and seniorresident supervision as factors that offset resident inexper-ience early in the academic year, which may explain the lack
TABLE 5. Comparison of Graft and Patient Survivals Between July a
Survivals TX Month 30 d 1 y
Graft survivalPre-MELD Non-July 87.4 75.5
July 88.4 77.6MELD era Non-July 93.7 83.4
July 93.6 83.5Patient survivalPre-MELD Non-July 92.5 82.9
July 93.2 84.7MELD era Non-July 95.9 87.3
July 95.9 87.6
TX month, month of transplantation.
674 Journal of Surgica
of the July effect in our cohort. Furthermore, continuity ofcare in liver transplantation relies heavily on a multidiscipli-nary team. Physician extenders, such as physician's assistantsand nurse practitioners, may also counterbalance the adverseeffects of staff turnover.Length of hospital stay after transplantation was also
comparable between groups. This is in contrast toAnderson et al.'s14 finding. Our results suggest thatnovice house staff do not commit medical errors signifi-cant enough to affect the length of a patient'shospital stay.The implementation of the MELD scoring system in
2002 sought to ensure fair allocation of donor livers.29
Before the MELD system was adopted, patient selection forliver transplantation was subject to many disparities.30 Liverallocation originally depended on the Child-Pugh score, asubjective score that could be manipulated based on asurgeon's judgment of stage of encephalopathy and ascites.Additionally, patients could be moved to the ICU toartificially increase their level of acuity, thereby placingthem higher on the transplant list. Waiting time wasalso a dominant factor in liver allocation, allowing loweracuity patients with longer wait times to be transplantedbefore more ill patients who were new to the list. TheMELD scoring system had the advantage of being purelyobjective as it relied strictly on a patient's creatinine,international normalized ratio, and total bilirubin incorpo-rated into a logarithmic formula.30 Because of the possibilityof surgeons controlling for a potential July effect bychoosing to transplant lower acuity patients in Julybefore the MELD system was implemented, we found itnecessary to perform MELD stratification to prevent con-founding of our data. Our stratified analysis reveals thatthe implementation of an unbiased scoring system intro-ducing higher acuity transplant recipients is not associatedwith worse survival in July and does not confoundour data.The July effect is generally attributed to new interns and
residents assuming new responsibilities. However, novicefellows and attendings can also significantly contribute tosuboptimal care in July, particularly in a surgical specialty
nd Other Months Before and After MELD Score Implementation
3 y 5 y Log Rank (Cox-Mantel)
67.8 62.4 0.00769.9 64.174.0 67.4 0.27674.6 68.3
76.2 71.0 0.02078.0 72.578.9 72.7 0.25979.5 73.4
l Education � Volume 70/Number 5 � September/October 2013
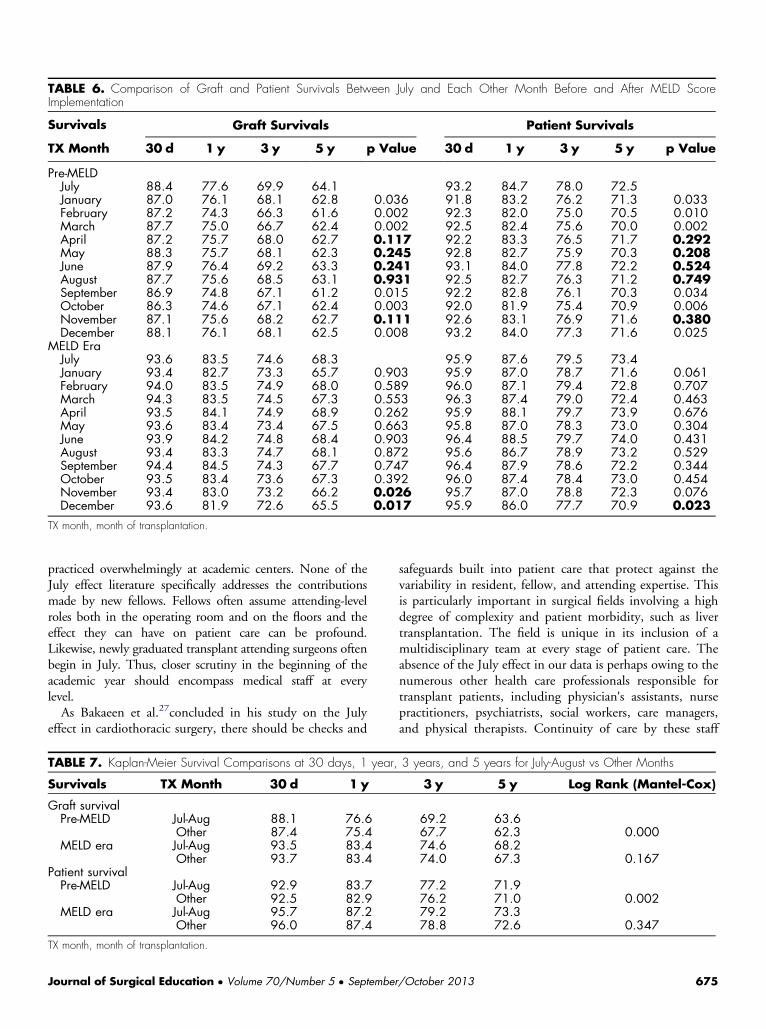
TABLE 6. Comparison of Graft and Patient Survivals Between July and Each Other Month Before and After MELD ScoreImplementation
Survivals Graft Survivals Patient Survivals
TX Month 30 d 1 y 3 y 5 y p Value 30 d 1 y 3 y 5 y p Value
Pre-MELDJuly 88.4 77.6 69.9 64.1 93.2 84.7 78.0 72.5January 87.0 76.1 68.1 62.8 0.036 91.8 83.2 76.2 71.3 0.033February 87.2 74.3 66.3 61.6 0.002 92.3 82.0 75.0 70.5 0.010March 87.7 75.0 66.7 62.4 0.002 92.5 82.4 75.6 70.0 0.002April 87.2 75.7 68.0 62.7 0.117 92.2 83.3 76.5 71.7 0.292May 88.3 75.7 68.1 62.3 0.245 92.8 82.7 75.9 70.3 0.208June 87.9 76.4 69.2 63.3 0.241 93.1 84.0 77.8 72.2 0.524August 87.7 75.6 68.5 63.1 0.931 92.5 82.7 76.3 71.2 0.749September 86.9 74.8 67.1 61.2 0.015 92.2 82.8 76.1 70.3 0.034October 86.3 74.6 67.1 62.4 0.003 92.0 81.9 75.4 70.9 0.006November 87.1 75.6 68.2 62.7 0.111 92.6 83.1 76.9 71.6 0.380December 88.1 76.1 68.1 62.5 0.008 93.2 84.0 77.3 71.6 0.025
MELD EraJuly 93.6 83.5 74.6 68.3 95.9 87.6 79.5 73.4January 93.4 82.7 73.3 65.7 0.903 95.9 87.0 78.7 71.6 0.061February 94.0 83.5 74.9 68.0 0.589 96.0 87.1 79.4 72.8 0.707March 94.3 83.5 74.5 67.3 0.553 96.3 87.4 79.0 72.4 0.463April 93.5 84.1 74.9 68.9 0.262 95.9 88.1 79.7 73.9 0.676May 93.6 83.4 73.4 67.5 0.663 95.8 87.0 78.3 73.0 0.304June 93.9 84.2 74.8 68.4 0.903 96.4 88.5 79.7 74.0 0.431August 93.4 83.3 74.7 68.1 0.872 95.6 86.7 78.9 73.2 0.529September 94.4 84.5 74.3 67.7 0.747 96.4 87.9 78.6 72.2 0.344October 93.5 83.4 73.6 67.3 0.392 96.0 87.4 78.4 73.0 0.454November 93.4 83.0 73.2 66.2 0.026 95.7 87.0 78.8 72.3 0.076December 93.6 81.9 72.6 65.5 0.017 95.9 86.0 77.7 70.9 0.023
TX month, month of transplantation.
practiced overwhelmingly at academic centers. None of theJuly effect literature specifically addresses the contributionsmade by new fellows. Fellows often assume attending-levelroles both in the operating room and on the floors and theeffect they can have on patient care can be profound.Likewise, newly graduated transplant attending surgeons oftenbegin in July. Thus, closer scrutiny in the beginning of theacademic year should encompass medical staff at everylevel.As Bakaeen et al.27concluded in his study on the July
effect in cardiothoracic surgery, there should be checks and
TABLE 7. Kaplan-Meier Survival Comparisons at 30 days, 1 year,
Survivals TX Month 30 d 1 y
Graft survivalPre-MELD Jul-Aug 88.1 76.6
Other 87.4 75.4MELD era Jul-Aug 93.5 83.4
Other 93.7 83.4Patient survivalPre-MELD Jul-Aug 92.9 83.7
Other 92.5 82.9MELD era Jul-Aug 95.7 87.2
Other 96.0 87.4
TX month, month of transplantation.
Journal of Surgical Education � Volume 70/Number 5 � September
safeguards built into patient care that protect against thevariability in resident, fellow, and attending expertise. Thisis particularly important in surgical fields involving a highdegree of complexity and patient morbidity, such as livertransplantation. The field is unique in its inclusion of amultidisciplinary team at every stage of patient care. Theabsence of the July effect in our data is perhaps owing to thenumerous other health care professionals responsible fortransplant patients, including physician's assistants, nursepractitioners, psychiatrists, social workers, care managers,and physical therapists. Continuity of care by these staff
3 years, and 5 years for July-August vs Other Months
3 y 5 y Log Rank (Mantel-Cox)
69.2 63.667.7 62.3 0.00074.6 68.274.0 67.3 0.167
77.2 71.976.2 71.0 0.00279.2 73.378.8 72.6 0.347
/October 2013 675
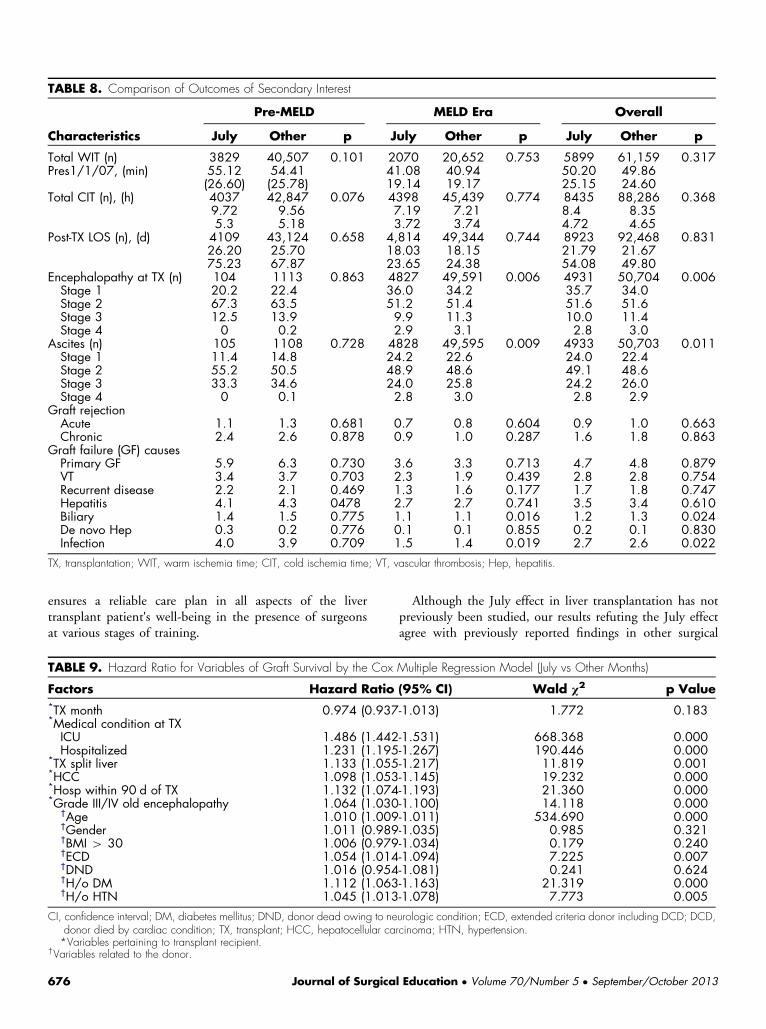
TABLE 8. Comparison of Outcomes of Secondary Interest
Pre-MELD MELD Era Overall
Characteristics July Other p July Other p July Other p
Total WIT (n) 3829 40,507 0.101 2070 20,652 0.753 5899 61,159 0.317Pres1/1/07, (min) 55.12 54.41 41.08 40.94 50.20 49.86
(26.60) (25.78) 19.14 19.17 25.15 24.60Total CIT (n), (h) 4037 42,847 0.076 4398 45,439 0.774 8435 88,286 0.368
9.72 9.56 7.19 7.21 8.4 8.355.3 5.18 3.72 3.74 4.72 4.65
Post-TX LOS (n), (d) 4109 43,124 0.658 4,814 49,344 0.744 8923 92,468 0.83126.20 25.70 18.03 18.15 21.79 21.6775.23 67.87 23.65 24.38 54.08 49.80
Encephalopathy at TX (n) 104 1113 0.863 4827 49,591 0.006 4931 50,704 0.006Stage 1 20.2 22.4 36.0 34.2 35.7 34.0Stage 2 67.3 63.5 51.2 51.4 51.6 51.6Stage 3 12.5 13.9 9.9 11.3 10.0 11.4Stage 4 0 0.2 2.9 3.1 2.8 3.0
Ascites (n) 105 1108 0.728 4828 49,595 0.009 4933 50,703 0.011Stage 1 11.4 14.8 24.2 22.6 24.0 22.4Stage 2 55.2 50.5 48.9 48.6 49.1 48.6Stage 3 33.3 34.6 24.0 25.8 24.2 26.0Stage 4 0 0.1 2.8 3.0 2.8 2.9
Graft rejectionAcute 1.1 1.3 0.681 0.7 0.8 0.604 0.9 1.0 0.663Chronic 2.4 2.6 0.878 0.9 1.0 0.287 1.6 1.8 0.863
Graft failure (GF) causesPrimary GF 5.9 6.3 0.730 3.6 3.3 0.713 4.7 4.8 0.879VT 3.4 3.7 0.703 2.3 1.9 0.439 2.8 2.8 0.754Recurrent disease 2.2 2.1 0.469 1.3 1.6 0.177 1.7 1.8 0.747Hepatitis 4.1 4.3 0478 2.7 2.7 0.741 3.5 3.4 0.610Biliary 1.4 1.5 0.775 1.1 1.1 0.016 1.2 1.3 0.024De novo Hep 0.3 0.2 0.776 0.1 0.1 0.855 0.2 0.1 0.830Infection 4.0 3.9 0.709 1.5 1.4 0.019 2.7 2.6 0.022
TX, transplantation; WIT, warm ischemia time; CIT, cold ischemia time; VT, vascular thrombosis; Hep, hepatitis.
ensures a reliable care plan in all aspects of the livertransplant patient's well-being in the presence of surgeonsat various stages of training.
TABLE 9. Hazard Ratio for Variables of Graft Survival by the Cox
Factors Hazard Ratio*TX month 0.974 (0.937*Medical condition at TXICU 1.486 (1.442Hospitalized 1.231 (1.195
*TX split liver 1.133 (1.055*HCC 1.098 (1.053*Hosp within 90 d of TX 1.132 (1.074*Grade III/IV old encephalopathy 1.064 (1.030
†Age 1.010 (1.009†Gender 1.011 (0.989†BMI 4 30 1.006 (0.979†ECD 1.054 (1.014†DND 1.016 (0.954†H/o DM 1.112 (1.063†H/o HTN 1.045 (1.013
CI, confidence interval; DM, diabetes mellitus; DND, donor dead owing to nedonor died by cardiac condition; TX, transplant; HCC, hepatocellular ca*Variables pertaining to transplant recipient.
†Variables related to the donor.
676 Journal of Surgica
Although the July effect in liver transplantation has notpreviously been studied, our results refuting the July effectagree with previously reported findings in other surgical
Multiple Regression Model (July vs Other Months)
(95% CI) Wald χ2 p Value
-1.013) 1.772 0.183
-1.531) 668.368 0.000-1.267) 190.446 0.000-1.217) 11.819 0.001-1.145) 19.232 0.000-1.193) 21.360 0.000-1.100) 14.118 0.000-1.011) 534.690 0.000-1.035) 0.985 0.321-1.034) 0.179 0.240-1.094) 7.225 0.007-1.081) 0.241 0.624-1.163) 21.319 0.000-1.078) 7.773 0.005
urologic condition; ECD, extended criteria donor including DCD; DCD,rcinoma; HTN, hypertension.
l Education � Volume 70/Number 5 � September/October 2013
TABLE 10. Hazard Ratio for Variables of Patient Survival by the Cox Multiple Regression Model (July vs Other Months)
Factors Hazard Ratio (95% CI) Wald χ2 p Value*TX month 0.982 (0.940-1.025) 0.693 0.405*Medical condition at TXICU 1.540 (1.489-1.593) 632.734 0.000Hospitalized 1.288 (1.246-1.331) 224.457 0.000
*TX split liver 0.883 (0.807-0.965) 7.435 0.006*HCC 1.166 (1.114-1.221) 42.747 0.000*Hosp within 90 d of TX 1.147 (1.082-1.217) 20.915 0.000*Grade III/IV old encephalopathy 1.124 (1.084-1.166) 39.913 0.000
†Age 1.011 (1.010-1.012) 531.079 0.000†Gender 0.978 (0.953-1.003) 2.965 0.085†BMI 4 30 1.031 (0.960-1.108) 0.719 0.396†ECD 0.997 (0.955-1.041) 0.017 0.895†DND 1.019 (0.951-1.093) 0.295 0.587†H/o DM 1.089 (1.035-1.147) 10.726 0.001†H/o HTN 1.017 (0.982-1.053) 0.907 0.341
CI, confidence interval; DM, diabetes mellitus; DND, donor dead owing to neurologic condition; ECD, extended criteria donor including DCD; DCD,donor died by cardiac condition; TX, transplant; HCC, hepatocellular carcinoma; HTN, hypertension.*Variables pertaining to transplant recipient.
†Variables related to the donor.
fields.14,22,26-28 They confirm that the current system oftraining surgeons to perform complex operations on illpatients is safe, and that patients are protected frompotential adverse events related to the educational process.
STRENGTHS AND LIMITATIONS
The strengths of our study lie in its use of a large, robust,and validated database. It also addresses a topic that has notbeen adequately addressed in the surgical field.There are several limitations to our study. First, the sample
sizes of our 2 groups were not equivalent—the non-July group
TABLE 11. Hazard Ratio for Variables of Graft Survival by the Co
Factors Hazard Ratio (95%
TX month July-August 1.022 (0.993-1.052*Medical condition at TXICU 1.52 (1.476-1.566Hospitalized 1.218 (1.183-1.255
EthnicityWhite 1.638 (0.528-5.081Black 2.030 (0.654-6.298Hispanic 1.523 (0.491-4.727Asian 1.368 (0.440-4.250Multiethnic/other 1.782 (0.568-5.588
*HCV serostatus 1.023 (0.949-1.103*Hosp within 90 d of TX 1.060 (1.014-1.108*Ascites 1.066 (0.987-1.152†Age 1.009 (1.008-1.010†Gender 1.024 (1.001-1.048†Non-ECD 0.921 (0.886-0.957†DND 0.891 (0.862-0.920
CI, confidence interval; HCV, Hepatitis C virus; TX, transplant; ECD, extendedDND, donor dead owing to neurologic condition.*Transplant recipient.
†Allograft donor.
Journal of Surgical Education � Volume 70/Number 5 � September
was much larger than the July group. We also could notexamine intraoperative complications related to technical inad-equacies of new house staff. Furthermore, our primary endpoints were graft and patient survival; we did not examinenonfatal adverse outcomes, such as excessive costs. We alsochose to represent the beginning of the academic year exclusivelywith the month of July. By choosing only July, we assume thatnew residents are effectively trained by August, which may notalways be the case. We also assumed that all transplants wereperformed in teaching hospitals; some transplants included inthe UNOS database were performed at nonteaching institu-tions. If so, it would be prudent to compare outcomes in
x Multiple Regression Model (July-August vs Other Months)
CI) Wald χ2 p Value
) 2.170 0.141
) 756.185 0.000) 174.646 0.000
) 0.730 0.393) 1.501 0.221) 0.530 0.466) 0.293 0.588) 0.981 0.342) 0.349 0.555) 6.730 0.009) 2.646 0.104) 461.862 0.000) 4.287 0.038) 18.006 0.000) 50.342 0.000
criteria donor including DCD; DCD, donor died by cardiac condition;
/October 2013 677
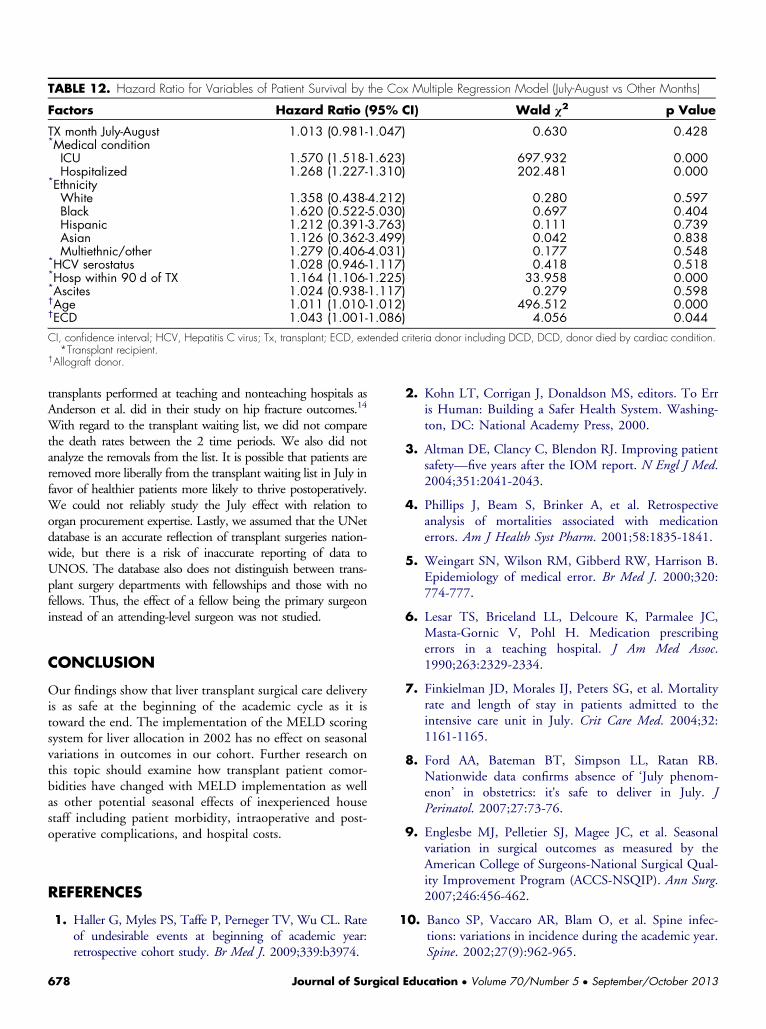
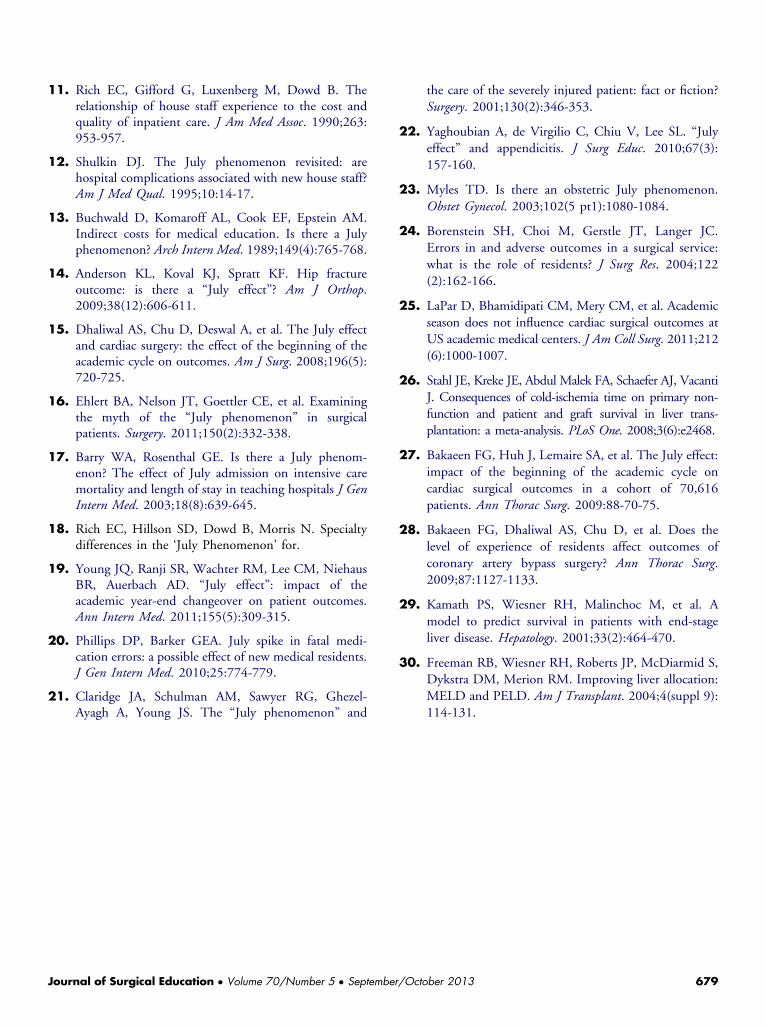
TABLE 12. Hazard Ratio for Variables of Patient Survival by the Cox Multiple Regression Model (July-August vs Other Months)
Factors Hazard Ratio (95% CI) Wald χ2 p Value
TX month July-August 1.013 (0.981-1.047) 0.630 0.428*Medical conditionICU 1.570 (1.518-1.623) 697.932 0.000Hospitalized 1.268 (1.227-1.310) 202.481 0.000
*EthnicityWhite 1.358 (0.438-4.212) 0.280 0.597Black 1.620 (0.522-5.030) 0.697 0.404Hispanic 1.212 (0.391-3.763) 0.111 0.739Asian 1.126 (0.362-3.499) 0.042 0.838Multiethnic/other 1.279 (0.406-4.031) 0.177 0.548
*HCV serostatus 1.028 (0.946-1.117) 0.418 0.518*Hosp within 90 d of TX 1.164 (1.106-1.225) 33.958 0.000*Ascites 1.024 (0.938-1.117) 0.279 0.598†Age 1.011 (1.010-1.012) 496.512 0.000†ECD 1.043 (1.001-1.086) 4.056 0.044
CI, confidence interval; HCV, Hepatitis C virus; Tx, transplant; ECD, extended criteria donor including DCD, DCD, donor died by cardiac condition.*Transplant recipient.
†Allograft donor.
transplants performed at teaching and nonteaching hospitals asAnderson et al. did in their study on hip fracture outcomes.14
With regard to the transplant waiting list, we did not comparethe death rates between the 2 time periods. We also did notanalyze the removals from the list. It is possible that patients areremoved more liberally from the transplant waiting list in July infavor of healthier patients more likely to thrive postoperatively.We could not reliably study the July effect with relation toorgan procurement expertise. Lastly, we assumed that the UNetdatabase is an accurate reflection of transplant surgeries nation-wide, but there is a risk of inaccurate reporting of data toUNOS. The database also does not distinguish between trans-plant surgery departments with fellowships and those with nofellows. Thus, the effect of a fellow being the primary surgeoninstead of an attending-level surgeon was not studied.
CONCLUSION
Our findings show that liver transplant surgical care deliveryis as safe at the beginning of the academic cycle as it istoward the end. The implementation of the MELD scoringsystem for liver allocation in 2002 has no effect on seasonalvariations in outcomes in our cohort. Further research onthis topic should examine how transplant patient comor-bidities have changed with MELD implementation as wellas other potential seasonal effects of inexperienced housestaff including patient morbidity, intraoperative and post-operative complications, and hospital costs.
REFERENCES
1. Haller G, Myles PS, Taffe P, Perneger TV, Wu CL. Rateof undesirable events at beginning of academic year:retrospective cohort study. Br Med J. 2009;339:b3974.
678 Journal of Surgica
2. Kohn LT, Corrigan J, Donaldson MS, editors. To Erris Human: Building a Safer Health System. Washing-ton, DC: National Academy Press, 2000.
3. Altman DE, Clancy C, Blendon RJ. Improving patientsafety—five years after the IOM report. N Engl J Med.2004;351:2041-2043.
4. Phillips J, Beam S, Brinker A, et al. Retrospectiveanalysis of mortalities associated with medicationerrors. Am J Health Syst Pharm. 2001;58:1835-1841.
5. Weingart SN, Wilson RM, Gibberd RW, Harrison B.Epidemiology of medical error. Br Med J. 2000;320:774-777.
6. Lesar TS, Briceland LL, Delcoure K, Parmalee JC,Masta-Gornic V, Pohl H. Medication prescribingerrors in a teaching hospital. J Am Med Assoc.1990;263:2329-2334.
7. Finkielman JD, Morales IJ, Peters SG, et al. Mortalityrate and length of stay in patients admitted to theintensive care unit in July. Crit Care Med. 2004;32:1161-1165.
8. Ford AA, Bateman BT, Simpson LL, Ratan RB.Nationwide data confirms absence of ‘July phenom-enon’ in obstetrics: it's safe to deliver in July. JPerinatol. 2007;27:73-76.
9. Englesbe MJ, Pelletier SJ, Magee JC, et al. Seasonalvariation in surgical outcomes as measured by theAmerican College of Surgeons-National Surgical Qual-ity Improvement Program (ACCS-NSQIP). Ann Surg.2007;246:456-462.
10. Banco SP, Vaccaro AR, Blam O, et al. Spine infec-tions: variations in incidence during the academic year.Spine. 2002;27(9):962-965.
l Education � Volume 70/Number 5 � September/October 2013
11. Rich EC, Gifford G, Luxenberg M, Dowd B. Therelationship of house staff experience to the cost andquality of inpatient care. J Am Med Assoc. 1990;263:953-957.
12. Shulkin DJ. The July phenomenon revisited: arehospital complications associated with new house staff?Am J Med Qual. 1995;10:14-17.
13. Buchwald D, Komaroff AL, Cook EF, Epstein AM.Indirect costs for medical education. Is there a Julyphenomenon? Arch Intern Med. 1989;149(4):765-768.
14. Anderson KL, Koval KJ, Spratt KF. Hip fractureoutcome: is there a “July effect”? Am J Orthop.2009;38(12):606-611.
15. Dhaliwal AS, Chu D, Deswal A, et al. The July effectand cardiac surgery: the effect of the beginning of theacademic cycle on outcomes. Am J Surg. 2008;196(5):720-725.
16. Ehlert BA, Nelson JT, Goettler CE, et al. Examiningthe myth of the “July phenomenon” in surgicalpatients. Surgery. 2011;150(2):332-338.
17. Barry WA, Rosenthal GE. Is there a July phenom-enon? The effect of July admission on intensive caremortality and length of stay in teaching hospitals J GenIntern Med. 2003;18(8):639-645.
18. Rich EC, Hillson SD, Dowd B, Morris N. Specialtydifferences in the ‘July Phenomenon’ for.
19. Young JQ, Ranji SR, Wachter RM, Lee CM, NiehausBR, Auerbach AD. “July effect”: impact of theacademic year-end changeover on patient outcomes.Ann Intern Med. 2011;155(5):309-315.
20. Phillips DP, Barker GEA. July spike in fatal medi-cation errors: a possible effect of new medical residents.J Gen Intern Med. 2010;25:774-779.
21. Claridge JA, Schulman AM, Sawyer RG, Ghezel-Ayagh A, Young JS. The “July phenomenon” and
Journal of Surgical Education � Volume 70/Number 5 � September
the care of the severely injured patient: fact or fiction?Surgery. 2001;130(2):346-353.
22. Yaghoubian A, de Virgilio C, Chiu V, Lee SL. “Julyeffect” and appendicitis. J Surg Educ. 2010;67(3):157-160.
23. Myles TD. Is there an obstetric July phenomenon.Obstet Gynecol. 2003;102(5 pt1):1080-1084.
24. Borenstein SH, Choi M, Gerstle JT, Langer JC.Errors in and adverse outcomes in a surgical service:what is the role of residents? J Surg Res. 2004;122(2):162-166.
25. LaPar D, Bhamidipati CM, Mery CM, et al. Academicseason does not influence cardiac surgical outcomes atUS academic medical centers. J Am Coll Surg. 2011;212(6):1000-1007.
26. Stahl JE, Kreke JE, Abdul Malek FA, Schaefer AJ, VacantiJ. Consequences of cold-ischemia time on primary non-function and patient and graft survival in liver trans-plantation: a meta-analysis. PLoS One. 2008;3(6):e2468.
27. Bakaeen FG, Huh J, Lemaire SA, et al. The July effect:impact of the beginning of the academic cycle oncardiac surgical outcomes in a cohort of 70,616patients. Ann Thorac Surg. 2009:88-70-75.
28. Bakaeen FG, Dhaliwal AS, Chu D, et al. Does thelevel of experience of residents affect outcomes ofcoronary artery bypass surgery? Ann Thorac Surg.2009;87:1127-1133.
29. Kamath PS, Wiesner RH, Malinchoc M, et al. Amodel to predict survival in patients with end-stageliver disease. Hepatology. 2001;33(2):464-470.
30. Freeman RB, Wiesner RH, Roberts JP, McDiarmid S,Dykstra DM, Merion RM. Improving liver allocation:MELD and PELD. Am J Transplant. 2004;4(suppl 9):114-131.
/October 2013 679