Embed Size (px)
Citation preview

Journal of Marine Research, Sears Foundation for Marine Research, Yale University PO Box 208118, New Haven, CT 06520-8118 USA
(203) 432-3154 fax (203) 432-5872 [email protected] www.journalofmarineresearch.org
The Journal of Marine Research is an online peer-reviewed journal that publishes original
research on a broad array of topics in physical, biological, and chemical oceanography.
In publication since 1937, it is one of the oldest journals in American marine science and
occupies a unique niche within the ocean sciences, with a rich tradition and distinguished
history as part of the Sears Foundation for Marine Research at Yale University.
Past and current issues are available at journalofmarineresearch.org.
Yale University provides access to these materials for educational and research purposes only. Copyright or other proprietary rights to content contained in this document may be held by
individuals or entities other than, or in addition to, Yale University. You are solely responsible for determining the ownership of the copyright, and for obtaining permission for your intended use.
Yale University makes no warranty that your distribution, reproduction, or other use of these materials will not infringe the rights of third parties.
This work is licensed under the Creative Commons Attribution-NonCommercial-ShareAlike 4.0 International License. To view a copy of this license, visit http://creativecommons.org/licenses/by-nc-sa/4.0/ or send a letter to Creative Commons, PO Box 1866, Mountain View, CA 94042, USA.
A Fluorometric Method far Determining
Chlorophylls a, b, and c'
Michael E. L oftus and James H. Carpenter
The :Johns Hopkins Univ ersity Baltimore, Mary land 2I2I8
A BSTRACT
A method for the determination of chlorophylls a, b, and c by fluorometric techniques is presented. The effects of accessory carotenoids and chlorophyll derivatives on the accuracy of this method are analyzed. Good agreement between the results derived with this technique and those derived with the spectrophotometric method has been demonstrated in the absence of pheopigments in 90°/0 -acetone extracts. An inherent error in the current flu orometric methods for the determination of chlorophyll a and pheophytin a is demonstrated, and a method for improving the estimation of pheophytin a is given.
1 . Introduction. The estimated concentration of chlorophyll s and their deriv-atives in phytoplankton samples is widely used in descriptions of plankton pop-ulations in natural waters. Pigment concentrations have been related to primary productivity (Ryther 1956, Ryther and Y entsch 1957, Ichimara et al. 1962, Curl and Small 1965), to microbial biomass (Holm- Hansen 1969), and to phytoplankton composition (Margalef 1961 ). Presently used methods of analy-sis have been reported in SCOR-Unesco (1966), and by Parsons and Strick-land ( 1963), who employed spectrophotometric techniques, and by Yentsch and Mense! (1963) and Holm- Hansen et al. (1965), who employed fluoro-metric techniques.
The trichromatic equations used in spectrophotometric methods permit determination of chlorophylls a, b, and c in a pigment mixture, but this method requires the assumption that the absorbancy at the three wavelengths used is due to only chlorophylls. Vernon ( 1960 ), L orenzen ( 1967 ), and Moss ( 1967 a, 1967b), who have recognized that such an assumption may be invalid, have presented methods that make possible the quantitative estimates of pheopig-
1. Contribution No. 647 from the McCollum-Pratt Institu te and Department of Biology, and No. 162 from the Chesapeake Bay Institute, The Johns Hopkins University. This work was supported by U.S. Atomic Energy Commission Contract AT(30-1)3497 (Document No. NYO 3497-30), by National Institutes of Health Training Grant GM 57, and by U.S. Atomic Energy Commission Con-tract AT(30-1)3480.
Accepted for publication and submitted to press I 5 June I 97 r.
320 Journal of Marine Research [ 29,3
ments in 90 %-acetone extracts, thus improving the chlorophyll-concentration estimates when chlorophyll degradation products occur in samples.
The fluorometric methods have the attractive features of rapidity and sen-sitivity when compared with spectrophotometric techniques. With the proper selection of excitation and emission filters, measurements can be made partially selective for chlorophyll-a fluorescence (Yentsch and Menzel 1963, Holm-Hansen et al. 1965). It has been recognized that other pigments that occur naturally in extracts can be a source of error with fluorometric techniques, as with the spectrophotometric methods. An extension of a fluorometric method that includes quantitative analyses of other pigments in extracts, with a limited sacrifice of sensitivity, has been suggested (Holm-Hansen et al. 1965). Methods for such an extension and an evaluation of these new techniques are the topic of this paper.
2. General Considerations. Compounds that fluoresce with a red color when they are excited by blue light and those that may be found in 90%-acetone extracts of phytoplankton material from natural waters are: chlorophylls a, b, and c, chlorophyllides a and b, pheophytins a, b, and c, pheophorbides a and h, and several porphyrins and metalloporphyrins that have not been well described (Falk 1964, Smith and Benitez 1955).z An accurate analysis of such a mixture appears to require chromatographic separation of the individual pigments prior to a fluorescence assay. However, a useful approximate analysis might be based on the following considerations: (i) the several porphyrins and metallopor-phyrins that possibly interfere have not been observed in significant concentra-tions in natural samples (Holm-Hansen et al. 1965, Patterson and Parsons 1963), (ii) the absorption spectra of the chlorophylls and the respective chloro-phyllides are similar (Patterson and Parsons 1963), and the fluorescence spectra might be expected to be similar (Rabinowitch 1956), (iii) the absorption spectra and the fluorescence of the pheophytins and the respective pheophorbides might be expected to be similar, and (iv) the fluorescence of a mixture is the sum of the flu orescence of the individual components without interaction of each with the others in a dilute solution (Goodwin 1947, Falk 1964). The extracts can thus be treated as a six-component mixture: chlorophyllous pigments a, h, and c and pheopigments a, h, and c.
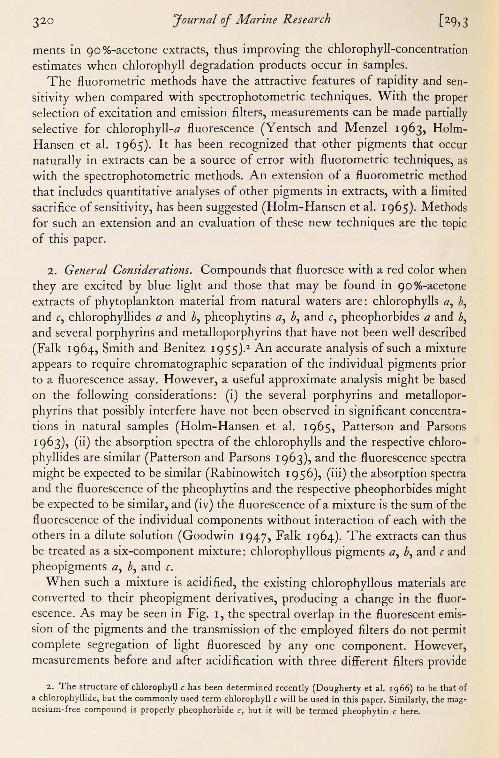
When such a mixture is acidified, the existing chlorophyllous materials are converted to their pheopigment derivatives, producing a change in the fluor-escence. As may be seen in Fig. I, the spectral overlap in the fluorescent emis-sion of the pigments and the transmission of the employed filters do not permit complete segregation of light fluoresced by any one component. However, measurements before and after acidification with three different filt ers provide
2. The structure of chlorophyll c has been determined recently (Dougherty et al. 1966) to be that of a chlorophyllid e, but the commonly used term chlorophyll c wi ll be used in this paper. Similarly, the mag-nesium-free compound is properly pheophorbide c, but it will be termed pheophytin c here.
1971]
10 9
C 8 0 (f) 7 (f)
E 6 Q)
5 Q) 4 > - 3 0 Q) 2 0::
I 0
10 9
C 8 0
(f)
7 (f)
E 6 Q)
5 Q)
> 4 -0 3 .Q) 2 0::
I 0
100 90
C 80 0 (f) 70 (f)
E 60 (f)
50 C 0 '- 40 f-
0 30 20 10
A.
8 .
C.
Loftus and Carpenter : Chlorophyll Fluorometry 321
CS-5-60 /
4 00 450 550 600
662 Phe b
676 Phe a
Filter I /
700 750
C
Figure 1. A , B. T he relative emission spectra of equimolar concentrations of chlorophyll s and pheo-phyt ins in 90°/0 acetone, wi th excit ation li ght provided by a mercury-vapor lamp and trans-mitted through Corning-glass filt er CS-5-60 used in ll uorometer. The measurements were made wi th a quarter-meter spectrometer. The correcti ons fo r photocathode sensit ivity with wavelength were appli ed. -C. The transmission spectra of the excitation fi lter (CS-5-60, above) and emission filt ers I, II , and III described fo r this analysis.
322 Journal of Marine Research [ 29,3
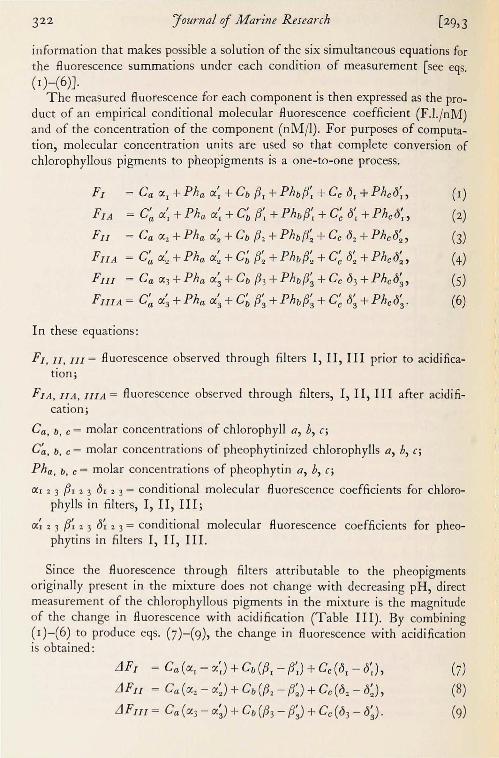
information that makes possible a solution of the six simultaneous equations for the flu orescence summations under each condition of measurement [see eqs. ( I )-(6 )].
The measured fluorescence for each component is then expressed as the pro-duct of an empirical conditional molecular fluorescence coefficient (F.1./nM) and of the concentration of the component (nM/1). For purposes of computa-tion, molecular concentration units are used so that complete conversion of chlorophyllous pigments to pheopigments is a one-to-one process.
F1 = Ca a, +Pha a;+ Cb /3, +Phb/3: + Cc cl, +Phco:, (1)
F1A = c~ a: +Pha a;+ c~ 13; +Phb/3: + c; o; +Phco:, (2)
Fu = Ca 0:2 + Pha a:+ Cb /32 + Phb/3: + Cc Oz+ Phco:, (3)
Fu A = c~ a:+ Pha a:+ c~ /3: + Phb/3: + c; o: + Phco:, (4)
Fu1 = Ca <X3+Pha a;+cb /33+Phbf3;+cc 03+Phco;, (5)
FmA = C~ a; +Pha a;+ C~ f3; +Phb/3; + c; o; +Phco;. (6)
In these equations:
F1, u, III = fluorescence observed through filters I, II, I II prior to acidifica-ti on;
F1A , II A, IIIA = flu orescence observed through filters, I, II, III after acidifi-cation;
Ca, b, c = molar concentrations of chlorophyll a, b, c;
C~. b, c = molar concentrations of pheophytinized chlorophylls a, b, c;
Pha, b, c = molar concentrations of pheophytin a, b, c;
a, 2 3 /3, 2 3 Or 2 3 = conditional molecular flu orescence coefficients for chloro-phylls in filters, I, II, II I;
a~ 2 3 /3~ 2 3 cl~ 2 3 = conditional molecular fluorescence coefficients for pheo-phytins in filters I, II, II I.
Since the flu orescence through filters attributable to the pheopigments originally present in the mixture does not change with decreasing pH, direct measurement of the chlorophyllous pigments in the mixture is the magnitude of the change in fluorescence with acidifi cation (Table III). By combining ( 1 )-(6) to produce eqs. ( 7 )-( 9), the change in fluorescence with acidification is obtained:
iJ F1 = Ca(a, -a:) + Cb(/3, - (3',) + Cc(OI -o:),
iJFu = Ca(<Xz -a:) + Cb(/3. -/3:) + Cc(o. - o:),
iJFu1 = Ca (0:3 - a;)+ Cb(/33 - /3; ) + Cc(03 - o;) .
(7)
(8)
(9)
Loftus and Carpenter: Chloroph;-11 Fluorometry
Here:
L1 Fr, II , III are measured changes in fluorescence through filters I, II, and III with acidification.
The determination of the 18 conditional molecular fluorescence coefficients then makes possible a calculation of the coefficient for each of the chlorophylls in (7)-(9) and a solution of those equations.
3. Materials and Methods. Conditional molecular fluorescence coefficients were determined on pigments that have been isolated by the following methods:
Chlorophyll s a and h were isolated from either a variety of grasses or from fresh spinach by using chromatographic techniques. The source materi al was first mascerated in a ti ssue grinder, using 5 to 7 ml of absolute methanol con-taining I gm/I MgCO3. The extract was then cleared and made to 10 ml with methanol prior to the addition of 10 ml of 10% NaCl (aqueous) in a 60-ml separatory funnel; 10 ml of petroleum ether were then added to the separatory funnel, and the layers were mixed to facilitate the transfer of the chlorophylls to the ether layer. Following separation, the methanol layer was discarded and the ether layer was cleared of water by centrifugation. The ether was then evaporated to near dryness under a nitrogen jet. The remaining soluti on of pigments was spotted on an Eastman 6061 silica-gel chromatogram sheet that had been dried at 50°C for 30 minutes. The chromatogram was developed with 58:30: 12, hexane: ethylacetate: dimethylamine (Gebelein 1967). Spots of chlorophyll a (Rt 7.4) and chlorophyll h (Rt 7.1) were cut out and eluted into 90% acetone; this solution was stored at - 20°C until the spectrophotometric analysis could be performed.
Chlorophylls a and c were isolated from 90 % acetone ( I g MgCO3/l) extracts of log-phase cultures of Goniaulax polyhedra, Gymnodinium splendens, and Pyrodinium hahamense, using the n-Hexane-90 %-acetone-phase separation described by Parsons ( I 963). Any accessory pigments in the chlorophyll-c acetone phase were not removed. The chlorophyll a plus the accessory pig-ments were transferred to 90 % acetone following evaporation of the hexane: acetone solvent under a nitrogen jet. These pigments were stored at - 20°C in 90% acetone until they were used. I solation techniques were carried out in a glove box, with nitrogen flushed through it and with subdued li ght at 23°-250C. Extracts of purified chlorophyll s were generally analyzed spectrophoto-metrically and fluorometrically within I 2 hours of their purification.
The purity and concentration of the isolated chlorophylls were determined by using spectrophotometric methods. A Beckman DK II ratio-recording spectrophotometer with optically matched 2-cm cuvettes was used for absorp-tion measurements. The absorption spectra of the purified pigments were recorded between 400 nm and 7 50 nm at slow speed, with the sensitivity set such that the slit width was 0.015 mm at 650 nm and less than 0.01 mm
Journal of Marine Research [ 29,3
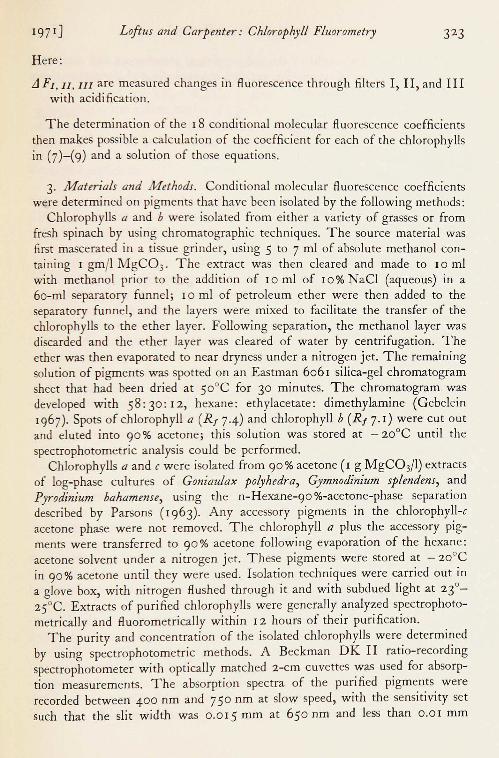
Table I. The wavelengths of the red maximum absorbances and mean acid ratios of N determinations for purified chlorophylls and their pheophytin derivatives in 90%-acetone.
Pigment
a .. ........... .
b ... . .. .. ..... . C ... .. . . • •.. •• •
nm red chlorophyll s
663--665 647-649 630-633
Max. O.D. pheophytins
667--669 653-655 595-597
N
8 7 5
Red max. acid ratio
1.71 ± 0.042 1.49 ± 0.036 I .BO± 0.070
below 600 nm. The absorbancy at the red and blue maxima were checked manually. Aliquots of the extracts were acidified with o. I ml of 1 .o N HCl, and the absorption spectra of the pheophytinized extracts were then measured.
The criterion for purity of the pigment was the ratio of the red absorption peaks before and after acidifi cati on of each pigment. These mean ratios for several purifi cations of each pigment, shown in Table I, are in good agree-ment with those reported in, or derived from, the lit erature (Lorenzen 1967, Vernon I 960, J effr eys 1963, Falk 1964). Table II shows the molecular weights and specific absorption coeffi cients used in determining the pigment concentrations in the calibration solutions. These solutions were diluted volu-metrically to prepare standards for the fluorometric readings.
The conditional molecular flu orescence coefficients were determined by equipping a Turner 111 flu orometer with a G4 T 4-1 lamp and a high-sensitivity door that held a 30-ml pyrex test tube. The excitation light was passed through a 5-cm2 Corning glass CS-5-60 filter, and the fluorescence was monitored through three combination filters:
I. Filters: Corning-glass filter CS-2-64 (5-cm2) with the Wratten gelatin filter # 70 protected by a (5-cm•) glass.
II. Filters: Corning-glass filt er CS-2-59 (5-cm2) with a Corion Instrument Company interference filter # 6509 (0.5 bandwidth 12.8 nm).
III. Filters: Corning-glass filter CS-2-62 (5 cm2 ) with a Corion Instrument Company interference filter # 62 I 7 ( o. 5 bandwidth I 2.2 nm).
The flu orescent li ght transmitted by filter I is primarily that obtained from chlorophyll a, by filt er II that obtained from chlorophyll b, and by filter III that obtained from chlorophyll c. Filter-transmission characteristics and chlorophyll- emission spectra are shown in Fig. 1.
Measurements obtained with the various sensitivity settings on the fluorom-eter were converted to equivalent units on the most sensitive scale (30 scale), and the coefficients were then expressed in these units.
The conditio nal molecular flu orescence coefficients were determined for each chlorophyll and pheopigment by adding o.o I ml to o. 1 ml of the prepara-tion to 25 ml of 90% acetone in the fluorometer tube. The concentration in the tube was then related to the number of "30-scale" equivalent units regis-
,, I
I'
ii
!1
.I
ii
II
" Ii Ii i1
,,
(1

Loftus and Carpenter: Chlorophyll Fluorometry
tered by the fluorometer, and the condi-tional molecular fluorescence coefficient was calculated as (R 0 - R1>)/Cp = Km, where Gp= the concentration m nM/1, R0 = the solution reading corrected to "30-scale" units, Rb= the blank reading, and Km= the conditional molecular fluor-escence coefficient.
The solution was then acidified by ad-ding several drops of 1.0 HCl, and the fluorescence was determined following pheophytinization. The pheopigment co-efficient was calculated as (Ra-R1>)/Cph = K~, where Ra I the reading for the acidified solution (30-scale units) and K~i is the pheopigment conditional molecular fluorescence coefficient.
By varying the pigment concentration in the assay tube, a linear relationship was found for each pigment in a concentration range from I nM to 60 nM. The mean values Km and K~ were therefore used to solve (7)-(9) for chlorophylls a, h, and c to produce eqs. ( 1 o )- ( 1 2) in terms of measured changes in fluorescence through each filter. Throughout the calibration and in later tests, the stability of the fluorometer was monitored, usmg qumme sulfate m o. 1 N H,SO; the fluorescence was read through filter II I.
Solutions of (7)- (9) and the transforma-tion to weight units result in (10)-(12) for our instrument:
Caµg/1 = o.110LJF1-o.109LJFn (io) +o.110LJFn1
C1>µg/l = o.052LJF1-o.286LJFn (II) + 0.310 LJFn1
Ccµg/1 =-o.012LJF1+0.036LJFn (i 2) + 0.265 LJFn1
I
...9
...c:: u ....
cE
C: V ·u
V
8 C: 0
u C:
·µ X V ....
u 0)
0 E
5 ui ·- ...c:: u ..,
oD V C: 0 V Uv C: >
.!2 e, E 0 ;:I
1l E ro- -u
'.:: E u V -0 0.. V .,, .... .,, .., .., ro
""@) .,, ·- C: <U · ->-,
.... ...c:: ro o..
- 0 ;:I V u ...c:: 0) 0..
0 -0 C: ro
. .,, ...... ;::::: ...... >-. V ...C::
- 0.. ..D 0 ro i...
f--<
0 " <.D u a, C:
" ... C: 0
" C: i:.:: b :>
ci .,. ..,.. -.t" -.:I" ·.3 00000 r3 ----- u::: xxxxx ~ t.0 U") N - U") ·u N 0) CO 11") LI") (IS
-B ..;:..;: «i c--i _; .[i:
·'= k 0.. 0
" ..c:: 0..
•
Journal of Marine R esearch [ 29,3
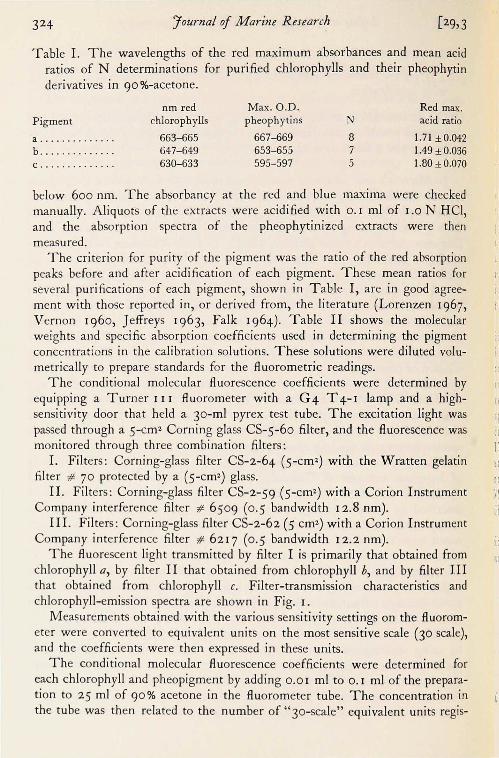
Table III. The mean conditional molecular flu orescence coefficients with S.E. for Io samples of Chlorophylls and Pheopigments determined for Tur-ner M odel I I I fluorometer with emission filter I, II, and III.
Filters Pigments I II III
Ch! a .... .. . .... . 14.75 ± 0.780 2.70±0.145 0.19± 0.025 Phe a ......... . .. 4.80 ± 0.302 0.73 ±0.080 0.04± 0.003 Ch! b ... ... ..... . 1.90 ±0.097 3.92 ±0.179 0.63 ± 0.055 Phe b .......... . . 5.75±0.293 7.46±0.196 0.31 ± 0.026 Ch! C ••••• • • •• • .• 2.29 ± 0.229 4.93 ±0.247 3.75 ± 0.605 Phe c .. . . . . .... . . 1.22 ± 0.085 0.36 ± 0.025 0.27 ± 0.020
4. R esults. The consistency in determining the conditional molecular fluo-rescence coefficient is shown in Table III. The coefficients, from at least three separate preparations of spectrophotometrically analyzed material, are the mean values of Io determinations. With the assumption that the experimental values are normally distributed about the mean, the standard error of the esti-mated coefficients is generally less than ± IO% of the mean value, with a greater variation associated with a low fluorescent yield through a particular filter.
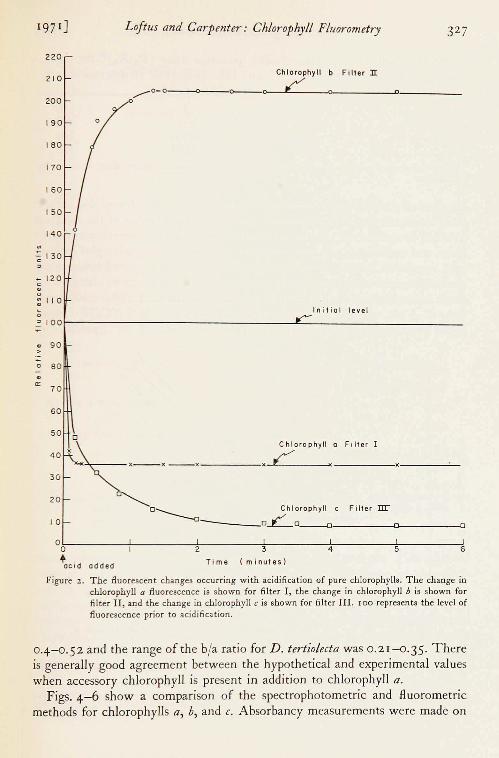
In determining the pheopigment coefficients, we found that the interval between the time of acidification and the reading of the fluorescence value was critical. The fluorescence change with pheophytinization is shown in Fig. 2.
Stability for all three pigments was reached three minutes after acidification, so that a minimum delay of three minutes before making the reading appears to be necessary. The acid factors for each pigment with each filter are presented in Table IV; the values reported are dissimilar to those observed by Holm-Hansen et al. ( I 96 5 ), who used a filt er whose transmission characteristics are similar to filter I. The difference in the acid factors for chlorophylls a and c (the Holm-Hansen values 2. I and 2.4, our values 3.07 and 1.88) is probably due to differences in the instrumentation, in the emission, and in the excitation filt ers used (Saijo and Nishizawa 1969). These differences clearly indicate the necessity of individual instrument calibration by each investigator employing a fluorometric method.
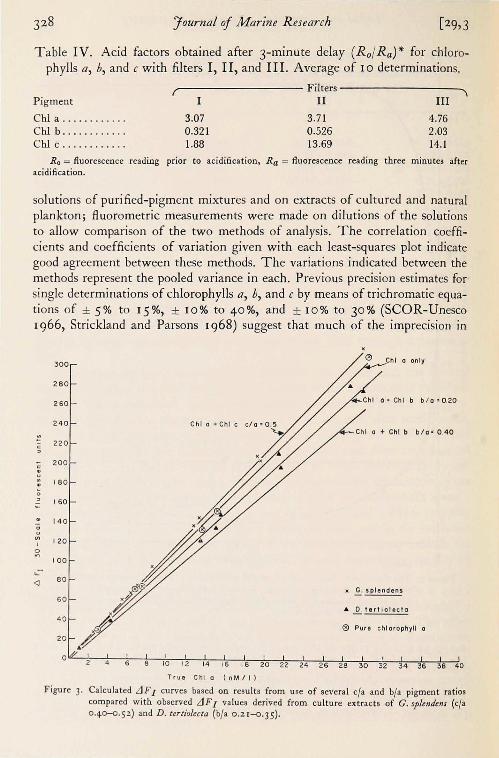
With acidifi cation, the fluorescence of the purified chlorophylls a and c decreased through all filters while the flu orescence of the purified chlorophyll b increased through filters I and II but decreased through filter III. The effect of this behavior of the chlorophylls upon the observed change in fluorescence (LIF) in pigment mixtures can be calculated by using the values in Table Ill and eqs. (7)-(9). In Fig. 3, the calculated LIF values for solutions containing chlorophyll a alone or in combination with chlorophylls b or c are compared with the LIF values for culture extracts of G. splendens and Dunaliella tertiolecta in 90% acetone, using filt er I. The range of the c/a ratio for G. splendens was
Loftus and Carpenter: Chlorophyll Fluorometry
220
210
200
Chlorophyll b
.,,..--0- 0- - -o-- -o---o~- ~Cc.._ __ ~o,-_ _ __ ~o, ____ _
Filter Ir
190
180
170
160
150
140 w
130
" - 120 C
" u : I I 0
Initial level
.:' I 00
" >
-C
a:
90
80
70
60
50
40
30
20
10
Chlorophyll o F i lter I
•- ~ --x--x-----x C x-----x----'-
Chlorop h yll c Filter fil"
0 o~ -----i-------.;..2------!-3-----4.,_ _____ 5.__ ____ _Js
+oc i d added T i me ( m i nutes )
Figure 2 . The fluorescent changes occurring wi th acidification of pure chlorophyll s. The change in chlorophyll a fluorescence is shown for filt er I, the change in chlorophyll b is shown for filter II , and the change in chlorophyll c is shown for filt er III. 100 represents the level of fluorescence prior to acidification.
0.4-0.52 and the range of the b/a ratio for D . tertiolecta was 0.21- 0.35. There is generally good agreement between the hypothetical and experimental values when accessory chlorophyll is present in addition to chlorophyll a.
Figs. 4- 6 show a comparison of the spectrophotometric and fluorometric methods for chlorophylls a, b, and c. Absorbancy measurements were made on
Journal of Marine Research [ 29,3
Table IV. Acid factors obtained after 3-minute delay ( R0 / Ra)* for chloro-phylls a, h, and c with filters I, II, and III. Average of IO determinations.
Filters Pigment I II III
Chi a ........ .. . . 3.07 3.71 4.76 Chl b . .... . . ..... 0.321 0.526 2.03 Chl C ••• • • • •.•• .. 1.88 13.69 14. l
Ro= fluorescence reading prior to acidification, Ra= fluorescence reading three minutes after acidification.
solutions of purified-pigment mixtures and on extracts of cultured and natural plankton; fluorometric measurements were made on dilutions of the solutions to allow comparison of the two methods of analysis. The correlation coeffi-cients and coefficients of variation given with each least-squares plot indicate good agreement between these methods. The variations indicated between the methods represent the pooled variance in each. Previous precision estimates for single determinations of chlorophylls a, h, and c by means of trichromatic equa-tions of ± 5% to 15%, ± IO% to 40%, and ± 10% to 30% (SCOR-Unesco 1966, Strickland and Parsons 1968) suggest that much of the imprecision 111
300
2 80
260
240
- 220 C ,
200 C
; 180
0 , I 60
140 0
120 ' 0
"' I 00
... -<I 8 0
60
4 0
20
0
Figure 3.
Chi o only
o • Chi b b / o •0.20
Chi a + Chi c
• ..Q.: tertiolecto
® Pur e ch l oro phyll a
4 6 8 10 12 14 16 18 20 22 24 26 28 30 32 34 36 38 40
True C hi a ( nM / 1)
Calculated LJ FI curves based on results from use of several c/a and b/a pigment ratios compared with observed LJF1 values derived from culture extracts of C. splendens (c/a o.4CH:>. 52) and D. tertiolecta (b/a o.z 1--0.35).
1971] L oftus and Carpenter: Chlorophyll Fluorometry 329
"' C: 0
0 ::, CT ., 0
.:: ., E 0
;; ::,
U:
--...
"' ::I.
0
.c a.
0
.c u
60 Regress ion analysis ./ 56 Y=0 .818 +0.952x
r =0 .973
52 Coefficient of variation 9 .28 % / 48
/ 44
40
36 X
32
0 X 28
X
24 X
X X
20 x/x 16 0 Pure chlorophyll a
/Xx 12 /Xx x Mixed pigments
8 ?'e
4
0 4 8 12 16 20 24 28 32 36 40 44 48 52 56 60
Chlorophyll a µ.g / I (Parsons 8 Strickland)
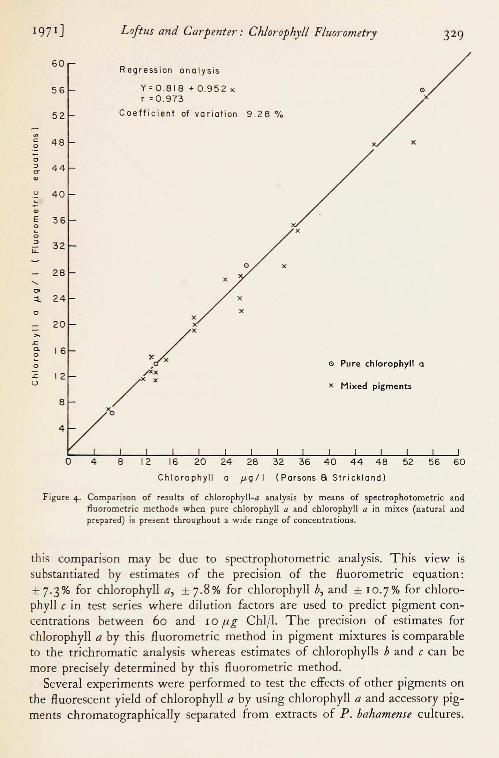
Figure 4. Comparison of results of chlorophyll-a analysis by means of spectrophotometric and fluorometric methods when pure chlorophyll a and chlorophyll a in mixes (natural and prepared) is present throughout a wide range of concentrations.
this comparison may be due to spectrophotometric analysis. This view 1s substantiated by estimates of the precision of the fluorometric equation: ± 7.3% for chlorophyll a, ± 7.8% for chlorophyll b, and ± 10.7% for chloro-phyll c in test series where diluti on factors are used to predict pigment con-centrations between 60 and 1 o µg Chi/I. The precision of estimates for chlorophyll a by this fluorometric method in pigment mixtures is comparable to the trichromatic analysis whereas estimates of chlorophylls b and c can be more precisely determined by this fluo rometric method.
Several experiments were performed to test the effects of other pigments on the fluorescent yield of chlorophyll a by using chlorophyll a and accessory pig-ments chromatographically separated from extracts of P. bahamense cultures.
33° Journal of Marine Research [ 29,3
-.;; " 0
0
" er ., u
-; E :: 0
" i;:
"' :I.
C. 0
;,
(.)
36
34
32
30
28
26
24
22
20
18
16
14
12
10
8
6
4
2
Regression anal ysis
Y: 0 . 097 + 1.013 X
r =0 . 9425
Coefficien t of variation 10.48 %
OX X
X )()(
X
X •
o x o Pure chlorophyll b
x Mixed P i gments -~
"
4 6 8 IO 12 14 I 6 I 8 2 0 22 24 2 6 28 30 32 3 4 36
Chlorop hyll b µ.g/1 (Parsons S Stricklond1
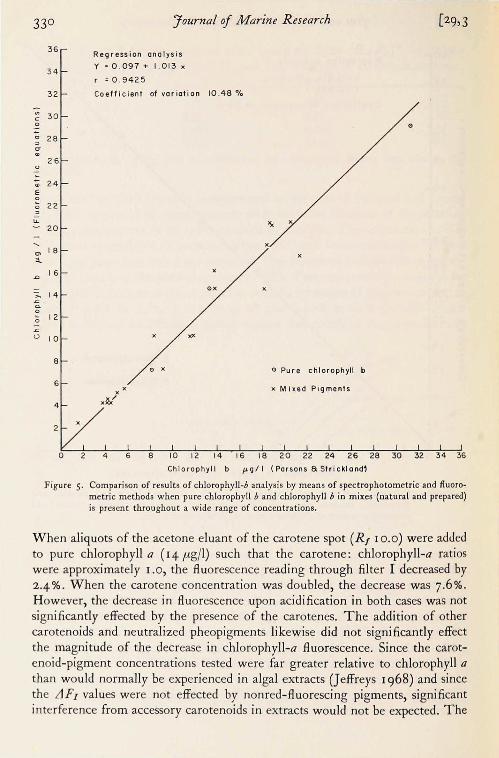
Figure 5. Comparison of results of chlorophyll-b analysis by means of spectrophotometric and Auoro-metric methods when pure chlorophyll b and chlorophyll b in mixes (natural and prepared) is present throughout a wide range of concentrations.
When aliquots of the acetone eluant of the carotene spot ( R1 1 o.o) were added to pure chlorophyll a (14 µg/1) such that the carotene: chlorophyll-a ratios were approximately 1.0, the fluorescence reading through filter I decreased by 2.4 % . When the carotene concentration was doubled, the decrease was 7 .6 % . However, the decrease in fluorescence upon acidification in both cases was not significantly effected by the presence of the carotenes. The addition of other carotenoids and neutralized pheopigments lik ewise did not significantly effect the magnitude of the decrease in chlorophyll-a fluorescence. Since the carot-enoid-pigment concentrations tested were far greater relative to chlorophyll a than would normally be experienced in algal extracts (Jeffreys 1968) and since the L1F1 values were not effected by nonred-fluorescing pigments, significant interference from accessory carotenoids in extracts would not be expected. The
l 971]
30
28
26
"' C 0 24 -; :, O" 22 ., u ·.:: -; 20
E 0
0 18 :,
G:: 16
14
"' ::t.. 12
u
= "' 10 .c C. 0
8 0
.c u
6
4
2
0
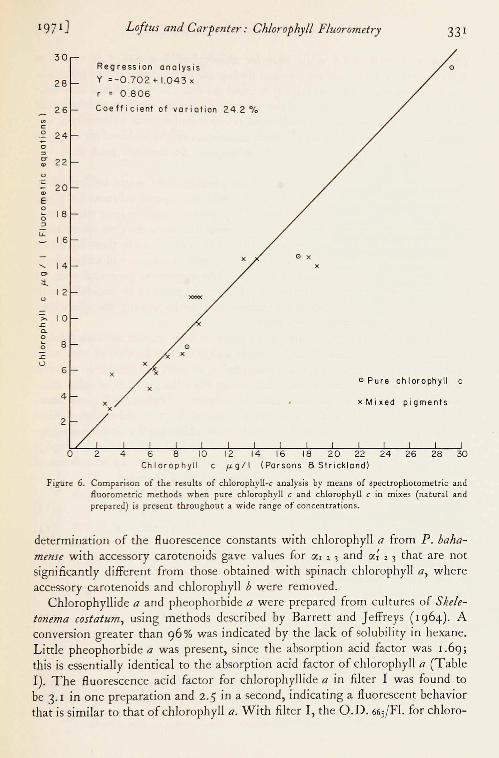
L oftus and Carpenter: Chlorophyll Fluorometry 331
Regression anal ys is
Y =-0 .7 0 2 +1.043 ><
r = 0 .806
Coeff ici ent of var i ati on 2 4 .2 ¾
)(
)( )(
)(
X
X
0 )(
)( 0 )( )(
0
0 Pure chlorophyll c
x Mixed pigments
2 4 6 8 10 12 14 16 18 20 22 24 26 28 30 Chlo r ophyll c µg / 1 (Parson s 8 Strickland)
Figure 6. Comparison of the results of chlorophyll- c analysis by means of spectrophotometric and Ruorometric methods when pure chlorophyll c and chlorophyll c in mix es (natural and prepared) is present throughout a wi de range of concentrations.
determination of the flu orescence constants with chlorophyll a from P. baha-mense with accessory carotenoids gave values for o::, 2 3 and o::; 2 3 that are not significantly different from those obtained with spinach chlorophyll a, where accessory carotenoids and chlorophyll b were removed.
Chlorophyllid e a and pheophorbide a were prepared from cultures of Skele-tonema costatum, using methods described by Barrett and J effr eys ( l 964). A conversion greater than 96% was indicated by the lack of solubil ity in hexane. Littl e pheophorbide a was present, since the absorption acid factor was I .69; this is essentially identical to the absorption acid factor of chlorophyll a (Table I). The fluorescence acid factor for chlorophyllide a in filt er I was found to be 3. 1 in one preparation and 2. 5 in a second, indicating a flu orescent behavior that is similar to that of chlorophyll a. With filt er I, the O .D. 665/Fl. for chloro-
332 Journal of Marine Research [ 29,3
phyll a was 5.48 x I o-6 while that for chlorophyllide a was 5.49 x I o-6 to 5.76x 10⁻⁶; so the procedure does not distinguish between these two pigments. Since Patterson and Parsons ( 1963) determined that chlorophyllide a may con-stitute a significant percentage of the pigments in natural samples, methods that will distinguish the chlorophyllides and pheophorbides from chlorophylls and pheophytins would be useful, and such techniques might be based on the 90% acetone: hexane phase separation with subsequent fluorometric analysis.
5. Discussion. Equations for each of the pheopigments might be derived by substituting (10)- (12) in (2), (4), and (6), with subsequent solution for Cpha, Cphb, and Cphc• Attempts to use these pheopigment equations have shown that the resultant estimates suffer from such great inaccuracies that uncertainty precludes their usefulness. The use of Table I II coefficients in these equations for mixtures of prepared solutions containing pheopigments and chlorophylls has resulted in poor estimates of all three pheopigments, generally with an underestimation of the amount present. The errors seem to be associated with the variance in the individual coefficients and perhaps with the quenching effects of the accessory pigments present.
We have found that the results of the previous fl uorometric methods (Holm-Hansen et al. 1965, Yentsch and Menzel 1963) have to be viewed with some qualification when chlorophyll h, chlorophyll c, or both are present in addition to chlorophyll a. The interference that results from the presence of other chlo-rophylls may lead to a significant error in estimates of chlorophyll a and pheo-pigment a when all of the fluorescence passed by the red-emission filt er (CS-2-64, CS-2-60) is assumed to result from chlorophyll a and its pheopig-ment derivatives. By using the equations given by Holm-Hansen et al. (1965) in combination with our conditional molar coefficients and an acid factor of 3.07 for filter I (Tables III, IV), we obtained the following:
Chlorophyll a (nM/1 = (1.48) (0.067) (Ro-Ra), (13)
Pheophytin a (nM/1) = (1.48) (0.067) (3.07 Ra-Ro). (14)
In the absence of pheopigments and in the presence of chlorophyll a and either chlorophyll h or c, the following equations can be derived from the Table III coefficients:
Ro= 14.75 Ca+ 1.90 Cb (or 2.29 Cc),
Ra= 4.80 Ca+ 5-75 Cb (or 1.22 Cc)-
A range of assumed values for the chlorophyll and pheophytin concentra-tions was used in these equations to calculate the readings; then these calculated readings were substituted in (13) and (14) to produce computed apparent chlo-rophyll-a and pheophytin-a concentrations. Fig. 7 shows the results of these
1971] L oftus and Carpenter: Ch/01-ophyll Fluorometry 333
I I
14 I 14 rPhe a
' I ::::;; 12 12 C I Chi a
0 I C 10 10 0 I 0
c B <» 8 E I "' a.
6 I 6 -0 I <»
0 I 4 4 => I 0
0 u I 2 2 Phe a
I L -----0 0 --
0 0.2 0.4 0.6 0.8 1.0 0 02 1·4 0.6 0.8 1.0 b l o r ot io c I a rot io
0 a:
2.8 ' 0 a:
2.6 0
0 0
2.4 -0
0 <l 2.2 ..... .,
2.0 2 .0 u.
C: 1.8 1.8
0 a. a. 1.6 1.6 <l
I .4 .._ _ _ .._ _ _._ __ __._ __ _.._ _ __, I .4 .__ _ __. _ _ _,_ __ ...._ _ _ ,..._ _ _,
0 .0 0 .2 0.4 0.6 0.8 1.0 0.0 0 .2 0.4 0 .6 0 .8 1.0
b/o ratio c/o r atio
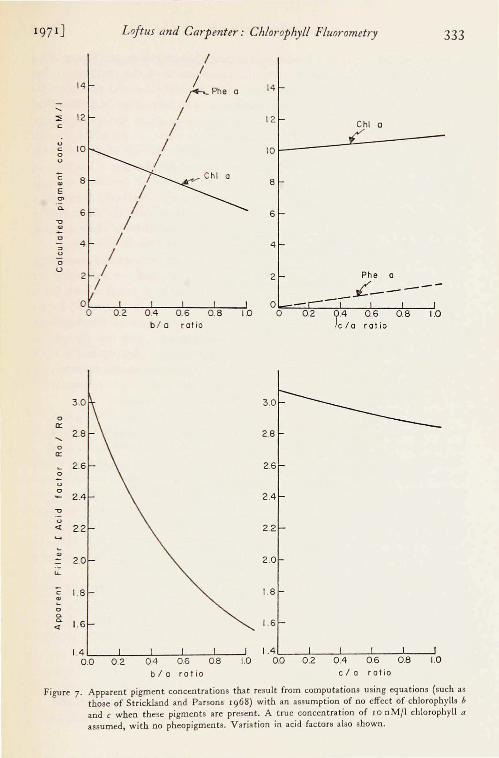
Figure 7. Apparent pigment concentrations that result from computations using equations (such as those of Strickland and Parsons 1968) with an assumption of no effect of chlorophyll s b and c when these pigments are present. A true concentration of 10 nM/1 chlorophyll a assumed, with no pheopigments. V ariation in acid factors also shown.
334 Journal of Marine Research [ 29,3
calculations for our filt er I with a constant concentration of chlorophyll a
( 1 o nM/1); Fig. 7 also demonstrates the consequence of the assumption that accessory chlorophylls do not interfere with chlorophyll-a and pheophytin-a estimates. Although the b/a ratios in natural samples may never be greater than 0.4, and are rarely greater than 0.1-0.2, these calculations show that a large quantity of pheophytin a would be estimated at these levels when none is actually present. Commensurate with the erroneous prediction of pheophytin a, concentrations of chlorophyll a are underestimated by 1 6 % for a b/a ratio of 0-4- J effr eys ( 1968) determined that the b/a ratio for old D. tertiofecta cultures is 0.89. If such a sample were analyzed by fluorometric methods, as reviewed by Strickland and Parsons ( r 968), using a filter similar to ours, the chlorophyll a
would be underestimated by 35 %, and, for every I o.o nM/1 of chlorophyll a, 19.5 nM/1 of pheophytin a would be predicted above that in the culture.
The errors in the predictions as a function of the c/a ratio are less severe than those associated with the b/a ratios. In this instance, with an increasing c/a ratio, the chlorophyll-a concentration is overestimated by as much as IO% when the c/a ratio is r.o. Ratios near r.o were obtained by Jeffreys (1968) for an Amphidinium sp. culture, and ratios of 0.5 or more are typical of dinoflagellates (Madgwick r 966 ). The overestimation of pheophytin a with our filter I in-dicates that those investigators who use the presence of pheopigment a as an indicator of predation and/or a condition of the population should exercise care to see that estimates of these pigments are legitimate and are not a function of the ratio of the accessory chlorophylls: chlorophyll a in samples.
Because the results shown in Fig. 7 were obtained with our filter I, there is excluded a greater percentage of light fluoresced by chlorophylls b and c than by the Corning CS-2-64 and CS-2-60 used by Holm-Hansen et al. (1965). Therefore, the use of the latter filt ers would result in greater errors than would be the case with the filters used by us. With any filt er, according to the recom-mendations of Strickland and Parsons (1968), calibration of a fluorometer when using mixed phytoplankton or culture material results in positive or nega-tive errors as a function of the ratios of accessory chlorophylls-chlorophyll a. Without knowledge of the concentrations of accessory chlorophylls in both the sample and the calibration solution, accurate determination of pheopigment a and chlorophyll a are impossible.
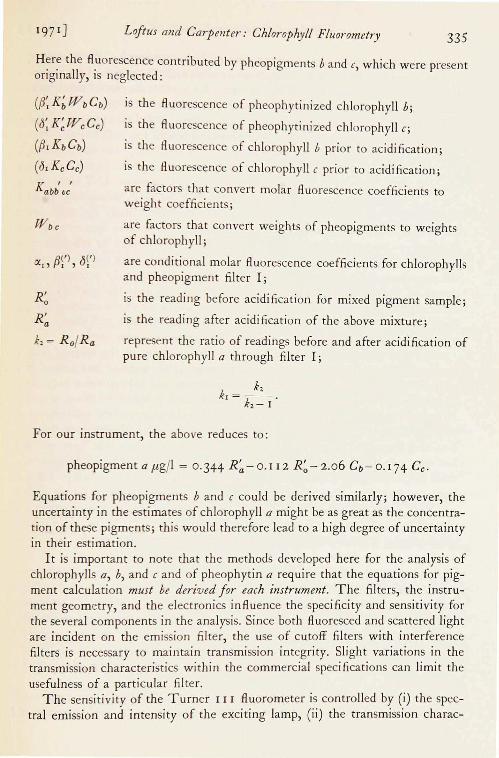
As indicated above, the direct solutions using (1)-(6) produced 18 term equati ons and unacceptable errors in the estimates of the pheopigments. How-ever, pheopigment a may be estimated by determining chlorophylls a, b, and c and by then using these results in an equation where these estimates are used as single-term corrections for the flu orescence contributed by each.
Equation:
pheopigment-a µg/1 = k,(a,)- 1Ka[ (k2(R~ - {J; K~WbCr c5; K;WcCc)] + [({J, Kb Cb+ c5, Kc Cc - R:)J.
Loftus and Carpenter : Chlorophyll Fluorometry 335
H: r~ the fl._uorescence contributed by pheopigments b and c, which were present ongmally, 1s neglected:
(fJ;x; w bCb)
(o;K; Wc Cc)
((J,KbCb)
(o,KcCc)
(J('> o<') (XI) l ) J
R' 0
R' a
is the flu orescence of pheophytinized chlorophyll b;
is the flu orescence of pheophytinized chlorophyll c;
is the flu orescence of chlorophyll b prior to acidification;
is the flu orescence of chloroph y II c prior to acidification;
are factors that convert molar flu orescence coefficients to weight coeffi cients;
are factors that convert weights of pheopigments to weights of chlorophyll;
are conditional molar fluorescence coeffici ents for chlorophylls and pheopigment filt er I;
is the reading before acidificati on for mixed pigment sample;
is the reading aft er acidification of the above mixture;
represent the rati o of readings before and after acidification of pure chlorophyll a through filter I;
k. k,= -- .
kz- I
For our instrument, the above reduces to:
pheopigment a µg/1 = 0 .344 R~-0.1 I 2 R:- 2.06 Cb- 0.174 Cc.
Equations for pheopigments b and c could be derived similarly; however, the uncertainty in the estimates of chlorophyll a might be as great as the concentra-tion of these pigments; this would therefore lead to a high degree of uncertainty in their estimation.
It is important to note that the methods developed here for the analysis of chlorophylls a, b, and c and of pheophytin a require that the equations for pig-ment calculation must be deri ved f or each instrument. The filt ers, the instru-ment geometry, and the electronics influence the specificity and sensitivity for the several components in the analysis. Since both fluoresced and scattered light are incident on the emission fil ter, the use of cutoff filt ers with interference filters is necessary to maintain transmission integrity. Slight variations in the transmission characteristics within the commercial specificati ons can limit the usefulness of a particular fil ter.
The sensitivi ty of the Turner I 11 fluorometer is controlled by (i) the spec-tral emission and intensity of the exciting lamp, (ii) the transmission charac-
'Journal of Marine Research [ 29,3
teristics of the emission and excitation filter, (iii) the geometry of the tube door, (iv) the spectral sensitivity of the photomultiplier, and (v) the size of the excita-tion slit. Each instrument must be calibrated for a particular set of these para-meters, and recalibration is necessary if any parameter is changed.
Since the initial calibration is somewhat tedious and time consuming, the level of sensitivity desired should be determined before the calibration is per-formed. For our purposes, the maximum level of sensitivity was not required, since chlorophyll concentrations in estuarine and coastal waters generally range above 1 µg/1. We have therefore used the general purpose U V lamp, the P-121 photomultiplier, and a mirrored tube door for tubes containing 30 ml and having a pathlength of 2.2 cm. By using the same filters and door, we found that, with a red-sensitive photomultiplier, an increase in sensitivity by a factor of 5-10 can be obtained. This level of sensitivity may be required for oceanic studies. Since numerous modifications are possible with the Turner 111
instrument, each investigator should determine the effects of the accessory pig-ments on his procedure. Goodwin ( I 94 7) has shown that the quenching of chlorophyll fluorescence varies with the spectral character of the exciting light, and it is likely that the calibration values for each pigment will show some variation, depending upon all the parameters previously mentioned.
After the calibration has been achieved, the integrity of the method with time relies upon the stability of the instrument. This stability has a twofold character: (i) linearity in response to concentration, and (ii) repetitive response to solutions of standard fluorescence. We have used standard solutions of qui-nine sulfate in o. 1 N H2SO 4 to check both of these features of the instrument's stability. Over the nine months of use, our fluorometer has shown good repeti-tive and linear stability with response to standard solutions that have varied less than 4%. Preparations of quinine sulfate in 0.1 N H2S04, in concentra-tions of 5 and Io mg/I, have served to monitor both features of stability. These concentrations have given readings that are near the middle and full scale with our filter III when the excitation slit is set at "30". At higher concentrations, quenching is observed and sensitivity to change is poor. The use of similar standardizing procedures is advised if long-term precision is desired.
6. Conclusions. The methods presented have several advantages over cur-rently used techniques. When compared with the trichromatic methods, this technique requires no assumption of the absence of pheopigment. The three chlorophylls may be determined at a faster rate than otherwise, since the sensi-tivity of the fluorometer requires only a fraction of the sample volume necessary for the spectrophotometric methods. These improvements are accompanied by no loss (and perhaps significant gain) in the precision for estimates of the three chlorophylls.
We have shown that the presence of accessory chlorophylls can cause not only serious overestimation of pheophytin a but errors in the estimates of
Loftus and Carpenter: Chlorophyll Fluorometry 337
chlorophyll a dependent upon the ratio of c/a and/or b/a when single-filter methods of fluorometric analysis are used. The multiple-filt er method described here permits measurement of pheopigment a with an accuracy such that the quantities might be useful indicators of community conditions and interaction. We therefore feel that this multifilt er method constitutes an improvement over current methods of chlorophyll analysis.
REFERENCES BARRETT, J., and S. \V . JEFFREYS
1964. Chlorophyllase and for mation of an atypical chlorophyllid e in marine algae. Plant Physiol., 39: 44-47.
CURL JR., HERBERT, and L. F. SMALL 1965. Variations in photosynthetic assimilati on ratios in natural marine phytoplankton
communities. Limnol. Oceanogr., IO suppl.: R67- R73.
DOUGHERTY, R. C., H . H . STRAIN, W. A. SVEC, R . A . UPHAUS, and J. J. KATZ 1966. tructure of chlorophyll -c. J . Amer. chem. Soc., 88: 5037-3038.
FALK, J.E. 1964. Spectra, In: Porphyrins and metalloporphyrins, pp. 8 5-88. Elsevier Publishing Co.,
N.Y. 266 pp.
GEBLEIN, CONRAD 1967. Effects of light intensity on growth, pigment concentration, carbon assimilation and
excretio in l sochrysis galbana, Park. Masters Essay, Johns Hopkins University, Baltimore. 59 pp.
GooDWIN, R. H. 1947. Fluorometric method for estimating small amounts of chlorophyll-a. Anal. Chem.,
I 9: 789-794.
HOLM-HANSEN, OSMUND 1969. Determination of microbial biomass in ocean profiles. Limnol. Oceanogr., I4: 740-
747.
HOLM-HANSEN, OSMUND, C. J. L ORENZEN, R. w . H OLMES, and J. D. H . STRICKLAND 1965. Fluorometri c determination of chlorophyll . J . Con. int. Explor. Mer, 30: 3-15.
lCHIMURA, SHUM-EI, YATSUKA SArJO, and YuSH0 AR UGA 1962. Photosynthetic characteri stics of marine phytoplankton and their ecological meaning
in the chlorophyll method . Bot. Mag. T okyo, 75: 212-220.
JEFFREYS, S. W . 1963. Purification and properties of chlorophyll -c fr om Sargassum jlavicans. Biochem. J .,
86: 313-318.
1968. Quantitative thin-layer chromatography of chlorophyll s and carotenoids fr om marine algae. Bi ochem. Biophys. A cta, I6 2: 265-270.
LORENZEN, C. J . 1967. Determination of chlorophyll and pheophytin : spectrophotometric equation.
Limnol. Oceanogr., I 2 : 343-346.
MADGWICK, J.C. 1966. Chromatographic determination of chlorophylls in algal cultures and phytoplankton.
D eep-sea Res., IJ : 459-466.
Journal of Marine Research [ 29,3
MARGALEF, RAMON 1961. Hidrografica y fitoplankton de un area manna de la costa meridional de Puerto
Rico. Inv. Pesq., I8: 33-96.
Moss, B. A. 1967a.A spectrophotometric method for the estimation of percent degradation of chloro-
phylls to pheo-pigments in extracts of algae. Limnol. Oceanogr., I 2: 335-340.
1967b.A note on the estimation of chlorophyll-a in freshwater algal communities. Limnol. Oceanogr., I2: 340-342.
PARSONS, T. R . 1963. A new method for the microdetermination of chlorophyll-c in sea water. J. mar.
Res., 2I: 165-171.
PARSONS, T . R., and J. D. H . STRICKLAND 1963. Discussion of spectrophotometric determination of marine plant pigments; with
revised euqations for ascertaining chlorophyll and carotenoids. J. mar. Res., 2I:
155-163.
PATTERSON, JOHN, and T. R . PARSONS 1963. Distribution of chlorophyll-a and degradation products in various marine materials.
Limnol. Oceanogr., 8: 355-356.
RABINOWIT CH, E. I. 19 56. The pigment factor, In: Photosynthesis and related processes, Vol. 2, Part 2,
pp. 1299-1310. Interscience Publishers Inc., New York. 2088 pp.
RYTHER, J. H. 1956. The measurement of primary production. Limnol. Oceanogr., I : 72.
RYTHER, J. H., and C. S. YENTSCH 1957. The estimation of phytoplankton production in the oceans from chlorophyll and
li ght data. Limnol. Oceanogr., 2: 281-286.
SAIJO, YATSUKA, and SATOSHI NISHIZAWA 1969. Excitation spectra in the flu orometric determination of chlorophyll-a and pheo-
phytin-a. Mar. Biol., 2: 135-136.
SCOR/UNESCO 1966. Determination of photosynthetic pigments in seawater: Monographs on oceano-
graphic methodology r. UNESCO Publications Center, New York. 69 pp.
SMITH, J. H ., and ALLEN BENIT EZ 1955. Chlorophylls: Analysis of plant materials, In: Modern methods of plant analysis,
Vol. 4, pp. 143-195, Editors, K. Paech and M . Tracey. Heileberg: Springer Verlag. 166 PP·
STRICKLAND, J. D . H., and T. R . PARSONS 1968. A practi cal handbook of seawater analysis. Bull. Fish. Res. Bd. Canada, I67: 185-
206.
VERNON, L . P . 1960. Spectrophotometric determination of chlorophylls and pheophytins m plant ex-
tracts. Anal. Chem., 32: 1144-11 50.
YENTSAH, C. S., and D. W. M ENZEL 1963. A method for the determination of phytoplankton chlorophyll and phaeophytin
by flu orescence. D eep-sea Res., IO: 221-23 r.


![The Journal of Marine Research is an online peer-reviewed ...images.peabody.yale.edu/publications/jmr/jmr40-02-02.pdf1982] Zeman & Lumley: Salt fingers 317 order model equations yield](https://img.pdfslide.us/doc/110x75/60e2453faa48900ff32cc49b/the-journal-of-marine-research-is-an-online-peer-reviewed-1982-zeman-.jpg)

![The Journal of Marine Research is an online peer-reviewed journal …images.peabody.yale.edu/publications/jmr/jmr39-04-06.pdf · 2019-05-18 · 1981] Blaha & Sturges: Gulf of Mexico](https://img.pdfslide.us/doc/110x75/5f3844f8508e12025a05c59b/the-journal-of-marine-research-is-an-online-peer-reviewed-journal-2019-05-18-1981.jpg)