Embed Size (px)
Citation preview

The Journal of AHRA: The Association for Medical Imaging Management
March/April 2017volume 39 number 2
Accounting Basics Part 4: Net Present ValueBy Carole A. South-Winter, EdD, CNMT, RT, FAEIRS and Jason C. Porter, PhD
Leading and Motivating Generation Y EmployeesBy Curtis Bush, MBA, CRA, FACHE
Enhancing Patient Safety Using Medical Imaging InformaticsBy Mahtab Karami, PhD and Nasrin Hafizi
The Diagnostic Imagination in Radiology: Part 2By Rodney Sappington, PhD

3
contentsAccounting Basics Part 4: Net Present ValueBy Carole A. South-Winter, EdD, CNMT, RT, FAEIRS and Jason C. Porter, PhDNet present value is a more advanced accounting tool for justifying expenditures. This entire article series provides a full set of tools to improve communication with the C-suite, donors, and other leaders.
Leading and Motivating Generation Y EmployeesBy Curtis Bush, MBA, CRA, FACHEThe literature review shows that strong, meaningful mentorship programs are a great way to lead and motivate generation Y into the future as current employees and future leaders. They value achievement and socialization more than prior generations.
Enhancing Patient Safety Using Medical Imaging InformaticsBy Mahtab Karami, PhD and Nasrin HafiziIn imaging, it is necessary to define a framework to identify safety incidents, analyze them, provide solutions for preventing them, and give feedback on the results. Using informatics can be effective in monitoring these indicators.
The Diagnostic Imagination in Radiology: Part 2By Rodney Sappington, PhDMachine learning means extracting patterns not only from patient level observations or a radiologist’s primary diagnosis, but from secondary diagnoses, incidental findings, claims data and similarities with other patients for predictive benefit.
• f e a t u r e s
11
19
27
39
M a r c h / a p r i l 2 0 1 7 • V o l u M e 3 9 : 2
46 Index to Advertisers
47 The Marketplace
• d e p a r t m e n t s
Cover: Annual Meeting 2016 attendees; Nashville, TN.

4
viewpoint 6
editorial 7
regulatory affairs 9
in the industry 17
workforce planning 25
coding 37
management findings 44
on that note 48
contents• c o l u m n s
Disrupt, Adapt, and OvercomeDebra L. Murphy, CAEMachine learning is the latest buzz in healthcare and it’s certainly not the first disruptive technology radiology has faced.
Managing Other DepartmentsPaul Dubiel, MS, RT(R), CRA, FAHRAWhile growing outside of imaging can be hard work and not always an easy transition it can also be rewarding.
A Series of Executive OrdersBill Finerfrock and Nathan BaughIt is prudent for the imaging community to understand with clear eyes which executive orders affect imaging and what exactly those orders entail.
An Alternative to Evacuated BottlesDan FelixThe system not only reduces costs and increases safety; it also demonstrates our commitment to the most advanced medical technologies.
Value-Based Customer Service RevisitedMark LernerImplementation of this program has been a journey of success in raising the bar on service excellence.
Can You Hear Me Now?Melody W. Mulaik, MSHS, CRA, FAHRA, RCC, CPC, CPC-HThis article highlights the key areas of concern associated with the linking of the RIS and CDM systems.
Go Beyond the EverydayDeo G. Religioso, CNMT, RT(N), MBA, CRACreate an experience that customers will appreciate, remember, and seek out. Command that emotional difference.
Our AHRA CultureGordon Ah Tye, FAHRAour work as caregivers makes us exceptional leaders, and also makes ahra uniquely special as an organization.


The Journal of AHRA: The Association for Medical Imaging Management
March/April 2017 • Volume 39 Number 2
Editor-in-ChiefPaul Dubiel, RT(R), MS, FAHRA, CRADirector of ImagingSeton Family of HospitalsAustin, TX
Managing Editor Debra L. Murphy, CAE
DesignMary McKeon
ProductionCenveo® Publisher Services
Associate Content ProducerKerri Hart-Morris
Editorial Review Board
viewpoint
Bill Algee, CRA, FAHRADirector of Imaging ServicesColumbus Regional HospitalColumbus, IN
Kelly J. Bergeron, MHA, BS, RT(R)(MR), CRASr. Lead MRI Technologist Alliance HealthCare ServicesNew Hampshire
Traci Foster, MSRA, CRA, RT(R)Assistant Director of Radiology Texas Children’s HospitalHouston, TX
Frances H. Gilman, DHSc, RT(R)(CT)(MR)(CV)Chair, Associate Professor Department of Radiologic SciencesThomas Jefferson UniversityPhiladelphia, PA
Margaret A. “Peggy” Kowski, PhD, DABR Physicist / OwnerNational Medical Physics PlusSt. Petersburg, FL
Mario Pistilli, CRA, MBA, CNMTManager, Imaging ServicesPresence Health—Saint Joseph Medical CenterJoliet, IL
Carrie Stiles, BS, RT(R)(CT), CRAMulti-Modality TechnologistHouston Methodist HospitalHouston, TX
Ivan Vinueza, CRADirector of RadiologyBlue Ridge HealthcareMorganton, NC
By Debra L. Murphy, CAE
Disrupt, Adapt, and Overcome
When you hear “artificial intelligence” (AI) what comes to mind? Cyborgs taking over the human race? AI is defined as intelligence exhib-ited by machines. In the Nov/Dec 2016 issue of Radiology Management, Rodney Sappington discussed an emerging subfield of AI: machine learning. This is something much less apocalyptic, and much more opportunistic. In relation to healthcare, it’s about identifying and clas-sifying disease that serves to improve lives; however, it will no doubt be a disruptive technology for radiology.
Of course, disruptive technologies are nothing new to imaging. It’s your preparation for and reaction to the change that is variable. Sure, you may be saying. Your hospital can’t even keep the chargemaster up to date. How are you supposed to prepare your organization for “machines that dream”?! Awareness and education are the first steps.
Other industry associations are also paying attention. HIMSS cer-tainly is. And in the January 2017 issue of the Journal of the American College of Radiology (JACR), James A. Brink, MD said in regards to machine learning: “Such disruptions in technology are beyond the con-trol of any individual or group of individuals within a given profession.” He goes on to imply that we’re smarter to plan for it and adapt than fall behind and risk obsolescence.
In Part 2 of his series (p. 39), Sappington discusses how machine learning can fit pieces of a patient’s story back together in a far richer and more predictive fashion. He also offers some thoughts on the busi-ness case for radiology, something that AHRA members will no doubt be interested in.
While, right now, this concept may be most applicable to academic hospitals and teaching institutions focused on research, it will surely spread and eventually be discussed at your own facility. It is disruptive and a potential game changer, but as always, if it will ultimately benefit patient care, then it’s a journey worth taking.
Contact Radiology ManagementAdvertising Sales
Kelly MillerM.J. Mrvica Associates, Inc.2 West Taunton AvenueBerlin, NJ 08009Phone: (856) 768-9360Fax: (856) [email protected]
Editor
Debra L. Murphy, CAEAHRA490-B Boston Post Road, Suite 200Sudbury, MA 01776Phone: (800) 334-2472, (978) 443-7591Fax: (978) [email protected]
Publication in Radiology Management does not constitute an endorsement of any product, service or material referred to, nor does publication of an advertisement represent an endorsement by AHRA or the Journal. All articles and columns represent the viewpoints of the author and are not necessarily those of the Journal or the Publisher.
Radiology Management is published 6 times each year (January, March, May, July, September,
and November) by AHRA. For information on subscriptions, contact: AHRA, 490-B Boston Post
Road, Suite 200, Sudbury, MA 01776; phone (978) 443-7591. For advertising and reprints, contact
M.J. Mrvica Associates, phone (856) 768-9360 or 2 West Taunton Avenue, Berlin, NJ 08009.
Subscriptions: Radiology Management is an official publication of AHRA. The annual subscrip-
tion is an integral part of the dues for members of the association. The fee for membership in AHRA is
$175.00 a year with a $25 initial application charge. For information on membership, contact AHRA
at the address above. A nonmember subscription rate is available at an annual cost of $100.00 within the
US, $115.00 within Canada, and $135.00 for other foreign countries. A year’s subscription covers the 6
regularly scheduled issues plus any special issues. All nonmember subscriptions must include payment
(payable to AHRA) with the request and should be forwarded to AHRA at the address above.
Change of Address: Notification should be sent to AHRA at the address above.
Copyright © 2017 by AHRA: The Association for Medical Imaging Management.
ISSN 0198-7097
m a r c h / a p r i l 2 0 1 7 r a d i o l o g y m a n a g e m e n t6
Deb Murphy is the Deputy Executive Director at AHRA. She is also managing editor of Radiology Management and may be contacted at [email protected].

editorial
r a d i o l o g y m a n a g e m e n t m a r c h / a p r i l 2 0 1 7 7
Managing Other DepartmentsBy Paul Dubiel, MS, RT(R), CRA, FAHRA
About four years ago, I was given the opportunity to manage a department in addition to my role in radiology. It was the beginning of the restructuring that we continue to see today. My imaging department was working well. I had excel-lent site managers, imaging IT staff and support personnel all working together to ensure imaging was on track and hum-ming along. Don’t get me wrong, we had our issues and enough projects to keep us all busy but as a whole we were in good shape. Right around this time a number of leaders left the organization. As they left for other opportunities, I saw my chance to step up and take a more active role in what was happening in the hospi-tal. I often told my boss during our one on ones that if he needed help with any of the other departments to let me know. When the lab director decided to leave, they finally listened and I was named Senior Director of Lab.
My main job was to get the lab through installation of a new lab infor-mation system and mentor the lab operations director to eventually take over as the senior director. Since the old lab director was a friend, we would bounce ideas off each other on how to improve services and how to navigate through the system. I thought I knew something about lab so obviously it would be an easy transition for me to take over. I knew the players, had some background as to what was needed, and I had been briefed by the former director
on what was going on. Easy as pie, right? Wrong!!! My experience with the lab, while rewarding, was a tough two years. The conversion to the new LIS system was not a welcome change. The system they had was a much more user friendly system that was not upgraded for many years so upgrading the system was essentially putting in a new one. In addi-tion, our network was standardized on a different IT product that was not well received by many lab leaders so the con-version was not going to be easy. That and the lack of communication between all of the different factions working on the project made the planning, imple-mentation, and execution extremely dif-ficult and stressful for all involved. Even now after the successful go-live there are still a number of unresolved issues that are being worked out.
One of the biggest mistakes I made was assuming that because I knew the lab leaders and had worked with them on some successful projects they would automatically accept me as their new leader. Although some did and worked with me to get things in place, a num-ber of them resented the fact that a non labratorian was put in charge. After all, the lab was different and no one but a lab person could really understand what was needed or what was going on. While I understood my limitations and relied on leadership to help me learn what I needed to know about the lab and its operations there was still enough
pushback from lab staff around my sug-gestions and direction that I had to use the words I hate to use more than any other: “because I said so” and “just do it.” Frustration boiled over on both sides and while work was getting done the sense of frustration was great.
Meanwhile, during this time the director of respiratory, cardiopulmo-nary, and neuro diagnostics left the orga-nization and they needed a new leader. Concurrently, my boss also left the orga-nization and a new leader took his place. During the transition, the lab operations director ended up reporting directly to my new boss. So because I did not learn from the first venture outside of imaging or because I was given the opportunity (I can’t remember which) I was named director of respiratory, cardiopulmonary, and neurosciences. While I was familiar with these areas, with the exception of cardiopulmonary, I did not have a good grasp of what they did or how they func-tioned. While I went into my time with lab with some cockiness about what I knew and what I could do, I had no illu-sions of what I knew about my new areas. I had to first meet the leaders who were now reporting to me, meet the people who were doing the work, and learn all I could in a very short period of time to make major decisions that would change how these new worlds would work. While I was learning the ropes I also needed to make decisions on how my new areas would meet the challenges of a

m a r c h / a p r i l 2 0 1 7 r a d i o l o g y m a n a g e m e n t8
new healthcare reality. All this, of course, in addition to my first love: imaging.
So what were the differences between my first venture outside of imaging and the new one? Mainly, it was me and how I approached the new role. While I thought I was trying to learn about lab, I also had to make some tough deci-sions that were counter to what the lab managers wanted to do. With my new responsibility, so far, we have all been on the same page in what we want and need to accomplish to improve patient care. With the lab I was never accepted in the leadership role because I was not a labra-torian and that was not going to change. Even when we did agree on a subject it was less about me working with them and more about me finally getting out of the way and letting lab do what lab does best. With my new managers there is a general sense of teamwork and coopera-tion and for the most part we are work-ing together to get things done. While it has been a hard few months to move some of our initiatives forward it is reas-suring that we are all on the same page and our goals aligned.
So what did I learn from my two expe-riences? Don’t be shy in your desire to add more responsibility to your resume. Walk in with your eyes, ears, and heart wide open. You need to be humble and willing to listen and learn because they are the experts not you. But while you are learning you also need to let them know you are in charge and even though you want to work together there are deci-sions that need to be made that cannot be debated or discussed ad nauseam. While my time with the lab was tumultu-ous I would not give it up for the world. I learned a lot, met some good people, and used my experiences to better myself and help those around me thrive. These are tough times and tough and unpopular decisions need to be made and you are the one who needs to make them. And, lastly, don’t forget your original team in radiology. While you are expanding your scope they are still working to preserve and continue the great work you have
accomplished. You may even have to dis-tribute some of your work to your leads or supervisors to better manage your time and the department’s work. You have trained them and prepared them to be more involved in your department and then trust them to do what needs to be done.
While growing outside of imaging can be hard work and not always an easy transition it is also rewarding for you and your healthcare system. It’s never too late to learn. It’s never too late to expand your horizons and it’s never too late to lead your new departments as well as the old ones into a new, exciting healthcare experience.
Paul A. Dubiel, MS, RT(R), CRA, FAHRA has been the senior director, imaging at Seton Family of Hospitals in Austin, TX since 2002. An AHRA member since 1993, he is currently editor-in-chief of Radiology Management and has volunteered for numerous other task forces and committees. Paul can be contacted at [email protected].
editorial

r a d i o l o g y m a n a g e m e n t m a r c h / a p r i l 2 0 1 7 9
Within ten days of taking office, Presi-dent Trump signed several highly pub-licized Executive Orders (EOs). While there has been a political and media frenzy surrounding many of his early actions, it is prudent for the imaging community to understand with clear eyes which executive orders affect imag-ing and what exactly those orders entail.
While the Affordable Care Act (ACA) repeal and replace process will certainly be an important item to watch, it is equally important to understand how the regulatory process will change under the Trump administration. It is difficult to predict what the ramifications of the Trump regulatory philosophy will be at this time. All we can do is discuss the directives from the President, and highlight the imaging issues potentially affected by his directives. This article will focus on three Trump orders.
Regulatory Freeze Pending Review The “regulatory freeze pending review” presidential memorandum is not some-thing unique to the Trump adminis-tration.1 Both the Obama and Bush administrations issued similar memo-randa on their first days in the White House. This directive, quite simply, halts the publication/finalization of regula-
tions until a department or agency head of the Trump administration has an opportunity to review and approves it prior to publication.
The order also directs the various agencies and departments to delay for a 60-day period any “final” regulation published but not yet effective so these, too, can be reviewed by Trump adminis-tration officials. Furthermore, the order directs the acting heads of agencies and departments to “where appropriate and as permitted by applicable law . . . con-sider proposing for notice and comment a rule to delay the effective date for regu-lations beyond that 60-day period.”
This order may have an impact on the development of clinical decision support (AUC/CDS) policy. The beginning of the year is known as “rulemaking season” over at the Centers for Medicare and Med-icaid Services (CMS) meaning that CMS employees are typically busy working on the two large annual healthcare rules: the Medicare Physician Fee Schedule (MPFS) update and the Hospital Outpatient Prospective Payment System (HOPPS) update. Career CMS employees are doing the preliminary work on those rules in hopes of getting them out on time; how-ever, any substantive policy decisions will have to wait until Trump administration officials are in place in CMS.
Minimizing the Economic Burden of the Patient Protection and Affordable Care Act Pending RepealPresident Trump also issued a relatively broad executive order on “Minimizing the Economic Burden of the Patient Pro-tection and Affordable Care Act Pending Repeal.”2 This order directs the Secretary of Health and Human Services and all other relevant authorities to:
waive, defer, grant exemptions from, or delay the implementation of any provision of the [ACA] that would impose a fiscal burden on any State or a cost, fee, tax, penalty, or regulatory burden on individu-als, families, healthcare providers, health insurers, patients, recipients of health care services, purchasers of health insurance, or makers of medical devices, products, or medications.
In the event that a repeal/replace effort gets delayed, this executive order could be used to halt enforcement of the taxing authorities built into the ACA, such as the so-called Cadillac Tax or medical device tax, or tanning booth tax, from going into effect. It could also be used to effectively eliminate the indi-vidual mandate penalty. Such actions
regulatory affairs
A Series of Executive OrdersBy Bill Finerfrock and Nathan Baugh

m a r c h / a p r i l 2 0 1 7 r a d i o l o g y m a n a g e m e n t10
Repeal.” January 20, 2017. Available at: https://www.whitehouse.gov/the-press-of f ice/2017/01/2/executive-order-minimizing-economic-burden-patient-protection-and. Accessed February 3, 2017.
3The White House, Office of the Press Secretary. “Presidential Executive Order on Reducing Regulation and Controlling Regulatory Costs.” January 30, 2017. Available at: https://www.whitehouse.gov/the-press-office/2017/01/30/presidential-executive-order-reducing-regulation-and-controlling. Accessed February 3, 2017.
Bill Finerfrock is the president and owner of Capitol Associates, a government relations/consulting firm based in Washington, DC, who has partnered with AHRA on their regulatory affairs issues. Nathan Baugh is an associate with CAI. They can be contacted at [email protected] and [email protected].
In many cases, these are not easy questions to answer. Depending on how the administration chooses to execute the “plus one, minus two” concept, the regulatory process could be slowed significantly.
Keep in mind, with change comes opportunity. AHRA may want to point out to CMS outdated rules and regula-tions that impact imaging, but serve no purpose in terms of improving patient care or lowering costs.
We should note that while the Trump administration is clearly focused on reducing federal regulations, items such as the further development of site neu-tral payment policies and CDS are regu-latory mandates grounded in bipartisan statutes. For example, the implementa-tion of the site neutral payment policy is projected to save the government $9.3 billion over ten years. While the further refining of the payment methodology may be onerous, it is also a significant source of savings for the federal budget. Therefore, the Trump administration may opt to continue to implement the site neutral regulations, despite a regula-tory burden on the imaging community.
These three orders are the tip of the spear in the new Trump era of rulemak-ing. The focus is clearly on reducing both the number and cost of regula-tions. However, as is often the case with policy and rulemaking, the devil is in the details, so we will need to remain vigilant as a community to understand how we are affected and what opportunities may arise during the Trump presidency.
References1Priebus R. “Memorandum for the Heads of
Executive Departments and Agencies.” The White House, Office of the Press Secretary. January 20, 2017. Available at: https://www.whitehouse.gov/the-press-office/2017/01/20/memorandum-heads-executive-departments-and-agencies. Accessed February 3, 2017.
2The White House, Office of the Press Secre-tary. “Executive Order Minimizing the Economic Burden of the Patient Protec-tion and Affordable Care Act Pending
would be done under the same execu-tive authority the Obama administration used to delay the effective date of certain aspects of the ACA.
Reducing Regulation and Controlling Regulatory CostsThe executive order on reducing regu-lation and controlling regulatory costs essentially says that for every new regu-lation, two existing regulations must be eliminated.3 It also directs the heads of all agencies to ensure that the total incre-mental cost of all new regulations final-ized throughout the year to be no greater than zero.
It is unclear if the Trump adminis-tration will calculate “total incremental cost” based on the cost the rules impose on the private sector, or based on the cost the new rules pose to the federal govern-ment, or both.
The Director of the Office of Man-agement and Budget is tasked with implementing these rules and creating a process for:
standardizing the measurement and esti-mation of regulatory costs; standards for determining what qualifies as new and offsetting regulations; standards for deter-mining the costs of existing regulations that are considered for elimination; processes for accounting for costs in different fiscal years; methods to oversee the issuance of rules with costs offset by savings at different times or different agencies; and emergen-cies and other circumstances that might justify individual waivers of the require-ments of this section.
It is difficult to predict the impact this will have on the rulemaking process during the Trump administration. For example, what will the cost estimate be for implementing AUC/CDS and how will they offset that cost? Will they con-sider the rules that are coming out on CDS implementation new rules and thus be required to identify other rules for elimi-nation? Or, will they argue that the rules surrounding AUC/CDS implementation are simply modifications of existing rules?
regulatory affairs

r a d i o l o g y m a n a g e m e n t m a r c h / a p r i l 2 0 1 7 11
The first parts of this series walked through some common accounting ter-minology and some useful accounting methods for justifying capital decisions. They have discussed how to gather the correct information, how to organize that information, how to calculate a net cash inflow (or outflow) each year, how to determine the payback period on a project, and how to use the time value of money and Internal Rate of Return (IRR) to make more informed decisions. This article will discuss the last of the account-ing tools being introduced: Net Present Value (NPV). This final tool, along with the other tools and definitions discussed, will provide a full set of accounting tools to improve communication with the C-suite, donors, and other leaders.
To illustrate the NPV method, this article will use the two examples intro-duced in parts 2 and 3 of the series. The first example assumed that the emer-gency department (ED) of a large hospi-tal has determined that moving trauma patients all the way to radiology for x-rays, several floors away, for imaging slows things down, causing added pain and discomfort for patients and frus-trating providers. At the same time, an increased volume of business has been experienced in the ED, making it even more desirable to provide the x-rays in
the ED. It has been proposed to executive administration that a dedicated porta-ble x-ray machine and digital reader be purchased for use in the ED. The second example assumed that a small hospital has the opportunity to lease a nearby office building. The hospital administra-tion wants to move some of their record keeping services offsite to free up space for three new beds.
The IRR analysis in Part 3 of the series suggested that the x-ray investment would be a successful project, but that the new office building would not pro-vide a sufficient return to make it worth the change. Now, the NPV method will be used to augment that analysis and confirm those preliminary results.
The Net Present Value MethodThe NPV method is considered the best accounting tool available for evaluat-ing long term projects. It eliminates the weaknesses of the IRR method by giving the decision maker greater flexibility and control over the annual cash flows while still incorporating the effects of time value. However, that benefit comes at a cost. The NPV method takes more work to both create and explain. However, if you walk through it step by step you can avoid both of those difficulties.
• Making and justifying capital expendi-tures can be a difficult part of a supervi-sory or managerial position. Under-standing more advanced accounting tools for justifying these expenditures, like Internal Rate of Return (IRR) and Net Present Value (NPV), can improve the chances of receiving necessary funding.
• NPV avoids the weaknesses of the IRR method by allowing decision makers to specify when cash flows will occur instead of assuming that net cash flows will be equal each year of a project.
• Taking the time to learn basic account-ing definitions and tools can improve your ability to manage and provide greater opportunities to help patients, staff, and the community.
ExEcutivE Summary
By Carole A. South-Winter, EdD, CNMT, RT, FAEIRS and Jason C. Porter, PhD
Accounting Basics Part 4: Net Present Value
The credit earned from the Quick CreditTM test accompanying this article may be applied to the
fiscal management (FM) domain.

Accounting Basics Part 4: Net Present Value
m a r c h / a p r i l 2 0 1 7 r a d i o l o g y m a n a g e m e n t12
The NPV calculation begins with a table of cash inflows and outflows, simi-lar to the one created in the last article. The goal with this table is to summarize the cash information in a format that makes it easy to read and easy to per-form the necessary calculations. Table 1 summarizes the inflows, outflows, and net cash amounts for each year of the x-ray project. In this simple example, the net cash flows are the same each year of the project, but that is not necessary for the calculations. Each year can have a unique amount, allowing for adjustments if additional training or maintenance will be required during some years of the project.
With the recurring and annual amounts listed, the next step is to use a present value calculation to convert these “future” dollars into “today” dollars. This can be done manually, but it’s much eas-ier to use the present value functions of a spreadsheet program. Before doing that, however, one more piece of informa-tion must be gathered. One of the most important elements of a time value cal-culation is the discount rate, or the rate at which an individual or organization believes that money will change value over time. Some organizations use the average interest rate on their debt, while others use an average of the IRRs from their various projects. Most, however, use their IRR thresholds or an interest rate very close to it. The easiest way to find
out what discount rate an organization uses is to contact the accounting depart-ment and tell them that you are working on a NPV calculation and need an appro-priate discount rate. Once they recover from the shock of being asked, they’ll be more than happy to provide it, and they may even ask if they can help with the calculations. In the x-ray example, the hospital will use its 10% IRR threshold as the discount rate, enough to cover 2-3% inflation, 5% in average interest costs on debt, and a 2-3% profit.
Once the appropriate discount rate and dollar values are known, the equa-tions are straightforward. The easiest equations are those for cash flows that happen at the beginning of the proj-ect, because no adjustment is required. Remember that the goal of time value calculations is to adjust future cash val-ues so that they match up with the value today. Since the initial outflows will be made immediately, they already match today’s values and no adjustment is nec-essary. In the x-ray example, that’s the case with the first two lines of the table, so the present value is equal to the stated cash flows.
The next step is to determine the pres-ent value of the future cash flows. For each of the other lines in the table, we will use this equation: =pv(discount rate, number of years from start of project, recurring amount, one time amount). For the 2017 line in Table 1, that equation
will appear like this: =pv(10%,1,0,38576). Notice that we don’t include a recurring amount, just the one time amount that will be paid or received for that year. You can use recurring amounts, like pay-ments on a mortgage, when calculat-ing the present value, but that method requires a bit more practice. For 2018, the equation would appear like this: =pv(10%,2,0,38576). Notice that the only change is to the year, since the net cash flow is the same as the cash flow in 2017, but it will happen two years from the start of the project.
While using a spreadsheet program greatly speeds up this process, there are two important things to remember. First, make sure that the cash outflow amounts are put into the equation as negative numbers to ensure that the system pro-vides the correct result. Second, some spreadsheet programs actually default to a negative value when doing present value calculations. To find out if this is the case with the program being used, try the present value equation on one cash inflow that should have a positive value. If the spreadsheet returns a nega-tive value, then add a “-” to the begin-ning of the equation to ensure the correct final result. So, in the x-ray example, if the basic equation for the annual cash inflows, =pv(10%,1,0,38576), returns a negative amount instead of a positive amount, then change the equation to look like this: =-pv(10%,5,164162,0).
taBLE 1. Summary of Cash Flows
year cash inflows
cash Outlfows
Net cash Flow
Description
Start of Project $0 ($120,000) ($120,000) Purchase of equipment and staff training
2017 $167,426 ($128,850) $38,576 Annual cash inflows include revenues and cost savings from the new machine. Annual cash outflows are the costs of running the new machine, including salaries for the new technologists needed. In the final year, the annual outflows also include the $100 to ship the equipment to a smaller facility.
2018 $167,426 ($128,850) $38,576
2019 $167,426 ($128,850) $38,576
2020 $167,426 ($128,850) $38,576
2021 $167,426 ($128,950) $38,476
totals $837,130 ($764,350) $72,780
r a d i o l o g y m a n a g e m e n t m a r c h / a p r i l 2 0 1 7 13
That slight change at the very beginning will correct for the error.
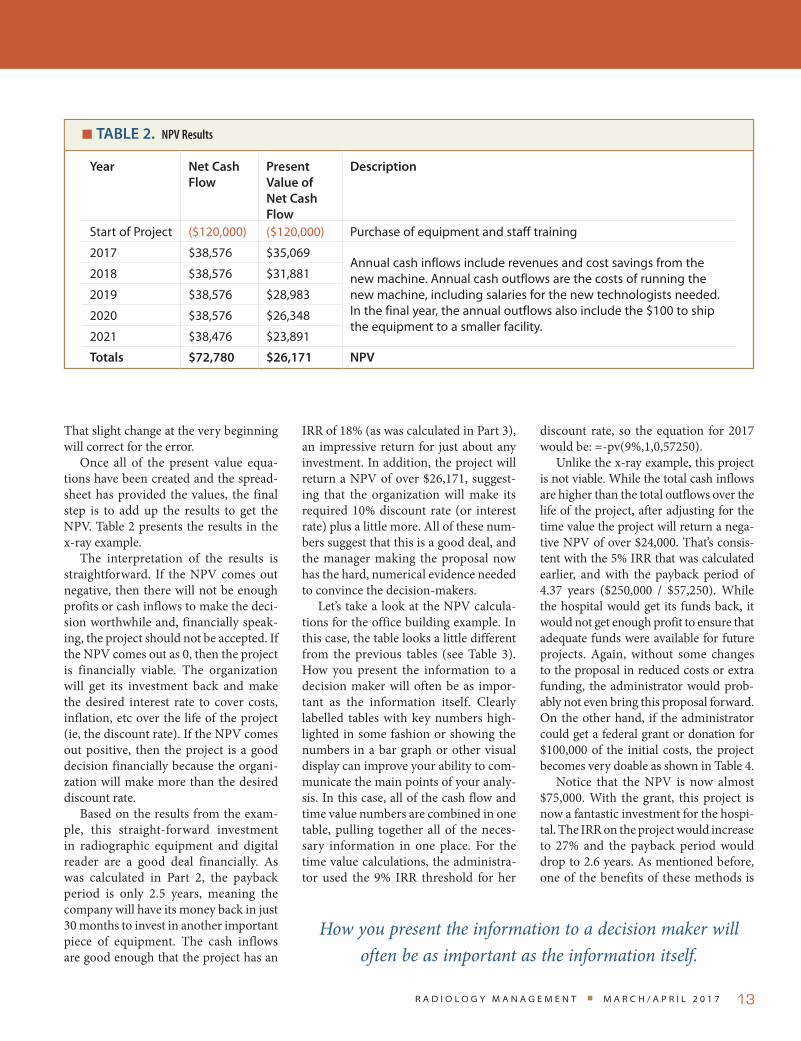
Once all of the present value equa-tions have been created and the spread-sheet has provided the values, the final step is to add up the results to get the NPV. Table 2 presents the results in the x-ray example.
The interpretation of the results is straightforward. If the NPV comes out negative, then there will not be enough profits or cash inflows to make the deci-sion worthwhile and, financially speak-ing, the project should not be accepted. If the NPV comes out as 0, then the project is financially viable. The organization will get its investment back and make the desired interest rate to cover costs, inflation, etc over the life of the project (ie, the discount rate). If the NPV comes out positive, then the project is a good decision financially because the organi-zation will make more than the desired discount rate.
Based on the results from the exam-ple, this straight-forward investment in radiographic equipment and digital reader are a good deal financially. As was calculated in Part 2, the payback period is only 2.5 years, meaning the company will have its money back in just 30 months to invest in another important piece of equipment. The cash inflows are good enough that the project has an
IRR of 18% (as was calculated in Part 3), an impressive return for just about any investment. In addition, the project will return a NPV of over $26,171, suggest-ing that the organization will make its required 10% discount rate (or interest rate) plus a little more. All of these num-bers suggest that this is a good deal, and the manager making the proposal now has the hard, numerical evidence needed to convince the decision-makers.
Let’s take a look at the NPV calcula-tions for the office building example. In this case, the table looks a little different from the previous tables (see Table 3). How you present the information to a decision maker will often be as impor-tant as the information itself. Clearly labelled tables with key numbers high-lighted in some fashion or showing the numbers in a bar graph or other visual display can improve your ability to com-municate the main points of your analy-sis. In this case, all of the cash flow and time value numbers are combined in one table, pulling together all of the neces-sary information in one place. For the time value calculations, the administra-tor used the 9% IRR threshold for her
discount rate, so the equation for 2017 would be: =-pv(9%,1,0,57250).
Unlike the x-ray example, this project is not viable. While the total cash inflows are higher than the total outflows over the life of the project, after adjusting for the time value the project will return a nega-tive NPV of over $24,000. That’s consis-tent with the 5% IRR that was calculated earlier, and with the payback period of 4.37 years ($250,000 / $57,250). While the hospital would get its funds back, it would not get enough profit to ensure that adequate funds were available for future projects. Again, without some changes to the proposal in reduced costs or extra funding, the administrator would prob-ably not even bring this proposal forward. On the other hand, if the administrator could get a federal grant or donation for $100,000 of the initial costs, the project becomes very doable as shown in Table 4.
Notice that the NPV is now almost $75,000. With the grant, this project is now a fantastic investment for the hospi-tal. The IRR on the project would increase to 27% and the payback period would drop to 2.6 years. As mentioned before, one of the benefits of these methods is
taBLE 2. NPV Results
year Net cash Flow
Present value of Net cash Flow
Description
Start of Project ($120,000) ($120,000) Purchase of equipment and staff training
2017 $38,576 $35,069 Annual cash inflows include revenues and cost savings from the new machine. Annual cash outflows are the costs of running the new machine, including salaries for the new technologists needed. In the final year, the annual outflows also include the $100 to ship the equipment to a smaller facility.
2018 $38,576 $31,881
2019 $38,576 $28,983
2020 $38,576 $26,348
2021 $38,476 $23,891
totals $72,780 $26,171 NPv
How you present the information to a decision maker will often be as important as the information itself.

Accounting Basics Part 4: Net Present Value
m a r c h / a p r i l 2 0 1 7 r a d i o l o g y m a n a g e m e n t14
taBLE 4. Second NPV Example with a Donation or Grant to Cover $100,000 of the Initial Costs
year cash inflows
cash Outlfows
Net cash Flow
Present value of Net cash Flows
Description
Start of Project
$0 ($150,000) ($150,000) ($150,000) Purchase of equipment and remodeling, less a $100,000 grant or donation
2017 $169,250 ($112,000) $57,250 $52,523 Annual inflows include revenues from extra hos-pital beds. Annual outflows are the costs of the lease payments, additional insurance, utility costs, cleaning supplies, and administrative costs. In year 4 there is an additional $5,000 outflow for main-tenance. In the final year, annual inflows include $4,000 from selling the equipment and the out-flows include $50,000 to restore the office building at the end of the lease.
2018 $169,250 ($112,000) $57,250 $48,186
2019 $169,250 ($112,000) $57,250 $44,208
2020 $169,250 ($117,000) $52,250 $37,015
2021 $169,250 ($112,000) $57,250 $37,209
2022 $173,250 ($162,000) $11,250 $6,708
totals $1,019,500 ($877,000) $142,500 $75,848 NPv
taBLE 3. Second NPV Example
year cash inflows
cash Outlfows
Net cash Flow
Present value of Net cash Flows
Description
Start of Project
$0 ($250,000) ($250,000) ($250,000) Purchase of equipment and remodeling
2017 $169,250 ($112,000) $57,250 $52,523 Annual inflows include revenues from extra hos-pital beds. Annual outflows are the costs of the lease payments, additional insurance, utility costs, cleaning supplies, and administrative costs. In year 4 there is an additional $5,000 outflow for main-tenance. In the final year, annual inflows include $4,000 from selling the equipment and the out-flows include $50,000 to restore the office building at the end of the lease.
2018 $169,250 ($112,000) $57,250 $48,186
2019 $169,250 ($112,000) $57,250 $44,208
2020 $169,250 ($117,000) $52,250 $37,015
2021 $169,250 ($112,000) $57,250 $37,209
2022 $173,250 ($162,000) $11,250 $6,708
totals $1,019,500 ($977,000) $42,500 ($24,152) NPv
the ability to test out the feasibility of a project, make adjustments, and adapt the plan to find viable options before submit-ting it to the management team.
Once a manager or supervisor has a strong set of these financial or account-ing facts, he can then add the rest of the story: improved patient care, increased
patient comfort, improved diagnosis and treatment, greater satisfaction for the physicians and technologists, and increased service to the community, etc. With the combination of financial and non-financial facts, he has a complete package that will be hard for the execu-tives to refuse.
Using a Decision Making TemplateWhile calculating financial support for proposals increases the chances of receiv-ing the desired funding, or of stopping a proposal before it is defeated, making the calculations can become very involved, especially for larger projects. One of the

r a d i o l o g y m a n a g e m e n t m a r c h / a p r i l 2 0 1 7 15
best ways to use the numbers, especially if they don’t come naturally or if they seem unintuitive is to create a financial template. A financial template is a form or worksheet that automatically per-forms a set of calculations. These forms, typically created in Microsoft Excel© or Google Sheets™, allow the manager or supervisor to create the process once, and then use the form for multiple proj-ects or discussions. A carefully designed template can work for years with only minor updates for most departments. This is an especially important feature if templates aren’t your specialty and you have no desire to really learn how to create them. It is possible to hire an accountant or bookkeeper as a consul-tant (or ask for help from the organiza-tion’s accounting department) to create the template, then use the template for several projects without the need to work with accountants each time templates are required. Although accountants are typically nice people who want to help, they are also very busy with other reports and forms, so the more a decision maker can do on his or her own the faster the process can move forward and the more he will impress the executive team with a knowledge of financial matters.
ConclusionThe typical imaging administrator’s career progression has often been one of default. They learn on the job in a reactive method rather than a pro-active fashion.1 The first major prov-ing ground for a new administrator, especially in the high budget areas of imaging departments and surgery, is a capital expenditure proposal. The ability to speak the language in both numbers and description of need will help move requests forward. Imaging adminis-trators are promoted because of their successes as technologists in the highly technical clinical aspects of imaging, and in respect to their years of experience. To achieve effective results, managers need
to acquire skills (conception/creative, leadership, interpersonal, administra-tive, and technical) before they attempt to apply the skills to the work situation.2 New and seasoned administrators with a clinical background have the intuitive knowledge for service line expansion, capital expenditures, technology, and education investments but often lack the ability to convey this intimate knowl-edge of the field. Pairing those skills with accounting will help to complete the pic-ture of the community, patient, staff, and system needs in respect to positive out-comes for patients.
Managers in the radiological sciences promoted in this manner must develop supervisory skills while simultaneously acquiring the new specific skills neces-sary for the operation of the department.3 Decisions driven by accounting are usu-ally a secondary skill developed once in positions of leadership and remain mis-understood. Business acumen and cost accounting are skill sets that many clini-cally promoted managers do not fully understand and often fear. These tools can help seasoned administrators climb into the C-suite. Most importantly, the incorporation of simple accounting tech-niques, as described in this series, can improve management decisions through quantification, comparison, justification, and sustainability in a credible fashion and in the most efficient manner for all stakeholders.
References1Moran P, Duffield C, Beutel J, Bunt S,
Thornton A, Wills J, Franks H. Nurse managers in Australia: Mentoring, lead-ership and career progression. Canadian Journal of Nursing Leadership. 2002;15(2): 14–20.
2Lin LM, Wu JH, Huang IC, Tseng KH, & Lawler JJ. (). Management development: A study of nurse managerial activities and skills. Journal of Healthcare Management. 2007;52(3):156–169
3South-Winter CA. Education and career pro-gression of imaging administrators. Radiol Manage. 2014;36(1):46–49
Carole South-Winter EdD, CNMT, RT, FAEIRS is an assistant professor of Health Services Administration in the Beacom School of Business at the University of South Dakota. She served for 13 years as program director of one of the largest nuclear medicine technology programs in the United States, as the interim Director of Education for the AHRA, Executive Director for Reclaiming Youth International, and Director of a free standing radiation therapy center and continues to serve as annual meeting planner for AEIRS. Dr. South-Winter has been active with many societies and organizations dealing with administration, education, global health care and imaging sciences and continues to lecture and write at local, state, national, and international levels. She can be contacted at [email protected].
Jason Porter, PhD is an associate professor of accounting at the University of South Dakota. During the past eleven years, he has taught a variety of accounting courses and has received numerous teaching awards, including the Outstanding Accounting Faculty Award and the College of Business and Economics Teacher of the Year Award from the University of Idaho. His scholarship includes articles helping students and professionals better understand the accounting cycle and the budgeting process, ways to effectively assess student learning, methods to effectively perform budgeting and variance analysis, and examples for understanding and applying new accounting rules. Jason can be contacted at [email protected].

m a r c h / a p r i l 2 0 1 7 r a d i o l o g y m a n a g e m e n t16
Questions
Instructions: Choose the answer that is most correct. Note: Per a recent ARRT policy change, the number of post-test questions has been reduced from 20 to 8.
1. the net present value (nPV) method begins with what basic step?a. Summarizing the pros and cons of the projectb. Summarizing the cash information of the projectc. Summarizing the results of the other financial analyses
performedd. Making the time value adjustment
2. the PV equation in most spreadsheet programs requires all of the following information eXCePt:a. IRRb. Discount ratec. Number of years from start of projectd. One time amount paid or received during the year
3. What is the definition of the discount rate in a nPV calculation?a. The value from the IRR calculation of the projectb. The company’s IRR thresholdc. The rate at which an individual or organization believes
that money will change value over timed. None of the above is a definition of the NPV
4. A financial template is a form or worksheet that:a. Determines the payback periodb. Creates the payback schedule c. Automatically performs a set of calculationsd. Selects the rate of return
5. new and seasoned administrators with a clinical background have the intuitive knowledge for service line expansion, capital expenditures, technology, and education investments, but often lack: a. C-suite support for capital expendituresb. The ability to convey this intimate knowledge of the field c. Support staff to carry out requestd. The ability to predict long term expenses
6. What does a negative nPV mean?a. That the cash outflows for a project are higher than the
cash inflowsb. That the IRR and payback period of a project are not
acceptablec. That the project will not make cash flows to make it a
worthwhile investmentd. That the project will make the desired discount rate over
the life of the project
7. How can the nPV of a project be improved?a. By increasing the cash outflows every yearb. By decreasing the annual cash inflowsc. By reducing the life of the projectd. By reducing the initial cost of the project
8. the incorporation of simple accounting techniques can improve management decisions through: a. Quantificationb. Comparisonc. Justificationd. All of the above
Continuing Education
Accounting Basics Part 4: Net Present Value
Home-Study Test
1.0 Category A credit • Expiration date 4-30-20
Carefully read the following multiple choice questions and take the post-test at AHRA’s Online Institute (www.ahra.org/onlineinstitute)
The credit earned from the Quick CreditTM test accompanying this article may be applied to the
AHRA certified radiology administrator (CRA) fiscal management (FM) domain.

r a d i o l o g y m a n a g e m e n t m a r c h / a p r i l 2 0 1 7 17
For a long time, evacuated bottles have been the status quo for disposing of ace-tic and pleural fluid in radiology depart-ments like ours. I oversee imaging services for Tucson Medical Center (TMC), a 600-bed regional teaching hospital that’s part of the Mayo Care Clinic Network. Recently, two converging trends—cost and safety—drove us to seek an alterna-tive to evacuated bottles.
Our supply costs were regularly exceeding budget by up to 15% because of expensive evacuated bottles. We con-duct over 500 paracentesis procedures and 260 thoracentesis procedures annu-ally. For each procedure, the average cost for evacuated bottles and the fee to dispose of them was $107.10. That’s out-rageous, especially in our current envi-ronment of flat reimbursements.
The exchange of evacuated bottles—often up to five or six during a single procedure—posed the risk of spills and dropped bottles, which could expose staff to potentially infectious waste fluid. Not surprisingly, the handling of potentially infectious materials is now the second greatest concern among healthcare risk managers, according to Aon’s annual Health Care Workers Compensation Benchmark Report.1 In fact, one in 10 healthcare workers in the United States suffers a splash expo-sure or needle stick injury every year, according to one study.2
In addition to the concern for staff welfare, exposure brings with it two other concerns. First and foremost is patient safety, since some studies have found a link between staff and patient safety.
One study found hospitals with greater levels of employee injury are more likely to have nursing shortages, which can lead to poorer patient outcomes.3
Another concern is the cost of expo-sure: If a staff member is exposed to and contracts a serious bloodborne infection, TMC’s payout could reach a million dollars—for medications, follow-up lab-oratory testing, clinical evaluation, lost wages and disability payments.4
The Answer: A Self-Contained SolutionWe explored various options and found a safer, lower-cost alternative in an FDA-approved self-contained system that automates the collection, measurement, and disposal of waste fluids. It connects directly from the patient to our facility’s
plumbing system, so it eliminates the need for evacuated bottles and the haz-ards of handling potentially infectious waste fluid. See Figure 1.
Our infection control department, which was involved in our initial review of the new system, supported it because it eliminated the handling of waste fluid—both during the procedure and afterwards to transport bottles to the environmental services department for disposal. Our lead technologist was also involved in the initial review and sup-ported the system from a user stand-point, citing its user-friendly design and programmable safety features, such as preset volume and auto stop.
The cost savings was another major draw. We saw a return on investment in just nine months—making this one of
in the industry
By Dan Felix
An Alternative to Evacuated Bottles
Figure 1 • The New System Set Up

m a r c h / a p r i l 2 0 1 7 r a d i o l o g y m a n a g e m e n t18
2Karmon, S.L., Mehta, S.A., Brehm, A., Dzurenko, J., Phillips, M. (2013). Evalua-tion of bloodborne pathogen exposures at an urban hospital. Am J Infect Control. 41(2), 185–186. http://www.ajicjournal.org/article/S0196-6553(12)00272-6/fulltext
3William Charney and Joseph Shirmer, “Nursing Injury Rates and Negative Patient Outcomes: Connecting the Dots,” Workplace Health & Safety (formerly AAOHN Journal), November 2007, pp. 470–475. http://whs.sagepub.com/ content/55/11/470.abstract
4U.S. Occupational Safety & Health Adminis-tration. Occupational Exposure to Blood Borne Pathogens Course. Updated Nov. 11, 2015. https://ceufast.com/course/osha-occupational-exposure-to-blood-borne-pathogens/
Dan Felix is director of imaging services for Tucson Medical Center. He’s been in management positions with the center for the past 15 years and can be contacted at [email protected].
the easiest purchase requests I’ve ever had to make. Our medical supply cost per procedure dropped from $107.10 to $24.00. Installation costs for the direct-to-drain system can range from a few hundred dollars to a few thousand. Our installation costs were on the higher end because we chose to install the system in a high-dose radiation room, which is surrounded by lead bricks.
We installed the system in our dedi-cated ultrasound room and use it for roughly 80% of paracentesis and thora-centesis procedures. Most of the other procedures are portable; the patient can’t be moved so we have to do the procedure in the patient’s room.
Other benefits we realized with this new system include:
• Easy to use, so minimal training was required.
• Up to a 25% reduction in procedure time with high volume procedures, since there’s no delay to exchange bottles.
• Increased accuracy of extraction volume, which our radiologists appreciate.
• Greater focus on patients, since our technologists don’t have to watch and exchange bottles.
• Simple cleaning process, which takes less than five minutes between procedures.
As a leader at TMC, I feel it’s my responsibility to applaud technologies and techniques that reinforce our posi-ton as a leading community hospital. The system we implemented not only reduces costs and increases safety, it also dem-onstrates our commitment to offer our community the most advanced medical technologies.
References1Aon Risk Solutions. 2014 Health Care
Workers Compensation Barometer Report. Published December 2014. http://w w w. a on . c om / at t a c h m e nt s / r i s k -s e r v i c e s / 2 0 1 4 - Aon - He a l t h - C are -Barometer-report.pdf
in the industry

r a d i o l o g y m a n a g e m e n t m a r c h / a p r i l 2 0 1 7 19
Many leaders in the health-care industry have employees from all four generations under their span of con-trol. This is certainly true at Baylor Uni-versity Medical Center (BUMC), which is a 900 bed Level 1 Trauma Center in Dallas, TX. There is no single or “cookie cutter” approach to leadership. Known as the Veterans Generation, this group of employees is the most tenured of the four. The members of this group tend to be more traditional in their communi-cation and learning styles. They prefer more formal communication and class-room style learning based on instruction. This group values hard work before fun, and they are motivated by formal rec-ognition of getting a job done.13 As this group of workers retire and otherwise leave the industry there will be a signifi-cant gap in knowledge and experience that the younger generations will need to account for.
The Baby Boomers are a great group of individuals, and many of them got into healthcare because there will always be a need for it and it won’t ever go away. That is true; however, the cost of healthcare has changed and facilities need to adapt very quickly to ensure survival. The Baby Boomers have been the slowest genera-tion to adapt to the changes required. In part, this may be related to the significant
advances in technology over the last two decades, and what is commonly found as a constant among the group is that if they are producing a result, why do they need to do anything differently? Many of this generation at BUMC have only worked at this one facility, and they’ve seen it grow from a serviceable hospital to a nation-ally recognized level 1 trauma center and leading transplant center in the country.
The leaders at BUMC within this gen-erational group are more of a challenge. Many are of the mindset that if they meet their targets then everyone will be happy and leave them alone. In the cur-rent environment, it is important to have continuous improvement in all areas; and putting the right leaders in place is a key part to continuous improvement.
The generation X group of employees are hard workers, and willing to change; provided there is evidence based rea-soning behind it. Staff level employees understand that their roles are important to the greater organizational picture, and they don’t mind putting in extra time to accomplish the goal. They still crave a work life balance, so extra time is only on occasion and they enjoy the rewards of their efforts. Generation X employees are more technologically savvy than the Baby Boomers; however, most prefer to work alone to ensure the job gets done
• This is the first time in history to have four generations in the workforce at the same time. As the generations transi-tion and turnover, it is important to determine what makes the most recent generation “tick.” Generation Y is new, innovative, and likes to be social. That is a change from what has been tradition-ally taught in leadership courses.
• Mentorship has become a key factor in gaining trust and engagement from generation Y employees. While there are intrinsic and extrinsic factors that motivate all employees, generation Y has shown to be more intrinsically moti-vated than extrinsically.
• They value achievement and socializa-tion more than prior generations, and since trust is not automatic, a good mentoring program can bridge that gap. The literature review shows that strong, meaningful mentorship pro-grams are a great way to lead and moti-vate generation Y into the future as cur-rent employees and future leaders.
ExEcutivE Summary
By Curtis Bush, MBA, CRA, FACHE
Leading and Motivating Generation Y Employees
The credit earned from the Quick CreditTM test accompanying this article may be applied to the
human resource management (HR) domain.

Leading and Motivating Generation Y Employees
m a r c h / a p r i l 2 0 1 7 r a d i o l o g y m a n a g e m e n t20
correctly. They are less trusting of peers on tasks with a result structured focus. There is a strong desire for achievement, and they are more than willing to put in the work. Many of them like public recognition while others like personal congratulations instead. The leaders at BUMC in this generational group are very data and process driven. They have come into healthcare thinking the indus-try was protected from recession, yet have been heavily involved in its chang-ing landscape. These leaders are charis-matic and dynamic, yet sometimes have poor tolerance for teaching and coach-ing. They expect everyone to function at a highly competent level, and to do what is best for the organization and patient. This group is traditionally loyal, and pre-fers upward advancement in their cur-rent organization rather than relocating geography or changing organizations.
Generation Y is the most current entrants into the workforce, and have added new skills to their leaders’ style. They are a group of about 80 million people born around 1980, and began entering the work force around the late 1990s.1 They don’t fear change, and rather embrace it. It is nothing for them to work multiple jobs to see which one fits the best. The entitlement that they expect has taught their managers patience. Existing leadership and staff members from the older generations within the workforce are having difficulty accepting the two new-est generations, particularly generation Y. Logically thinking, it is most important to adapt and adjust to the newest generations since they will be in the workforce for the longest amount of time, and have the abil-ity for the biggest impact.1
As a leader in today’s environment, understanding the various generations in the workforce has become very impor-tant. As with most things over the last several years, leadership, how we lead, and how we mentor and coach new leaders has changed. There is a transi-tion occurring from having long term “do my job and go home” employees to employees who want upward mobility, and who want to truly make a difference
in their organizations and the world. Leaders in all industries are finding it challenging to lead all generations in the same direction. The Veterans were born before 1946, have a strong work ethic, and will always get the job done. The Baby Boomers were born between 1946 and 1964, and invented the 60 hour work week. They are very competitive and will often turn endings into beginnings. Gen X are people born between 1965 and 1979. This group is highly independent and were the “latch key kids;” they altered the philosophy of if it’s not broke don’t fix it, and demand a high competence in their leaders. Gen Y are highly entrepre-neurial and many had “real” jobs before graduating high school. They are highly connected, and truly view themselves as a part of the world. This group favors col-laboration and team work, and is by far the most accepting of diversity.2
Literature ReviewHerzberg’s two factor theory of motiva-tion states that there are extrinsic and intrinsic factors that drive motivation. The intrinsic factors are psychological in nature and result in the need to grow. The external factors are mainly societal needs and are a primary cause of job dissatisfaction.3 Some suggested moti-vational tactics for engaging and moti-vating generation Y employees include creating personable relationships with them, as they are very sociable, and having a friendly work environment is a positive for them. Providing access to team activities also helps engage them; it feeds their need for socialization, as well as offers team building and collabora-tion activities that can lead to produc-tive outcomes. Gen Y is very aware and engaged in society and philanthropy and green projects will engage them in the organization.4
Key characteristics of generation Y include that they are highly educated and fast learners, they are practical and dislike waste, they are very creative and innovative, and they are socially, cul-turally, and environmentally connected and aware. Researchers have identified that this group of employees are the least expensive to hire from a salary and benefits stand point which will lead to a reduction in overall operating costs.4
Some commonalities of generation Y employees are that they crave mentoring, frequently ask “why,” and are the most technologically savvy of the generations within the workforce. They likely have never had to get off the couch to turn a television channel, are ego centric result-ing from having dual income parents that provided an easy upbringing for them, and in turn created the entitlement that is widely associated with generation Y. As a leader, it is important to embrace this generation as an energetic, highly edu-cated, and compassionate group.1
Meaningful mentoring is a key tactic necessary for successful leadership and effective management of generation Y employees. Historically, managers have expected employees to learn tasks to per-form their jobs and deliver the expected results. Generation Y will question this tactic because they don’t trust authority. An effective and authentic mentoring program will gain trust of generation Y employees by giving them the associa-tion with authority that they crave, and likely never had from their parents as they worked long hours trying to get ahead.1 Authentic mentoring is to really try and pass on the knowledge acquired, and also the failures that resulted in that knowledge. The ability to tell a story and talk about the history or background of a situation is one way to engage generation Y employees in a trusting and effective learning environment.1 Along with being
There is a transition occurring from having long term “do my job and go home” employees to employees who want upward mobility, and who want to truly make a difference.

r a d i o l o g y m a n a g e m e n t m a r c h / a p r i l 2 0 1 7 21
respected at work, and receiving direct feedback on their performance, genera-tion Y employees want their work to be interesting and to feel that their job/role is important to the overall organization and betterment of society.5
ResearchWhat motivates generation Y has been reviewed over the last decade, although there has not been much research done in the areas of gender motivation for this generation. One study done showed a slight favorable trend for females to be motivated by improving their career stat-ure and males showed a slight propen-sity to be motivated by social growth.6 While fair pay is important to this group, money is not necessarily a motivator for them. To attract the best and the bright-est performers to join a company, it is important to have top performers par-ticipate in the interview and selection process. This new generation can be attracted and motivated by opportuni-ties for growth and development at a personal and professional level. Men-toring programs are excellent ways to advertise and invite participation for these opportunities.7
In a study performed on the impor-tant factors for motivation and happi-ness, generation Y ranked opportunity for advancement and free time as their top two happiness factors. Many of the survey participants felt that their cur-rent levels of free time and advancement opportunities were satisfactory. This study showed that generation Y ranked compensation as the highest motiva-tional factor and the lowest happiness factor, which shows that work/life bal-ance is important for generation Y in terms of motivation and happiness. This also can help explain why generation Y is very deliberate in scheduling learning activities to coincide with their life at the appropriate time for advancement.8
A few commonalities among genera-tion Y employees are their knowledge often exceeds their job title, they have grown up in a technological age where
immediate feedback is the norm not the exception, and they have no fear of change. Many of them expect to change jobs every two years, and there are some predictions that by age 38, a generation Y employee could have eleven different employers. This presents a new problem for employers who hope to retain their best talent, and continues to put a heavy focus on creating advancement opportu-nities for generation Y employees.9
Knowing what motivates employees is a key part of leadership, and while many researchers can agree that genera-tion Y has similar motivators like respect, fair pay, and interesting and meaningful work; it is not fair to group all of the generation into a cookie cutter category. Leadership still comes down to leading the employee and not the generation that they happen to be a part of. This is ulti-mately determined by situational leader-ship, and how you lead and motivate an employee depends on what that specific employee determines to be important for them.10
Another study performed via Face-book responses to empathy-based sto-ries showed that generation Y employees working in full time positions were far more intrinsically motivated than exter-nally motivated. The top things having motivational influence over this group were an interesting, variable, and flex-ible job along with having good relation-ships.11 A cultural based study conducted with over 200 participants in four coun-tries confirmed that it is absolutely nec-essary to take into consideration both generational and cultural differences when determining motivational factors for generation Y workers.12
ConclusionSince this is the first time in history that there are four generations in the work-force, it would make sense that a transi-tion of some nature would need to occur. The focus on diversity has increased in many organizations from both a cultural perspective as well as a generational per-spective. As we continue to adjust to the
best practices identified for leading and motivating generation Y employees, it is also important to realize where they are coming from. Generation X were the original “latch key” kids whose parents were busy working, and the parental relationship and guidance was not nec-essarily there. That is how generation X became very independent workers. However, it is also how the next gen-eration’s parents have overcompensated to create the defining characteristics of generation Y. These characteristics are primarily viewed upon as negative, and should not necessarily be looked at that way. The sense of entitlement, which has absolutely expanded my own diversification and tolerance, is primar-ily caused by their parents’ overcompen-sation of attention and reward system. They want to be social because they are so accustomed to being connected that independence doesn’t seem comfort-able. Technology has also made them much more aware of all of the good and the bad in the world, and for that, they truly want to make a difference for the betterment of society. Modifications in leadership styles have to be made from a director model only giving commands to perform tasks to achieve results to a participatory leader model. As a partici-patory leader, it is important to coach and provide meaningful mentoring to the current employees and future lead-ers of tomorrow.
References1Sommer K, Sopp T. Managing generation Y
[Entire issue]. HRMagazine. 2006;51(5). 2Telberg R. “Four Generations in the Work-
place: Who Are They? What Do They Want?” CPA Trendlines. Available at: http://cpatrendlines.com/2010/08/30/four-generations-in-the-workplace-who-are-they/. Accessed December 28, 2016.
3Essays, UK. Motivating the generation y in the workplace. March 23, 2015. Available at: http : / /w w w.ukess ays .com/essays/management/motivating-the-generation-y-in-the-workplace-management-essay.php. Accessed December 28, 2016.
4Bahoo T. Motivating and Rewarding Genera-tion Y Employees. Academia.edu. (n.d.).

Leading and Motivating Generation Y Employees
m a r c h / a p r i l 2 0 1 7 r a d i o l o g y m a n a g e m e n t22
Available at: http://www.academia.edu/3736192/MOTIVATING_AND_REWARDING_GENERATION_Y_EMPLOYEES. Accessed December 28, 2016.
5Wilson JL, Johnsen LE. Motivating your gen-eration x and y team members. The Asset. 2006;54(6):27–28.
6Burns DJ, Reid J, Toncar M, Anderson C, Wells C. The effect of gender on the motivation of members of generation y college students to volunteer. Journal of Nonprofit & Public Sector Marketing. 2008;19(1):99.
7Johnson K, Price T, Taylor P. Help me generate results from generation y staff. People Management. 2008;14(10):50.
8Bradford IN, Hester PT. Analysis of gen-eration y workforce motivation using
multiattribute utility theory. Defense AR Journal. 2011;18(1).
9Harrington D. Generation Y in the workplace [Entire issue]. The Estates Gazette. 2011.
10Carlson S. Managing gen-y: Supervising the person not the generation [Entire issue]. SuperVision. 2010;71(2).
11Kultalahti S, Liisa Viitalla R. Sufficient chal-lenges and a weekend ahead—Generation Y describing motivation at work. Journal of Organizational Change Management. 2014;27(4).
12Kubatova J, Kukelokova A. Cultural Differ-ences in the motivation of generation y knowledge workers. Human Affairs. 2014;24(4).
13Olson P, Brescher H. The Power of 4: The four generations: Who are they. Adayana. 2011
Curtis Bush, MBA, CRA, FACHE is the director of imaging services at Baylor University Medical Center in Dallas. He has a bachelor of science in nuclear medicine technology from the University of Wisconsin-LaCrosse, a master’s of science in management with a concentration in healthcare administration, and an MBA from Troy University. Curt can be contacted at [email protected].

r a d i o l o g y m a n a g e m e n t m a r c h / a p r i l 2 0 1 7 23
Questions
Instructions: Choose the answer that is most correct. Note: Per a recent ARRT policy change, the number of post-test questions has been reduced from 20 to 8.
1. What is the most tenured generation in the current work force?a. The Veteransb. Baby Boomersc. Generation Xd. Generation Y
2. What is not a characteristic of a generation Y member?a. Technologically saavyb. Like to be micro-managedc. Crave mentoringd. Ask “why”
3. A key tactic necessary for successful leadership of Generation Y employees is: a. Monetary incentivesb. Paid nap timesc. Free lunchesd. Meaningful mentoring
4. Common motivator(s) for generation Y employees include:a. Respectb. Fair payc. Meaningful workd. All of the above
5. Generation Y employees expect to change jobs every 2 years.a. Trueb. False
6. Based on the article, what years were the Baby Boomers born between?a. 1922–1946b. 1946–1964c. 1694–1979d. 1980–1999
7. Which group is the newest entrant into the work force?a. The Veteransb. Baby Boomersc. Generation Xd. Generation Y
8. Which Generation are called “latch key kids”?a. The Veteransb. Baby Boomersc. Generation Xd. Generation Y
Continuing Education
Leading and Motivating Generation Y Employees
Home-Study Test
1.0 Category A credit • Expiration date 4-30-20
Carefully read the following multiple choice questions and take the post-test at AHRA’s Online Institute (www.ahra.org/onlineinstitute)
The credit earned from the Quick CreditTM test accompanying this article may be applied to the
AHRA certified radiology administrator (CRA) human resource management (HR) domain.

r a d i o l o g y m a n a g e m e n t m a r c h / a p r i l 2 0 1 7 25
workforce planning
My article in the Sep/Oct 2015 issue of Radiology Management described the ways in which my department has been trying to improve the patient experience. At the end of the piece I wrote about our initiation of a value-based customer service program. Now that we have been imple-menting this strategy for a little over a year I am convinced that we are absolutely on the right track. Let me explain why.
I’m sure you are as frustrated as I am with the general level of customer service provided in this country. Like many busi-nesses, we attempt to train people in this area with decidedly mixed results. As I related in my previous column (Jan/Feb 2017) it was a trip to Europe that demon-strated to me the origin of the problem.
We were in a restaurant in Lisbon, Portugal located in a narrow alleyway on a spectacularly beautiful summer eve-ning. The place was packed with people. One waiter was running around trying to serve all of the guests. I, unfortunately, needed some assistance and I did not want to interrupt this extremely busy person. I waved him over and immedi-ately apologized. I said, “I’m sorry but I need some help with my food.” The gen-tleman responded without hesitation and asserted confidently, “Please don’t apolo-gize to me. We are all human. I may need your help one day.”
It was then that I got it. It hit me that, in America, we try and teach customer service, but in Europe they practice it as a value. For example, we instruct our peers that they should treat people the way they would want to be treated. But in reality
Value-Based Customer Service RevisitedBy Mark Lerner
our patients are not us. Or we might offer that staff should take care of patients as if they are their mothers, when in fact that’s not who they are as individuals. Finally, we assert that we should provide a high level of attentiveness because this is the right thing to do, which is true, but this statement is not instructive in delineat-ing exactly the behaviors to be exhibited.
When I returned from vacation I explained my experience in Lisbon to my management team and I asked them to delineate the values that we should emphasize in our department. They decided upon dignity, kindness, com-passion, respect, patience, and fun. We concluded that we would encourage our employees to demonstrate these ideals not simply because we want to improve customer service, but ultimately because our aim is to improve the Washington, DC community. We became convinced that if we illustrated these traits we would have them reflected back from the indi-viduals with whom we interacted.
The success of our value-based cus-tomer service program has greatly exceeded my expectations. I have wit-nessed our service excellence improve and we have also raised the level of patient safety. We even announce to our clientele that we are value-based by greeting them with The Promise. We tell them upfront that we are going to take excellent care of them today, which is a statement packed with the value proposi-tions we are promoting.
All of this is exciting, but I want to want to let you in on the best part. As
many of my readers know I have a strong interest in improving public educa-tion, specifically through the growth of charter schools. This past summer I had the fantastic opportunity of visiting the Denver School of Science and Technol-ogy (DSST), a middle and high school in Denver, Colorado. This particular char-ter specializes in teaching children living in poverty and it has for years been taking pupils who are two or more years behind grade level and closing the achievement gap. This is a feat that almost all educa-tional institutions have found impossible to reach. When we met with the found-ing CEO of DSST he started his presen-tation not by talking about test scores or curriculum but by showing us the values that his teachers are trying to instill in their scholars. They are respect, respon-sibility, courage, curiosity, integrity, and doing your best.
The similarities between the group of values identified by this school and our radiology department are striking. We even share the first one on the list which is respect. My strong assertion is that if an emphasis on values is good enough for DSST to record standardized test scores that are the same for wealthy and poor kids, then they are good enough for us to use to raise the bar on service excellence. Now we talk about our value-based customer service program each and every day.
Mark Lerner is the director of diagnostic imaging at the George Washington University Hospital. He can be reached at [email protected].
25


r a d i o l o g y m a n a g e m e n t m a r c h / a p r i l 2 0 1 7 27
Medical imaging is one of the most important departments in the hospital which supports diagnosis and treatment of patients. In healthcare, this department has high potential for adverse patient safety events, so its consideration is essential.1 Patient safety means lack of harm resulting from providing health services and is con-sidered one of the most important aspects of quality of care.2,3 Medical errors are one of the most common causes of death in the world. WHO has estimated that millions of patients are victimized by injuries and deaths due to unsafe medical practice.4
Errors in medical imaging can be classified into two categories: latent fail-ures and active failures. Latent failures are related to technical, system-related, and reporting defects (including defec-tive documentation, incorrect or incom-plete information, and communication loop failure). Active failures are human failures, patient-based failures, and exter-nal failures. Poor communication and human errors are at the heart of medical errors, as illustrated in Figure 1.5
The impact of an error includes legal, social, and economic effects on both the patient and the system.6 Different stud-ies have shown that medical errors and adverse events are one of the biggest problems in the US, and the Institute of Medicine estimated that about 44,000
to 98,000 Americans die due to medical errors every year.7 Also, several studies in different countries such as Australia show that 2.5–16.6% of hospital admis-sions suffer from adverse events.8,9
Clinical adverse impacts can be cat-egorized as a spectrum ranging from near-miss events to sentinel events. A near-miss event is defined as an event characterized by detection and correc-tion of an error before harm reaches the patient, and a sentinel event is “an unexpected occurrence involving death or serious physical or psychological injury, or the risk thereof.”10,11 Seri-ous injury specifically includes loss of limb or function. The phrase “or the risk thereof ” includes any process variation for which a recurrence would carry a significant chance of a seri-ous adverse outcome. Such events are called “sentinel” because they signal the need for immediate investigation and response.12,13 Some of these events in medical imaging departments include accidental harms, delay in treatment, accidents caused by equipment, falling, inappropriate inspection, IV events, medication errors, oxygen events, and events related to patient identifica-tion and other cases.14 On the other side, economic adverse events impose high costs on patients and healthcare
Mahtab Karami, PhD and Nasrin Hafizi
Enhancing Patient Safety Using Medical Imaging Informatics
• A set of performance indicators and metrics related to patient safety that classifies and measures mistakes can prevent errors in medical imaging. The potential of harm in this department is high since it is a complicated environ-ment in terms of diversity of services, patient mix, personnel, equipment, tech-nology, and information.
• In such an environment, it is necessary to define a framework to identify safety inci-dents, analyze them, provide solutions for preventing them, and give feedback on the results. Using medical imaging informatics can be effective in monitor-ing these indicators.
• Benefits such as reducing radiation expo-sure and reducing medication errors and adverse effects can be achieved. It can also promote knowledge through acces-sibility of resources and useful informa-tion in order to optimize decision making.
ExEcutivE Summary

Enhancing Patient Safety Using Medical Imaging Informatics
m a r c h / a p r i l 2 0 1 7 r a d i o l o g y m a n a g e m e n t28
organizations, in such a way that the yearly expense of predictable medical errors in the US is estimated at about $17–29 million.3 Rendering healthcare services is not without risk. Medical errors or safety events for patients can happen anywhere and at any time, but it is believed that 50% of these adverse events are predictable.15,16
Patient Safety Indicators To prevent errors from occurring, there is a need for a set of performance indica-tors and metrics related to patient safety for classifying and measuring mistakes. Each indicator plays an essential role in ensuring a safe practice. Based on research conducted, 26 patient safety performance metrics were extracted (Table 1).5,14,17-23
A serious challenge in implementing quality improvement plans for medical imaging is related to an exact definition of quality.24 In order to improve the safety in imaging departments, it is necessary to define its indicators (Table 2).12,21,25,26
Patient safety in an imaging depart-ment is affected by a number of indica-tors, all of which are linked directly or indirectly like puzzle pieces (Figure 2). Monitoring safety indicators minimizes the occurrence of errors and the degree
of their resulting harm. Medical imag-ing is a complicated environment in terms of diversity of services, patients, personnel, equipment, technology, data, and information generated.18 In order to improve patient safety a framework is needed to identify safety events, ana-lyze them, prepare a solution, and give
feedback on the result.27 In this regard, using informatics can be effective.
Medical Imaging Informatics and Patient SafetyMedical errors and patient safety inci-dents mostly occur due to system or pro-cess related failures. Patient safety and quality of care can be promoted by imple-menting error detective information.8 The Joint Commission has also emphasized that all healthcare organizations develop a comprehensive system for detecting, classifying, and managing errors. A sys-tem is able to analyze all of the incidents, detect opportunities for minimizing error occurrence, and provide feedback on the results.28 Therefore, some informatics tools shown in Table 3 can have a pro-found impact on the quality of all imaging activities.8,14,17,18,24,25,29-49
As shown in Table 3, generally medi-cal imaging informatics can assist in improving patient safety by reducing medication errors and adverse effects and compliance with evidence-based
Defects in reporting cycle
Sentinelevents andnear-miss
events
Incorrect information
Incorrect Documentation
Incomplete information
Behavioral defects
Humansdefects
Externaldefects
Patientdefects
Technicaldefects
SystemfailuresLatent factors
Radiology practiceerrors
Active factors
Reportingdefects
Inadequate planning
Defects in the performance of duties
Infection
Radiation
Universal
Critical resultsreporting
Patient falls
Image labeling
Critical incidents
Standardizedprotocol
Specimenlabeling
protocolMedicationreconciliation
Proceduralcomplications
Hand hygiene Critical testreporting
implementation
Figure 1 • Reasons Related to Errors in the Medical Imaging Department
Figure 2 • Patient Safety Indicators

r a d i o l o g y m a n a g e m e n t m a r c h / a p r i l 2 0 1 7 29
taBLE 1. Key Performance Indicators and Metrics Related to Patient Safety in Medical Imaging
Patient Safety indicators metrics
researcher
Karam
i
Kruskal
John
son
Swen
sen
thornton
ab
ujudeh
Schultz
Brook
Stevnes
Steph
en
2016
2012
2011
2005
2011
2010
2011
2010
2007
2005
Universal protocol implementation
Patient identification error rate ü ü ü ü ü ü ü
Site identification error rate ü ü ü ü ü ü ü
Side identification error rate ü ü ü ü ü ü ü
Procedure selection error rate ü ü ü ü ü ü ü
Specimen labeling Specimen labeling error rate ü ü ü ü
Medication reconciliation
Medication error rate ü ü ü
Medication allergy rate ü ü ü
Adverse drug reactions rate ü ü ü
Critical incidents
Failure rate of electronic information transfer rate ü ü ü ü ü
Order entry error rate ü ü ü ü ü
Hazard related to environment rate ü ü ü ü ü
Hazard related to equipment rate ü ü ü ü ü
Procedural complications
Intravenous extravasations rate ü ü ü ü ü ü ü ü
Radiologic-induced pneumothorax rate ü ü ü ü ü ü ü ü
Skin Impairment rate ü ü ü ü ü ü ü ü
Post-procedure hematomas rate ü ü ü ü ü ü ü ü
Contrast-media reactions rate ü ü ü ü ü ü ü ü
Contrast material-induced nephropathy rate ü ü ü ü ü ü ü ü
Standard protocol Protocol selection error rate ü ü ü ü
Reduction of patient falls with harm
Patient falls with harm rate ü ü ü ü ü
Radiation Improper dose rate ü ü ü ü ü ü
Images labeling Images labeling error rate ü ü ü ü ü
Hand hygieneNon-compliance with hand hygiene requirements ü ü ü
Prevention of infection Radiologic-induced infection rate ü ü ü ü
Critical test reporting Critical test reporting rate ü ü ü ü ü
Critical results reporting Critical results reporting rate ü ü ü ü ü

Enhancing Patient Safety Using Medical Imaging Informatics
m a r c h / a p r i l 2 0 1 7 r a d i o l o g y m a n a g e m e n t30
taBLE 2. Calculation of KPIs and Metrics
row Safety indicators Description calculation
Numerator Denominator
1 Patient identification error rate
Any errors related to patient identification
No. of incorrect patient identifications
Total no. of patient
2 Site identification error rate Any errors in determining the position of the patient for imaging procedures
No. of incorrect site iden-tification
Total no. of patient
3 Side identification error rate Incorrect labeling of right and left sides rate
No. of markers placed incorrectly
Total no. of procedures
4 Procedure selection error rate
Incorrect actions in imaging procedures
No. of incorrect procedure Total no. of procedures
5 Specimen labeling error rate
Incorrect labeling on Specimen No. of incorrectly labeled specimens
Total no. of specimens
6 Medication error rate Incorrect drug as a contrast agent in imaging procedures
No. of medication errors in procedures
Total no. procedures (with contrast)
7 Medication allergy rate Creating reaction in patients caused by incorrect drug use as a contrast agent in imaging procedures
No. of drug allergy in patients
Total no. procedures (with contrast)
8 Adverse drug reactions rate Creating adverse drug reactions caused by imaging procedures as a contrast agent injected dose or taking the medication that causes complications (such as kidney problems, gastrointes-tinal, skin, etc.) to the patient
No. of adverse drug reac-tions in patients
Total no. procedures (with contrast)
9 Failure rate of electronic information transfer rate
Incorrect electronic transmission of data related to imaging (or wrong image, the wrong records data sent to the wrong person, etc)
No. of errors in the elec-tronic transmission of data
Total. of transferring electronic data
10 Order entry error rate Incorrect data in the doctor’s prescriptions, including (misdiagnosis, improper treat-ment, incorrect actions, etc)
No. of error in physician order
Total prescriptions for imaging procedures
11 Hazard related to environ-ment rate
Risks and events created in the image caused by environmental factors
No. of risks caused by imaging environment
Total. of risks in imaging department
12 Hazard related to equip-ment rate
Risks and events created in the image caused by technical factors such as equipment, systems, networks, etc
No. of risks caused by imaging equipment
Total. of risks in imaging department
13 Intravenous extravasations rate
Ruptured vein in patients that caused by imaging procedures
No. of patients with rup-ture of veins that caused in procedures using con-trast agent
Total no. procedures (with contrast)
14 Radiologic-induced pneu-mothorax rate
Pneumothorax (lung problems) in patients that caused by imaging procedures
No. of patients with pneu-mothorax caused by imag-ing procedures
Total no. of procedures(with contrast)

r a d i o l o g y m a n a g e m e n t m a r c h / a p r i l 2 0 1 7 31
taBLE 2. Continued
Row Safety indicators Description Calculation
Numerator Denominator
15 Skin Impairment rate Damage to skin of the patient in imaging procedures
No. of patients with skin damage caused in imag-ing procedures
Total no. of procedures(with contrast)
16 Post-procedure hematomas rate
Hematoma (bleeding) of the patient that caused by imaging procedures
No. of patients with hema-toma caused by imaging procedures
Total no. of procedures(with contrast)
17 Contrast- medications reac-tions rate
Reactions of the patient (gas-trointestinal, neurological, skin, etc.) in procedures that use with oral (PO) or injective (IV) medi-cations
No. of patients with Contrast- medications reactions caused by using injective (IV) or oral (PO) contrast agent
Total no. procedures (with contrast)
18 Contrast material-induced nephropathy rate
Neuropathy (kidney disease) in patients due to use of the contrast agent in imaging pro-cedures
No. of patients with nephropathy caused by using injective(IV) or oral (PO) contrast agent
Total no. procedures (with contrast)
19 Protocol selection error rate Incorrect protocols selected in imaging procedures
No. of incorrect protocol Total no. of procedures
20 Patient falls with harm rate Falls with injury was defined as any type of injury that was doc-umented by the caring nurse.
No. of falls with injury Total no. of patient
21 Improper dose rate Use of inappropriate radiation doses in imaging procedures
No. of inappropriate radia-tion dose in imaging pro-cedures at a time
Total no. of radiation dose in imaging proce-dures at a time
22 Image labeling error rate Incorrect labels placed on images
No. of incorrectly labeled image
Total no. of image
23 Hand hygiene Surveys were given to selected patients to indicate whether they observed hand hygiene performed by their caregivers before and after their procedure (Two separate questions).
No. of patient survey forms returned indicating observation of caregiver hand hygiene
Total no. of hand hygiene surveys returned
24 Radiology-generated infec-tions rate
Blood infection caused by imag-ing procedures
No. of patient positive blood cultures attribut-able to a imaging procedure
Total no. of imaging pro-cedures resulting in tube insertion or placement
25 Critical test reporting rate Are defined at each institution (e.g., “stroke alert” with CT exam-ination of the head) and require the radiologist to give the pro-vider a telephone or face-to-face report of the results.
No. of examination reports with documentation of telephone call within 60 min of order
Total no. of critical test examinations
26 Critical results reporting rate
Are defined at each institution and refer to findings that require urgent patient care
No. of critical examination reports with documenta-tionof critical result calls
Total no. of examinations with critical results
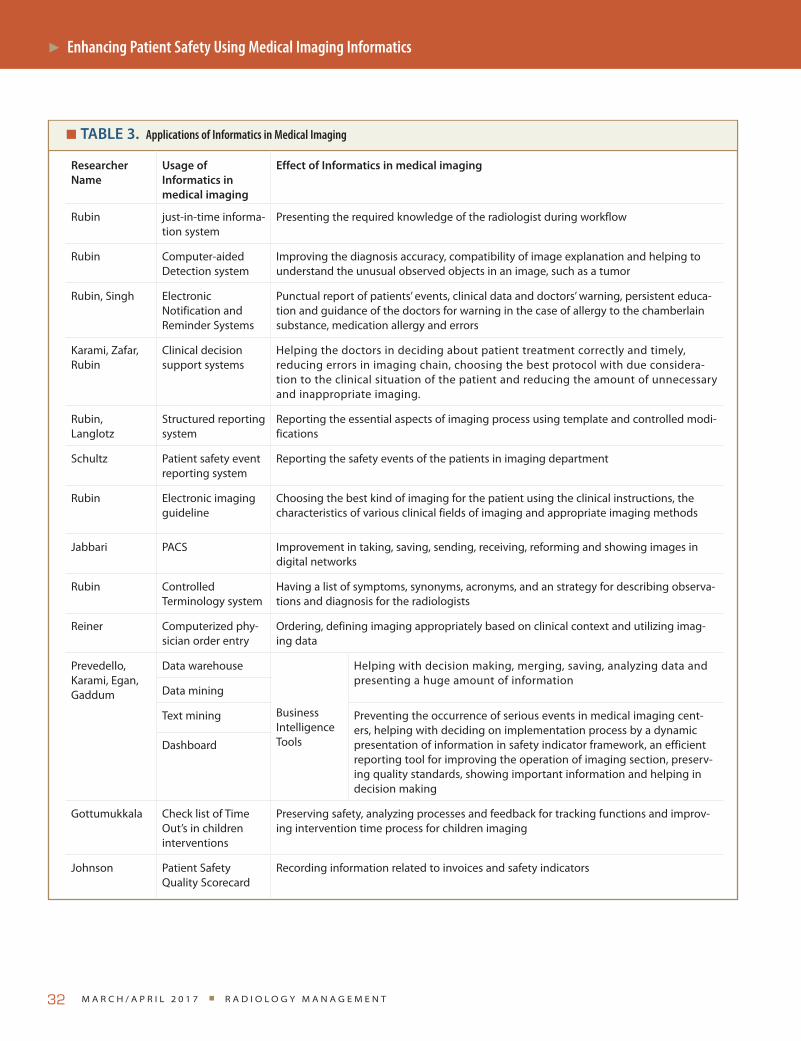
Enhancing Patient Safety Using Medical Imaging Informatics
m a r c h / a p r i l 2 0 1 7 r a d i o l o g y m a n a g e m e n t32
taBLE 3. Applications of Informatics in Medical Imaging
researcher Name
usage of informatics in medical imaging
Effect of informatics in medical imaging
Rubin just-in-time informa-tion system
Presenting the required knowledge of the radiologist during workflow
Rubin Computer-aided Detection system
Improving the diagnosis accuracy, compatibility of image explanation and helping to understand the unusual observed objects in an image, such as a tumor
Rubin, Singh Electronic Notification and Reminder Systems
Punctual report of patients’ events, clinical data and doctors’ warning, persistent educa-tion and guidance of the doctors for warning in the case of allergy to the chamberlain substance, medication allergy and errors
Karami, Zafar, Rubin
Clinical decision support systems
Helping the doctors in deciding about patient treatment correctly and timely, reducing errors in imaging chain, choosing the best protocol with due considera-tion to the clinical situation of the patient and reducing the amount of unnecessary and inappropriate imaging.
Rubin,Langlotz
Structured reporting system
Reporting the essential aspects of imaging process using template and controlled modi-fications
Schultz Patient safety event reporting system
Reporting the safety events of the patients in imaging department
Rubin Electronic imaging guideline
Choosing the best kind of imaging for the patient using the clinical instructions, the characteristics of various clinical fields of imaging and appropriate imaging methods
Jabbari PACS Improvement in taking, saving, sending, receiving, reforming and showing images in digital networks
Rubin Controlled Terminology system
Having a list of symptoms, synonyms, acronyms, and an strategy for describing observa-tions and diagnosis for the radiologists
Reiner Computerized phy-sician order entry
Ordering, defining imaging appropriately based on clinical context and utilizing imag-ing data
Prevedello,Karami, Egan, Gaddum
Data warehouse
Business Intelligence Tools
Helping with decision making, merging, saving, analyzing data and presenting a huge amount of information
Data mining
Text mining Preventing the occurrence of serious events in medical imaging cent-ers, helping with deciding on implementation process by a dynamic presentation of information in safety indicator framework, an efficient reporting tool for improving the operation of imaging section, preserv-ing quality standards, showing important information and helping in decision making
Dashboard
Gottumukkala Check list of Time Out’s in children interventions
Preserving safety, analyzing processes and feedback for tracking functions and improv-ing intervention time process for children imaging
Johnson Patient Safety Quality Scorecard
Recording information related to invoices and safety indicators

r a d i o l o g y m a n a g e m e n t m a r c h / a p r i l 2 0 1 7 33
taBLE 4. Usage of Informatics
medical imaging chain Patient Safety indicators usage of informatics in medical imaging
Stag
e1 Ordering study -Standard protocol-Critical incidents(Order entry error)-Universal protocol Implementation
-Computerized physician order entry-Business Intelligence Tools-Clinical decision support systems-Electronic Notification and Reminder Systems-just-in-time information system
Stag
e2
Imaging practice
-Prevention of infection-Hand hygiene-Radiation - Critical incidents(Hazard related to -environment- Hazard related to equipment)
-Image labeling-Medication reconciliation -Procedural complications-Patient falls with harm -Universal protocol Implementation-Standard protocol
- Electronic Notification and Reminder Systems
-Business Intelligence Tools- Electronic imaging guidelines and Controlled Terminology system
-Clinical decision support systems-Computer-aided Detection system-just-in-time information system
Stag
e3
Communicating results
-Critical test reporting -Critical results reporting - Critical incidents(Failure rate of elec-tronic information transfer)
-picture archiving and communication system-Structured reporting system -Business Intelligence Tools-Electronic Notification and Reminder Systems-Clinical decision support systems-Computer-aided Detection system-just-in-time information system
taBLE 3. Continued
researcher Name
usage of informatics in medical imaging
Effect of informatics in medical imaging
Rubio, Corso, Time-Out Systems In Radiology
Time-Out Systems as a tool to enhance patient safety and Decreasing Incidence of Wrong-Patient in radiology
Boos, Kim Dose monitor-ing Systems In Radiology
Systematic monitoring and analysis of dose related data from radiological examinations is mandatory for the reduction of patient radiation exposure
Al Salman, McGuckin
Electronic hand hygiene monitoring system
Ensuring patient safety, promoting and improving hand hygiene compliance in hospitals
Yam Radiology report Allowing users to automate the case-tracking process for either clinical follow-up or teaching purposes. With this system, radiologists can initiate the tracking of a case by dictating a keyword into the report

Enhancing Patient Safety Using Medical Imaging Informatics
m a r c h / a p r i l 2 0 1 7 r a d i o l o g y m a n a g e m e n t34
clinical guidelines, decreasing repetition of examinations in order to minimize exposure to radiation, and promoting knowledge through the accessibility of resources and useful information to opti-mize decision making.31,33,38,50,51
Table 4 illustrates an interlinked series of events that occur from the time an examination is ordered until the results of the examination are communicated to the ordering provider.8,14,17,18,24,25,29-43 At each stage of the process, numerous safe-guards, defenses, and barriers in terms of safety indicators or procedure time-outs must be implemented to prevent an error from occurring and to reduce its impact. Such medical informatics tools can be applied to monitor these indicators. In the process of ordering an examination, it can cause correct and appropriate choice of a radiology examination with access to the important clinical and pictorial data in workstations. It can also have some benefits during an examination, such as preventing the occurrence of adverse effects and critical events, determin-ing appropriateness, and choosing the best imaging procedure or protocol for patients in order to minimize unneces-sary radiation exposure.
Finally, during the process of com-municating results, it leads to reduc-ing errors, subtle interpretation of images, timely reports on critical radi-ology results, the possibility of sending and receiving information and images among systems and different workplaces, improving the quality of reports and the results of images, saving time and cost, and preventing harm to patients.50
ConclusionPatient safety in any department is not a goal, it is a responsibility. And imaging informatics tools can aid in achieving it. Besides applying these tools toward promoting patient safety, they have some other benefits such as saving time, decreasing costs, facilitating interactions of providers, and saving a large number of information and images. The essential
factors for the implementation of medi-cal imaging informatics include supply-ing the required capital; determination and establishment of key rules in the development of informatics applications; the storage, publication and updating of information; ensuring security and reli-ability of data; creating a software and hardware infrastructure; establishing an evaluation framework to measure the success of informatics applications; and training users with the required IT skills. The rate of compliance of the informatics applications should be embedded with the goals of the medical imaging depart-ment, and an appropriate mindset both at the level of individuals and the organi-zation needs to be created.
References1J. G. Mistake-proofing the design of health care
processes. US Department of Health and Human Services: Agency for Healthcare Research and Quality Website. ahrq.gov/qual/mistakeproof/mistakeproofing.pdf. Published May 2007; 2011.
2Wachter RM. Understanding Patient Safety. ed s, editor. New York: Mc Graw Hil; 2008.
3Kohn LT, Corrigan JM, Donaldson MS. To Err Is Human: Building a Safer Health System. Washington, D.C.: National Academy Press; 2000.
4WHO. Call for more research on patient safety 2007. Available from: http://www.who.int/mediacentre/news/releases/2007/pr52/en/index.html.
5Brook OR, O’Connell AM, Thornton E, Eisenberg RL, Mendiratta-Lala M, Kruskal JB. Quality initiatives: anatomy and patho-physiology of errors occurring in clinical radiology practice. Radiographics. 2010; 30(5):1401–10.
6Stewart RM, Corneille MG, Johnston J, al. e. Transparent and open discussion of errors does not increase malpractice risk in trauma patients. Ann Surg. 2006;243(5):645–9.
7Institute of Medicine. Committee on Quality of Health Care in America To err is Human: Building a Safer Health System. National Academy Press, Washington, DC; 2000.
8Sheikhtaheri A, Sadoughi F, Ahmadi M, Moghaddasi H. A Framework Of A Patient Safety Information System For Iranian Hospitals: Lessons Learned From Australia,
England And The Us. Interna tional Jour-nal Of Medical Informatics. 2013;82(5): 335–44.
9Brennan TA, Leape LL, Laird NM, Hebert L, Localio AR, Lawthers AG, et al. Incidence of adverse events and negli-gence in hospitalized patients: results of the Harvard Medical Practice Study I. 1991. Qual Saf Health Care. 2004;13(2): 145–51; discussion 51–2.
10Institute for Safe Medication Practices. ISMP survey helps define near miss and close call. Institute for Safe Medication Practices Website. www.ismp.org/newsletters/acutecare/articles/ 20090924.asp. Published September 24, 2009. Accessed June 21, 2010.
11encourages HMGcp, errors. rn-mm, www.healthleadersmedia. HMW, com/content/QUA-248568/Good-, Catch-Program-Encourages-Reporting-NearMiss-, Medical-Errors##. Published March 25, et al.
12Balter S, Miller DL. The new Joint Commis-sion sentinel event pertaining to prolonged fluoroscopy. J Am Coll Radiol. 2007;4(7): 497–500.
13Joint Commission. Sentinel events. 2006; (Available at: http://www.jointcommis-sion.org/NR/rdonlyres/690008C7-EAB2-4 2 7 5 - B C 7 B - 6 8 B 3 7 4 8 1 D 6 5 8 / 0 /SE_Chap_Sept06.pdf. Accessed October 6, 2006.).
14Schultz SR, Watson RE, Jr., Prescott SL, Krecke KN, Aakre KT, Islam MN, et al. Patient safety event reporting in a large radiology department. AJR Am J Roent-genol. 2011;197(3):684–8.
15Leong P, Afrow J, Weber HP, Howell H. Atti-tudes toward patient safety standards in US dental schools: a pilot study. J Dent Educ. 2008;72(4):431–7.
16Zwart DL, Langelaan M, van de Vooren RC, Kuyvenhoven MM, Kalkman CJ, Verheij TJ, et al. Patient safety culture measure-ment in general practice. Clinimetric properties of ’SCOPE’. BMC Fam Pract. 2011;12(117):1–7.
17Johnson CD, Krecke KN, Miranda R, Roberts CC, Denham C. Quality initia-tives: developing a radiology quality and safety program: a primer. Radiographics. 2009;29(4):951–9.
18Karami M, Safdari R, From Information Management to Information Visualization: Development of Radiology Dashboards. Applied Clinical Informatics.2016;7(2): 308–29.

r a d i o l o g y m a n a g e m e n t m a r c h / a p r i l 2 0 1 7 35
19Abujudeh H, Kaewlai R, Shah B, Thrall J. Characteristics of falls in a large academic radiology department: occurrence, associ-ated factors, outcomes, and quality improvement strategies. AJR Am J Roent-genol. 2011;197(1):154–9.
20Kruskal JB, Anderson S, Yam CS, Sosna J. Strategies for establishing a comprehensive quality and performance improvement program in a radiology department. Radiographics. 2009;29(2):315–29.
21Stephen B, Donald M. The New Joint Commission Sentinel Event Pertaining to Prolonged Fluloroscopy. Medical Physics Consult. 2006;3(3):497.
22Stevens A. Establishing Quality Indicators for Medical Imaging and the Basic Quality Management Toolbox 2007 [cited 2013]. Available from: http://www.e-radimaging.com/site/article.cfm?ID=277.
23Swensen SJ, Johnson CD. Radiologic quality and safety: mapping value into radiology. J Am Coll Radiol. 2005;2(12):992–1000.
24Rubin DL. Informatics in radiology: Measur-ing and improving quality in radiology: meeting the challenge with informatics. Radiographics. 2011;31(6):1511–27.
25Johnson CD, Miranda R, Osborn HH, Miller JM, Prescott SL, Aakre KT, et al. Designing a safer radiology department. AJR Am J Roentgenol. 2012;198(2):398–404.
26Thornton RH, Miransky J, Killen AR, Solo-mon SB, Brody LA. Analysis and prioriti-zation of near-miss adverse events in a radiology department. AJR Am J Roent-genol. 2011;196(5):1120–4.
27Sadoughi F, Ahmadi M, Moghaddasi H, Sheikhtaheri A. Patient Safety Information System: Purpose, Structure and Functions. Medical Sciences Journal Of Mazandaran University 2011;21(85):174–88.
28Commission J. Accepted: new and revised hospital elements of performance related to CMS application process. Jt Comm Per-spect. 2009;29(10):16–9.
29Jabbari N, Afshar LH, Zeinali A, Feizi A, Johnson SAK. Problems and obstacles in implementation of Picture Archiving and Communication System (PACS) in Urmia Imam Khomeini Hospital. Official Organ Of The Society Of Iran Hospital Adminis-tration. 2011;4(11).
30Ravaghi H, Sajadi H. Identify Patient Safety Research Priorities In Iran. Hakim Research 2012;4(16):358–66.
31Zafar HM, Mills AM, Khorasani R, Langlotz CP. Clinical Decision Support For Imaging In The Era Of The Patient Protection And
Affordable Care Act. J Am Coll Radiol. 2012;9(12):907–18.
32Reiner B. Improving Upon The Inherent Deficiencies Of Radiology Reporting Through Data Mining. Journal Of Digital Imaging. 2012;23(2):109–18.
33Prevedello LM, Andriole KP, Hanson R, Kelly P, Khorasani R. Business intelligence tools for radiology: creating a prototype model using open-source tools. J Digit Imaging. 2008;23(2):133–41.
34Egan M. Clinical dashboards: impact on workflow, care quality, and patient safety. Crit Care Nurs Q. 2006;29(4):354–61.
35Gaddum A. business intelligence for health-care organizations 2010 [cited 2012]. Available from: http://www.ilink-systems.com/portals/0/ilink/pdf/BI_healthcare_organizations.pdf.
36Singh H, Arora HS, Vij MS, Rao R, Khan MM, Petersen LA. Communication Out-comes of Critical Imaging Results in a Computerized Notification System. J Am Med Inform Assoc. 2007 14(4):459–66.
37Langlotz CP. Structured Radiology Report-ing: Are We There Yet? Radiology. 2009; 253(1):23–5.
38Thornton E, Brook OR, Mendiratta-Lala M, Hallett DT, Kruskal JB. Application of failure mode and effect analysis in a radiol-ogy department. Radiographics. 2011; 31(1):281–93.
39Angle JF, Nemcek AA, Cohen AM, Miller DL, Grassi CJ, D’agostino HR, et al. Quality Improvement Guidelines for Preventing Wrong Site, Wrong Procedure, and Wrong Person Errors: Application of the Joint Commission “Universal Protocol for Preventing Wrong Site, Wrong Procedure, Wrong Person Surgery” to the Practice of Interventional Radiology. J Vasc Interv Radiol. 2008;19(3):1151–4.
40Gottumukkala R, Street M, Fitzpatrick M, Tatineny P, Duncan JR. Improving Team Per-formance During The Preprocedure Time-Out In Pediatric Interventional Radiology. The Joint Commission Journal On Quality And Patient Safety. 2012;38 (9):387–94.
41Magrabia F, Aartsb J, Nohrc C, Bakerd M, Harrisond S, Pelayoe S, et al. A compara-tive review of patient safety initiatives for national health information technology. International Journal for medical infor-matics. 2013;82(5):139–48.
42Kwoh CK, Li X, Zheng J, S.b. C. A Special Section on Computational Systems for Medical and Health Informatics. J Med Imaging Health Inf. 2015;5(5):1084–7.
43Al-Salman JM, Hani S, Marcellis-Warin N, Isa SF. Effectiveness of an electronic hand hygiene monitoring system on healthcare workers’ compliance to guidelines. J Infect Public Health. 2015;8(2):117–26.
44Corso R, Vacirca F, Patelli C, Leni D. Use of “Time-Out” checklist in interventional radiology procedures as a tool to enhance patient safety. Radiol Med. 2014 119(11): 828–34.
45Rubio EI, Hogan L. Time-Out: It’s Radiology’s Turn—Incidence of Wrong-Patient or Wrong-Study Errors. AJR Am J Roentgenol. 2015 205(5):941–6.
46Boos J, Meineke A, Bethge OT, Antoch G, Kröpil P. Dose Monitoring in Radiology Departments: Status Quo and Future Per-spectives. Rofo. 2016 188(5):443–50.
47kim j, Yoon Y, Seo D, Kwon S, Shim J, Kim J. Real-Time Patient Radiation Dose Moni-toring System Used in a Large University Hospital. J Digit Imaging. 2016:Epub ahead of print.
48McGuckin M, Govednik J. A Review of Elec-tronic Hand Hygiene Monitoring: Consid-erations for Hospital Management in Data Collection, Healthcare Worker Supervi-sion, and Patient Perception. Journal of Healthcare Management. 2015;60(5):348.
49Yam CS, Rofsky N, Kruskal J, Sitek A. Devel-opment of a radiology report monitoring system for case tracking. AJR Am J Roent-genol. 2005;187(1):343–6.
50Karami M. Clinical Decision Support Sys-tems and Medical Imaging 2015.
51Morin RL, Seibert JA, Boone JM. Radiation dose and safety: informatics standards and tools. J Am Coll Radiol. 2014 11(12):1286–97.
Mahtab Karami is a PhD of health information management at the Health Information Management Research Center (HIMRC), department of health information technology and management, school of allied-medical sciences, Kashan University of Medical Sciences in Kashan, Iran and can be contacted at [email protected].
Nasrin Hafizi, MSc (corresponding author) is a student in health information technology at the department of health information technology and management, school of allied-medical sciences, Kashan University of Medical Sciences in Kashan, Iran and can be contacted at [email protected].
AcknowledgementThis review study was performed as a part of a research plan supported by the Kashan University Medical Research Council (grant number: 9532).


r a d i o l o g y m a n a g e m e n t m a r c h / a p r i l 2 0 1 7 37
We all remember the commercials that were filled with poor connections and lots of people saying “can you hear me now?” This technology disconnect could be analogous to our systems that we use on a daily basis. Sometimes we get so fixated on the newest change or con-cern that we neglect the core issues that can create our biggest risks or problems. Maintaining the Radiology Information System (RIS) and Charge Description Master (CDM) can definitely fall into this category if we’re not careful. It’s not always about the codes but modifiers and procedure pricing as well.
If it’s not on your short list of con-cerns I would argue that it should be. In many facilities, different individu-als are responsible for the maintenance of the RIS and CDM files and there is no reconciliation process to coordinate their efforts. This lack of coordination can result in missed and/or inaccurate charges. This article will highlight the key areas of concern associated with the linking of these systems.
There is not one standard process that all hospitals follow when performing the charge capture function. While the end result is getting a claim out of the door with procedure codes that hopefully reflect what was ordered, performed and documented, the process to get there can
vary significantly by facility. The num-ber and type of systems that are utilized during charge capture drive the process. Additionally, staff who utilize these sys-tems also play a very important role. Are they properly trained? Do reports exist that help identify problems?
The first thing to examine in your facility is where does the charge genera-tion begin? Is it at scheduling, registra-tion, exam completion, or during the code assignment process? Keep in mind there is not a right or wrong answer to the questions, but rather there is a goal of understanding how it is being done in your facility. If the charge capture pro-cess begins at scheduling, this tells me that most likely the scheduling staff can access either the RIS system or CDM and is actually selecting a procedure from a listing in those systems. Assuming that the scheduled exam is correct, matches the order, is performed by the technolo-gist and properly documented by the radiologist, a correct bill will emerge. If any of those items is not accurate there is a potential problem. Unfortunately, the reality is that this process has great room for error and is not recommended as a best practice.
If charge generation begins at reg-istration, the same concerns are pres-ent. Unless there is a dedicated coder
assigning procedure and diagnosis codes directly from the radiologist’s dictated report, we are relying on the technolo-gist to review and change the charge information as needed. Then the ques-tion becomes: what does the technolo-gist see from a charge perspective? Does s/he see the information in the RIS or in the CDM? This is a very important question, and you should not make any assumptions about the answer. If the technologists are only seeing the infor-mation in the RIS, they are only getting half the picture. The next step in the coding process is critical. The individ-ual line items in the RIS must link to the corresponding item in the CDM or an accurate charge will not be created no matter what the technologist selects for the procedure.
This linking between the RIS, or other order entry system, and the CDM is critical for correct coding. Usually the technologist selects and/or verifies infor-mation from the RIS system and does not always have access to the CDM. The CDM may be maintained by someone in finance who is responsible for all depart-ments and therefore does not have the experience with radiology procedures to understand what is needed based on the facility’s scope of practice. If someone in the radiology department is responsible
coding
Can You Hear Me Now?By Melody W. Mulaik, MSHS, CRA, FAHRA, RCC, CPC, CPC-H

m a r c h / a p r i l 2 0 1 7 r a d i o l o g y m a n a g e m e n t38
Melody W. Mulaik is president and co-founder of Coding Strategies, Inc. She is a nationally recognized speaker and has delivered numerous presentations at AHRA annual meetings and conferences. Melody is a member of AHRA, has published extensively, and may be contacted at [email protected].
a. Map your CDM numbers to the corresponding RIS numbers i. Identify CDM entries with no
corresponding RIS entry and vice versa
ii. Compare descriptions to ensure errors are not made because of inaccuracies between the two entities
Unless you have completed a recent review I would anticipate that you will find several areas of opportunity. There is typically a disconnect between finance and radiology when it comes to charg-ing. It’s not intentional but rather reflects a different focus. The radiology IT staff is focused on providing what the tech-nologists need to capture what they are doing, and not necessarily on the result-ing charges. If you are like many facili-ties, the opportunities can be significant. Be careful not to put a specific dollar amount on the anticipated opportuni-ties lest your CFO budget the numbers to your detriment. I would recommend that you compare a quarter’s worth of data before and after the review and update and provide the good news in solid numbers.
One final issue of importance is the role of the technologist in the charg-ing function. Many times the technolo-gists are aware that they can’t charge for something but they don’t understand the importance of getting the problem fixed in the system, so they don’t raise the issue quite as vigorously as they should. Instead the technologist may inadver-tently be selecting a procedure that is “close to” what was performed which may be a lower or higher charge and always incorrect.
As the great coach Vince Lombardi once said “The achievements of an orga-nization are the results of the combined effort of each individual.” Keeping your systems up-to-date and accurate is an ongoing team effort that should be tack-led at least annually.
for the CDM you will find that the risk of errors is significantly lowered.
So how can you ensure that your sys-tems are correct? I recommend that you do the following:
1. Review your CDM (in spreadsheet format) for accuracya. Are there procedure codes present
for all procedures performed in the department? If not, add the miss-ing procedures/codes.
b. Are there modifiers present? If so, are they accurate and appropriate? Some modifiers are CDM appro-priate; however, most are not. A careful review will identify areas of concern.
c. Are the revenue codes correct for each procedure?
d. Are there multiple entries for the same procedure? It is not tech-nically wrong to have multiple entries, but it can create confusion and make it difficult to determine accurate utilization numbers for specific procedures. A clean CDM will have one procedure definition per procedure code.
e. Is the pricing accurate and up-to-date? Many facilities adjust prices annually for overall increases but do not adjust individual procedure fees. Ascertain your facility’s pric-ing policy and ensure it is applied to all charges. Low charges could be costing your facility, and thus your department, particularly if your fees are at or below the payor allowables. Several articles have seen written for Radiology Man-agement that address this critical issue as more and more bundled codes are created for radiol-ogy services. (See May/Jun 2016 and May/Jun 2015 articles “New Directions in CMS Bundling.”)
2. Match your CDM to your RIS/order entry system (merge spreadsheet or physically key in the data)
coding

r a d i o l o g y m a n a g e m e n t m a r c h / a p r i l 2 0 1 7 39
This article will address a few cases of machine learning applied to radiology that give specificity to artificial intelligence (AI) and are being worked out in diagnostic radiology today. The term “data driven” encompasses a range of data—ie, EHR data, imaging data, digital pathology, and population health data that can be utilized to render a diag-nostic interpretation and improved pic-ture of a patient’s condition and health.
First, an examination of lung cancer will be outlined with a discussion of a different model of technical-clinical innovation. The article will then move to briefly addressing how machine learn-ing can fit pieces of a patient’s story back together in a far richer and more predic-tive fashion with some thoughts on the business case for radiology and further thoughts on a specific data-driven story.
Lung Cancer as an ExampleAs a disease of modern times (there were few reported cases of lung cancer at the dawn of the 20th century), lung cancer is the highest mortality cancer worldwide estimated to cause one in five deaths (1.59 million in 2012, 1.67 million in 2015).1 Lung cancer deaths are estimated to rise to an astounding 2.27 million by 2030.2 Due to morphological complexities and
tiny non-calcified nodules, lung cancer can be difficult to detect and diagnose via X-ray and CT. In busy and high pro-duction radiology workflows, lung can-cer can be missed. In the US, failure to diagnose lung cancer at an early stage when it’s most treatable ranks fourth in malpractice claims.3 When lung cancer is identified early it is treatable, when identified at a later stage the prognosis is very poor. Deep learning algorithms that detect and correlate potential lung cancer cases could augment the radiolo-gist’s workflow, saving time and saving lives. It is not suggested that algorithms diagnose, but rather, augment the radi-ologist’s perceptual and cognitive capac-ity to see and identify lung cancer in the busy flow of reading cases.
Here, deep learning is altogether dif-ferent than computer aided diagnostics due to its ability to segment and classify disease from complex and dimensional pixel data without hand labeling each image and each potential abnormality. What this means is a deep neural net-work makes approximations, so to speak, on the available diagnostic image data that it is given. And due to increasing computational power it can bring those approximations into greater and greater specificity on the fly without human intervention at each step. This is the
By Rodney Sappington, PhD
The Diagnostic Imagination in Radiology: Part 2
• Developing algorithms for the improve-ment of diagnostic care leverages tech-nologies and techniques developed across industries that are exponentially being improved, developed, and tested.
• Machine learning means extracting pat-terns not only from patient level obser-vations or a radiologist’s primary diag-nosis, but from secondary diagnoses, incidental findings, claims data and sim-ilarities with other patients for predic-tive benefit.
• The business model for radiology will be based on deeply knowing and leverag-ing existing data and generating data on patients that can be reused and made easily accessible for future algo-rithms and changes in healthcare policy and reimbursement.
ExEcutivE Summary

The Diagnostic Imagination in Radiology: Part 2
m a r c h / a p r i l 2 0 1 7 r a d i o l o g y m a n a g e m e n t40
ideal and there is still much work to do in order to achieve beyond human results and algorithmic software integration that would augment this workflow. It’s not a matter of decades, but a few years for this augmentation to achieve com-mercial success—research and develop-ment has rapidly been advancing. Intense energy and resources are being dedicated to using machine learning for detecting lung cancer earlier and when treatable. What is needed is not better radiology workflows, but as radiologist David Hirschhorn MD of Staten Island Univer-sity Hospital states we “need a brain to drive all of this . . . [PACS, RIS] systems were never really designed to do.”4
Building such a brain means building many brains from many different com-panies and data sets. A machine learning and data science platform, Kaggle.com, brings some of this diversity together. It has solicited machine learning practi-tioners from around the world to build algorithms to help solve the problem of early detection and identification of lung cancer by offering $1 million, the larg-est amount ever given out for a Kaggle competition since its founding in 2010. As part of their 2017 Data Science Bowl, there are currently 899 Kaggle teams worldwide developing algorithms to defeat late stage lung cancer. A dizzy-ing array of clinical image competitions are available in 2017 that include auto-mated detection and classification of breast cancer, tissue microarray analysis for thyroid cancer, liver tumor segmen-tation, and diagnostic classification of prostate lesions.5
Why would a machine learning competition of mostly non-radiologists have a chance at besting radiologist per-formance in identifying late stage lung cancer? There are several reasons that such a competition is an effective model of innovation.
• Domain expertise. Clinical domain expertise is necessary but not sufficient for successful results in algorithm development. Such success largely depends on a tight technical team of
machine learning engineers, deep learning experts, mathematicians, soft-ware developers, DICOM integration personnel, and statisticians. Radiolo-gists are only a member of a larger non-clinical team.
• Faster R&D timelines and learning from others. A start-up with the right talent can move forward in a matter of a few months, research papers can be tested almost in real time as they are shared online. A competition of machine learning practitioners can leverage knowledge from each other and learn in ways no academic medical center could provide. A form of curated crowd sourcing encourages innovation here.
• Research to experimentation to imple-mentation. Research in machine learn-ing (that includes deep learning) is remarkably rapid, more rapid than institutional review board approval processes, academic funding cycles, or hiring practices within hospitals. Stay-ing nimble, failing fast, and gaining knowledge from mistakes is something that favors flexible diagnostic organiza-tions who wish to develop machine learning algorithms.
Many of the top Kaggle competi-tion winners have gone on to form their own companies using techniques gained from knowledge sharing and team work. Machine learning has been an essen-tial advance in industries from biotech, finance, agriculture, and fraud protection to name a few. Kaggle has hosted a num-ber of breakthrough competitions across such industries. What this means for radiology is that developing algorithms for the improvement of diagnostic care leverages technologies and techniques developed across industries that are exponentially being improved, devel-oped, and tested.
Rich and Predictive Patient StoriesIf machine learning is thought of as a puzzle master, then consider the puzzle pieces brought back together that have
historically been isolated and left out of a full patient’s story (eg, diagnos-tic images, population health metrics, claims data, EHR patient histories, pathology reports and images, patient behavior scrapped from the Internet). This means extracting patterns not only from patient level observations or a radiologist’s primary diagnosis, but from secondary diagnoses, incidental findings, claims data and similarities with other patients for predictive ben-efit. Radiology is not far off from uti-lizing massive computational power in deploying algorithms that are “clustering pixels into lines and shapes and ulti-mately learning contours of fracture lines, parenchymal opacities, and more. Even traditional insurance claims data can take on a new life: diagnostic codes trace an intricate, dynamic picture of patients’ medical histories, far richer than the static variables for coexisting conditions used in standard statistical models.”6
Many companies are currently devel-oping predictive analytics for healthcare. One company is attempting to tackle this fuller patient story by predicting health risk. As they state, one of their key AI solutions calculates a range of data rela-tionships (eg, location, time, behavior, history, pathology) meaningful for pre-vention and clinical intervention.7
The Business CaseIn value-based care, bundled payments based on population level cost-benefit analyses put the pressure on radiol-ogy departments to do more with less. Machine learning brought into radiol-ogy departments and integrated into radiology, teleradiology, and telemedi-cine workflows will mine and correlate data that remains unused but necessary for delivering improved diagnostic out-comes on both individual and popula-tion levels. We are at the beginning. The business of radiology will become a data business not dissimilar to other indus-tries in finance, retail, aerospace, and insurance that have come before. The

r a d i o l o g y m a n a g e m e n t m a r c h / a p r i l 2 0 1 7 41
business model will be based on deeply knowing and leveraging existing data and generating data on patients that can be reused and made easily accessible for future algorithms and changes in health-care policy and reimbursement. As radi-ology turns into clinical data science, data itself will gain in increasing value, how it’s managed, created, archived, distrib-uted, correlated, prioritized, protected, and made available to patients and clini-cians. The business model is really many models for radiology service and they fall into a few lines of thinking.
• Clinical-industry collaborations. Part-nerships with machine learning compa-nies in which radiology can gain from the knowledge and development of new products and services. Radiology can gain revenue as an early adopter.
• Cost savings. Demonstrable cost sav-ings based on efficiency gains from algorithms that make radiologists more efficient in their daily tasks. More reports generated per radiologist.
• More effective sub-specialization. Algo-rithms could be even more precise than rule-based software systems in aligning the right sub-specialized radiologist with the right diagnostic task. Radiol-ogy can gain from improved outcomes and reduced errors with precise target-ing of expertise.
• Scalability. As with teleradiology, once the digital boom took hold, radiology service became widely distributed and scalable. Machine learning will pro-vide incredible potential for radiology to scale.
A Data-Driven Story The following algorithm story focuses on a very sick patient called “Jane” and a group of lively algorithms called “Irma.” The story’s purpose is to open broader understanding of algorithms that operate behind the scenes of a patient’s journey. Jane and Irma are characters that may at least ignite thought on a few near term realities facing data-driven radiology and healthcare generally.
The “Jane-Irma” story is a thought experiment that illustrates the expan-sive use medical and non-medical data as part of the patient’s journey through diagnosis, treatment, and recovery. On one level are random forest methods, deep neural networks, network security protocols, social media networks, and network optimizations that together aim to classify and detect disease, and correlate and distribute clinical and non-clinical data for Jane’s betterment.
On another level there’s Irma, a set of algorithms busy correlating the patient’s functional lab results, demographic and physiological data (eg, BMI, age, CT images and radiology reports, physical and eye exams, surgical reports, uses of home medical equipment, and social media logins). As the scope of Irma’s algorithmic reach is realized, several algorithmic and network functions that are typically seen as separate functions working together in Jane’s journey as a patient are identified.
Irma knows nothing about Jane’s inner world. Jane knows nothing about Irma’s function in her care or how dis-ease classifiers are working in her favor. How does Irma account for Jane’s reac-tions to the décor and comfort of a radiology waiting room, or her feelings when she visits her thoracic surgeon’s office where she observes people shuf-fling in with oxygen tanks and making co-pays? And how does Jane account for algorithms continuously learning about her chronic disease for best treatment options? How does Irma account for Jane’s hesitancy in touching the stranger next to her as she is called into her sur-geon’s office? Jane has no way to account for what makes Irma “go.” Yet, Irma has been vigorously and intelligently corre-lating Jane’s hospital post-operative con-sultation (below description compiled from anonymous operative reports in
collaboration with thoracic surgeons and radiologists):
A 71-year-old female with a history of diabetes, smoking, hypertension, hypo-thyroidism, chronic kidney disease, CAD, MVA, prolonged hospital stay at the local hospital for osteomyelitis of the right heel status post debridement with IV antibi-otics x3 prior to this admission, bilateral pleural effusions requiring thoracentesis, pericardial effusion status post window. The patient was intubated, extubated, and found to have a left breast mass, sent to rehab after a near syncopal episode and post diarrhea, found to be hypoxic and admitted to the County hospital from rehab. Chest x-ray revealed bilateral pleu-ral effusions and pulmonary edema. She was placed on BiPAP, given IV Lasix with improvement in her symptoms initially, but continued to have persistent effusions. She was evaluated by interventional radiology, had bilateral chest tubes placed during her hospital stay here, and eventually chest tubes were removed. The patient continued to have reaccumulation of her left located pleural effusion. After multiple evaluations by cardiothoracic surgery and moderate-to-severe mitral regurgitation, repair of her valve would help her CHF status. The patient is now being transferred to another hospital for mitral valve repair.
From a radiology and surgical point-of-view, Jane was a picture of continued follow-up CTs, chronic disease main-tenance, and thorascopic intervention. Jane was a perfect rendering of a body in need of being repaired, intubated, and transferred to various hospitals for further evaluation and treatment. From Irma’s machine point of view, Jane was generative, that is she was creating data that a multi-layer deep neural network was trained on, and continuously learn-ing to identify, correlate, denoise, seg-ment, feature-extract, and output. From Jane’s point of view, her life had not been
We are at the beginning. The business of radiology will become a data business not dissimilar to other industries in finance,
retail, aerospace, and insurance that have come before.

The Diagnostic Imagination in Radiology: Part 2
m a r c h / a p r i l 2 0 1 7 r a d i o l o g y m a n a g e m e n t42
lived well or right and she wanted to get better. She wanted medicine to somehow give her another chance.
Let’s embrace Jane from another angle—what she gives rise to. She gives rise to almost endless opportunities for machine intelligence. As a patient (one of the most data-rich moments in the human life-cycle), Jane will be shuttled back and forth between a new research project on lung cancer reoccurrence. She will be moved between databases and parsed for clinical outcomes research. Her data will serve to train a set of algorithms that continuously learn to better classify non-small cell adenocarcinoma that learn from radi-ologist interaction to quickly diagnose the highest mortality cancer.
On this wider level, Jane has invis-ible lives as DICOM, FIHR and HL7 and laboratory tests and SOAP notes. At this intersection, Jane and Irma’s inter-action intensifies. Irma is alive through deep learning neural networks. There’s no “off ” button. Irma exchanges Jane’s data across hospital and private prac-tices as is medically necessary, her fate realigned as the health system under which her care was handled is leveraged by a private equity firm merger. Jane owns no medical ontologies, deep learn-ing libraries, patient tests, networked databases, or patient histories. Jane owns none of the “intelligence” driving her care. Jane represented by axial CT and 3-D reconstructed pixel data of her adenocarcinoma is not the same Jane who received her husband’s hand while leaving the thoracic surgeon’s office and into the elevator.
In the clinical data-value chain, Jane’s data life begins to resemble a perpetual effervescence. It takes expansive form. The National Cancer Institute, American Cancer Society, and Mount Sinai Medi-cal Center all have traces (or anonymized PHI) of Jane to compare base-line chest CTs to routine scans to determine cancer rates among women born before 1940, married, and previous smokers with a per pack-year rate. On another level, Jane’s data-life has left traces within the
Bureau of Transportation and Roche which together have entered into a joint venture to understand driving habits connected to smoking and other high-risk health behavioral norms. Jane’s grandchildren have opened a Facebook account for her and rendered opinion on lung cancer treatment and chronic disease, which has left a secondary trace that follows Jane in other ways. The Lung Cancer Alliance has read her posts on Facebook and has asked to interview her and her family. Irma speeds-on, even though Jane as a human must eventually slow down.
Jane will serve as data-points among other points of predictive inference that leverage radiology reports and images along with: social security numbers, tax files, insurance premiums, GPS location, and smoking behavior and per-pack a year rates. Major tobacco companies have also secured her smoking history and used it to redesign their delivery devices for optimal burn time. Paradoxically, the Society of Thoracic Surgeons has secured Jane’s data for Irma-like deployment in its STS National Database for quality improvement based on over 4.5 million surgical records. To use the figure of a Jane-Irma relationship as predictive data correlation means that in the free mar-ket of data exchange Irma thrives. In the clinical reality of lung cancer Jane negoti-ates her disease. Jane’s diseases were not caused purely by smoking or poor diet, but in this context they were correlated via her widening relationships, Facebook “likes,” connections, social media tags, interactions, environmental exposures, genetic predispositions. Correlations, diagnoses, and treatment suggestions are arrived at in real-time, 24/7, tirelessly.
ConclusionThe capabilities of AI in medicine are being sounded off all around us. We hear rumblings that AI has gone main-stream and that it will replace 50% of jobs in the next few decades. Radiolo-gists will soon be replaced by algorithms and error rates will be eliminated by
data-driven radiology. However, there’s a more grounded and perhaps compas-sionate approach to this AI story line. Focus should be put on actual use cases of machine learning applied in diag-nostic and clinical care today. Useful applications for radiology management, radiologists, and organizational think-ers attempting to foresee and plan for machine intelligence in the near term should be the focus.
A key feature of machine learning is its exponentiality. What this means is that algorithms are being developed and dis-tributed faster than the previous uptake of informatics—ie, imaging modalities, voice recognition, RIS, image compres-sion algorithms. Such exponentiality suggests disruption to cycles of human learning, unlearning, and jobs. Speed of change, scale of delivery, rapid develop-ment of machine intelligence, and orga-nizational change are features of machine learning today not tomorrow. Given this context of hype and possibility, organiza-tions will likely continue to be both open and closed to such accelerated change. Radiologists in particular will continue to puzzle through their own machine learning embrace-rejection stance, with winners and losers. Machine learning not only means a new level of technical devel-opment for radiology service, but a new level of human adaptation (and coop-eration) around implementation and augmentation of novel systems that can be highly efficacious but also confound-ing. Part 3 in this series will address the impact of machine learning on jobs and expertise in radiology service.
References1World Health Organization. Health Statistics
and Information Systems: WHO Mortality Database. Available at: who.int/healthinfo/mortality_data/en/. Accessed February 1, 2017.
2American Thoracic Society. “Breathing in America: Diseases, Progress, and Hope.” Chapter 11: Lung Cancer. Available at: https://www.thoracic.org/patients/patient-re s ou rc e s / bre at h i ng - i n - ame r i c a /resources/chapter-11-lung-cancer.pdf. Accessed February 1, 2017.

r a d i o l o g y m a n a g e m e n t m a r c h / a p r i l 2 0 1 7 43
3Medical Malpractice Center. “Lung Cancer Misdiagnosis.” Available at: http://www.malpracticecenter.com/misdiagnosis/lung-cancer. Accessed February 1, 2017.
4AuntMinnie.com. “The year ahead in radiol-ogy: 9 trends to watch in 2016.” Available at: http://www.auntminnie.com/index.aspx?sec=ser&sub=def&pag=dis&ItemID=113146. Accessed February 1, 2017.
5Consortium for Open Medical Image Com-puting. “Gran Challenges in Biomedical Image Analysis.” Available at: https://grand-challenge.org/All_Challenges. Accessed February 1, 2017.
6Obermeyer Z, Emanuel EJ. Predicting the future—big data, machine learning, and cl inica l medicine. N Engl J Med . 2016;375:1216–1219. Available at: http://w w w. n e j m . or g / d oi / f u l l / 1 0 . 1 0 5 6 /NEJMp1606181. Accessed February 1, 2017.
7Lumiata. “Risk Matrix.” Available at: http://www.lumiata.com/product/. Accessed February 1, 2017.
Rodney W. Sappington, PhD is a senior clinical data scientist, informatician, author, and healthcare strategist. He is CEO of Acesio Inc., a disease insights company that leverages medical and non-medical data to better understand early indicators and inequities that lead to global disease incidence. He can be contacted at [email protected].

management findings
m a r c h / a p r i l 2 0 1 7 r a d i o l o g y m a n a g e m e n t44
everyday roles. When a customer isn’t feeling so upbeat or is expecting fam-ily members to be visiting soon, the last thing he or she wants to do is wait for transportation services. Seek opportuni-ties to be remarkable.
At our facility, a customer showed up one day earlier than what was arranged with the scheduling team. The customer asked to speak with the modality super-visor. In speaking with the customer, I quickly came to realize that she was overly anxious and worried about what the results of the exam may find. To her pleasant surprise, I agreed to accommo-date her since no preps were necessary for the exam and the isotope was avail-able at the local radiopharmacy. Believe me, most exams in nuclear medicine aren’t as cut and dry. To add to her sur-prise, I proceeded to accompany the cus-tomer to the registration office to help streamline and navigate her through the registration process. Her worries were instead met with empathy and attention. She was happy and beyond relieved.
More recently, after conversing with an elderly customer, the technologist had learned that the customer had come alone by taxi. He stated that his wife would be picking him up once the exam was com-pleted. The technologist also noticed that he had trouble walking and walked very slowly. So after the exam was completed, our technologist got the gentleman a wheelchair and personally escorted him
Rising above and beyond the customer’s “everyday” perception and experience ought to be a defining interest and focus for the radiology practice. In a world where “different” is often discouraged and diminished, isn’t it ironic that in the business world differentiation and dis-ruption are considered precious lifelines or catalysts to renewed visibility?
A strategy of fitting in is a guaran-teed future of self-inflicted marginaliza-tion. Do you really want to be invisible? Seth Godin, an American author, entre-preneur, marketer, and public speaker, said it best: “You’re either remarkable or invisible. Make a choice.” Remarkable is choosing to be different, doing things both in process and manner that are just not done by other players within your region or industry. In the book, “The ONE Thing,” authors Gary Keller and Jay Papasan wrote “a different result requires doing something different.” Therefore, being different is good strategy.
Go beyond hello and create a genuine connection. Get to know your customer at a deeper level. Make a genuine connec-tion through shared experiences, activi-ties, places, and people. Offer a simple compliment if you can. Make your cus-tomer smile. Make your customer laugh. Laughter is a great way for two people to form a connection. Compliment your customer on how well they followed instructions during the exam. Show your appreciation!
Go Beyond the Everyday
Remember, no element or detail proves too small. In the evolving, expe-rience economy, every action and inac-tion you take will contribute to the total customer experience. Maya Angelou, an American poet and memoirist, once wrote, “Remember, people will judge you by your actions, not your intentions.” Our customers seek out confidence and encouragement. They seek out trust and a feeling of satisfaction. Are your team members delivering the right cues and behavior that together affirm the desired experience?
Words do matter. One’s choice of words can affect the recipient’s behavior. Listen to the language your staff uses. “May I proceed?” empowers your cus-tomer and it also displays humility and respect. “My pleasure” resonates so much better than “No problem.” “Is there any-thing else I may do for you?” closes the encounter with grace and goodwill.
Go beyond your everyday role and create customer surprise. For example, an inpatient just completed an exam. Most radiology departments will do the same routine of calling for transporta-tion services. Why not encourage the staff to fulfill that function? Opt to be different. Why make the customer wait if resources, wheelchair, and staff are within reach and immediately available? Create customer surprise. In doing so, your customers will know that staff are willing to go above and beyond their
By Deo G. Religioso, CNMT, RT(N), MBA, CRA

r a d i o l o g y m a n a g e m e n t m a r c h / a p r i l 2 0 1 7 45
to the lobby of the hospital. Along the way, the gentleman needed to stop and use the restroom. Once at the lobby, our technologist proceeded to wait with the customer keeping him entertained and safe until his wife arrived. The customer was highly impressed with the care and attention our technologist provided. He was beyond grateful. He was amazed. The customer came to our service over a four-day period. Every day, the same technologist was at his side.
Go beyond today and create a loyal customer. When you think about it, every interaction with a customer is an opportunity to learn from the cus-tomer. In principle, both parties have an opportunity to learn from one another. However, the more the customer teaches you, and not the other way around, the better informed and adept you will be at winning the customer’s loyalty and trust. Steve Jobs, founder of Apple, once boasted, “Get closer than ever to your customers. So close that you tell them what they need well before they realize it themselves.” Imagine that.
Also utilize the concept of managing up. Managing up is all about helping to create good impressions of others in the organization either before an encounter or during a first meet. Customers are often scheduled to have multiple exams during one visit. Make it a practice to escort cus-tomers and family members to their next exam appointments. And, along the way, make it a point to say something posi-tive about the next imaging modality or department or co-worker. The transition should be seamless and harmonious, giv-ing the customer and family members a positive impression and feeling. Manag-ing up other departments, co-workers, and physicians is a great way to facilitate improved relationships.
Make it a habit to learn from the cus-tomer. Make it a commitment to get to know your customer. Was your customer happy or unhappy with the visit today? Did a particular activity or interaction trigger a happy or unhappy response? What are the personal likes and dislikes
of the customer? Every bit of information that the customer decides to share with you ought to be thoroughly examined and considered. Your objective is to cre-ate a focusing question and a playbook for each and every customer. Record your findings and/or corrections in your RIS or scheduling system. Review, share, and learn these important details and insights before the next customer encounter or visit. It may turn your 4 star rating into a coveted 5!
Take heed to define who you are:
1. What is it about your practice that makes it different?
2. What is special about the way you do business?
3. What do you want to be known for?4. What story do you want to tell the
customer?5. What lasting impressions and memo-
ries do you want to make?
Remember, your customer’s per-ception and experience is your reality. To succeed, don’t follow the crowd. Be bold. Be different. Be remarkable. Be willing and able to tap into the hearts and emotions of your customers. Create that focusing question and playbook. Create an experience that customers will appreciate, remember, and seek out. Command that emotional differ-ence. Attend to details with the inten-tion of winning loyalty and trust. It’s sustainable. It’s a differentiation that leads to renewed visibility, growth, and financial success.
Bibliography1Pine J and Gilmore J. “The Experience Econo-
my.” Boston: Harvard Business School Press. 1999.
2Godin S. “Purple Cow: Transform Your Busi-ness by Being Remarkable.” New York: Penguin Group. 2002.
3Shaw C and Ivens J. “Building Great Customer Experiences.” New York: Palgrave Macmil-lan. 2002.
4Keller G and Papasan J. “The ONE Thing, The Surprisingly Simple Truth Behind Extraor-dinary Results.” Texas: Bard Press. 2013.
Deo G. Religioso is the lead technologist for nuclear medicine services at Boca Raton Regional Hospital. He obtained his MBA degree from Manhattan College in 1995. An AHRA member since 2004, he achieved his CRA credential in 2007. Deo can be contacted at [email protected].

m a r c h / a p r i l 2 0 1 7 r a d i o l o g y m a n a g e m e n t46
AHRA www.ahra.org covers, 1
Beekley www.beekley.com 5, 36
The Burwin Institute www.burwin.com 47
FUJIFILM Medical Systems www.fujimed.com cover
Intersocietal Accreditation Commission (IAC) www.intersocietal.org 26
Landauer landauermp.com/cdos 24
Mednovus-SAFESCAN® www.mednovus.com 22
MIC www.micinfo.com 2
Radcomm www.radcomm.net 47
Skyline Medical www.skylinemedical.com 43
Advertiser Web Site Page Number
AdvertisersIndex to

r a d i o l o g y m a n a g e m e n t m a r c h / a p r i l 2 0 1 7 47
■ Special advertiSing Section
the mArketplAce
No Additional Charge for 1/8 Page Horizontal Ad Layout!Just send us a company logo, contact information and a descrip-tion of your services. Or send us an image of your product with a 70 word (maximum) description; we’ll put it into a standard 3 1/2” x 2 1/8” format and place your ad in this highly visible section.
Ad Rates and Discounts 1X 3X 6XBlack & White Only $275 $249 $225
M a r k e t p l a c e A d v e r t i s i n g
For more information on how these advertising opportunities and more can work for you contact:
Kelly MillerM.J. Mrvica Associates, Inc.
(856) 768-9360E-mail: [email protected]
www.ahra.org/rmsearch
One of the most popular pages on AHRA’s website, this archive contains journal articles since 1995. Access is open to members and subscribers only.
Opportunities for banner ad placements.
Radiology Management Article Database
AHRA’s Annual Meeting & Exposition is the premier event for imaging administrators. Reach meeting attendees each morning with the AHRA Convention Daily, the only publication that provides the most recent news, information, and schedules. Convention Daily advertisements are a great way to direct traffic to your booth.
Advertising RatesSize 2x* 4x**
Full page $1915 $10751/2 page $975 $5901/4 page $520 $365
*2x advertisers must advertise in the second and fourth issues.**4x advertisers must advertise in each of the four issues.
COLOR• 4-Color Process: add $550
C o n v e n t i o n D a i l y
Offered to subscribers as an alternative format, all print ads are included in the digital edition of Radiology Management at no additional cost. A major advantage of digital edition advertising is the ability to promote and track usage of click-throughs (all ads containing an e-mail address and/or a URL are clickable). Nearly 80% of readers prefer receiving information about a product or service by visiting a company’s website.* Advertisers follow normal print advertising production specifica-tions and deadlines.
*Source: Radiology Management Reader Survey, March 2010.
Radiology Management Dig i ta l Ed i t ion

m a r c h / a p r i l 2 0 1 7 r a d i o l o g y m a n a g e m e n t48
Our AHRA Culture
i became an aHra member over 30 years ago and can still recall my first experience at what was then a regional annual meet-ing. i was amazed at how friendly all the members were. the board of directors and annual meeting committee members were so professional, but at events they made a point of noticing that i was a first time attendee, and came up to introduce them-selves and exchange pleasantries. When i started going to the presentations, i was amazed how knowledgeable the speakers were, only to realize that these were radiol-ogy supervisors, managers, and directors. Some were from small hospitals, and some from large university institutions. But there was no distinction between the big and the small. everyone was there to sup-port one another. it was the warmth i felt and the caring culture i first experienced which i call “our aHra culture.”
there have been many leaders that have had a strong influence on me as i culminate my 40 year career in imag-ing this year. Merle Meland was my first mentor in management. as a new work-ing supervisor, i had no experience at all in management. He was kind enough to take me under his wing to teach me about the business of radiology. He also intro-duced me to what was then our aHra Western region, and encouraged me to get involved. it was a gift he gave me that benefited me my entire career.
While serving on the Western region Board, it was my year as president that some sweeping changes were made to aHra by eliminating our five regions. it was a difficult business decision that was driven by two of my mentors, ron
Bernardi and Michael Favereau. the national board’s strategic view was basic: some regions were financially strapped with low membership volumes. For our vendor partners, it was becoming financially infeasible for them to sup-port aHra at both the national and the regional levels. We needed to con-solidate and work together as a national organization to survive. i worked with some of the very best people associated with aHra: Howard Schwartz, deb platt, Monte clinton, ted caveglia, John ising, Sheila Sferrella, Brenda Holden, louise Broadley, deanna Welch, robbie edge, Jim grosskopf, roland rhynus, Jd Mace, chuck Mitchell, gail nielsen, and dewey Hollingsworth just to name a few.
We met in dallas at the lowe’s ana-tole Hotel. We had never assembled all five of the regional boards as well as the national board members in one place, so it was a big gathering with the best and brightest leaders in our field from across the nation. the opening meeting laid out the importance of our mission and how this was a critical agenda that could mean the demise of aHra without change, or could shape a new future for aHra. it was a sobering meeting and everyone knew the importance of what we were embarking upon. We worked in cross-regional groups to help design this new model of aHra that would eliminate the very regions most of us represented. the work that was done at that meeting was the initial steps that have served as our aHra framework now for decades.
the next year, ron Bernardi approached me on behalf of the nominations committee
to see if i would consider being on the bal-lot for aHra president-elect. it threw me. it just didn’t occur to me that i would be considered. during those days there was no executive director of aHra, which meant that the president was required to spend much more time in aHra opera-tions. i knew it would be a strain on me and my family, but it was something i really wanted to do, with a passion to make a dif-ference with an organization that i loved. So i said yes. it was one of the greatest com-mitments in my lifetime that i will never forget and always be grateful for.
What i am most grateful for is that i feel i was able to foster and encour-age our aHra culture. if you go to our annual meeting today, there is still that warmth and genuine personal touch felt from other attendees and our leader-ship. i always contended it was because most of us originated as caregivers. as leaders, we inherently communicate this in the way we connect with others. it is important for us, as members, to see that our aHra culture continues to thrive. it is who we are, in our workplace and in our lives. Ultimately, it is what makes us exceptional leaders, and also makes aHra uniquely special as an organization.
Gordon Ah Tye, FAHRA is director of imaging and radiation oncology services for Kaweah Delta Health Care District in Visalia, CA. He holds a bachelor’s degree in biological sciences from California State University in Fresno. Gordon is a past president of AHRA, received the AHRA Gold Award in 2001, and received the 2006 Minnie for Most Effective Radiology Administrator of the year. He may be contacted at [email protected].
By Gordon Ah Tye, FAHRA
on that note