Embed Size (px)
Citation preview
The Job deficitPublic Job Creation and the Right to a Job :
Towards a Strategy of Pro-poor Inclusive Growth
Rania Antonopoulos
May 9-10, 2008
THE CITIZEN CITY INTERNATIONAL SYMPOSIUM ON ELR, Rio de JaneiroOrganized by the Institute for Zero Unemployment
Sponsored by the Brazilian National Development Bank

The role of the Markets revisited
• Challenge: International market dynamics lead to the crisis of rising food prices….
• Challenge: Sub-prime mortgage crisis leads to turmoil in financial markets…
• Challenge: demand is insufficient to provide jobs and hire those who need and wish to work; poverty reduction, polarization

The role of Government revisited Economic and Social outcomes of Laissez faire,
and small government prove uneven and often times disappointing
• In production markets it can increase food security price subsidies of staple foods, stockpiling, Malawi’s subsidies of fertilizers,South Africa rethinking land policy
• In financial markets it can ameliorate instability and fragility stronger rules and regulation are needed
• To address unemployment it can introduce an active labor market policy: ELR

“There is plenty of evidence that unemployment has many far-reaching effects other than loss of income, including psychological harm, loss of work motivation, skill and self-confidence, increase in ailments and morbidity (and even mortality rates), disruption of family relations and social life, hardening of social exclusion and accentuation of racial tensions and gender asymmetries.”
Amartya Sen (2000)

Changes in employment to output growth ratio
0.0
0.2
0.4
0.6
0.8
1.0
1.2
Central andEastern Europe
(non-EU) & CIS
DevelopedCountries and EU
South Asia Latin America andthe Caribbean
Sub-SaharanAfrica
Middle East andNorth Africa
1995-19992000-2005
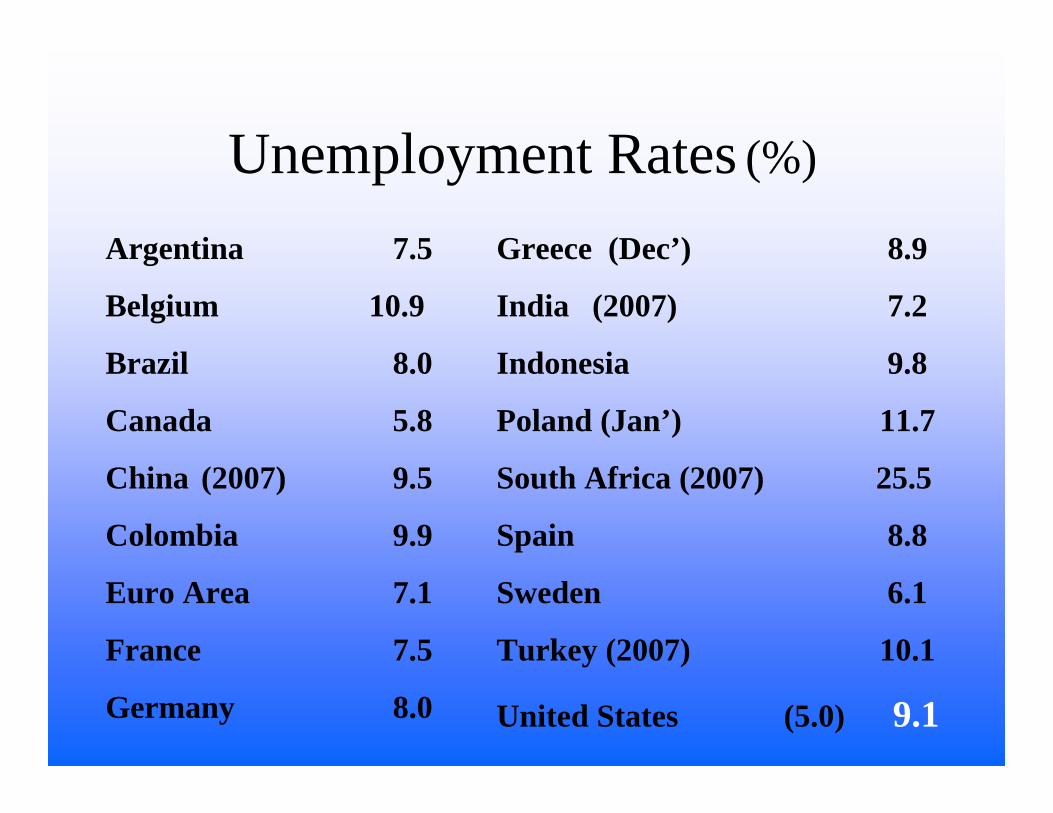
Unemployment Rates (%)
Argentina 7.5
Belgium 10.9
Brazil 8.0
Canada 5.8
China (2007) 9.5
Colombia 9.9
Euro Area 7.1
France 7.5
Germany 8.0
Greece (Dec’) 8.9
India (2007) 7.2
Indonesia 9.8
Poland (Jan’) 11.7
South Africa (2007) 25.5
Spain 8.8
Sweden 6.1
Turkey (2007) 10.1
United States (5.0) 9.1

Why an EGS,ELR,PWP?The right to work promotes • Dignity, inclusion and expanded democracy• Direct and indirect income creation• Direct and indirect job creation • Public and Private Asset creation • Pro-poor growth• Change our mentality about growth as the single
developmental objective and replace it with pro-poor growth, employment creation, inclusion and improvement in standard of living of people

Typology of Direct Job Creation Government Programs
• Emergency Programmes:Indonesia, Korea, Argentina post 2001 financial crisis, USA (New Deal)
• Social Funds:Bolivia (1986), Chile (1975-1987), Peru (1991)
• ILO Employment Intensive Infrastructure(since 70’s in many African countries)
• The Right to Food,the Right to Work:NREGA since 2006
• Recognition of Unemployment during prosperity: South Africa since 2005, Sweden and Australia (1940’s-70’s)

Employment Guarantee Programs
• What kinds of jobs? What types of “projects”? Who is eligible? For how long?
• What is the “cost” of such projects and what are the “benefits”? Financing? Are they inflationary?
• Institutional arrangements? Technical expertise?Fiscal and monetary policy consistency?

Employment Guarantee Programs
• Expanded Public Works Programmes [infrastructure, social sector, environment, economic]
SOUTH AFRICA
• National Rural Employment Guarantee Act[Right to Information Act- Ongoing Social Audits ]
INDIA

NREGA Types of Community Projects
Rural roads and access roads
Rural land development
Flood control works
Water conservation and water harvesting
Irrigation facilities to land owned by poor people and to beneficiaries of land reforms
Reactivation of traditional water harvesting and distribution systems

Promoting gender equality?Example: Morocco Rural Water Supply and
Sanitation Project• improved access of rural communities to safe water• which improves the health and productivity of rural
communities • while it reduced the burden of girls traditionally involved
in fetching water, thereby increasing their school attendance
• time women and girls spend gathering water hasbeen reduced by 50-90 %. This enables women to spend more time on agricultural production, literacy classes, while girls devote more time to education.
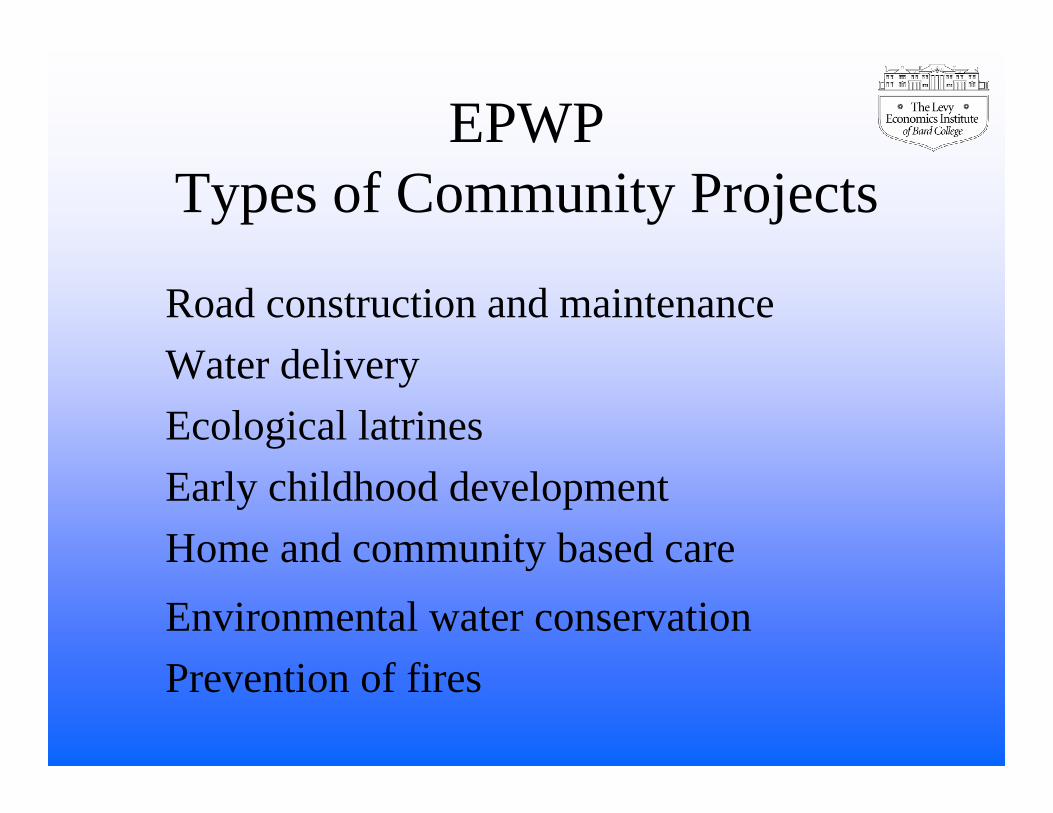
EPWPTypes of Community Projects
Road construction and maintenanceWater delivery Ecological latrines Early childhood developmentHome and community based careEnvironmental water conservation Prevention of fires

Background on the Study• Research project on micro-macro impact of scaling up
public job creation
• This presentation: Kijong Kim (Levy Institute), EPWP, Irwin Friedman (Health Trust Fund) and PROVIDE team (Dept. of Agriculture)
• Type of Intervention : scaling up Early Childhood Development and Home/Community Based Care
• The right to work , the right types of projects?unpaid work and gender issues

Policy Simulations• All Existing Types of Projects have the potential to
reduce unpaid work and facilitate creation and access to basic services EPWP Working for Water; environment sector (Tsitsikamma 2004/05)EPWP Social Sector (Health Trust Fund)EPWP Infrastructure;Access roads and Water Reticulation (SCIP Engineering Group)
• Options for Job allocation schemeJefes variation by population weights (part time year around)NREGA scheme (100 days)Poverty weights-normalized by populationUnemployment weights normalized by poverty incidence
• Target population Poor and ultra poor households comprising (50% of the unemployed); “unskilled” wages according to programme stipulations and skilled according to SAM

Impact of EPWP Injectionexex--ante evaluation of policy scenariosante evaluation of policy scenarios
• Direct and indirect job creation (skill level/gender/sector)
• Direct and indirect income received by type of hh• Depth of poverty reduction • GDP growth? Pro-poor growth?Sectoral growth?• Fiscal space expansion?• Impact of new assets and service delivery for
participants and community

The SAM for South Africa• Based on PROVIDE, Dept. of Agriculture• Factors disaggregated
by skill and gender• 26 sectors• 20 types of hhs• 7 exogenous sectors
1 FGOS2 FMaleUS3 FMaleSk4 FFemUS5 FFemSk
E 53 1 SALTAXX 54 2 INDTAXO 55 3 DIRTAXG 56 4 GOVT
57 5 KAP58 6 DSTOC59 7 ROW
A 27 1 CagricC 28 2 CminingT 29 3 CfoodI 30 4 CtextV 31 5 CpaperI 32 6 CpetroT 33 7 CnonmetI 34 8 CmetalsE 35 9 CmachinS 36 10 Ccomeq
37 11 Ctrnseq38 12 Comanuf39 13 Celec40 14 Cwater41 15 Cbuild42 16 Cconstr43 17 Ctradacc44 18 Ctrnscom45 19 Cfinserv46 20 Cbusserv47 21 Ceduc48 22 Cogovserv49 23 Chealth50 24 Csocial51 25 Coserv52 26 Cdomserv
1 HUF_Af1_32 HUF_Af43 HUF_Af54 HUF_Co1_35 HUF_Co46 HUF_Co57 HUF_Wh8 HUI_Af1_39 HUI_Af4
10 HUI_Af511 HRF_Af1_312 HRF_Af413 HRF_Af514 HRF_Co1_315 HRF_Co416 HRF_Co517 HRF_Wh18 HRI_Af1_319 HRI_Af420 HRI_Af5

Types of Households1 HUF_Af1_32 HUF_Af43 HUF_Af54 HUF_Co1_35 HUF_Co46 HUF_Co57 HUF_Wh8 HUI_Af1_39 HUI_Af4
10 HUI_Af511 HRF_Af1_312 HRF_Af413 HRF_Af514 HRF_Co1_315 HRF_Co416 HRF_Co517 HRF_Wh18 HRI_Af1_319 HRI_Af420 HRI_Af5
Urban Formal African Non-PoorUrban Formal African PoorUrban Formal African Ultra PoorUrban Formal Colored Non-PoorUrban Formal Colored PoorUrban Formal Colored Ultra PoorUrban Formal White Non-PoorUrban Informal African Non-PoorUrban Informal African PoorUrban Informal African Ultra PoorRural Commercial African Non-PoorRural Commercial African PoorRural Commercial African Ultra PoorRural Commercial Colored Non-PooRural Commercial Colored PoorRural Commercial Colored Ultra PooRural Commercial White Non-PoorEx-homeland African Non-PoorEx-homeland African PoorEx-homeland African Ultra Poor

Unemployment Rate - African, poor/ultra-poor (strict definition)
0% 10% 20% 30% 40% 50% 60% 70% 80%
Urban formal Ultra-poor
Urban formal Poor
Urban informal Ultra-poor
Urban informal Poor
Rural com Ultra-poor
Rural com Poor
Ex-homeland Ultra-poor
Ex-homeland Poor
FemaleMale

EPWP: Social Sector
• Social Sector consists of ECD/Education and HCBC/Health
• High female intensity (60 and 69% respectively) addresses female unemployment in the short run and builds skills in the long-term
• Data source: Friedman, Irwin, Bhengu, L., Mothibe, N., Reynolds, N., and Mafuleka, A., (2007) Scaling up the EPWP,Health Systems Trust, November, Volume 1-4. Study commissioned by Development Bank of South Africa and EPWP.

Simulation Results
9 billion Rand, full time-year around jobs
• Direct job creation (600,000 to 1,2million)
• Indirect job creation: for every 3 EPWP, another one in the economy is created
• GDP (+1.7%), tax expansion (1/3 recovered)
• Poverty reduction: pro-poor growth!

Costs and Benefits
• Social inclusion • Income-Poverty reduction? This depends on the
length and duration of jobs, wages and targeting method
• Asset poverty reduction!!! • Service delivery!!!• Gender equality in unpaid and paid work• Pro-poor development• Monetary cost: 1% of GDP ….?3% of GDP?• Opportunity cost of not mobilizing domestic
resources?

member institutions...we are...a group of economists working towards building a global informal network of academics, policy advisors, institutions, advocates and members of government, committed to the realization of the right to work…
www.economistsforfullemployment.org
we are committed to...joining forces with all who foster public dialogue and seek to promote employment guarantee around the world. Together, we can provide coherent, viable policy alternatives that lead to inclusive and just outcomes for all…

We aim to…Promote public dialogue and build towards a worldwide
campaign
Leverage and influence the policies and programs of development agencies and financial institutions for improved employment outcomes.
Build communities of learning and foster public awareness on existing country level experiences.
Engage in teaching and policy oriented research
Explore linkages between development, poverty reduction and macroeconomic coordination policies

COUNTRIES REPRESENTED
Morocco South AfricaIndia
Costa Rica
ArgentinaColumbia
Bulgaria
United StatesTunisia
Ghana
MexicoAustralia
Canada
Djibouti
Belgium
Turkey
Georgia
Luxembourg
Switzerland
Iran
Brazil

Let’s join our effortsAnother world is possible!
Thank you