Embed Size (px)
Citation preview

The Japanese Experience
Gavin CameronFriday 30 July 2004
Oxford University
Business Economics Programme

the Japanese Economy• Rapid growth until 1980s.• Economic “shocks” of 1980s and 1990s.• Is this really a “recession”?• Can policy fix it?

investment backlogs and reconstruction• The war provided a big shock to capital: in Japan 81% of
shipping, 34% of industrial machinery and 25% of dwellings were destroyed.
• With a Cobb-Douglas production function (with a labour share of 0.7), a loss of a quarter of the capital stock reduces output by 8%.
• In addition, much of the capital that withstood the war was unusable for some time due to lack of fuel, parts, labour and transport. Or because it needed to be converted from wartime to civilian uses. If we say that a quarter of the workforce was temporarily displaced and only a quarter of the capital stock could be used immediately, output would be reduced to 54% of its pre-War level.
• Therefore the rapid rises back to pre-War levels largely due to capital and labour being redeployed and brought back into use.
• Of course, that still leaves the actual loss of capital and the ‘missed years’ to be replaced and doesn’t explained the prodigious post 1955 growth.

long-run Japanese performance
log TFP in Japanese Aggregate Manufacturing relative to USA
-0.60
-0.50
-0.40
-0.30
-0.20
-0.10
0.00
0.10
0.20
1955 1960 1965 1970 1975 1980 1985 1990 1995
High Capital Grow th Low Capital Grow th Old Data

Japanese industrial performance
Table 1 Relative TFP Level of Japanese Industry (US=100)
1955 1973 1980 1989 1998 Total 60.5 87.8 102.6 104.9 90.2
Food 73.5 84.4 82.1 75.9 68.3 Textiles 57.2 69.4 69.6 56.4 44.7 Paper 65.0 95.4 103.4 118.7 102.7 Chemicals 76.3 89.5 119.6 134.7 125.5 Minerals 42.2 70.8 78.1 79.3 68.8 Primary Metals 57.0 98.5 123.8 123.5 109.7 Metal Products 39.3 75.7 74.0 81.9 75.9 Machinery 40.6 86.1 107.9 91.2 n/a Electricals 50.5 100.0 125.5 132.3 n/a Transport 40.3 85.3 98.2 104.3 97.1 Instruments 37.4 80.1 94.3 95.2 95.3

accounting for Japanese growth
1950-1973 1973-1987GDP 9.27 3.73Augmented factor input 5.44 2.95TFP 3.83 0.78
Structural Effect 1.22 0.15Technology Diffusion 0.50 0.21Foreign Trade 0.38 0.18Scale Effect 0.28 0.11Energy Effect 0.00 -0.12Natural Resources 0.00 0.00
Total explained 2.38 0.17Residual TFP 1.45 0.61
Note: Data are annual compound growth rates.Source: Maddison (1991) table 5.19.

OECD macroeconomic performance
OECD EU USA JAPAN GERMANY FRANCE ITALY UKOutput Growth1960-1973 4.9 4.7 4.0 9.7 4.3 5.4 5.3 3.11973-1979 3.2 2.6 2.9 3.5 2.4 2.7 3.5 1.51979-1989 2.9 2.2 2.8 3.8 2.0 2.1 2.4 2.41989-1999 2.6 2.0 3.0 1.7 2.2 1.7 1.3 1.9Unemployment1960-1973 2.9 2.6 4.8 1.2 1.0 2.6 5.7 3.31973-1979 5.0 4.6 6.7 1.9 3.0 4.4 6.0 4.91979-1989 7.3 9.4 7.3 2.5 5.8 8.8 8.2 9.81989-1999 7.4 9.9 5.8 3.1 7.5 11.2 10.9 8.3Inflation1960-1973 3.9 4.1 3.1 6.1 3.4 4.9 4.9 4.81973-1979 8.8 9.6 7.8 9.5 4.6 11.1 16.7 15.61979-1989 5.4 6.6 5.3 2.5 2.8 7.5 11.4 7.01989-1999 2.7 3.4 2.4 1.0 2.4 2.1 4.6 3.8
Source: Economics of the OECD 2000 exam paper data tables 1, 4 and 5.

what happened to economic growth?• Growth fell in two “steps”: 1973 and 1991.• Since 1997 longest post-war recession: 6 quarters of
negative growth.• Four quarter recession in 2001.• Now growing slower than other OECD.• A large part of the decline is from productivity
performance.

three major interpretations• Succession of unfavourable shocks
• Japan’s structure hasn’t changed• Potential growth has sharply diminished
• catch-up is over; unfavourable demography; Japan’s model can’t adapt
• Elements of both which interact• shocks plus pessimism and uncertainty

1980s economic shocks• 1985-1989 the “bubble” economy.
• investment boom (excess capacity?)• land and asset prices• policy stance - loose money, tight fiscal (low
interest rates, capital outflow)• Persistent trade surpluses; tension with the US.

reverse shocks in 1990s• Yen appreciation from Plaza (1985 ) to 1996.• Monetary policy burst the bubble in 1991 - deliberate.• Massive loss of wealth.• Policy induced double-dip recession in 1991-95 and
1997-99.

fixed investment as % share GDP
△ △ △ △ △ △ △▽ ▽ ▽ ▽ ▽ ▽
2.0
4.0
6.0
8.0
10.0
12.0
14.0
16.0
18.0
20.0
22.0
2.0
4.0
6.0
8.0
10.0
12.0
14.0
16.0
18.0
20.0
22.0
Manufacturing
Non-manufacturing
All industries
70 71 72 73 74 75 76 77 78 79 80 81 82 83 84 85 86 87 88 89 90 91 92 93 94 95 96 97 98 99

Yen-Dollar Exchange Rate
0
50
100
150
200
250
300
19
80
19
80
19
81
19
82
19
83
19
84
19
85
19
85
19
86
19
87
19
88
19
89
19
90
19
90
19
91
19
92
19
93
19
94
19
95
19
95
19
96
19
97
19
98
19
99

Japanese Official Discount Rate
0
1
2
3
4
5
6
7
Pe
r ce
nt

more shocks in the 1990s• Large and rising government deficits and debt.• Ageing population - pension problems.• Financial market deregulation and demands for
further deregulation.• Banking “crisis”, bad loans and “credit crunch”.• Asian crisis of 1997-98.

but is this really a recession?• Where is potential growth, how bad is the recession?• Neoclassical, “supply-siders”: it’s a natural
adjustment.• OECD and IMF: potential has fallen to 1.5%, output
“gap” about 5%.• Krugman: potential is much higher 3% so “gap” is
much bigger.

what should be done?• First decide what the problem is
• Supply side: an economy with low potential?• Or demand side?
• If supply side …• main policy tool is deregulation• flexibility, restructuring, corporate governance• these are happening…slowly.
• If demand side …• Savings rate high, for last 10 years higher than
domestic investment.• Keynesian economy with insufficient demand.• Macro policy is the conventional remedy. Can it
work?

△ △ △ △ △ △ △▽ ▽ ▽ ▽ ▽ ▽
-10.0
-5.0
0.0
5.0
10.0
15.0
20.0
25.0
30.0
35.0
40.0
-10.0
-5.0
0.0
5.0
10.0
15.0
20.0
25.0
30.0
35.0
40.0
Saving-Investment Balance
Private investment
Private surplus
Private savings
General govt deficit

9.2
9.7
10.2
10.7
11.2
11.7
12.2
1994 1995 1996 1997 1998 1999
-4
-2
0
2
4
6
Source: OEF
%1990 yen trillion
GDP growth
Public works
Public works and GDP growth cycle

what about monetary policy?• Nominal interest rates close to zero: what more?• Japan may be in “liquidity trap”• And worse, real interest rates are still positive • Crazy suggestions?
• Krugman wants positive inflation targets;• McKinnon wants Yen depreciation;• Bank of Japan has tried raising interest rates to
stimulate (i.e. to make banks lend money they need to be able to make profits on loans);
• Taxpayers pay for bailout of banking system.
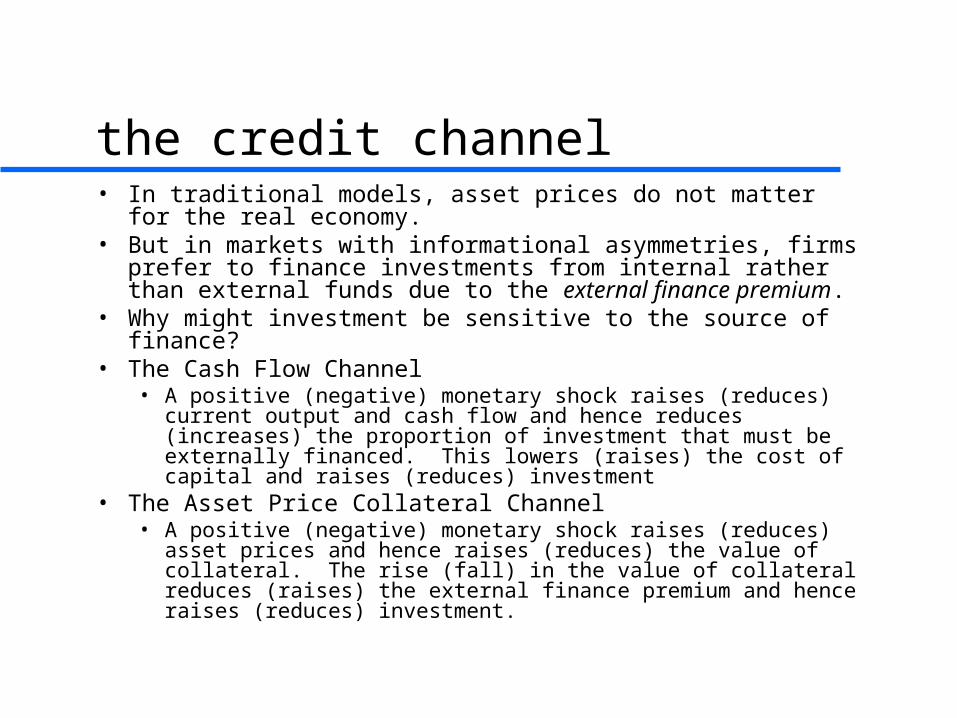
the credit channel• In traditional models, asset prices do not matter for the
real economy.• But in markets with informational asymmetries, firms
prefer to finance investments from internal rather than external funds due to the external finance premium.
• Why might investment be sensitive to the source of finance?
• The Cash Flow Channel• A positive (negative) monetary shock raises (reduces) current
output and cash flow and hence reduces (increases) the proportion of investment that must be externally financed. This lowers (raises) the cost of capital and raises (reduces) investment
• The Asset Price Collateral Channel• A positive (negative) monetary shock raises (reduces) asset
prices and hence raises (reduces) the value of collateral. The rise (fall) in the value of collateral reduces (raises) the external finance premium and hence raises (reduces) investment.

recent policy measures• In October 2002, BOJ announced that it would start to
purchase JGBs in order to raise liquidity in the money market – liquidity has doubled since then.
• Excess reserves held at the BOJ are running at about 34 trillion yen, up from their average of 5 trillion yen in 2000.
• Government adopted “policies” to resolve the non-performing loan (NPL) problem aimed at halving ratio of NPLs to total loans.
• In practice, since there is little new money to liquidate the NPLs, the policy is focussed on hastening the resolution of NPLs and has had little effect (except for a 2 trillion yen bailout of the former Daiwa bank).

summary• The traditional Japanese model had advantages.• But may have slowed down adjustment.• Labour system and corporate governance are
particularly slow to change.• This is not a coincidence.• And lack of dynamism in a major economy has effects:
• confidence• fear of policy impotence
• For example, see the debate in 2002-3 on possible deflation in the USA.

oecd forecasts
2000 2001 2002 2003 2004f 2005fPrivate consumption 0.5 1.7 0.9 1.1 1.7 1.5Government consumption 4.4 2.9 2.4 1.2 2 2.3Gross fixed investment 4.1 -2.3 -6.1 3.3 3.4 1.9Exports 12.5 -6.1 8.0 10.0 12.5 12.1Imports 9.4 0.1 1.9 4.9 6.9 7.2GDP at market prices 2.6 0.4 -0.3 2.7 3.0 2.8
Expansion gained momentum in late 2003, thanks to rising business investment, exports, and some private consumption. If growth continues, this could mark the end of deflation, however, continued falls in land prices and bank lending are a drag on activity.

what next?

syndicate topics• How did Japan grow so fast between 1945 and 1990?
Assess the contributions of high domestic saving, technology transfer, and the Japanese labour market and system of corporate governance.
• Is the Japanese recession a necessary correction to the bubble years of 1985 to 1990?
• What is a liquidity trap? What is a Ricardian debt trap? Is Japan trapped?
• Why are the Japanese such prodigious savers?• How can the Japanese banking crisis be resolved?