Embed Size (px)
Citation preview

THE JAMAICA PUBLIC SERVICE CO. LTD.
ANNUAL TARIFF ADJUSTMENT
SUBMISSION FOR 2013
April 3, 2013

1
Executive Summary
This submission is made in relation to the annual Performance-Based Rate-Making (PBRM)
tariff adjustment filing for 2013, in accordance with the All Island Electric Licence 2001 (the
Licence), Schedule 3, section 4, which states:
―The Licensee shall make annual filings to the Office at least sixty (60) days prior to the
Adjustment Date [June 1, 2013]. These filings shall include the support for the performance
indices, the CPI indices, and the proposed Non-Fuel Base Rates for electricity, and other
information as may be necessary to support such filings….‖
In accordance with the Licence and the OUR‘s September 18, 2009 Determination Notice, the
2013 annual non-fuel tariff adjustment will incorporate changes in relation to an annual
inflation adjustment, the resetting of the base foreign exchange rate and an X factor
adjustment; but it will not include any adjustments for the Q factor.
Additionally, although there was a natural disaster in 2012 (Hurricane Sandy), the damages
were fairly limited (approximately US$5 million) and, as such, could be resolved from the
Electricity Disaster Fund which now stands at approximately US$19 million as at the end of
March 2013 (after facilitating the US$5 million draw down mentioned above). As a result,
there will be no need for any Z-factor adjustment.
Recent Developments
In relation to the 2013 annual tariff submission, we wish to note that the continued viability of
JPS will be dependent on a change to the regulatory approach in relation to the recovery of
fuel costs. As a result of the significant under-recovery of fuel costs experienced in 2011 and
2012 (exceeding US$30 million in 2012 alone), JPS has been in financial breach of certain
loan covenants since March 2012. That breach is still on-going as at the end of March 2013
and has resulted in the auditors issuing a qualified audit opinion in the audited financial
statements of the Company, which casts severe doubt about the ability of the utility to
continue as a viable operation. As explained in more detail in the auditors‘ opinion to the
audited financial statements, this financial breach provides our lenders with the right to
demand the immediate repayment of the loan balances (principal and accrued interest)
amounting to US$430 million.
Supporting Customer Expectations, Achieving regulatory balance
In this filing JPS has sought to address the need to spur economic growth and development to
stimulate sales and retain large industrial loads that ultimately translates to keeping tariffs low
for all customers. Simultaneously, the Company is also seeking to adjust certain strictures in
the regulatory framework that is impairing the utility‘s ability to recover its fuel cost, an
underlying weakness in its continuing deteriorating financial performance. This relates
primarily to the target for the amount of energy loss in the transmission and distribution of
electricity. The majority of this energy is lost to the crime of electricity theft over which JPS
has very limited control. In this submission we are urging regulatory acceptance of that fact
and approval to allocate funds through state bodies that are better equipped to support a more
holistic approach to combatting electricity theft, including social intervention projects.

2
The 2013 Annual Adjustment filing tries to balance these objectives that all work together for
the objective of sustaining the long-term ability of JPS to meet customer expectations.
The proposals contained in the submission for which JPS is seeking regulatory approval are as
follows:
Application of the Annual Inflation Adjustment Factor
As per Schedule 3 of the Amended and Restated All-Island Electric Licence 2011, an annual
adjustment factor of 10.35% is determined to be applied to the total tariff basket for the 2013
annual adjustment. The adjustment in each tariff will be weighted, thus the adjustment across
rates will be dependent on their relative weights in relation to the total tariff basket.
Introduction of a Wholesale Tariff class
JPS is proposing the introduction of a Wholesale Tariff (WT) rate class for our largest
customers that represent approximately 20% of total sales. This will ensure that we provide a
stimulus for growth for such large industries, which in turn will create jobs and more energy
demand that ultimately lowers unit costs.
Qualifying customers must meet the following criteria:
1. Single point electricity supply with an average monthly demand of at least 1 MVA
during 2012 and total annual energy usage of at least 5,000,000 kWh;
2. Multiple points of electricity supply with an average monthly demand of at least 3
MVA during 2012 and total annual energy usage of at least 10,000,000 kWh;
3. For rate 20 customers (with no demand meter), total energy usage of at least
10,000,000 kWh during 2012. Additionally, customers who meet the criterion in item
2 above would also have their rate 20 supply qualifying for the Wholesale Tariff as
well.
Collectively this rate class would represent a 2.23% decrease out of the overall 10.35% (non-
fuel) annual adjustment factor.
Early Payment Incentive (EPI)
JPS is seeking regulatory approval for the introduction of an Early Payment Incentive (EPI)
that will reward customers who pay their bills in full and on time. This programme is in
response to a collective customer request for an alternative to disconnections. Therefore, as a
complementary element to this $250 incentive a similar value late payment fee has been
proposed that will allow an extended period for payment to be made before disconnection.
All our customer focus group surveys have found overwhelming support for this initiative and
so we anticipate regulatory approval of the programme.

3
Increase in the Standard Disconnection Fee
JPS proposes a 10% increase to the disconnection fee, from $1,500 to $1,650 (plus GCT).
This request is made given that no increase has been granted to the disconnection fee since
2009. Please note that by contrast the cumulative Jamaican inflation adjustment for the last 3
annual tariff applications (2010 to 2013) has amounted to approximately 23%. Given the
complementary introduction of the early payment incentive and late payment fee this measure
is expected to have minimal impact on customers.
Illegal Reconnection Fee
For customers, who have not paid their outstanding balance within 30 days of the due date
and service was suspended and are subsequently found illegally reconnected, JPS is proposing
the introduction of a second fee (in addition to the disconnection/reconnection charge) of
$2,000 for an illegal reconnection. This is necessary for such offending customers, as JPS
often incurs additional cost to remove the service wire to prevent such customers from
illegally reconnecting themselves.
Adjustment to the Fuel Weights
All customers currently pay the same standard fuel rate except for TOU customers who pay
adjusted rates based on their actual time of use. JPS proposes two changes to the fuel weights
with a view to giving a volume discount for the largest users of electricity (and thus fuel) on
the grid, as well as to provide a further discount to shift more production to the off-peak time
band. Firstly, this will offer TOU customers a 20% discount (up from 13.1% previously) for
off-peak usage, while maintaining a 30% premium for on-peak usage and a 4.4% premium for
partial-peak use. Secondly, we propose amending the standard fuel rate from 1 to 0.96 for all
rate 40 and 50 customers (including the wholesale customers). We believe this 4% discount
is reasonable given that the consumption of these customer classes is typically several
hundred times larger than a typical residential customer and as such they should get some
volume discount on fuel.
Rebalancing Impact of proposals
JPS acknowledges that the collective effect of the adjustment in fuel cost recovery as well as
the Wholesale Tariff to large industrial customers and the annual inflation reconciliation will
inevitably result in some tariff rebalancing among customer classes. We have done
everything possible to keep this impact to a minimum for all customers. Indeed, by taking
advantage of the EPI, the overall bill impact as a result of all of the proposed adjustments
would be an average increase of 0.26% for residential customers, which represent a J$16
increase in the monthly bill of a typical residential customer.
This will not only provide greater assurance of the viability of the utility sector and help
industrial customers lead the revival of the Jamaican economy, it will also provide the
financial stability needed for new generation projects to proceed thereby leading to the
substantial reductions in the cost of energy for all of our customers.

4
Glossary
ABNF - Adjusted Non-fuel base rate
CIS - Customer Information System
CPI - Consumer Price Index
EDF - Electricity Disaster Fund
GDP - Gross Domestic Product
GOJ - Government of Jamaica
GWh - Gigawatt-hours
IPP - Independent Power Purchase
kVA - Kilo Volt Amperes
kWh - Kilowatt-hours
Licence - The All Island Electric Licence 2001
MVA - Mega Volt Amperes
MW - Megawatt
MWh - Megawatt-hours
NWC - National Water Commission
O&M - Operating and Maintenance
OCC - Opportunity Cost of Capital
PATH - Programme of Advancement Through Health and Education
PIOJ - Planning Institute of Jamaica
PBRM - Performance Based Rate-Making Mechanism
RAMI - Residential Advanced Metering Infrastructure
REP - Rural Electrification Programme Limited
RPD - Revenue Protection Department
T&D - Transmission & Distribution
TOU - Time of Use
5
Table of Contents
PREAMBLE.......................................................................... ERROR! BOOKMARK NOT DEFINED.
GLOSSARY ............................................................................................................................................ 4
SECTION 1: PBRM ANNUAL ADJUSTMENT ........................................................................ 6
1.1. Overview ............................................................................................................................................ 6
1.2. Current year annual inflation adjustment factor (dI – X) .................................................................... 7
1.3. Application of the Annual Inflation Adjustment Factor ...................................................................... 8
1.4 Other annual tariff adjustments ....................................................................................................... 13
SECTION 2: OVERVIEW OF EXISTING FUEL EFFICIENCY TARGETS........................ 16
2.1. Introduction ..................................................................................................................................... 16
2.2. Heat Rate target ............................................................................................................................... 17
2.3. System Losses Target ........................................................................................................................ 18
SECTION 3: ENSURING QUALITY OF SERVICE: THE Q-FACTOR ..................................... 23
3.1 Introduction ..................................................................................................................................... 23
3.2. Baseline Setting for SAIDI, SAIFI and CAIDI ....................................................................................... 24
3.3. JPS System Reliability Improvement Programme ............................................................................. 24
3.4. Past 5 Years Performance on SAIDI, SAIFI and CAIDI ........................................................................ 26
APPENDIX I: U.S. AND JAMAICAN CONSUMER PRICE INDICES ........................................ 28
APPENDIX II: ESTIMATED BILL IMPACT OF ANNUAL TARIFF ADJUSTMENT ............ 30
APPENDIX III: JPS COMPREHENSIVE LOSS REDUCTION STRATEGIES ......................... 37
APPENDIX IV: OUTAGE MANAGEMENT SYSTEM IMPLEMENTATION STATUS .......... 59
APPENDIX V: FUEL WEIGHTS ..................................................................................................... 65
6
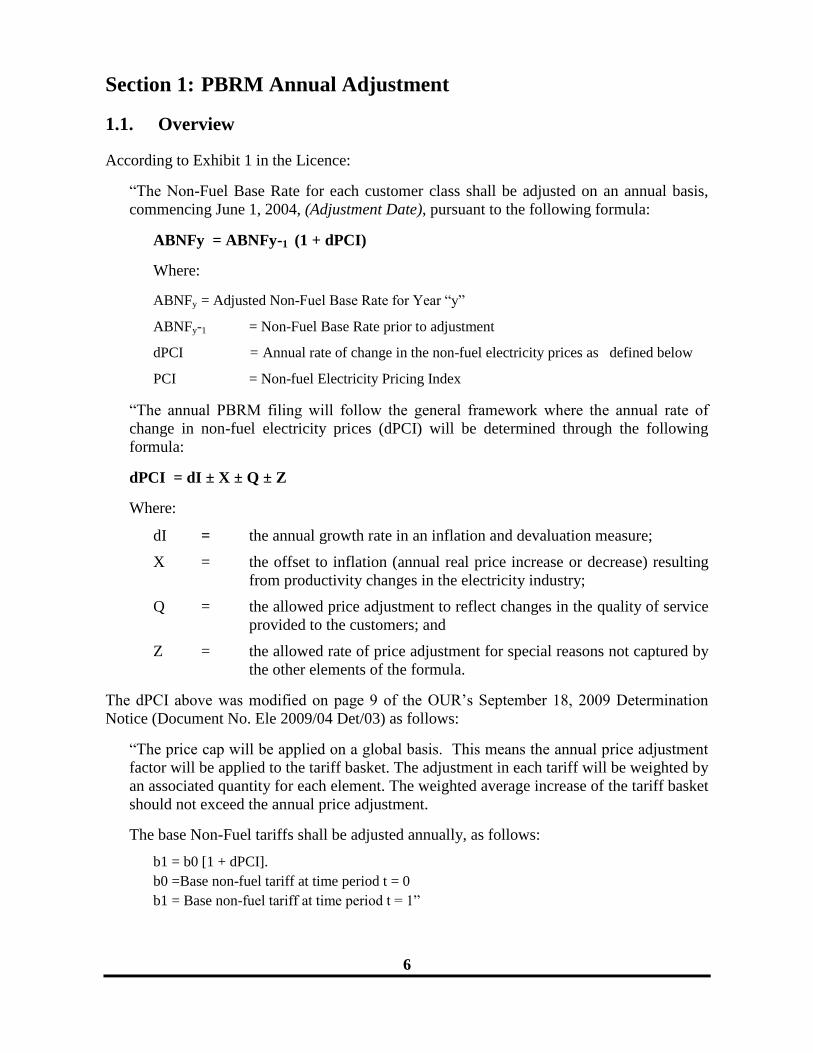
Section 1: PBRM Annual Adjustment
1.1. Overview
According to Exhibit 1 in the Licence:
―The Non-Fuel Base Rate for each customer class shall be adjusted on an annual basis,
commencing June 1, 2004, (Adjustment Date), pursuant to the following formula:
ABNFy = ABNFy-1 (1 + dPCI)
Where:
ABNFy = Adjusted Non-Fuel Base Rate for Year ―y‖
ABNFy-1 = Non-Fuel Base Rate prior to adjustment
dPCI = Annual rate of change in the non-fuel electricity prices as defined below
PCI = Non-fuel Electricity Pricing Index
―The annual PBRM filing will follow the general framework where the annual rate of
change in non-fuel electricity prices (dPCI) will be determined through the following
formula:
dPCI = dI ± X ± Q ± Z
Where:
dI = the annual growth rate in an inflation and devaluation measure;
X = the offset to inflation (annual real price increase or decrease) resulting
from productivity changes in the electricity industry;
Q = the allowed price adjustment to reflect changes in the quality of service
provided to the customers; and
Z = the allowed rate of price adjustment for special reasons not captured by
the other elements of the formula.
The dPCI above was modified on page 9 of the OUR‘s September 18, 2009 Determination
Notice (Document No. Ele 2009/04 Det/03) as follows:
―The price cap will be applied on a global basis. This means the annual price adjustment
factor will be applied to the tariff basket. The adjustment in each tariff will be weighted by
an associated quantity for each element. The weighted average increase of the tariff basket
should not exceed the annual price adjustment.
The base Non-Fuel tariffs shall be adjusted annually, as follows:
b1 = b0 [1 + dPCI].
b0 =Base non-fuel tariff at time period t = 0
b1 = Base non-fuel tariff at time period t = 1‖
7
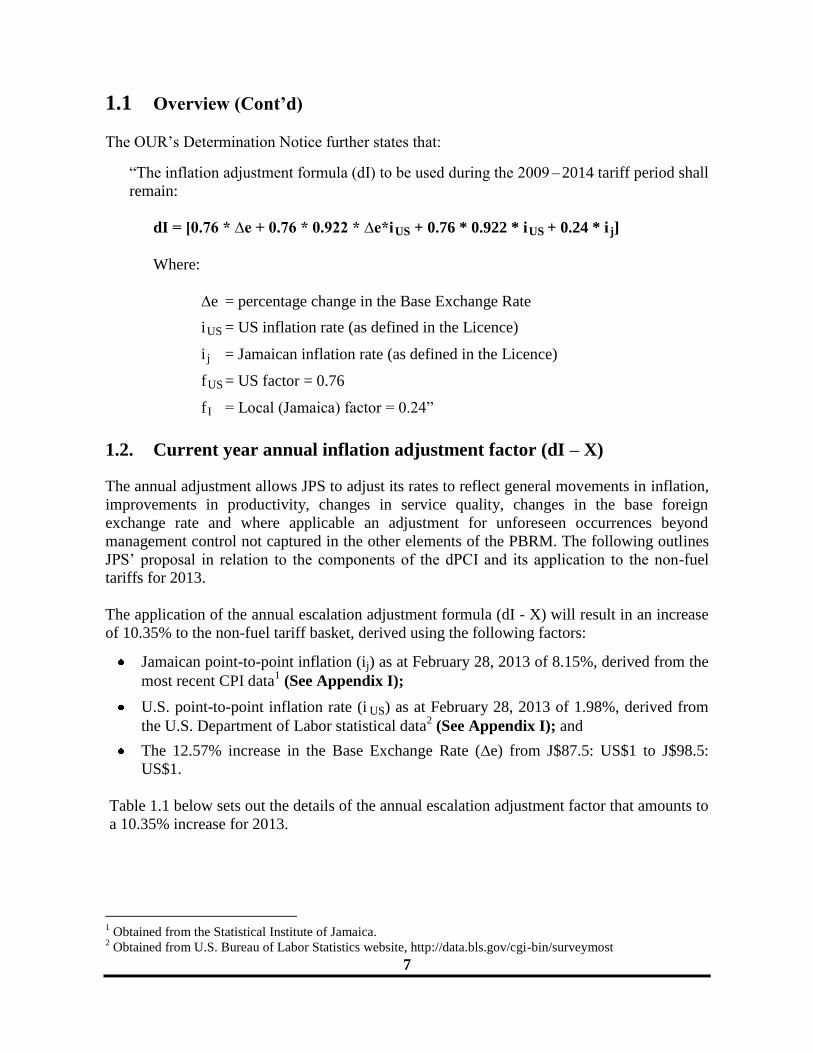
1.1 Overview (Cont’d)
The OUR‘s Determination Notice further states that:
―The inflation adjustment formula (dI) to be used during the 2009 – 2014 tariff period shall
remain:
dI = [0.76 * ∆e + 0.76 * 0.922 * ∆e*i US + 0.76 * 0.922 * i US + 0.24 * i j]
Where:
∆e = percentage change in the Base Exchange Rate
i US = US inflation rate (as defined in the Licence)
i j = Jamaican inflation rate (as defined in the Licence)
f US = US factor = 0.76
f I = Local (Jamaica) factor = 0.24‖
1.2. Current year annual inflation adjustment factor (dI – X)
The annual adjustment allows JPS to adjust its rates to reflect general movements in inflation,
improvements in productivity, changes in service quality, changes in the base foreign
exchange rate and where applicable an adjustment for unforeseen occurrences beyond
management control not captured in the other elements of the PBRM. The following outlines
JPS‘ proposal in relation to the components of the dPCI and its application to the non-fuel
tariffs for 2013.
The application of the annual escalation adjustment formula (dI - X) will result in an increase
of 10.35% to the non-fuel tariff basket, derived using the following factors:
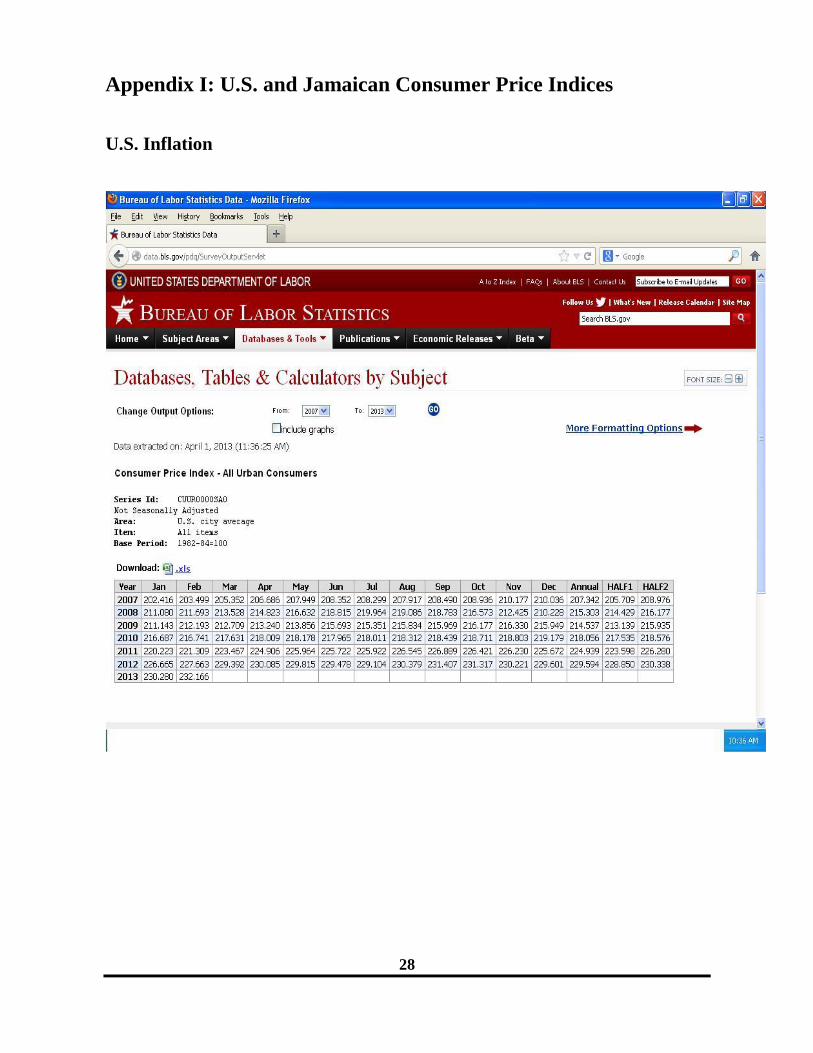
Jamaican point-to-point inflation (ij) as at February 28, 2013 of 8.15%, derived from the
most recent CPI data1 (See Appendix I);
U.S. point-to-point inflation rate (i US) as at February 28, 2013 of 1.98%, derived from
the U.S. Department of Labor statistical data2 (See Appendix I); and
The 12.57% increase in the Base Exchange Rate (∆e) from J$87.5: US$1 to J$98.5:
US$1.
Table 1.1 below sets out the details of the annual escalation adjustment factor that amounts to
a 10.35% increase for 2013.
1 Obtained from the Statistical Institute of Jamaica.
2 Obtained from U.S. Bureau of Labor Statistics website, http://data.bls.gov/cgi-bin/surveymost
8
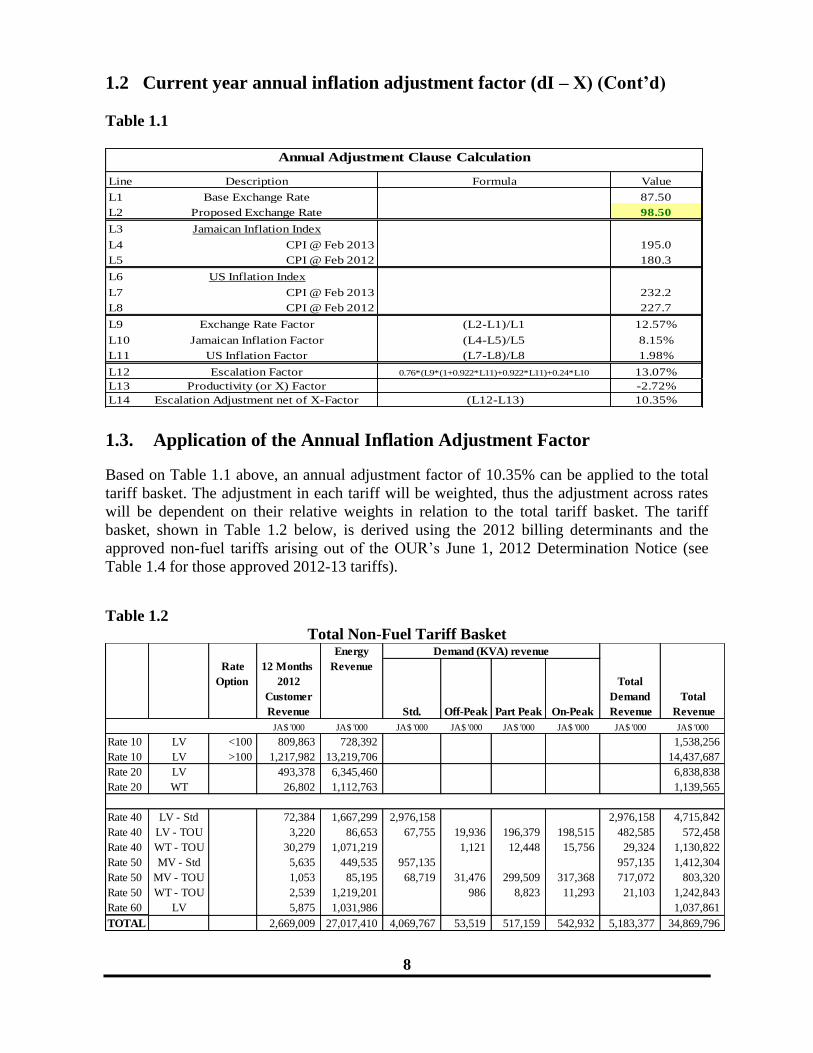
1.2 Current year annual inflation adjustment factor (dI – X) (Cont’d)
Table 1.1
1.3. Application of the Annual Inflation Adjustment Factor
Based on Table 1.1 above, an annual adjustment factor of 10.35% can be applied to the total
tariff basket. The adjustment in each tariff will be weighted, thus the adjustment across rates
will be dependent on their relative weights in relation to the total tariff basket. The tariff
basket, shown in Table 1.2 below, is derived using the 2012 billing determinants and the
approved non-fuel tariffs arising out of the OUR‘s June 1, 2012 Determination Notice (see
Table 1.4 for those approved 2012-13 tariffs).
Table 1.2
Total Non-Fuel Tariff Basket
Line
L1
L2
L3
L4
L5
L6
L7
L8
L9
L10
L11
L12
L13
L14
Annual Adjustment Clause Calculation
Description Formula Value
Base Exchange Rate 87.50
Proposed Exchange Rate 98.50
Jamaican Inflation Index
CPI @ Feb 2013 195.0
CPI @ Feb 2012 180.3
US Inflation Index
CPI @ Feb 2013 232.2
CPI @ Feb 2012 227.7
Exchange Rate Factor (L2-L1)/L1 12.57%
Jamaican Inflation Factor (L4-L5)/L5 8.15%
US Inflation Factor (L7-L8)/L8 1.98%
Escalation Factor 0.76*(L9*(1+0.922*L11)+0.922*L11)+0.24*L10 13.07%
Productivity (or X) Factor -2.72%
Escalation Adjustment net of X-Factor (L12-L13) 10.35%
Energy
Rate 12 Months Revenue
Option 2012 Total
Customer
Revenue Std. Off-Peak Part Peak On-Peak
Demand
Revenue
Total
Revenue
JA$ '000 JA$ '000 JA$ '000 JA$ '000 JA$ '000 JA$ '000 JA$ '000 JA$ '000
Rate 10 LV <100 809,863 728,392 1,538,256
Rate 10 LV >100 1,217,982 13,219,706 14,437,687
Rate 20 LV 493,378 6,345,460 6,838,838
Rate 20 WT 26,802 1,112,763 1,139,565
Rate 40 LV - Std 72,384 1,667,299 2,976,158 2,976,158 4,715,842
Rate 40 LV - TOU 3,220 86,653 67,755 19,936 196,379 198,515 482,585 572,458
Rate 40 WT - TOU 30,279 1,071,219 1,121 12,448 15,756 29,324 1,130,822
Rate 50 MV - Std 5,635 449,535 957,135 957,135 1,412,304
Rate 50 MV - TOU 1,053 85,195 68,719 31,476 299,509 317,368 717,072 803,320
Rate 50 WT - TOU 2,539 1,219,201 986 8,823 11,293 21,103 1,242,843
Rate 60 LV 5,875 1,031,986 1,037,861
TOTAL 2,669,009 27,017,410 4,069,767 53,519 517,159 542,932 5,183,377 34,869,796
Demand (KVA) revenue
9
1.3 Application of the Annual Inflation Adjustment Factor (Cont’d)
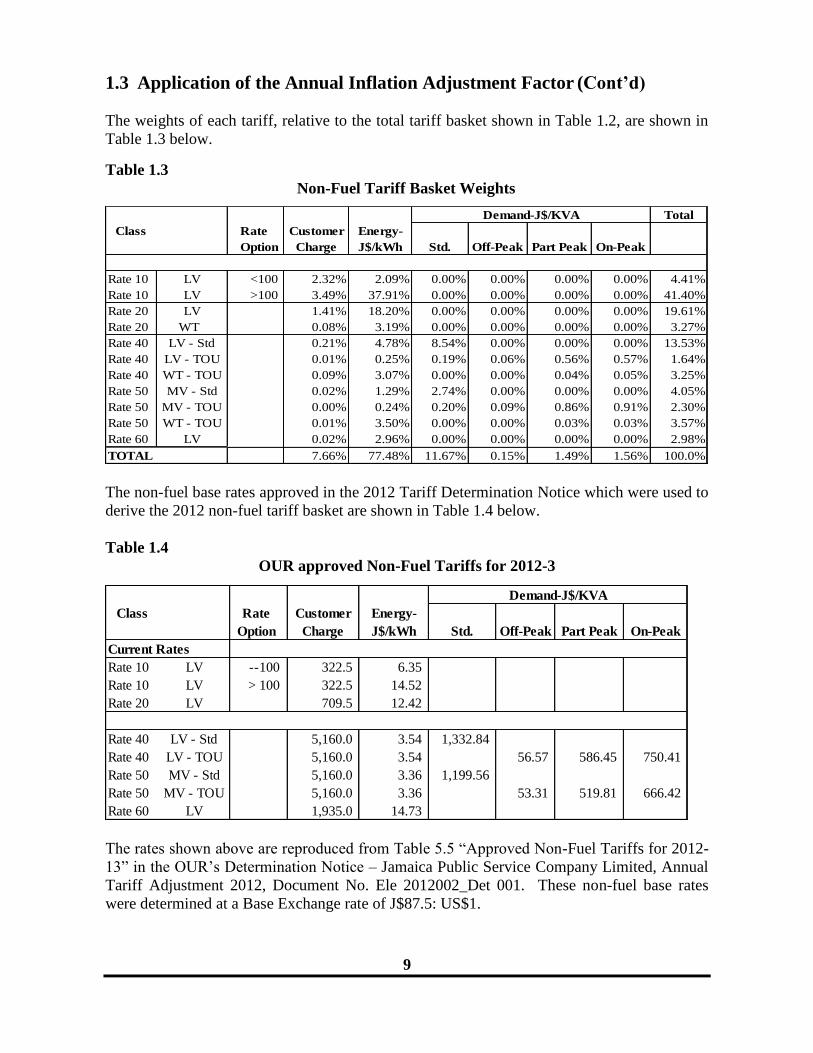
The weights of each tariff, relative to the total tariff basket shown in Table 1.2, are shown in
Table 1.3 below.
Table 1.3
Non-Fuel Tariff Basket Weights
The non-fuel base rates approved in the 2012 Tariff Determination Notice which were used to
derive the 2012 non-fuel tariff basket are shown in Table 1.4 below.
Table 1.4
OUR approved Non-Fuel Tariffs for 2012-3
The rates shown above are reproduced from Table 5.5 ―Approved Non-Fuel Tariffs for 2012-
13‖ in the OUR‘s Determination Notice – Jamaica Public Service Company Limited, Annual
Tariff Adjustment 2012, Document No. Ele 2012002_Det 001. These non-fuel base rates
were determined at a Base Exchange rate of J$87.5: US$1.
Total
Class Rate Customer
Option Charge J$/kWh Std. Off-Peak Part Peak On-Peak
Rate 10 LV <100 2.32% 2.09% 0.00% 0.00% 0.00% 0.00% 4.41%
Rate 10 LV >100 3.49% 37.91% 0.00% 0.00% 0.00% 0.00% 41.40%
Rate 20 LV 1.41% 18.20% 0.00% 0.00% 0.00% 0.00% 19.61%
Rate 20 WT 0.08% 3.19% 0.00% 0.00% 0.00% 0.00% 3.27%
Rate 40 LV - Std 0.21% 4.78% 8.54% 0.00% 0.00% 0.00% 13.53%
Rate 40 LV - TOU 0.01% 0.25% 0.19% 0.06% 0.56% 0.57% 1.64%
Rate 40 WT - TOU 0.09% 3.07% 0.00% 0.00% 0.04% 0.05% 3.25%
Rate 50 MV - Std 0.02% 1.29% 2.74% 0.00% 0.00% 0.00% 4.05%
Rate 50 MV - TOU 0.00% 0.24% 0.20% 0.09% 0.86% 0.91% 2.30%
Rate 50 WT - TOU 0.01% 3.50% 0.00% 0.00% 0.03% 0.03% 3.57%
Rate 60 LV 0.02% 2.96% 0.00% 0.00% 0.00% 0.00% 2.98%
TOTAL 7.66% 77.48% 11.67% 0.15% 1.49% 1.56% 100.0%
Energy-
Demand-J$/KVA
Class Rate Customer
Option Charge J$/kWh Std. Off-Peak Part Peak On-Peak
Current Rates
Rate 10 LV --100 322.5 6.35
Rate 10 LV > 100 322.5 14.52
Rate 20 LV 709.5 12.42
Rate 40 LV - Std 5,160.0 3.54 1,332.84
Rate 40 LV - TOU 5,160.0 3.54 56.57 586.45 750.41
Rate 50 MV - Std 5,160.0 3.36 1,199.56
Rate 50 MV - TOU 5,160.0 3.36 53.31 519.81 666.42
Rate 60 LV 1,935.0 14.73
Energy-
Demand-J$/KVA
10
1.3 Application of the Annual Inflation Adjustment Factor (Cont’d)
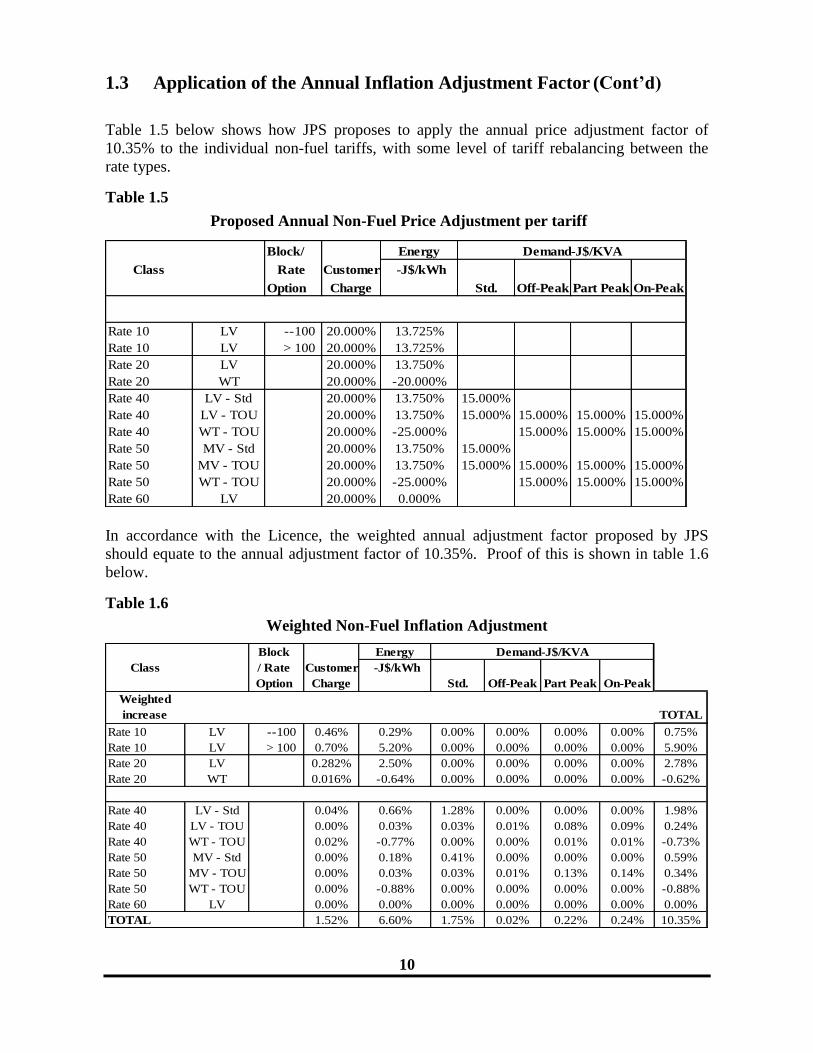
Table 1.5 below shows how JPS proposes to apply the annual price adjustment factor of
10.35% to the individual non-fuel tariffs, with some level of tariff rebalancing between the
rate types.
Table 1.5
Proposed Annual Non-Fuel Price Adjustment per tariff
In accordance with the Licence, the weighted annual adjustment factor proposed by JPS
should equate to the annual adjustment factor of 10.35%. Proof of this is shown in table 1.6
below.
Table 1.6
Weighted Non-Fuel Inflation Adjustment
Block/ Energy
Class Rate Customer -J$/kWh
Option Charge Std. Off-Peak Part Peak On-Peak
Rate 10 LV --100 20.000% 13.725%
Rate 10 LV > 100 20.000% 13.725%
Rate 20 LV 20.000% 13.750%
Rate 20 WT 20.000% -20.000%
Rate 40 LV - Std 20.000% 13.750% 15.000%
Rate 40 LV - TOU 20.000% 13.750% 15.000% 15.000% 15.000% 15.000%
Rate 40 WT - TOU 20.000% -25.000% 15.000% 15.000% 15.000%
Rate 50 MV - Std 20.000% 13.750% 15.000%
Rate 50 MV - TOU 20.000% 13.750% 15.000% 15.000% 15.000% 15.000%
Rate 50 WT - TOU 20.000% -25.000% 15.000% 15.000% 15.000%
Rate 60 LV 20.000% 0.000%
Demand-J$/KVA
Block Energy
Class / Rate Customer -J$/kWh
Option Charge Std. Off-Peak Part Peak On-Peak
Weighted
increase TOTAL
Rate 10 LV --100 0.46% 0.29% 0.00% 0.00% 0.00% 0.00% 0.75%
Rate 10 LV > 100 0.70% 5.20% 0.00% 0.00% 0.00% 0.00% 5.90%
Rate 20 LV 0.282% 2.50% 0.00% 0.00% 0.00% 0.00% 2.78%
Rate 20 WT 0.016% -0.64% 0.00% 0.00% 0.00% 0.00% -0.62%
Rate 40 LV - Std 0.04% 0.66% 1.28% 0.00% 0.00% 0.00% 1.98%
Rate 40 LV - TOU 0.00% 0.03% 0.03% 0.01% 0.08% 0.09% 0.24%
Rate 40 WT - TOU 0.02% -0.77% 0.00% 0.00% 0.01% 0.01% -0.73%
Rate 50 MV - Std 0.00% 0.18% 0.41% 0.00% 0.00% 0.00% 0.59%
Rate 50 MV - TOU 0.00% 0.03% 0.03% 0.01% 0.13% 0.14% 0.34%
Rate 50 WT - TOU 0.00% -0.88% 0.00% 0.00% 0.00% 0.00% -0.88%
Rate 60 LV 0.00% 0.00% 0.00% 0.00% 0.00% 0.00% 0.00%
TOTAL 1.52% 6.60% 1.75% 0.02% 0.22% 0.24% 10.35%
Demand-J$/KVA
11
1.3 Application of the Annual Inflation Adjustment Factor (Cont’d)
Proposed Introduction of Wholesale Tariffs
Please note that the annual tariff adjustment includes the proposed introduction of a new
Wholesale Tariff (WT) class for qualifying rate 20, 40 and 50 customers. We believe this can
be accommodated as part of the annual tariff rebalancing exercise provided the total tariff
increase does not exceed the global price cap of 10.35% and this new customer class is clearly
defined.
Table 1.5 shows the proposed reduction in the tariffs for such qualifying WT customers, while
Table 1.6 shows their total weighting in the overall 10.35% increase in the tariff basket.
Please note (from Table 1.6) that they collectively represent a 2.23% decrease out of the
overall 10.35% annual increase that is required.
It is our analysis that a volume discount is required to the tariffs for the largest users of energy
and demand on the network. This is consistent with the lower tariffs for rate 40 and 50
customers relative to rate 20 customers. However, the rate 40 category starts at 25 KVA and
does not provide any further volume discount for customers with demand which is 40 times
larger (i.e. 1 MVA). The introduction of the Wholesale Tariff seeks to address this deficiency
for customers with demand exceeding 1 MVA.
We analysed the complete set of billing determinants for 2012 for each of our customers who
met the following criteria:
4. Single point electricity supply with an average monthly demand of at least 1 MVA
during 2012 and total annual energy usage of at least 5,000,000 kWh;
5. Multiple points of electricity supply with an average monthly demand of at least 3
MVA during 2012 and total annual energy usage of at least 10,000,000 kWh;
6. For rate 20 customers (with no demand meter), total energy usage of at least
10,000,000 kWh during 2012. Additionally, customers who meet the criterion in item
2 above would also have their rate 20 supply qualifying for the Wholesale Tariff as
well.
The qualifying list of customers meeting the above criteria (who represent approximately 18%
of total sales) will be supplied to the OUR under confidential cover.
We are confident that this kind of tariff rebalancing is to the overall benefit of all the network
users. It provides an incentive for these customers with the potential to self-generate to
remain on the grid thereby keeping downward pressure on per unit cost for all other customers
using the network. It is also critical to spurring economic development in Jamaica at this time
and to ensuring growth in these critical businesses that use a substantial amount of energy.
These qualifying WT customers (as shown in a typical bill provided in Appendix II) have a
monthly electricity bill that is typically $29 million per month (at the lowest level for rate 20),
which is substantially larger than the typical rate 20 customer (who has a $75,000 per month
bill) or a rate 10 customer ($6,300 per month bill). The larger WT customers will have
monthly electricity bills ranging from $50 - $400 million per month.
We are also motivated by the fact that the failure to introduce a Wholesale Tariff will result in
some of these customers leaving the grid (or possibly going out of business) which will
12
1.3 Application of the Annual Inflation Adjustment Factor (Cont’d)
necessarily increase the cost of electricity for all remaining customers on the grid and further
hurt the economic development of the country.
We recommend that new entrants be added to this customer class only once per year as part of
the annual tariff submission, based on their past 12-month consumption record and subject to
regulatory approval.
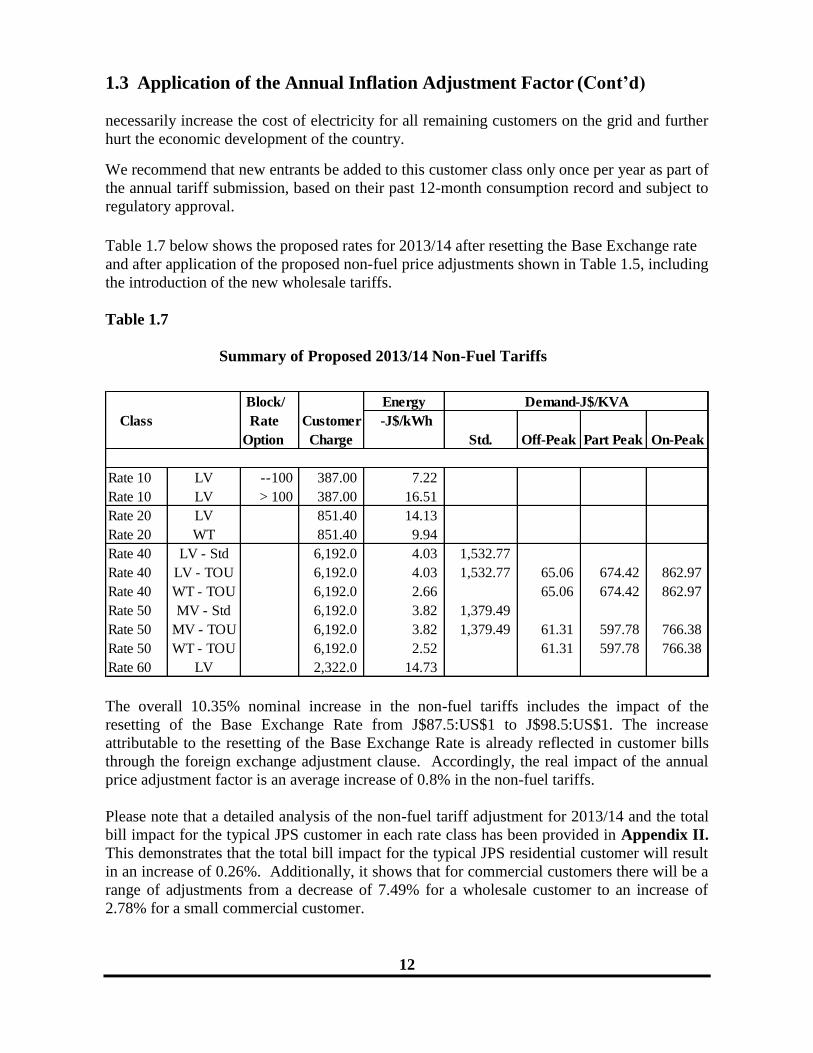
Table 1.7 below shows the proposed rates for 2013/14 after resetting the Base Exchange rate
and after application of the proposed non-fuel price adjustments shown in Table 1.5, including
the introduction of the new wholesale tariffs.
Table 1.7
Summary of Proposed 2013/14 Non-Fuel Tariffs
The overall 10.35% nominal increase in the non-fuel tariffs includes the impact of the
resetting of the Base Exchange Rate from J$87.5:US$1 to J$98.5:US$1. The increase
attributable to the resetting of the Base Exchange Rate is already reflected in customer bills
through the foreign exchange adjustment clause. Accordingly, the real impact of the annual
price adjustment factor is an average increase of 0.8% in the non-fuel tariffs.
Please note that a detailed analysis of the non-fuel tariff adjustment for 2013/14 and the total
bill impact for the typical JPS customer in each rate class has been provided in Appendix II.
This demonstrates that the total bill impact for the typical JPS residential customer will result
in an increase of 0.26%. Additionally, it shows that for commercial customers there will be a
range of adjustments from a decrease of 7.49% for a wholesale customer to an increase of
2.78% for a small commercial customer.
Block/ Energy
Class Rate Customer -J$/kWh
Option Charge Std. Off-Peak Part Peak On-Peak
Rate 10 LV --100 387.00 7.22
Rate 10 LV > 100 387.00 16.51
Rate 20 LV 851.40 14.13
Rate 20 WT 851.40 9.94
Rate 40 LV - Std 6,192.0 4.03 1,532.77
Rate 40 LV - TOU 6,192.0 4.03 1,532.77 65.06 674.42 862.97
Rate 40 WT - TOU 6,192.0 2.66 65.06 674.42 862.97
Rate 50 MV - Std 6,192.0 3.82 1,379.49
Rate 50 MV - TOU 6,192.0 3.82 1,379.49 61.31 597.78 766.38
Rate 50 WT - TOU 6,192.0 2.52 61.31 597.78 766.38
Rate 60 LV 2,322.0 14.73
Demand-J$/KVA
13
1.3 Application of the Annual Inflation Adjustment Factor (Cont’d)
Section 1.4 that follows discusses some additional requested changes as part of the annual
tariff adjustment application. This includes the introduction of a $250 early payment
incentive / late payment fee for residential customers and the changing of the fuel weights for
the calculation of the fuel tariffs for rate 40 and 50 customers. The price reductions noted
above are after taking into consideration the additional adjustments proposed in Section 1.4.
1.4 Other annual tariff adjustments
Early Payment Incentive/ Late Payment fee
JPS proposes the introduction of an early payment incentive/late payment fee of $250 for
residential customers only.
Residential customers who pay their bills in full and on time will receive the early payment
incentive. This will be applied to their bills in the following month. Those customers who
pay their bill after the due date will be charged the late payment fee, also to be applied to their
bill in the following month. This creates a $500 incentive to pay on time. This is an
important initiative given that JPS does not charge residential customers interest for normal
arrears and it typically has arrears exceeding $1 billion in total for residential customers.
We believe this will help to positively reduce total receivables thus reducing the amount that
is included in the rate base, which tends to have an upward pressure on tariffs. It also
allocates a direct charge to customers who are tardy.
This will also provide a more customer friendly way to dealing with late payments rather than
having the threat of disconnection as the only option. In this regard, we therefore propose a 7
day grace period for customers who are late with their bill payments before resorting to
disconnections.
Further, we propose providing up to 15 days grace before resorting to disconnections for
residential customers who have an adequate security deposit in place (i.e. equal to one
month‘s electricity consumption). Consideration will be given to customers with an excellent
past payment record at the Company‘s discretion.
Bill Payment Notification & Payment Channels
These proposals are made in the context of the significant improvement in customer
awareness and notification of their billing cycle and the vast expansion in payment channels
now available to customers for timely and convenient settlement of their invoices.
Over the last two years we have regularised customer billing periods so customers are now
accustomed to a consistent and known due date. Additionally, we now have a database of
telephone numbers or email addresses for 60% and growing, of our customers and utilise a
text alert system to remind customers to pay their bill by the due date. There is a programme
to continually capture this customer contact information at points of communication through

14
1.4 Other annual tariff adjustments Cont’d
our Customer Care Centre or office visits. We have also re-launched our website to facilitate
on-line bill payments and bill query, so customers can easily check their bill balance and due
date.
We wish to emphasise that beyond the late payment fee a customer who anticipates a
difficulty making a payment on schedule and in full can enter into a payment arrangement
through the Customer Care Centre, or at a parish office, to avoid disconnection. This
arrangement should be made prior to the due date to avoid a disconnection being
automatically triggered.
Under this facility two payment arrangements are permitted per calendar year, whereby the
balance is paid in full within 30 days of the due date. This requirement is important to ensure
that receivables are kept to manageable levels, especially giving consideration to the fact that
fuel and the IPP payments represent approximately 80% of the total cost of electricity and JPS
must settle its obligations with these respective suppliers within 30 days. Failure to do so
necessarily results in interest charges being levied on JPS and undue foreign exchange risk
given these obligations must be settled in U.S. currency.
Increase in the Standard Disconnection Fee
We hereby request a 10% increase to the disconnection fee, from $1,500 to $1,650 (plus
GCT). This request is made given that no increase has been granted to the disconnection fee
since 2009. Please note that by contrast the cumulative Jamaican inflation adjustment for the
last 3 annual tariff applications (2010 to 2013) has amounted to approximately 23%. By way
of reference only, we also wish to note that this fee is approximately half of the fee currently
approved by the OUR for the water utility for the disconnection of service.
Illegal Reconnection Fee
Additionally, for offending customers, who have not paid their outstanding balance within 30
days of the due date and whom JPS has found illegally reconnected, we propose the
introduction of a second fee of $2,000 for an illegal reconnection. This is necessary for such
offending customers, as JPS often has to resort to removing the entire service wire to prevent
such customers from illegally reconnecting themselves. This charge which is higher than and
is in addition to the standard disconnection/reconnection fee is necessary to reflect the higher
cost of doing this additional activity and to send strong price signals that curb such customer
tendencies that adds to commercial losses to the grid.
Adjustment to the Fuel Weights
As you are aware, all customers currently pay the same standard fuel rate except for TOU
customers who pay adjusted rates based on their actual time of use. The adjusted fuel weights
for the three buckets of energy use (off-peak, partial-peak and on-peak) are 0.869, 1.044 and
1.302, respectively. An amount greater than 1 implies a premium is being charged while an
amount less than 1 implies a discount is being given.

15
1.4 Other annual tariff adjustments (Cont’d)
JPS proposes two changes to the fuel weights with a view to giving a volume discount for the
largest users of electricity (and thus fuel) on the grid, as well as to incentivise more
production in the off-peak time band.
Firstly, we propose amending the off-peak weight from 0.869 to 0.800. We believe this is
reasonable given the TOU customer would be receiving a 20% discount (up from 13.1%
previously) for his off-peak usage, while still paying a 30% premium for his on-peak usage
and a 4.4% premium for his partial-peak use. This will provide a greater incentive to moving
production into the off-peak time band which will in turn result in a lower overall system peak
demand and lower fuel costs on average for all customers.
Secondly, we propose amending the standard fuel rate from 1 to 0.96 for all rate 40 and 50
customers (including the wholesale customers). We believe this 4% discount is reasonable
given that the consumption of these customer classes is typically several hundred times larger
than a typical residential customer and given the fuel component represents up to 80% of their
total bill, compared to 66% for a typical residential customer (please see examples of typical
bills in Appendix II). Again this is intended to provide some level of price reduction for the
largest users on the grid and to support economic growth and development for the country.
The proposed fuel weights are shown in Appendix V.

16
Section 2: Overview of Existing Fuel Efficiency Targets
2.1. Introduction
Currently, the recovery of fuel cost is subject to two efficiency measures: Heat Rate and
System Losses. If the Company fails to achieve the stipulated regulatory efficiency targets it
will experience an under-recovery of its fuel cost (i.e. a fuel penalty) and if it exceeds the
targets it can have a fuel gain. There is an increasing trend in the net fuel penalty over the last
3 years, growing from US$13 million in 2010 to US$36.5 million in 2012, with the Company
experiencing a net fuel penalty in every month since the losses target was reduced to 17.5% in
July 2011 (excluding November 2012 when force majeure relief was provided due to the
impact of hurricane Sandy).
It should be evident from the table above that the regulatory targets for system losses and heat
rate are completely out of sync with the actual performance of the utility.
It should also be evident that this level of fuel penalty is clearly not sustainable, nor is it
acting as a true incentive for improved efficiency. In fact, this level of fuel penalty will
simply precipitate the failure of JPS, a point which is now being underscored for the 3rd
time
in a row as part of the annual tariff adjustment submissions supported by the utility‘s
increasingly poorer financial results and the on-going financial covenant breaches.
To be abundantly clear, if the current framework is not changed, JPS will experience a net
fuel penalty exceeding US$30 million again in 2013 which would guarantee its failure as a
going concern.
17
New Approach Needed on Losses
It is impossible for JPS to substantially reduce system losses from the current levels of 25% in
the near future and without a complete redesign in the approach to addressing this crime. We
have included the details of our activities conducted during 2012 in Appendix III, which
represents our best efforts to reduce the theft of electricity and our plans for 2013. In section
2.3, we detail the challenges being experienced in this area and the recommendations for a
redesign to the approach to dealing with the ‗root cause‘ of the problem, which will require
the concerted effort of several government agencies working in conjunction with JPS. This
criminal activity must become a top priority for all of the relevant authorities, including the
police, the judiciary and the GOJ, if we are to have a sustainable programme designed to truly
eradicate the theft of electricity. JPS will never be able to deal with this problem on its own.
2.2. Heat Rate target
The objective of a good regulatory environment should be to provide the utility with
incentives to improve the relative efficiency of converting chemical energy to electrical
energy; and to ensure the economic dispatch of all available generation units. In addition to
the above, the OUR has stated that:
―…. the following principles should be applied in setting the heat rate target:
The target should hold JPS accountable for the factors which are under its direct control;
The target should adequately and realistically reflect the available and future (within the rate-cap
period) generating fleet‗s capabilities and legitimate constraints.‖
Currently, there exists a good regulatory framework around the economical dispatch of
generation units, however, JPS believes the only way to significantly reduce the heat rate
for the benefit of our customers will come from replacing old and inefficient generating
plant. In this regard, the OUR has informed JPS that it does not have the right to replace its
existing generation assets and instead we have spent the last three (3) to five (5) years
waiting on a clear signal from the OUR and GOJ that allows for new generation to be
introduced to the benefit all of Jamaicans. There is clearly a need to act now in this regard,
as all new generation plant will be 40 to 50% more efficient in terms of heat rate than the
current generation assets that need to be retired.
JPS also notes for the record its concern about the reliability of the existing generation
plants amounting to approximately 292 MWs of capacity, that were expected to be retired
in 2014. There can be no assurance that these plants will continue to be available for the
near future. In any event to keep them running will cost significant amounts in capital
expenditure and maintenance costs. In 2013 alone more than US$12 million will be spent
on these units, despite the clear need to retire them in the near future. However, at this
point in time, there is very little which can be done to improve the efficiency of these base-
load units as they are simply economically obsolete and inefficient by design.
As a result of the substantial uncertainty with regards to their reliability and availability,
and given how volatile the system-wide heat rate performance will be until new generation
18
expansion is added, we believe it is appropriate to suspend the heat rate target at this time,
in conjunction with our request for full pass-through of fuel costs.
Focus should be maintained on the economic dispatch of units to ensure the cost of fuel is
kept as low as possible. We believe there is no conflict in this regard, as JPS is incentivised
to keep the cost as low as possible bearing in mind the negative impact which high prices
have on our customers and thus on their ability to consume the services we are providing.
By way of reminder all future generation expansion projects will be implemented under an
IPP model with the IPPs being held to a contractual heat rate. All such IPPs will be third
party providers of electricity to JPS and, as such, it will not be appropriate for JPS to be
penalised as it relates to their heat rate performance. Already today, more than 33% of all
net generation is provided by IPPs and will only increase substantially in the near future as
new generation is added to the grid.
2.3. System Losses Target
It is important to understand that JPS is penalized for not meeting the system losses target
in several ways. Additionally, it is important to understand that there are several causes for
system losses, some which are outside of the control of the utility. Thirdly, in any fair
regulatory environment, the target should hold the utility accountable for things which are
under its control (as stated above for heat rate). Lastly, the target should be realistic if it is
to truly act as an incentive. This means it must bear some semblance to what is actually
achievable and properly count the costs required to achieve the target (i.e. cost benefit
analysis). These main principles are expanded on below.
The Three Ways the Company is Penalized for System Losses
1. The Company is penalized in its non-fuel revenues as a result of the OUR adjusting
the actual energy sales used to set the non-fuel tariffs in the first place. The actual
energy sales were adjusted for assumed sales growth (in relation to expected
additional sales from converting some electricity theft into actual sales), which
never actually materialized. That is to say, the electricity rates were not derived
based on the approved costs (i.e. the revenue requirement) divided by actual
energy sales but rather based on the approved costs divided by an adjusted energy
sale. The actual test year energy sales were 3,197.7 GWh in 2008 but 3,256 GWh
(which includes the sales growth assumption) was used to calculate the non-fuel
tariffs. This creates a regulatory stretch target for reducing losses which results in a
US$6.4 million annual penalty to the extent the adjusted energy sales did not
materialise.
2. To the extent that sales are actually shrinking (the more realistic projection since the
2009 rate case submission as a result of the global recession), even if losses
remained the same as a percentage of sales (something which is actually unlikely),
then the abovementioned US$6.4 million penalty would be increasing. This is a
function of the high fixed cost nature of non-fuel costs (where more than 70% of
costs do not vary with changing levels of production) and the fact that the tariffs are
not truly cost-reflective in this regard (only 21% of non-fuel tariffs are fixed in

19
nature). Since, it is the OUR that sets the tariffs, JPS cannot actually resolve this
fundamental problem on its own. The comparable level of energy sales to the 2009
determined tariffs was 3,015.8 GWh in 2012. All other things being equal, this
means the losses penalty on non-fuel tariffs would have grown to more than US$20
million per annum by 2012. This is further exacerbated by the fact that the utility is
expected to become 2.72% more efficient in 2013 (X-factor adjustment) despite the
expected shrinkage in sales; the high fixed cost nature of the business and poor
match with fixed-cost recovery in the form of the tariffs and its inability to replace
old ageing generation plant.
3. The losses penalty as it relates to the actual recovery of fuel costs. This penalty
again increases as sales shrink, given that losses are calculated as a percentage of
sales, and also increases as the price of oil increases. Since fuel is the straight
variable cost of production and represents 65% of the total cost of energy, we
believe that the full pass through is essential to ensure the viability of the utility.
This is extremely important in the context that in a typical year, the return (profit) of
the utility is not likely to be more than 2 - 3% of the total cost of electricity.
In the case of 2012, the fuel penalty actually represented 4% of the cost of fuel, thereby
virtually eliminating all of the operating profit of the utility in 2012.
Additionally, as demonstrated in the points that follow, we believe the losses target is more
appropriate as it relates to the non-fuel costs.
Technical Losses
The reasons for system losses will obviously vary depending on whether we are discussing
technical or non-technical losses.
In the case of technical losses, we believe an independent study is critical to confirming the
existing level of technical losses (to the satisfaction of the regulator) which we evaluate to
be approximately 10%. Additionally, this study would help to design a credible agreed
programme to achieve an optimal level of technical losses. The T&D system configuration
and voltage levels are critical to determining the actual level of technical losses. Further
reduction in technical losses will typically be as a result of capital intensive programmes
such as building more sub-stations or increasing the voltage level at which we transmit and
distribute electricity. As a result of the capital demand, a proper engineering study must be
conducted in order to determine the appropriate reconfiguration cost and expected benefits.
Additionally, such a study could identify any other corrective measures which could be
taken to improve technical losses. This would form the basis for a credible work program
which the regulator could then use as a basis for setting regulatory targets for desired levels
of technical losses, while also giving consideration to the required funding to achieve the
said targets. This process does not require the presence of a fuel penalty to be effective and
is typically driven by non-fuel costs at any rate. As mentioned previously, this loss target
could be incorporated into a stretch sales target for the purposes of determining the non-
fuel tariffs.
20
Independent Third Party Evaluation
On the instruction of the OUR, we engaged an international firm of consultants (KEMA) to
conduct the above engineering study and expect to submit the results of this study to the
OUR by April 15, 2013 to help guide the process of establishing a credible technical loss
reduction campaign. Thereafter, the OUR could indicate a clear path going forward for
achieving a reasonable regulatory target in relation to technical losses. This could be
embedded in a five year business plan which could be implemented as part of the 2014 – 19
tariff application process. We believe this is most appropriate given the substantial
resources that would likely be involved and the long planning horizon for reconfiguration
of a T&D network which also needs to be synchronized with future generation expansion
plans.
Additionally, given the current level of actual energy sales relative to the regulatory target,
we believe the US$20 million per annum penalty mentioned previously is a substantial
incentive for JPS to continue reducing losses in the near future. However, we believe there
will likely be the need for a greater provision for capital expenditure in the tariffs to
accomplish this feat but the engineering study will objectively confirm the best way
forward.
Non-Technical Losses
Non-technical losses are represented primarily by the theft of electricity. This may take
numerous forms including meter tampering, meter by-pass and the direct theft of service by
illegal consumers. Appendix III details the numerous strategies and activities that JPS is
undertaking in its efforts to reduce non-technical losses. However, the reality of the
situation is despite the growing fuel penalty being experienced by JPS (as shown previously
in Table 2.1), JPS has not been able to prevent the rising trend in losses over the last decade
and sharply accelerated over the last two years, despite its best efforts. The simple reason
for this is that the theft of electricity is a crime which JPS alone cannot prevent, any more
than the police force by itself can reduce crime in Jamaica. To resolve this particular act of
crime in Jamaica will require the concerted efforts of several government agencies
including the Police, PIOJ, REP, PATH, NWC, working in conjunction with the JPS. It
will also need the collective will and commitment of the GOJ demonstrated through strong
legislative and regulatory support to ensure more severe penalties for offenders and a
swifter path to justice.
Undoubtedly, this will require changes to legislation much in the same way changes are
being made to deal with the ‗lottery scam.‘ Today, the theft of electricity is costing the
country approximately US$60 million per annum in wasted fuel, another US$20 million in
foregone revenues for the utility and an annual budgetary expenditure of approximately
US$30 million to try to prevent/reduce this criminal act.
Social Intervention
JPS alone cannot get to the ‗root cause‘ of the problem and admittedly is not able to do the
necessary social intervention work required, or to enforce the law. It is obvious that one of
the visible current approach of pulling down illegal connections is simply not effective in

21
terms of reducing the theft of electricity as the benefits are quite short lived. Additionally,
it is also clear that our attempts to regularise communities through the implementation of
RAMI, requires a much more collective effort and is a longer term solution and is itself
dependent on social intervention if it is truly to be effective.
As provided in greater detail in our separate paper entitled ―A new way forward for Losses‖
we make the point that if we were to join forces with the relevant government authorities
under the direction of the PIOJ, and by including the NWC into this programme, a pool of
US$25 million per annum from existing funds between the two utilities could be available,
subject to regulatory approval, to implement a more holistic approach to regularising the
estimated 150,000 households which exist in informal settlements across Jamaica. This
programme would have elements of incentive as well as enforcement, inducement and
empowerment but supported by strong deterrents and sanctions. We believe this is the only
true way to reduce the theft of utility services (electricity and water) in Jamaica and to
create a culture where persons appreciate the need to pay for their basic utilities.
In summary, this programme would be funded to ensure a systematic approach is taken to
regularising impoverished communities all across the country, where one of their main
constraints is a lack of basic infrastructure. There is also clearly a need for a structured
social intervention programme to provide skills and jobs training, customer education and
financial assistance to help persons to be able to afford the utility services in the short term.
Community Renewal & Culture Change
There is also the need for community renewal work to be conducted aimed at improving
basic infrastructure in such communities. There is also proposed a need to increase the
policing and law enforcement in these communities to ensure that persons provided with
the opportunity and assistance to regularise themselves, are also held accountable for
upholding the law. In this regard, we also recommend legislative changes to the law to
facilitate the introduction of a special court to prosecute utility offenders. We believe a
credible programme funded jointly by the NWC and JPS would all these factors and look
forward to the speedy implementation with the assistance of the OUR and PIOJ.
Indeed, the only way we are truly going to reduce the level of crime in Jamaica, including
the theft of electricity and water, is by providing the basic infrastructure and education and
by changing the culture of our people. The theft of electricity is a crime and one which
costs the country dearly. As such, we believe a special purpose programme must be started
immediately which gives critical attention to addressing this problem to ensure the
sustainability of the utility sector.
Full Fuel Cost Pass-through
The pass-through of fuel costs is a fundamental condition for the survival of the electricity
sector that does not jeopardise accountability or creates moral hazard as appropriate
incentives already exist in the form of the non-fuel penalties. We also believe this is an
area which requires additional study in order to design a programme that serves the best
interest of all. As such, we will be working closely with the OUR and the PIOJ to design
and implement such a programme in the shortest possible time.

22
In the meantime, we implore the OUR to allow the full pass-through of fuel costs as of the
effective billing date of the Annual Adjustment Determination, July 1, 2013.
The analysis shows that this would create upward pressure of approximately 4% on fuel
costs in general with a marginal increase in the average residential customer‘s bill of less
than 0.5% or $16 per month as part of the annual tariff adjustment submission taking into
consideration all other adjustments and recommendations made (please refer to Appendix
II for details of the bill impact from the annual tariff application).
Without by any means trivialising or down playing the impact of any increase at all on our
customers, JPS suggests that customers stand to benefit substantially over the medium term
through a vibrant and viable JPS that can support generation expansion to significantly
lower cost and invest in the T&D network to improve service and reliability.
The successful implementation of a sustainable loss reduction program, aimed at
regularising 10,000 – 15,000 households per annum, will ultimately also result in a
substantial reduction in the cost of electricity for all. Admittedly, this will take some time
to regularise the 150,000 illegal users of electricity and water today., However, it is clear
that a structured programme of social intervention involving the GOJ that assist in
infrastructure build-out, income generation and a targeted, time bound and means-based
assistance programme backed by strong policing and effective laws stand a far better
chance of success than the current Lone Ranger approach thrust upon JPS.
23
Section 3: Ensuring Quality of Service: The Q-Factor
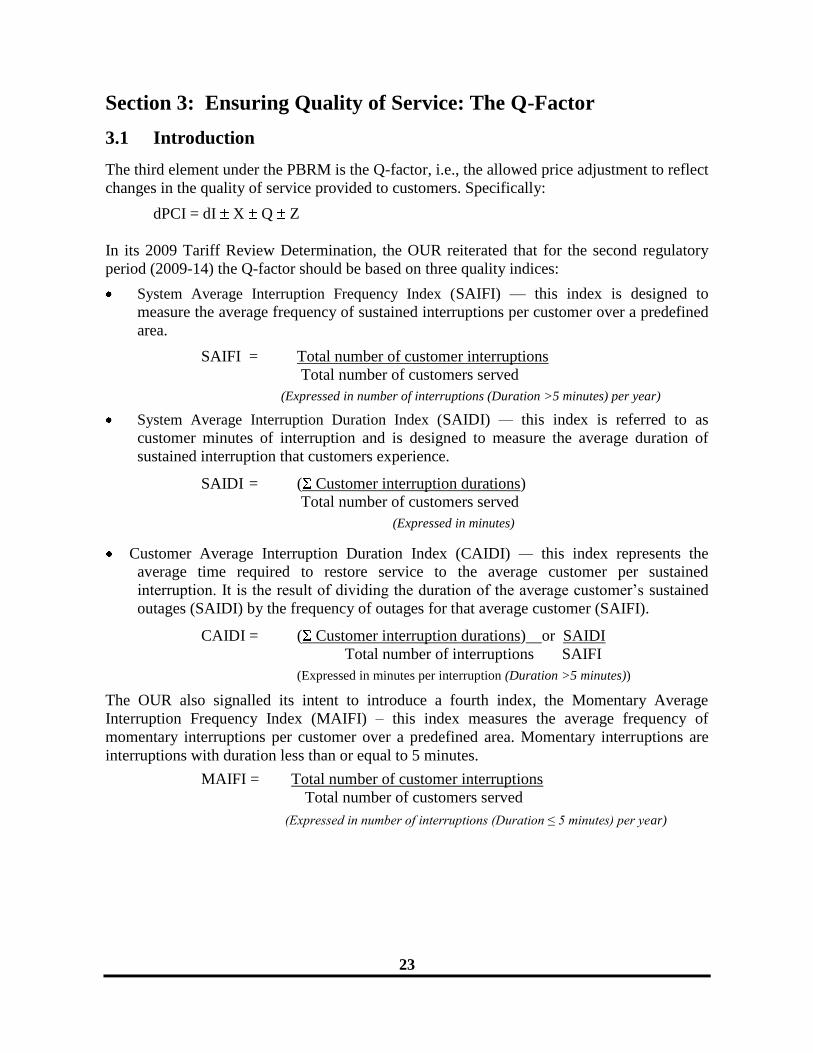
3.1 Introduction
The third element under the PBRM is the Q-factor, i.e., the allowed price adjustment to reflect
changes in the quality of service provided to customers. Specifically:
dPCI = dI X Q Z
In its 2009 Tariff Review Determination, the OUR reiterated that for the second regulatory
period (2009-14) the Q-factor should be based on three quality indices:
System Average Interruption Frequency Index (SAIFI) — this index is designed to
measure the average frequency of sustained interruptions per customer over a predefined
area.
SAIFI = Total number of customer interruptions
Total number of customers served
(Expressed in number of interruptions (Duration >5 minutes) per year)
System Average Interruption Duration Index (SAIDI) — this index is referred to as
customer minutes of interruption and is designed to measure the average duration of
sustained interruption that customers experience.
SAIDI = ( Customer interruption durations)
Total number of customers served
(Expressed in minutes)
Customer Average Interruption Duration Index (CAIDI) — this index represents the
average time required to restore service to the average customer per sustained
interruption. It is the result of dividing the duration of the average customer‘s sustained
outages (SAIDI) by the frequency of outages for that average customer (SAIFI).
CAIDI = ( Customer interruption durations) or SAIDI
Total number of interruptions SAIFI
(Expressed in minutes per interruption (Duration >5 minutes))
The OUR also signalled its intent to introduce a fourth index, the Momentary Average
Interruption Frequency Index (MAIFI) – this index measures the average frequency of
momentary interruptions per customer over a predefined area. Momentary interruptions are
interruptions with duration less than or equal to 5 minutes.
MAIFI = Total number of customer interruptions
Total number of customers served
(Expressed in number of interruptions (Duration ≤ 5 minutes) per year)
24
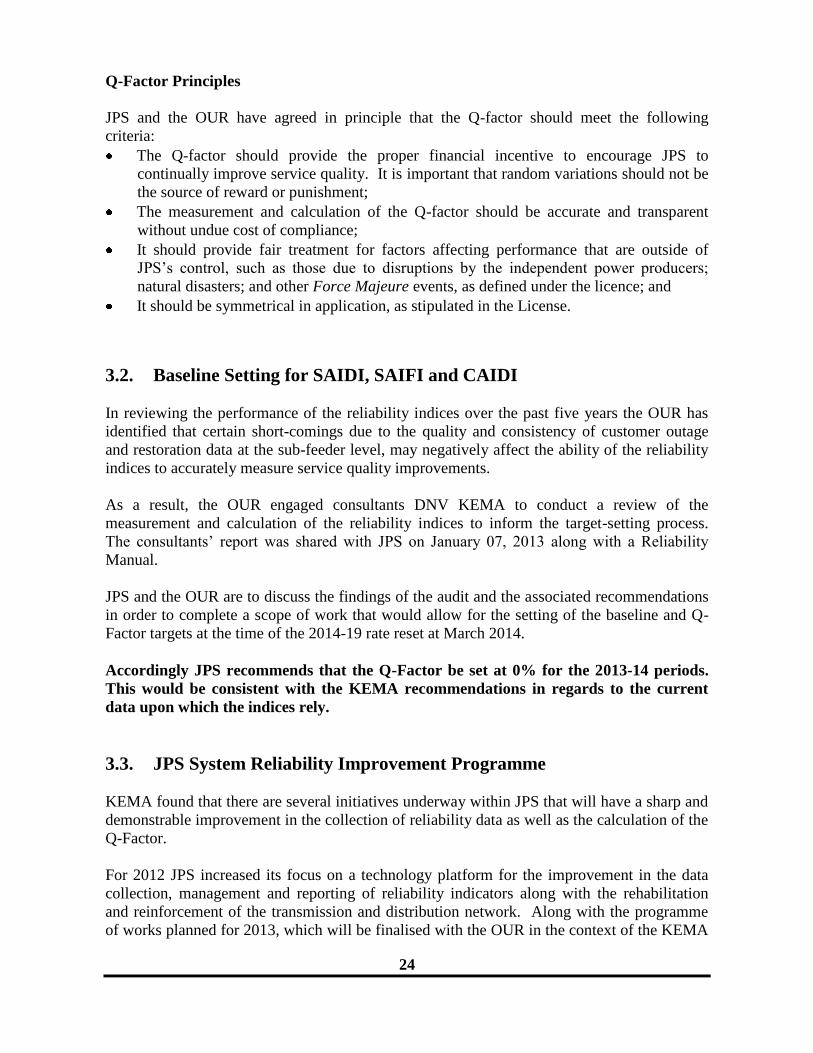
Q-Factor Principles
JPS and the OUR have agreed in principle that the Q-factor should meet the following
criteria:
The Q-factor should provide the proper financial incentive to encourage JPS to
continually improve service quality. It is important that random variations should not be
the source of reward or punishment;
The measurement and calculation of the Q-factor should be accurate and transparent
without undue cost of compliance;
It should provide fair treatment for factors affecting performance that are outside of
JPS‘s control, such as those due to disruptions by the independent power producers;
natural disasters; and other Force Majeure events, as defined under the licence; and
It should be symmetrical in application, as stipulated in the License.
3.2. Baseline Setting for SAIDI, SAIFI and CAIDI
In reviewing the performance of the reliability indices over the past five years the OUR has
identified that certain short-comings due to the quality and consistency of customer outage
and restoration data at the sub-feeder level, may negatively affect the ability of the reliability
indices to accurately measure service quality improvements.
As a result, the OUR engaged consultants DNV KEMA to conduct a review of the
measurement and calculation of the reliability indices to inform the target-setting process.
The consultants‘ report was shared with JPS on January 07, 2013 along with a Reliability
Manual.
JPS and the OUR are to discuss the findings of the audit and the associated recommendations
in order to complete a scope of work that would allow for the setting of the baseline and Q-
Factor targets at the time of the 2014-19 rate reset at March 2014.
Accordingly JPS recommends that the Q-Factor be set at 0% for the 2013-14 periods.
This would be consistent with the KEMA recommendations in regards to the current
data upon which the indices rely.
3.3. JPS System Reliability Improvement Programme
KEMA found that there are several initiatives underway within JPS that will have a sharp and
demonstrable improvement in the collection of reliability data as well as the calculation of the
Q-Factor.
For 2012 JPS increased its focus on a technology platform for the improvement in the data
collection, management and reporting of reliability indicators along with the rehabilitation
and reinforcement of the transmission and distribution network. Along with the programme
of works planned for 2013, which will be finalised with the OUR in the context of the KEMA
25
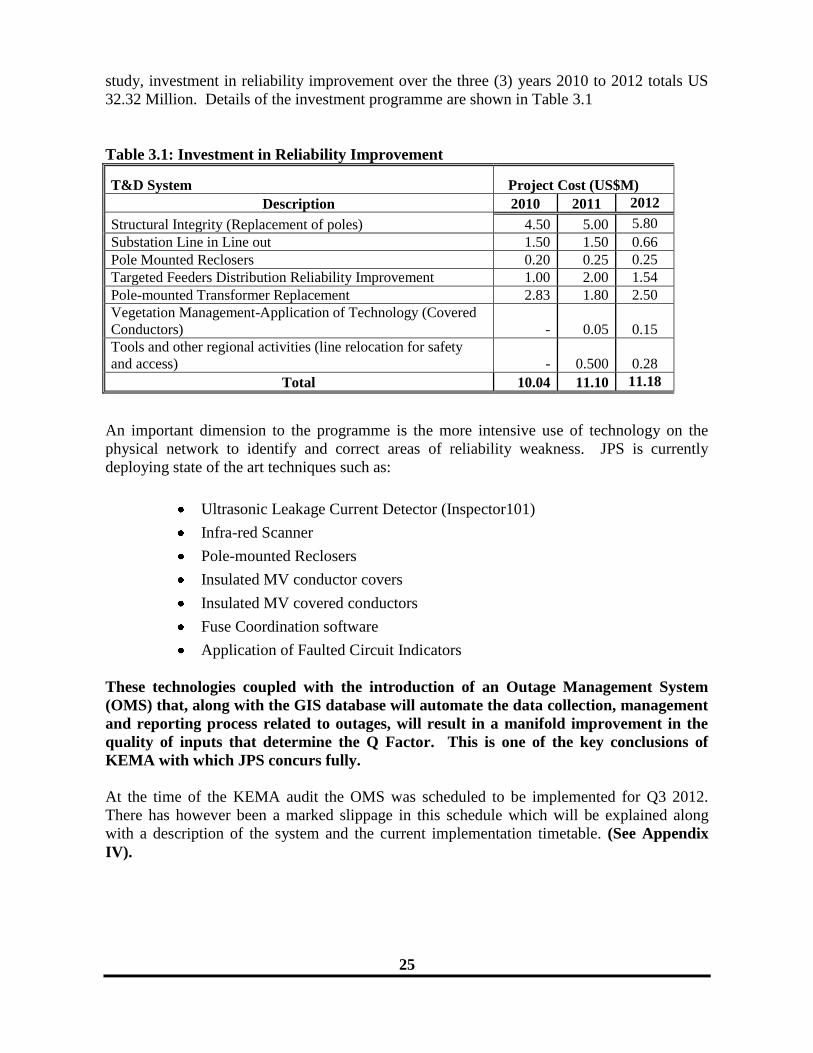
study, investment in reliability improvement over the three (3) years 2010 to 2012 totals US
32.32 Million. Details of the investment programme are shown in Table 3.1
Table 3.1: Investment in Reliability Improvement
T&D System Project Cost (US$M)
Description 2010 2011 2012
Structural Integrity (Replacement of poles) 4.50 5.00 5.80
Substation Line in Line out 1.50 1.50 0.66
Pole Mounted Reclosers 0.20 0.25 0.25
Targeted Feeders Distribution Reliability Improvement 1.00 2.00 1.54
Pole-mounted Transformer Replacement 2.83 1.80 2.50
Vegetation Management-Application of Technology (Covered
Conductors) - 0.05 0.15
Tools and other regional activities (line relocation for safety
and access) - 0.500
0.28
Total 10.04 11.10 11.18
An important dimension to the programme is the more intensive use of technology on the
physical network to identify and correct areas of reliability weakness. JPS is currently
deploying state of the art techniques such as:
Ultrasonic Leakage Current Detector (Inspector101)
Infra-red Scanner
Pole-mounted Reclosers
Insulated MV conductor covers
Insulated MV covered conductors
Fuse Coordination software
Application of Faulted Circuit Indicators
These technologies coupled with the introduction of an Outage Management System
(OMS) that, along with the GIS database will automate the data collection, management
and reporting process related to outages, will result in a manifold improvement in the
quality of inputs that determine the Q Factor. This is one of the key conclusions of
KEMA with which JPS concurs fully.
At the time of the KEMA audit the OMS was scheduled to be implemented for Q3 2012.
There has however been a marked slippage in this schedule which will be explained along
with a description of the system and the current implementation timetable. (See Appendix
IV).
26
MAIFI
JPS continues to believe that the introduction of MAIFI is premature to this market.
Nevertheless the monitoring and measurement of MAIFI began in 2011. The measured value
of MAIFI for 2011 is 109 and for 2012 it is 112.
The Company has taken note of KEMA‘s comments on MAIFI and will engage the OUR on
the appropriate treatment for this index at the time of the setting of the baseline for the
reliability indices.
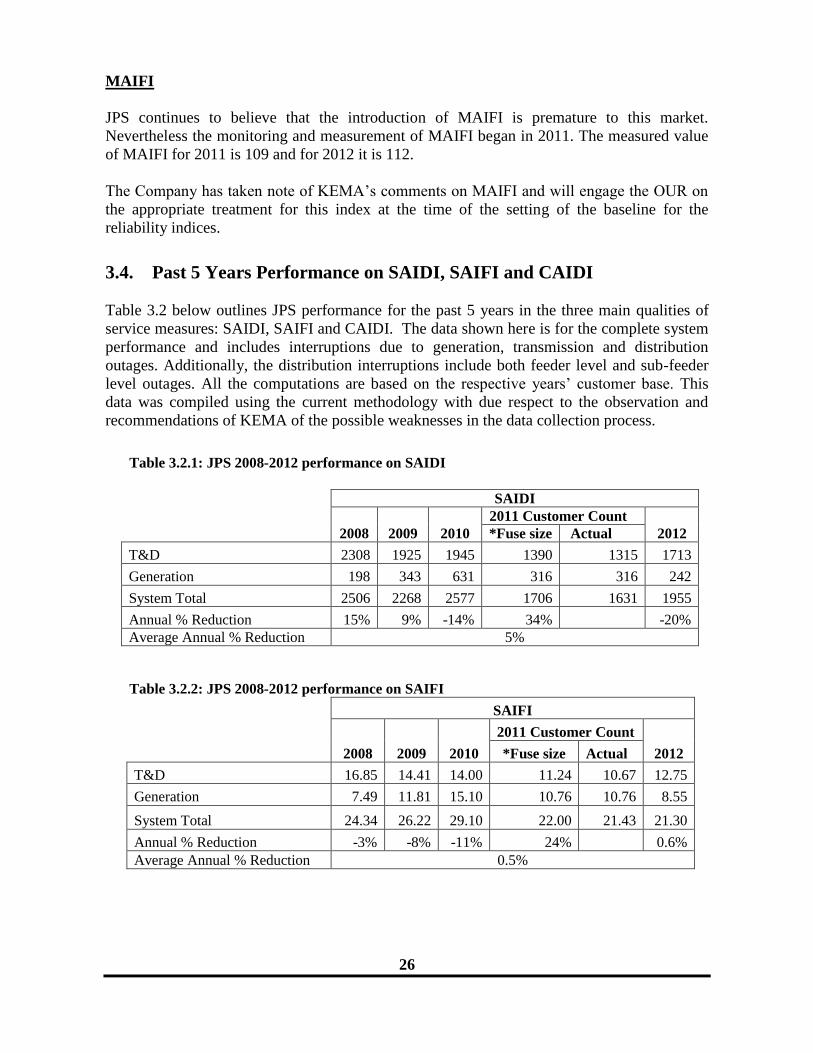
3.4. Past 5 Years Performance on SAIDI, SAIFI and CAIDI
Table 3.2 below outlines JPS performance for the past 5 years in the three main qualities of
service measures: SAIDI, SAIFI and CAIDI. The data shown here is for the complete system
performance and includes interruptions due to generation, transmission and distribution
outages. Additionally, the distribution interruptions include both feeder level and sub-feeder
level outages. All the computations are based on the respective years‘ customer base. This
data was compiled using the current methodology with due respect to the observation and
recommendations of KEMA of the possible weaknesses in the data collection process.
Table 3.2.1: JPS 2008-2012 performance on SAIDI
SAIDI
2008 2009 2010
2011 Customer Count
2012 *Fuse size Actual
T&D 2308 1925 1945 1390 1315 1713
Generation 198 343 631 316 316 242
System Total 2506 2268 2577 1706 1631 1955
Annual % Reduction 15% 9% -14% 34% -20%
Average Annual % Reduction 5%
Table 3.2.2: JPS 2008-2012 performance on SAIFI
SAIFI
2008 2009 2010
2011 Customer Count
2012 *Fuse size Actual
T&D 16.85 14.41 14.00 11.24 10.67 12.75
Generation 7.49 11.81 15.10 10.76 10.76 8.55
System Total 24.34 26.22 29.10 22.00 21.43 21.30
Annual % Reduction -3% -8% -11% 24% 0.6%
Average Annual % Reduction 0.5%
27
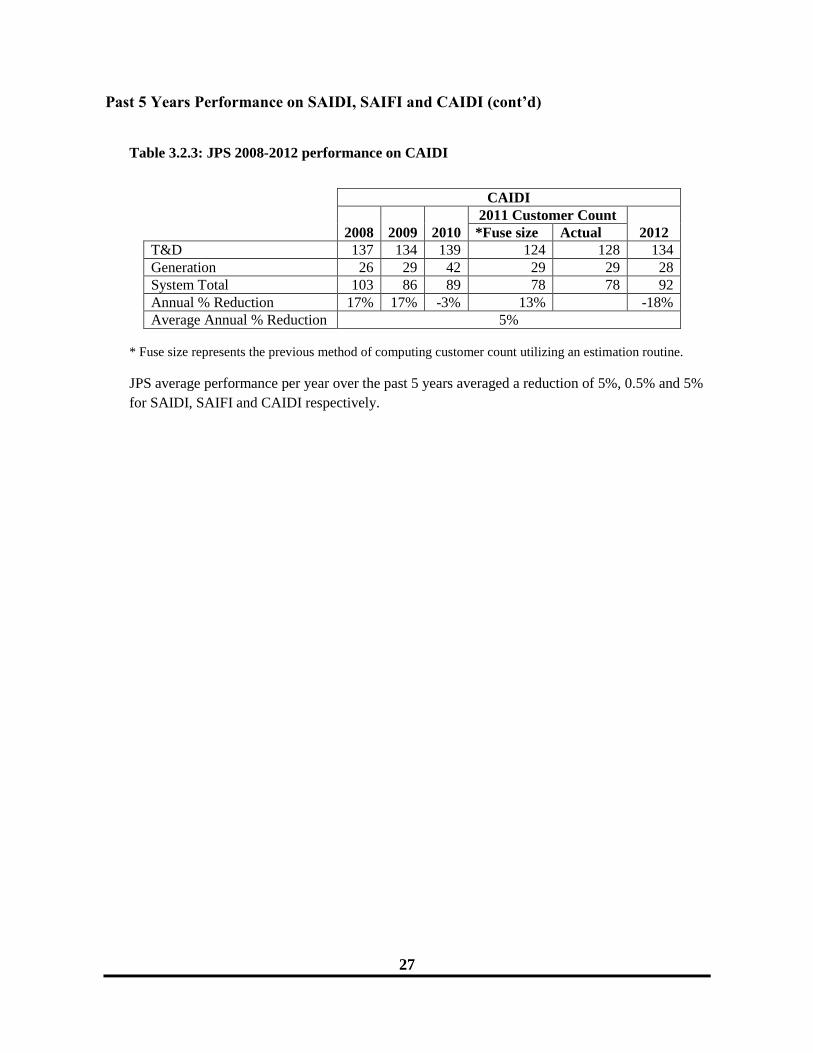
Past 5 Years Performance on SAIDI, SAIFI and CAIDI (cont’d)
Table 3.2.3: JPS 2008-2012 performance on CAIDI
CAIDI
2008 2009 2010
2011 Customer Count
2012 *Fuse size Actual
T&D 137 134 139 124 128 134
Generation 26 29 42 29 29 28
System Total 103 86 89 78 78 92
Annual % Reduction 17% 17% -3% 13% -18%
Average Annual % Reduction 5%
* Fuse size represents the previous method of computing customer count utilizing an estimation routine.
JPS average performance per year over the past 5 years averaged a reduction of 5%, 0.5% and 5%
for SAIDI, SAIFI and CAIDI respectively.
28
Appendix I: U.S. and Jamaican Consumer Price Indices
U.S. Inflation

29
Appendix I: U.S. and Jamaican Consumer Price Indices (Con’t)
Jamaican Inflation
30
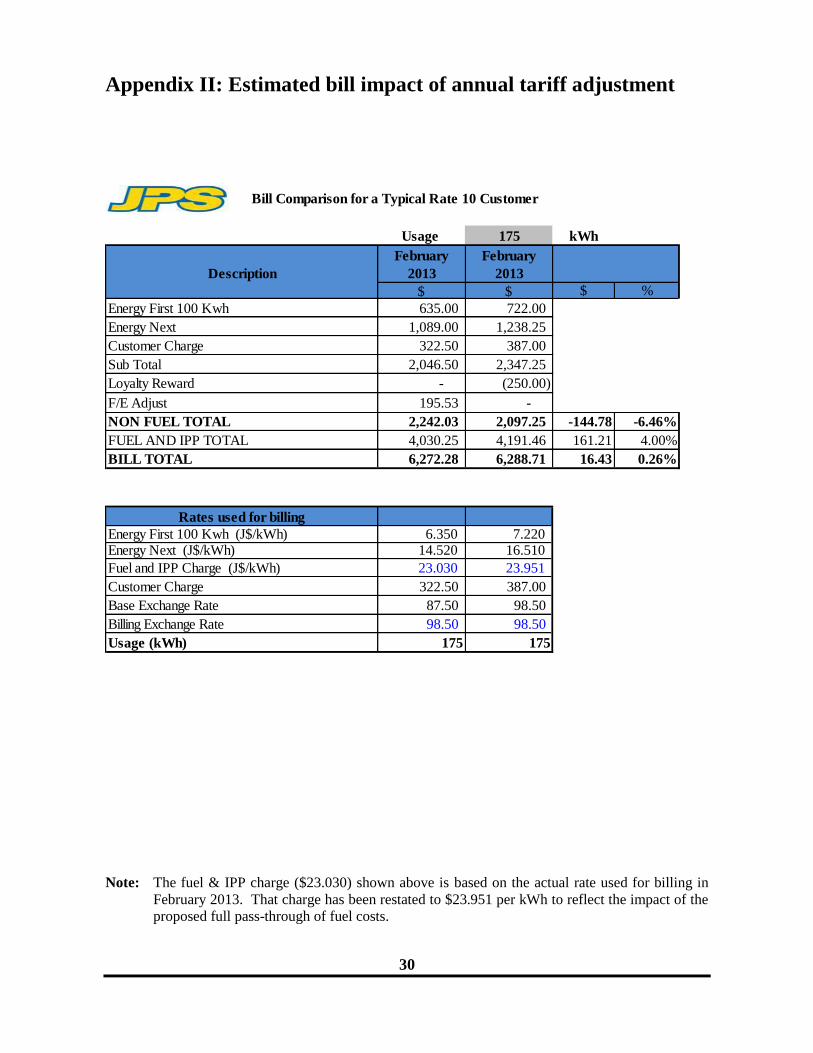
Appendix II: Estimated bill impact of annual tariff adjustment
Note: The fuel & IPP charge ($23.030) shown above is based on the actual rate used for billing in
February 2013. That charge has been restated to $23.951 per kWh to reflect the impact of the
proposed full pass-through of fuel costs.
Usage 175 kWh
February February
Description 2013 2013
$ $ $ %
Energy First 100 Kwh 635.00 722.00 87.00 13.70%
Energy Next 1,089.00 1,238.25 149.25 13.71%
Customer Charge 322.50 387.00 64.50 20.00%
Sub Total 2,046.50 2,347.25 300.75 14.70%
Loyalty Reward - (250.00)
F/E Adjust 195.53 - -195.53
NON FUEL TOTAL 2,242.03 2,097.25 -144.78 -6.46%
FUEL AND IPP TOTAL 4,030.25 4,191.46 161.21 4.00%
BILL TOTAL 6,272.28 6,288.71 16.43 0.26%
Rates used for billing
Energy First 100 Kwh (J$/kWh) 6.350 7.220 0.87 13.70%Energy Next (J$/kWh) 14.520 16.510 1.99 13.71%
Fuel and IPP Charge (J$/kWh) 23.030 23.951 0.92
Customer Charge 322.50 387.00 64.50 20.00%
Base Exchange Rate 87.50 98.50 11.00 12.57%
Billing Exchange Rate 98.50 98.50 0.00 0.00%
Usage (kWh) 175 175
Change
Bill Comparison for a Typical Rate 10 Customer
31
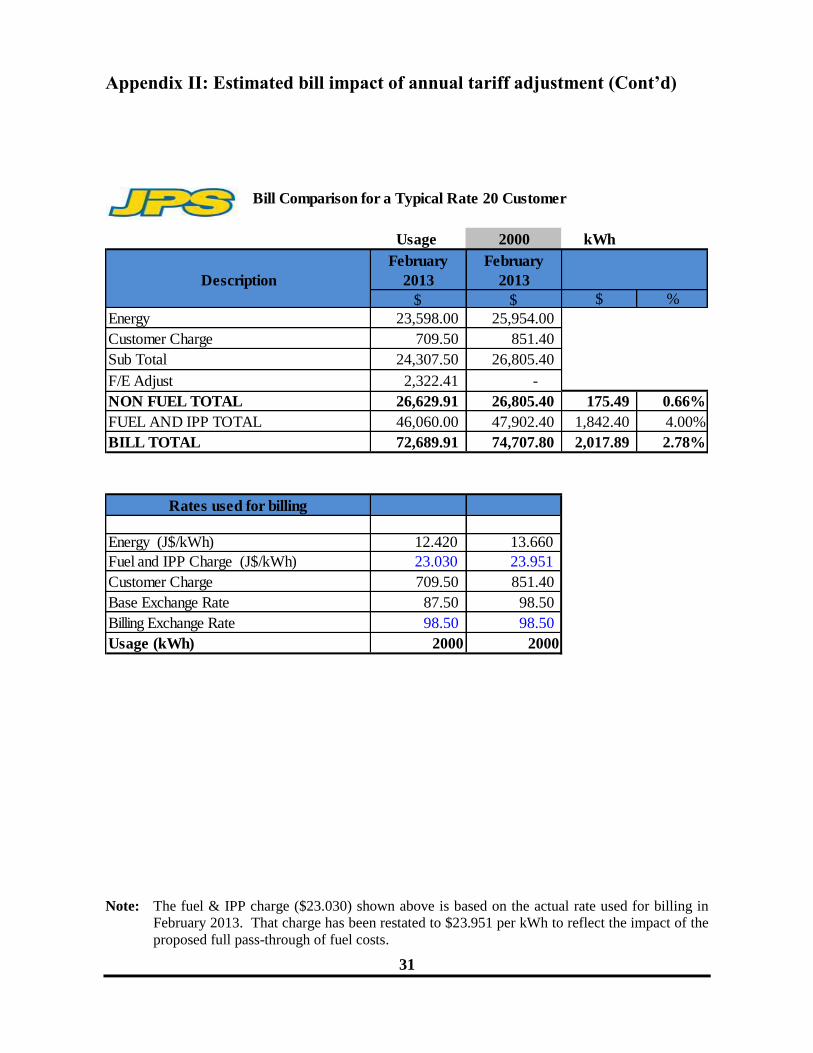
Appendix II: Estimated bill impact of annual tariff adjustment (Cont’d)
Note: The fuel & IPP charge ($23.030) shown above is based on the actual rate used for billing in
February 2013. That charge has been restated to $23.951 per kWh to reflect the impact of the
proposed full pass-through of fuel costs.
Usage 2000 kWh
February February
Description 2013 2013
$ $ $ %
Energy 23,598.00 25,954.00 2356.00 9.98%
Customer Charge 709.50 851.40 141.90 20.00%
Sub Total 24,307.50 26,805.40 2497.90 10.28%
F/E Adjust 2,322.41 - -2322.41
NON FUEL TOTAL 26,629.91 26,805.40 175.49 0.66%
FUEL AND IPP TOTAL 46,060.00 47,902.40 1,842.40 4.00%
BILL TOTAL 72,689.91 74,707.80 2,017.89 2.78%
Rates used for billing
0.00 #DIV/0!Energy (J$/kWh) 12.420 13.660 1.24 9.98%
Fuel and IPP Charge (J$/kWh) 23.030 23.951 0.92
Customer Charge 709.50 851.40 141.90 20.00%
Base Exchange Rate 87.50 98.50 11.00 12.57%
Billing Exchange Rate 98.50 98.50 0.00 0.00%
Usage (kWh) 2000 2000
Change
Bill Comparison for a Typical Rate 20 Customer
32
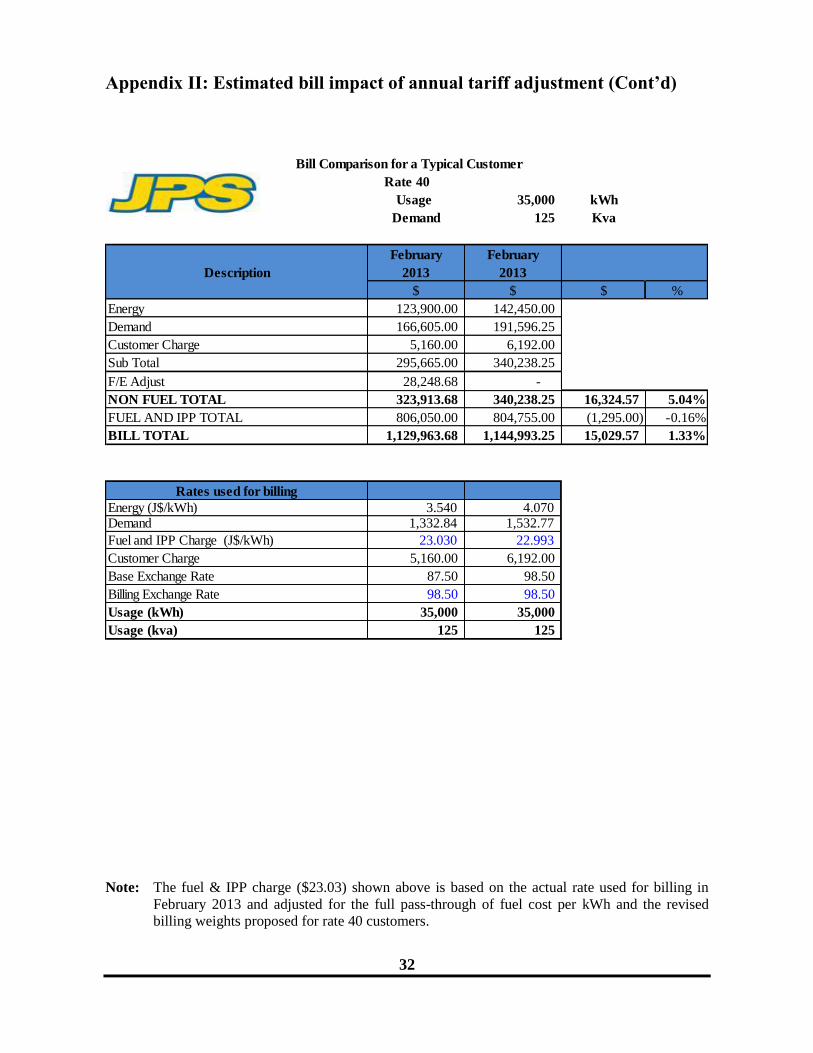
Appendix II: Estimated bill impact of annual tariff adjustment (Cont’d)
Note: The fuel & IPP charge ($23.03) shown above is based on the actual rate used for billing in
February 2013 and adjusted for the full pass-through of fuel cost per kWh and the revised
billing weights proposed for rate 40 customers.
Usage 35,000 kWh
Demand 125 Kva
February February
Description 2013 2013
$ $ $ %
Energy 123,900.00 142,450.00 18550.00 14.97%
Demand 166,605.00 191,596.25 24991.25 15.00%
Customer Charge 5,160.00 6,192.00 1032.00 20.00%
Sub Total 295,665.00 340,238.25 44573.25 15.08%
F/E Adjust 28,248.68 - -28248.68 0.00%
NON FUEL TOTAL 323,913.68 340,238.25 16,324.57 5.04%
FUEL AND IPP TOTAL 806,050.00 804,755.00 (1,295.00) -0.16%
BILL TOTAL 1,129,963.68 1,144,993.25 15,029.57 1.33%
Rates used for billing
Energy (J$/kWh) 3.540 4.070 0.53 14.97%Demand 1,332.84 1,532.77 199.93 15.00%
Fuel and IPP Charge (J$/kWh) 23.030 22.993 -0.04 -0.16%
Customer Charge 5,160.00 6,192.00 1032.00 20.00%
Base Exchange Rate 87.50 98.50 11.00 12.57%
Billing Exchange Rate 98.50 98.50 0.00 0.00%
Usage (kWh) 35,000 35,000
Usage (kva) 125 125
Change
Bill Comparison for a Typical Customer
Rate 40
33
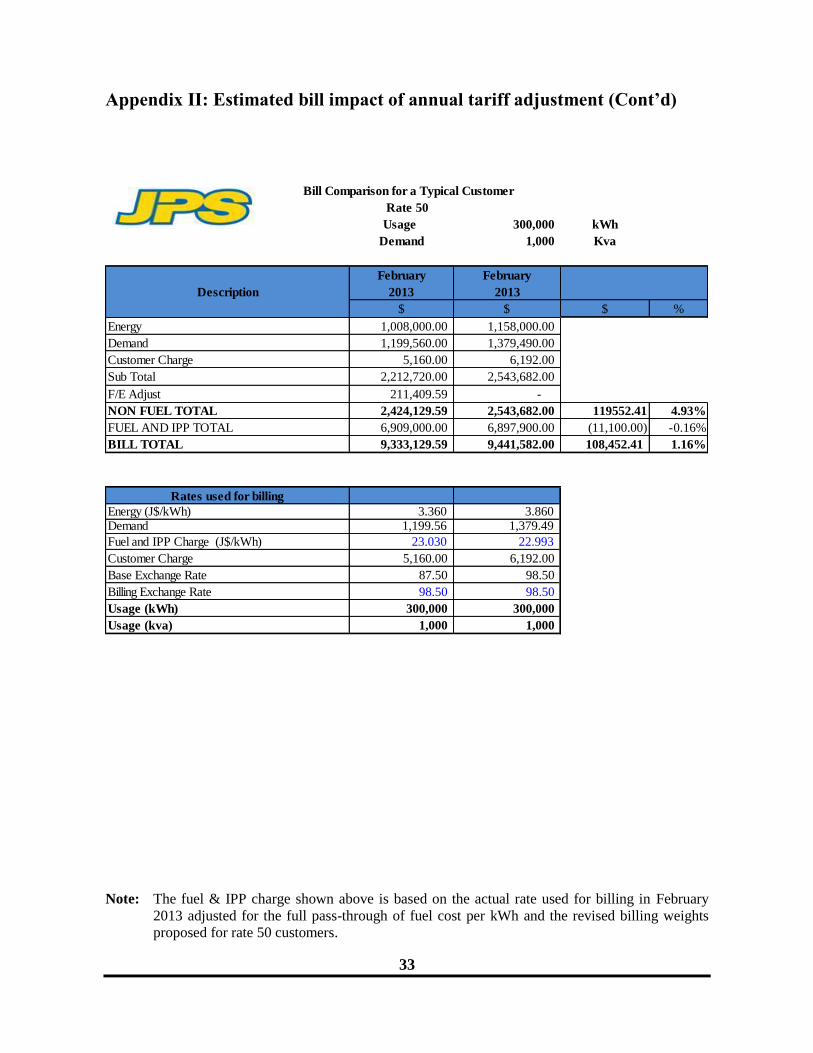
Appendix II: Estimated bill impact of annual tariff adjustment (Cont’d)
Note: The fuel & IPP charge shown above is based on the actual rate used for billing in February
2013 adjusted for the full pass-through of fuel cost per kWh and the revised billing weights
proposed for rate 50 customers.
Usage 300,000 kWh
Demand 1,000 Kva
February February
Description 2013 2013
$ $ $ %
Energy 1,008,000.00 1,158,000.00 150000.00 14.88%
Demand 1,199,560.00 1,379,490.00 179930.00 15.00%
Customer Charge 5,160.00 6,192.00 1032.00 20.00%
Sub Total 2,212,720.00 2,543,682.00 330962.00 14.96%
F/E Adjust 211,409.59 - -211409.59 -100.00%
NON FUEL TOTAL 2,424,129.59 2,543,682.00 119552.41 4.93%
FUEL AND IPP TOTAL 6,909,000.00 6,897,900.00 (11,100.00) -0.16%
BILL TOTAL 9,333,129.59 9,441,582.00 108,452.41 1.16%
Rates used for billing
Energy (J$/kWh) 3.360 3.860 0.50 14.88%Demand 1,199.56 1,379.49 179.93 15.00%
Fuel and IPP Charge (J$/kWh) 23.030 22.993 -0.04 -0.16%
Customer Charge 5,160.00 6,192.00 1032.00 20.00%
Base Exchange Rate 87.50 98.50 11.00 12.57%
Billing Exchange Rate 98.50 98.50 0.00 0.00%
Usage (kWh) 300,000 300,000
Usage (kva) 1,000 1,000
Change
Bill Comparison for a Typical Customer
Rate 50
34
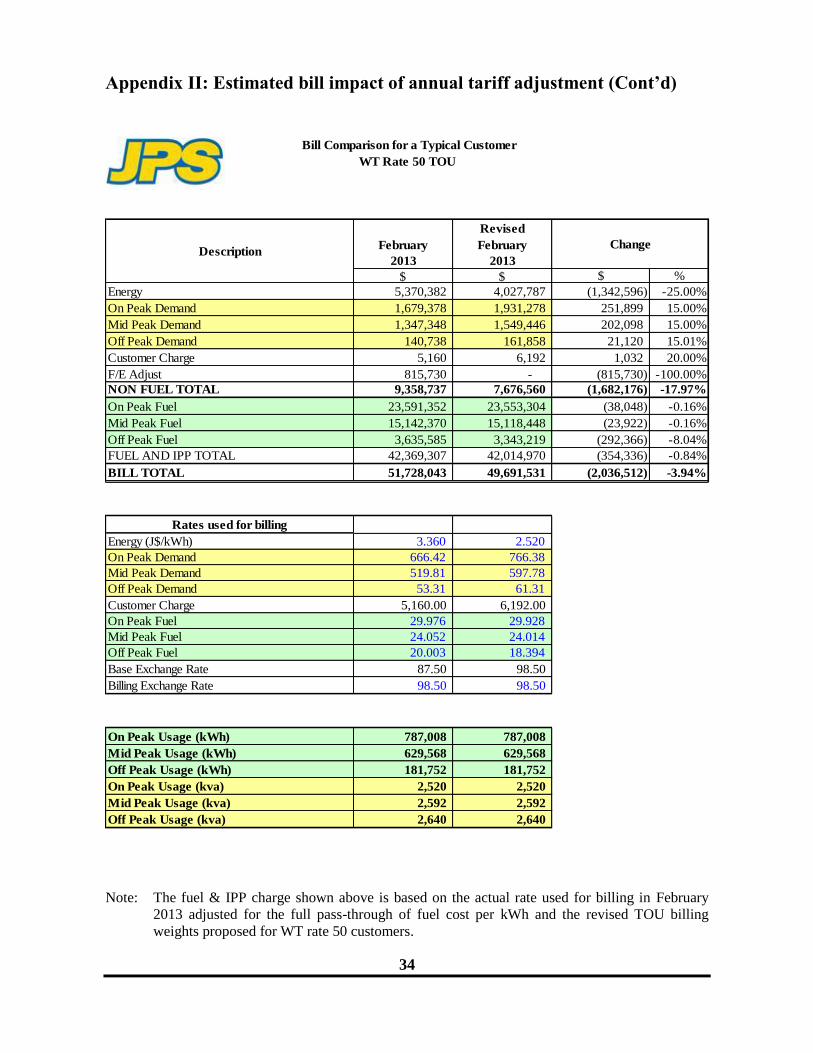
Appendix II: Estimated bill impact of annual tariff adjustment (Cont’d)
Note: The fuel & IPP charge shown above is based on the actual rate used for billing in February
2013 adjusted for the full pass-through of fuel cost per kWh and the revised TOU billing
weights proposed for WT rate 50 customers.
Revised
February February
2013 2013
$ $ $ %
Energy 5,370,382 4,027,787 (1,342,596) -25.00%
On Peak Demand 1,679,378 1,931,278 251,899 15.00%
Mid Peak Demand 1,347,348 1,549,446 202,098 15.00%
Off Peak Demand 140,738 161,858 21,120 15.01%
Customer Charge 5,160 6,192 1,032 20.00%
F/E Adjust 815,730 - (815,730) -100.00%
NON FUEL TOTAL 9,358,737 7,676,560 (1,682,176) -17.97%
On Peak Fuel 23,591,352 23,553,304 (38,048) -0.16%
Mid Peak Fuel 15,142,370 15,118,448 (23,922) -0.16%
Off Peak Fuel 3,635,585 3,343,219 (292,366) -8.04%
FUEL AND IPP TOTAL 42,369,307 42,014,970 (354,336) -0.84%
BILL TOTAL 51,728,043 49,691,531 (2,036,512) -3.94%
Rates used for billing
Energy (J$/kWh) 3.360 2.520 -0.84 -25.00%
On Peak Demand 666.42 766.38 99.96 15.00%
Mid Peak Demand 519.81 597.78 77.97 15.00%
Off Peak Demand 53.31 61.31 8.00 15.01%
Customer Charge 5,160.00 6,192.00 1032.00 20.00%
On Peak Fuel 29.976 29.928 -0.05 -0.16%
Mid Peak Fuel 24.052 24.014 -0.04 -0.16%
Off Peak Fuel 20.003 18.394 -1.61 -8.04%
Base Exchange Rate 87.50 98.50 11.00 12.57%
Billing Exchange Rate 98.50 98.50 0.00 0.00%
On Peak Usage (kWh) 787,008 787,008
Mid Peak Usage (kWh) 629,568 629,568
Off Peak Usage (kWh) 181,752 181,752
On Peak Usage (kva) 2,520 2,520
Mid Peak Usage (kva) 2,592 2,592
Off Peak Usage (kva) 2,640 2,640
Bill Comparison for a Typical Customer
WT Rate 50 TOU
DescriptionChange
Change
35
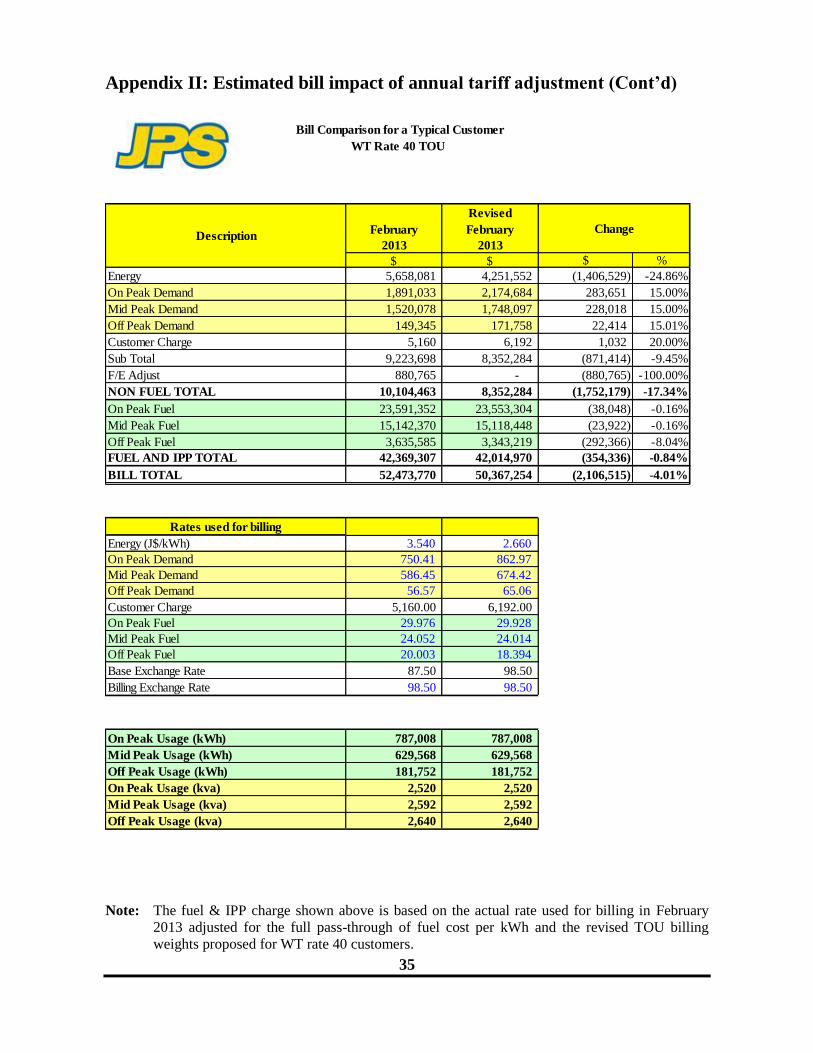
Appendix II: Estimated bill impact of annual tariff adjustment (Cont’d)
Note: The fuel & IPP charge shown above is based on the actual rate used for billing in February
2013 adjusted for the full pass-through of fuel cost per kWh and the revised TOU billing
weights proposed for WT rate 40 customers.
Revised
February February
2013 2013
$ $ $ %
Energy 5,658,081 4,251,552 (1,406,529) -24.86%
On Peak Demand 1,891,033 2,174,684 283,651 15.00%
Mid Peak Demand 1,520,078 1,748,097 228,018 15.00%
Off Peak Demand 149,345 171,758 22,414 15.01%
Customer Charge 5,160 6,192 1,032 20.00%
Sub Total 9,223,698 8,352,284 (871,414) -9.45%
F/E Adjust 880,765 - (880,765) -100.00%
NON FUEL TOTAL 10,104,463 8,352,284 (1,752,179) -17.34%
On Peak Fuel 23,591,352 23,553,304 (38,048) -0.16%
Mid Peak Fuel 15,142,370 15,118,448 (23,922) -0.16%
Off Peak Fuel 3,635,585 3,343,219 (292,366) -8.04%
FUEL AND IPP TOTAL 42,369,307 42,014,970 (354,336) -0.84%
BILL TOTAL 52,473,770 50,367,254 (2,106,515) -4.01%
Rates used for billing
Energy (J$/kWh) 3.540 2.660 -0.88 -24.86%
On Peak Demand 750.41 862.97 112.56 15.00%
Mid Peak Demand 586.45 674.42 87.97 15.00%
Off Peak Demand 56.57 65.06 8.49 15.01%
Customer Charge 5,160.00 6,192.00 1032.00 20.00%
On Peak Fuel 29.976 29.928 -0.05 -0.16%
Mid Peak Fuel 24.052 24.014 -0.04 -0.16%
Off Peak Fuel 20.003 18.394 -1.61 -8.04%
Base Exchange Rate 87.50 98.50 11.00 12.57%
Billing Exchange Rate 98.50 98.50 0.00 0.00%
On Peak Usage (kWh) 787,008 787,008
Mid Peak Usage (kWh) 629,568 629,568
Off Peak Usage (kWh) 181,752 181,752
On Peak Usage (kva) 2,520 2,520
Mid Peak Usage (kva) 2,592 2,592
Off Peak Usage (kva) 2,640 2,640
Bill Comparison for a Typical Customer
WT Rate 40 TOU
DescriptionChange
Change
36
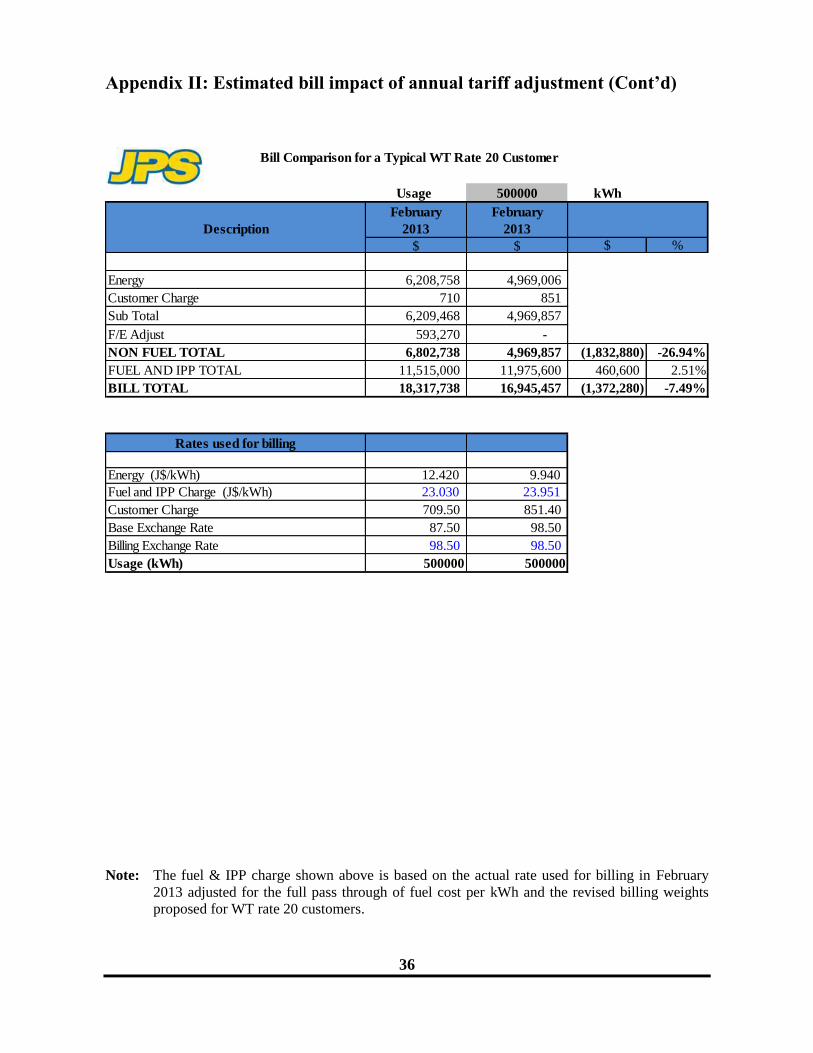
Appendix II: Estimated bill impact of annual tariff adjustment (Cont’d)
Note: The fuel & IPP charge shown above is based on the actual rate used for billing in February
2013 adjusted for the full pass through of fuel cost per kWh and the revised billing weights
proposed for WT rate 20 customers.
Usage 500000 kWh
February February
Description 2013 2013
$ $ $ %
0.00 #DIV/0!
Energy 6,208,758 4,969,006 -1239752.00 -19.97%
Customer Charge 710 851 141.90 20.00%
Sub Total 6,209,468 4,969,857 -1239610.10 -19.96%
F/E Adjust 593,270 - -593270.27
NON FUEL TOTAL 6,802,738 4,969,857 (1,832,880) -26.94%
FUEL AND IPP TOTAL 11,515,000 11,975,600 460,600 2.51%
BILL TOTAL 18,317,738 16,945,457 (1,372,280) -7.49%
Rates used for billing
0.00 #DIV/0!Energy (J$/kWh) 12.420 9.940 -2.48 -19.97%
Fuel and IPP Charge (J$/kWh) 23.030 23.951 0.92
Customer Charge 709.50 851.40 141.90 20.00%
Base Exchange Rate 87.50 98.50 11.00 12.57%
Billing Exchange Rate 98.50 98.50 0.00 0.00%
Usage (kWh) 500000 500000
Bill Comparison for a Typical WT Rate 20 Customer
Change

37
Appendix III: JPS Comprehensive Loss Reduction Strategies
1.1 JPS System Loss Frameworks – A Deteriorating Problem
The current regulatory framework for addressing system losses has never worked and has
virtually very little prospect of achieving its desired success in its current form. The
framework failures include the methodology for determining loss targets, the embedded triple
penalty, and the reliance on technology at its centrepiece to solve a problem that is primarily
socio-economic in nature.
The most fundamental weakness, however, is the transfer of the crime prevention and
punishment responsibility from the State to an electric utility that has neither the experience
nor expertise to handle it. This framework therefore not only threatens the viability of JPS, but
also endangers the lives of our employees in ways no other private goods or service provider
in Jamaica has to contend with.
The loss target, which is determined with a high degree of subjectivity as it relates to
commercial losses, has never been achieved over the past two decades.
System losses, which is primarily due to the theft of electricity, have been trending steadily
higher, despite occasional dips. Over the past two (2) years actual outturn has moved from a
―12 month rolling average‖ of 21.65 % in March 2011 up to 25.15% in February 2013. This
trend has been driven by sustained high fuel prices, a shrinking economy and a crime
permissive culture. Higher electricity prices and a stagnating economy have put upward
pressure on all customer classes. This in turn has triggered conservation efforts, the increasing
take up of off-grid alternative energy and pushing marginal customers to theft resulting in
lower sales that translate into higher reported system loss.
This vicious cycle has effectively masked much of the success that has been achieved over the
past five years in combatting losses. There can be little doubt that the growing tide is being
partially held in check by the loss reduction programmes in place. Nevertheless, the
increasing trend of reported losses (See Figure 1) confirms that JPS‘ effort, by itself, cannot
overcome the combined social and economic forces at play and which must be prominently
factored into the regulatory regime for losses.
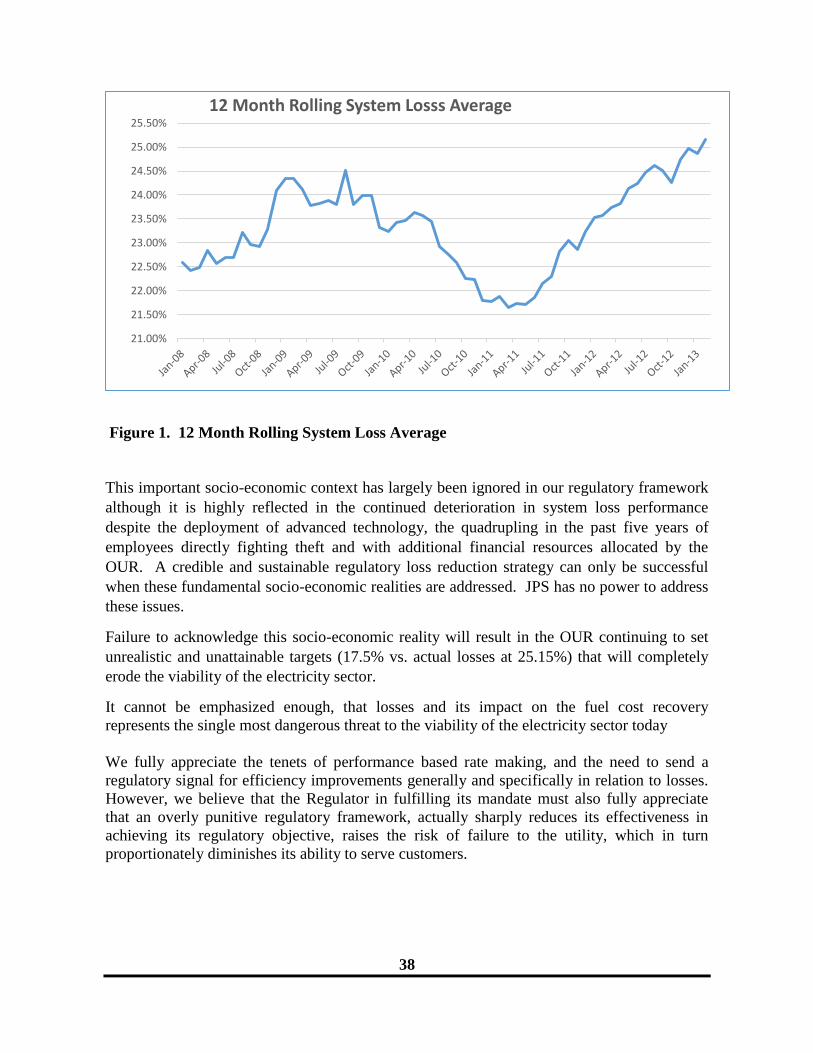
38
Figure 1. 12 Month Rolling System Loss Average
This important socio-economic context has largely been ignored in our regulatory framework
although it is highly reflected in the continued deterioration in system loss performance
despite the deployment of advanced technology, the quadrupling in the past five years of
employees directly fighting theft and with additional financial resources allocated by the
OUR. A credible and sustainable regulatory loss reduction strategy can only be successful
when these fundamental socio-economic realities are addressed. JPS has no power to address
these issues.
Failure to acknowledge this socio-economic reality will result in the OUR continuing to set
unrealistic and unattainable targets (17.5% vs. actual losses at 25.15%) that will completely
erode the viability of the electricity sector.
It cannot be emphasized enough, that losses and its impact on the fuel cost recovery
represents the single most dangerous threat to the viability of the electricity sector today
We fully appreciate the tenets of performance based rate making, and the need to send a
regulatory signal for efficiency improvements generally and specifically in relation to losses.
However, we believe that the Regulator in fulfilling its mandate must also fully appreciate
that an overly punitive regulatory framework, actually sharply reduces its effectiveness in
achieving its regulatory objective, raises the risk of failure to the utility, which in turn
proportionately diminishes its ability to serve customers.
21.00%
21.50%
22.00%
22.50%
23.00%
23.50%
24.00%
24.50%
25.00%
25.50%
12 Month Rolling System Losss Average
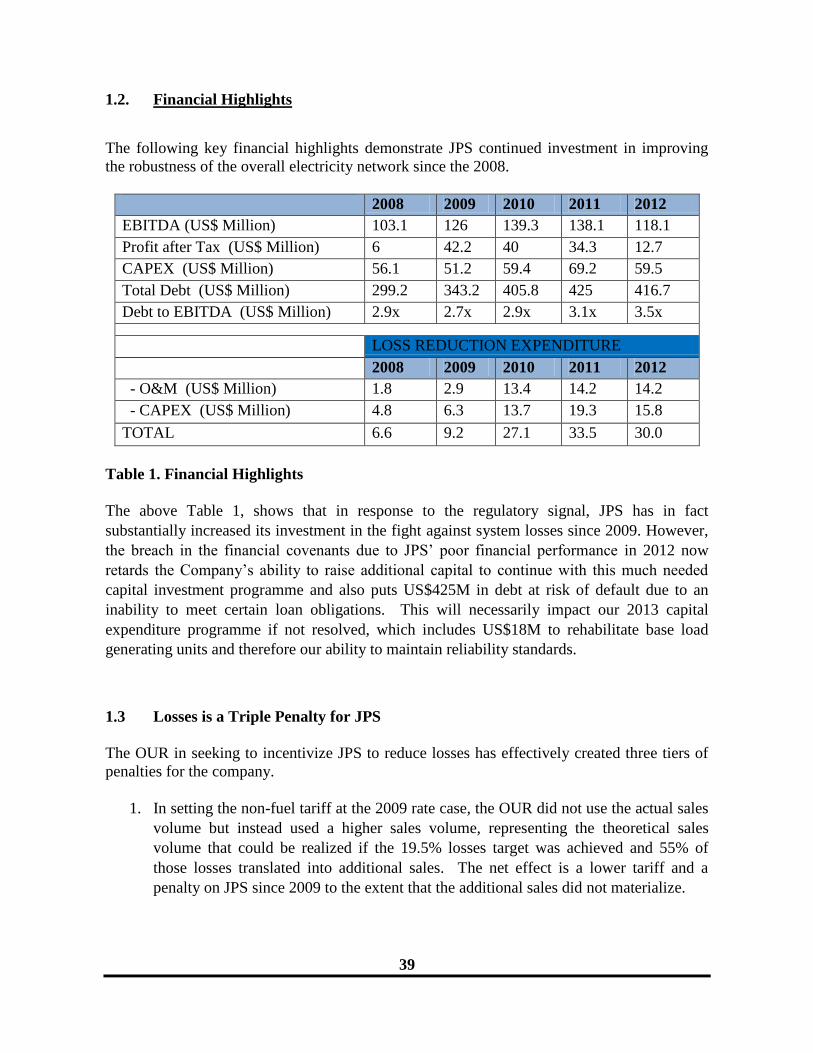
39
1.2. Financial Highlights
The following key financial highlights demonstrate JPS continued investment in improving
the robustness of the overall electricity network since the 2008.
2008 2009 2010 2011 2012
EBITDA (US$ Million) 103.1 126 139.3 138.1 118.1
Profit after Tax (US$ Million) 6 42.2 40 34.3 12.7
CAPEX (US$ Million) 56.1 51.2 59.4 69.2 59.5
Total Debt (US$ Million) 299.2 343.2 405.8 425 416.7
Debt to EBITDA (US$ Million) 2.9x 2.7x 2.9x 3.1x 3.5x
LOSS REDUCTION EXPENDITURE
2008 2009 2010 2011 2012
- O&M (US$ Million) 1.8 2.9 13.4 14.2 14.2
- CAPEX (US$ Million) 4.8 6.3 13.7 19.3 15.8
TOTAL 6.6 9.2 27.1 33.5 30.0
Table 1. Financial Highlights
The above Table 1, shows that in response to the regulatory signal, JPS has in fact
substantially increased its investment in the fight against system losses since 2009. However,
the breach in the financial covenants due to JPS‘ poor financial performance in 2012 now
retards the Company‘s ability to raise additional capital to continue with this much needed
capital investment programme and also puts US$425M in debt at risk of default due to an
inability to meet certain loan obligations. This will necessarily impact our 2013 capital
expenditure programme if not resolved, which includes US$18M to rehabilitate base load
generating units and therefore our ability to maintain reliability standards.
1.3 Losses is a Triple Penalty for JPS
The OUR in seeking to incentivize JPS to reduce losses has effectively created three tiers of
penalties for the company.
1. In setting the non-fuel tariff at the 2009 rate case, the OUR did not use the actual sales
volume but instead used a higher sales volume, representing the theoretical sales
volume that could be realized if the 19.5% losses target was achieved and 55% of
those losses translated into additional sales. The net effect is a lower tariff and a
penalty on JPS since 2009 to the extent that the additional sales did not materialize.
40
2. To the extent losses exceed the regulatory target and losses are growing JPS loses on
the non-fuel revenue it does not collect from stolen electricity as would any other
company suffering shrinkage. This is a normal and expected consequence.
3. Fuel Penalty. JPS is prevented from passing through the fuel cost associated with
losses above the regulatory target and must absorb this cost. This type of penalty, in
combination with the previous two penalties mentioned on non-fuel revenues is a
highly unusual regulatory practice given that fuel typically represents the largest cost
factor for utilities, as much as 67% for JPS. . Since system losses is a T&D
phenomenon, it is considered that the appropriate penalty should be non-fuel, that is,
of the nature, if not the exact form of the first two penalties described. Generation
losses, as captured in the efficiency of fuel conversion is appropriately incentivised
through the heat rate target mechanism.
Additionally, the determination of the regulatory target is highly subjective (despite
JPS offering a more objective basis for determining same as part of its 2009 tariff
submission) and gives no consideration to the changes in the socio-economic
conditions of the country. This penalty has become particularly corrosive on JPS‘
finances, resulting in a US$16M under-recovery in 2011 and a US$30M penalty in
2012. If this is not revised, the penalty will exceed US$30M in 2013 and certainly
undermine JPS‘ status as a going concern. JPS simply cannot continue as a viable
company sustaining this level of financial haemorrhage, which is directly linked to the
reduction of the losses target to 17.5% in June 2011 in the face of an upward trend in
electricity theft as evidenced by the continuous fuel penalty for every quarter since
June 2011.
There is also an equal concern as to the subjective nature of how the productivity factor (X-
factor) was also determined, being 2.72% currently. This is unusually high given the trend in
U.S. inflation (less than 2.5% p.a.), the forecast for sales growth (or shrinkage), the high level
of fixed costs the business faces and the challenges with meeting the regulatory system losses
target. It is unrealistic to expect a business to become more efficient by 2.72% in an
environment of declining sales, where most of its non-fuel revenues are unfairly tied to energy
sales and it has an unreasonably low level of regulatory approved fixed charges (i.e. the tariffs
are not truly cost reflective as it relates to the fixed cost nature of expenses).
The removal of the system losses penalty from the fuel cost along with the implementation of
strategies to address the socio-economic elements of commercial losses is central to the
viability of the company and to implementing the options that will ensure a holistic approach
in the fight against commercial losses.
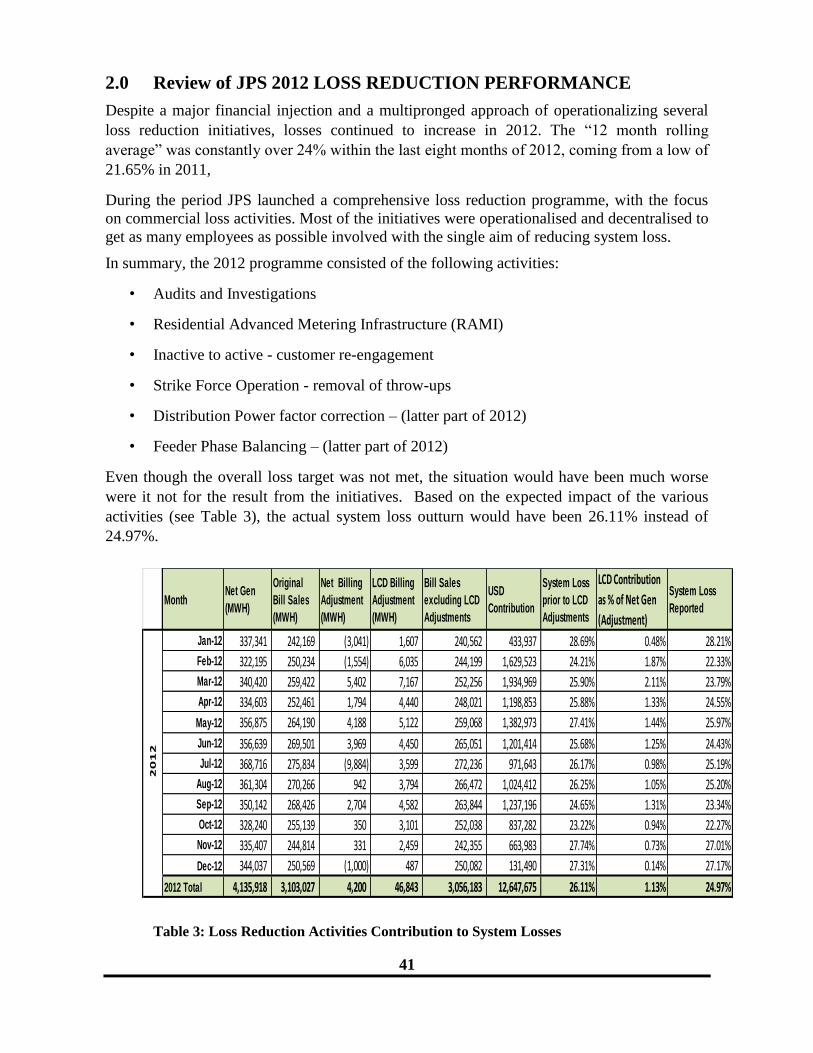
41
2.0 Review of JPS 2012 LOSS REDUCTION PERFORMANCE
Despite a major financial injection and a multipronged approach of operationalizing several
loss reduction initiatives, losses continued to increase in 2012. The ―12 month rolling
average‖ was constantly over 24% within the last eight months of 2012, coming from a low of
21.65% in 2011,
During the period JPS launched a comprehensive loss reduction programme, with the focus
on commercial loss activities. Most of the initiatives were operationalised and decentralised to
get as many employees as possible involved with the single aim of reducing system loss.
In summary, the 2012 programme consisted of the following activities:
• Audits and Investigations
• Residential Advanced Metering Infrastructure (RAMI)
• Inactive to active - customer re-engagement
• Strike Force Operation - removal of throw-ups
• Distribution Power factor correction – (latter part of 2012)
• Feeder Phase Balancing – (latter part of 2012)
Even though the overall loss target was not met, the situation would have been much worse
were it not for the result from the initiatives. Based on the expected impact of the various
activities (see Table 3), the actual system loss outturn would have been 26.11% instead of
24.97%.
Table 3: Loss Reduction Activities Contribution to System Losses
MonthNet Gen
(MWH)
Original
Bill Sales
(MWH)
Net Billing
Adjustment
(MWH)
LCD Billing
Adjustment
(MWH)
Bill Sales
excluding LCD
Adjustments
USD
Contribution
System Loss
prior to LCD
Adjustments
LCD Contribution
as % of Net Gen
(Adjustment)
System Loss
Reported
Jan-12 337,341 242,169 (3,041) 1,607 240,562 433,937 28.69% 0.48% 28.21%
Feb-12 322,195 250,234 (1,554) 6,035 244,199 1,629,523 24.21% 1.87% 22.33%
Mar-12 340,420 259,422 5,402 7,167 252,256 1,934,969 25.90% 2.11% 23.79%
Apr-12 334,603 252,461 1,794 4,440 248,021 1,198,853 25.88% 1.33% 24.55%
May-12 356,875 264,190 4,188 5,122 259,068 1,382,973 27.41% 1.44% 25.97%
Jun-12 356,639 269,501 3,969 4,450 265,051 1,201,414 25.68% 1.25% 24.43%
Jul-12 368,716 275,834 (9,884) 3,599 272,236 971,643 26.17% 0.98% 25.19%
Aug-12 361,304 270,266 942 3,794 266,472 1,024,412 26.25% 1.05% 25.20%
Sep-12 350,142 268,426 2,704 4,582 263,844 1,237,196 24.65% 1.31% 23.34%
Oct-12 328,240 255,139 350 3,101 252,038 837,282 23.22% 0.94% 22.27%
Nov-12 335,407 244,814 331 2,459 242,355 663,983 27.74% 0.73% 27.01%
Dec-12 344,037 250,569 (1,000) 487 250,082 131,490 27.31% 0.14% 27.17%
2012 Total 4,135,918 3,103,027 4,200 46,843 3,056,183 12,647,675 26.11% 1.13% 24.97%
20
12
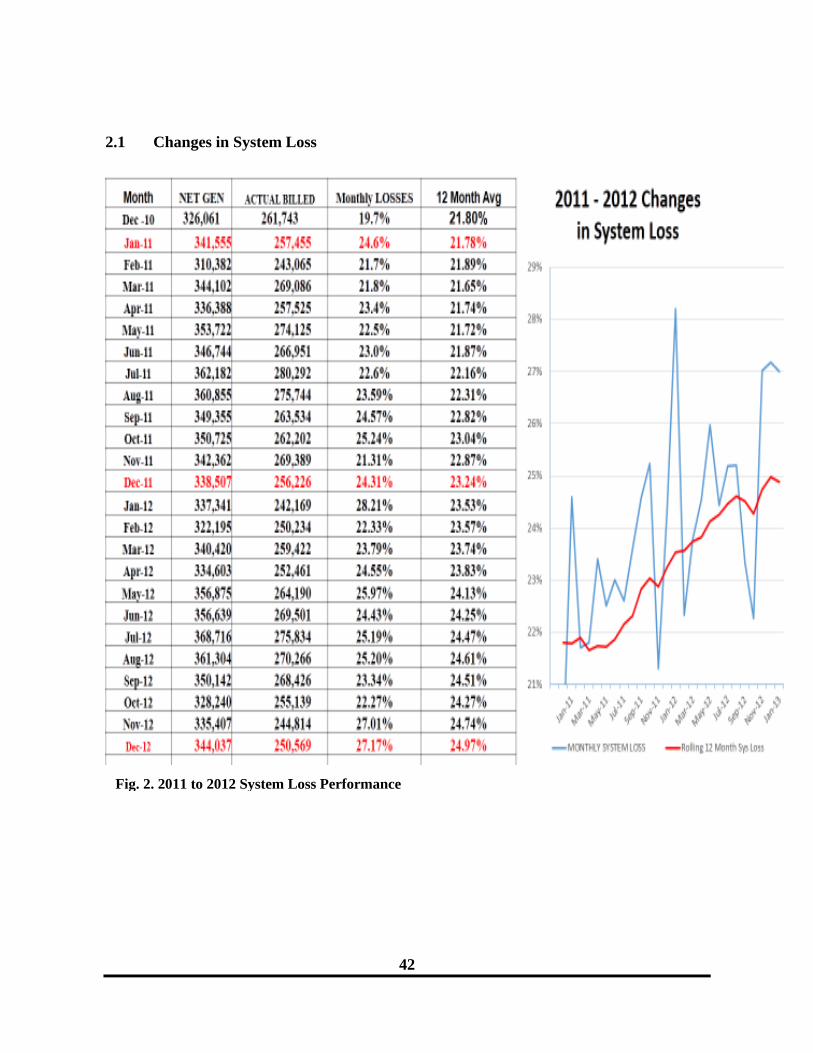
42
2.1 Changes in System Loss
Fig. 2. 2011 to 2012 System Loss Performance
43
3.0 2012 Commercial Loss Reduction Projects
3.1 Audit, Investigations and Meter Replacement
3.1.1 Audit and Investigations
This involves the analysis of accounts to identify those with potential irregularities, followed
up with field investigations. Suspected irregularities include meter tampering, direct
connections, meter by-passes, etc. The targeted areas/communities were identified from the
data on the top 20 worst losses feeders plus data received on individual theft or irregularities.
Temporary metering and readings from clip-on instruments were used to further disaggregate
the target areas and hence improve the strike rate. Revenue intelligence was also utilised in
order to identify customer accounts with highest potential for revenue recovery. Investigation
of 115,841 customer accounts yielded an overall recovery of 46.8 GWh. The work was
mainly organised around customer groups based on their Rate Class:
1) Large Accounts – (multipliers > 1 and with usage > 1 MWh per month).
A total of 9,393 accounts were investigated, 1,503 of these accounts were discovered
with irregularities, representing a strike rate of 16.0% and an overall recovery of 8
GWh.
2) Small Commercial Accounts – (multipliers < 1 and usage < 1 MWh per month).
A total of 5,687 accounts were investigated, 996 of these accounts were discovered
with irregularities, representing a strike rate of 17.5% and a recovery of 8 GWh.
3) Residential Customer Accounts – (residential accounts with a multiplier of 1).
A total of 99,752 accounts were investigated, 18,828 of these accounts were
discovered with irregularities, representing a strike rate of 18.9% and an overall
recovery of 29.8 GWh.
4) Central Intelligence Unit – this unit is charged with the responsibility of providing
support to all the above departments. Strategies are developed in order to identify
potential accounts for investigation; these strategies are piloted through a specialised
investigation team.
A total of 1,009 accounts were investigated, 215 of these accounts were discovered
with irregularities, represents a strike rate of 21.3% and recovery of 1 GWh.
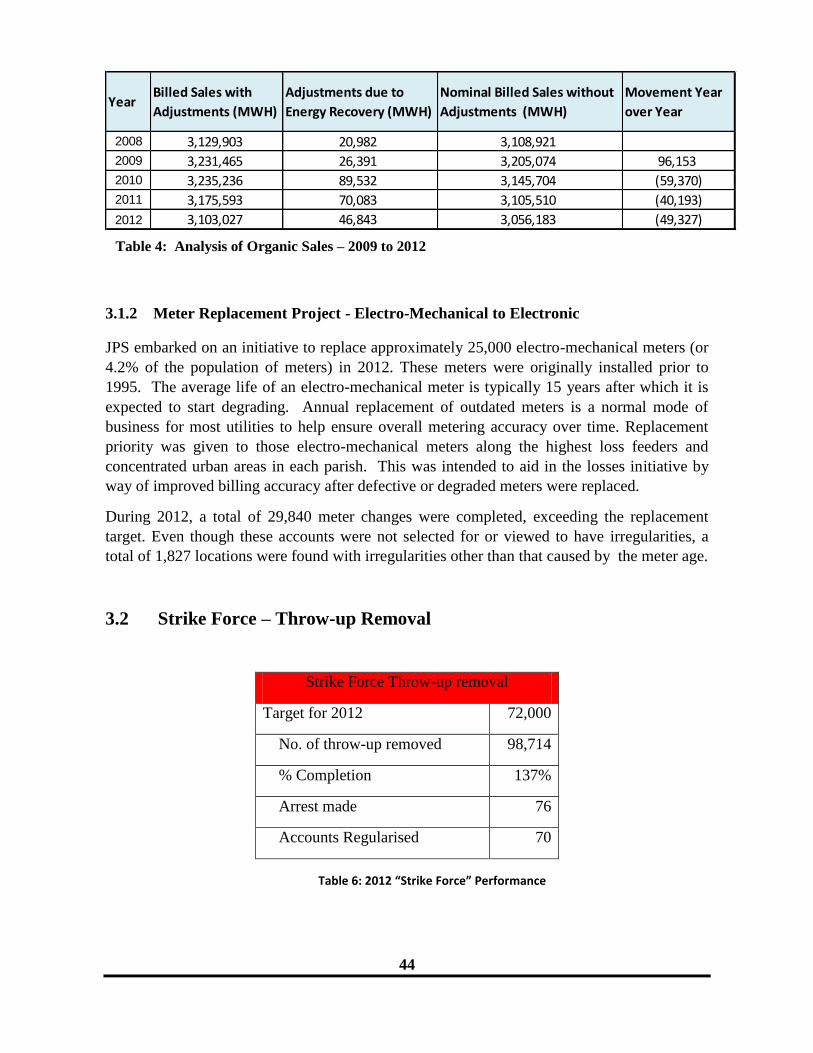
44
3.1.2 Meter Replacement Project - Electro-Mechanical to Electronic
JPS embarked on an initiative to replace approximately 25,000 electro-mechanical meters (or
4.2% of the population of meters) in 2012. These meters were originally installed prior to
1995. The average life of an electro-mechanical meter is typically 15 years after which it is
expected to start degrading. Annual replacement of outdated meters is a normal mode of
business for most utilities to help ensure overall metering accuracy over time. Replacement
priority was given to those electro-mechanical meters along the highest loss feeders and
concentrated urban areas in each parish. This was intended to aid in the losses initiative by
way of improved billing accuracy after defective or degraded meters were replaced.
During 2012, a total of 29,840 meter changes were completed, exceeding the replacement
target. Even though these accounts were not selected for or viewed to have irregularities, a
total of 1,827 locations were found with irregularities other than that caused by the meter age.
3.2 Strike Force – Throw-up Removal
Strike Force Throw-up removal
Target for 2012 72,000
No. of throw-up removed 98,714
% Completion 137%
Arrest made 76
Accounts Regularised 70
YearBilled Sales with
Adjustments (MWH)
Adjustments due to
Energy Recovery (MWH)
Nominal Billed Sales without
Adjustments (MWH)
Movement Year
over Year
2008 3,129,903 20,982 3,108,921
2009 3,231,465 26,391 3,205,074 96,153
2010 3,235,236 89,532 3,145,704 (59,370)
2011 3,175,593 70,083 3,105,510 (40,193)
2012 3,103,027 46,843 3,056,183 (49,327)
Table 6: 2012 “Strike Force” Performance
Table 4: Analysis of Organic Sales – 2009 to 2012
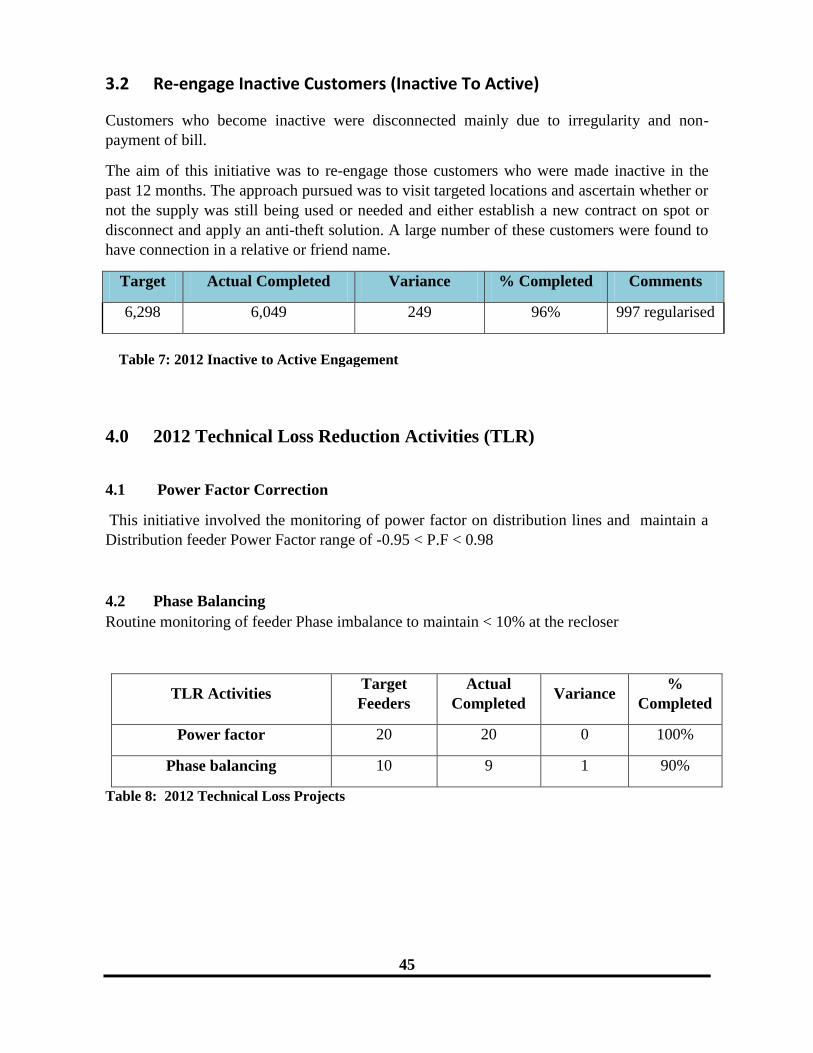
45
3.2 Re-engage Inactive Customers (Inactive To Active)
Customers who become inactive were disconnected mainly due to irregularity and non-
payment of bill.
The aim of this initiative was to re-engage those customers who were made inactive in the
past 12 months. The approach pursued was to visit targeted locations and ascertain whether or
not the supply was still being used or needed and either establish a new contract on spot or
disconnect and apply an anti-theft solution. A large number of these customers were found to
have connection in a relative or friend name.
Target Actual Completed Variance % Completed Comments
6,298 6,049 249 96% 997 regularised
4.0 2012 Technical Loss Reduction Activities (TLR)
4.1 Power Factor Correction
This initiative involved the monitoring of power factor on distribution lines and maintain a
Distribution feeder Power Factor range of -0.95 < P.F < 0.98
4.2 Phase Balancing
Routine monitoring of feeder Phase imbalance to maintain < 10% at the recloser
TLR Activities Target
Feeders
Actual
Completed Variance
%
Completed
Power factor 20 20 0 100%
Phase balancing 10 9 1 90%
Table 8: 2012 Technical Loss Projects
Table 7: 2012 Inactive to Active Engagement
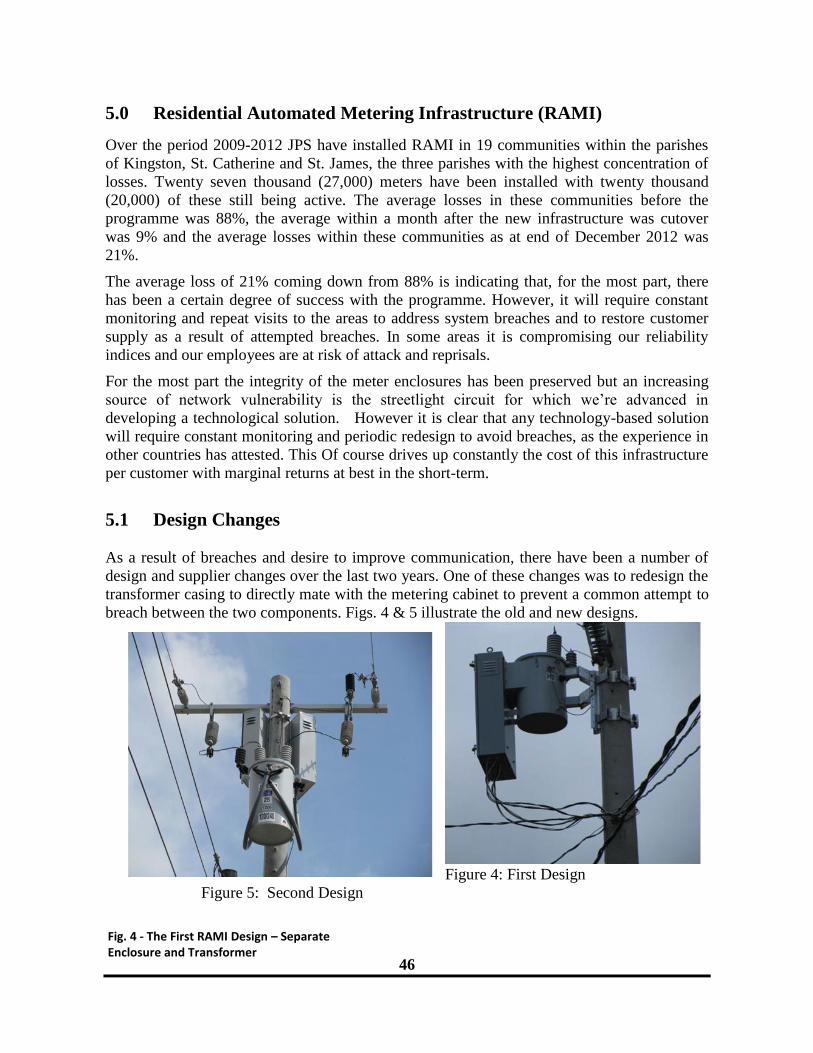
46
5.0 Residential Automated Metering Infrastructure (RAMI)
Over the period 2009-2012 JPS have installed RAMI in 19 communities within the parishes
of Kingston, St. Catherine and St. James, the three parishes with the highest concentration of
losses. Twenty seven thousand (27,000) meters have been installed with twenty thousand
(20,000) of these still being active. The average losses in these communities before the
programme was 88%, the average within a month after the new infrastructure was cutover
was 9% and the average losses within these communities as at end of December 2012 was
21%.
The average loss of 21% coming down from 88% is indicating that, for the most part, there
has been a certain degree of success with the programme. However, it will require constant
monitoring and repeat visits to the areas to address system breaches and to restore customer
supply as a result of attempted breaches. In some areas it is compromising our reliability
indices and our employees are at risk of attack and reprisals.
For the most part the integrity of the meter enclosures has been preserved but an increasing
source of network vulnerability is the streetlight circuit for which we‘re advanced in
developing a technological solution. However it is clear that any technology-based solution
will require constant monitoring and periodic redesign to avoid breaches, as the experience in
other countries has attested. This Of course drives up constantly the cost of this infrastructure
per customer with marginal returns at best in the short-term.
5.1 Design Changes
As a result of breaches and desire to improve communication, there have been a number of
design and supplier changes over the last two years. One of these changes was to redesign the
transformer casing to directly mate with the metering cabinet to prevent a common attempt to
breach between the two components. Figs. 4 & 5 illustrate the old and new designs.
Figure 4: First Design
Figure 5: Second Design
Fig. 4 - The First RAMI Design – Separate Enclosure and Transformer
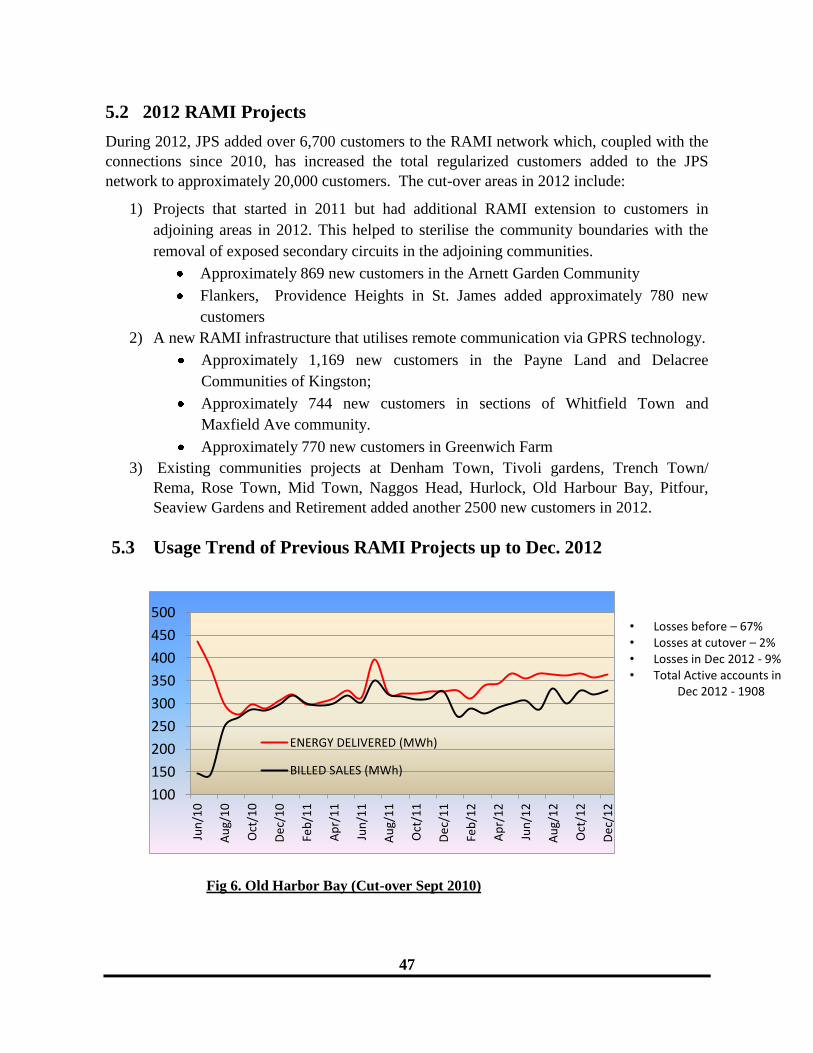
47
5.2 2012 RAMI Projects
During 2012, JPS added over 6,700 customers to the RAMI network which, coupled with the
connections since 2010, has increased the total regularized customers added to the JPS
network to approximately 20,000 customers. The cut-over areas in 2012 include:
1) Projects that started in 2011 but had additional RAMI extension to customers in
adjoining areas in 2012. This helped to sterilise the community boundaries with the
removal of exposed secondary circuits in the adjoining communities.
Approximately 869 new customers in the Arnett Garden Community
Flankers, Providence Heights in St. James added approximately 780 new
customers
2) A new RAMI infrastructure that utilises remote communication via GPRS technology.
Approximately 1,169 new customers in the Payne Land and Delacree
Communities of Kingston;
Approximately 744 new customers in sections of Whitfield Town and
Maxfield Ave community.
Approximately 770 new customers in Greenwich Farm
3) Existing communities projects at Denham Town, Tivoli gardens, Trench Town/
Rema, Rose Town, Mid Town, Naggos Head, Hurlock, Old Harbour Bay, Pitfour,
Seaview Gardens and Retirement added another 2500 new customers in 2012.
5.3 Usage Trend of Previous RAMI Projects up to Dec. 2012
100
150
200
250
300
350
400
450
500
Jun
/10
Au
g/1
0
Oct
/10
De
c/1
0
Feb
/11
Ap
r/1
1
Jun
/11
Au
g/1
1
Oct
/11
De
c/1
1
Feb
/12
Ap
r/1
2
Jun
/12
Au
g/1
2
Oct
/12
De
c/1
2
ENERGY DELIVERED (MWh)
BILLED SALES (MWh)
• Losses before – 67% • Losses at cutover – 2% • Losses in Dec 2012 - 9% • Total Active accounts in
Dec 2012 - 1908
Fig 6. Old Harbor Bay (Cut-over Sept 2010)
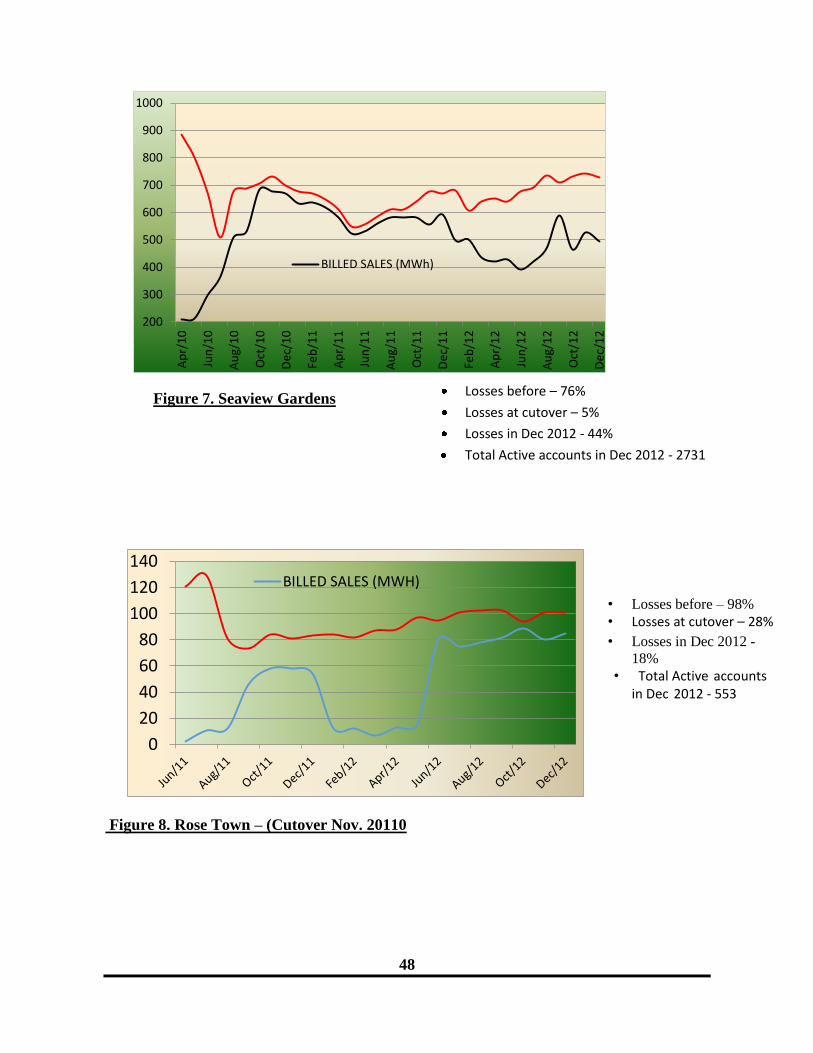
48
Figure 7. Seaview Gardens
Figure 8. Rose Town – (Cutover Nov. 20110
Fig 7. Seaview Gardens (Cut over - Nov. 2010)
200
300
400
500
600
700
800
900
1000
Ap
r/1
0
Jun
/10
Au
g/1
0
Oct
/10
De
c/1
0
Feb
/11
Ap
r/1
1
Jun
/11
Au
g/1
1
Oct
/11
De
c/1
1
Feb
/12
Ap
r/1
2
Jun
/12
Au
g/1
2
Oct
/12
De
c/1
2
BILLED SALES (MWh)
0
20
40
60
80
100
120
140BILLED SALES (MWH)
• Losses before – 98%
• Losses at cutover – 28%
• Losses in Dec 2012 -
18%
• Total Active accounts in Dec 2012 - 553
Losses before – 76%
Losses at cutover – 5%
Losses in Dec 2012 - 44%
Total Active accounts in Dec 2012 - 2731
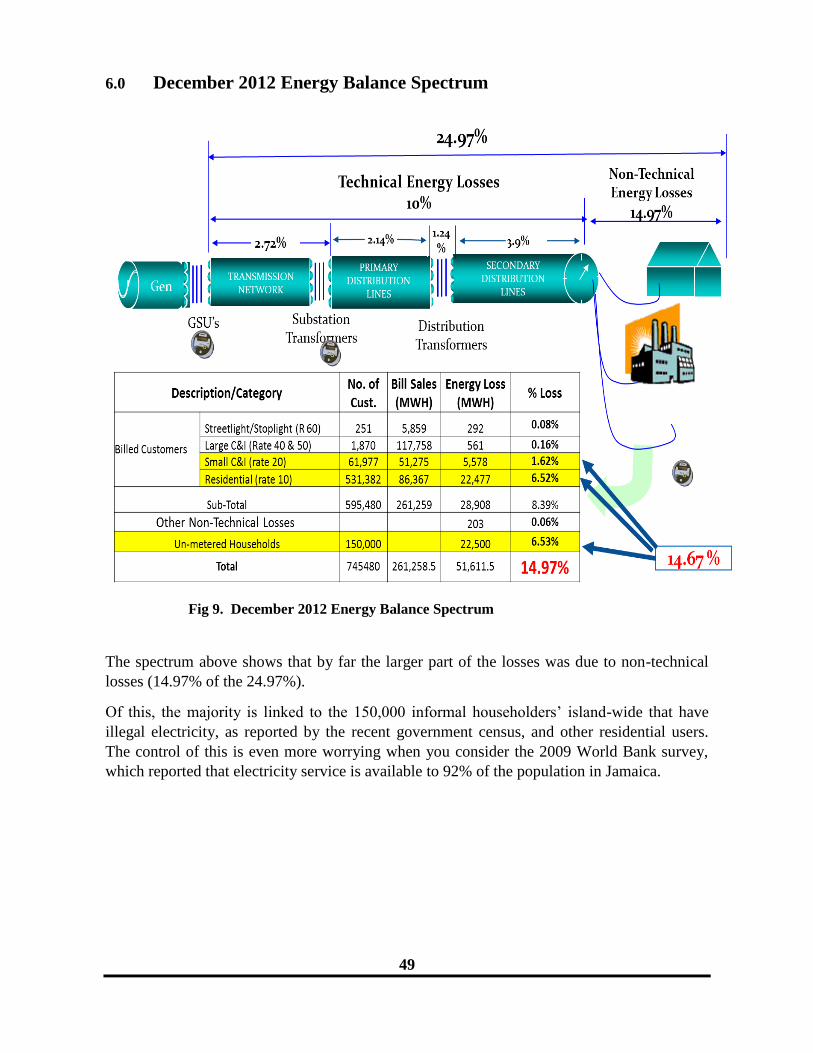
49
6.0 December 2012 Energy Balance Spectrum
The spectrum above shows that by far the larger part of the losses was due to non-technical
losses (14.97% of the 24.97%).
Of this, the majority is linked to the 150,000 informal householders‘ island-wide that have
illegal electricity, as reported by the recent government census, and other residential users.
The control of this is even more worrying when you consider the 2009 World Bank survey,
which reported that electricity service is available to 92% of the population in Jamaica.
Fig 9. December 2012 Energy Balance Spectrum

50
7.0 JPS 2013 Comprehensive Loss Reduction Strategies
Based on the list of strategies for 2013 outlined in Table 9, cumulatively, the
activities are expected to yield an annual recovery of 65.85 GWh, at an investment
of approximately US$ 27.27 million.
Capital Investment: US$ 13.63 million
Operating Expense: US$ 13.64 million
The plan is to maintain an ongoing reduction of losses across the system by multi-pronged
and sustainable activities such as;
a) Energy Balance Metering & Monitoring
b) Account Audit & Investigation of accounts
c) Strike Force operations – ―Take back Jamaica‖
d) Controlled Amnesty – Inactive to active Customer Re-engagement,
e) Recloser Energy Limiting Initiative (RELI)
f) Residential AMI and Commercial AMI
g) Technical Loss programmes
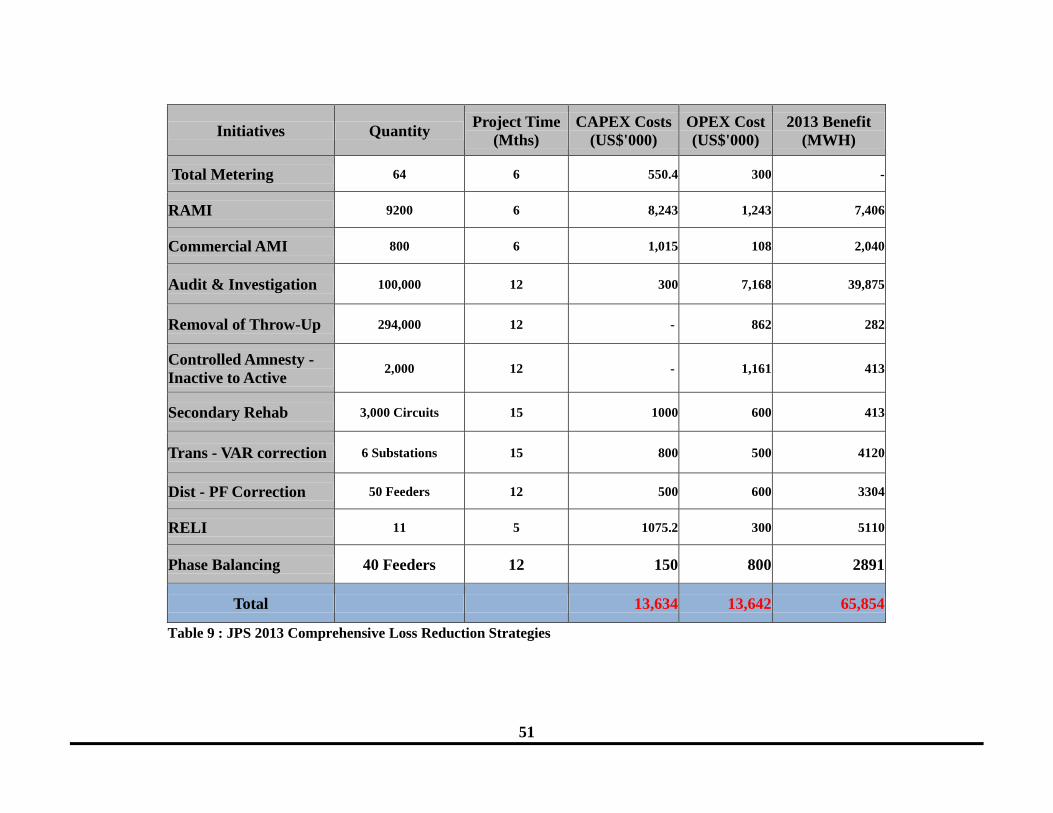
51
Initiatives Quantity Project Time
(Mths) CAPEX Costs
(US$'000) OPEX Cost
(US$'000) 2013 Benefit
(MWH)
Total Metering 64 6 550.4 300 -
RAMI 9200 6 8,243 1,243 7,406
Commercial AMI 800 6 1,015 108 2,040
Audit & Investigation 100,000 12 300 7,168 39,875
Removal of Throw-Up 294,000 12 - 862 282
Controlled Amnesty -
Inactive to Active 2,000 12 - 1,161 413
Secondary Rehab 3,000 Circuits 15 1000 600 413
Trans - VAR correction 6 Substations 15 800 500 4120
Dist - PF Correction 50 Feeders 12 500 600 3304
RELI 11 5 1075.2 300 5110
Phase Balancing 40 Feeders 12 150 800 2891
Total 13,634 13,642 65,854
Table 9 : JPS 2013 Comprehensive Loss Reduction Strategies
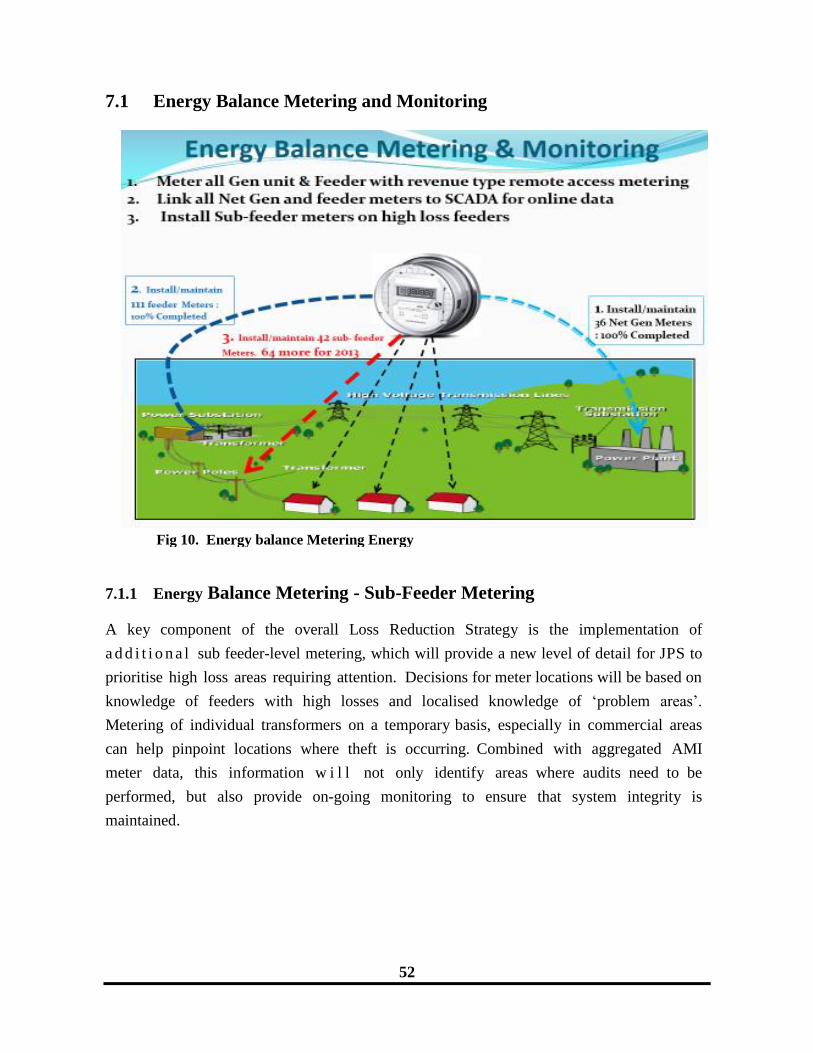
52
7.1 Energy Balance Metering and Monitoring
7.1.1 Energy Balance Metering - Sub-Feeder Metering
A key component of the overall Loss Reduction Strategy is the implementation of
a d d i t i o n a l sub feeder-level metering, which will provide a new level of detail for JPS to
prioritise high loss areas requiring attention. Decisions for meter locations will be based on
knowledge of feeders with high losses and localised knowledge of ‗problem areas‘.
Metering of individual transformers on a temporary basis, especially in commercial areas
can help pinpoint locations where theft is occurring. Combined with aggregated AMI
meter data, this information w i l l not only identify areas where audits need to be
performed, but also provide on-going monitoring to ensure that system integrity is
maintained.
Fig 10. Energy balance Metering Energy
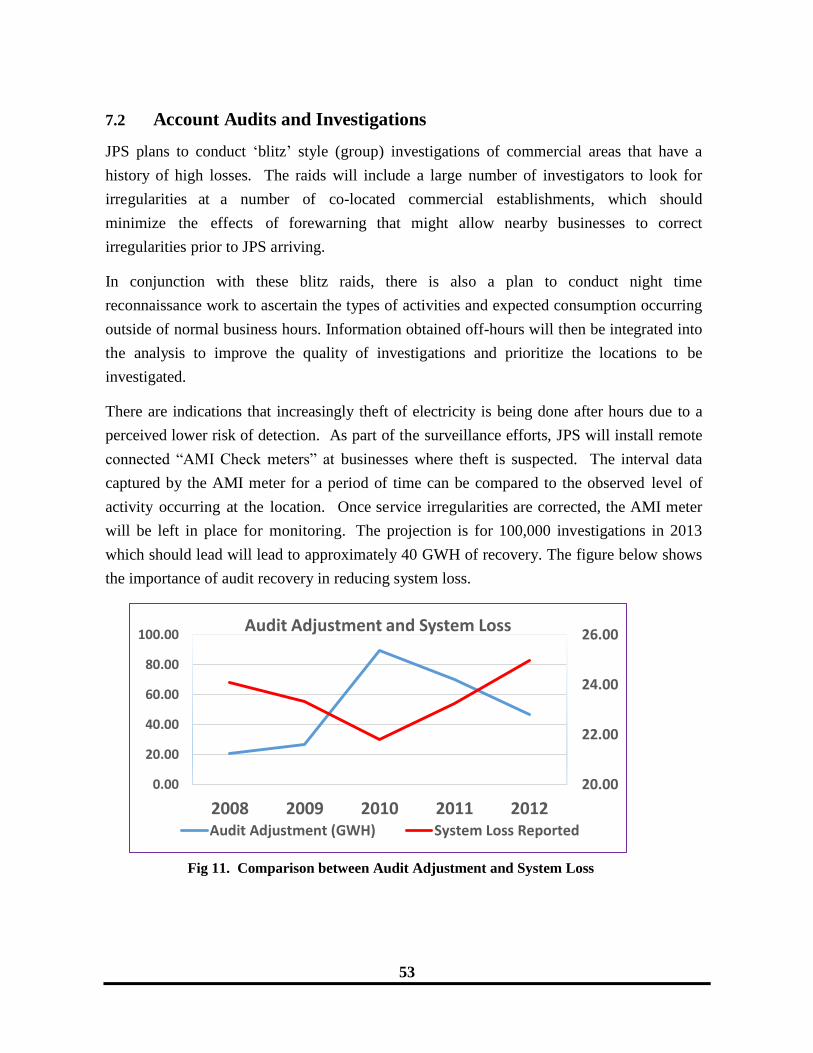
53
7.2 Account Audits and Investigations
JPS plans to conduct ‗blitz‘ style (group) investigations of commercial areas that have a
history of high losses. The raids will include a large number of investigators to look for
irregularities at a number of co-located commercial establishments, which should
minimize the effects of forewarning that might allow nearby businesses to correct
irregularities prior to JPS arriving.
In conjunction with these blitz raids, there is also a plan to conduct night time
reconnaissance work to ascertain the types of activities and expected consumption occurring
outside of normal business hours. Information obtained off-hours will then be integrated into
the analysis to improve the quality of investigations and prioritize the locations to be
investigated.
There are indications that increasingly theft of electricity is being done after hours due to a
perceived lower risk of detection. As part of the surveillance efforts, JPS will install remote
connected ―AMI Check meters‖ at businesses where theft is suspected. The interval data
captured by the AMI meter for a period of time can be compared to the observed level of
activity occurring at the location. Once service irregularities are corrected, the AMI meter
will be left in place for monitoring. The projection is for 100,000 investigations in 2013
which should lead will lead to approximately 40 GWH of recovery. The figure below shows
the importance of audit recovery in reducing system loss.
20.00
22.00
24.00
26.00
0.00
20.00
40.00
60.00
80.00
100.00
2008 2009 2010 2011 2012
Audit Adjustment and System Loss
Audit Adjustment (GWH) System Loss Reported
Fig 11. Comparison between Audit Adjustment and System Loss
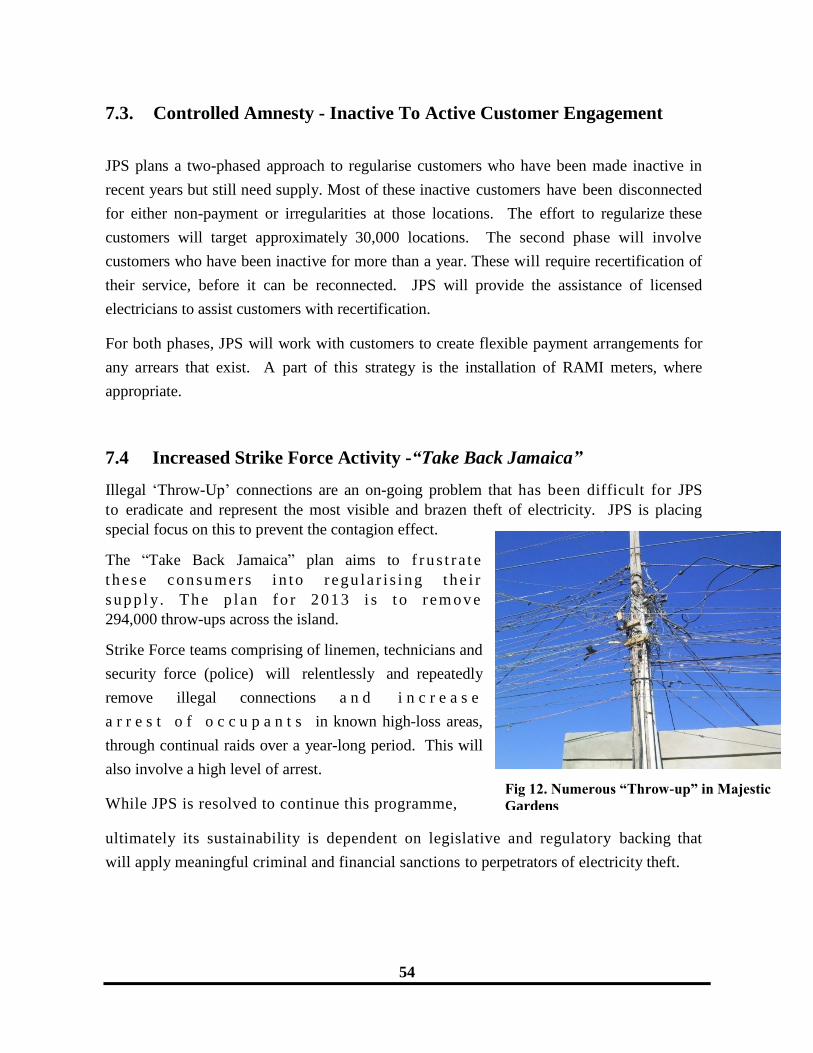
54
7.3. Controlled Amnesty - Inactive To Active Customer Engagement
JPS plans a two-phased approach to regularise customers who have been made inactive in
recent years but still need supply. Most of these inactive customers have been disconnected
for either non-payment or irregularities at those locations. The effort to regularize these
customers will target approximately 30,000 locations. The second phase will involve
customers who have been inactive for more than a year. These will require recertification of
their service, before it can be reconnected. JPS will provide the assistance of licensed
electricians to assist customers with recertification.
For both phases, JPS will work with customers to create flexible payment arrangements for
any arrears that exist. A part of this strategy is the installation of RAMI meters, where
appropriate.
7.4 Increased Strike Force Activity -“Take Back Jamaica”
Illegal ‗Throw-Up‘ connections are an on-going problem that has been difficult for JPS
to eradicate and represent the most visible and brazen theft of electricity. JPS is placing
special focus on this to prevent the contagion effect.
The ―Take Back Jamaica‖ plan aims to f r u s t r a t e
t h es e con su mer s i n to r egu la r i s i ng t h e i r
s up p l y. T h e p l an f o r 2 01 3 i s t o r em ov e
294,000 throw-ups across the island.
Strike Force teams comprising of linemen, technicians and
security force (police) will relentlessly and repeatedly
remove illegal connections a n d i n c r e a s e
a r r e s t o f o c c u p a n t s in known high-loss areas,
through continual raids over a year-long period. This will
also involve a high level of arrest.
While JPS is resolved to continue this programme,
ultimately its sustainability is dependent on legislative and regulatory backing that
will apply meaningful criminal and financial sanctions to perpetrators of electricity theft.
Fig 12. Numerous “Throw-up” in Majestic
Gardens
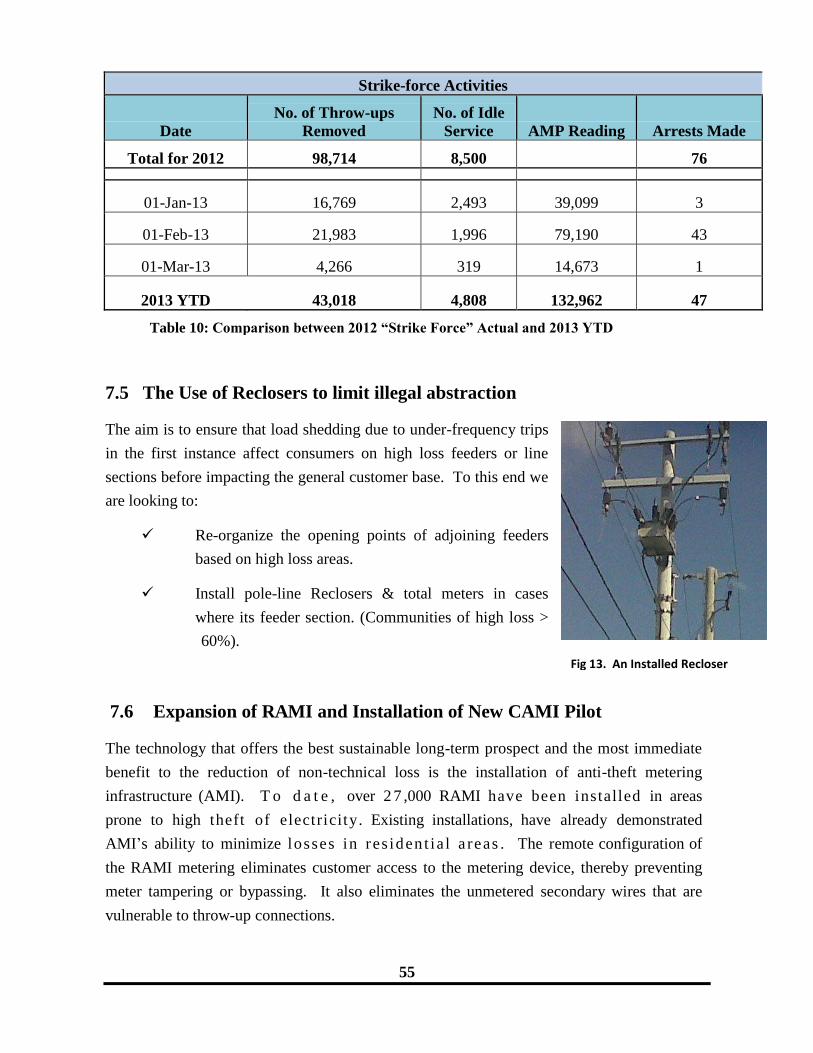
55
Strike-force Activities
Date
No. of Throw-ups
Removed
No. of Idle
Service AMP Reading Arrests Made
Total for 2012 98,714 8,500
76
01-Jan-13 16,769 2,493 39,099 3
01-Feb-13 21,983 1,996 79,190 43
01-Mar-13 4,266 319 14,673 1
2013 YTD 43,018 4,808 132,962 47
7.5 The Use of Reclosers to limit illegal abstraction
The aim is to ensure that load shedding due to under-frequency trips
in the first instance affect consumers on high loss feeders or line
sections before impacting the general customer base. To this end we
are looking to:
Re-organize the opening points of adjoining feeders
based on high loss areas.
Install pole-line Reclosers & total meters in cases
where its feeder section. (Communities of high loss >
60%).
7.6 Expansion of RAMI and Installation of New CAMI Pilot
The technology that offers the best sustainable long-term prospect and the most immediate
benefit to the reduction of non-technical loss is the installation of anti-theft metering
infrastructure (AMI). T o d a t e , over 2 7 ,000 RAMI have been installed in areas
prone to high theft of electricity. Existing installations, have already demonstrated
AMI‘s ability to minimize losses in r es iden t ia l a reas . The remote configuration of
the RAMI metering eliminates customer access to the metering device, thereby preventing
meter tampering or bypassing. It also eliminates the unmetered secondary wires that are
vulnerable to throw-up connections.
Table 10: Comparison between 2012 “Strike Force” Actual and 2013 YTD
Fig 13. An Installed Recloser
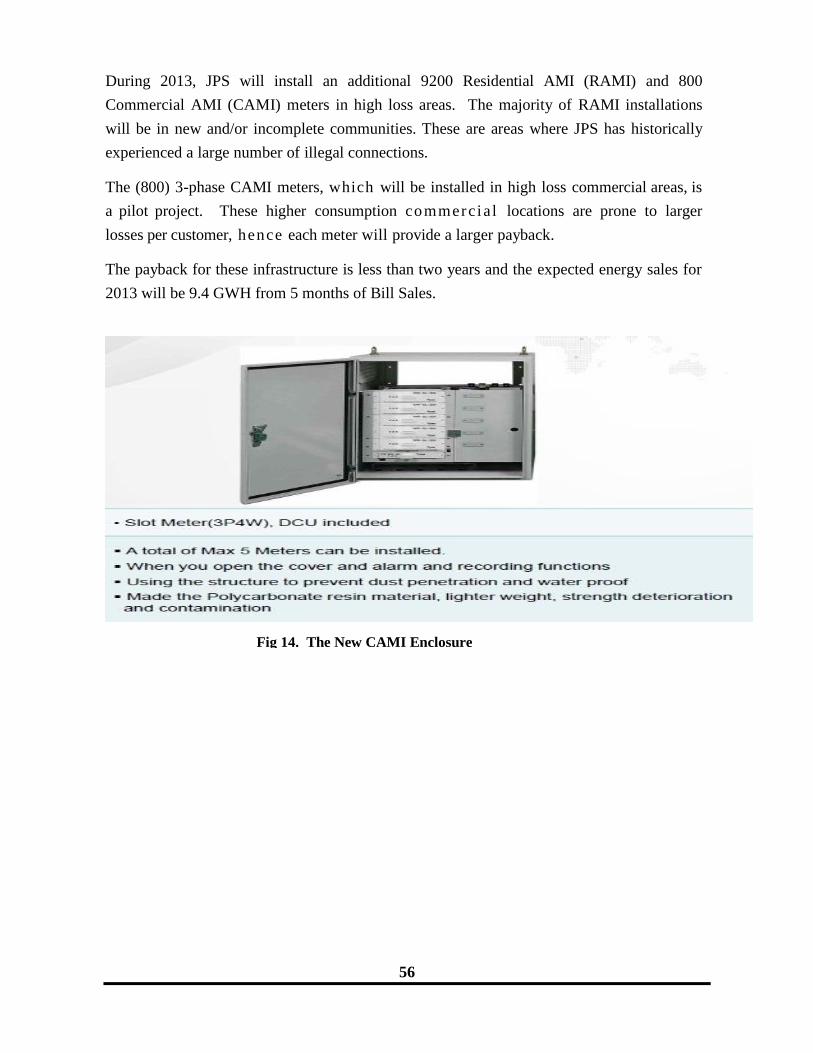
56
During 2013, JPS will install an additional 9200 Residential AMI (RAMI) and 800
Commercial AMI (CAMI) meters in high loss areas. The majority of RAMI installations
will be in new and/or incomplete communities. These are areas where JPS has historically
experienced a large number of illegal connections.
The (800) 3-phase CAMI meters, which will be installed in high loss commercial areas, is
a pilot project. These higher consumption commercia l locations are prone to larger
losses per customer, hence each meter will provide a larger payback.
The payback for these infrastructure is less than two years and the expected energy sales for
2013 will be 9.4 GWH from 5 months of Bill Sales.
Fig 14. The New CAMI Enclosure
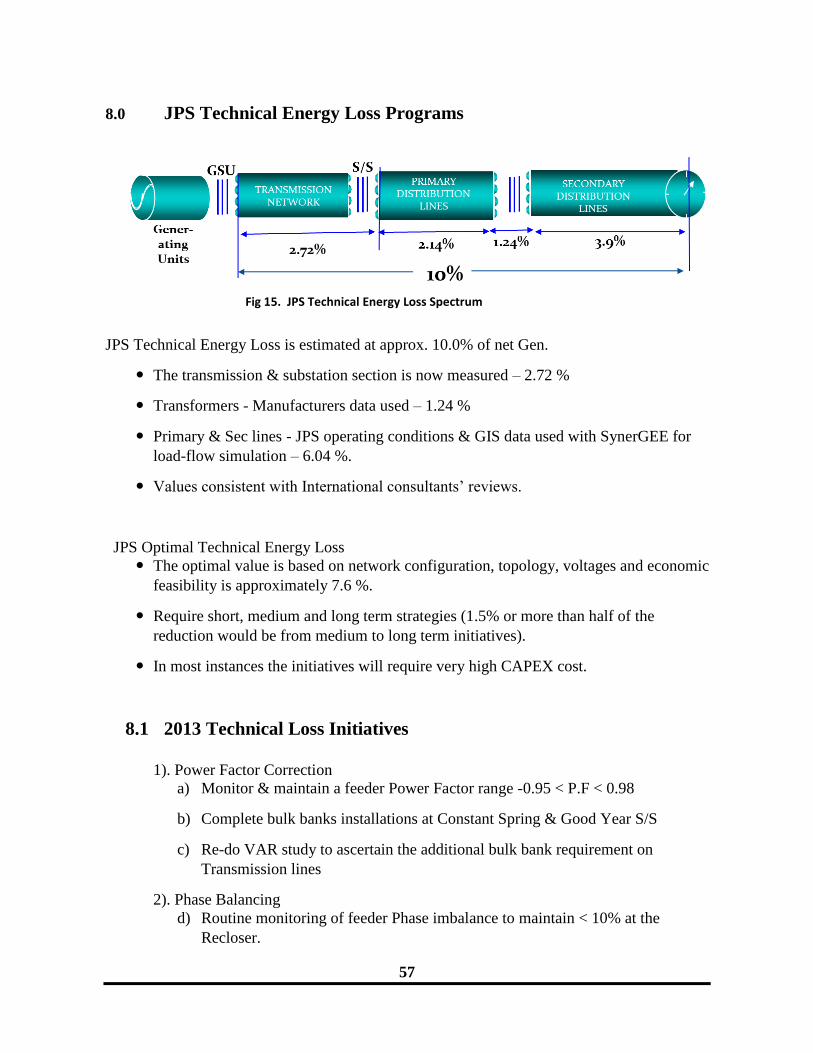
57
8.0 JPS Technical Energy Loss Programs
JPS Technical Energy Loss is estimated at approx. 10.0% of net Gen.
The transmission & substation section is now measured – 2.72 %
Transformers - Manufacturers data used – 1.24 %
Primary & Sec lines - JPS operating conditions & GIS data used with SynerGEE for
load-flow simulation – 6.04 %.
Values consistent with International consultants‘ reviews.
JPS Optimal Technical Energy Loss
The optimal value is based on network configuration, topology, voltages and economic
feasibility is approximately 7.6 %.
Require short, medium and long term strategies (1.5% or more than half of the
reduction would be from medium to long term initiatives).
In most instances the initiatives will require very high CAPEX cost.
8.1 2013 Technical Loss Initiatives
1). Power Factor Correction
a) Monitor & maintain a feeder Power Factor range -0.95 < P.F < 0.98
b) Complete bulk banks installations at Constant Spring & Good Year S/S
c) Re-do VAR study to ascertain the additional bulk bank requirement on
Transmission lines
2). Phase Balancing
d) Routine monitoring of feeder Phase imbalance to maintain < 10% at the
Recloser.
Fig 15. JPS Technical Energy Loss Spectrum

58
3). Distribution Voltage Standardization Program (VSP)
e) Redo study on cost-benefit of Primary Distribution voltage upgrade because of
the large increase in fuel price in recent times.
4). Secondary Rehabilitation
f) The majority of the Secondary rehabilitation will be realised from the RAMI
projects.
9.0 Pre-paid Metering Pilot
JPS has plans during 2013 to utilize RAMI customer locations to implement a pre-paid
metering p i l o t for 1 , 0 0 0 newly regularized customers. Prepaid metering has been used
successfully around the world for over 20 years. While it is not viewed as a direct loss
reduction strategy, pre-paid will be an important complementary programme to improve the
success rate for the other initiatives by providing post regularisation usage and budget control
for customers. JPS RAMI systems are prepay compatible, very easy to implement and
convenient for customers to use. Upon completion of the pilot, JPS will evaluate the cost
benefit of implementing a full prepaid programme.

59
Appendix IV: Outage Management System Implementation Status
Background JPS has been engaged in the development of an Outage Management System (OMS) since
2010 when the company commissioned an in-house customised programme to address a
narrowly defined need and therefore had very limited scope for integration with other critical
IT platforms across the Company. In September 2012, after a change of leadership within
the IT function at JPS, all on-going projects and existing systems were reviewed for
consistency in keeping with a new philosophy for systems implementation that was developed
with the following guiding tenets:
All systems, as far as is possible will be procured from leading edge vendors with
established products widely deployed
Customisation, will be kept to a minimum, and systems will be maintained in a
generic state as far as possible
The modern world class business process, usually embedded in these Tier 1 and Tier 2
systems will be adopted by JPS unless there are local safety and regulatory issues
which dictate otherwise
As far as is possible, disparate systems will be integrated in a cohesive manner to
reduce level of manual handoff and broken processes impacting the organisation
OMS RFP Process Based on the above, the development of the in-house Genome (OMS) was suspended in
October 2012, and a competitive Request For Proposal was issued to the market to acquire
and implement an off-the-shelf OMS.
After an initial research process, a formal Request for Information (RFI) document was
submitted to ten (10) established vendors as follows:-
Schneider (Telvent)
Milsoft
Oracle
IBM
Open Systems Interconnection
Ventyx ABB
Intergraph
TVD
Illuminat
Adjoined Business Solutions
A cross-functional evaluation team was formed to oversee the selection process. There were
seven responses, with two (2) vendors bidding on the Oracle product. Four (4) vendors were
shortlisted and invited to present their systems.
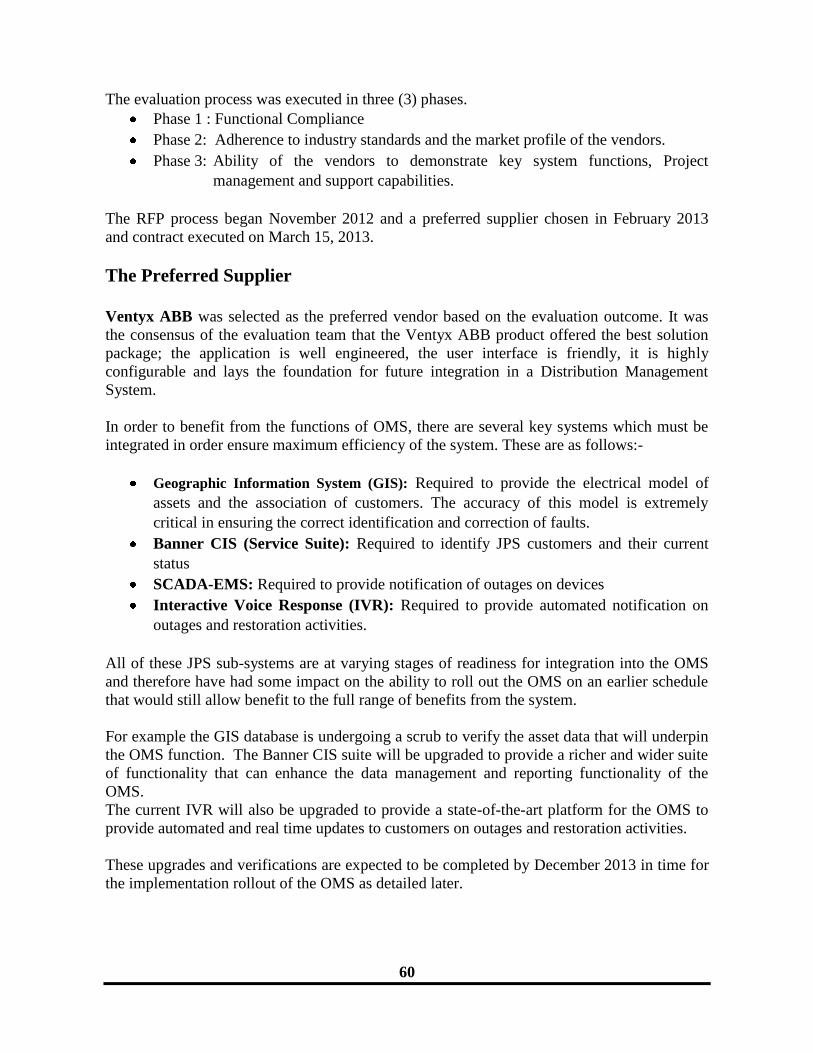
60
The evaluation process was executed in three (3) phases.
Phase 1 : Functional Compliance
Phase 2: Adherence to industry standards and the market profile of the vendors.
Phase 3: Ability of the vendors to demonstrate key system functions, Project
management and support capabilities.
The RFP process began November 2012 and a preferred supplier chosen in February 2013
and contract executed on March 15, 2013.
The Preferred Supplier
Ventyx ABB was selected as the preferred vendor based on the evaluation outcome. It was
the consensus of the evaluation team that the Ventyx ABB product offered the best solution
package; the application is well engineered, the user interface is friendly, it is highly
configurable and lays the foundation for future integration in a Distribution Management
System.
In order to benefit from the functions of OMS, there are several key systems which must be
integrated in order ensure maximum efficiency of the system. These are as follows:-
Geographic Information System (GIS): Required to provide the electrical model of
assets and the association of customers. The accuracy of this model is extremely
critical in ensuring the correct identification and correction of faults.
Banner CIS (Service Suite): Required to identify JPS customers and their current
status
SCADA-EMS: Required to provide notification of outages on devices
Interactive Voice Response (IVR): Required to provide automated notification on
outages and restoration activities.
All of these JPS sub-systems are at varying stages of readiness for integration into the OMS
and therefore have had some impact on the ability to roll out the OMS on an earlier schedule
that would still allow benefit to the full range of benefits from the system.
For example the GIS database is undergoing a scrub to verify the asset data that will underpin
the OMS function. The Banner CIS suite will be upgraded to provide a richer and wider suite
of functionality that can enhance the data management and reporting functionality of the
OMS.
The current IVR will also be upgraded to provide a state-of-the-art platform for the OMS to
provide automated and real time updates to customers on outages and restoration activities.
These upgrades and verifications are expected to be completed by December 2013 in time for
the implementation rollout of the OMS as detailed later.

61
The main users of the system will include the following groups:-
Customer Care Centre Agents: They will record outage information and provide
updates to customers on restoration activities
Dispatch Centre: The team will monitor outages received and dispatch and manage
outage activities.
GIS Engineers: The team will review the data disparities generated by the OMS are
effect the necessary changes.
OVERVIEW OF PROPOSED SYSTEM
The core of the chosen solution is the Ventyx Network Manager DMS Outage Management
that includes best in class technology. The solution includes Network Manager (OMS) for
core outage management and restoration solution.
The OMS is astorm proven solution that provides a technology solution that will allow JPS to
monitor, manage, report, and react quickly to changing conditions during a storm event. In
addition information can easily be disseminated through the organization as well as to
customers, public officials, and emergency responders.
In addition with an improved outage management and restoration process there are various
other procedures and processes that are internal to JPS that the technology by itself won‘t be
able to improve but will enable business process improvement.
Network Manager (OMS)
Network Manager is the first step in JPS replacing the current home-grown OMS; it will also
be the basis for the full solution and the base platform of Ventyx‘s key technology
components.
Network Manager OMS also provides JPS with the option to expand the functionality of the
OMS by adding advanced applications such as Fault Location, Restoration Switching
Analysis, Unbalanced Load Flow analysis on the same platform, utilizing the same network
model and user interface improving operator work flows and reducing the total cost of
ownership.
Architecture and Interfaces to Other JPS Systems
As shown in the diagram below, our OMS solution architecture consists of two tiers:
1. The control room tier, which consists of the main servers, and operator
workstations/clients located on a secure LAN.
2. The DMZ, which includes web servers for remote access to the system, call-taking,
dashboards, lower-level outage handling and crew assignment capabilities.
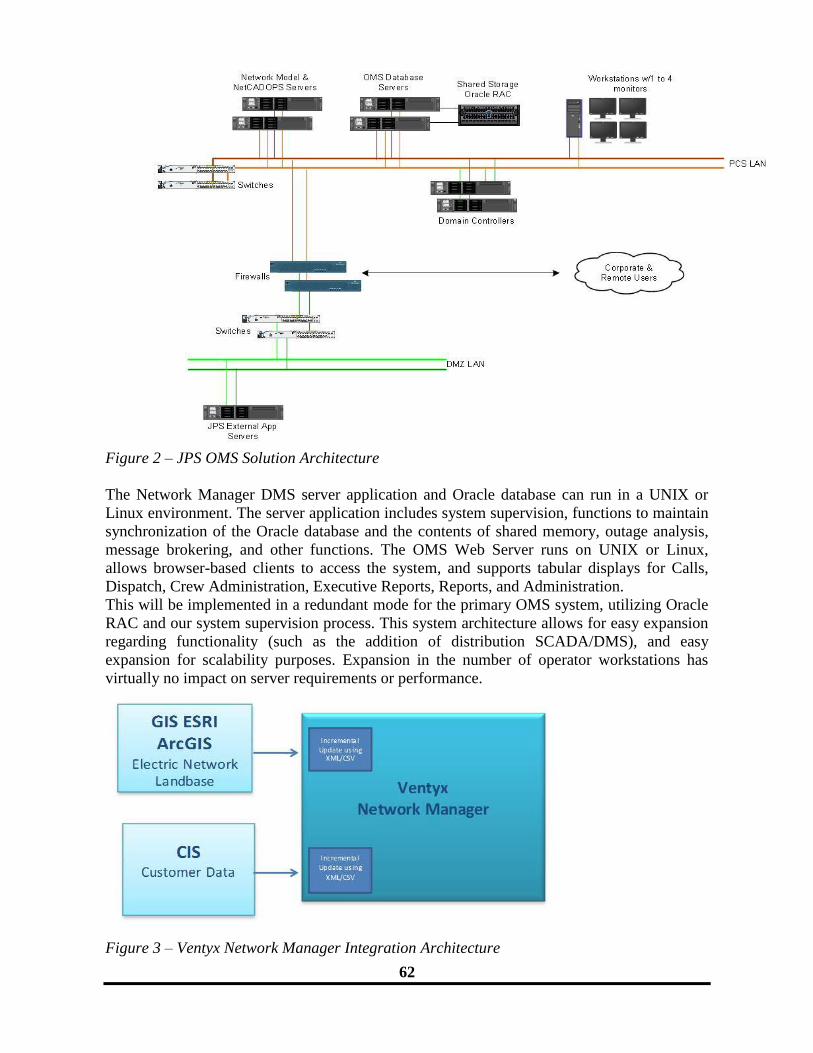
62
Figure 2 – JPS OMS Solution Architecture
The Network Manager DMS server application and Oracle database can run in a UNIX or
Linux environment. The server application includes system supervision, functions to maintain
synchronization of the Oracle database and the contents of shared memory, outage analysis,
message brokering, and other functions. The OMS Web Server runs on UNIX or Linux,
allows browser-based clients to access the system, and supports tabular displays for Calls,
Dispatch, Crew Administration, Executive Reports, Reports, and Administration.
This will be implemented in a redundant mode for the primary OMS system, utilizing Oracle
RAC and our system supervision process. This system architecture allows for easy expansion
regarding functionality (such as the addition of distribution SCADA/DMS), and easy
expansion for scalability purposes. Expansion in the number of operator workstations has
virtually no impact on server requirements or performance.
Figure 3 – Ventyx Network Manager Integration Architecture
63
GIS
Network Manager has been interfaced with a variety of GIS systems, including ESRI,
Intergraph, SmallWorld and several other GIS systems such as CableCAD, AutoCAD with
Oracle underneath and homegrown GIS systems. Data is extracted via XML files, comma
delimited text files or shared Oracle tables. The data is then imported into the Network
Manager DMS run-time environment using the Network Manager DMS incremental update
process.
CIS
Network Manager DMS standard API allows customer data to be updated either on a nightly
basis or on a near real-time basis for connects/disconnects. Many CIS systems have been
interfaced, including Customer One, SAP, Ventyx Customer Suite, ATS and various
homegrown systems.
Project Status
The contract with Ventyx for the implementation of OMS was executed on March 15, 2013.
Project start up is scheduled for April 8, 2013. The proposed milestone plan is included
below and is scheduled for 6 to 7 months. The system will support all outage efforts in JPS
from Q1 2014.
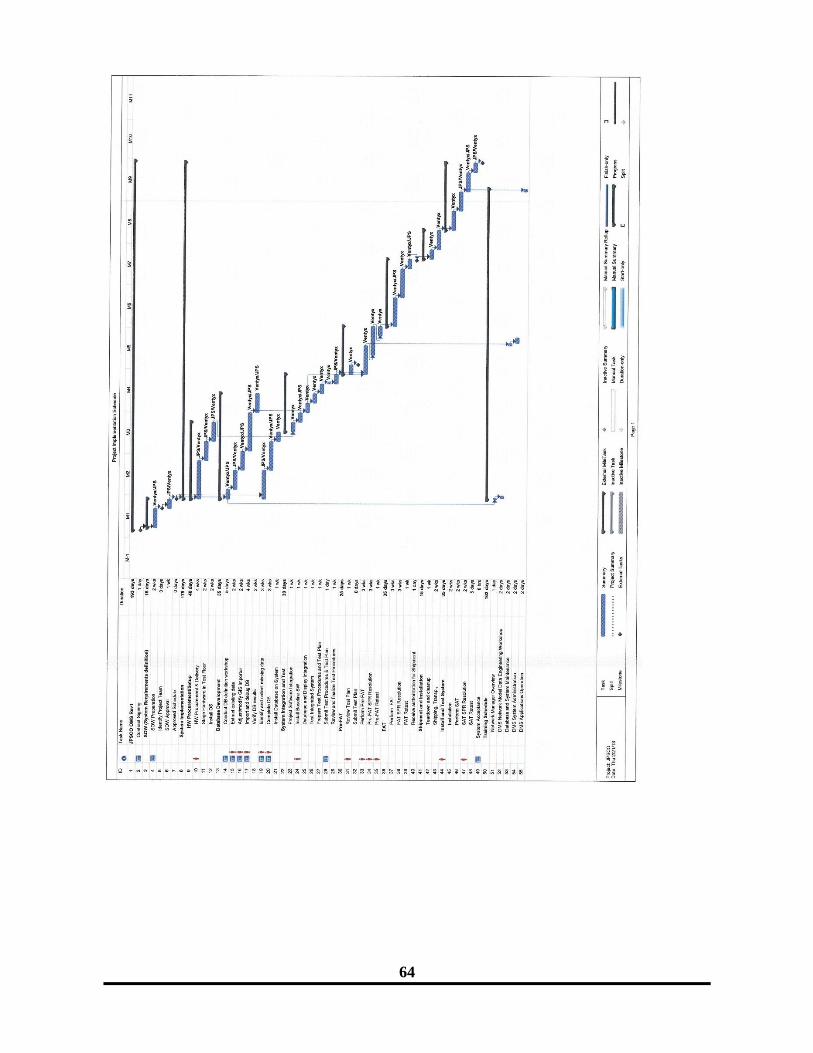
64
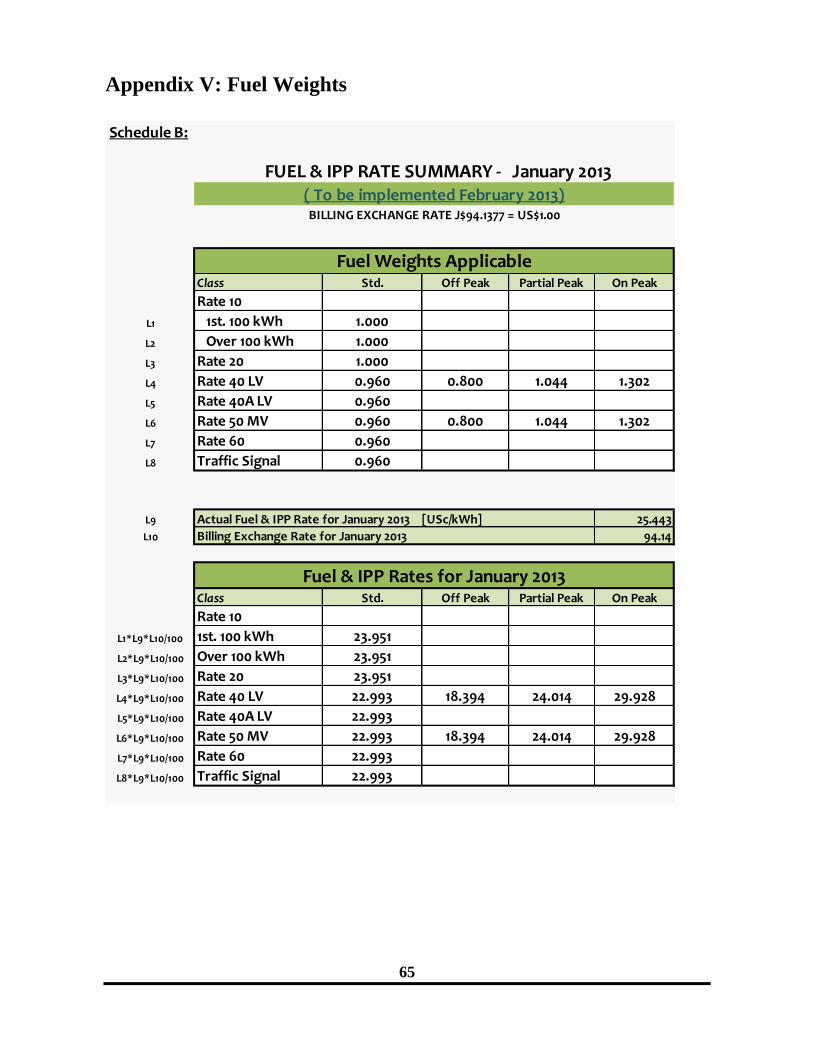
65
Appendix V: Fuel Weights
Schedule B:
January 2013
Class Std. Off Peak Partial Peak On Peak
Rate 10
L1 1st. 100 kWh 1.000
L2 Over 100 kWh 1.000
L3 Rate 20 1.000
L4 Rate 40 LV 0.960 0.800 1.044 1.302
L5 Rate 40A LV 0.960
L6 Rate 50 MV 0.960 0.800 1.044 1.302
L7 Rate 60 0.960
L8 Traffic Signal 0.960
L9 25.443
L10 94.14
Class Std. Off Peak Partial Peak On Peak
Rate 10
L1*L9*L10/100 1st. 100 kWh 23.951
L2*L9*L10/100 Over 100 kWh 23.951
L3*L9*L10/100 Rate 20 23.951
L4*L9*L10/100 Rate 40 LV 22.993 18.394 24.014 29.928
L5*L9*L10/100 Rate 40A LV 22.993
L6*L9*L10/100 Rate 50 MV 22.993 18.394 24.014 29.928
L7*L9*L10/100 Rate 60 22.993
L8*L9*L10/100 Traffic Signal 22.993
Actual Fuel & IPP Rate for January 2013 [USc/kWh]
Billing Exchange Rate for January 2013
Fuel & IPP Rates for January 2013
FUEL & IPP RATE SUMMARY - ( To be implemented February 2013)BILLING EXCHANGE RATE J$94.1377 = US$1.00
Fuel Weights Applicable

66