Embed Size (px)
Citation preview

The Israeli Economy: Current Trends, Strength and Challenges
Jerusalem Press Club
Dr. Karnit Flug
Governor of the Bank of Israel
05.02.2017
1

GDP per capita Growth Rates
GDP per capita annual % change (2000-2016)
2 Source : IMF
Israel
Developing Economies
Advanced Economies
*Advanced economies: Simple average for 21 rich OECD countries **Developing economies: IMF “emerging markets” definition
-6
-4
-2
0
2
4
6
8

Source: CBS, OECD ,IMF
80
90
100
110
120
130
140
150
160
170
80
90
100
110
120
130
140
150
160
170
80
90
100
110
120
130
140
150
160
170
Israel’s Exports and the World Trade
מדד מדד מדד
World Trade
Israel
OECD*
USA
OECD*
USA
Goods Services Goods & Services
3
Israel
Israel
Goods and Services exports in Israel & OECD and the world trade, 2015-2016 Index, Q1-2007=100

Geographical composition of Israel’s Exports
Sources: CBS 4
Europe 34%
USA 31%
Asia 6%
Other 29%
Geographical composition of Israel’s Exports of goods excluding diamonds, 2015
Europe
29%
USA 24%
Asia 25%
Other 23%
Geographical composition of Israel’s Exports of
Business services, 2014
5
Participation Rate
Employment rate
Unemployment rate
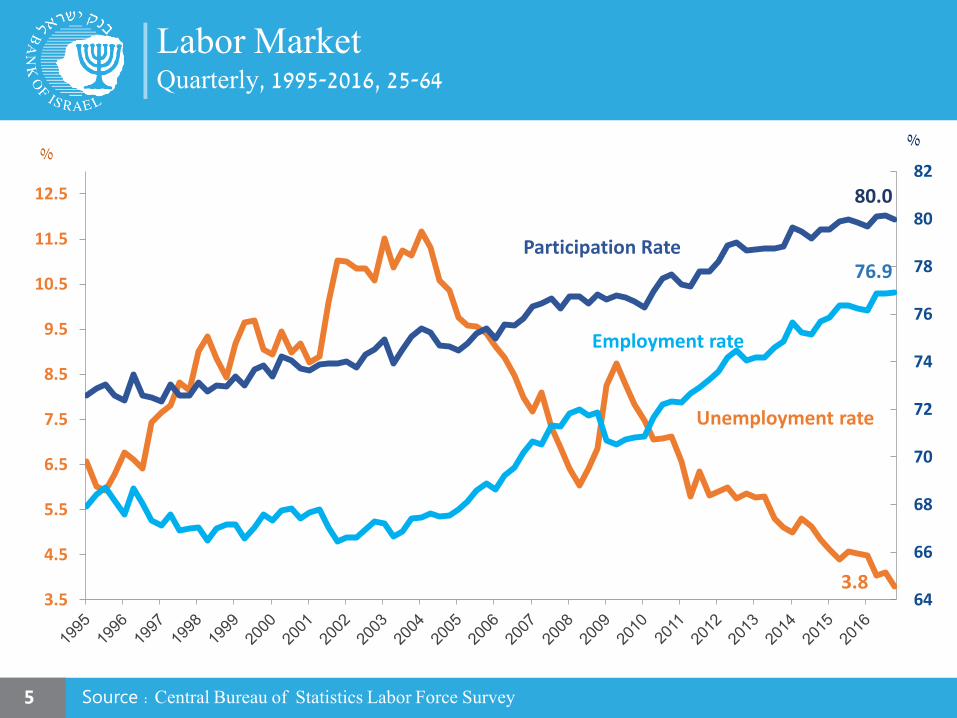
Labor Market Quarterly, 1995-2016, 25-64
% %
Source : Central Bureau of Statistics Labor Force Survey
3.8
80.0
76.9
64
66
68
70
72
74
76
78
80
82
3.5
4.5
5.5
6.5
7.5
8.5
9.5
10.5
11.5
12.5

Unemployment Rate, 25-64, 2015
0
5
10
15
20
25
Ko
rea
Icel
and
Jap
anM
exic
oN
orw
aySw
itze
rlan
dU
nit
ed K
ingd
om
New
Zea
lan
dU
nit
ed S
tate
sG
erm
any
Isra
elC
zech
Rep
ub
licA
ust
ralia
Au
stri
aC
hile
Den
mar
kEs
ton
iaSw
eden
Luxe
mb
ou
rgC
anad
aH
un
gary
Net
her
lan
ds
Po
lan
dO
ECD
Be
lgiu
mFi
nla
nd
Slo
ven
iaIr
elan
dTu
rkey
Fran
ceLa
tvia
Ital
ySl
ova
k R
epu
blic
Po
rtu
gal
Spai
nG
reec
e
%
Source: OECD and BoI 6
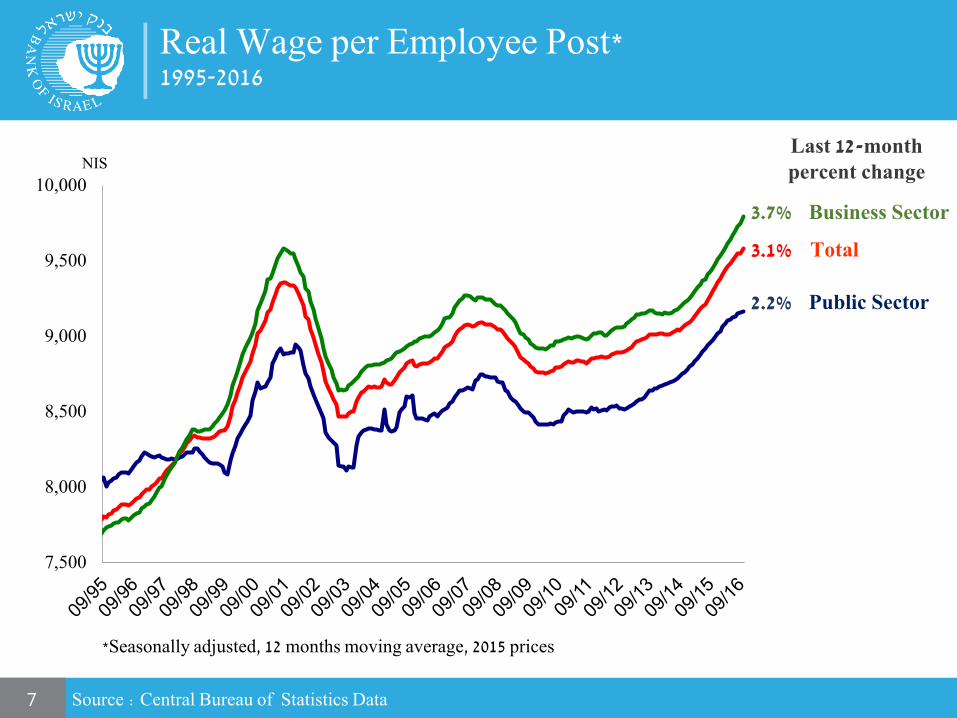
Real Wage per Employee Post* 1995-2016
NIS
*Seasonally adjusted, 12 months moving average, 2015 prices
Source : Central Bureau of Statistics Data 7
7,500
8,000
8,500
9,000
9,500
10,000
Last 12-month percent change
Business Sector
Total
Public Sector 2.2%
3.1%
3.7%

75%
2%
0% 13%
9% 1%
Banks Institutional Inverstors
Credit card companies Foreign residents
Government Households & others
Source: BoI 8
63% 13%
2%
13%
1% 8%
*Without credit to the government
The Financial System Structure
Distribution of Credit for Non-Financial Private Sector, by Lender
2000 2016

24%
7%
48%
21%
Banks
CurrentAccount
InstitutionalInvestors
Other
Source: BOI 9
38%
1% 36%
25%
The Financial System Structure
Distribution of the Public’s Assets Portfolio
2000 2016
*Other includes mostly cash, stocks and bonds held directly by the public
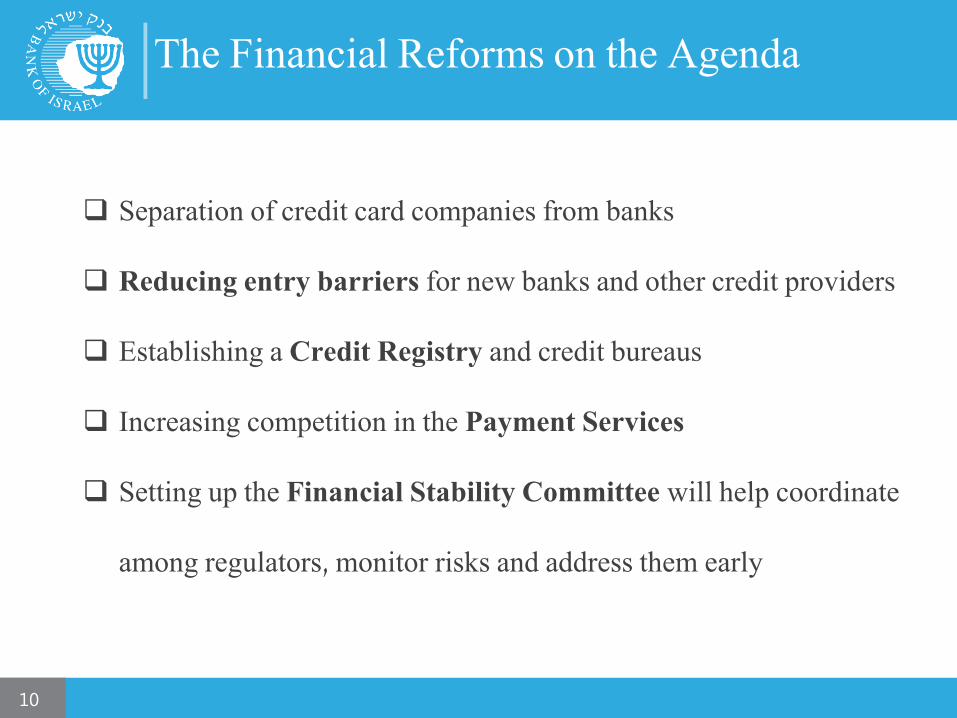
Separation of credit card companies from banks
Reducing entry barriers for new banks and other credit providers
Establishing a Credit Registry and credit bureaus
Increasing competition in the Payment Services
Setting up the Financial Stability Committee will help coordinate
among regulators, monitor risks and address them early
The Financial Reforms on the Agenda
10

Bank of Israel Policy
BOI’s Policy Objectives
Maintain price stability, as the central goal.
Support economic policy, primarily growth, employment and reducing social gaps.
Support the stability and orderly activity of the financial system.
12

-2
-1
0
1
2
3
4
5
6
7
%
* Forward inflation expectations 3-5 years
Inflation 12 month
Expectations Forward*
13 Source: Bol
Research Division Forecast
Actual Inflation and Inflation Expectations & Forecast, 2006-2018

Exchange Rates 2012-2016
NIS Index
Nominal Effective
14 Source : BoI
70
75
80
85
90
95
100
105
110
3.2
3.4
3.6
3.8
4.0
4.2
4.4
4.6
4.8
5.0
5.2
01
/12
03
/12
05
/12
07
/12
09
/12
11
/12
01
/13
03
/13
05
/13
07
/13
09
/13
11
/13
01
/14
03
/14
05
/14
07
/14
09
/14
11
/14
01
/15
03
/15
05
/15
07
/15
09
/15
11
/15
01
/16
03
/16
05
/16
07
/16
09
/16
11
/16
₪/$
₪/€
Index
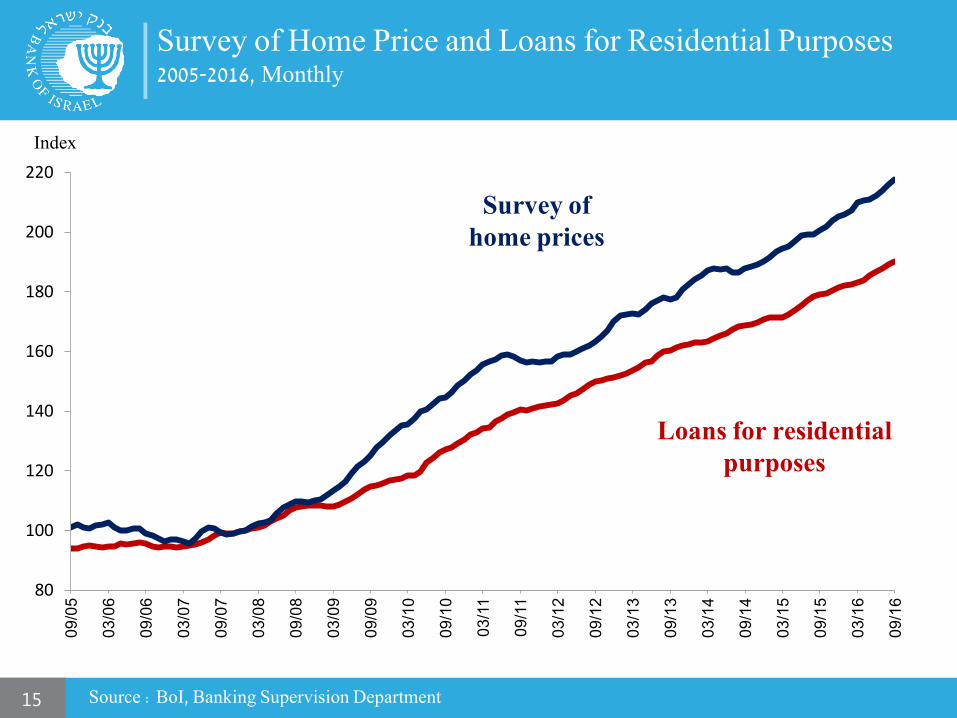
Survey of Home Price and Loans for Residential Purposes 2005-2016, Monthly
Source : BoI, Banking Supervision Department 15
Survey of home prices
Loans for residential purposes
80
100
120
140
160
180
200
220
09
/05
03
/06
09
/06
03
/07
09
/07
03
/08
09
/08
03
/09
09
/09
03
/10
09
/10
03
/11
09
/11
03
/12
09
/12
03
/13
09
/13
03
/14
09
/14
03
/15
09
/15
03
/16
09
/16

Bank of Israel Policy Tools 2007-2016
0.1 0
1
2
3
4
5
01/0
7 0
6/0
7 1
1/0
7 0
4/0
8 0
9/0
8 0
2/0
9 0
7/0
9 1
2/0
9 0
5/1
0 1
0/1
0 0
3/1
1 0
8/1
1 0
1/1
2 0
6/1
2 1
1/1
2 0
4/1
3 0
9/1
3 0
2/1
4 0
7/1
4 1
2/1
4 0
5/1
5 1
0/1
5 0
3/1
6 0
8/1
6
FX Intervention
(US$)
Interest Rate (%)
01/0009/1305/2701/4110/5406/6802/8210/9507/0903/23
01/0
7 0
6/0
7 1
1/0
7 0
4/0
8 0
9/0
8 0
2/0
9 0
7/0
9 1
2/0
9 0
5/1
0 1
0/1
0 0
3/1
1 0
8/1
1 0
1/1
2 0
6/1
2 1
1/1
2 0
4/1
3 0
9/1
3 0
2/1
4 0
7/1
4 1
2/1
4 0
5/1
5 1
0/1
5 0
3/1
6
Additional provision
for high LTV loans
Higher capital
requirements for
high LTV
Variable Interest
Rate limit
LTV limit
PTI limit and
capital requirem
ent
Higher capital
requirements for high LTV
Bond Purchases
18 Billion NIS
Higher capital
requirements
Macroprudential
Measures
16
Natural Gas Purchase program + Intervention
Building reserves Intervention
“The Monetary Committee assesses that monetary policy
will remain accommodative for a considerable time”
Source : Bol
0
500
1,000
1,500
2,000
2,500
3,000
01/0
7 0
6/0
7 1
1/0
7 0
4/0
8 0
9/0
8 0
2/0
9 0
7/0
9 1
2/0
9 0
5/1
0 1
0/1
0 0
3/1
1 0
8/1
1 0
1/1
2 0
6/1
2 1
1/1
2 0
4/1
3 0
9/1
3 0
2/1
4 0
7/1
4 1
2/1
4 0
5/1
5 1
0/1
5 0
3/1
6

Fiscal Policy

Budget Deficit* and Deficit Target (Percent of GDP, 2000-2016)
%
*Percent of GDP; excluding credit extended. The data refers to the deficit excluding the Bank of Israel’s profits.
Source : Bol 18
2.9 2.9
0
1
2
3
4
5
6
2000 2001 2002 2003 2004 2005 2006 2007 2008 2009 2010 2011 2012 2013 2014 2015 2016 2017 2018
New Budget Target

Source : Bol and the OECD. 19
40
50
60
70
80
90
100
2000 2001 2002 2003 2004 2005 2006 2007 2008 2009 2010 2011 2012 2013 2014 2015 2016
%
Public Debt - Israel
1.4
2.8
-4.0
-2.0
0.0
2.0
4.0
No
rway
Ko
rea
Swed
en
Luxem
bo
urg
Eston
iaFin
land
Switzerlan
dJap
anA
ustralia
New
zealand
De
nm
arkN
etherlan
ds
Cze
ch R
epu
blic
Can
ada
Germ
any
Slovak R
epu
blic
OEC
DP
olan
dA
ustria
France
Un
ited
Kin
gdo
mIre
land
Spain
Be
lgium
Sloven
iaIsraelU
nite
d State
sG
reece
Hu
ngary
Icelan
dItalyP
ortu
gal
General government net debt interest payments Per cent of nominal GDP 2016
Public Debt in Israel is Decreasing but Net Interest Payments are Still High in International Comparison

34.3
0
5
10
15
20
25
30
35
40
45
50
31.4
%
Source: OECD Revenue Statistics 2015
Tax Burden 2015, Percent of GDP
20

%
Public Expenditure Percent of GDP, 2016
38.2
46.1
15
20
25
30
35
40
45
50
55
60
21 Source : OECD
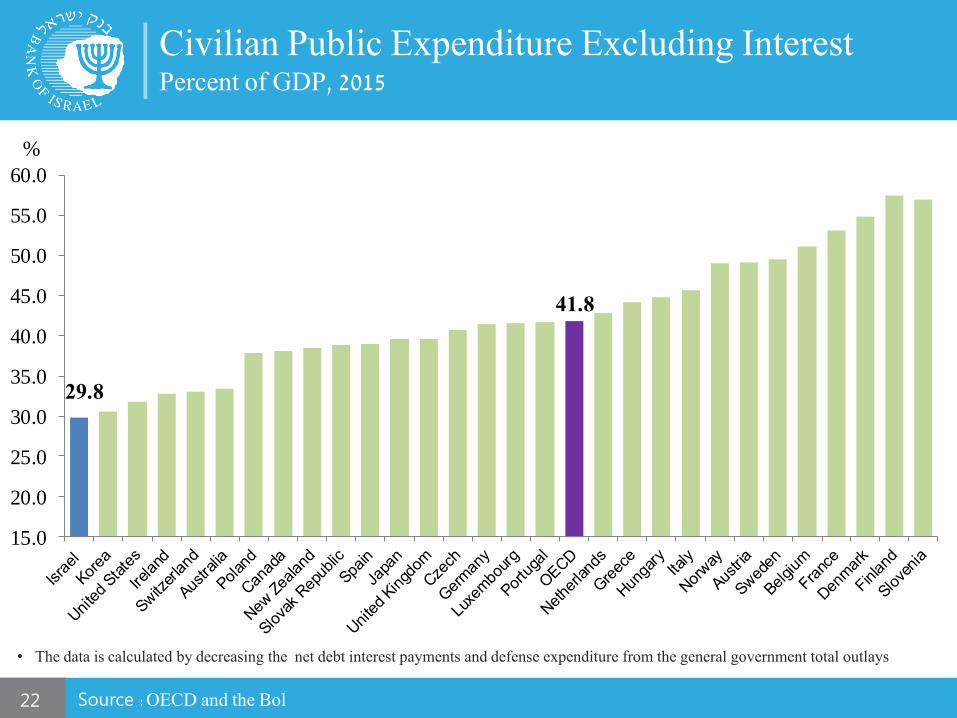
29.8
41.8
15.0
20.0
25.0
30.0
35.0
40.0
45.0
50.0
55.0
60.0
Source :OECD and the Bol
• The data is calculated by decreasing the net debt interest payments and defense expenditure from the general government total outlays
%
Civilian Public Expenditure Excluding Interest Percent of GDP, 2015
22
The Strengths Behind Israel’s Economy

0
10
20
30
40
50
60
Share of the Population Aged 25-64 with Tertiary-Level Education , 2015
%
Source : OECD Education at a Glance 2015 24

Israel is Leading in International Innovation Rankings
Source: World Economic Forum 2016-2017 & Bloomberg Innovation Report 2015 25
Factors in Israel that encourage innovation Quality universities that provide the economy with human
capital, scientific aptitude, and technological abilities Collaboration between the universities and industry Government support for commercial R&D Developed venture capital industry
Ranking 2 10
Index

• 73 Israeli companies are listed on Nasdaq
• Over 300 international companies established Israeli R&D centers
• More than 5,000 startups : The world’s greatest concentration of
high tech companies outside Silicon Valley
• Leading in cyber security: 430 cyber security companies and
startups. In 2015, Israel’s share of private investment in the field was
nearly 20% (second only to the US).
Source: Israel Innovation Authority, Nasdaq, The National Cyber Bureau 26
Israel’s Relative Advantages - Technology

0.0
10.0
20.0
30.0
40.0
50.0
60.0
70.0
80.0
27
Triadic Patent Families Number per million inhabitants, 2013
Source: OECD
125 148

Israel’s Relative Advantages – Water Innovation
• World leader in desalination; With a network
of five coastal desalination plants, which
together produce 75% of all water supply to
households.
• Leading in Waste-Water Recycling with a rate
of 86%.
• Israel developed and patented the “Drip
Irrigation”, that has not only produced huge
reduction in agricultural water use, but has also
vastly increased yields, and it is used
worldwide.
28 Source: Israeli Water Authority , “Natafim”, “Mekorot”.
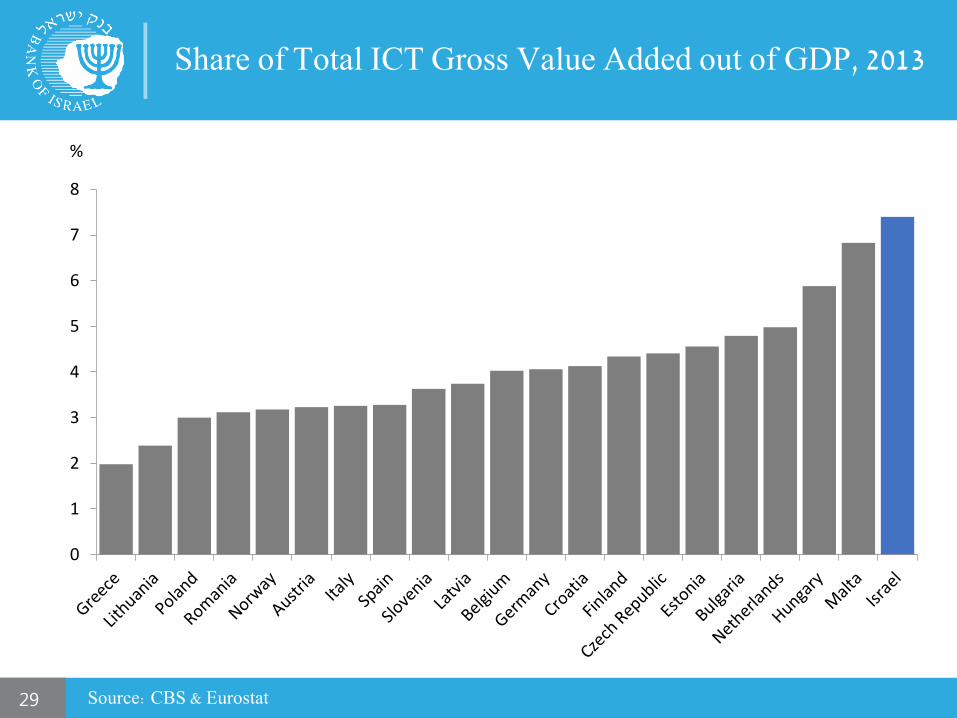
Share of Total ICT Gross Value Added out of GDP, 2013
0
1
2
3
4
5
6
7
8
Source: CBS & Eurostat 29
%
0.00%
0.05%
0.10%
0.15%
0.20%
0.25%
0.30%
0.35%
0.40%
0.45%
Gre
ece
Ital
y
Po
lan
d
Cze
ch R
epu
blic
Slo
vak
Rep
ub
lic
Slo
ven
ia
Spai
n
Au
stra
lia
Au
stri
a
Esto
nia
Ger
man
y
New
Zea
lan
d
Den
mar
k
Net
her
lan
ds
Be
lgiu
m
Po
rtu
gal
Fran
ce
Hu
nga
ry
No
rway
Swit
zerl
and
Un
ited
Kin
gdo
m
Jap
an
Irel
and
OEC
D
Fin
lan
d
Ko
rea
Swed
en
Can
ada
Un
ited
Sta
tes
Isra
el
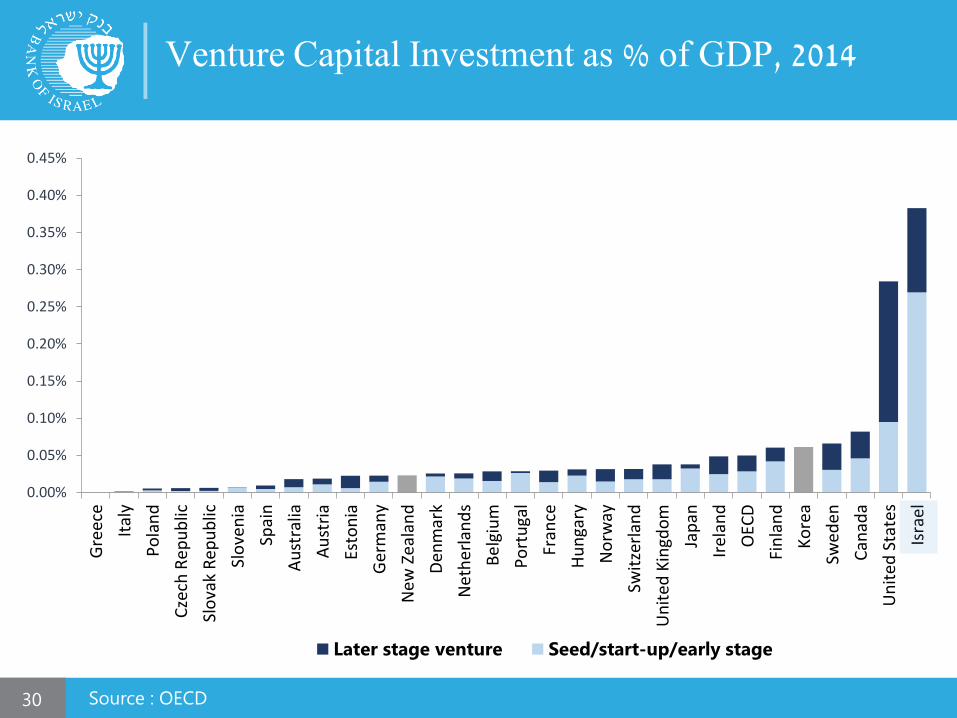
Later stage venture Seed/start-up/early stage
Venture Capital Investment as % of GDP, 2014
Source : OECD 30

424 474
260 246 246 342 306 319
379 292 328
242 202 210
83 5
102
129
90 77 148
186 194
235
282
296
348 446
596
787
788
643
69
67
29 37
17
32 37
44
34
30
24 20
22
8
2
1999 2000 2001 2002 2003 2004 2005 2006 2007 2008 2009 2010 2011 2012 2013 2014
Failed Running Successful
Flurry of High Tech Entrepreneurship: Taste for Risk Number of New Start-Ups by Year 1999-2014
31
Average: 640 new startups per year!
Source: IVC
Israeli Startup Companies: Number of Companies Established by Year and Success Index
1999-2014 8

Yet, There Are Challenges
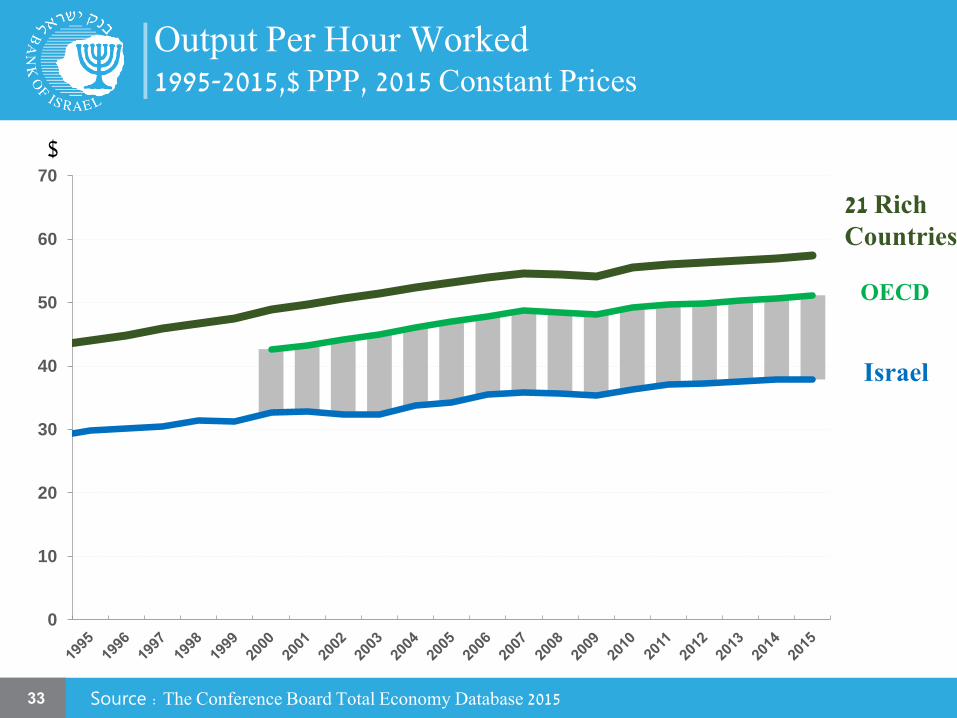
$
Source : The Conference Board Total Economy Database 2015
Output Per Hour Worked 1995-2015,$ PPP, 2015 Constant Prices
33
0
10
20
30
40
50
60
70
Israel
OECD
21 Rich Countries
34
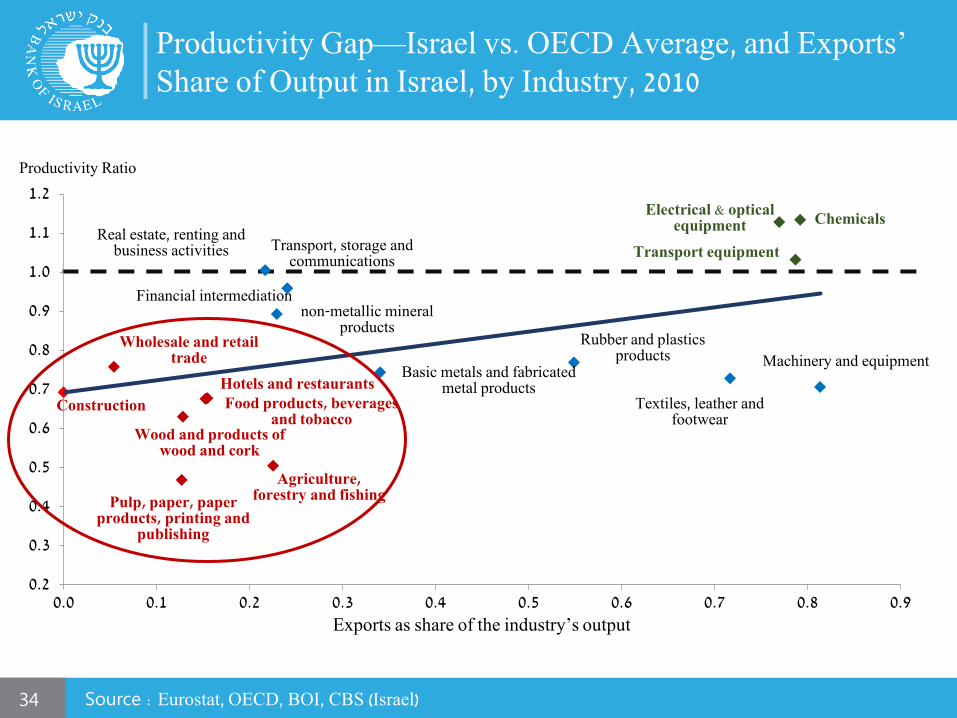
Agriculture, forestry and fishing
Food products, beverages and tobacco
Textiles, leather and footwear
Wood and products of wood and cork
Pulp, paper, paper products, printing and
publishing
Rubber and plastics products
non-metallic mineral products
Basic metals and fabricated metal products
Machinery and equipment
Electrical & optical equipment
Transport equipment
Construction
Wholesale and retail trade
Hotels and restaurants
Transport, storage and communications
Financial intermediation
Real estate, renting and business activities
Chemicals
0.2
0.3
0.4
0.5
0.6
0.7
0.8
0.9
1.0
1.1
1.2
0.0 0.1 0.2 0.3 0.4 0.5 0.6 0.7 0.8 0.9
Productivity Ratio
Exports as share of the industry’s output
Productivity Gap—Israel vs. OECD Average, and Exports’ Share of Output in Israel, by Industry, 2010
Source : Eurostat, OECD, BOI, CBS (Israel)

265
270
275
280
285
290
295
300
The Productivity Gap is the Result of Various Factors: Regulation, Human Capital & Trade Facilitation & Capital Stock
0
100,000
200,000
300,000
400,000
500,000
600,000
Me
xic
oP
ola
nd
Chile
Tu
rkey
New
Ze
ala
nd
Isra
el
Slo
vakia
Esto
nia
Hungary
Jap
an
Canada
Ice
lan
dA
ustr
alia
Cze
ch R
epublic
OE
CD
Slo
venia
United S
tate
sG
erm
any
Sw
eden
Sw
itzerlan
dU
nited K
ingdom
Latv
iaD
enm
ark
Fin
lan
dN
eth
erla
nds
Au
str
iaLuxem
bourg
Fra
nce
Po
rtuga
lB
elg
ium
Norw
ay
Sp
ain
Gre
ece
Irela
nd
Italy
Capital per employee in the business sector 2014, 2011 prices, $PPP
$
Source: BoI ,RAMA ,Doing Business
67
72
77
82
87
92
New
Ze
alan
dD
enm
ark
Ko
rea
No
rway
Un
ited
Kin
gdo
mU
nit
ed S
tate
sSw
eden
Esto
nia
Fin
lan
dLa
tvia
Au
stra
liaG
erm
any
Irel
and
Au
stri
aIc
elan
dC
anad
aP
ola
nd
Po
rtu
gal
Cze
ch R
epu
blic
Net
her
lan
ds
Fran
ceSl
ove
nia
Swit
zerl
and
Spai
nSl
ova
k R
epu
blic
Jap
anH
un
gary
Bel
giu
mM
exic
oIt
aly
Isra
elC
hile
Luxe
mb
ou
rgG
reec
eTu
rkey
Problems-solving in technology-rich environment scale, PIAAC survey
Aged 15+, 2015
35
Israel’s score
Doing Business 2017 Distance to Frontier (0-100)
10
12
14
16
18
20
Au
stra
liaN
eth
erla
nd
sIr
elan
dC
anad
aA
ust
ria
Swit
zerl
and
UK
Fin
lan
dN
ew Z
eal
and
USA
Jap
anSl
ove
nia
Den
mar
kK
ore
aP
ola
nd
Fran
ceSl
ova
kia
Ital
ySw
eden
Ger
man
yP
ort
uga
lM
exic
oSp
ain
Bel
giu
mC
hile
No
rway
Luxe
mb
urg
Cze
ch R
epu
blic
Esto
nia
Turk
eyH
un
gary
Isra
elG
ree
ce
OECD Trade Facilitation Indicators 2014
36
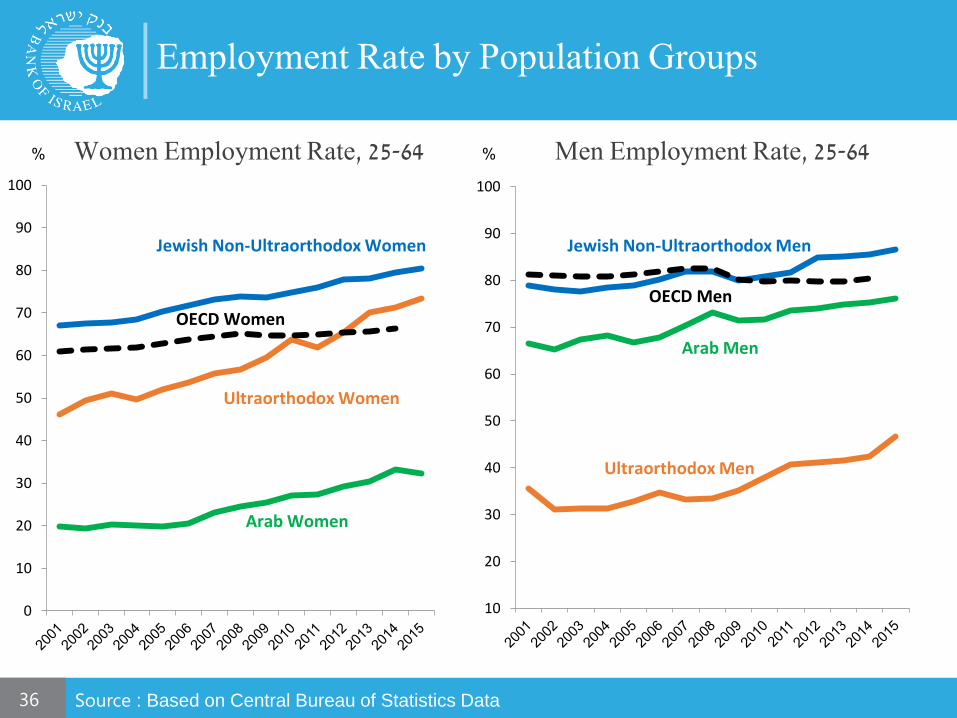
%
Source : Based on Central Bureau of Statistics Data
Women Employment Rate, 25-64 % Men Employment Rate, 25-64
Employment Rate by Population Groups
10
20
30
40
50
60
70
80
90
100
Jewish Non-Ultraorthodox Men
Ultraorthodox Men
Arab Men
OECD Men
0
10
20
30
40
50
60
70
80
90
100
Jewish Non-Ultraorthodox Women
Ultraorthodox Women
Arab Women
OECD Women

High Poverty rate and Income Inequality
Source: OECD 37
Gini Index, 2014, at disposable income, post taxes
and transfers Israel 2015
0
0.1
0.2
0.3
0.4
0.5
0.6
Icel
and
No
rway
Den
mar
kSl
ove
nia
Fin
lan
dC
ezch
Rep
ub
licB
elgi
um
Slo
vak
Rep
ub
licA
ust
ria
Luxe
mb
urg
Swed
enN
eth
elan
ds
Hu
nga
ryG
erm
any
Fran
ceSw
itze
rlan
dP
ola
nd
Ko
rea
Irel
and
OEC
DC
anad
aIt
aly
Jap
anN
ew Z
eala
nd
Au
stra
liaP
ort
uga
lG
ree
ceSp
ain
Latv
iaU
nit
red
Kin
gdo
mEs
ton
iaIs
rael
Turk
eyU
nit
ed
Sta
tes
Mex
ico
Ch
ile
0
2
4
6
8
10
12
14
16
18
20
Icel
and
Den
mar
kC
ezch
Rep
ublic
Fin
land
Nor
way
Fra
nce
Slo
vak
Rep
ublic
Luxe
mbu
rgN
ethe
land
sS
witz
erla
ndS
wed
enIr
elan
dA
ustr
iaG
erm
any
Slo
veni
aN
ew Z
eala
ndB
elgi
umH
unga
ryU
nite
d K
ingd
omP
olan
dO
EC
DC
anad
aA
ustr
alia
Italy
Por
tuga
lLa
tvia
Kor
eaG
reec
eS
pain
Japa
nE
ston
iaM
exic
oC
hile
Tur
key
Uni
ted
Sta
tes
Isra
el 2
015
Poverty rate, 2014 Israel 2015
38
To Sum Up
The Israeli Economy has a great potential, but while part of the
economy utilizes its strengths and resources, inclusive growth of
the economy as a whole requires a comprehensive and persistent
policy.
The main pillars of such policy should address economic inequality,
inefficient regulation and the need to increase both investment and
human capital.

Thank You