Embed Size (px)
Citation preview

Ple
ase
note
that
this
is a
n au
thor
-pro
duce
d P
DF
of a
n ar
ticle
acc
epte
d fo
r pub
licat
ion
follo
win
g pe
er re
view
. The
def
initi
ve p
ublis
her-
auth
entic
ated
ver
sion
is a
vaila
ble
on th
e pu
blis
her W
eb s
ite
1
The ISME Journal July 2014, Volume 8, Pages 1370-1380 http://dx.doi.org/10.1038/ismej.2013.250 © 2014 International Society for Microbial Ecology All rights reserved 1751-7362/14
Archimer http://archimer.ifremer.fr
Microorganisms persist at record depths in the subseafloor of the Canterbury Basin
Maria-Cristina Ciobanu1, 2, 3, Gaëtan Burgaud4, 8, Alexis Dufresne5, 8, Anja Breuker6, Vanessa Rédou4, Sarah Ben Maamar1, Frédéric Gaboyer1, 2, 3, Odile Vandenabeele-Trambouze1, 2, 3, Julius
Sebastian Lipp7, Axel Schippers6, Philippe Vandenkoornhuyse5, Georges Barbier4, Mohamed Jebbar1, 2, 3, Anne Godfroy1, 2, 3 and Karine Alain1, 2, 3, *
1 Université de Bretagne Occidentale (UBO, UEB), IUEM—UMR 6197, Laboratoire de Microbiologie des Environnements Extrêmes (LMEE), Plouzané, France 2 CNRS, IUEM—UMR 6197, LMEE, Plouzané, France 3 Ifremer, UMR6197, LMEE, Plouzané, France 4 Université de Brest, UEB, Laboratoire Universitaire de Biodiversité et d’Ecologie Microbienne EA 3882, IFR148 SFR ScInBioS, ESIAB, Plouzané, France 5 Université de Rennes I, CNRS, UMR 6553 ECOBIO, Rennes, France 6 Bundesanstalt für Geowissenschaften und Rohstoffe (BGR), Hannover, Germany 7 Organic Geochemistry Group, Department of Geosciences and MARUM Center for Marine Environmental Sciences, University of Bremen, Bremen, Germany *: Corresponding author : Karine Alain, email address : [email protected]
Abstract: The subsurface realm is colonized by microbial communities to depths of >1000 meters below the seafloor (m.b.sf.), but little is known about overall diversity and microbial distribution patterns at the most profound depths. Here we show that not only Bacteria and Archaea but also Eukarya occur at record depths in the subseafloor of the Canterbury Basin. Shifts in microbial community composition along a core of nearly 2 km reflect vertical taxa zonation influenced by sediment depth. Representatives of some microbial taxa were also cultivated using methods mimicking in situ conditions. These results suggest that diverse microorganisms persist down to 1922 m.b.sf. in the seafloor of the Canterbury Basin and extend the previously known depth limits of microbial evidence (i) from 159 to 1740 m.b.sf. for Eukarya and (ii) from 518 to 1922 m.b.sf. for Bacteria. Keywords: deep biosphere ; subsurface life ; eukaryote ; record depth
Introduction
In addition to terrestrial and marine near-surface habitats, the deep biosphere is considered to be a third realm for microbial life. Subseafloor sediments provide a habitat for large numbers of microbial cells, as revealed by cell counts (Parkes et al., 2000) or CARD-FISH (Schippers et al., 2005). Although recent data have shown that the global biomass in subseafloor sediments is smaller than given by earlier estimates, the deep subseafloor biosphere still constitutes a large fraction (2.9 × 1029 cells) of Earth’s living biomass (Kallmeyer et al., 2012).
The subsurface microbiota is diverse and complex, hosting metabolically active communities down to depths of >1000 meters below the seafloor (m.b.sf.), as revealed by molecular, metagenomic and metatranscriptomic studies (Lipp et al., 2008; Roussel et al., 2008; Biddle et al., 2011; Pawlowski et al., 2011; Orsi et al.

3
2013a). It harbors representatives from the three domains of life, i.e., numerous endemic 51 and/or as yet uncultured Archaea and Bacteria (e.g., Orcutt et al., 2011; Inagaki et al. 52 2006), in addition to bacterial endospores (Lomstein et al., 2012), protists and fungi 53 belonging to Eukarya (Schippers et al., 2006; Edgcomb et al., 2011; Orsi et al., 2013a, 54 2013b). Occurrence of capsid-encoding organisms has also been confirmed (Engelhardt 55 et al., 2011). Although in subsurface sediment shallower than 1000 mbsf background 56 molecular data on bacterial and archaeal lineages exists (e.g., Orcutt et al., 2011; 57 Inagaki et al. 2006), most deep-subsurface microorganisms detected so far were 58 refractory to cultivation (Sass and Parkes, 2011). The diversity of deeply buried 59 microorganisms remains untapped, as subseafloor prokaryotic culturability in most 60 studies is less than 0.1% of all microscopically detected cells (D’Hondt et al., 2004). 61 Remarkably, when wide enrichment collections targeting different physiological groups 62 such as fermenters, sulfate-reducers and methanogens were performed using different 63 subseafloor sediments, these often led to the isolation of the same few “generalist” 64 bacteria (e.g., Batzke et al., 2007). In most cases, the retrieved bacterial genera were 65 adapted to a broader spectrum of environmental conditions (e.g., broad temperature 66 range for growth) compared to their surface counterparts (Sass and Parkes, 2011). 67 So far, within subseafloor sediments, active Bacteria have been identified down to 518 68 mbsf (Bale et al., 1997), active Archaea down to 1626 mbsf (Roussel et al., 2008), and 69 active microeukaryotes down to 159 mbsf (Orsi et al., 2013a), but we are still eager to 70 know the depth limit of the deep subsurface biosphere. Limits to microbial habitability 71 in subseafloor sediments are set by a variety of physical and chemical parameters like 72 temperature, pH, pressure, salinity, porosity, availability of energy, nutrients and water, 73 and maybe also by age since there was water exchange within the sediment pores. The 74
4
present study site is not characterized by particularly extreme conditions but stands out 75 from sites previously examined by its depth and low porosity. The depth limit of the 76 deep biosphere remains an important issue to place bounds on the volume of the 77 subseafloor biosphere and to guide the search for deep life capabilities/adaptation and 78 the role of microorganisms in global nutrient cycles. We hypothesized that life could 79 exist in even deeper sediments if pore space was sufficient. 80 In this study, we investigated the subsurface microbial communities from a core of 1927 81 m length collected in the Canterbury Basin (344 m water depth), off the coast of New 82 Zealand at site U1352, which was drilled during the Integrated Ocean Drilling Program 83 (IODP) Expedition 317 with DS Joides Resolution. Our purpose was to investigate 84 vertical distribution of microbial communities, abundance and evenness of taxa above 85 and below 1000 mbsf depth. We developed a highly stringent massive parallel tagged-86 amplicon sequencing of 16S-18S hypervariable regions of small-subunit (SSU) rRNA 87 gene (Fig. S1-S2, Tables S1-S3), coupled with cell counts, real-time PCR (phylogenetic 88 and functional genes) and cultivation approaches. This rigorous method was applied to 89 sediment/carbonate rocks spanning epochs from the Holocene to late Eocene. 90 91 Materials and methods 92 Site description and sampling 93 Three holes (A, B and C) were drilled at Site U1352 (44°56’26.62’’S; 172°1’36.30’’E), 94 reaching a total depth of 1927.5 m CSF-A, and thus spanning the Holocene to late Eocene 95 epochs. Fluorescent microspheres were used as tracers for contamination during drilling. 96 Sampling was processed under strict contamination controls onboard and offshore and only 97 samples with no detectable contamination were used for this study (Fulthorpe et al., 2011). 98

5
Onboard, only the center parts of unconsolidated sediments and intact pieces of rocks that had 99 been exposed to UV radiation after washing were kept for microbiological analyses, as reported 100 elsewhere (Expedition 317 Scientists, 2011). Subsamples were immediately frozen at –80°C for 101 onshore molecular analyses, stored at 4°C under an anaerobic gas phase for later cultivation, 102 and stored at 4°C in a 3% NaCl/3% formalin solution for cell counting. Detailed information on 103 sampling/subsampling of sediment, contamination controls and on depth scale terminology are 104 provided in Supplementary Text. 105 106 Lithological, physical and geochemical data 107 Environmental data were acquired onboard during IODP Expedition 317, as reported elsewhere 108 (Fulthorpe et al., 2011). 109 110 DNA extraction, PCR amplification and contamination controls 111 DNA extractions were made from 16 samples collected all along the core. In order to avoid 112 contamination, all handling was carried out in a PCR cabinet exclusively dedicated to low 113 biomass sediment samples (PCR cabinet; Captair®Bio, Erlab), using Biopur 1.5 mL Safe-Lock 114 micro test tubes (Eppendorf), ultrapure PCR water (Ozyme) and UV-treated (> 40 min) 115 plasticware and micropipettes. Negative controls (reaction mixture without DNA) were included 116 in each set of PCR reactions. In addition, a negative control (e.g., negative DNA extraction) was 117 prepared for each work stage, to ensure that no contamination with exogenous amplifiable DNA 118 occurred during the different stages of sample treatment. The FastDNA™ Spin Kit for Soil 119 (#6560-200, MP Biomedicals®) was used to perform DNA extractions, with few modifications. 120 Detailed information on DNA extractions and PCR amplifications are provided in 121 Supplementary Information. Primer sequences used in this study are detailed in Table S2 and 122 primer sets for direct and nested PCR amplifications are detailed in Fig. S2. 123 124
6
454-Pyrosequencing 125 For each DNA extract, four independent 25 µL PCR amplifications were run with fusion primer 126 pairs specific for Bacteria, Archaea and Eukarya, as detailed in Table S3. PCR products were 127 pooled two by two, so as to have two independent replicates for pyrosequencing. Potential 128 contaminants from lab reagents were excluded through the sequencing of negative-control 129 samples and the removal of OTUs containing sequences retrieved in negative controls. Detailed 130 information on 454-pyrosequencing, quality filtration, trimming, clustering and taxonomic 131 affiliation are provided in Supplementary Text. 132 133 Cell counts 134 Total prokaryotic cells were enumerated in triplicate from 13 uncontaminated sediment samples 135 collected all along the core, using the cell extraction protocol (protocol FCM-A) described by 136 Morono et al. (2011) until step 9. Then, all supernatants containing extracted cells were filtered 137 onto 0.2 µm filters (Anodisc, Whatman) and stained with SYBR®Green I (Invitrogen), as 138 described elsewhere (Noble and Fuhrman, 1998). Filters were counted in epifluorescence mode, 139 with an Olympus BX60 microscope (objective 100×, pH3, WIB filter) (details in 140 Supplementary Text). 141 142 Real-time PCR measurements 143 Quantifications of different lineages and diverse functional genes were performed all along the 144 core by quantitative, real-time PCR (Q-PCR). Quantifications of Bacteria, Archaea, Eukarya, 145 JS1-Chloroflexi, and Geobacteriaceae were performed using previously described Q-PCR 146 assays based on the detection of 16S or 18S rRNA (Schippers et al., 2012). These assays were 147 carried out using TaqMan® or SYBR®Green chemistries. DNA copy numbers were also 148 determined for the following functional genes: mcrA for alpha subunit of the methyl coenzyme 149
7
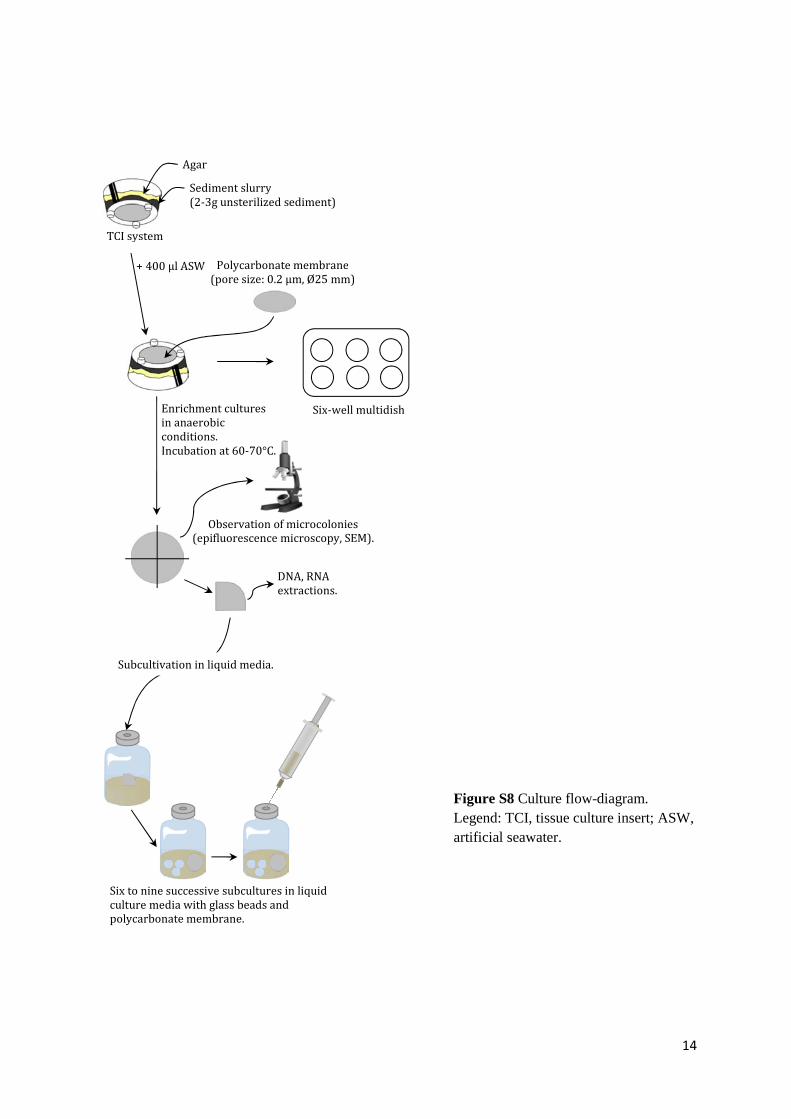
M reductase, dsrA for the alpha subunit of the sulfite (bi)reductase, aprA for the alpha subunit 150 of the adenosine-5’-phosphosulfate reductase and cbbL for the large subunit of the enzyme 151 ribulose-1.5-bisphosphate carboxylase/oxygenase (RubisCO, form I “red-like”), as described 152 elsewhere (Schippers et al., 2012). 153 154 Cultures and approaches used for their analysis 155 A sediment slurry membrane system was used for cultivation (Ferrari et al., 2008) (Fig. S8; 156 details in Supplementary Information). Different anaerobic metabolisms found in the subsurface 157 biosphere were targeted in culture: fermentation, sulfate-reduction and 158 methanogenesis/acetogenesis. Media, culture conditions, viability and identification procedures 159 of cells are described in Supplementary Text. 160
161 Statistical analyses 162 Principal Component Analysis (PCA) was used to help in visualization of high-dimensional 163 data. An order abundance matrix was combined with environmental parameters, using 164 XLSTAT, to assess relationships between microbial taxa and ecological variables (Addinsoft 165 USA, New York, USA). A second complementary approach was based on regularized canonical 166 correlation analyses (RCCA), which were performed to highlight correlations between the order 167 abundance matrices (X) and the environmental parameters (Y) using the R software CCA 168 package. 169 170 Results and Discussion 171 Core description 172

8
The core lithology was characterized by horizontal gradual layers, from unconsolidated 173 sediments (clay, marl) to carbonate rocks (Fig. 1). The core was composed of three 174 lithological units (UI, UII and UIII). Unit I (0–711 m CSF-A, meters of core depth 175 below seafloor computed by conventional method A, corresponding to mbsf; see “IODP 176 depth scale terminology” at www.iodp.org/program-policies/) was predominantly 177 characterized by a transition from mud-rich sediment to marl. Unit II (711–1853 m 178 CSF-A) consisted of hemipelagic/pelagic sediment from calcareous sandy mud to sandy 179 sandstone. Unit III (1853–1924 m CSF-A) was characterized by a sharp change 180 (Marshall unconformity: ~12 Ma are missing) that occurred at 1853 m CSF-A, and was 181 formed of hemipelagic to pelagic foraminifer-bearing nannofossil limestone of early 182 Oligocene to late Eocene age (Fig. 1). The temperature at the bottom of the hole was 183 estimated to be in the range 60°C–100°C on the basis of thermal conductivity 184 measurements and geochemical results (Fulthorpe et al., 2011). Below 1000 m CSF-A, 185 sediments were replaced by consolidated sedimentary calcium carbonate rocks with 186 porous horizons of glauconite. Porosity decreased with depth and mean pore-size was 187 around 2-4 µm at the hole bottom. In carbonate rocks, numerous fractures and stylolites 188 were observed (Fig. S3). Organic carbon content was low (<0.6 wt %), with only a few 189 samples having >1 wt % TOC (Fig. 1). The organic matter quality changed from 190 relatively labile volatile material in the shallower sediments to more stable protokerogen 191 with increasing depth. Methane and ethane both occurred below 11.7 and 18.2 m CSF-192 A and the relative ethane content increased with increasing burial depth and temperature 193 (Fig. 1). Low but increasing concentrations of C3-C5 and occasionally C6 alkanes were 194 also measured with depth (18). pH values were close to 7.5 and stable from the surface 195 to 1164 m CSF-A (18). Sulfate concentration decreased gradually in the first meters of 196
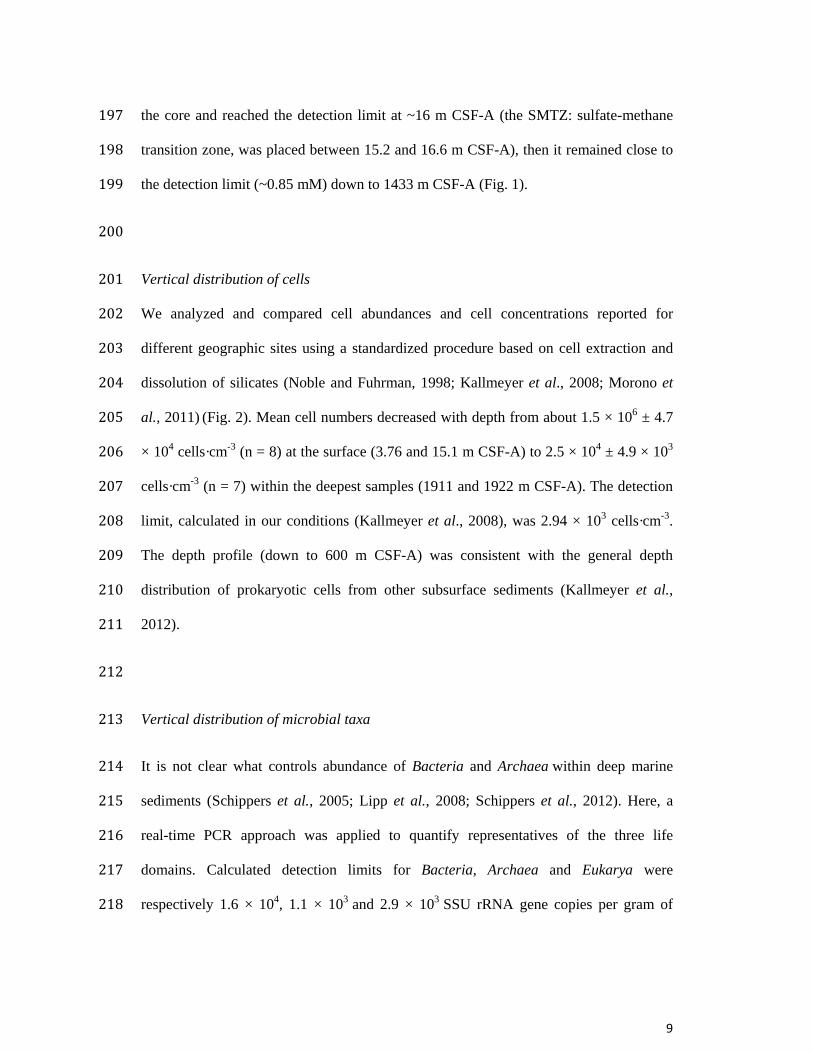
9
the core and reached the detection limit at ~16 m CSF-A (the SMTZ: sulfate-methane 197 transition zone, was placed between 15.2 and 16.6 m CSF-A), then it remained close to 198 the detection limit (~0.85 mM) down to 1433 m CSF-A (Fig. 1). 199 200 Vertical distribution of cells 201 We analyzed and compared cell abundances and cell concentrations reported for 202 different geographic sites using a standardized procedure based on cell extraction and 203 dissolution of silicates (Noble and Fuhrman, 1998; Kallmeyer et al., 2008; Morono et 204 al., 2011) (Fig. 2). Mean cell numbers decreased with depth from about 1.5 × 10⁶ ± 4.7 205 × 104 cells·cm-3 (n = 8) at the surface (3.76 and 15.1 m CSF-A) to 2.5 × 10⁴ ± 4.9 × 10³ 206 cells·cm-3 (n = 7) within the deepest samples (1911 and 1922 m CSF-A). The detection 207 limit, calculated in our conditions (Kallmeyer et al., 2008), was 2.94 × 10³ cells·cm-3. 208 The depth profile (down to 600 m CSF-A) was consistent with the general depth 209 distribution of prokaryotic cells from other subsurface sediments (Kallmeyer et al., 210 2012). 211 212 Vertical distribution of microbial taxa 213 It is not clear what controls abundance of Bacteria and Archaea within deep marine 214 sediments (Schippers et al., 2005; Lipp et al., 2008; Schippers et al., 2012). Here, a 215 real-time PCR approach was applied to quantify representatives of the three life 216 domains. Calculated detection limits for Bacteria, Archaea and Eukarya were 217 respectively 1.6 × 10⁴, 1.1 × 10³ and 2.9 × 10³ SSU rRNA gene copies per gram of 218

10
sediment (wet weight). Archaea were the most abundant within the first meters, while 219 Bacteria dominated the rest of the core (Fig. 2). Archaeal SSU rRNA gene copy 220 numbers strongly decreased with depth (from 1.8 × 10⁶ to 1 × 10³ gene copies·g-1, 221 corresponding roughly to 1 × 10⁶ to 6 × 10² cells·g-1) and were no longer detectable 222 below 650 m CSF-A. A similar depth distribution was observed for eukaryotic SSU 223 rRNA gene copy numbers, but abundances were relatively constant with depth (~104 224 copies·g-1). Bacterial SSU rRNA gene copy numbers were low (~106 copies·g-1 ≈ 2.5 × 225 105 cells·g-1) at the surface and decreased with depth up to 1600 m CSF-A (8 × 10⁴ 226 copies·g-1 ≈ 2 × 10⁴ cells·g-1). 227 Along with these measures, deep sequencing allowed the detection limits to be lowered 228 and masked lineages to be revealed. We pyrosequenced bacterial (V4-V5), archaeal 229 (V1-V3) and eukaryotic (V1-V3) SSU rRNA gene amplicons from sixteen depth 230 horizons and one negative control, pooled together in one single dataset with two PCR-231 replicates per sample to overcome PCR and sequencing errors (Fig. S1). Sequences 232 were grouped into OTUs (Operational Taxonomic Units) with a 97% identity threshold. 233 Sequence composition of the OTUs was then analyzed, and OTUs entirely composed of 234 sequences that had appeared in a single PCR only were excluded from the diversity 235 analyses. All the sequences kept appeared at least twice independently. Potential 236 contaminants from laboratory reagents were excluded through the sequencing of 237 negative-control samples and the removal of OTUs containing sequences retrieved in 238 negative controls. The remaining OTUs were used to calculate non-parametric diversity 239 indices (Fig. 3, Fig. S4-S6) and compared to the SILVA 111 database for taxonomic 240 affiliation. Pyrosequencing results were congruent with the data discussed above. 241 Archaeal sequences could not be amplified and sequenced for samples below 634 m 242

11
CSF-A, as observed with real-time PCR analyses. The non-detection of archaeal 16S 243 rRNA genes below 650 m CSF-A using two different amplification methods suggests 244 that Archaea are likely rare or absent at great depths in the Canterbury Basin. 245 Eukaryotic sequences were detected down to 1740 m CSF-A and bacterial sequences 246 were found up to the maximal depth of 1922 m CSF-A. The observed species richness 247 (i.e., number of OTUs) was extremely low in comparison with other microbial habitats 248 investigated so far, including extreme environments (e.g., Roalkvam et al., 2012). 249 Indeed, only 198, 16 and 40 unique bacterial, archaeal and eukaryotic OTUs, at 3% 250 dissimilarity level, were detected in the entire cored sequence (Fig. S4, Tables S4-S5). 251 Chao1 estimator revealed a vertical decrease in microbial richness with increasing depth 252 (Fig. 3). Richness estimates for Archaea and Eukarya dropped off gradually with depth 253 and reached only 2 and 4 OTUs respectively at the deepest depth for which a PCR 254 signal was obtained. Beta diversity estimators (i.e., diversity among samples) revealed a 255 strong differentiation between communities with depth and a strong vertical 256 structuration (Fig. S5). 257 Archaeal diversity showed high abundances of MBG-B (Marine Benthic Group B) and 258 MCG (Miscellaneous Crenarchaeotal Group), two archaeal groups typically found in 259 subseafloor sediments (Lloyd et al., 2013). Representatives of the as-yet-uncultured 260 lineages MBG-B, MBG-E (Marine Benthic Group E) and MCG were the predominating 261 taxa in surficial layers, while MCG was the most consistently detected archaeal lineage 262 down to 346 m CSF-A (Fig. 2). MBG-B and MCG members are heterotrophic Archaea 263 frequently found in surficial marine sediments (Biddle et al., 2006; Lloyd et al., 2013). 264 Thermococcales dominated archaeal diversity of the sediment horizon at 634 m CSF-A. 265 Methanogens and anaerobic methanotrophs (ANME) were not detected, in agreement 266
12
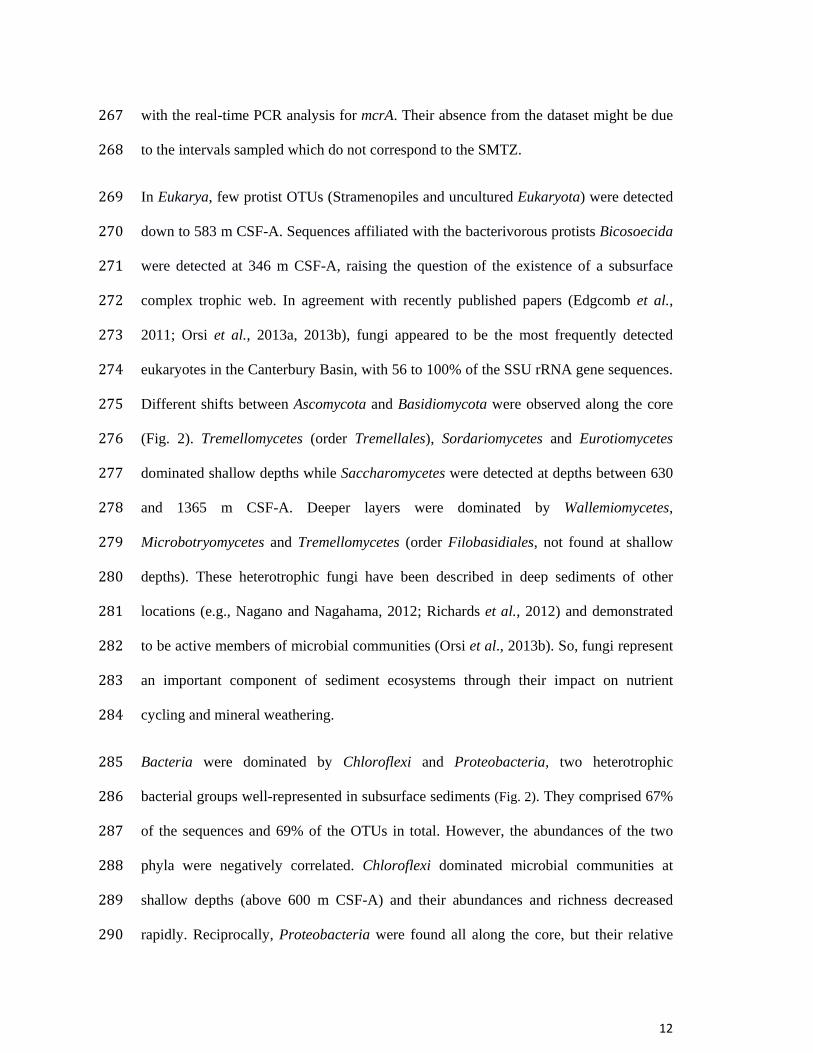
with the real-time PCR analysis for mcrA. Their absence from the dataset might be due 267 to the intervals sampled which do not correspond to the SMTZ. 268 In Eukarya, few protist OTUs (Stramenopiles and uncultured Eukaryota) were detected 269 down to 583 m CSF-A. Sequences affiliated with the bacterivorous protists Bicosoecida 270 were detected at 346 m CSF-A, raising the question of the existence of a subsurface 271 complex trophic web. In agreement with recently published papers (Edgcomb et al., 272 2011; Orsi et al., 2013a, 2013b), fungi appeared to be the most frequently detected 273 eukaryotes in the Canterbury Basin, with 56 to 100% of the SSU rRNA gene sequences. 274 Different shifts between Ascomycota and Basidiomycota were observed along the core 275 (Fig. 2). Tremellomycetes (order Tremellales), Sordariomycetes and Eurotiomycetes 276 dominated shallow depths while Saccharomycetes were detected at depths between 630 277 and 1365 m CSF-A. Deeper layers were dominated by Wallemiomycetes, 278 Microbotryomycetes and Tremellomycetes (order Filobasidiales, not found at shallow 279 depths). These heterotrophic fungi have been described in deep sediments of other 280 locations (e.g., Nagano and Nagahama, 2012; Richards et al., 2012) and demonstrated 281 to be active members of microbial communities (Orsi et al., 2013b). So, fungi represent 282 an important component of sediment ecosystems through their impact on nutrient 283 cycling and mineral weathering. 284 Bacteria were dominated by Chloroflexi and Proteobacteria, two heterotrophic 285 bacterial groups well-represented in subsurface sediments (Fig. 2). They comprised 67% 286 of the sequences and 69% of the OTUs in total. However, the abundances of the two 287 phyla were negatively correlated. Chloroflexi dominated microbial communities at 288 shallow depths (above 600 m CSF-A) and their abundances and richness decreased 289 rapidly. Reciprocally, Proteobacteria were found all along the core, but their relative 290
13
abundance showed a sharp increase below 343 m CSF-A. Among the other lineages 291 observed in this study, Planctomycetes, Nitrospirae and the candidate division OP9 292 were major contributors of the amplicon pool at shallow depths. Below 600 m CSF-A, 293 Acidobacteria, Firmicutes (a phylum containing spore-formers), and two loosely 294 defined groups of uncultured Bacteria (ML635J-21 and MLE1-12) were the most 295 consistently detected lineages. Real-time PCR quantification of the JS1-Chloroflexi 296 group confirmed these results as ~103 to 106 SSU rRNA gene copies·g-1 were detected 297 between the sediment surface and 1532 m CSF-A. Deltaproteobacteria were detected 298 above the SMTZ and at great depths. Genes encoding a functional dissimilatory sulfite 299 (bi)reductase (dsrA), a key enzyme of dissimilatory sulfate reduction frequently 300 encountered among Deltaproteobacteria, was quantified above the SMTZ and in layers 301 up to 1000 m deep in the sediment. The gene became undetectable below this depth, 302 either because it may decrease below the detection limit or because the detected 303 Deltaproteobacteria cannot respire sulfate. 304 305 Diversity and environmental factors 306 Principal component analyses (PCA) coupled with regularized canonical correlation 307 analyses (RCCA) were performed to visualize relationships between environmental 308 factors and microbial taxa. We first evaluated the relationships between all 309 environmental parameters measured (i.e., depth, pH, salinity, porosity, alkalinity and 310 concentrations of calcium, calcium carbonate, ammonium, magnesium, sulfate, 311 inorganic carbon, organic carbon, methane and ethane) to design a network of 312 correlations. Only the six most explanatory variables were kept (Fig. S6). This 313

14
complementary analysis reinforced the conclusion about microbial distribution pattern 314 and vertical community composition, depth being defined as a main factor explaining 315 diversity changes (Fig. S7). 316 317 318 Handling deeply buried microorganisms 319 Cultivation approaches allowed prokaryotic and eukaryotic strains to be grown, 320 corresponding to a fraction of the microbial communities detected all along the core, 321 underlining that these microorganisms were viable. Fungal strains were obtained at 21 322 to 765 m CSF-A, using elevated hydrostatic pressure to mimic in situ conditions (Fig. 4 323 A-C, Table S6). Sequencing of the ITS1 rRNA regions allowed identification of a 324 Cadophora representative that had already been found in extreme environments, i.e., 325 Antarctic environments (Tosi et al., 2002) and deep-sea hydrothermal vents (Burgaud et 326 al., 2009) (Table S6). Fifty-seven anaerobic fungi, currently under description, have 327 also been isolated from these sediments (Rédou and Burgaud, unpublished data). In 328 addition to the important finding that living fungi could be cultivated from the sediment 329 samples, microbial colonies were grown anaerobically at 60-70°C from calcareous 330 chalk/limestone samples collected at 1827 and 1922 m CSF-A (Fig. 4 D-E), using a 331 microcultivation method (Fig. S8). The microcolonies were successfully transferred to 332 liquid media and subcultured. From the different tests performed, it was impossible to 333 grow true methanogens and true sulfate-reducers. Only bacterial fermentative strains 334 degrading the organic compounds supplied (i.e., low quantity of yeast extract) have 335 grown. Within these subcultures, mean cell densities were low, around 4 × 10⁵ cells·mL-336 1 and growth rates were slow (in 2.5 years of culture, only 6 to 9 subcultures at 1/40 or 337

15
1/50 have been performed). Cells were able to grow at atmospheric pressure and at the 338 estimated in situ pressure (22 MPa). They were composed of viable very small rods, 339 coccobacilli and cocci of 300 to 800 nm in diameter, often forming aggregates (Fig. 4 F-340 I). These small sizes and this cellular organization as consortia raises questions about 341 the living conditions of these cells and their (in)dependence with regard to other cells. 342 The smallest diameter of a cell that assures its viability was calculated as ~ 200 nm 343 (Velimorov, 2001). The major lineages identified in DNA and RNA libraries from these 344 subcultures belonged to Alpha-, Beta-, Gamma-proteobacteria, Actinobacteria and 345 Armatimonadetes (Fig. 5). With the exception of Armatimonadetes, all these taxa were 346 detected from pyrosequencing in crude samples from 1827 and 1922 m CSF-A. The 347 majority of the sequences had relatives recovered from environments with similar 348 physical-chemical characteristics (Lin et al., 2006; Mason et al., 2010) (i.e., hot and 349 reduced habitats) compared with the Canterbury subseafloor. Considering the 'ubiquity' 350 of these taxa, one can hypothesize that they are generalist bacteria which would have 351 been maintained during progressive burial of sediments or by transportation through 352 circulating fluids. They might have acquired metabolic capabilities enabling them to 353 resist the associated environmental changes. However, this hypothesis needs to be 354 analyzed in detail. Furthermore, similar SSU rRNA gene sequences do not 355 automatically correspond to identical physiologies, identical phenotypes or similar 356 functions. 357 358 Impact of potential contaminants on native microbial populations 359 Contamination is a crucial issue when working with subseafloor sediments. In general, 360 contamination during drilling is still difficult to predict. During IODP Expedition 317, 361
16
the level of contamination during drilling was evaluated by using fluorescent 362 microspheres and only samples with no detectable contamination were kept for 363 microbiological analyses. Nevertheless, samples without microspheres are not 364 necessarily uncontaminated (Smith et al., 2000). Contamination generally decreases 365 from the exterior to the interior of both sediment and rocks cores (e.g., Lever et al., 366 2006). In consequence, only the interior of sediment cores and intact pieces of rocks that 367 had been exposed to UV light after washing were used for the analyses. In addition, for 368 molecular experiments deeply frozen samples of more than 1 cm in diameter were 369 sterilized by flaming. Afterwards, all possible contaminations during the wet-lab steps 370 have been strictly controlled and minimized (see Supplementary Text). The cutting-371 edge strategy applied for the pyrosequencing and bioinformatic analyses allowed 372 removing potential spurious sequences and OTUs likely to contain contaminants, by 373 sequencing of negative controls, a duplicate procedure and an associated bioinformatics 374 pipeline. In addition to these precautions, the level of potential contamination of our 375 samples was estimated by calculating the number of contaminating cells per gram of 376 sediment and per gram of sedimentary rock based on the mean contamination values 377 with drilling fluids and mean cell abundances in surface waters reported in the literature. 378 The mean potential contamination was estimated as (i) 0.011 ± 0.018 µL of drilling 379 fluid per gram for unconsolidated sediments drilled using advanced piston coring (APC) 380 and (ii) 0.027 ± 0.029 µL·g–1 for rocks collected using rotary core barrel (RCB) (Lever 381 et al., 2006). Considering these levels of contamination, mean cell counts of 5 × 10⁵ 382 cells·mL–1 in surface waters in the ocean (Whitman et al., 1998) and average densities of 383 1.85 g·cm–3 in sediments and 1.99 g·cm–3 in sedimentary rocks at site U1352, potential 384 contamination of the interior of the core sample should be expected very low with 5 to 385
17
11 cells·g–1 of sediment only. A second reported estimate indicates that less than 50 386 cells per gram of sediment contaminated APC core centers drilled with Joides 387 Resolution and that XCB cores were generally more contaminated with contamination 388 levels 3 to 10 times higher in XCB cores than in APC core centers (House et al., 2003). 389 Considering these different estimates of potential contamination, the observed cell 390 counts at site U1352 were 2 to 5 orders of magnitude higher in the studied samples. If 391 contamination cannot be excluded, in the worst case, non-indigenous cells represent 392 only up to 1% of total cells in the sample. Therefore, it is most likely that more than 393 99% of the counted cells are native to the sampled sediment/rocks. This implies that the 394 vast majority of the prokaryotic and eukaryotic DNA subjected to pyrosequencing was 395 therefore derived from the sediment native cells. By extension, assuming that most of 396 the prokaryotic DNA extracted from sediments samples is from native cells, the fact that 397 cultivated bacteria match OTUs abundant in the crude sediment samples supports the 398 idea that these cultivated strains are isolates of native bacteria. Consequently, the 399 potential impact of contaminants on each category of data (cell counts, molecular data 400 and cultures) is likely very low. 401 402 Ecological implications and future prospects 403 We have underlined that the subseafloor of the Canterbury basin hosts microorganisms 404 which comprise Bacteria, Archaea and Eukarya. Some of these microorganisms are 405 alive and, at least to a certain extent, revivable. The communities exhibit a quite low 406 phylogenetic diversity, but this does not necessarily correspond to a low functional 407 diversity. This poor diversity could be explained if natural selection has produced (i) 408 taxa adapted to harsh subsurface conditions (i.e., specialists), which would be expected 409

18
in the case of a low connectivity among habitats; and/or (ii) taxa with a broad 410 physiological plasticity, allowing them to survive in a diversity of nutritional and 411 physical-chemical conditions (i.e., generalists). In fact, some taxa detected through their 412 16S/18S rRNA gene sequences are thought to be endemic to subsurface habitats, while 413 others seem ubiquitous and are consistently encountered in common and extreme 414 environments. The bacterial strains in cultures are related to opportunistic or generalist 415 taxa isolated from a broad array of redox environments, which raises the question of the 416 existence of microbial metabolic versatility and also questions the species concept, since 417 behind a given name or a given OTU can lay a variety of microorganisms with different 418 ecological lifestyles. Metabolic versatility has already been demonstrated in well-known 419 taxa. For example, some Thermococcales strains, which are usually fermenters that 420 reduce sulfur compounds, can grow in oligotrophic conditions or can oxidize carbon 421 monoxide (Sokolova et al., 2004). Heterotrophy is likely to be the major mode of 422 carbon assimilation within microbial communities of subsurface marine sediments 423 (Batzke et al., 2007). Our culture data support this hypothesis. Genome and 424 metagenome analyses would allow functions to be predicted on a finer scale, to assess 425 and hypothesize the individual ecological functions within the analyzed habitat or 426 ecosystem (Vandenkoornhuyse et al., 2010). The detection of fungal sequences at great 427 depths and our success in the cultivation of fungal strains leads us to ask what role they 428 play in deep carbon cycling and what involvement they have in dynamics/regulation of 429 prokaryotic populations, if they are active in situ. 430 The broad polyphasic approach developed in this study provides direct evidence that 431 viable microorganisms can be present in rocks that are hardened but not totally 432 cemented, where stylolites and micro-fluid circulations exist. Our data demonstrate that 433
19
the combination of physical, chemical and energetic constraints encountered from 0 to 434 1922 m CSF-A in the subseafloor of the Canterbury Basin still allow microorganisms to 435 persist down to at least 650, 1740 and 1922 m CSF-A for Archaea, fungi and Bacteria, 436 respectively. It extends the subseafloor sedimentary depths at which subseafloor 437 organisms are known to be present to 1740 m for fungi and to 1922 m for Bacteria. 438 Nevertheless, one cannot exclude that some of the detected sequences belong to 439 microorganisms in dormancy. More extensive sequencing efforts will be required, i.e., 440 direct metatranscriptomics, to describe more directly the microbial communities along 441 with functional signatures, and to compile data on biogeochemical processes and fluxes. 442 443 Acknowledgements 444 Samples, shipboard facilities and expedition support were provided by IODP. The authors thank 445 the co-chiefs, crew and shipboard scientific parties of IODP Expedition 317. The Joint Research 446 Unit UMR 6197 (CNRS-Ifremer-UBO), LUBEM, GDR Ecchis, EU program MaCuMBA, 447 DIVVIR project of the FRB and the BGR supported molecular and cultural post-cruise 448 analyses. The study was supported by grants from the French Ministry of Higher Education and 449 Research for MCC, VR and FG; from the Région Bretagne for FG; and from the DFG for AS 450 (grant SCH535/7-2) and for JSL (grant HI616/11-1). We thank reviewers for their constructive 451 comments. We thank also C Struckmeyer, M Guégan, H Leclerc, C Argouarch, S Coudouel, A 452 Dheilly and O Quenez for their contribution to this work. 453 454 Supplementary information is available at the ISMEJ’s website. 455 The authors declare no conflict of interest. 456
20
References 457 Goodman K, Rochelle PA, Marchesi JR, Fry JC, Weightman AJ et al. (1997) 458
Desulfovibrio profundus sp. nov., a novel barophilic sulfate-reducing bacterium 459 from deep sediment layers in the Japan Sea. Int J Syst Bacteriol 47:515-521. 460
Batzke A, Engelen B, Sass H, Cypionka H (2007) Phylogenetic and physiological 461 diversity of cultured deep-biosphere bacteria from equatorial Pacific Ocean and 462 Peru Margin sediments. Geomicrobiol J 24:261-273. 463
Biddle JF, Lipp JS, Lever MA, Lloyd KG, Sørensen KB, Anderson R et al. (2006) 464 Heterotrophic Archaea dominate sedimentary subsurface ecosystems off Peru. 465 Proc Natl Acad Sci USA 103:3846-3851. 466
Biddle JF, White JR, Teske AP, House CH (2011) Metagenomics of the subsurface 467 Brazos-Trinity Basin (IODP site 1320): comparison with other sediment and 468 pyrosequenced metagenomes. The ISME J 5:1038-1047. 469
Burgaud G, Le Calvez T, Arzur D, Vandenkoornhuyse P, Barbier, G (2009) Diversity 470 of culturable marine filamentous fungi from deep-sea hydrothermal vents. 471 Environ Microbiol 11:1588-1600. 472
D’Hondt S, Jørgensen, B B, Miller, DJ, Batzke A, Blake R, Cragg BA et al. (2004) 473 Distributions of microbial activities in deep subseafloor sediments. Science 474 306:2216-2221. 475
Edgcomb VP, Beaudoin D, Gast R, Biddle JF, Teske A (2011) Marine subsurface 476 eukaryotes: the fungal majority. Environ Microbiol 13:172-183. 477
Engelhardt T, Sahlberg M, Cypionka H, Engelen B (2011) Induction of prophages from 478 deep-subseafloor bacteria. Environ Microbiol Rep 3:459-465. 479

21
Expedition 317 Scientists (2011) Methods, Proc. IODP 317 (Integrated Ocean Drilling 480 Program Management International, Inc.), doi:10.2204/iodp.proc.317.102.2011. 481
Ferrari BC, Winsley T, Gillings M, Binnerup S (2008) Cultivating previously 482 uncultured soil bacteria using a soil substrate membrane system. Nature 483 Protocols 3:1261-1269. 484
Fulthorpe CS, Hoyanagi K, Blum P, the Expedition 317 Scientists (2011) Site U1352, 485 Proceedings of the Integrated Ocean Drilling Program 317 (Integrated Ocean 486 Drilling Program Management International, Inc., Tokyo), 487 doi:10.2204/iodp.proc.317.104.2011. 488
House CH, Cragg BA, Teske A, Leg 201 Scientific Party (2003) Drilling contamination 489 tests during ODP Leg 201 using chemical and particulate tracers. Proceedings of 490 the Ocean Drilling Program, Initial Reports, eds D’Hondt SL, Jørgensen BB, 491 Miller DJ et al. (Ocean drilling Program, College Station, TX), Vol. 201, pp 1-492 19. 493
Inagaki F, Nunoura T, Nakagawa S, Teske A, Lever Mark, Lauer A et al. (2006) 494 Biogeographical distribution and diversity of microbes in methane hydrate-495 bearing deep marine sediments on the Pacific Ocean Margin. Proc Natl Acad Sci 496 USA 103:2815-2820. 497
Kallmeyer J, Smith DC, Spivack AJ, D’Hondt S (2008) New cell extraction procedure 498 applied to deep subsurface sediments. Limnol Oceanogr Methods 6:236-245. 499
Kallmeyer J, Pockalny R, Adhikari RR, Smith DC, D’Hondt S (2012) Global 500 distribution of microbial abundance and biomass in subseafloor sediment. Proc 501 Natl Acad Sci USA 109:16213-16216. 502

22
Lever, MA, Alperin M, Engelen B, Inagaki F, Nakagawa S, Steinsbu BO et al. (2006) 503 Trends in basalt and sediment core contamination during IODP Expedition 301. 504 Geomicrobiol J 23:517-530. 505
Lin LH, Wang P-L, Rumble D, Lippmann-Pipke J, Boice E, Pratt LM et al. (2006) 506 Long-term sustainability of a high-energy, low-diversity crustal biome. Science 507 314:479-482. 508
Lipp JS, Morono Y, Inagaki F, Hinrichs K-U (2008) Significant contribution of Archaea 509 to extant biomass in marine subsurface sediments. Nature 454:991-994. 510
Lloyd KG, Schreiber L, Petersen DG, Kjeldsen KU, Lever MA , Steen AD et al. (2013) 511 Predominant archaea in marine sediments degrade detrital proteins. Nature 512 496:215-218. 513
Lomstein BA, Langerhuus AT, D’Hondt S, Jørgensen BB, Spivack AJ (2012) 514 Endospore abundance, microbial growth and necromass turnover in deep sub-515 seafloor sediment. Nature 484:101-104. 516
Mason OU, Nakagawa T, Rosner M, Van Nostrand JD, Zhou J, Maruyama A et al. 517 (2010) First investigation of the microbiology of the deepest layer of ocean 518 crust. PLoS One 5:e15366. 519
Morono Y, Kallmeyer J, Inagaki F, the Expedition 329 Scientists (2011) Preliminary 520 experiment for cell count using flow cytometry. Proceedings of the Integrated 521 Ocean Drilling Program 329 (Integrated Ocean Drilling Program Management 522 International, Inc., Tokyo), http://dx.doi.org/10.2204/iodp.proc.329.110.2011. 523
Nagano Y, Nagahama T (2012) Fungal diversity in deep-sea extreme environments. 524 Fungal Ecol 5:463-471. 525
23
Noble RT, Fuhrman JA (1998) Use of SYBR Green I for rapid epifluorescence counts 526 of marine viruses and bacteria. Aquat Microb Ecol 14:113-118. 527
Orcutt BN, Sylvan JB, Knab NJ, Edwards KJ (2011) Microbial Ecology of the Dark 528 Ocean above, at, and below the Seafloor. Microbiol Mol Biol Rev 75:361-422. 529
Orsi WD, Edgcomb VP, Christman GD, Biddle JF (2013a). Gene expression in the deep 530 biosphere. Nature 499, 205–208, doi:10.1038/nature12230. 531
Orsi W, Biddle JF, Edgcomb V (2013b) Deep sequencing of subseafloor eukaryotic 532 rRNA reveals active Fungi across marine subsurface provinces. PLOS One 533 8:e56335. 534
Parkes RJ, Cragg BA, Wellsbury P (2000) Recent studies on bacterial populations and 535 processes in subseafloor sediments: A review. Hydrogeol Rev 8:11-28. 536
Pawlowski J, Christen R, Lecroq B, Bachar D, Shahbazkia RH, Amaral-Zettler L et al. 537 (2011) Eukaryotic Richness in the Abyss: Insights from Pyrotag Sequencing. 538 PLoS One 6:e18169. 539
Richards TA, Jones MDM, Leonard G, Bass D (2012) Marine Fungi: Their Ecology and 540 Molecular Diversity. Ann Rev Mar Sci 4:495-522. 541
Roalkvam I, Dahle H, Chen Y, Jørgensen SL, Haflidason H, Steen IH et al. (2012) 542 Fine-Scale Community Structure Analysis of ANME in Nyegga Sediments with 543 High and Low Methane Flux. Front Microbiol 3: e216. 544
Roussel EG, Cambon Bonavita M-A, Querellou Joël, Cragg BA, Webster G, Prieur D, 545 Parkes RJ et al. (2008) Extending the sub-sea-floor biosphere. Science 320:1046. 546
Sass H, Parkes RJ (2011) Sub-seafloor Sediments: An Extreme but Globally Significant 547 Prokaryotic Habitat (Taxonomy, Diversity, Ecology), Extremophiles handbook, 548 Ed. Horikoshi K (Springer, Tokyo), pp 1016-1036. 549

24
Schippers A, Neretin LN, Kallmeyer J, Ferdelman TG, Cragg BA, Parkes RJ Jørgensen 550 BB et al. (2005) Prokaryotic cells of the deep sub-seafloor biosphere identified 551 as living bacteria. Nature 433:861-864. 552
Schippers A, Neretin LN (2006) Quantification of microbial communities in near-553 surface and deeply buried marine sediments on the Peru continental margin 554 using real-time PCR. Environ Microbiol 8:1251-1260. 555
Schippers A, Kock D, Höft C, Köweker G, Siegert M (2012) Quantification of 556 microbial communities in subsurface marine sediments of the Black Sea and off 557 Namibia. Front Microbiol 3:16. 558
Smith DC, Spivack AJ, Fisk MR, Haveman SA, Staudigel H (2000) Tracer-based 559 estimates of drilling-induced microbial contamination of deep sea crust. 560 Geomicrobiol J 17:207-219. 561
Sokolova TG, Jeanthon C, Kostrikina NA, Chernyh NA, Lebedinsky AV, Stackebrandt E, et al. 562 (2004) The first evidence of anaerobic CO oxidation coupled with H2 production by a 563 hyperthermophilic archaeon isolated from a deep-sea hydrothermal vent. Extremophiles 564 8:317–323. 565
Tosi S, Casado B, Gerdol R, Caretta, G (2002) Fungi isolated from Antarctic mosses. 566 Polar Biol 25:262-268. 567
Vandenkoornhuyse P, Dufresne A, Quaiser A, Gouesbet G, Binet F, Francez AJ et al. 568 (2010) Integration of molecular functions at the ecosystemic level: 569 breakthroughs and future goals of environmental genomics and post-genomics. 570 Ecol Lett 13:776–791. 571
Velimorov B (2001) Nanobacteria, Ultramicrobacteria and Starvation Forms: a search 572 for the smallest metabolizing bacterium. Microb Environ 16:67-77. 573

25
Whitman WB, Coleman DC, Wiebe WJ (1998) Prokaryotes: The unseen majority. Proc 574 Natl Acad Sci USA 95:6578-6583. 575

26
Figure legends 576 577 Figure 1 Main physical-chemical characteristics of the studied core. Black arrows 578 indicate measures of in situ temperatures used to calculate a thermal gradient of 579 46°C/km. This thermal gradient together with the interpretation of the thermal maturity 580 gradient defined by Tmax measurements, allowed estimating a bottom-hole temperature 581 comprised between 60 and 100 °C (Source: IODP report 317) (Fulthorpe et al., 2011). 582 583 Figure 2 Lithological structure and age of lithological deposits at site U1352 in the 584 Canterbury Basin compared with depth distribution of cell counts, 16S/18S rRNA gene-585 tag sequences and DNA copy numbers of genetic markers and functional genes. On the 586 left, cell concentrations counted at site U1352 (red dots) and neighboring site U1351 587 (blue squares), according to depth (m CSF-A), compared with the general depth 588 distribution of cells (grey dots) in subseafloor sediments (Kallmeyer et al., 2012). In the 589 center, Phylum Class_Order distribution of archaeal, eukaryotic and bacterial 16S/18S 590 rRNA gene-tag sequences (based on SILVA111 classification) from OTU containing 591 100 or more sequences (the remaining sequences were grouped into “Other”). On the 592 right, copy numbers of the disulfite reductase genes A, of the 18S rRNA genes from 593 total Eukarya and of 16S rRNA genes from total Bacteria, Archaea and 594 JS1/Chloroflexi-related bacteria. Geobacteriaceae were detected only up to 15 m CSF-595 A (~ 5 × 10³ copies per g). No amplification from greater depth was shown. The 596 functional genes mcrA, aprA and cbbL were not detected at all. Legend: § In other 597 classifications, MCG affiliate with the Thaumarchaeota. # Lineages of plants and algae. 598 * Depth horizons where ≥ 100 reads of plants and Chrysophyceae were detected. 599

27
600 Figure 3 Community richness (Chao1 non-parametric estimator) for archaeal, 601 eukaryotic and bacterial sequences making up the OTUs (calculated by MOTHUR at 602 3% difference between OTUs). 603 604 Figure 4 Epifluorescence microphotographs of initial enrichment cultures and 605 subsequent liquid subcultures hybridized with the Cy3-labelled probe Euk516 (staining 606 of nuclei with DAPI) (top panel), or stained with SYBR®Green I (middle panel + G) or 607 with the dual staining LIVE/DEAD®Bacterial Viability Kit (H-I). (A-C) Identification 608 of fungus-like eukaryotic cells with fluorescently-labeled 18S rRNA oligonucleotide 609 probes in initial enrichment cultures with sediments from 21 m CSF-A on PDB 3%, at 4 610 MPa (A), with sediments from 37 m CSF-A on PDB 3%, at 11 MPa (B) and with 611 sediments from 765 m CSF-A on PDB 0%, at 11 MPa (C). (D-E) Microcolonies 612 observed on polycarbonate membranes (initial enrichment cultures) after 15 days of 613 incubation with sediments from 1922 m CSF-A on H2/CO2 + YE. (F-G) Cellular 614 aggregates observed in the 7th liquid subcultures performed after the initial enrichment 615 with sediments from 1827 m CSF-A on YE + peptone + casamino acids. (H-I) Cell 616 structural integrity was observed in the 7th liquid subcultures performed after the initial 617 enrichment with sediments from 1827 m CSF-A on acetate + YE (H) and with 618 sediments from 1922 m CSF-A on YE + peptone + casamino acids (I). Legend: YE, 619 Yeast Extract; PDB, Potato Dextrose Broth. 620 621
28
Figure 5 Phylogenetic position of the bacterial 16S rRNA gene sequences detected in 622 RNA extracts from the fifth to eighth liquid subculture following the initial enrichment 623 step on a sediment substrate membrane system. The phylogenetic reconstruction was 624 performed using the Neighbor-Joining algorithm. Bootstrap values based on 1000 625 replications are indicated at the branch nodes. Representative bacterial 16S rRNA gene 626 sequences of H2/CO2 + yeast extract (YE)-based cultures and acetate + YE-based 627 cultures from the 137R section (1827 m CSF-A), as well as YE + peptone (pept.) + 628 casamino acids (CA)-based culture from the 148R section (1922 m CSF-A) are shown 629 in bold blue letters. Sequences from basalt or an underground aquifer where the 630 temperature is high (52<T°<80°C) are shown in brown; Sequences from environments 631 rich in hydrocarbons or radioactive metals are shown in orange. Accession numbers are 632 given in brackets. 633


��
�
The ISME Journal
Supplementary Information
Ciobanu et al.
SI Tables
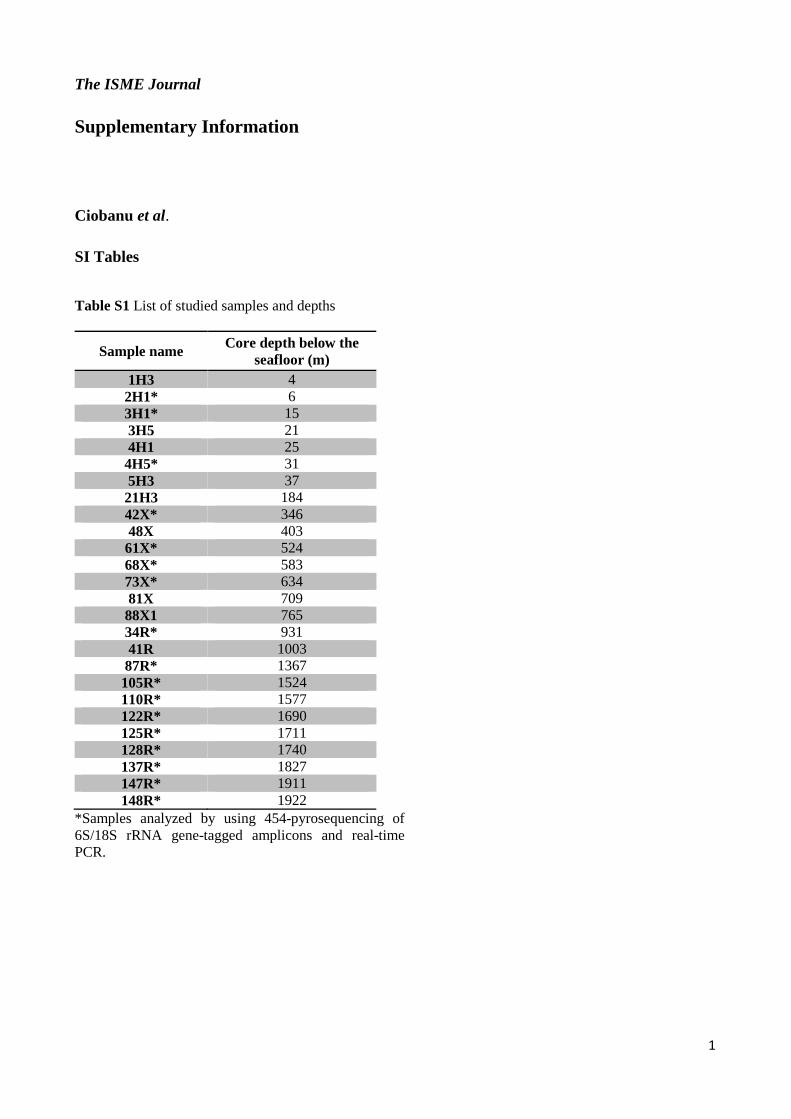
Table S1 List of studied samples and depths
Sample name Core depth below the seafloor (m)
1H3 4 2H1* 6 3H1* 15 3H5 21 4H1 25 4H5* 31 5H3 37 21H3 184 42X* 346 48X 403 61X* 524 68X* 583 73X* 634 81X 709 88X1 765 34R* 931 41R 1003 87R* 1367 105R* 1524 110R* 1577 122R* 1690 125R* 1711 128R* 1740 137R* 1827 147R* 1911 148R* 1922
*Samples analyzed by using 454-pyrosequencing of 6S/18S rRNA gene-tagged amplicons and real-time PCR.

��
�
Table S2 Primers used in this study Primer Target Sequence* (5’ – 3’) Tm Bac 341F Bacteria 16S rRNA CCTACGGGAGGCAGCAG 58°C
Uni 907R Bacteria 16S rRNA CCGTCAATTCMTTTGAGTTT 50°C
Bac AF† Bacteria 16S rRNA GTGCCAGCMGCCGCGGTAATAC 64°C
Bac BR† Bacteria 16S rRNA CCGTCAATTCCTTTGAGTTT 51°C
Bac 8F Bacteria 16S rRNA AGAGTTTGATCATGGCTCAG 58°C
1492R Bacteria 16S rRNA ACGGHTACCTTGTTACGACTT 50°C
Arc 27Fa† Archaea 16S rRNA TCYGGTTGATCCTGSCGG 58°C
Arc 806R Archaea 16S rRNA GGACTACVSGGGTATCTAAT 50°C
Arc 519R† Archaea 16S rRNA GGTDTTACCGCGGCKGCTG 61°C
Euk 82F Eukarya 18S rRNA GAADCTGYGAAYGGCTC 52°C
Euk 516R† Eukarya 18S rRNA ACC AGACTTGCCCTCC 54°C
Euk 42F† Eukarya 18S rRNA CTCAARGAYTAAGCCATGCA 53°C *Degenerated primers: R=G/A, Y=T/C, M=A/C, K=G/T, S=G/C, W=A/T, H=A/C/T, B=G/T/C, V=G/C/A, D=G/A/T, N=G/A/T/C. †Primers used for pyrosequencing.

��
�
Table S3 Fusion primers used in this study
��
�
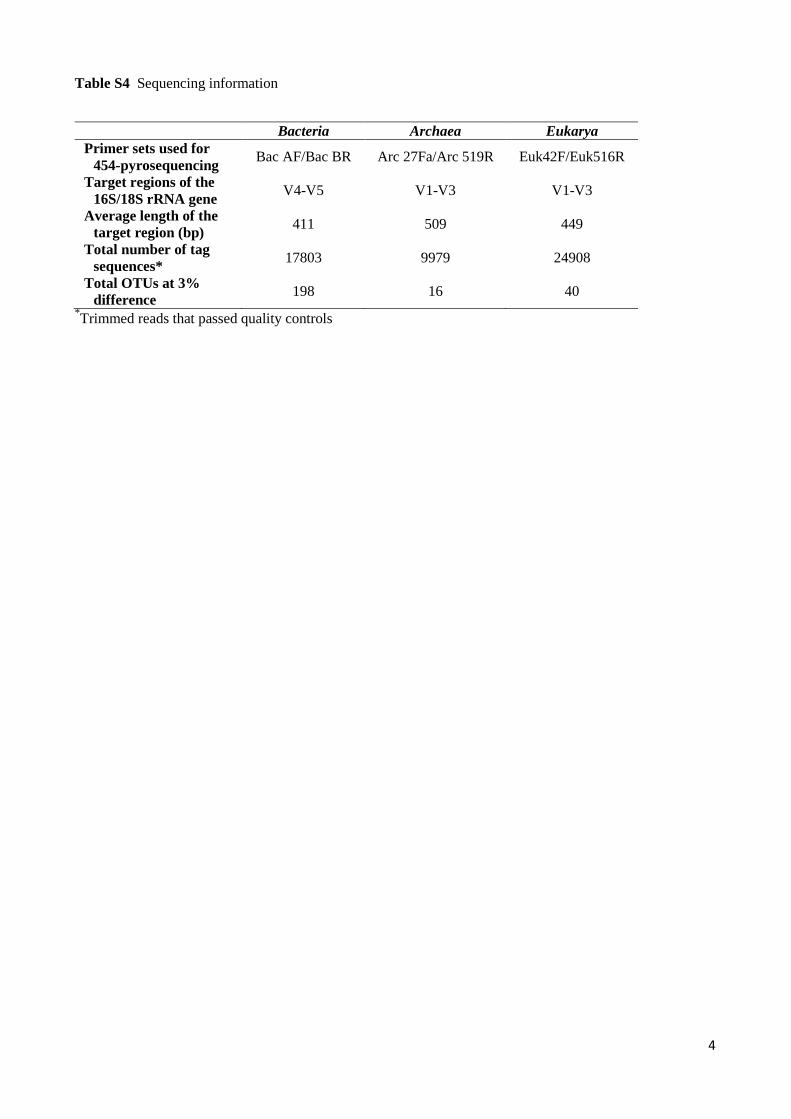
Table S4 Sequencing information
Bacteria Archaea Eukarya Primer sets used for
454-pyrosequencing Bac AF/Bac BR Arc 27Fa/Arc 519R Euk42F/Euk516R
Target regions of the 16S/18S rRNA gene
V4-V5 V1-V3 V1-V3
Average length of the target region (bp)
411 509 449
Total number of tag sequences*
17803 9979 24908
Total OTUs at 3% difference
198 16 40 *Trimmed reads that passed quality controls
��
�
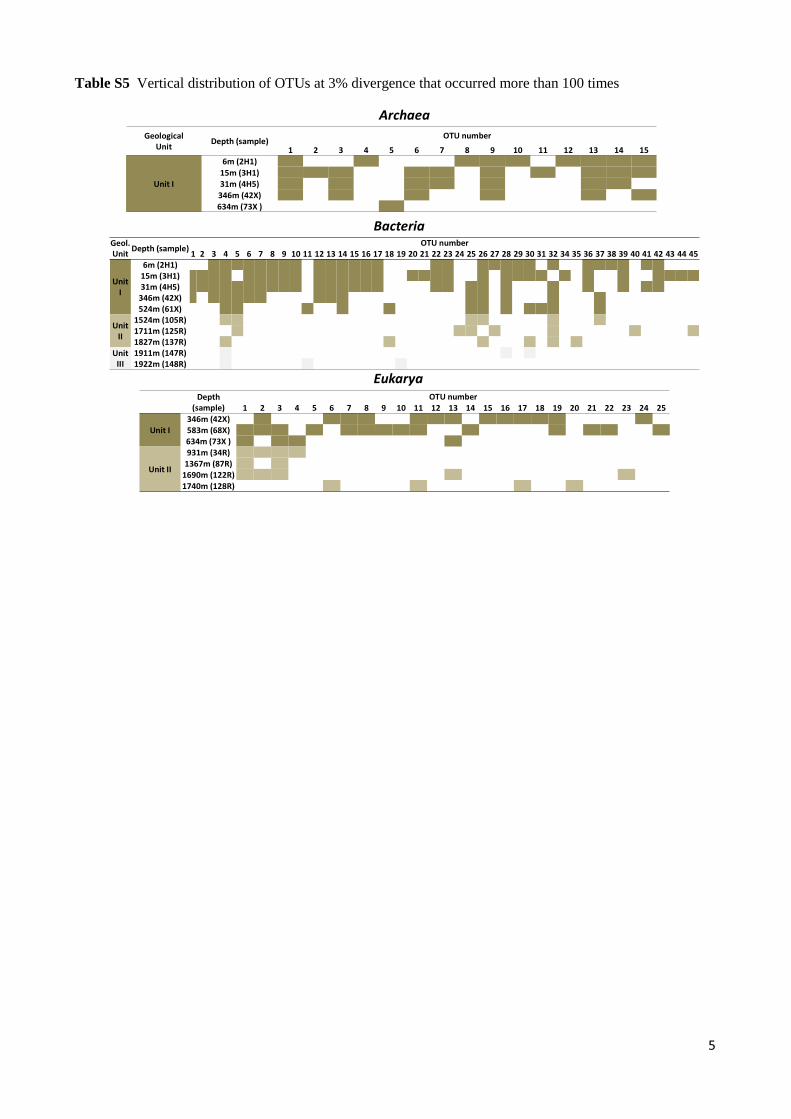
Table S5 Vertical distribution of OTUs at 3% divergence that occurred more than 100 times
�������
�����
������ �
�����
������
� �������
� � � � � � � � � �� �� �� �� �� �� �� �� �� �� �� �� �� �� �� ��
������
������� �
������� ��
������� ��
�������
�������!�
��������!�
���������!�
���������!�
"�#$�
��������� ������
� �������
� � � � � � � � � �� �� �� �� �� �� �� �� �� �� �� �� �� �� �� �� �� �� �� �� �� �� �� �� �� �� �� �� �� �� �� �� �� �� ��
�����
�
����%��
�����%��
�����%��
������� �
������� �
�����
��
���������!�
���������!�
���������!�
�����
���
���������!�
���������!�
"�##&�'�
��������� ������
� �������
� � � � � � � � � �� �� �� �� �� ��
������
����%��
�����%��
�����%��
������� �
������� ��
��
�
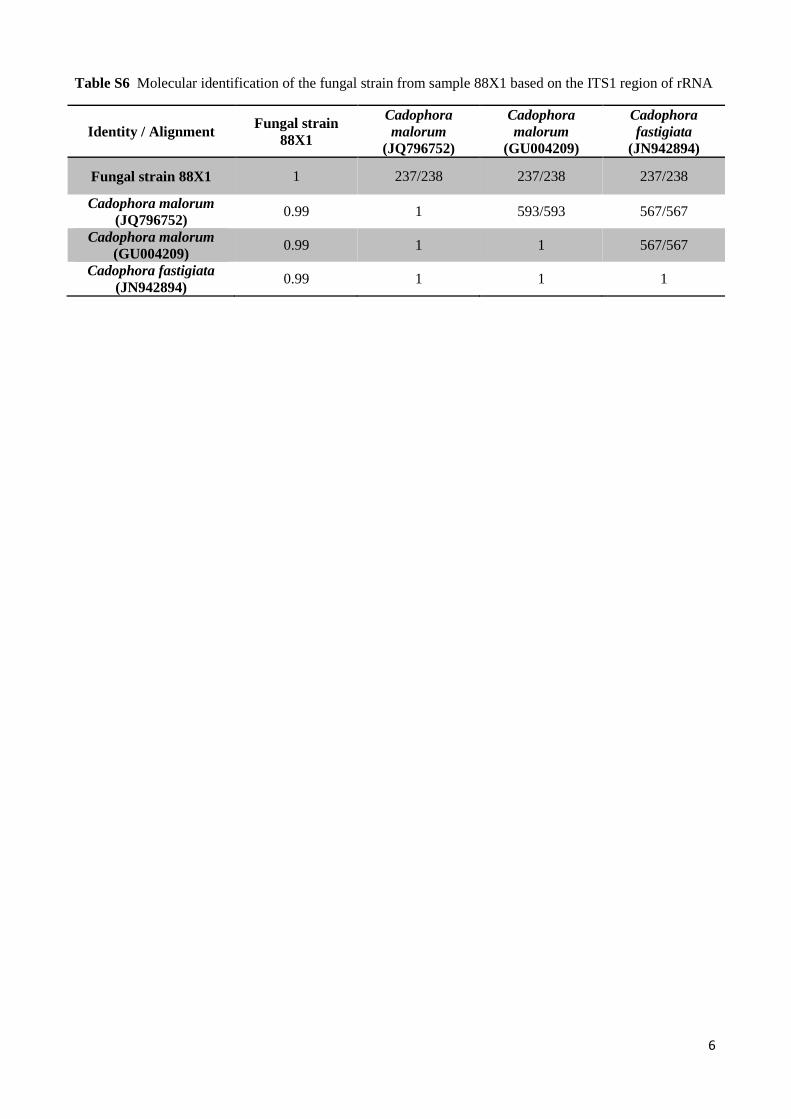
Table S6 Molecular identification of the fungal strain from sample 88X1 based on the ITS1 region of rRNA
Identity / Alignment Fungal strain 88X1
Cadophora malorum
(JQ796752)
Cadophora malorum
(GU004209)
Cadophora fastigiata
(JN942894)
Fungal strain 88X1 1 237/238 237/238 237/238
Cadophora malorum (JQ796752)
0.99 1 593/593 567/567
Cadophora malorum (GU004209)
0.99 1 1 567/567
Cadophora fastigiata (JN942894)
0.99 1 1 1

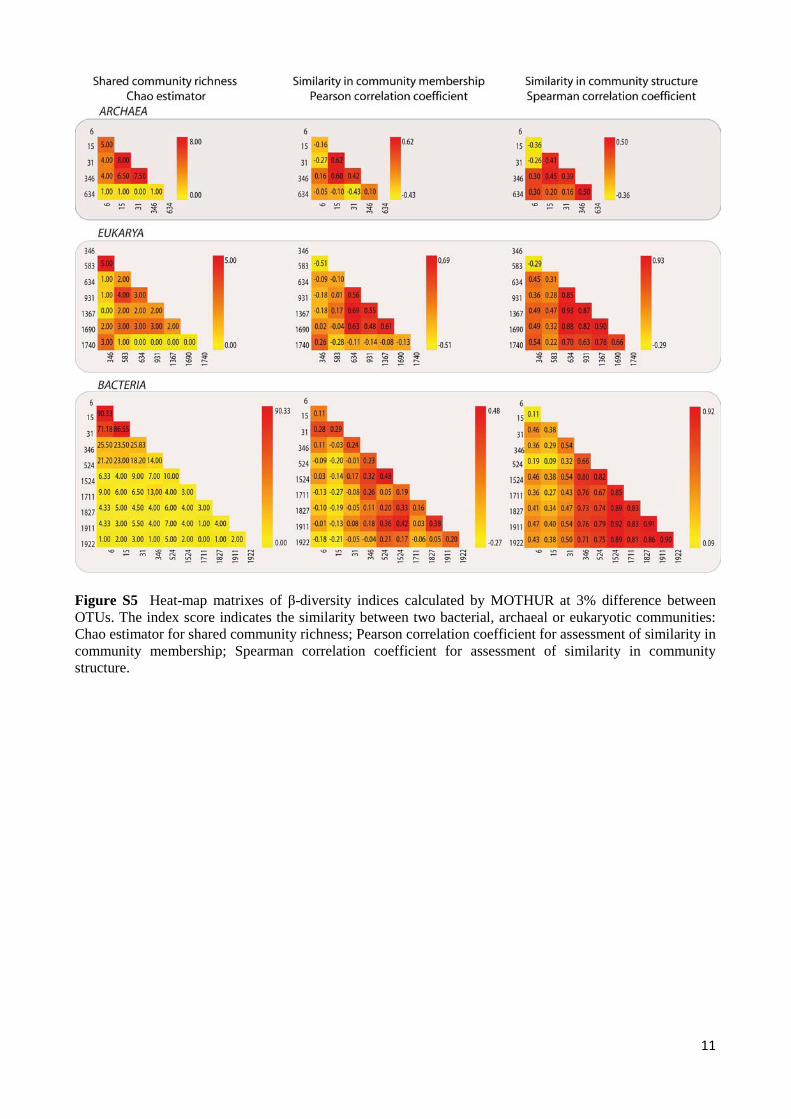
��
�
SI Figures
Figure S1 Flow-diagram of the 454-pyrosequencing strategy.
�
�
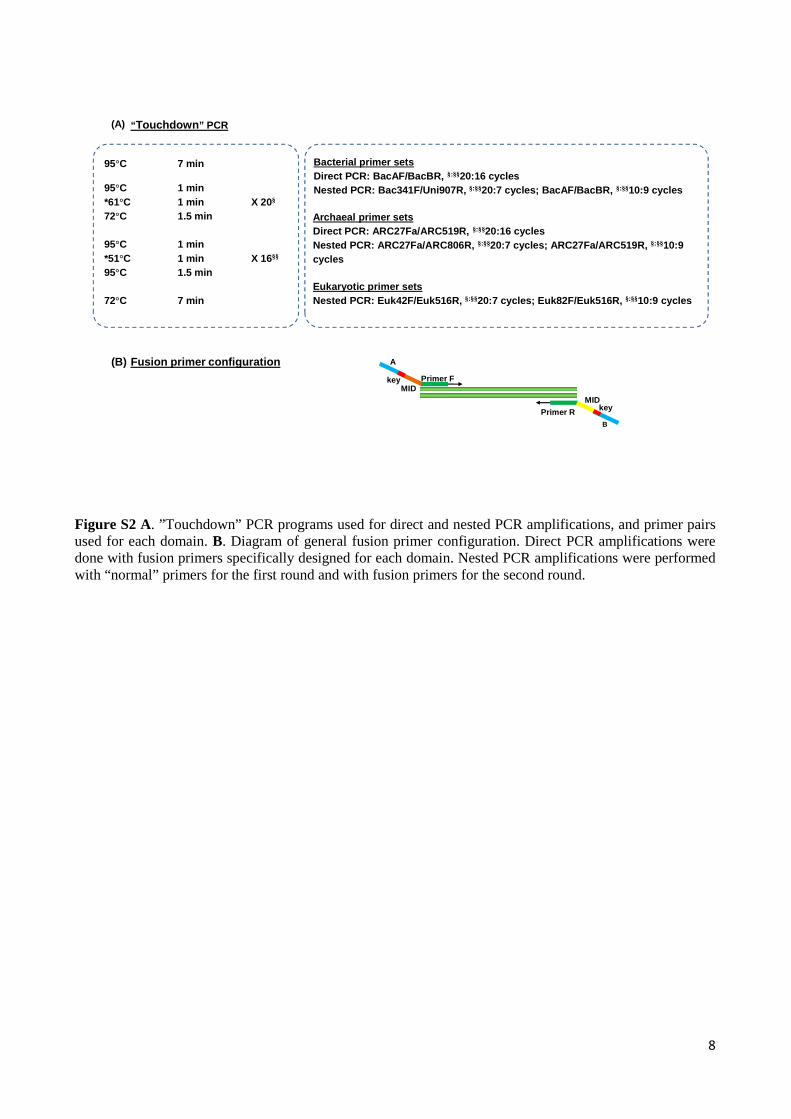
Figure S2 A. ”Touchdown” PCR programs used for direct and nested PCR amplifications, and primer pairs used for each domain. B. Diagram of general fusion primer configuration. Direct PCR amplifications were done with fusion primers specifically designed for each domain. Nested PCR amplifications were performed with “normal” primers for the first round and with fusion primers for the second round.
95°C 7 min
95°C 1 min*61°C 1 min X 20 §
72°C 1.5 min
95°C 1 min*51°C 1 min X 16 §§
95°C 1.5 min
72°C 7 min
Bacterial primer setsDirect PCR: BacAF/BacBR, §:§§20:16 cyclesNested PCR: Bac341F/Uni907R, §:§§20:7 cycles; BacAF/BacBR, §:§§10:9 cycles
A
B
MID
key
key Primer F
Primer RMID
Archaeal primer setsDirect PCR: ARC27Fa/ARC519R, §:§§20:16 cyclesNested PCR: ARC27Fa/ARC806R, §:§§20:7 cycles; ARC27Fa/ARC519R, §:§§10:9 cycles
Eukaryotic primer setsNested PCR: Euk42F/Euk516R, §:§§20:7 cycles; Euk82F/Euk516R, §:§§10:9 cycles
“ Touchdown ” PCR(A)
(B) Fusion primer configuration
�
�
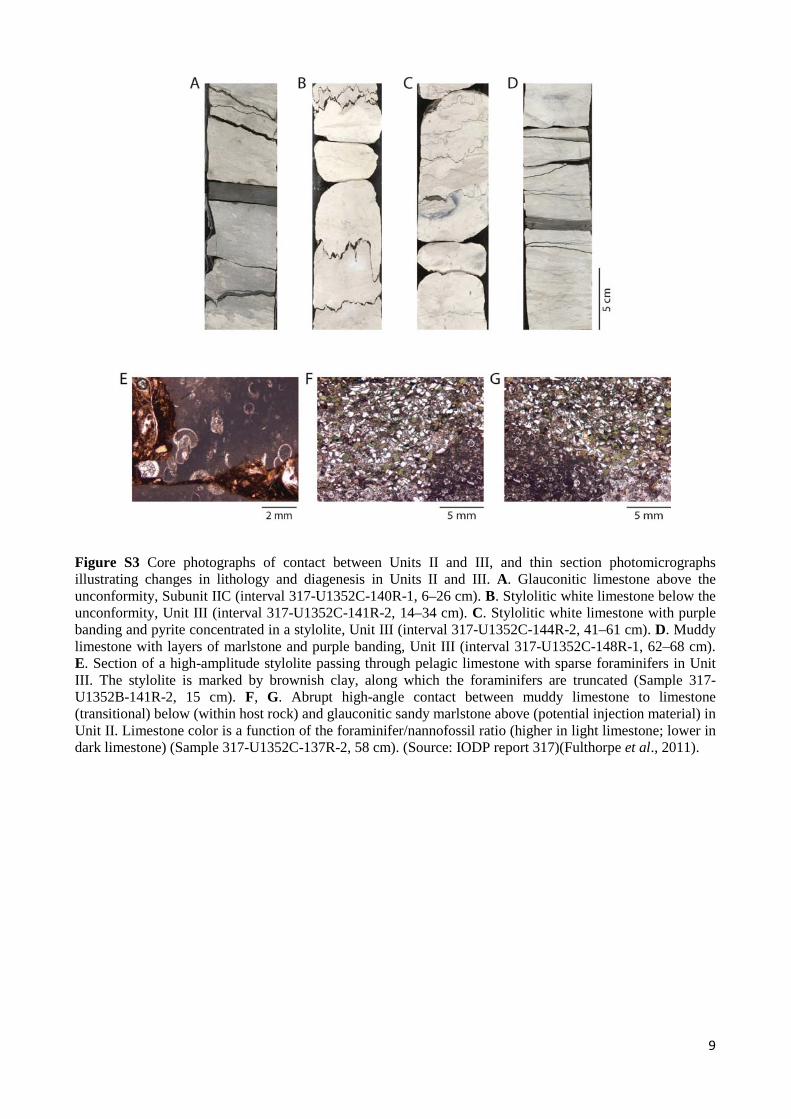
Figure S3 Core photographs of contact between Units II and III, and thin section photomicrographs illustrating changes in lithology and diagenesis in Units II and III. A. Glauconitic limestone above the unconformity, Subunit IIC (interval 317-U1352C-140R-1, 6–26 cm). B. Stylolitic white limestone below the unconformity, Unit III (interval 317-U1352C-141R-2, 14–34 cm). C. Stylolitic white limestone with purple banding and pyrite concentrated in a stylolite, Unit III (interval 317-U1352C-144R-2, 41–61 cm). D. Muddy limestone with layers of marlstone and purple banding, Unit III (interval 317-U1352C-148R-1, 62–68 cm). E. Section of a high-amplitude stylolite passing through pelagic limestone with sparse foraminifers in Unit III. The stylolite is marked by brownish clay, along which the foraminifers are truncated (Sample 317-U1352B-141R-2, 15 cm). F, G. Abrupt high-angle contact between muddy limestone to limestone (transitional) below (within host rock) and glauconitic sandy marlstone above (potential injection material) in Unit II. Limestone color is a function of the foraminifer/nannofossil ratio (higher in light limestone; lower in dark limestone) (Sample 317-U1352C-137R-2, 58 cm). (Source: IODP report 317)(Fulthorpe et al., 2011).

���
�
Figure S4 Number of OTUs found for Archaea (red bars), Eukarya (green bars) and Bacteria (blue bars) for each depth sample. OTUs were defined using a strict 3% dissimilarity threshold between 16S or 18S rDNA gene sequences. Numbers indicated to the right of each bar correspond to tag sequences constituting OTUs that were obtained by 454-pyrosequencing for each domain and depth sample.
���
�
Figure S5 Heat-map matrixes of β-diversity indices calculated by MOTHUR at 3% difference between OTUs. The index score indicates the similarity between two bacterial, archaeal or eukaryotic communities: Chao estimator for shared community richness; Pearson correlation coefficient for assessment of similarity in community membership; Spearman correlation coefficient for assessment of similarity in community structure.

PARAMETERS
Depth
Calcium
carbonate
Inorganiccarbon
Organiccarbon
Methane
Ethane
Alkalinity
Ammonium
Calcium
Magnesium
pH
Salinity
Sulfate
Porosity
Depth
1***
***
NS
NS
****
NS
**NS
NS
**NS
***
Calcium
carbonate
0,943
1***
NS
NS
**
NS
NS
NS
**
NS
NS
NS
***
Inorganiccarbon
0,943
1,000
1NS
NS
**
NS
NS
NS
**
NS
NS
NS
***
Organiccarbon
0,019
-0,061
-0,061
1NS
NS
NS
*NS
**
NS
NS
NS
NS
Methane
-0,382
-0,310
-0,310
-0,217
1NS
NS
NS
NS
NS
NS
NS
NS
NS
Ethane
0,656
0,710
0,710
-0,112
-0,143
1NS
NS
NS
NS
NS
NS
NS
**
Alkalinity
-0,860
-0,439
-0,439
-0,352
0,554
-0,266
1NS
***
NS
NS
NS
NS
NS
Ammonium
0,461
0,627
0,627
0,674
-0,217
0,583
-0,309
1NS
**
NS
**
NS
NS
Calcium
0,851
0,288
0,288
0,201
-0,355
0,061
-0,879
-0,003
1NS
NS
NS
NS
*
Magnesium
-0,541
-0,846
-0,846
-0,871
0,192
-0,353
0,237
-0,893
-0,030
1NS
**
NS
pH
0,005
0,015
0,015
0,254
-0,116
0,157
0,144
-0,376
-0,025
0,105
1NS
NS
NS
Salinity
-0,736
-0,541
-0,541
-0,479
0,194
-0,406
0,565
-0,821
-0,488
0,701
0,502
1*
NS
Sulfate
-0,453
-0,522
-0,522
-0,525
-0,111
0,481
0,016
-0,600
-0,129
0,720
0,242
0,756
1NS
Porosity
-0,968
-0,942
-0,942
0,073
0,318
-0,645
0,500
0,112
-0,686
0,201
-0,401
0,238
0,245
1
Depth
Organic
carbon
Calcium
carbonate
Inorganic
carbon
Porosity
Methane
pH
Ammonium
Alkalinity
Calcium
Sulfate
Ethane
Magnesium
Salinity
Pe
ars
on
co
rre
lati
on
s (r
)
be
twe
en
en
vir
on
me
nta
l
pa
ram
ete
rs a
nd
th
eir
sig
nif
i-
can
ce b
ase
d o
n p
-va
lue
s
NS
n
ot
sig
nif
ica
nt
* 0
.01
<P
<0
.05
(lig
ht
gre
y)
**
<0
.01
(d
ark
gre
y)
***
<0
.00
1 (
da
rk)
Ne
two
rk o
f co
rre
lati
on
s
be
twe
en
th
e 1
4 e
nv
iro
nm
en
tal
pa
ram
ete
rs c
ha
ract
eri
zin
g
IOD
P L
eg
31
7 s
ed
ime
nt
core
.
Inn
er
bo
x p
ara
me
ters
are
pro
xy
s fo
r o
ute
r b
ox
on
es.
P
osi
tive
co
rre
lati
on
N
eg
ati
ve c
orr
ela
tio
n
***
**
*
N
eg
ati
ve c
orr
ela
tio
n
P
osi
tive
co
rre
lati
on
***
*
*
FigureS6RelationshipsbetweenenvironmentalparametersbasedonPearsoncorrelations(r).A
networkofcorrelationswasbuiltbasedonbothpositiveandnegativecorrelations.Depth,Methane,
Organiccarbon,Calciumcarbonate,InorganiccarbonandPorositywerechosenasproxiesfor
Ammonium,Sulfate,Magnesium,Salinity,Ethane,CalciumandAlkalinity.
Depth
Calcium carbonateInorganic carbon
Organic carbon
Methane
Porosity
MBGB
MCG
Unclassified Crenarchaeota
Thermococcales
MBG-E
SAGMEG
BACTERIA
ARCHAEA
EUKARYA
Axis 1 (64.91%)
Axi
s 2
(2
4.7
2 %
)
4H5
42x
73x
2H13H1
Depth
Calcium carbonateInorganic carbon
Organic carbon
Methane
Porosity
Axis 1 (67.41%)
Axi
s 2
(2
1.7
7 %
)
73x
42x
34R122R
128R
87R68x
Basidiomycota_Tremellales
Basidiomycota_Malasseziales
Basidiomycota_FilobasidialesBasidiomycota_Microbotryomycetes_incertae_sedis
Basidiomycota_Wallemiales
Ascomycota_CapnodialesAscomycota_Chaetothyriales
Ascomycota_Sordariomycetes
Ascomycota_Saccharomycetales
Streptophyta_SolanalesStreptophyta_Malpighiales
Ascomycota_MycocalicialesStramenopiles_Ochromonadales
Stramenopiles_Bicosoecida
Streptophyta_PoalesStreptophyta_Rosales
uncultured_Eukaryota
DepthCalcium carbonate
Inorganic carbon
Organic carbon
Methane
Porosity
105R
148R
137R147R
4H5
3H12H1
42x61x
125R
Acidobacteria_DA052
Proteobacteria_Sphingomonadales
Proteobacteria_Myxococcales
Unclas. Bacteria_MLE1-12
Firmicutes_
Bacillales
Actinobacteria_OPB41
Proteobacteria_Rhizobiales
Proteobacteria_Burkholderiales
Proteobacteria_Caulobacterales
Actinobacteria_Corynebacteriales
Proteobacteria_Neisseriales
Chloroflexi_JG30-KF-CM66
Proteobacteria_Pseudomonadales
Unclas. Bacteria_ML635J-21Proteobacteria_Xanthomonadales
Nitrospirae_NitrospiralesCandidate_division_OP9
Planctomycetes_MSBL9
_vadinBA26_MSBL5
Chloroflexi_Caldilineales _GIF9Chloroflexi_GIF3
Proteobacteria_DesulfobacteralesChloroflexi_Napoli-4B-65
BHI80-139Spirochaetes_Kazan-3B-09
_Sh765B-AG-111Proteobacteria_Desulfarculales _MSB-5B2
Acidobacteria_S035
Axis 1 (66.97%)
Axi
s 2
(2
0.0
2 %
)
-1.0 -0.5 0.0 0.5 1.0
Streptophyta_Liliopsida_Poales
Streptophyta_Eudicotyledons_Malpighiales
Streptophyta_Eudicotyledons_Rosales
Streptophyta_Eudicotyledons_Solanales
uncultured_Eukaryota
Ascomycota_Dothideomycetes_Capnodiales
Ascomycota_Eurotiomycetes_Chaetothyriales
Ascomycota_Eurotiomycetes_Mycocaliciales
Ascomycota_unclassified_Sordariomycetes
Ascomycota_Saccharomycetes_Saccharomycetales
Basidiomycota_Tremellomycetes_Tremellales
Basidiomycota_Tremellomycetes_Filobasidiales
Basidiomycota_Wallemiomycetes_Wallemiales
Basidiomycota_Microbotryomycetes_incertae_sedis
Basidiomycota_Exobasidiomycetes_Malasseziales
Stramenopiles_Bicosoecida_Bicosoecida
Stramenopiles_Chrysophyceae_Ochromonadales
Depth
Calcium carbonate
Inorganic carbon
Organic carbon
Methane
Porosity
Po
ale
s
Ma
lpig
hia
les
Ro
sale
s
So
lan
ale
s
un
cult
ure
d_
Euk.
Ca
pn
od
iale
s
Ch
aet
oth
yria
les
Myc
oca
licia
les
So
rda
rio
myc
etes
Sa
cch
aro
myc
eta
les
Trem
ella
les
Filo
ba
sid
iale
s
Wa
llem
iale
s
Mic
rob
o. _
ince
rta
e_
sed
is
Ma
lass
ezia
les
Bic
oso
ecid
a
Och
rom
on
ad
ale
s
De
pth
Ca
lciu
m c
arb
on
ate
Ino
rga
nic
ca
rbo
n
Org
an
ic c
arb
on
Me
tha
ne
Po
rosi
ty
Acidobacteria_Acidobacteria_DA052
Acidobacteria_Acidobacteria_S035
Actinobacteria_Actinobacteria_Corynebacteriales
Actinobacteria_OPB41
Chloroflexi_Caldilineae_Caldilineales
Chloroflexi_GIF3
Chloroflexi_GIF9
Chloroflexi_JG30_KF_CM66
Chloroflexi_MSB_5B2
Chloroflexi_MSBL5
Chloroflexi_Napoli_4B_65
Chloroflexi_Sh765B_AG_111
Chloroflexi_vadinBA26
Firmicutes_Bacilli_Bacillales
Nitrospirae_Nitrospira_Nitrospirales
Planctomycetes_Phycisphaerae_MSBL9
Proteobacteria_Alphaproteobacteria_Caulobacterales
Proteobacteria_Alphaproteobacteria_Rhizobiales
Proteobacteria_Alphaproteobacteria_Sphingomonadales
Proteobacteria_Betaproteobacteria_Burkholderiales
Proteobacteria_Betaproteobacteria_Neisseriales
Proteobacteria_Deltaproteobacteria_Desulfarculales
Proteobacteria_Deltaproteobacteria_Desulfobacterales
Proteobacteria_Deltaproteobacteria_Myxococcales
Proteobacteria_Gammaproteobacteria_Pseudomonadales
Proteobacteria_Gammaproteobacteria_Xanthomonadales
Spirochaetes_Spirochaetes_Kazan_3B_09
BHI80_139
Candidate_division_OP9
Uncultured_Bacteria_ML635J_21
Uncultured_Bacteria_MLE1_12
Depth
Calcium carbonate
Inorganic carbon
Organic carbon
Methane
Porosity
DA
05
2
S0
35
Co
ryn
eba
cter
iale
s
OP
B4
1
Ca
ldili
nea
les
GIF
3
GIF
9
JG3
0_
KF
_C
M6
6
MS
B_
5B
2
MS
BL
5
Na
po
li_4
B_
65
Sh
76
5B
_A
G_
11
1
vad
inB
A2
6
Ba
cilla
les
Nit
rosp
ira
les
MS
BL
9
Ca
ulo
ba
cter
ale
s
Rh
izo
bia
les
Sph
ing
om
on
ad
ale
s
Bu
rkh
old
eria
les
Nei
sser
iale
s
Des
ulf
arc
ula
les
Des
ulf
ob
act
era
les
Myx
oco
cca
les
Pse
ud
om
on
ad
ale
s
Xa
nth
om
on
ad
ale
s
Ka
zan
_3
B_
09
BH
I80
_1
39
OP
9
ML
63
5J_
21
ML
E1
_1
2
De
pth
Ca
lciu
m c
arb
on
ate
Ino
rga
nic
ca
rbo
n
Org
an
ic c
arb
on
Me
tha
ne
Po
rosi
ty
Crenarchaeota_MBG-B
Crenarchaeota_MCG
Unclassified_Crenarchaeota
Euryarchaeota_Thermococcales
Euryarchaeota_MBG-E
Euryarchaeota_SAGMEG
Depth
Calcium carbonate
Inorganic carbon
Organic carbon
Methane
Porosity
MB
G-B
MC
G
Un
cla
ssif
ied
_C
ren
.
Ther
mo
cocc
ale
s
MB
G-E
SA
GM
EG
De
pth
Ca
lciu
m c
arb
on
ate
Ino
rga
nic
ca
rbo
n
Org
an
ic c
arb
on
Me
tha
ne
Po
rosi
ty
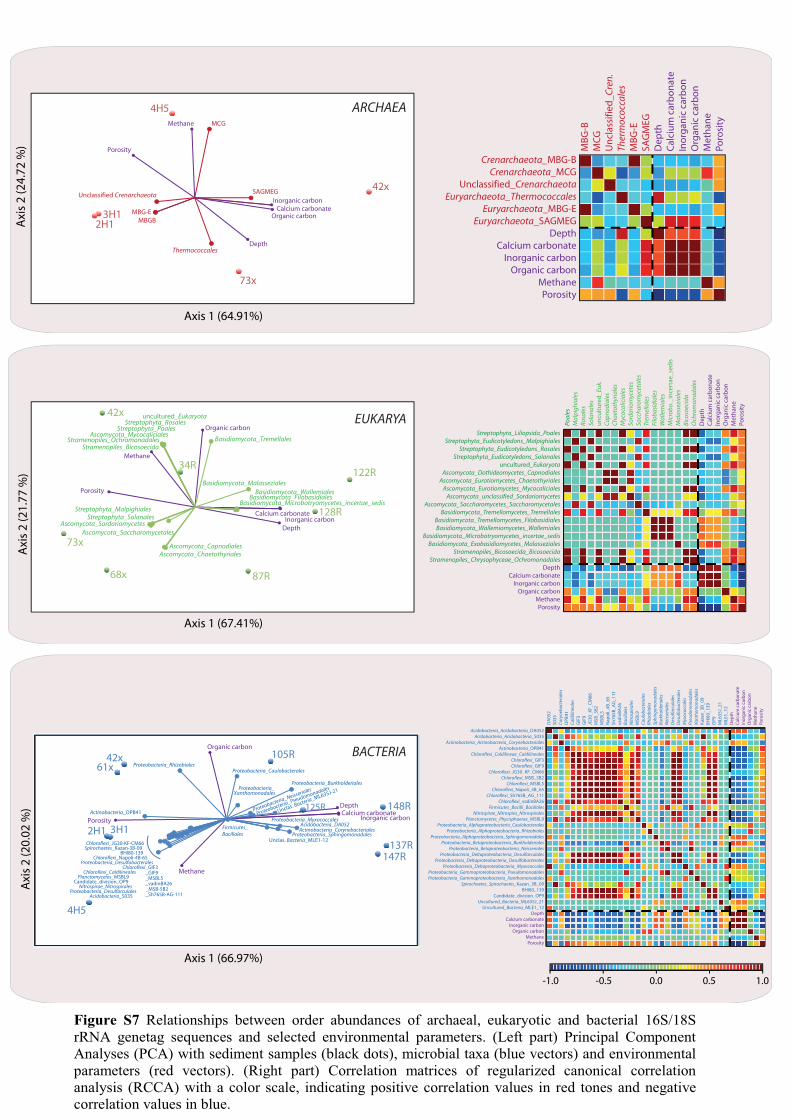
Figure S7 Relationships between order abundances of archaeal, eukaryotic and bacterial 16S/18S
rRNA genetag sequences and selected environmental parameters. (Left part) Principal Component
Analyses (PCA) with sediment samples (black dots), microbial taxa (blue vectors) and environmental
parameters (red vectors). (Right part) Correlation matrices of regularized canonical correlation
analysis (RCCA) with a color scale, indicating positive correlation values in red tones and negative
correlation values in blue.
�
���
�
�
�
�
�
�
�
�
�
�
�
�
�
�
�
�
�
�
�
�
�
Figure S8 Culture flow-diagram. Legend: TCI, tissue culture insert; ASW, artificial seawater.
�
����������
����� ������� ������������������������������������� �!�"�#�
$%� �&%����'�����������
(����)�������*������������������*�+������������������� ��,-#��
��.�������+�������/01�+����������.���.����#�
�1���
,����2�����+��+��������������������.�����������+����������3�/4�5���
��'����������+������)���+��+��+���������6+�.��+��+����.���7��2�1��������.����.�����������������������
�+��+���)�����������6+�.��.����
��'/7����+���.��2�
1
The ISME Journal
Supplementary Information
Ciobanu et al.
SI Text
Site description, sampling details and
depth scale terminology. Hole U1352A was cored with the advanced piston corer system (APC; inside diameter: 6.2 cm) down to 42.2 m CSF-A. Hole U1352B was cored with the APC/extended core barrel (XCB; inside diameter: 6 cm) down to 830.9 m CSF-A. Hole U1352C was drilled and cored with the rotary core barrel (RCB; inside diameter: 5.87 cm) down to 1927.5 m CSF-A. As a contamination control, micro-sized fluorescent microspheres were added during drilling (for every 10 m long sampled core) and the presence of microspheres was checked by epifluorescence microscopy in subsamples from the periphery to the inner center of each core sample. No contamination was detected in the center of cores analyzed in this study. Twenty-five whole-round sediment cores were subsampled onboard under sterile conditions. Subsamples were immediately frozen at –80°C for onshore molecular analyses. Subsamples were stored at 4°C under an anaerobic gas phase for later cultivation and sediment samples of 1 cm3 were taken from the center of all whole-round samples and stored at 4°C in a 3% NaCl/3% formalin solution for onshore prokaryotic cell counting (for details see http://publications.iodp.org/preliminary_report/317/317PR.PDF) (Fulthorpe et al., 2011). Rock samples for molecular analyses
were also flamed in the laboratory before analysis.
Similarly, three holes were drilled at the neighboring site U1351 (44°53’04.22’’S; 171°50’40.65”E) reaching a total depth of 967.3 m CSF-A and were subsampled for cell counting as reported elsewhere (Fulthorpe et al., 2011). Unless otherwise stated, all depth data in this paper refer to the core depth below seafloor computed by conventional method A (CSF-A) depth scale (see “IODP depth scales terminology” at www.iodp.org/program-policies/). This terminology is more accurate than that generally used in microbiological studies on sub-sea-floor samples as it takes into account sources of errors in depth scale determination such as incomplete recovery or core expansion/contraction. Nevertheless, since this method was also the one used in previous IODP studies, meters expressed in CSF-A are equivalent to mbsf (meters below seafloor) reported in the literature. Cell count details. Samples from site U1351 were all counted directly onboard and some were also recounted in the laboratory. Samples from site U1352 were counted in the laboratory. As differences in cell counts were found between onboard data and later laboratory data with samples

2
from site U1351 a correction factor was calculated.
DNA extraction and PCR amplification
details. DNA was extracted from at least 5 × 0.5 – 1 g uncontaminated frozen samples (–80°C) with the FastDNATM Spin Kit for Soil (#6560-200, MP Biomedicals®), following the manufacturer’s instructions. Ten µL of linear acrylamide (5 mg·mL-1, Ambion/Applied Biosystems) were added to the protein lysis buffer in order to favor DNA precipitation in subsequent stages. At the final DNA extraction step, the DNA was eluted with 50 µL of DES solution. Additionally, DNA purifications were also made using a Microcon kit (Millipore) or on agarose gels. Whole genome DNA amplification attempts were also carried out using a commercial kit (GenomiPhi, GE Healthcare) with different DNA dilutions (1/10 and 1/100) and several amplification times (1.5 and 3 h). Concentration of extracted DNA was measured with a NanoDrop 1000 Spectrophotometer (Thermo Scientific) and PCR assays were performed on several dilutions: ½, 1/5, 1/10, 1/100 and 1/1000. In order to obtain direct positive PCR amplifications with our samples, a number of optimizations were performed. These included testing several DNA polymerases such as TaqCORE DNA polymerase (MP Biomedicals), AmpliTaq Gold® DNA polymerase (Applied Biosystems), TaKaRaTM ExTaq DNA polymerase (Ozyme) and FastStart Taq DNA polymerase (Roche), according to the manufacturer’s instructions. After comparison of PCR amplifications with different DNA polymerases, FastStart Taq DNA polymerase (Roche) was chosen. All PCR mixtures (25 µL) contained 1× Taq DNA polymerase buffer with MgCl2 (2 mM) (Roche), 1 mM of additional MgCl2,
240 µM dNTP, 0.4 µM of each primer, 1 volume of 5× GC-rich buffer (Roche), 1 unit of FastStart Taq DNA polymerase (Roche) and 1 µL of DNA template. A “touchdown” PCR program was used to perform direct and nested PCRs for Bacteria, Archaea and Eukarya (Fig. S2). When the amplification methods listed above failed, DNA extracts were amplified with a nested PCR using several primer combinations (Table S2). For nested PCR amplifications targeting Bacteria and Eukarya, the touchdown gradient for the first PCR round was from 61 to 51°C and it was from 58 to 53°C for the second round. For archaeal nested PCR amplifications, the first “touchdown” PCR program was from 68°C to 58°C and the second touchdown PCR program was from 66°C to 61°C. For nested PCR amplifications, the reaction mixture was the same as that used for the first PCR amplifications (see above). In order to minimize stochastic PCR biases, two independent PCR products from the first round were pooled and used as template for the second PCR amplification (with 1 µL of mixed PCR products). This procedure was necessary to obtain visible PCR products on a 1% (w/v) agarose gel stained with ethidium bromide.
454-Pyrosequencing details. The sequencing of replicates was performed to overcome sequencing errors and to keep singletons retrieved in different pyrosequencing replicates, or in different samples (at different depths). For each sample, around 100 ng of PCR product was obtained and sent (on dry ice) to the Environmental Genomics facility of the Observatoire des Sciences de l'Univers de
Rennes (University of Rennes I, France) where sequencing was performed.
3
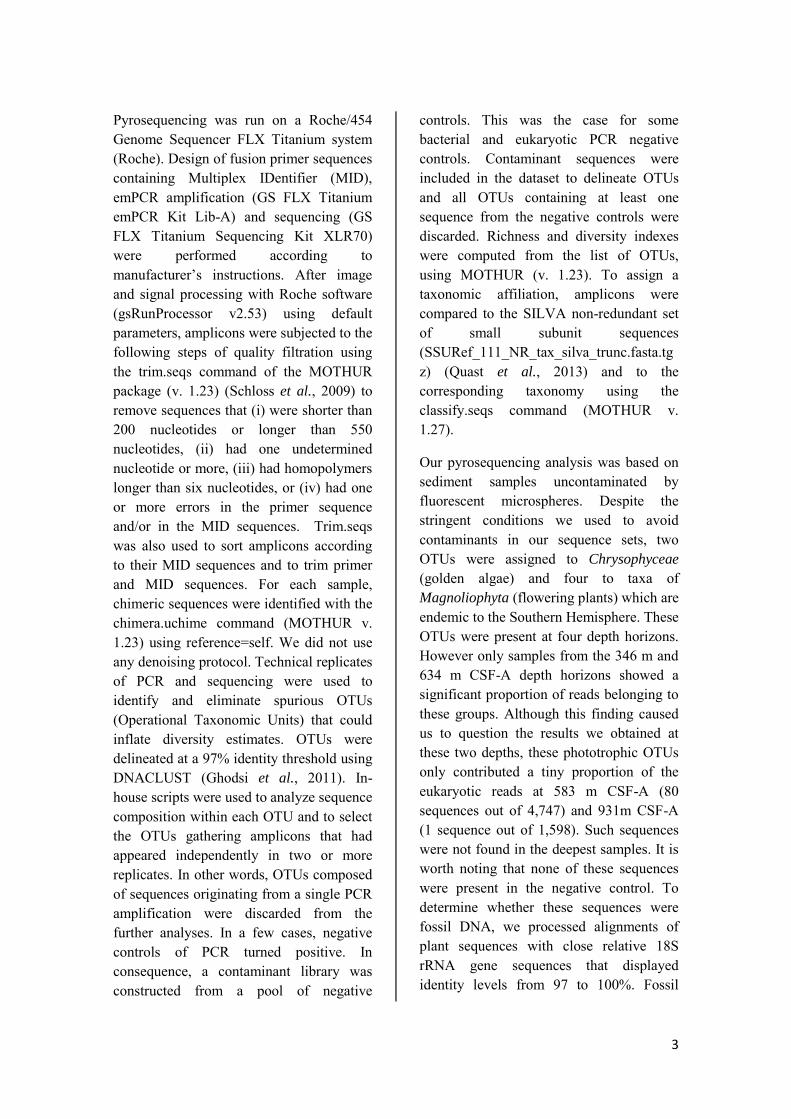
Pyrosequencing was run on a Roche/454 Genome Sequencer FLX Titanium system (Roche). Design of fusion primer sequences containing Multiplex IDentifier (MID), emPCR amplification (GS FLX Titanium emPCR Kit Lib-A) and sequencing (GS FLX Titanium Sequencing Kit XLR70) were performed according to manufacturer’s instructions. After image and signal processing with Roche software (gsRunProcessor v2.53) using default parameters, amplicons were subjected to the following steps of quality filtration using the trim.seqs command of the MOTHUR package (v. 1.23) (Schloss et al., 2009) to remove sequences that (i) were shorter than 200 nucleotides or longer than 550 nucleotides, (ii) had one undetermined nucleotide or more, (iii) had homopolymers longer than six nucleotides, or (iv) had one or more errors in the primer sequence and/or in the MID sequences. Trim.seqs was also used to sort amplicons according to their MID sequences and to trim primer and MID sequences. For each sample, chimeric sequences were identified with the chimera.uchime command (MOTHUR v. 1.23) using reference=self. We did not use any denoising protocol. Technical replicates of PCR and sequencing were used to identify and eliminate spurious OTUs (Operational Taxonomic Units) that could inflate diversity estimates. OTUs were delineated at a 97% identity threshold using DNACLUST (Ghodsi et al., 2011). In-house scripts were used to analyze sequence composition within each OTU and to select the OTUs gathering amplicons that had appeared independently in two or more replicates. In other words, OTUs composed of sequences originating from a single PCR amplification were discarded from the further analyses. In a few cases, negative controls of PCR turned positive. In consequence, a contaminant library was constructed from a pool of negative
controls. This was the case for some bacterial and eukaryotic PCR negative controls. Contaminant sequences were included in the dataset to delineate OTUs and all OTUs containing at least one sequence from the negative controls were discarded. Richness and diversity indexes were computed from the list of OTUs, using MOTHUR (v. 1.23). To assign a taxonomic affiliation, amplicons were compared to the SILVA non-redundant set of small subunit sequences (SSURef_111_NR_tax_silva_trunc.fasta.tgz) (Quast et al., 2013) and to the corresponding taxonomy using the classify.seqs command (MOTHUR v. 1.27).
Our pyrosequencing analysis was based on sediment samples uncontaminated by fluorescent microspheres. Despite the stringent conditions we used to avoid contaminants in our sequence sets, two OTUs were assigned to Chrysophyceae (golden algae) and four to taxa of Magnoliophyta (flowering plants) which are endemic to the Southern Hemisphere. These OTUs were present at four depth horizons. However only samples from the 346 m and 634 m CSF-A depth horizons showed a significant proportion of reads belonging to these groups. Although this finding caused us to question the results we obtained at these two depths, these phototrophic OTUs only contributed a tiny proportion of the eukaryotic reads at 583 m CSF-A (80 sequences out of 4,747) and 931m CSF-A (1 sequence out of 1,598). Such sequences were not found in the deepest samples. It is worth noting that none of these sequences were present in the negative control. To determine whether these sequences were fossil DNA, we processed alignments of plant sequences with close relative 18S rRNA gene sequences that displayed identity levels from 97 to 100%. Fossil

4
DNA is commonly characterized by abnormal substitutions or deamination of cytosine residues, but neither was observed in this case, suggesting that these sequences do not represent fossil DNA, even though this analysis was only processed on short sequences (454 reads). So, these sequences might correspond to contaminants. However, as kinetics of phosphodiester bonds have never been studied under pressure, and as plant sequences were observed only on these given horizons that were characterized by bioturbation, these sequences might also correspond to buried preserved remains (carbonates are good matrices for DNA preservation) or could have been transported to their positions during the last 500,000 years. Indeed, another recent study found rRNA signatures from plants and diatoms in marine sub-seafloor sediments ranging from 0.03 to 2.7 million years old (Orsi et al., 2013). Real-time PCR measurement details.
Bacterial and archaeal 16S rRNA gene copy numbers were tentatively converted to cell numbers by applying correction factors of 4.2 and 1.7, corresponding to the respective average copy numbers of 16S rRNA genes in these domains (source: rrndb http://rrndb.mmg.msu.edu, May 2013).
Cultures and approaches used for their
analysis.
Microcolony cultivation in a sediment
slurry membrane system. For the sediment slurry membrane cultivation system (Ferrari et al., 2005, 2008), sediment slurry was prepared by adding 2-3 g of unsterilized marine sediment into the tissue culture insert (TCI) and then moistening it with 400 µL artificial seawater (ASW). TCIs were allowed to dry for five minutes and then placed upside down in a sterile six-well
multidish (Nunc) that had been previously filled with 1 mL sterile Milli-Q water to prevent the TCIs from drying during incubations at high temperature (Fig. S8). Inocula were prepared by filtering 10 mL of a 1:100 sediment sample dilution on a 0.2 µm white polycarbonate membrane (PC) (Whatman), with a Büchner filtration device. The underside of an inoculated polycarbonate (PC) membrane was then placed on the TCI membrane (Fig. S8). The membrane system (TCI/PC membrane) allows nutrients and growth factors naturally present in the environment to be used by the microorganism community that grows on the PC membrane. The culture system (multidish containing TCI/PC membranes) was placed in an anaerobic jar containing two paper strips impregnated with a 10% (v/v) Na2S·9H2O solution, sealed, and incubated at 60-70°C for 2 weeks. Negative control preparations consisted of non-inoculated PC membranes that were placed on top of the TCI growth support system containing nonsterile sediment slurries. Each multidish contained a negative control (non-inoculated medium).
Media preparation and culture conditions.
Each liter of artificial seawater (ASW), used for microcolony cultivation, contained: KBr (0.09 g), KCl (0.6 g), CaCl2 (1.47 g), MgCl2.6H2O (5.67 g), NaCl (30 g), SrCl2.6H2O (0.02 g), MgSO4.7H2O, (5.62 g), NaF (0.002 g), and PIPES buffer (3 g). The pH was adjusted to 7.5. After autoclaving, the medium was cooled and the following solutions were added from sterile stock solutions: NH4Cl (4.67 mM), KH2PO4 (1.5 mM), a solution of seven vitamins (1×) and a trace element solution (1X). Different anaerobic metabolisms were targeted in culture: fermentation, sulfate-reduction and methanogenesis/acetogenesis. For the enrichment culture step, all media

5
contained 10 µM cAMP (Cyclic adenosine monophosphate), a cellular signalization molecule, and were inoculated as described above. Fermentation assays were performed on samples 137R and 148R; fermentation media were supplemented with 0.5 g·L‒1 yeast extract, 0.5 g·L‒1 peptone and 0.5 g·L‒1 casamino acids. For methanogens/acetogens, four types of substrate were used: (1) H2/CO2 80/20 (2 bars), (2) 10 mM acetate, (3) ethanol/methanol, 0.5% (v/v) (and incubation under an atmosphere of N2/CO2 80/20 (2 bars)), and (4) a mixture of methylamine and formate at a concentration of 10 mM each. Enrichment cultures of methanogens/ acetogens were performed with samples 137R and 148R. All media contained resazurin (0.5 g·L–1) as an anaerobiosis indicator, and were incubated for two weeks at 70°C in the dark. Fungal cultures were prepared in Potato Dextrose Broth (Sigma) saturated with dissolved oxygen, and either supplemented with 3% (w/v) sea salts (PDB3) or not (PDB0). Replicates were processed for each positive sample (3H5, 5H3, 88X1). Sample 3H5 was incubated in plastic tubes sealed with sterile Parafilm at 4 MPa and 25°C, 5H3 and 88X1 at 11 MPa and 25°C. Cultivation under high-hydrostatic pressure was carried out in 10 mL syringes loaded with medium and then placed into a high-pressure/high temperature incubation system, custom-built by Top-Industrie (Vaux le Pénil, France).
Microcolony visualizations, microscopic
observations, fluorescent in situ
hybridizations. Growth on PC membranes was checked by fluorescence microscopy after staining of total cells on PC membranes. A quarter of each PC membrane was stained with SYBR®Green I (1:1000, Invitrogen, Molecular Probes), as follows: 20 µL of a 10× SYBR®Green I
solution was deposited on a PC membrane section, incubated in the dark for about 15 minutes, air dried and directly mounted on a slide with 40 µL anti-fading solution (50% glycerol, 50% PBS [120 mM NaCl, 10 mM NaH2PO4 pH 7.5], 0.1% p-phenylenediamine). Microcolonies were observed under immersion with an Olympus BX60 epifluorescence microscope (objective 100×, pH3, WIB filter). Images were processed with QCAPTURE PRO 6.0 software. Prokaryotic cells in liquid subcultures were regularly observed by light and epifluorescence microscopy. Growth was monitored by epifluorescence microscopy after culture filtration (0.02 µm pores) and staining with SYBR®Green I (Olympus BX60; magnification 100×, pH3, WIB filter). For observations by fluorescence in situ hybridization, fungal cultures were fixed with 4% (w/v) paraformaldehyde for 3 hours at 4°C. After fixation, cultures were washed three times in phosphate buffer saline and stored in phosphate buffer saline/96% ethanol (v/v) solution. Forty µL of this solution was put on a slide. After drying for 20 min at 46°C, each slide was covered with a 0.1% (w/v) agarose layer. Cells were then dehydrated in three successive baths of ethanol of increasing concentration (50%, 80% and 96%). Hybridization was performed with hybridization buffer (NaCl 0.9M, Tris-HCL 10.18M, SDS 0.01%, formamide 20%) and 3 ng/µL of oligonucleotide probe Euk516 labeled with the fluorochrome Cy3. In addition, 1 µL DAPI was introduced in order to visualize the cell nucleus. After 3 hours of incubation at 46°C, each slide was rinsed independently in a unique buffer rinsing (20 mM Tris-HCl, 5 mM EDTA and 215 mM NaCl) for 10 min at 48°C. The slides were then observed by epifluorescence microscopy (Olympus BX51; magnification X60; Olympus UPlanFL N).

6
Liquid enrichment subcultures. When microcolonies were detected on a (PC) membrane, a quarter section of the same PC membrane was transferred to a new sterile vial containing 5 mL of enrichment medium (ASW supplemented with given substrates) and then incubated at 60-70°C (Fig. S6). Growth was regularly checked by photonic and epifluorescence microscopy (staining with 5 µL 10× SYBR®Green I solution for 100 µl culture). Following at least 30 days of incubation, positive cultures were transferred (1:50 inoculation) under the same conditions to a new sterile vial containing 20 mL of the same medium. Subsequently, given the slow growth and the extremely low biomasses observed in the first subcultures in liquid media, sterile glass beads and a polycarbonate filter were added to the vials in order to allow the microorganisms to adopt an “attached lifestyle”, as in the first enrichment system (Fig. S8). From then, cultures were conducted in the manner of a culture media renewal. To perform culture media renewal in subsequent liquid subcultures, almost all the culture volume was removed aseptically under anaerobic conditions and stored at 4°C in a sterile anaerobic vial, under an atmosphere of 100% N2. Only 0.5 mL of culture was kept in the vial with the original growth media (plus the glass beads and the polycarbonate filter) and then, 20 mL of fresh medium was added to the original vial, using a syringe. The vials were re-labeled accordingly. In order to stimulate growth and to supply growth factors in liquid subcultures, 0.1 g·L‒1 of yeast extract was also added. This was done, as it appeared that we did not enrich true methanogens and true sulfate-reducers in the media targeting these physiological groups, but rather strains degrading yeast extract or PIPES buffer.
With mean cell densities around 4.5 × 10⁵ cells·mL‒1, growth was difficult to monitor. Only the fact that the density in the cultures was maintained after 6-9 subcultures inoculated at 1/40 or 1/50 formally demonstrated that growth occurred in these cultures. The overall dilution factor of the original sample [F(y)] in different subcultures can be calculated as follows: F(y) = [(20/0.4)y] x [(20/0.5)5] where y represents the number of subcultures made with classic transfer (= inoculation of a fresh medium; depending on the sample, the classic transfer method was used from 1 to 4 times) and 5 is the number of subcultures by simple renewal of the medium. Thus, the samples were diluted at least F (1) = 2 × 10⁹ times and a maximum of F (4) = 2 × 10¹² times. Cell counts made on crude sediments from the Canterbury Basin have indicated abundances around 3 × 10⁴ cells/mL. Consequently, considering the wide overall sample dilution factor of the original sample after 6 to 9 subcultures and the observation that that were still 103 to 105 cells/mL in the last subcultures, there are strong indications that growth occurred within cultures. Altogether, the small cell-sizes, the low abundances and the very slow growth rates made these community cultures very difficult to study. After two and a half years of cultivation and 6 to 9 subcultures, these low-density and slow-growing community cultures of fermentative bacteria could not be subcultured further, probably because nutritional or physical-chemical conditions were not optimal.
ATP quantification and viability assays.
Cell viability and structural integrity in bacterial liquid subcultures was monitored using the dual staining LIVE/DEAD® Bacterial Viability Kit (BacLight™) (Molecular Probes), following the manufacturer’s instructions. ATP content
7
within cultures was determined using the Bac Titer-Glo Microbial Cell Viability Assay (Promega) with a 100 nM ATP standard.
DNA/RNA extractions. DNA extractions from liquid subcultures were performed by the phenol-chloroform-isoamyl alcohol method. Five mL of culture were centrifuged (in 3 times) in an Eppendorf at 4°C for 45 min at 13000 x g, and the cell pellet was extracted and eluted in 40 µL DEPC water, then concentrated with a kit Microcon YM-total 100 (Millipore) according to manufacturer's instructions. The concentrated DNA was eluted in 50 µL ultrapure water. As a negative control, a DNA extraction with sterile Milli-Q water was also performed. For RNA extractions, the cell pellet (see above) was suspended in 0.6 mL of STE buffer [STE buffer (per 100 ml): 1 mL Tris / HCl 1 M, pH 8.3, 200 µL EDTA 0.5 M, pH 8.0, 2 mL NaCl 5 M, 96.8 mL RNase-free water] and 1.08 mL of hot acid phenol (pH 4.5 to 5.0; Roth) preheated to 60°C in a water bath. Subsequently, 240 µL SDS 10% (v/v) were added and the mix was incubated in a water bath for 8 min at 60°C. Tubes were then placed on ice and centrifuged 4°C for 25 min at 5000 x g. After centrifugation, the upper aqueous phase was recovered and transferred to a new Eppendorf tube. Eighty µL of sodium acetate (3M) and a volume of hot phenol were added and the tubes were centrifuged again (see above). At this step, the upper aqueous phase was recovered in a new tube and a volume of PCI (125:24:1, pH 4.5 to 5.0; Roth) was added. The solutions were mixed by gentle inversion and then centrifuged. The upper aqueous phase was then recovered and one volume of chloroform was added. The tubes were then centrifuged, and the aqueous phase was recovered without disturbing the interface. RNA was precipitated by adding 2.5
volumes of 96% (v/v) ethanol to the aqueous phase (30 min at ‒80°C). RNA was pelleted by centrifugation (1 h at 4°C, 5000 x g). As a final step, the pellet was washed with 70% (v/v) ethanol and suspended in 50 µL RNase-free water. A DNase treatment was performed by adding 6 µL 10× DNase buffer (Fermentas), 0.6 µL DTT (0.1 mol.L‒1; Roche), 0.6 µL RNase inhibitor (40 units/µL; Roche), 3 µL DNase (1 unit/µL), and incubating the mixture at 37°C for 1.5 h. The reaction was stopped by adding 6 µL EGTA, 20 mM, pH 8. A negative control of RNA extraction was performed with sterile Milli-Q water.
PCR and RT-PCR amplifications. 16S rRNA gene sequences were amplified from the DNA/RNA extracts, and from negative controls, using the universal bacterial primers Bac8F/1492R and the Taq core DNA polymerase (MP Biomedicals), following the manufacturer’s amplification protocol. For the amplifications from RNA extracts, a RT-PCR was performed with 11 µL RNA with the kit RevertAidTM H Minus First Strand cDNA Synthesis (Fermentas), using the primer 1492R 5'‒ACGGHTACCTTGTTACGACTT‒3', following the manufacturer’s instructions. Then, a PCR was performed with the Taq core DNA polymerase (MP Biomedicals). RT-PCR and direct PCR negative controls were also performed on RNA extracts to confirm the absence of contaminant DNA.
Nucleic acid purification. Prior to cloning, PCR products were purified on gel to remove dNTPs or potential non-specific bands. PCR products were migrated on a 1% (w/v) agarose gel and bands of interest were extracted and purified with the kit QIAEX II Agarose Gel Extraction (Qiagen®), according to manufacturer's instructions. Purified DNA was resuspended in 35 µL sterile Milli-Q water
8
and stored at 4°C. The DNA quantification obtained after purification was evaluated by deposition and migration of 5 µL of purified product on a 1% (w/v) agarose gel.
Cloning, sequencing and sequence
analysis. Prior to cloning, PCR amplicons stored at 4°C were given a poly-A tail by incubating the PCR mix (see above) at 72°C for 10 min, then cooling it to 4°C for another 10 min. Four µL of PCR product were then cloned with the TOPO®TA Cloning kit (InvitrogenTM), following the manufacturer's recommendations. Ligation time was extended to 30 min and transformation (within TOP 10 10F’ competent cells) was done within 2 h under gentle shaking (200 rpm). Cells were then plated onto LB agar plates (NaCl, 10g·L‒1, tryptone 10 g·L‒1, yeast extract 5 g·L‒1, agar 20 g·L‒1, pH 7.5, ampicillin 50 mg·L‒
1). One hundred colonies were picked randomly from the transformation plates and grown in deep-wells containing 1.5 mL of LB medium supplemented with ampicillin at 50 mg·L‒1. Deep-well plates were incubated at least 24 hours at 37°C. For each clone culture, a volume of 200 µL was stored in 25% (v/v) glycerol at -20°C. Plasmids were extracted by an alkaline lysis method in deep-wells. Plasmid DNAs were resuspended in 50 µL 1× TE buffer. PCR products were amplified from cloned rRNA gene fragments using primers M13F and M13R, and sequenced. PCR amplicon sequencing was carried out by the Cogenics-Beckman Coulter Genomics Company. Sequences were compared to those present in the databases using the BLASTn algorithm (and then aligned to their nearest neighbor using the programs CLUSTAL_X v2 and PHYLIP v3.69).
References
1. Biddle JF, Lipp JS, Lever MA, Lloyd KG, Sørensen KB, Anderson R et al. (2006) Heterotrophic Archaea dominate sedimentary subsurface ecosystems off Peru. Proc Natl Acad
Sci USA 103:3846-3851. 2. Ferrari BC, Binnerup SJ, Gillings, M (2005) Microcolony cultivation on a soil substrate membrane system selects for previously uncultured soil bacteria. Appl
Environ Microbiol 71:8714-8720. 3. Ferrari BC, Winsley T, Gillings M, Binnerup S (2008) Cultivating previously uncultured soil bacteria using a soil substrate membrane system. Nature Protocols 3:1261-1269. 4. Fry JC, Parkes RJ, Cragg BA, Weightman AJ, Webster, G (2008) Prokaryotic biodiversity and activity in the deep subseafloor biosphere. FEMS Microbiol Ecol 66:181-196.
5. Fulthorpe CS, Hoyanagi K, Blum P, the Expedition 317 Scientists (2011) Site U1352, Proceedings of the Integrated Ocean
Drilling Program 317 (Integrated Ocean Drilling Program Management International, Inc., Tokyo), doi:10.2204/iodp.proc.317.104.2011.
6. Ghodsi M, Liu B, Pop M (2011) DNACLUST: accurate and efficient clustering of phylogenetic marker genes. BMC
Bioinformatics 12:271. 7. Karner MB, DeLong EF, Karl DM (2001) Archaeal dominance in the mesopelagic zone of the Pacific Ocean. Nature 409:507-509. 8. Lloyd KG, Schreiber L, Petersen DG, Kjeldsen KU, Lever MA , Steen AD et al. (2013) Predominant archaea in marine sediments degrade detrital proteins. Nature
496:215-218. 9. Orcutt BN, Sylvan JB, Knab NJ, Edwards KJ (2011) Microbial Ecology of the Dark Ocean above, at, and below the Seafloor. Microbiol Mol Biol Rev 75:361-422.

9
10. Orsi W, Biddle JF, Edgcomb V (2013) Deep sequencing of subseafloor eukaryotic rRNA reveals active Fungi across marine subsurface provinces. PLOS one 8:e56335. 11. Quast C, Pruesse E, Yilmaz P, Gerken J, Schweer T, Yarza P et al. (2013) The SILVA ribosomal RNA gene database project: improved data processing and web-based tools. Nucl Acids Res 41:D590-D596. 12. Schloss PD, Westcott SL , Ryabin T, Hall JR, Hartmann M, Hollister EB et al. (2009) Introducing mothur: Open-Source, Platform-Independent, Community-Supported Software for Describing and Comparing Microbial Communities. Appl Environ Microbiol 75:7537-7541.
13. Teske AP (2006) Microbial communities of deep marine subsurface sediments: molecular and cultivation surveys. Geomicrobiol J 23:357-368.


![Parallelism, Multicore, and Synchronization · sw t1, s1, 4 # store A[i+1] addi s1, s1, +8 # increment pointer bne s1, s3, Loop # continue if s1!=end ALU/branch slot Load/store slot](https://img.pdfslide.us/doc/110x75/5f58ee0e112d542f8b3381fe/parallelism-multicore-and-sw-t1-s1-4-store-ai1-addi-s1-s1-8-increment.jpg)