Embed Size (px)
Citation preview


I
The Islamic University of GazaGraduate Studies - Faculty of EngineeringElectrical Engineering Department
Characterization of Radio Over FiberEmployed GPON Architecture for Different
Modulation Schemes
باستخدام عمارة شبكات توصیف تقنیة الرادیو عبر األلیاف الضوئیةالمختلفةألنواع التضمینGPONالجیجا بت الضوئیة السالبة
A Thesis Presented by:
Yehia Omar Urouq
Under Supervision of:
Dr. Fady El-Nahal
A Thesis Submitted in Partial Fulfillment of the Requirements for theDegree of Master in Electrical Engineering/Communication Systems
April , 2014

II
Abstract
One of the most significant developments within the fiber optic technology is passive
optical network (PON) which is a point-to-multipoint network architecture. Compare
to other PONs, Gigabit-PON (GPON) is attractive due to the flexibility, simple and
low cost passive connection. Radio over fiber (RoF) is One of the most important
applications in the fiber optic system, RoF is a hybrid system that integrates the
wireless and optical in one system. The combination of GPON with RoF technology
provides high capacity, high data rate and low cost of development. This research
provides characterization of RoF employed GPON architecture for wireless
distribution network. The Simulations has been performed on OPTISYSTEM
software. The analysis of simulation results are based on the bit error rate (BER),
received signal strength and eye pattern obtained for various modulation schemes.
The system has been analyzed using phase shift keying (PSK) modulation, differential
phase shift keying (DPSK) modulation and offset quadrature phase shift keying
(OQPSK) modulation with different length from the optical line termination (OLT) to
optical network unit (ONU). The best results were achieved using PSK modulation,
and for different modulation schemes, the BER is accepted for length of fiber up to 40
km in upstream and downstream.

III
ملخص الرسالة
. النقطة ألكثر من نقطة
GPON ة والبساطة وقلة تكلفة التوصیل السالبلمرونبسبب ااكتسبت الكثیر من االھتمام.
الالسلكیةیدمجھجینھو نظامROFاأللیاف البصریة،في نظامأھم التطبیقاتھي واحدة من(ROF)الضوئیة
، ROFالمزج .في نظام واحدالبصریةو
.للتنمیةمنخفضةوتكلفةللبیاناتنقل عالي لمعد
.
,برنامجطریق OPTISYSTEM.قوة اإلشارة و،منحنى نسبة الخطأعلىاعتمدالتحلیل لنتائج المحاكاة
.التي تم الحصول علیھانمط العین
PSK, DPSK and OQPSK, .
OLTONU.
PSK ، 40أیضا منحنى نسبة الخطأ أعطى نتائج مقبولة لجمیع أنواع التضمین وحتى طول
.في كل من مرحلة التنزیل ومرحلة اإلرسال

IV
Acknowledgement
A thesis cannot be completed without the help of many people who contribute directly
or indirectly through their constructive criticism in the evolution and presentation of
this work.
I would like to express my deepest gratitude for my parents who have always been
there to support me. I also thank my wife who has been strongly supportive to me to
the end of this thesis.
I am also greatly thankful to my supervisor, Dr. Fady El-Nahal, whose
encouragement, guidance and support from the initial to the final phase enabled me to
develop a deep and thorough understanding of the subject. Finally, I offer my regards
and blessings to all of those who supported me in any respect during the completion
of the thesis.
V
Table of Contents
Abstract ................................................................................................................. II
ملخص الرسالة …………………………………………………………................... III
Acknowledgement ………………………………………….………................... IV
Table of Contents ………………………………..………………….................... V
List of Figures ……………………………………………………....................... VII
List of Tables ………………………..........………………………….................. IX
Abbreviations ……………………………………..………………..................... X
Chapter 1 – Introduction ………………..…………………………................... 1
1.1 Introduction ……………………………………………………..................... 1
1.2 Problem Statement ……………………………………………….................. 2
1.3 Literature Review ………………………………………………................... 2
1.4 Objectives ………………………………………………………................... 3
1.5 Thesis Overview ………………………………………………..................... 4
Chapter 2 - Optical Communications and Passive Optical Network …………. 5
2.1 Introduction ……………………………………………………..................... 5
2.2 Optical Transmission link ………………………………………................... 5
2.2.1 Optical Transmitter …………………………………………….................. 6
2.2.1.1 Light Emitting Diodes ……………………………………..................... 6
2.2.1.2 Laser Diodes ………………………………………………..................... 6
2.2.2 Fiber …………………………………………………………..................... 6
2.2.2.1 Multimode versus Single mode Fiber ………………………................... 7
2.2.2.2 Fiber Attenuation …………………………………………….................. 8
2.2.2.3 Dispersion ………………………………………………….................... 8
2.2.3 Optical Receivers ……………………………………………..................... 9
2.2.3.1 PIN Receivers ………………………………………………................... 10
2.2.3.2 Avalanche Photodiode Receivers …………………………..................... 10
2.2.4 Optical Modulation …………………………………………….................. 11
2.2.4.1 Electro-optic Modulation System …………………………..................... 12
2.2.4.2 Electro-optic Match Zender Modulation …………………….................. 12
2.2.5 Optical Amplifier ……………………………………………..................... 12
2.2.5.1 Erbium doped Fiber Amplifier EDFA ……………………….................. 14
2.3 Passive Optical Networks ………………………………………................... 14
2.3.1 Generic Operation of passive Optical Networks ……………..................... 15

VI
2.3.2 Optical Line Terminal ………………………………………….................. 15
2.3.3 Optical Network Unit ONU …………………………………..................... 16
2.3.4 Splitter ………………………………………………………….................. 16
2.3.5 Operation Description Of Passive Optical Networks ………….................. 17
2.3.5.1 Downstream Channel ……………………………………….................... 17
2.3.5.2 Upstream Channel …………………………………………..................... 17
2.3.6 GPON ………………………………………………………….................. 17
2.3.8 Why GPON …………….……………………………………..................... 19
Chapter 3 Radio Over Fiber RoF ………..………………………….................. 20
3.1 Introduction …………………………………………………….................... 20
3.2 RoF Link Configuration ………………………………………..................... 21
3.3 Benefits of RoF Technology ……………………………………................... 22
3.3.1 Low Attenuation ……………………………………………….................. 22
3.3.2 Large BandWidth …………………………………………….................... 23
3.3.3 Immunity to Radios Frequency Interference ………………….................. 23
3.3.4 Dynamic Resource Allocation ……………………………….................... 23
3.3.5 Low Cost ……………………………………………………….................. 24
3.4 Application of Rof Technology ………………………………….................. 24
3.4.1 Cellular Networks …………………………………………….................... 24
3.4.2 Satellite Communications …………………………………….................. 24
3.4.3 Wireless LAN ………………………………………………….................. 25
3.4.4 vehicle communication and control …………………………..................... 25
3.5 Digital modulation……………………………………................................... 25
3.5.1 Phase Shift Keying (PSK)…………………………………………………. 26
3.5.2 Quadrature phase-shift keying (QPSK) ……………………....................... 26
3.5.3 Differential Phase shift keying (DPSK) ……………………....................... 27
Chapter 4 Design Of The RoF Employed GPON Architecture …….................. 28
4.1 Introduction ……………………………………………………..................... 28
4.2 System Model of Bidirectional Transmission for RoF employed GPON
Architecture ……..…….………………………………........................................ 29
4.2.1 Downstream Link …………………………………………….................... 32
4.2.1.1Transmitter …………………………………………………..................... 33
4.2.1.2 Circulator …………………………………………………….................. 34
4.2.1.3 Fiber ………………………………………………………….................. 35
4.2.1.4 Splitter ………………………………………………………................... 35
VII
4.2.1.5 Receiver …………………………………………………….................... 36
4.2.2 Upstream Link ………………………………………………..................... 37
4.2.2.1 Transmitter ………………………………………………….................... 37
4.2.2.2 Splitter, Fiber and Circulator ……………………………….................... 41
4.2.2.3 Receiver …………………………………………………….................... 41
4.3 Results for PSK Modulation for 20 Km Fiber Length …………................... 42
4.4 Results for DPSK Modulation for 20 Km Fiber Length ……….................... 45
4.5 Results for OQPSK Modulation for 20 Km Fiber Length ………................. 47
4.6 Test the performance of the PSK, DPSK and QPSK System for different
Fiber length ......…………………………………………………….................... 49
4.6 Results comparison of various modulation type and fiber link ... ................. 52
4.7 summary ………………………………………………………..................... 55
Chapter 5 Conclusion and Future Work ……………………...……................... 56
5.1 summary ………………………………………………………..................... 56
5.2 Suggestion for Improvement …………………………………….................. 57
References …………………………………………………………..................... 58
VIII
List Of Figures
Figure 2.1 : Optical transmission link. ………………………….………………... 5
Figure 2.2 : Optical fiber core with surrounding cladding and protective jacket 7
Figure 2.3: PIN photodetector………………………….………………................. 10
Figure 2.4: Functional types of optical ……………………..………..................... 13
Figure 2.5 : Passive Optical Networking Diagram. ………………..….................. 15
Figure 2.6: ITU-T GPON Standard G.984: Single Fiber. …………….................. 18
Figure 3.1: General RoF Architecture ……………..………………….................. 21
Figure 3.2 Radio signal transport schemes for RoF systems ..……….................... 22
Figure 3.3:Constellation diagram for BPSK………....................……..................... 26
Figure 3.4: Constellation diagram for QPSK………....................…….................... 27
Figure 4.1 Schematic of a bidirectional RoF system ……………...…................... 29
Figure 4.2: System model in optisystem………………..….................................. 30
Figure 4.3 Transmitter in the bidirectional RoF system …………….................... 31
Figure 4.4 Receiver in the bidirectional RoF system …………….….................. 31
Figure 4.5 PSK Modulated signal ………………….………………..................... 33
Figure 4.6 modulation at the MZM ………..………………………….................. 34
Figure 4.7: The electrical signal after PIN. ………………..…................................ 36
Figure 4.8 The MZM transmitted signal at 1330 nm. ……………….................... 38
Figure 4.9: implementation of TDMA using two cascaded dynamic Y selector… 39
Figure 4.10 Signal transmitted by ONU 1 in time domain …………...................... 40
Figure 4.11Signal transmitted by ONU 16 in time domain …………..................... 40
Figure 4.12 Signal transmitted by ONU 32 in time domain …………................... 41
IX
figure 4.13 Splitter output toward the fiber in the time domain . ……................... 41
Figure 4.14: Receiver in upstream ………………..…........................................... 42
Figure 4.15: received signal after photo detection and filtering………………..… 42
Figure 4.16: RF spectrum regenerated at the 5GHz working frequency………… 43
Figure 4.17: Eye diagram and BER of ONU 1 – downstream…………………… 43
Figure 4.18: Eye diagram and BER for upstream………………………………… 44
Figure 4.19: RF spectrum regenerated at the 5GHz working frequency…………. 45
Figure 4.20: DPSK Eye diagram and BER for downstream……………………… 46
Figure 4.21 : DPSK Eye diagram and BER for upstream………………………… 46
Figure 4.22 : RF spectrum regenerated at the 5GHz working frequency……….. 47
Figure 4.23: OQPSK Eye diagram and BER for downstream…………………… 48
Figure 4.24: OQPSK Eye diagram and BER for upstream……………………….. 48
Figure 4.25: BER of PSK for system of varied fiber length………………………. 49
Figure 4.26: Received Power for PSK system of varied fiber length…………….. 50
Figure 4.27 BER of DPSK for system of varied fiber length…………………… 50
Figure 4.28: Received Power for DPSK system of varied fiber length………….. 51
Figure 4.29: BER of OQPSK for system of varied fiber length………………..…. 51
Figure 4.30: Received Power for OQPSK system of varied fiber length………… 52
Figure 4.31: downstream BER for PSK,OQPSK and DPSK and for varied fiber
length…............................................................................................................... 53
Figure 4.32 Upstream BER for PSK,OQPSK and DPSK and for varied fiber
length……………………………………………………………………………… 53

X
List Of Tables
Table 4.1 hardware configurations of the transmitter in Downstream . .................. 34
Table 4.2 hardware configurations of the fiber ………………….…..................... 35
Table 4.3 hardware configurations of the Splitter ……………….….................... 36
Table 4.4 hardware configurations of the Receiver ……..…………….................. 37
Table 4.5 hardware configurations of the transmitter in Upstream ….................... 38
Table 4.6 PSK downstream – upstream results ………………….…..................... 44
Table 4.7 DPSK downstream – upstream results ……………….…….................. 47
Table 4.8 OQPSK downstream – upstream results ……………….….................. 49
Table 4.9 Results comparison for various modulation type and fiber link ………. 54

XI
Abbreviations
APD Avalanche Photodiode
ASE Amplified Spontaneously Emission
ATM Asynchronous Transfer Mode
BB Baseband
BER Bit Error Rate
BPF Band Bass Filter
BPON Broadband Passive Optical Network
BS Base Station
BW BandWidth
CS Central Station
CW Continuous Wave
dB Decibels
DPSK Differential Phase Shift Keying
DWDM Dense Wavelength Division Multiplexing
EDFA Erbium-doped fiber Amplifiers
EFM Ethernet in the First Mile
EMI Electro-Magnetic Interference
EPON Ethernet Passive Optical Network
FOA Fiber Optical Amplifiers
FSAN Full Service Access Network
FTTH Fiber-to-the-Home
GPON Gigabit Passive Optical Network
GSM Global System for Mobile Communications
HDTV High-definition television
IEEE Institute of Electrical and Electronics Engineers

XII
IF Intermediate Frequency
ISI Intersymbol Interference
ITS Intelligent Transport Systems
ITU International Telecommunication Union
IVC Inter-Vehicle Communication
LD Laser Diode
LED Light Emitting Diode
MAC Media Access Control
MZM Mach-Zehnder Modulator
NT Network Terminal
ODN Optical Distribution Network
OQPSK Offset Quadrature Phase Shift Keying
OLT Optical Line Terminal
ONU Optical Network Unit
OTL Optical Transmission Link
OTDM Optical Time Division Multiplexing
PIN Positive-Intrinsic-Negative
PM Physical Media
PMD Polarization Mode Dispersion
POF Polymer Optical Fibers
POLT Packet Optical Line Terminal
PON Passive Optical Network
PRBS Pseudo Random Binary Sequence
PSK Phase Shift Keying
QPSK Quadrature Phase Shift Keying
RBS Remote Base Station

XIII
RF Radio Frequency
RoF Radio over Fiber
RS Remote Station
RVC Road-to-Vehicle Communication
SMF Single Mode Fiber
SOA Semiconductor Optical Amplifier
TDM Time Division Multiple
TDMA Time Division Multiple Access
VOLT Video Optical Line Terminal
WDM Wavelength Division Multiplexing
WLAN Wireless Local Area Network

XIV
This page left intentionally blank

1
1 Introduction
1.1 INTRODUCTIONThe result of integrated fiber optic and wireless is considered the base for the
convergence of radio and optical system. Thus, an efficient technology is needed to
appropriately support the operation of this advanced system. By making broadband
access network termination close to the end users, it is now easily to use new
application with high Band Width (BW) demand such as high definition video
services. Thus, the proposed solution is Passive Optical Network (PON) which offer
more opportunities for high speed communications; also it has broadcasting features
and provides better security[1].
Because of its high BW and low attenuation characteristics, Fiber optic is widely used
as a major building block in the telecommunication infrastructure. The demand for
and use of optical fiber has grown enormously and optical-fiber applications are
widespread, ranging from global networks to desktop computers. The ability of
transmitting voice, data, or video over very short, or very long distances provides
remarkable value for communication networks like mobile phone, wireless system
and broadband, due to the reduction of energy consumption and cost. Fiber optic
technology is understood as the promising technology for future networks and trusted
by users [2].
Radio over fiber (RoF) is one of the most important applications in the fiber optic
system. At RoF, light modulated into radio frequency and transmits it via optical fiber
to facilitate wireless access. Technically, RoF is a hybrid system that integrates the
wireless and optical in one system leading towards high capacity, high data rate,
transparent and mobility solution [2].
Connecting a number of Remote Base Station (RBSs) to the Central Station (CS) -
centralized architecture- in RoF allows the cost reduction, easier controlling and
system upgrading. RoF is a rather ideal technology for the integration of wireless and

2
wired networks. The main reason being is that it combines the best attributes of two
common communication types. Firstly, the wireless network connection frees the end
user from the constraints of a physical link to a network which is a drawback of
conventional fiber optic networks. Secondly, optical networks have unlimited amount
of bandwidth with which to satisfy the most bandwidth customers demand where
bandwidth for wireless networks can be a considerable problem. RoF networks allow
the customers to maintain their mobility while also providing them with the
bandwidth necessary for both current and future communication [3].
1.2 Problem Statement
Gigabit-PON (GPON) is a variant of PON technology which can support higher data
rate (~ 2.5 Gbps) using a point to multipoint access mechanism. RoF networks comes
into picture when requirement of high data rate can not be satisfied by decreasing cell
size or by allocating more bandwidth because both these methods lead to increased
complexity of base band station. RoF system is integration of wireless and fiber based
technology. The main goal of RoF system is the distribution of broadband signals to
distributed base stations for wireless access using an optical access network. The
combination of GPON with RoF technology provides high capacity and high data rate
solution. This research provides characterization of RoF employed GPON
Architecture for wireless distribution network by PSK, DPSK and OQPSK
modulation. The system will be tested for length from the OLT to ONU of 10 Km up
to 60Km .
1.3 Literature Review
To meet the accelerating demands in communication systems, the integration of
optical network and wireless radio is a promising solution. ROF means the optical
signal is being modulated at radio frequencies and transmitted via the optical fiber. In
addition with broadband passive optical network BPON, GPON is the most often type
used by European and US providers while providers in Asia predominantly use
Ethernet passive optical network (EPON) [4].
GPON is more advantageous, more robust, offers more capacity and has higher
profitability compared to EPON is the result of a comparison between EPON and

3
GPON [5]. An overview of Gigabit PON and analyses network architecture,
transmission mechanisms and power budget in GPON systems were done successfully
in [6]. The works on the distribution of the mobile 3G on GPON, have been done with
limited number of ONU due to the Universal Mobile Telecommunication System
(UMTS) channel limitation[7,8].
The integration of wireline and wireless services has been proposed but only
concentrating on a single network connection. Good BER (10-13) was achieved with
fiber length extended to 45 km. However, the power budget performance was less
analyzed [9]. Downstream link is presented for GPON with data rate of 1.25 Gb/s, and
all the optical distribution network (ODN) classes are implemented, using Optisystem,
to investigate the transmission capability and performance of the proposed
downstream physical media (PM) GPON model. Some of the design constraints
involved in an optical network design such as fiber span analysis, power budget and
margin calculations are taken into consideration with worst case [10].
The Performance of IEEE 802.11 over fiber at Media Access Control "MAC" layer
employing GPON architecture are analyzed [1]. This work presents the analysis of
the adoption of fiber with GPON architecture into the wireless network which is
feasible to be developed into a building. Authors measure the performance of IEEE
802.11 throughput at the MAC layer. The distribution of IEEE 802.11 Wireless Local
Area Network (WLAN) service using RoF technique in GPON network architecture
was characterized by means of simulation which was done in OptiSystem software
[2]. The bidirectional transmission was used with fiber length varied from 2-20 km
and PSK Modulation. Based on those previous papers and studies, there are so many
researches and works in the field of RoF Employed GPON Architecture for Wireless
Distribution Network
1.4 Objectives
Development of the bidirectional transmission for RoF employed GPON
architecture for a length from the OLT to ONU of 20 km.
4
Evaluating the performance of the system using BER, Q factor and eye
diagram for the PSK Modulation.
Evaluating the performance of the system for DPSK modulation.
Evaluating the performance of the system for OQPSK modulation.
Evaluating the performance of the system for the different modulation
schemes and different modulation schemes.
Compare the results for the system performance for the different modulation
schemes and different fiber length.
1.5 Thesis Overview
Chapter 2 shows an introduction to optical communications. The major components
of a communications system are described including optical transmitters, fiber, and
receivers. Following this, the concept of a PON will be presented including PON
architecture which consist of the optical line terminal (OLT) at the service provider’s
central office (CO), the optical network units (ONUs) and the Splitter. Then PON
technologies and the current standard for Gigabit-capable Passive Optical Networks
(GPON) are outlined.
Chapter.3 describes the RoF technology, which shows introduction to the RoF, the
benefits, the limitations and applications of RoF technology in communication fields.
In addition it covers various types of modulations schemes.
Chapter 4 presents the methodological processes by showing detailed diagram of the
methods implemented as well as highlighting briefly the steps those have been
followed to achieve the objective of this project.
In Chapter 5 introduces the conclusions of the research, and describes the possible
future works.

5
2 Optical Communications and
Passive Optical Network
2.1 Introduction
Optical fiber is a transmission medium usually used in data networks, like PON. Fiber
may be defined by a thin, transparent and flexible glass or plastic, by which light
pulses are sent in order to represent data to be transmitted. The beam is completely
contained and it spreads inside the fiber at an angle of reflection above the critical
angle of total reflection, according to Snell’s law [11].
Optical fiber is widely used in telecommunications because it allows to send large
amounts of data to large distance and have higher bandwidths than other forms of
communication. It is a transmission medium that provides high immunity to
electromagnetic interference and signals travel along them without high losses. This
way of transmission allows the transport of a large amounts of information. It is used
for applications such as broadband internet, telephone and cable television [11]. This
chapter highlights the literature cited on the optical transmission link with more
details about optical fiber, optical transmitter, optical modulation, optical receiver and
optical amplifier, and covers about the Passive optical Network.
2.2 Optical Transmission Link (OTL)A general optical transmission link, is briefly described for which assumed that a
digital pulse signal is transmitted over optical fiber unless otherwise specified as
shown in figure 2.1. The optical link consists of an optical fiber transmitter, receiver,
and amplifier each of which is dealt with in the subsequent subsections.
Figure 2.1: Optical transmission link.

6
2.2.1 Optical TransmittersAn optical transmitter converts an electrical signal into an optical signal and launches
the optical signal into an optical fiber. In optical communications networks the ideal
optical transmitter is one which outputs a high quality of light. This can be defined by
having a narrow spectral width, high stability, low power consumption and a tunable
central wavelength. The most common light sources found in fiber optic
communication systems are light emitting diodes (LEDs) and laser diodes (LDs).
Both are small semiconductor devices that convert electrical signals into light[11].
2.2.1.1 Light Emitting Diodes (LEDs)
LEDs emit light through spontaneous emission and are used extensively in fiber optic
communication systems due to their small size, long lifetime and low cost. They are
mostly found in short distance, low bandwidth networks such as local area network
(LAN) as they are limited in their transmission capabilities by their low output
intensity, poor beam focus and incoherent radiation[11].
2.2.1.2 Laser Diodes (LDs)In comparison to LEDs, lasers emit light through amplification of radiation by
stimulated emission. Lasers have a higher output power than LEDs and so they are
capable of transmitting information over longer distances. Also lasers have a much
narrower spectral width and can provide high bandwidth communication over long
distances, thus are an excellent light source for long haul fiber optics links[11].
2.2.2 FiberOptical fiber is a dielectric waveguide that operates at optical frequencies and
transmits information in the light form along its axis as shown in figure 2.2 [11]. It
has a central core in which the light is guided, embedded in an outer cladding of
slightly lower refractive index. Core and cladding are protected by buffer and outer
jacket where the core has the highest refractive index. Optical fiber has two low-
attenuation regions [12]. The region of 1300 nm is a range of 200 nm and its
attenuation is less than 0.5dB/ km, has a total BW of about 25 THz. The second
region centered at 1550 nm with attenuation is less than 0.2 dB/km. Combining these
two regions provide a theoretical of 50 THz bandwidth. By using these large low
attenuation areas for data transmission, the signal loss for a set of one or more

7
wavelengths can be made very small. Thus, reducing the number of amplifiers and
repeaters actually needed.
Figure 2.2: Optical fiber core with surrounding cladding and protective jacket[11]
In the experiments of long distance, optical signals can been sent over hundreds of
kilometers without amplification. In addition to large bandwidth and low attenuation,
Fiber offers low error rates. Communication systems using an optical fiber typically
operate at BER’s of less than 10-10 [2]. When installing local networks in buildings,
the small radius of fiber make it occupy the same physical space as copper. Also, fiber
transmission has high immunity to electromagnetic interference and does not cause
interference. mainly there are two types of optical fiber: first so called as step index
fiber and second graded-index fiber.
2.2.2.1 Multimode versus Single-Mode FiberA mode in an optical fiber corresponds to one of the possible multiple ways in which
a wave may propagate through the fiber. It can also be viewed as a standing wave in
the transverse plane of the fiber. More formally, a mode corresponds to a solution of
the wave equation that is derived from Maxwell's equations and subject to boundary
conditions imposed by the optical fiber waveguide. If more than one mode propagates
through a fiber, then the fiber is called multimode. In general, a larger core diameter
or high operating frequency allows a greater number of modes to propagate [11].
The advantage of multimode fiber is that, its core diameter is relatively large; as a
result, injection of light into the fiber with low coupling loss can be accomplished by
using inexpensive, large-area light sources, such as light-emitting diodes (LED's). The
disadvantage of multimode fiber is that it introduces the phenomenon of intermodal
n1 n2
n1>n2
Jacket
8
dispersion. In multimode fiber, each mode propagates at a different velocity due to
different angles of incidence at the core-cladding boundary. This effect causes
different rays of light from the same source to arrive at the other end of the fiber at
different times, resulting in a pulse that is spread out in the time domain. Intermodal
dispersion increases with the distance of propagation, so that it limits the bit rate of
the transmitted signal and the distance that the signal can travel [13].
Thus, in RoF networks multimode fiber is not utilized as much as possible, instead,
single-mode fiber is widely used. Single-mode fiber allows only one mode and
usually has a core size of about 10μm, while multimode fiber typically has a core size
of 50-100 μm. It eliminates intermodal dispersion and hence can support transmission
over much longer distances. However, it introduces the problem of concentrating
enough power into a very small core. LED's cannot couple enough light into a single-
mode fiber to facilitate long distance communications. Such a high concentration of
light energy may be provided by a semiconductor laser, which can generate a narrow
beam of light [11].
2.2.2.2 Fiber AttenuationAttenuation is the loss of optical power of a signal as it travels down a fiber.
Attenuation depends on the wavelength of the light propagating within it and is
measured in decibels per length (dB/m, dB/km). Attenuation characteristics can be
classified as intrinsic or extrinsic. Intrinsic attenuation occurs due to substances
inherently present in the fiber, whereas extrinsic attenuation occurs due to external
influences such as bending or connection loss [11].
2.2.2.3 Dispersion
The output from a optical communications source (LED or LASER) is not a single
wavelength but in fact a distribution of wavelengths. These various wavelength
components propagate along the fiber at different speeds and arrive at the receiver at
different times thus causing the pulse to spread or disperse. This is characterized by
the dispersion parameter [13].
Dispersion is measured in picoseconds of pulse widening per nanometer of the signal
spectral width per kilometer of the path length i.e. ps/nm.km. When a pulse spreads to
the degree where it overlaps with an adjacent pulse, it causes detection problems at
the receiver resulting in errors in transmission. This is called intersymbol interference

9
(ISI) or patterning. Dispersion is a limiting factor in fiber bandwidth, as the shorter
the pulses, the shorter the possible time between the pulses, the more susceptible they
are to patterning [11].
There are three types of dispersion found in fiber optical communications: chromatic,
intermodal and polarization mode dispersion. Chromatic dispersion occurs in all types
of fibers; intermodal dispersion only occurs in multimode fibers and polarization
mode dispersion is only significant in single mode fibers. Intermodal dispersion is
caused when multiple modes of the same signal propagate at different velocities along
the fiber. Intermodal dispersion does not occur in a single mode fiber [13].
Another form of dispersion is material or chromatic dispersion. In a dispersive
medium, the index of refraction is a function of the wavelength. Thus, if the
transmitted signal consists of more than one wavelength, certain wavelengths will
propagate faster than other wavelengths. Since no laser can create a signal consisting
of an exact single wavelength, chromatic dispersion will occur in most systems [11].
The third type of dispersion found in fibers is called polarization mode dispersion
(PMD). The fundamental mode which travels in a single mode fiber has two
polarization components. Ideally these two states carry half of the total power each
and when the fiber is symmetric PMD is not an issue in the signal transmission [13].
PMD is caused when the fiber's cross section is not symmetric i.e. the refractive
indices along the fiber's x and y axes are not equal, which leads to the broadening of
the optical signal. This generally occurs during fiber-cabling and fiber-spicing
processes. In early installed fibers PMD was found to severely limit the propagation
distance at high bit rates [14]. Research into PMD continues as there exists a great
deal of installed standard fiber which has a comparatively large PMD value which is a
potential problem at high bit rates.
2.2.3 Optical ReceiversAn optical receiver or detector is an electro-optical device that accepts optical signals
and converts them into electrical signals. An ideal optical receiver in an optical
communications system will have high sensitivity, large bandwidth, low temperature
sensitivity, low power consumption and polarization independence. The most
common optical receivers found in fiber optic communication systems are positive-

10
intrinsic-negative (PIN) photodiodes and avalanche photodiode (APD) receivers. Both
are highly sensitive semiconductor devices that convert light pulses into electrical
signals [11].
2.2.3.1 PIN ReceiversA positive-intrinsic-negative PIN photodiode consists of a thick intrinsic (undoped)
depletion region sandwiched between positive and negative doped regions as shown
in Figure 2.3. The material of the p and n layers is chosen so that there is no
absorption of the incident photons in these layers. It is generally operated by applying
a reverse-bias voltage, typically less than a few volts. Most of the incident photons
will enter the thick intrinsic layer and produce electron-hole pairs which will generate
a photocurrent. This photocurrent is in direct proportion to the absorbed optical power
[15].
Figure 2.3: PIN photodetector[15]
A current known as dark current is still produced by the leakage current that flows
when the reverse bias is applied without any incident light on the photodiode. Dark
current is temperature dependent and will increase as the device temperature
increases. The PIN photodiode allows high bandwidths and responsivity to be
achieved simultaneously [16]. PIN photodiodes are the most commonly employed
receivers in fiber optic communication systems due to their ease in fabrication, high
reliability, low noise, low voltage and relatively high bandwidth.
2.2.3.2 Avalanche Photodiode ReceiversAn avalanche photodiode (APD) is a photodiode that internally amplifies the
photocurrent by an avalanche process thus making it a more sensitive receiver than a
PIN photodiode. The more sensitive the receiver is, the longer the communications
link can be with the given losses. The APD has a greater sensitivity by internally
11
amplifying the photocurrent without introducing the noise associated with external
electronic circuitry [11].
A reverse bias is applied to the active region which causes the electrons generated by
the incident photons to accelerate. The gain increases as the reverse bias voltage
increases to approach the breakdown voltage. However in the vicinity of the
breakdown voltage, a large current flows through the APD which can easily cause it
permanent damage. The high bias also increases the noise levels and limits the useful
gain of the APD [15].
An APD has higher gain and bandwidth than a PIN but it requires a much greater
voltage to be applied across the active region. This requirement for higher power
reduces the capability of miniaturization of a receiver unit and limits the possibilities
of integration in communication systems [11].
2.2.4 Optical ModulationTo transmit data across an optical fiber, the information must first be encoded, or
modulated, onto the laser signal. Analog techniques include amplitude modulation
(AM), frequency modulation (FM), and phase modulation (PM). Digital techniques
include amplitude shift keying (ASK), frequency shift keying (FSK), and phase shift
keying (PSK). Of all these techniques, binary ASK currently is the preferred method
of digital modulation because of its simplicity. In binary ASK, also known as on-off
keying (OOK), the signal is switched between two power levels. The lower power
level represents a 0 bit, while the higher power level represents a 1 bit.
In systems employing OOK, modulation of the signal can be achieved by simply
turning the laser on and off (direct modulation). In general, however, this can lead to
chirp, or variations in the laser's amplitude and frequency, when the laser is turned on.
A preferred approach for high bit rates is to have an external modulator that
modulates the light coming out of the laser. To this end, the Mach Zehnder
interferometer is widely utilized [3,17].

12
2.2.4.1 Electro-optic Modulation SystemThere are two primary methods for modulating light in telecommunication systems:
direct and external modulation. Direct modulation refers to the modulation of the
source, i.e.: turning a laser on and off to create pulses, while external modulation uses
a separate device to modulate the light. External modulation has become the dominant
method for high-speed long haul telecommunication systems. External modulators
can be implemented using a variety of materials and architectures [13].
2.2.4.2 Electro-Optic - Mach Zehnder Modulator (MZM)The electro-optic MZM has become a ubiquitous device for high speed optical
communication systems. It is customarily used as an intensity modulator for typical
systems making use of the non return-to-zero (NRZ) or return to zero (RZ)
modulation formats, and has recently demonstrated its potential for phase modulation
in future systems making use of the DPSK format. Such modulators are made from an
electro-optic crystal (typically lithium niobate, LiNbO3), who’s refractive index
depends on the electric field, hence voltage, which is applied to it. The electrical data
can thus modulate the refractive index of the crystal, hence the phase of the incoming
light wave. Incorporating the crystal into an interferometric structure (Mach-Zehnder
interferometer) in turn converts the phase modulation into intensity modulation [3,13].
Although the principle of such a modulator is fairly simple, its operation can present
many degrees of freedom and resulting trade-offs. One particular task will be to
establish relations between the extinction ratio (defined as the ratio of the power
transmitted into a binary `1´ and `0´) of the modulated optical signal and its frequency
chirping, depending on the chirp generation mechanism (optical or electrical
imbalance of the MZM) [11,13].
2.2.5 Optical AmplifiersAttenuation reduces the optical power of the signal as it travels through the fiber.
Thus optical amplifiers are greatly helpful in increasing the transmission distance
ability of a communication system while still enabling the signal to meet the
sensitivity requirements of the optical receiver. Optical amplifiers are categorized in
terms of its function as follows.
13
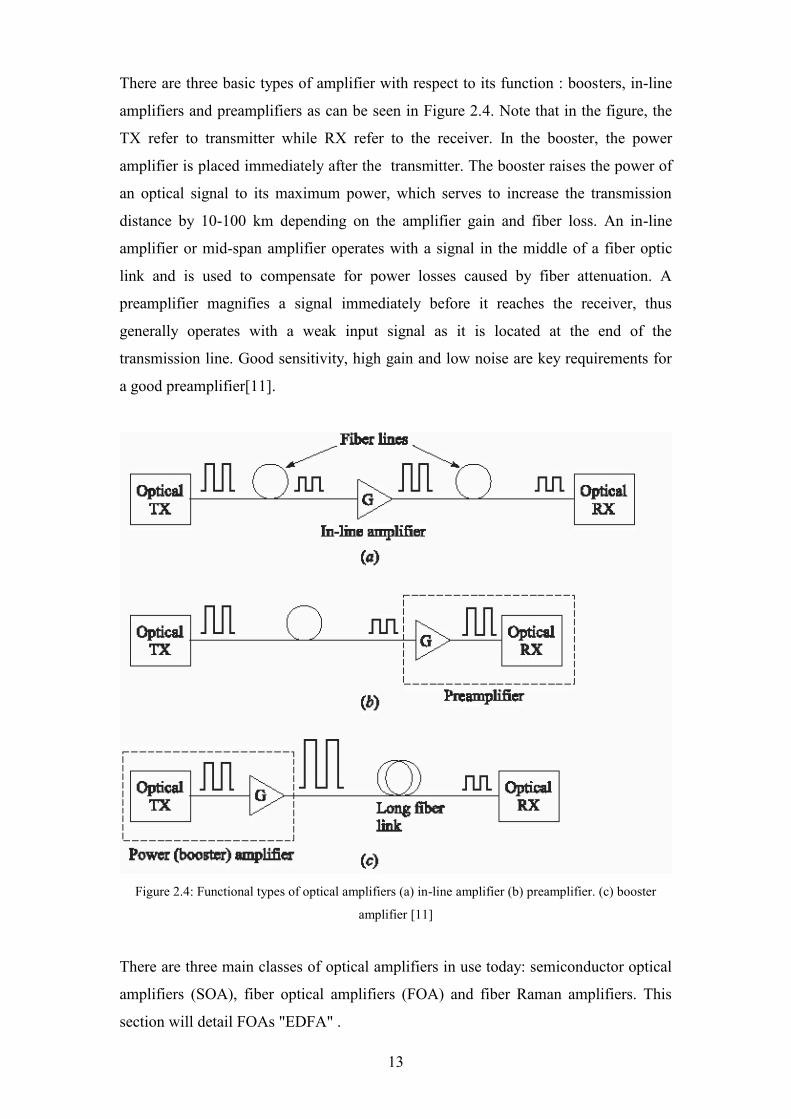
There are three basic types of amplifier with respect to its function : boosters, in-line
amplifiers and preamplifiers as can be seen in Figure 2.4. Note that in the figure, the
TX refer to transmitter while RX refer to the receiver. In the booster, the power
amplifier is placed immediately after the transmitter. The booster raises the power of
an optical signal to its maximum power, which serves to increase the transmission
distance by 10-100 km depending on the amplifier gain and fiber loss. An in-line
amplifier or mid-span amplifier operates with a signal in the middle of a fiber optic
link and is used to compensate for power losses caused by fiber attenuation. A
preamplifier magnifies a signal immediately before it reaches the receiver, thus
generally operates with a weak input signal as it is located at the end of the
transmission line. Good sensitivity, high gain and low noise are key requirements for
a good preamplifier[11].
Figure 2.4: Functional types of optical amplifiers (a) in-line amplifier (b) preamplifier. (c) booster
amplifier [11]
There are three main classes of optical amplifiers in use today: semiconductor optical
amplifiers (SOA), fiber optical amplifiers (FOA) and fiber Raman amplifiers. This
section will detail FOAs "EDFA" .

14
A fiber optical amplifier is a piece of specialty fiber spliced with a transmission fiber
and connected to a pump laser. Both these amplifier types work on the principle of
stimulated emission. Fiber amplifiers, specifically erbium-doped fiber amplifiers
(EDFAs), are widely used in telecommunication networks. EDFAs operate only in the
1550nm window while SOAs can function in either 1300nm or 1550nm
communications windows [11].
2.2.5.1 Erbium Doped Fiber Amplifiers (EDFA)EDFA is one of the most widely used optical amplifiers at 1550 nm [18]. EDFAs
contain a length of fiber working as an active region that is heavily doped with erbium
ions and is pumped optically at 980 nm, 1480 nm or both using a semiconductor laser
in the 10 to 100 milliwatt output range. The optical information and the optical
pumping beams are combined onto the same fiber by a coupler; they propagate
together along the doped section of the fiber where the information signal is amplified
at the expense of the pumping wavelength. A second coupler removes residual
pumping light from the fiber. An isolator is incorporated to prevent backwards
travelling amplified spontaneous emission (ASE) from penetrating the amplifier. The
gain saturation and gain recovery have a time characteristically in the millisecond
range. The data which is being amplified does not have any frequency components in
this range and therefore the signal is not distorted by amplification. Very high gains
(54dB) with low noise figures (3.1dB) have been achieved [19]. The greatest
drawback of the EDFA is its wavelength restriction. It is possible to tailor the fiber
length to achieve good performance in the L-band (1565-1625nm) [20] but
satisfactory performance has not been achieved in the O-band despite a great deal of
research [21].
2.3 Passive Optical Networks (PON)A PON is a network which by its nature provides a variety of broadband services to
users through optical fiber access. PON allows removing all active components
between the server and client introducing in place optical passive components to
guide the traffic throughout the network. Its principal element is the optical splitter.
Passive Optical Networking is a point-to-multipoint optical network architecture. As
can be seen in Figure 2.5. Moving from the network to the user, it can say that PON
architecture consists of the following equipment: an OLT at the service provider’s

15
central office and a number of ONUs or Optical Network Terminals (ONTs) close to
end users.
Figure 2.5: Passive Optical Networking Diagram[22].
2.3.1 Generic operation of a PONAs has been described in the previous section in general terms, a passive optical
network always works under transmission between the OLT and the different ONU’s
through optical splitters, which multiplex or demultiplex signals based on their origin
and destination. Therefore, they appear three distinct devices in the network: the OLT,
the ONU and the splitter, each of which has a necessary and priority function on the
passive optical network. Below are detailed the function and general characteristics
each of them.
2.3.2 Optical Line Terminal (OLT)The OLT is located in a central office and controls the bidirectional flow of
information across the ODN. An OLT must be able to support transmission distances
across the ODN of up to 20 km (currently could be more with EDFA). In the
downstream direction the function of an OLT is to take in voice, data, and video
traffic from a long-haul network and broadcast it to all the ONU modules on the
ODN. In the reverse direction (upstream), OLT accepts and distributes all the traffic
from the network users [23]. Simultaneous transmission of separate service types on
the same fiber in the ODN is enabled by using different wavelengths for each
direction. For downstream transmissions, a PON uses a 1490 nm wavelength for

16
combined voice and data traffic and a 1550 nm wavelength for video distribution.
Upstream voice and data traffic use a 1310 nm wavelength [24]. An optical power
measurement at the OLT is also required to ensure that sufficient power is delivered
to the ONUs. This should be done during the initial activation because it cannot be
repeated without interrupting service for the entire network once the network has been
connected. Finally, note that the OLT does not emit the same light output at all ONU
fairly, but depends on the distance they are from the plant. Therefore, a user close to
the central need less power, while a remote user will need a higher power.
2.3.3 Optical Network Unit (ONU)ONU is placed as the subscriber neighborhood for terminating the optical fiber
transmission and converting the signals to electrical ones over metallic line to
subscribers [22]. The signals will be adapted to user traffic through Network Terminal
(NT). At the high performance end, an ONU can aggregate, groom, and transport
various types of information traffic coming from the user site and send it upstream
over a single-fiber PON infrastructure. The term grooming means that the switching
equipment looks inside a time-division-multiplexed data stream, identifies the
destinations of the individual multiplexed channels, and then reorganizes the channels
so that they can be delivered efficiently to their destinations [23].
2.3.4 SplitterSplitters are passive power dividers that allow communication between the OLT and
their respective ONT who serve. However, not only are dedicated to multiplex or
demultiplex signals, but also combine power: they are bidirectional optical
distribution devices with one input and multiple outputs:
The signal which enters from input port (downlink), it proceeds from the OLT
and it is divided among multiple output ports.
The signals which enter from the exits (uplink), they come from ONU and
they are combined at the entrance.
without extern power, lowering their cost of deployment, operation and maintenance.
They just introduce optical power loss on communication signals, which are inherent
in nature [23].

17
2.3.5 Description of operation of Passive Optical NetworkOnce detailed all the elements that build a PON, it is necessary to know how the
global system works and the behavior of the network with all the interconnected
elements, from the head OLT towards ONU users, and vice versa. The most important
thing to note in the generic operation of the network is the existence of two channels,
one ascending and one descending. However, both generally work through the same
physical cable, so different wavelengths are assigned to each transmission channel
and, depending on traffic, coexisting in the same fiber at least 3 different wavelengths:
one for video flow in the upstream channel, and two for data flow of uplink and
downlink respectively [25]. Below is going to be analyzed in more detail both
transmission channels:
2.3.5.1 Downstream channelThe downstream channel is the direction of information from the OLT operator to the
ONU located on the end user. In this network, the PON behaves like a point
multipoint network. The OLT includes plenty of added voice and data frames that go
towards PON, through the packet optical line terminal (POLT) and the video optical
line terminal (VOLT). Frames collected by these teams are transformed to signals
which inject in the different branches of the users. These branches are formed by one
or two fibers that carry signals bi or unidirectional, and are passively coupled by
optical splitters that allow the union of all the ONT in the network, without
intermediate regeneration of signals (avoiding active elements) [23].
2.3.5.2 Upstream channelThe upstream channel is the direction of information from the ONU end user to the
OLT operator. In this network, the PON behaves like a point to point. Each ONU
includes the added frames of voice and data (from each user) that are directed toward
the OLT. At this point, the ONU performs the same operation as the OLT in the
downstream channel, i.e., turn the frames into injecting signals through optical fiber
that have been dedicated to the user [23].
2.3.6 GPONThe search for compatibility between equipment from different manufacturers has led
to the creation of PON standards. Two standardization bodies have been active in the

18
access area. On the one hand, the International Telecommunication Union (ITU) with
help of the Full Service Access Network (FSAN) group has created BPON
(Broadband PON) and GPON (Gigabit PON) standards. On the other hand, the
Institute of Electrical and Electronics Engineers (IEEE) and particularly the Ethernet
in the First Mile (EFM) group is responsible for EPON (Ethernet PON) standards
[21]. GPON is the more advanced standard on which is still working, it is who is born
from the evolution of the BPON. All the previous standards are considered in the
improvements that GPON offers. Thus, GPON works well with changes in
communication technologies. In general, the improvements include increasing the
bandwidth in transmission and providing security to the own network by protocol
level. The Gigabit PON standard is defined in the G.984.1 recommendation (2003)
[24]. The International telecommunication union’s telecommunication standardization
sector (ITU-T) standardized G.984 or Gigabit-capable PON (GPON) in 2003 with
revisions in 2008. GPON systems are formed by an OLT and multiple ONUs or
ONTs interconnecting with an ODN. Thus, there is a one-to-many relationship
between the OLT and the ONU/ONTs respectively [24]. GPON supports several bit
rates in both channels such as asymmetric or symmetric combinations, from 155 Mb/s
to 2.5 Gb/s. Time division multiplexing (TDM) is used downstream and time division
multiple access (TDMA) is implemented upstream as can be seen in figure 2.6. Its
maximum physical coverage is up to 20km and its logical reach can be up to 60km.
There is a trade off between the PON length and its splitting capability, with a
maximum of 128 ONUs per OLT, however a split ratio of 32 is common today [23].
Figure 2.5: GPON Architecture [1]

19
2.3.8 Why GPONGPON is the fastest commercially available member of the PON family of
technologies, which also includes Broadband PON (BPON) and Ethernet PON
(EPON). GPON and EPON were the two competing systems in the beginning of 2009
due to the fact that GPON and EPON offered more bandwidth per subscriber than
BPON. EPON has mostly thrived in Eastern Asia countries such as China, Korea and
Japan, whereas GPON has succeeded very well in the North America. GPON is a
more advanced system than EPON from the technological parameters point of view. It
provides higher bandwidth efficiency and higher splitting ratio but generally costs
more than EPON. The cost per EPON ONU link was about 78 % compared to that of
GPON [24].
GPON had a technical market advantage in that its transmission convergence layer
natively accommodated not only encapsulation of native Ethernet frames, but also of
Asynchronous Transfer Mode (ATM) cells and TDM services. This capability made it
an ideal choice for carriers wishing to deliver simultaneous voice and data services to
their customers.

20
3 Radio Over Fiber
3.1 IntroductionThe proposed promising cost effective solution to meet ever increasing user
bandwidth and wireless demand is the Wireless networks based on RoF technologies.
Since it was first demonstrated for cordless or mobile telephone service in 1990, many
research has been carried out to consider its limitation and develop new and high
performance RoF technologies [26]. In this network a CS is connected to numerous
functionally simple BS via an optic fiber. The main function of BS is to convert
optical signal to wireless one and vice versa. Almost all processing including
modulation, demodulation, coding, routing is performed at the CS. This means that,
RoF networks use highly linear optic fiber links to distribute RF signals between CS
and BS
At minimum, RoF architecture link consists of all the hardware required to impose an
RF signal on an optical carrier, the fiber-optic link, and the hardware required to
recover the RF signal from the carrier. The general RoF architecture is shown in
figure 3.1. Note that the optical carrier's wavelength is usually selected to coincide
with either the 1.3 nm window, at which standard single-mode fiber has minimum
dispersion, or the 1.55 nm window, at which its attenuation is minimum [13].
As the requirement of high data rate can not be satisfied by decreasing cell size or by
allocating more bandwidth because both these methods lead to increased complexity
of base station, RoF networks come into picture. RoF technology has emerged as a
cost effective technique for decreasing radio system costs because it simplifies the
remote antenna sites and enhances the sharing of expensive radio equipment located
at appropriately sited Switching Centers (SC) or otherwise known as Central
Sites/Stations (CS) [13].

21
Figure 3.1: General RoF Architecture [13]
3.2 RoF link configurationsThere are several approaches for transporting radio signals over optical fiber in RoF
systems, which is classified based on the kinds of frequency bands (RF bands,
Intermediate Frequency IF, baseband (BB)) transmitted over an optical fiber link. The
three fundamental techniques as shown in Figure 3.2 [13].
a) In baseband-RoF, a message data signal is used to modulate the light wave to
transfer through the optical link. In other word, the message signal is the modulating
signal and the light wave is the carrier signal [13].
b) In RF-RoF, a Radio Frequency signal with a high frequency is modulated with an
optical light wave signal before being transported over the optical link. Therefore,
wireless signals (RF signal) are optically distributed to base stations directly at high
frequencies and there is no need to any up/ down conversions, thereby a less cost
system is obtained [27].
c) In IF-RoF, an Intermediate Frequency radio signal with a lower frequency is used
for modulating light before being transported over the optical link. Therefore, wireless
signals are transported at intermediate frequency over the optical [27].
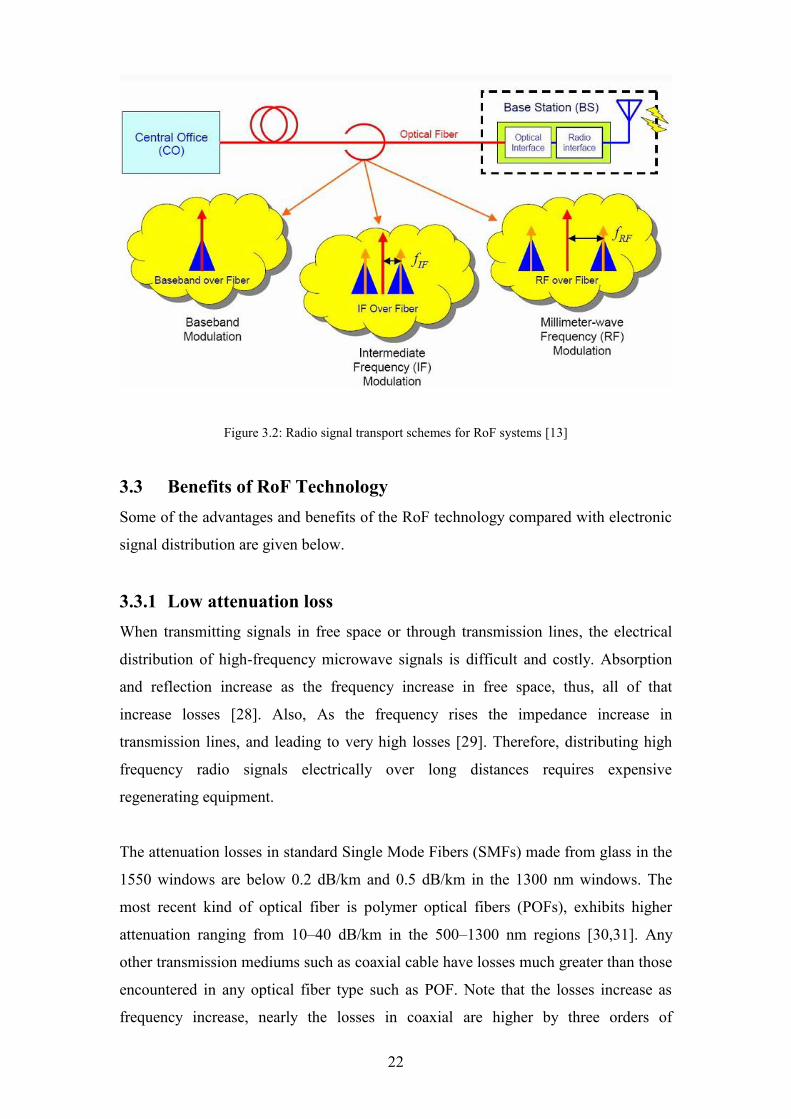
22
Figure 3.2: Radio signal transport schemes for RoF systems [13]
3.3 Benefits of RoF TechnologySome of the advantages and benefits of the RoF technology compared with electronic
signal distribution are given below.
3.3.1 Low attenuation lossWhen transmitting signals in free space or through transmission lines, the electrical
distribution of high-frequency microwave signals is difficult and costly. Absorption
and reflection increase as the frequency increase in free space, thus, all of that
increase losses [28]. Also, As the frequency rises the impedance increase in
transmission lines, and leading to very high losses [29]. Therefore, distributing high
frequency radio signals electrically over long distances requires expensive
regenerating equipment.
The attenuation losses in standard Single Mode Fibers (SMFs) made from glass in the
1550 windows are below 0.2 dB/km and 0.5 dB/km in the 1300 nm windows. The
most recent kind of optical fiber is polymer optical fibers (POFs), exhibits higher
attenuation ranging from 10–40 dB/km in the 500–1300 nm regions [30,31]. Any
other transmission mediums such as coaxial cable have losses much greater than those
encountered in any optical fiber type such as POF. Note that the losses increase as
frequency increase, nearly the losses in coaxial are higher by three orders of

23
magnitude at higher frequencies. For instance, the attenuation of a half inch diameter
coaxial cable (RG-214) is >500 dB/km for frequencies above 5 GHz [32]. Therefore,
by transmitting microwaves in the optical form, transmission distances are increased
several folds and the required transmission powers reduced greatly.
3.3.2 Large BandwidthOne of the most important Benefit of Optical fibers is the huge bandwidth. In SMF,
the total BW of the three transmission windows proposed low attenuation (850 nm,
1310 nm, and 1550 nm) is nearly 50 THz [33]. Just only a fraction of this capacity
(1.6 THz) the today’s commercial systems can utilized. The developments to exploit
more optical capacity per single fiber are still continuing. The main driving factors
towards the ability of utilize more bandwidth out of the optical fiber including the
availability of low dispersion (or dispersion shifted) fiber, the Erbium Doped Fiber
Amplifier (EDFA) for the 1550 nm window, and the use of advanced multiplex
techniques namely Optical Time Division Multiplexing (OTDM) in combination with
Dense Wavelength Division Multiplex (DWDM) techniques [34].
3.3.3 Immunity to Radio Frequency InterferenceImmunity to electromagnetic Interference (EMI) is a very attractive property of
optical fiber communications Especially for microwave transmission. This is so
because signals are transmitted in the form of light through the fiber. Even for short
connections, fiber cables are preferred at high frequencies because of this immunity
[34].
.
3.3.4 Dynamic Resource AllocationIn RoF, The switching, modulation, and other RF functions are performed at a
centralized headend, so it is possible to allocate capacity dynamically. For instance
in a RoF distribution system for Global system mobile (GSM) traffic [34].
Some area such as shopping mall can allocate more capacity during peak times and
then re-allocated to other areas such as populated residential areas in the evenings.
when offpeak. This can be achieved by allocating optical wavelengths through
wavelength division multiplexing (WDM) as need arises [3] .

24
3.3.5 Lower CostMost RoF techniques eliminate the need for a local oscillator and related equipment at
the remote station (RS). Simpler structure of remote base station means lower cost of
infrastructure, lower power consumption by devices and simpler maintenance, all of
these contribute to lower the overall installation and maintenance cost [34] .
3.4 Applications of RoF TechnologySince RoF technology was first demonstrated for cordless or mobile telephone service
in 1990, a lot of research efforts have been made to investigate its limitation and
develop new, high performance RoF technologies [26]. Some of the applications of
RoF technology include satellite communications, Cellular Networks, vehicle
communications and control, and wireless LANs over optical networks. The main
application areas are briefly discussed below.
3.4.1 Cellular NetworksOne of the most important application area of RoF is the Mobile networks. The
increasing demand for broadband services coupled with the continuous increasing in
the number of mobile subscribers have made continuous pressure on mobile networks
to offer increased capacity. Therefore, mobile traffic can be relayed cost effectively
between the SCs and the BSs by exploiting the benefits of SMF technology. Other
RoF functionalities such as dynamic capacity allocation offer significant operational
benefits to cellular networks [34].
3.4.2 Satellite CommunicationsOne of the first practical uses of RoF technology was the Satellite communications.
One of the applications involves the remoting of antennas to suitable locations at
satellite earth stations. At this, small optical fiber links of less than 1km and operating
at frequencies between 1GHz and 15GHz are used. The second application involves
the remoting of earth stations themselves. With the use of RoF technology the
antennae need not be within the control area (e.g. Switching Center). They can be
sited many kilometers away for the purpose of, for instance improved satellite
visibility or reduction in interference from other terrestrial systems. Switching
equipment may also be appropriately sited, for say environmental or accessibility
reasons or reasons [34].

25
3.4.3 Wireless LANsPortable devices and computers become more and more powerful as well as
widespread. Thus, the demand for mobile broadband access to LANs will be on the
increase. This will lead to higher carrier frequencies in the bid to meet the demand for
capacity. For instance current wireless LANs operate at the 2.4 GHz ISM bands and
offer the maximum capacity of 11 Mbps per carrier (IEEE 802.11b). The broadband
wireless LANs are offered up to 54 Mbps per carrier, and will require higher carrier
frequencies in the 5 GHz band (IEEE802.11a/D7.0) [35]. Higher carrier frequencies
in turn lead to micro- and Pico-cells, and all the difficulties associated with coverage
arise. A cost effective way around this problem is to deploy RoF technology.
3.4.4 Vehicle Communication and ControlThe vehicle control is considered as potential application area of RoF technology.
Frequencies between 63-64 GHz and 76-77 GHz have already been allocated for this
service within Europe. The objective is to provide continuous mobile communication
coverage on major roads for the purpose of intelligent transport systems (ITS) such as
road-to-vehicle communication (RVC) and inter-vehicle communication (IVC). ITS
systems aim to provide traffic information, improve transportation efficiency, reduce
burden on drivers, and contribute to the improvement of the environment [13]. In
order to achieve the required (extended) coverage of the road network, numerous base
stations are required. These can be made simple and of low cost by feeding them
through RoF systems, thereby making the complete system cost effective and
manageable [34].
3.5 Digital ModulationModulation refers to the representation of digital information in terms of analog
waveforms that can be transmitted over physical channels. Typically the objective of a
digital communication system is to transport digital data between two or more nodes.
In radio communications this is usually achieved by adjusting a physical characteristic
of a sinusoidal carrier, either the frequency, phase, amplitude or a combination
thereof. This is performed in real systems with a modulator at the transmitting end to
impose the physical change to the carrier and a demodulator at the receiving end to
detect the resultant modulation on reception [36].
26
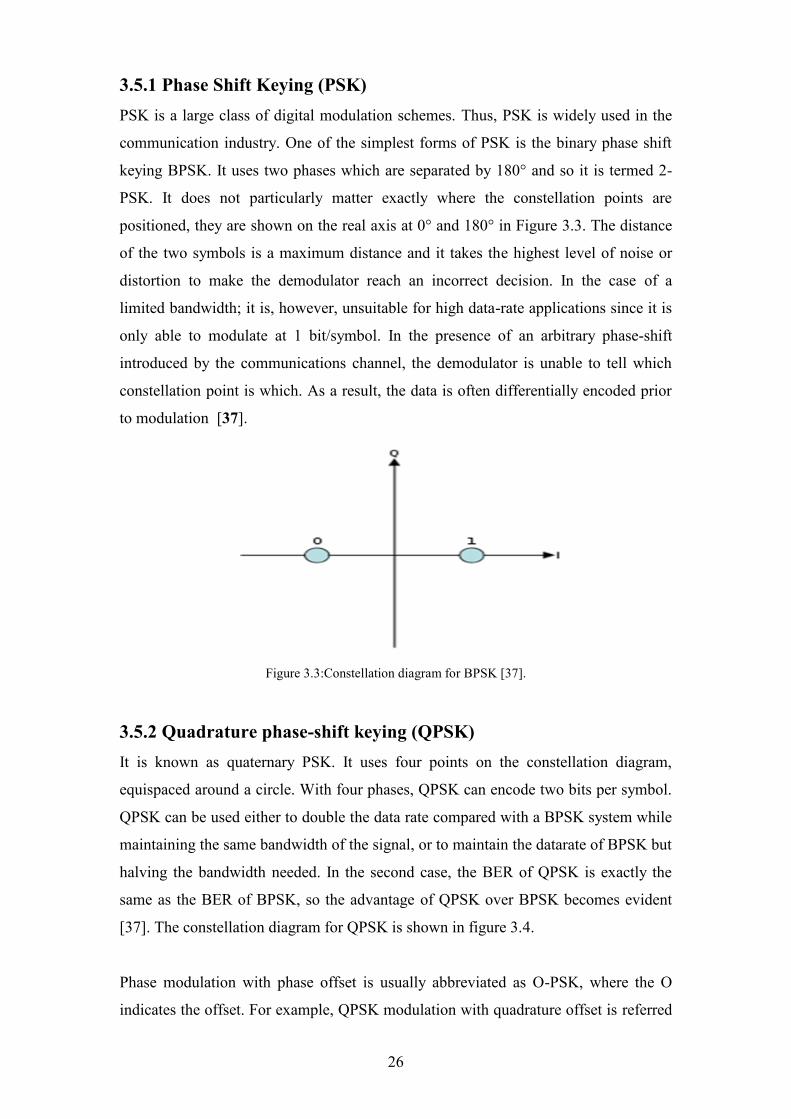
3.5.1 Phase Shift Keying (PSK)PSK is a large class of digital modulation schemes. Thus, PSK is widely used in the
communication industry. One of the simplest forms of PSK is the binary phase shift
keying BPSK. It uses two phases which are separated by 180° and so it is termed 2-
PSK. It does not particularly matter exactly where the constellation points are
positioned, they are shown on the real axis at 0° and 180° in Figure 3.3. The distance
of the two symbols is a maximum distance and it takes the highest level of noise or
distortion to make the demodulator reach an incorrect decision. In the case of a
limited bandwidth; it is, however, unsuitable for high data-rate applications since it is
only able to modulate at 1 bit/symbol. In the presence of an arbitrary phase-shift
introduced by the communications channel, the demodulator is unable to tell which
constellation point is which. As a result, the data is often differentially encoded prior
to modulation [37].
Figure 3.3:Constellation diagram for BPSK [37].
3.5.2 Quadrature phase-shift keying (QPSK)It is known as quaternary PSK. It uses four points on the constellation diagram,
equispaced around a circle. With four phases, QPSK can encode two bits per symbol.
QPSK can be used either to double the data rate compared with a BPSK system while
maintaining the same bandwidth of the signal, or to maintain the datarate of BPSK but
halving the bandwidth needed. In the second case, the BER of QPSK is exactly the
same as the BER of BPSK, so the advantage of QPSK over BPSK becomes evident
[37]. The constellation diagram for QPSK is shown in figure 3.4.
Phase modulation with phase offset is usually abbreviated as O-PSK, where the O
indicates the offset. For example, QPSK modulation with quadrature offset is referred

27
to as OQPSK. OQPSK has the same spectral properties as QPSK for linear
amplification, but has higher spectral efficiency under nonlinear amplification, since
the maximum phase transition of the signal is 90 degrees, corresponding to the
maximum phase transition in either the in-phase or quadrature branch, but not both
simultaneously [38].
Figure 3.4: Constellation diagram for QPSK [38]
.
3.5.3 Differential Phase shift keying (DPSK)DPSK modulation uses standard PSK constellations, but encodes the information in
the phase transitions between successive symbols rather than in the absolute phase of
one symbol. This allows recovery of the information even when there is no absolute
phase reference. In non differential or coherent modulation, an estimate of the channel
phase and attenuation is recovered. It is then possible to reproduce the transmitted
signal, and demodulate. It is necessary to have an accurate version of the carrier,
otherwise errors are introduced. The transmitter in differential modulate each symbol
in relative to the previous symbol, for DPSK: 0 = no change and 1 = +180o. In the
receiver, the current symbol is demodulated using the previous symbol as a reference.
The previous symbol acts as an estimate of the channel [37].
Differential reception is theoretical 3dB poorer than coherent. This is because the
differential system has two sources of error: a corrupted symbol, and a corrupted
reference (the previous symbol). Non-coherent reception is often easier to implement
[36].
28
4. Design of the RoF Employed
GPON Architecture
4.1 IntroductionThis section will describe the design of RoF employed GPON Architecture. The
methods of simulation and its parameter will be shown and described. The purpose is
to show the behavior of links of optical fiber when the signal goes through all the
elements such as optical fiber, splitters, and the goal is to find a good quality of signal
in all receivers. The final goal pursued with this thesis is to evaluate the performance
of the whole system.
The parameters used to evaluate this behavior will be the BER, Q factor and eye
diagram. The first condition used to assess the performance of the link is generally
BER at the receiver. Simulations are done trying to approach at the receiver a
minimum BER. The minimum BER accepted to the GPON is 10-10 [39]. The second
condition corresponds to the Q factor which may be necessary in the case of difficult
measurements of BER in high performance transmission link. System Q factor adopts
the concept of S/N ratio in a digital signal. The minimum value of Q that will enable
an error-free system is 6. Usually much higher values of Q would be expected of a
practical system [40]. The third condition corresponds to the eye diagram. Viewing
this diagram it can describe the quality of the received signal. In the presence of ISI,
when the pulse does not satisfy the Nyquist criterion, the diagram will tend to close
vertically. For error-free transmission in the absence of noise, the eye must be kept
some vertical opening, or otherwise it will exist interference between symbols that
will cause errors. When the eye is not fully closed, the interference between symbols
reduces the value of allowable additive noise. Therefore, the higher vertical opening
the greater immunity to noise.
The following sections will describe the design, of RoF Employed GPN Architecture.
Firstly, the system of RoF employed GPON architecture will be modeled including
the behavior of the system blocks such as transmitter and receiver in downstream and

29
upstream channel. Secondly, the system will be tested for PSK, DPSK and OQPSK
modulation respectively with fiber length of 20km. Finally the performance of the
system for different modulation schemes and fiber lengths will be evaluated, then a
comparison will be introduced.
4.2 System Model of Bidirectional Transmission for RoF employed
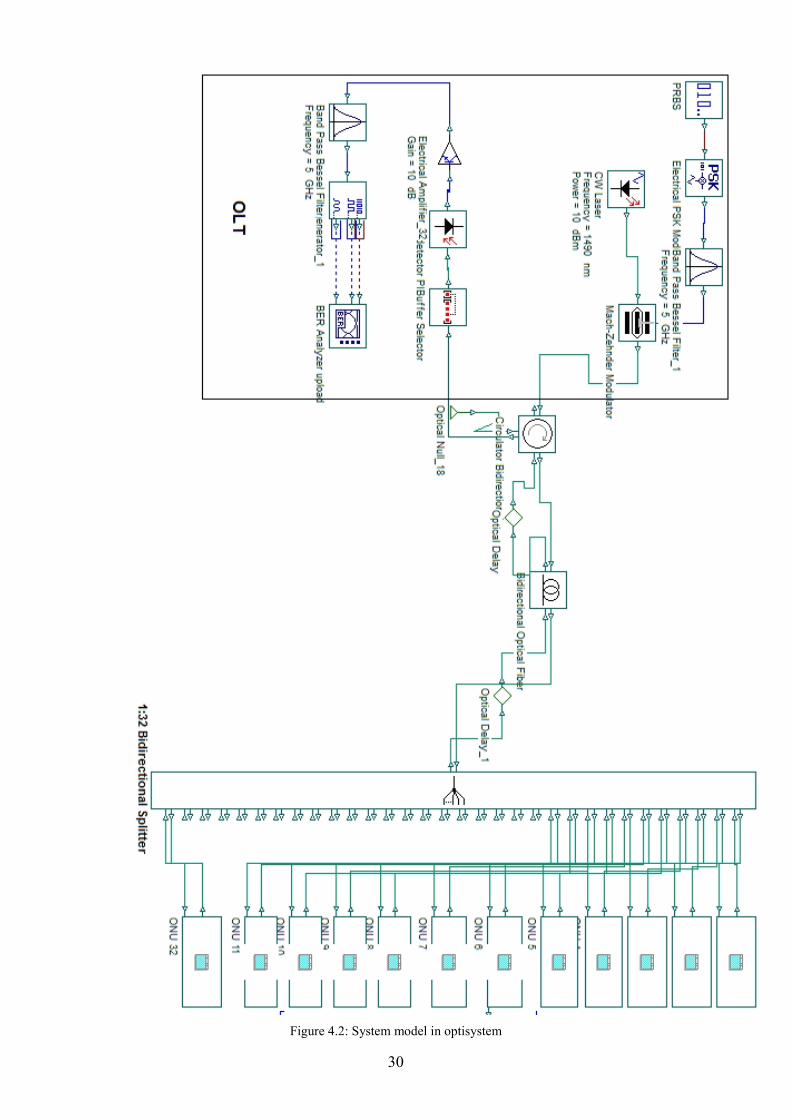
GPON ArchitectureThis section briefly describes the simulation setup in OptiSystem where all necessary
parameters are based on the GPON standardized properties. The proposed RoF
employed GPON system model is shown in figure 4.1 while figure 4.2 show the
optisystem implementation of the system.
Figure 4.1: Schematic of a bidirectional RoF system
1:32
Bid
irec
tiona
lSp
litte
r
30
Figure 4.2: System model in optisystem
31
The design in figure 4.1 shows the development of the bidirectional transmission for
RoF employed GPON architecture. One transmitter and one receiver are used at OLT
and distributed to the 32 ONUs. Bidirectional fiber is used with length up to 60 km.
A bidirectional 1:32 passive optical splitter is used to connect the ONU's to the
backbone fiber. Finally, the upstream and downstream signal separated by the optical
circulator and optical delay introduced at the fiber to ensure the correct timing of
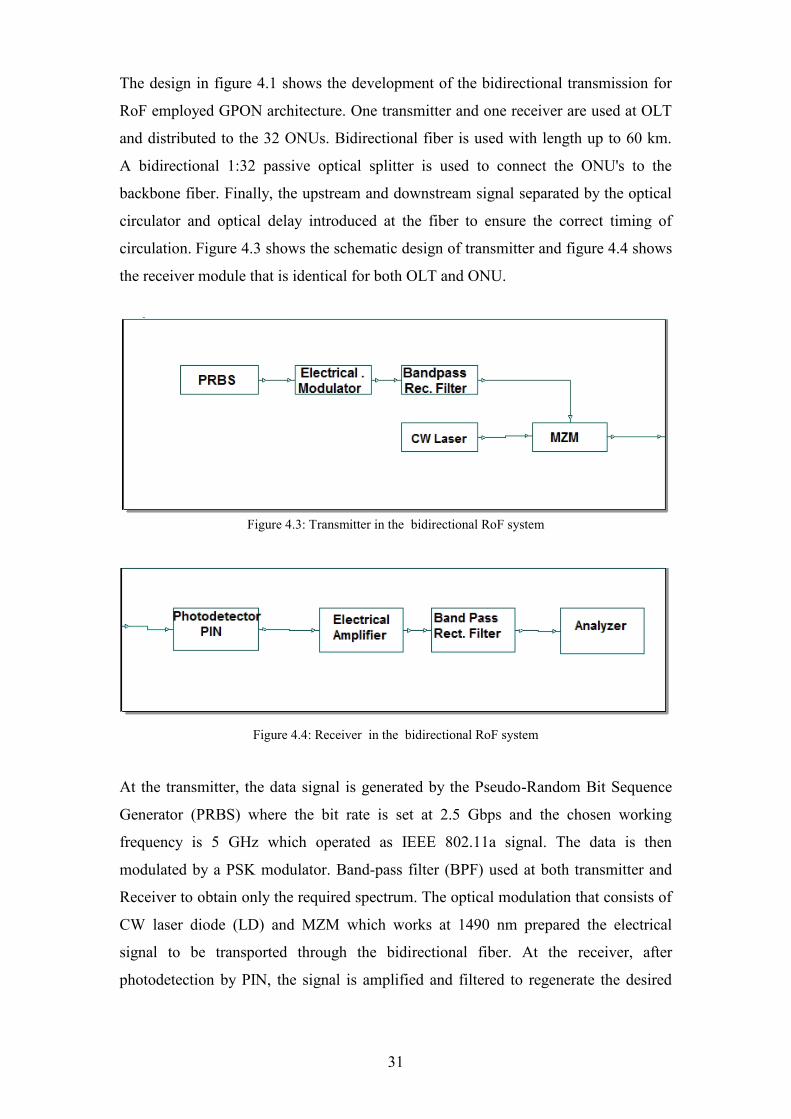
circulation. Figure 4.3 shows the schematic design of transmitter and figure 4.4 shows
the receiver module that is identical for both OLT and ONU.
Figure 4.3: Transmitter in the bidirectional RoF system
Figure 4.4: Receiver in the bidirectional RoF system
At the transmitter, the data signal is generated by the Pseudo-Random Bit Sequence
Generator (PRBS) where the bit rate is set at 2.5 Gbps and the chosen working
frequency is 5 GHz which operated as IEEE 802.11a signal. The data is then
modulated by a PSK modulator. Band-pass filter (BPF) used at both transmitter and
Receiver to obtain only the required spectrum. The optical modulation that consists of
CW laser diode (LD) and MZM which works at 1490 nm prepared the electrical
signal to be transported through the bidirectional fiber. At the receiver, after
photodetection by PIN, the signal is amplified and filtered to regenerate the desired

32
signal. The signal then fed into the spectrum and BER analyzers for data analysis. The
main components used in the system are as follows:
Pseudo Random Binary Sequence (PRBS): Generates bits stream a according to
different operation modes. The bit sequence is designed to approximate the
characteristics of random data.
Mach-Zehnder Modulator (MZM): Modulators are the devices used to modulate
the beam of light according to the modulating signal which is the electrical signal that
will be carried over the light.
Positive-Intrinsic-Negative photodetector (PIN-PD): It is used to convert the
optical signal to electrical signal.
Bidirectional single mode fiber (SMF): The cable simulates the bidirectional
propagation of arbitrary configuration of optical signals in a single-mode fiber.
bidirectional Splitter 1x32 : This device splits evenly the signal input power to 32
output ports in the downstream and act as a combiner in the upstream to combine 32
input to one output.
Continuous Wave Laser (CW laser): it is used to convert electrical signal to optical
signal and it generates CW optical signal.
Phase Shift Keying (PSK): Encodes and modulates a binary signal to an electrical
signal using phase shift keying modulation (PSK).
Differential Phase Shift Keying (DPSK): Encodes and modulates a binary signal to
an electrical signal using differential phase shift keying modulation (DPSK).
Offset Quadrature Phase Shift Keying (OQPSK): Encodes and modulates a binary
signal to an electrical signal using offset quadrature phase shift keying modulation
(OQPSK).
4.2.1 Downstream linkIn downstream, the optical signal will direct from the OLT to the end users at ONU's.
The signal will travel from the transmitter at the OLT to the receiver in the ONU at
1490 nm pass through bidirectional SMF and a splitter. The system composed of a
transmitter in OLT, Bidirectional SMF, splitter and 32 receivers at the ONU's, one
receiver for each ONU.

33
4.2.1.1 TransmitterThe transmitter in the downlink is shown in figure 4.3. The data signal is generated by
the PRBS where the bit rate is set at 2.5 Gbps and the chosen working frequency is 5
GHz which operated as IEEE 802.11a signal. The data is then modulated by a PSK
modulator. BPF used to obtain only the required spectrum. The PSK modulated signal
is illustrated in Figure 4.5 the central frequency of the signal is 5 GHz with 3.75 GHz
major bandwidth from 3.125 GHz to 6.875 GHz in two sidebands. The optical
modulation that consists of LD and MZM which works at 1490 nm prepared the
electrical signal to be transported through the bidirectional fiber. The MZM has three
ports: the first port is for electrical modulation type, the second is the CW laser input
and the third port is the outlet of output optical signal. The extinction ratio is set to 30
dB to characterize the division power ratio of the upper path to lower path. The
modulation at the MZM can be seen in Figure 4.6. It is clear that the output optical
signal is symmetry about 1490 nm The hardware configurations of the transmitter side
are summarized in Table 4.1. The output power is measured by using the optical
power meter after MZM P= 6.9 dBm.
Figure 4.5: PSK Modulated signal

34
Table 4.1 Hardware configurations of the transmitter in Downstream
Quantity Value
Pseudo Random Bit Sequence
(PRBS) Generator
2.5 Gbps
Laser Diode
Frequency = 1490 nm
Power = 10 dBm
Line width = 10 MHz
Initial phase = 0 deg
Phase Shift Keying (PSK) Modulator Frequency = 5 GHz
Amplitude = 1 a.u.
Phase offset = 45 deg
Bias = 0 a.u.
Mach-Zehnder Modulator Extinction ratio = 30 dB
Rectangle band-pass filter Frequency = 5 GHz
Band width = 3.75 GHz
Figure 4.6: modulation at the MZM
4.2.1.2 Circulatorthe upstream and downstream signal separated by the optical circulator and optical
delay introduced at the fiber to ensure the correct timing of circulation. Optical
35
circulator has insertion losses of 0 dB and return losses of 65 dB. So the power after
the circulator has no change P=6.9 dBm .
4.2.1.3 FiberA bidirectional SMF is used to forward the signal and to backward it with an optical
delay of 1 unit in order to separate the upstream and downstream. Table 4.2 shows the
main parameters of a bidirectional optical fiber. The fiber cable has an attenuation
loss of 0.2 dB/km and varied length from 10 km to 60 km, this means there is a 0.2
dB/km*10 km "suppose fiber length = 10 km" which equal to 2 dBm power loss, so
that the resultant signal power is equal to 6.9 dBm -2 dBm = 4.9 dBm ( Theoretical
Analysis). On other hand, the measured signal power after travelling through the
optical fiber cable is equal to 4.9 dBm, so that there is a matching between theoretical
analysis and simulated measurements.
Table 4.2 Hardware configurations of the fiber
4.2.1.4 SplitterPassive splitters are used that enables single feeding fiber from the provider’s central
office to serve multiple homes and small business. the optical signals are transmitted
to the optical splitter. The optical splitter splits the signal into required number of
signal streams to transmit it to customer premises. Theoretically, the splits can be up
to 64 but due to the current hardware limitations, the development so far can only
reach 32. Thus, a bidirectional 1:32 passive optical splitter is used to connect the
ONUs to the backbone fiber. The splitter has the following properties listed in table
4.3. The measured and calculated value of signal power enter the splitter equal to 4.9
dBm = 3.091x10⁻³Watt. The splitter will split the incoming power to 32 equal signal.
Thus, the theoretical output power will be 3.091x10⁻³/32 =96.59x10⁻⁶ Watt. The signal
Quantity Value
Reference wavelength 1490 nm
Attenuation 0.2 dB /km
Dispersion 16.75 ps nm-1 km-1
Length 10, 20 , 40 ,60 Km
Dispersion slope 0.075 ps/nm2/km

36
power after the splitter is P=-10.15 dBm =96.59x10⁻⁶ Watt. So that there is a
matching between theoretical analysis and simulated measurements.
Table 4.3 Hardware configurations of the Splitter
Quantity Value
Splitter bidirectional 1x32
Insertion loss 0 dB
Return loss 65 dB
4.2.1.5 ReceiverThe Receiver in the downstream is shown in figure 4.3. The optical signal is
received by photodetector PD operating at 1490 nm frequency to convert it back to
electrical form, the received signal after photo detection is illustrated in Figure 4.7. It
is clear that the central frequency of the signal is about 5 GHz; also it is clear that
there is a power loss and signal distortion due to conversion process in spite of using
sampling rate in PD five times of the main sampling rate, the signal power decreases
to -39.29 dBm. To recover the message signal; a BPF is used with central frequency
of 5 GHz and 3.75 GHz bandwidth. These hardware configurations are summarized
in Table 4.4.
Figure 4.7: The electrical signal after PIN.

37
The resultant signal power after the BPF and electrical amplification is about -34.76
dBm, the power losses in BPF is due to the signal cutting. After receiving and filtering
the signal, 3R regenerator is used and connected directly to the BER Analyzer. 3R
regenerator has three outputs; the first output port is the bit sequence, the second one
is a reference signal and the last one is the output signal. These three signals can be
connected directly to the BER Analyzer, avoiding additional connections between
transmitter and the receiver stage.
Table 4.4 Hardware configurations of the Receiver
Quantity Value
Photodetector
type PIN
responsivity = 3 AW
Dark current = 10 nA
Filter
type : Band pass rectangle filter
frequency = 5 GHz
insertion loss = 0 dB
Depth = 100 dB
Electrical amplifier gain = 10 dB
4.2.2 UpstreamIn upstream, the optical signal will direct from the end users "ONU's" to the OLT. The
signal will travel from the transmitter at the ONU to the receiver in the OLT at 1330
nm pass through a splitter and bidirectional fiber. As in the down stream the system
composed of 32 transmitter "one transmitter for each ONU " , splitter , Bidirectional
Fiber and a receiver at the OLT.
4.2.2.1 TransmitterThe transmitter in the uplink shown in figure 4.2 . As in the downstream, the data
signal is generated by the PRBS where the bit rate is set at 2.5 Gbps and the chosen
working frequency is 5 GHz. The data is then modulated by a PSK modulator. BPF
used to obtain only the required spectrum. The PSK modulated signal is illustrated in
figure 4.5 the central frequency of the signal is 5 GHz with 3.75 GHz major
bandwidth from 3.125 GHz to 6.875 GHz in two sidebands. The optical modulation
that consists of LD and MZM which work at 1330 nm prepared the electrical signal to
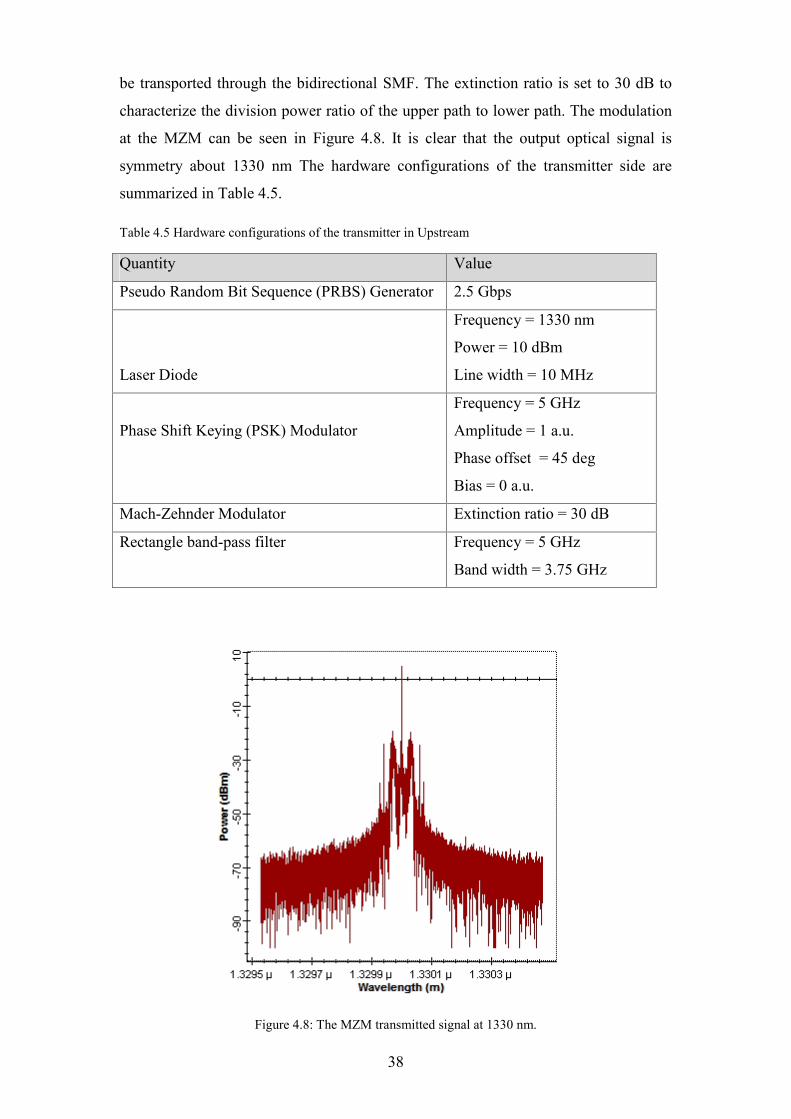
38
be transported through the bidirectional SMF. The extinction ratio is set to 30 dB to
characterize the division power ratio of the upper path to lower path. The modulation
at the MZM can be seen in Figure 4.8. It is clear that the output optical signal is
symmetry about 1330 nm The hardware configurations of the transmitter side are
summarized in Table 4.5.
Table 4.5 Hardware configurations of the transmitter in Upstream
Quantity Value
Pseudo Random Bit Sequence (PRBS) Generator 2.5 Gbps
Laser Diode
Frequency = 1330 nm
Power = 10 dBm
Line width = 10 MHz
Phase Shift Keying (PSK) Modulator
Frequency = 5 GHz
Amplitude = 1 a.u.
Phase offset = 45 deg
Bias = 0 a.u.
Mach-Zehnder Modulator Extinction ratio = 30 dB
Rectangle band-pass filter Frequency = 5 GHz
Band width = 3.75 GHz
Figure 4.8: The MZM transmitted signal at 1330 nm.

39
In the case of upstream , it has more than one transmitter operating on the same
wavelength, it must take into account the TDMA. Therefore it will use two cascaded
Dynamic Select Y as shown in figure 4.9 which they will allow to pass the signal only
at a determined time instant and the rest will be zero. In the begining, the parameter
TimeSlot for every ONU has been defined and assign value of 0 to the first ONU, 1
for the second ONU and so on until reach TimeSlot=31 for ONU number 32. later for
each one Dynamic Y select, the time interval or switching time will be defined to has
the following value. For component A:
switching time = TimeSlot * (1/Bit rate) *Sequence length / 32
The number 32 refer to 32 ONU. For component B, switching time will be defined to:
Switching time=Timeslot * (1/Bit rate) * Sequence length / 32+Time window / 32
Figure 4.9: implementation of TDMA using two cascaded dynamic Y selector
In component A properties, port before switching is port1 and after switching is port
2, while in component B the port before switching is port2 and after switching is port1
[40]. Now lets explain the idea on ONU1, ONU16 and ONU32. Time window = 51.2
nano second (ns), Bit rate = 2.5 Gbps and Sequence length=128 Bit. Firstly, for
ONU1, TimeSlot =0, Switching time for component A = 0 ns and switching time for
component B = 1.6 ns. Component A will pass the input signal (port 1) to the output
from 0 ns to the end of time window, while component B will allow to pass the signal
from switching time of component A to the switching time of component B. This
means that the signal will pass to the output from 0 ns to 1.6 ns second and the rest
will be zero. Figure 4.10 shows the signal transmitted by ONU1. Secondly, for
ONU16, TimeSlot =15, Switching time for component A = 24 ns and switching time
for component B = 2.56 ns. Component A will pass the input signal to the output from

40
24 ns to the end of time window, while component B will allow to pass the signal
from switching time of component A to the switching time of component B. mean the
signal will pass to the output from 24 ns to 2.56 ns and the rest will be zero. Figure
4.11 shows the signal transmitted by ONU16. Thirdly, for ONU32, TimeSlot=31,
Switching time for component A=49.6 ns and switching time for component B = 51.2
ns. Component A will pass the input signal to the output from 49.6 ns to the end of
time window, while component B will allow to pass the signal from switching time of
component A to the switching time of component B. mean the signal will pass to the
output from 49.6 ns to 51.2 ns and the rest will be zero. Figure 4.12 shows the signal
transmitted by ONU32.This proves that the signals transmitted by the various ONU's
do not overlap in time:
Figure 4.10: Signal transmitted by ONU1
in time domain
Figure 4.11: Signal transmitted by ONU 16
in time domain

41
Figure 4.12: Signal transmitted by ONU32
in time domain Figure 4.13: Splitter output toward the fiber
in the time domain
4.2.2.2 Splitter , Fiber and CirculatorThe Bidirectional splitter work as a combiner in the upstream channel. The properties
of the splitter was shown in table 3, The output of the splitter toward the fiber in the
time domain is shown in figure 4.13.
4.2.2.3 Receiver
Figure 4.14 shows the receiver in the upstream. The only difference between receiver
in downstream and upstream is buffer selector in upstream receiver. The first element
of the receiver will be the buffer selector, which will be used to select only the latest
iteration of the simulation, which will be the one with the correct results. After this
element as in the downstream, the signal will pass through the PIN Photodetector
where it will be converted to electrical domain and as in other cases will be filtered
through BPF. The received signal after photo detection and filtering is illustrated in
Figure 4.15. It is clear that the central frequency of the signal is about 5 GHz; also it is
clear that there is a power loss and signal distortion due to conversion process in spite
of using sampling rate in PD five times of the main sampling rate. The resultant of
signal power after the BPF and electrical amplification is about -31.49 dBm, the
power losses in BPF is due to the signal cutting. After receiving and filtering the
signal, 3R regenerator is used and connected directly to the bit error rate (BER)
Analyzer .
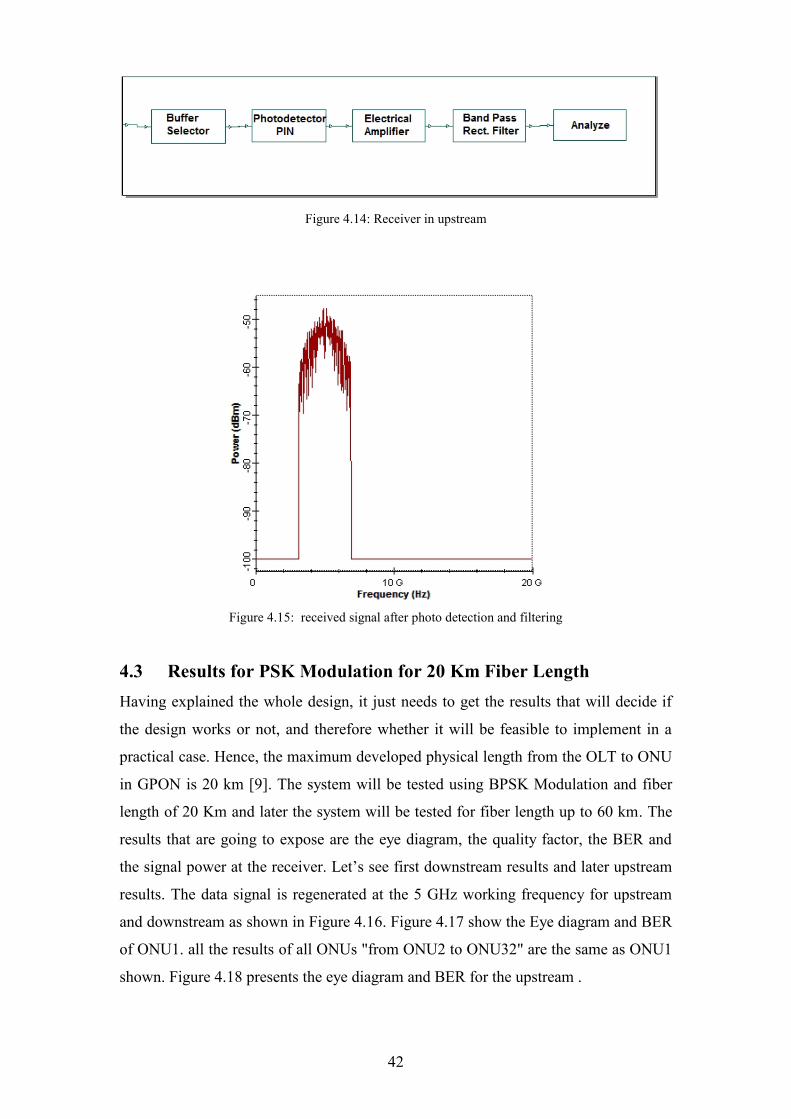
42
Figure 4.14: Receiver in upstream
Figure 4.15: received signal after photo detection and filtering
4.3 Results for PSK Modulation for 20 Km Fiber LengthHaving explained the whole design, it just needs to get the results that will decide if
the design works or not, and therefore whether it will be feasible to implement in a
practical case. Hence, the maximum developed physical length from the OLT to ONU
in GPON is 20 km [9]. The system will be tested using BPSK Modulation and fiber
length of 20 Km and later the system will be tested for fiber length up to 60 km. The
results that are going to expose are the eye diagram, the quality factor, the BER and
the signal power at the receiver. Let’s see first downstream results and later upstream
results. The data signal is regenerated at the 5 GHz working frequency for upstream
and downstream as shown in Figure 4.16. Figure 4.17 show the Eye diagram and BER
of ONU1. all the results of all ONUs "from ONU2 to ONU32" are the same as ONU1
shown. Figure 4.18 presents the eye diagram and BER for the upstream .

43
Figure 4.16: RF spectrum regenerated at the 5GHz working frequency
Figure 4.17: Eye diagram and BER of ONU 1 - downstream

44
Figure 4.18: Eye diagram and BER for upstream
The received eye diagrams of downstream and upstream signals were measured at
ONU and OLT respectively. In both downlink stage and uplink stage, it can be seen
that the eye was clear and open and the Q factor has accepted value since it is greater
than 6. Table 4.6 compares between two stages, it is clear that the system performs
more efficient in the downstream due to using TDMA in upstream.
Table 4.6 PSK Downstream – Upstream results
PSK Parameter Downlink uplink
Max Q. Factor 10.50 9.52
Min BER 4.48 x 10⁻²⁶ 8.24 x 10⁻²²
Eye Height 1.59 x 10⁻⁴ 1.73 x 10⁻⁴
Signal power -38.76 dBm -35.50 dBm
The BER is the number of bit errors divided by the total number of transferred bits
during a certain time interval. As the BER decreases the system performance
increases and it has a range between 0 to 1. The values of BER in downstream and
upstream are accepted since it is lower than the standardized minimum 10-10 BER for
GPON technology [39].

45
4.4 Results for DPSK Modulation for 20 Km Fiber Length
The system will be tested for DPSK Modulation and fiber length of 20 Km. The
results that are going to expose are the eye diagram, the quality factor, the BER and
the signal power at the receiver. The data signal is regenerated at the 5 GHz working
frequency as shown in Figure 4.19 for upstream and downstream. Figure 4.20
describes the Eye diagram and BER of ONU1 for downstream. all the results of all
ONU's "from ONU 2 to ONU 32" are the same as ONU 1 shown. Figure 4.21 show
the Eye diagram and BER for the upstream.
Figure 4.19: RF spectrum regenerated at the 5GHz working frequency
The received eye diagrams of downstream and upstream signals were measured at
ONU and OLT respectively. In both downlink stage and uplink stage, it can be seen
that the eye was clear and open. Table 4.7 compares between two stages, it is clear
that the system performs more efficient in the downstream due to using TDMA in
upstream.

46
Figure 4.20: DPSK Eye diagram and BER for downstream
Figure 4.21 : DPSK Eye diagram and BER for upstream

47
Table 4.7 DPSK downstream – upstream results
DPSK Parameter Downlink uplink
Max Q. Factor 10.38 9.51
Min BER 1.49 x 10⁻²⁵ 9.64 x 10⁻²²
Eye Height 6.84 x 10⁻⁵ 6.98 x 10⁻⁵
Signal power -46.11 dBm -42.15 dBm
The results of DPSK modulation is nearly the same as PSK modulation in Eye height
and Max Q factor but the results of PSK modulation is better than the results of DPSK
modulation in BER and signal power received at the receiver. The values of BER in
downstream and upstream are accepted since it is lower than the standardized
minimum 10-10 BER for GPON technology [39].
4.5 Results for OQPSK Modulation for 20 Km Fiber Length
The system will be tested for OQPSK modulation and fiber length of 20 km. The data
signal is regenerated at the 5 GHz working frequency as shown in Figure 4.22 for
upstream and downstream. Figure 4.23 shows the Eye diagram and BER of ONU 1
for downstream. all the results of all ONU's "from ONU 2 to ONU 32" are the same
as ONU 1 shown. Figure 4.24 shows the Eye diagram and BER for the upstream.
Figure 4.22 : RF spectrum regenerated at the 5GHz working frequency

48
Figure 4.23: OQPSK Eye diagram and BER for downstream
Figure 4.24: OQPSK Eye diagram and BER for upstream

49
The received eye diagrams of downstream and upstream signals were measured at
ONU and OLT respectively. In both downlink stage and uplink stage, it can be seen
that the eye was clear and open and the Q factor has accepted value since it is greater
than 6. The values of BER in downstream and upstream are accepted since it is lower
than the standardized minimum 10-10 BER for GPON technology [39]. Table 4.8
compares between two stages, it is clear that the system performs more efficient in the
downstream due to losses in TDMA in upstream.
Table 4.8 OQPSK Downstream – Upstream results
PSK Parameter Downlink uplink
Max Q. Factor 10.40 9.51
Min BER 1.21 x 10⁻²⁵ 9.07 x 10⁻²²
Eye Height 1.4 x 10⁻⁴ 1.70 x 10⁻⁴
Signal power -39.66 dBm -35.64 dBm
4.6 Test the performance of the PSK, DPSK and OQPSK System for
different Fiber lengthAt this section the performance of the system will be evaluated for PSK, DPSK and
OQPSK with a fiber length from 10 km up to 60 Km. Figure 4.25 shows the BER for
downstream and upstream of the system with PSK modulation for length of fiber from
10km up to 60 km
Figure 4.25: BER of PSK for system of varied fiber length

50
It can be seen in Figure 4.25 that BER increases with fiber length increases. The
performance of downstream is better than upstream of fiber length up to 47km. The
upstream signal appears to be better for fiber length from 50 km up to 60 km but it
located under 10-10 line and not accepted for optical communication. Figure 4.26 show
the signal power at the receiver for downstream and upstream of the system with PSK
modulation for length of fiber from 10km to 60 km.
Figure 4.26: Received Power for PSK system of varied fiber length
It is clear that the signal power received at the receiver decreases with as the fiber
length increase. Figure 4.27 show the BER for downstream and upstream of the
system with DPSK modulation for length of fiber from 10km up to 60 km.
Figure 4.27 BER of DPSK for system of varied fiber length

51
It can be seen in Figure 4.27 that BER increases with fiber length increases. Figure
4.28 shows the total power at the receiver for downstream and upstream of the system
with DPSK modulation for length of fiber from 10km up to 60 km. The signal power
received at the receiver decreases as the fiber length increase as shown in figure 4.28
Figure 4.28: Received Power for DPSK system of varied fiber length
Figure 4.29 show the BER for downstream and upstream of the system with OQPSK
modulation for length of fiber from 10km up to 60 km.
Figure 4.29: BER of OQPSK for system of varied fiber length

52
It is clear that BER increases with fiber length increases. Figure 4.30 shows the signal
power at the receiver for downstream and upstream of the system with OQPSK
modulation for length of fiber from 10km up to 60 km. The signal power received at
the receiver decreases as the fiber length increases as shown in figure 4.30.
Figure 4.30: Received Power for OQPSK system of varied fiber length
4.7 Results comparison of various modulation type and fiber
length Figure 4.31 shows the downstream BER for different modulation schemes and
different fiber lengths. As it can been seen that the BER of the PSK modulation is
better than DPSK and OQPSK modulation in the downstream, and the BER is
accepted for length of fiber up to 40 km, at this distance, the PSK BER=1.6x10⁻¹²,
DPSK BER=1.6x10⁻¹¹ and OQPSK BER=5.11x10⁻¹². At fiber length of 50 km, 60 km
the BER is under the 10-10 line and not accepted for GPON network. Figure 4.32 show
the upstream BER for PSK, DPSK and QPPSK modulation for length of fiber from
10km to 60 km. As it can been seen that the BER of the PSK modulation is better than
DPSK and OQPSK modulation in the upstream. The BER is accepted for different
modulation schemes and length of fiber up to 40 km, at this distance, the PSK
BER=8.3x10⁻¹², DPSK BER=3.4x10⁻¹¹ and OQPSK BER=1.6x10⁻¹¹. At fiber length
of 50 km , 60 km the BER is under the 10-10 line and not accepted for GPON network.
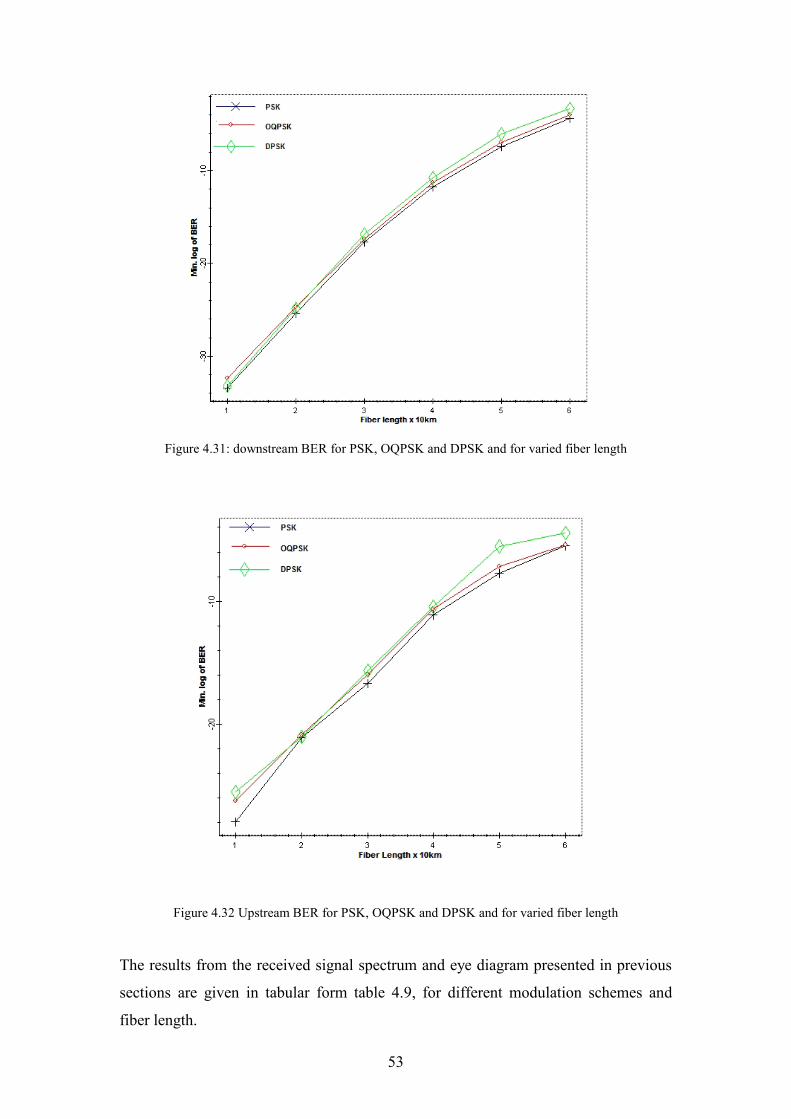
53
Figure 4.31: downstream BER for PSK, OQPSK and DPSK and for varied fiber length
Figure 4.32 Upstream BER for PSK, OQPSK and DPSK and for varied fiber length
The results from the received signal spectrum and eye diagram presented in previous
sections are given in tabular form table 4.9, for different modulation schemes and
fiber length.

54
Table 4.9 Results comparison for various modulation type and fiber link
DOWNSTREAM UPSTREAMBER Eye
heightPower BER Eye
heightPower
PSK10km
3.9x10⁻³⁴ 2.6x10⁻⁴ -34.8dB 1.2 x10⁻²⁸ 3.1x10⁻⁴ -31.5dB
PSK20km
4.5x10⁻²⁶ 1.6x10⁻⁴ -38.7dB 8.2x10⁻²² 1.7x10⁻⁴ -35.5dB
PSK30km
1.9x10⁻¹⁸ 9.2x10⁻⁵ -42.7dB 2.1x10⁻¹⁷ 9.5x10⁻⁵ -39.5dB
PSK40km
1.6x10⁻¹² 5.0x10⁻⁵ -46.8dB 8.3x10⁻¹² 8.9x10⁻⁵ -43.5dB
PSK50km
3.8x10⁻⁸ 2.4x10⁻⁵ -50.9dB 2.0x10⁻⁸ 4.6x10⁻⁵ -47.5dB
PSK60km
4.2x10⁻⁵ 7.9x10⁻⁶ -55.2dB 3.5x10⁻⁶ 2.8x10⁻⁵ -51.5dB
DPSK10km
6.3x10⁻³⁴ 1.1x10⁻⁴ -42.8dB 2.9x10⁻²⁶ 1.7x10⁻⁴ -36.5dB
DPSK20km
1.5x10⁻²⁵ 6.9x10⁻⁵ -46.1dB 9.6x10⁻²² 7.0x10⁻⁵ -42.1dB
DPSK30km
1.4x10⁻¹⁷ 4.5x10⁻⁵ -48.9dB 2.3x10⁻¹⁶ 8.1x 10⁻⁵ -43.1dB
DPSK40km
1.6x10⁻¹¹ 2.7x10⁻⁵ -51.8dB 3.4x10⁻¹¹ 6.4x10⁻⁵ -44.4dB
DPSK50km
8.3x10⁻⁷ 1.2x10⁻⁵ -56dB 3.6x10⁻⁵ 3.6x10⁻⁵ -48.4dB
DPSK60km
4.6x10⁻⁴ 1.8x10⁻⁶ -60.2dB 1.9x10⁻⁵ 1.9x10⁻⁶ -52.4dB
OQPSK10km
8.2x10⁻³⁴ 2.3x10⁻⁴ -35.6dB 1.2x10⁻²⁸ 3.0x10⁻⁴ -31.8dB
OQPSK20km
1.2x10⁻²⁵ 4.4x10⁻⁵ -39.6dB 9.7x10⁻²² 1.7x10⁻⁴ -35.6dB
OQPSK30km
5.9x10⁻¹⁸ 8.2x10⁻⁵ -43.6dB 3.4x10⁻¹⁷ 9.1x 10⁻⁵ -39.8dB
OQPSK40km
5.2x10⁻¹² 4.4x10⁻⁵ -47.7dB 1.6x10⁻¹¹ 8.6x10⁻⁵ -42.9dB
OQPSK50km
1.1x10⁻⁷ 2.1x10⁻⁵ -51.87dB 2.2x10⁻⁷ 3.6x10⁻⁵ -46.4dB
OQPSK60km
9.3x10⁻⁵ 5.9x10⁻⁶ -56.1dB 1.1x10⁻⁵ 6.7x10⁻⁶ -53.4dB

55
4.7 SummaryThe RoF employed GPON system was tested for different modulation schemes.
Firstly, the system was tested for 20 km fiber length and different modulation
schemes. The received eye diagrams of downstream and upstream signals were
measured at ONUs and OLT respectively. In both downlink stage and uplink stage,
the eye was clear and open, BER and Signal power values were accepted for different
modulation schemes. Secondly, the system was tested for different modulation
schemes and fiber length from 10 Km up to 60 Km and a comparison was made. In
downstream and upstream , increasing the fiber length, the BER increases and the
signal power decreases.
BER is accepted for length of fiber up to 40 km in upstream and downstream for
different modulation schemes. BER results of the PSK modulation is better than
DPSK and OQPSK modulation in the downstream and the upstream.

56
5. Conclusion and Future Work
5.1 SummaryRoF is a very effective technology for integrating wireless and optical access.
It combines the two media; fiber optics and radio, and it is a way to easily distribute
radio frequency as a broadband or baseband signal over fiber. It utilizes analog fiber
optic links to transmit and distribute radio signals between a central CS and numerous
BSs. In this sense RoF is a promising technology for future high-capacity and
broadband multimedia wireless services.
GPON has gained much interest in today’s networking due to the flexibility,
simple and low cost passive connection. For instance, GPON technology has been
successfully deployed in Fiber-to-the-Home (FTTH) that support Triple-Play services
which combine the internet data, telephony and video to the home through only single
cable. This research provides characterization of Rof employed GPON architecture
for wireless distribution network.
The Simulation was performed on OPTISYSTEM software. The analysis of
simulation results were based on received signal strength and eye pattern obtained for
various modulation schemes. The system was analyzed using PSK modulation and
DPSK Modulation. The system was tested for length from the OLT to ONU of from
10km up to 60Km. In the design of the proposed system, one transmitter and one
receiver were used at OLT and distributed to the 32 ONUs. Bidirectional fiber was
used with length up to 60 km. A bidirectional 1:32 passive optical splitter was used to
connect the ONU's to the backbone fiber. The upstream and downstream signal
separated by the optical circulator and optical delay introduced at the fiber to ensure
the correct timing of circulation. The bit rate of the downstream and upstream was set
at 2.5 Gbps and the chosen working frequency was 5 GHz which operated as IEEE
802.11a signal. The optical modulation that consisted of CW LD and MZM which
worked at 1490 nm for downstream and 1330 nm for upstream.

57
In the first part at this work, the system was tested for BPSK modulation, with
fiber length of 20 Km. The received eye diagrams of downstream and upstream
signals were measured at ONUs and OLT respectively. In both downlink stage and
uplink stage, it can be seen that the eye was clear and open. BER and Signal power
values were accepted without using optical amplifier.
In the second part at this work, the system was tested for DPSK modulation,
with fiber length of 20 Km. Both eye diagram and BER values were accepted. And in
the third part the system was tested for OQPSK modulation with 20km fiber length
and accepted results were achieved.
Finally, the system was tested for different modulation schemes and different
fiber lengths, and a comparison was made. In downstream and upstream, increasing
the fiber length, the BER increases and the signal power decreases. BER of the PSK
modulation is better than DPSK and OQPSK modulation in the downstream and the
upstream. The BER is accepted for length of fiber up to 40 km for different
modulation schemes in both downstream and upstream, at this distance the value of
BER is not exceed the accepted value for GPON which is 10-10. The value of BER is
not accepted for fiber length more than 40 Km since it exceed the limit 10-10. with
high bandwidth, flexible and simple assessment.
RoF and GPON technology is indeed a promising solution for today’s
communication to support the continuous increasing figure of wireless internet users.
BPSK is the most appropriate modulation scheme. It gives maximum power, and
minimum bit error rate (BER) for satisfactory receiver performance.
5.2 Suggestion for ImprovementThe design in this work can be upgraded to give better performance. To increase the
system efficiency, the data rate and the number of optical network unit can be
increased. We use a 1:32 Splitter to serve 32 ONU, we can increase this to 64 ONU.
Also At this design we use three type of modulation PSK, DPSK and OQPSK, the
design can be modified to operate with other modulation techniques such as qudrature
amplitude modulation QAM. The concept of wavelength division multiplexing
(WDM) can be applied as future recommendations to efficiently utilize the available
BW resources.
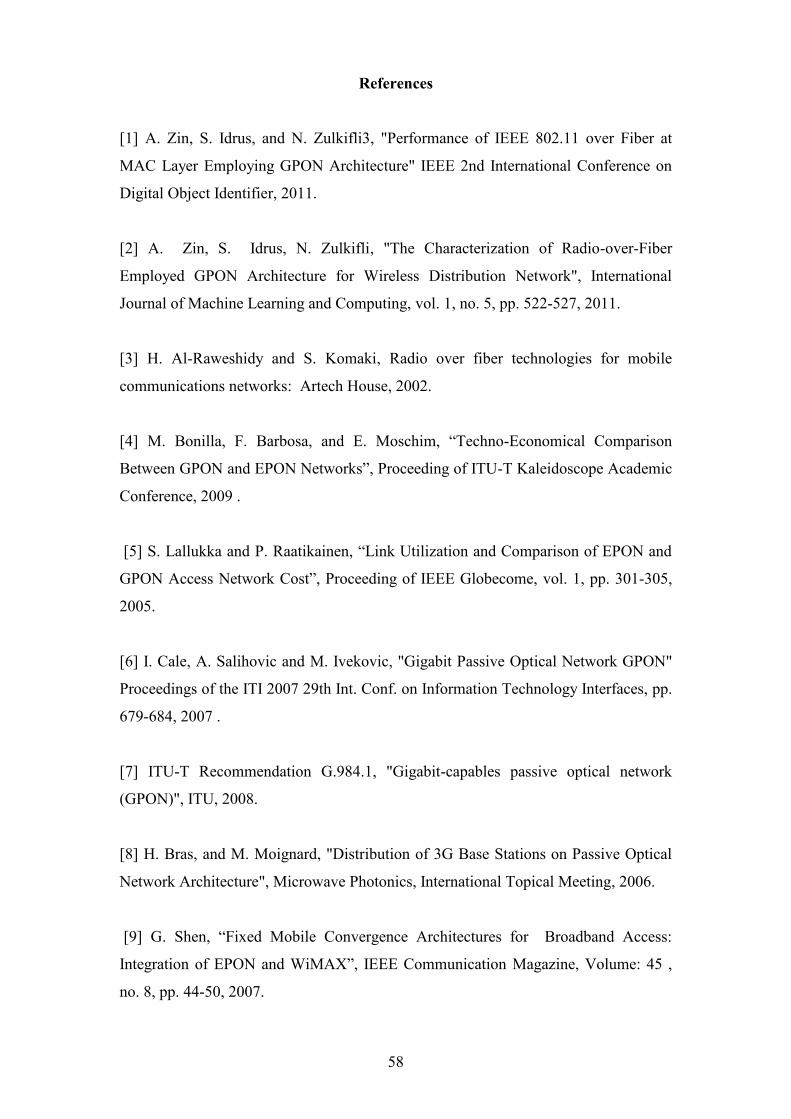
58
References
[1] A. Zin, S. Idrus, and N. Zulkifli3, "Performance of IEEE 802.11 over Fiber at
MAC Layer Employing GPON Architecture" IEEE 2nd International Conference on
Digital Object Identifier, 2011.
[2] A. Zin, S. Idrus, N. Zulkifli, "The Characterization of Radio-over-Fiber
Employed GPON Architecture for Wireless Distribution Network", International
Journal of Machine Learning and Computing, vol. 1, no. 5, pp. 522-527, 2011.
[3] H. Al-Raweshidy and S. Komaki, Radio over fiber technologies for mobile
communications networks: Artech House, 2002.
[4] M. Bonilla, F. Barbosa, and E. Moschim, “Techno-Economical Comparison
Between GPON and EPON Networks”, Proceeding of ITU-T Kaleidoscope Academic
Conference, 2009 .
[5] S. Lallukka and P. Raatikainen, “Link Utilization and Comparison of EPON and
GPON Access Network Cost”, Proceeding of IEEE Globecome, vol. 1, pp. 301-305,
2005.
[6] I. Cale, A. Salihovic and M. Ivekovic, "Gigabit Passive Optical Network GPON"
Proceedings of the ITI 2007 29th Int. Conf. on Information Technology Interfaces, pp.
679-684, 2007 .
[7] ITU-T Recommendation G.984.1, "Gigabit-capables passive optical network
(GPON)", ITU, 2008.
[8] H. Bras, and M. Moignard, "Distribution of 3G Base Stations on Passive Optical
Network Architecture", Microwave Photonics, International Topical Meeting, 2006.
[9] G. Shen, “Fixed Mobile Convergence Architectures for Broadband Access:
Integration of EPON and WiMAX”, IEEE Communication Magazine, Volume: 45 ,
no. 8, pp. 44-50, 2007.
59
[10] H. Bakarman, S. Shaari and M. Ismail, "Simulation of 1.25 Gb/s Downstream
Transmission Performance of GPON-FTTx", IEEE International Conference on
Digital Object Identifier, 2010 .
[11] G. Keiser, Optical Fiber Communications: McGraw-Hill,2000.
[12] H. Sasai, T. Niiho, K. Tanaka, K. Utsumi and S. Morikura , "Radio-over-fiber
transmission performance of OFDM signal for dual-band wireless LAN systems",
IEEE Microwave Photonics, pp. 139-142, 2003.
[13] G. Agrawal, Fiber-optic communication systems: Wiley, 2012.
[14] H. Bulow, “System outage probability due to first and second order PMD,” IEEE
Photonics Technology Letters, vol. 10, no. 5, pp. 696-698, 1998.
[15] G. Sasaki, K. Sivarajan and R. Ramaswami, Optical Networks A Practical
Perspective: Third Edition, ElSEVIER, 2010.
[16] P. Thijs, L. Tiemeijer, P. Kuindersma, J. Binsma, and T. Dongen, "High
Performance 1.5m Wavelength InGaAs-InGaAsP Strained Quantum Well Lasers and
Amplifiers", IEEE J. of Quantum Electron, vol. 27, no. 6, pp. 1426-1439, 1991.
[17] E. Ackerman and C. Cox, "RF fiber-optic link performance", Microwave
Magazine, IEEE, vol.2, no. 4, pp. 50-58, 2001.
[18] E. Desurvire, Erbium Doped Fibre Amplifiers, New York, USA: Wiley, 1994.
[19] R. Laming, M. Zervas, and D. Payne, “Erbium doped amplifier with 54dB gain
and 3.1dB noise figure”, IEEE Photon. Technol. Lett, vol. 4, no. 12, pp. 1345-1347,
1992.
[20] J. Nilsson, S. Yun, S. Hwang, J. Kim, and S. Kim, “Long wavelength erbium-
doped fibre amplifier gain enhanced by ASE end reflectors,” IEEE Photon. Technol.
Lett, vol. 10, no. 11, pp. 1551-1553, 1998.

60
[21] T. Whitley, R. Wyatt, D. Szebesta, and S. Davey, “Towards a practical 1.3μm
optical fibre amplifier”, BT Technol. J, 1993.
[22] j. McGeough, Semiconductor Optical Amplifiers to Extend the Reach of Passive
Optical Networks: Uviversity of Glasgow, 2012.
[23] G. Keiser, FTTX concepts and applications: John Wiley & Sons, 2006
[24] ITU-T G.984.1 "Gigabit-capable Passive Optical Networks (GPON): General
characteristics", ITU 2003.
[25] B. Dang and I. Niemegeers "Analysis of IEEE 802.11 in Radio over Fiber Home
Networks" Proceedings of the IEEE Conference on Local Computer Networks, pp.
744-747, 2005.
[26] A. Cooper, "Fiber/Radio for the provision of cordless/mobile telephony services
in the access network", Electron. Lett, vol. 26, pp. 2054-2056, 1990.
[27] M. Webster, G. Wimpenny, K. Beacham and L. Crawford, "Radio over fiber for
mobile communications," IEEE, pp.157-160, 2004.
[28]. D. Novak, “Fiber Optics in Wireless Applications”, OFC 2004 Short Course
217, 2004.
[29]. J. O’Reilly, P. Lane, and M. Capstick, “Optical Generation and Delivery of
Modulated mm-waves for Mobile Communications”, Analog Optical Fiber
Communications, IEE, pp. 229-256, 1995.
[30]. Y. Koike, “POF Technology for the 21st Century”, in Proceedings of the Plastic
Optical Fibres (POF) Conference, 2001.
[31]. Y. Watanabe, “Current Status of Perfluorinated GI-POF and 2.5 Gbps Data
Transmission over it”, in Proceedings of OFC, vol. 1, no. 12, 2003.

61
[32]. D. Wake, and K. Beachman, “A Novel Switched Fibre Distributed Antenna
System”, in Proceedings of European Conference on Optical Communications, vol. 1,
pp. 55-56, 2004.
[33]. D. Mynbaev, L. Scheiner, Fiber Optic Communications Technology: Prentice
Hall, New Jersey, 2001.
[34]. A. Ng’oma, "Radio-over-fiber technology for broadband wireless
communication systems," Eindhoven, The Netherlands, PhD Thesis, 2005.
[35] A. Kim, Y. Joo and Y. Kim, "60 GHz wireless communication systems with
radio-over-fiber links for indoor wireless LANs", Consumer Electronics, IEEE
Transactions on, vol. 50, no. 2, pp. 517-520, 2004.
[36] L. Couch, Digital and Analog Communications: 6th ed. Upper Saddle River,
USA: Prentice-Hall, 1997.
[37] J. Proakis, Digital Communications: Third Edtion. Singapore: McGraw Hill,
1995.
[38] U. Madhow, Fundamentals of Digital Communication: Cambridge University
Press, 2008.
[39] S. Pato, J. Santos, J. Pedro, P. Monteiro and H. Silva, “On Supporting Radio over
Fiber and Passive Optical Network Systems with a Common Fiber Plant
Compatibility Aspects”, Proceeding of ITCON, vol. 2, pp. 203-206, 2008.
[40] D. Mynbaev and L. Scheiner, Fiber Optic Communications Technology:Prentice Hall, New Jersey, 2001.
[41] O. Company," Broadband Optical System Based on a Passive Optical Network(BPON)". Retrieved 2 2, 2014, from optiwave, 2010.http://optiwave.com/resources/applications-resources/optical-system-broadband-optical-system-based-on-a-passive-optical-network-bpon/#