Embed Size (px)
Citation preview

Balancing Act- a triple bottom line analysis of 135 sectors of the Australian economy
Barney Foran - CSIRO Resource Futures
Manfred Lenzen & Christopher Dey - ISA @ USyd
We undertake research, applications development and consulting on broad sustainability issues.
Our aim is to develop scientifically rigorous, quantitative, consistent and comprehensive approaches for Integrated Sustainability Analysis.
Our research framework has applications including:• quantitative triple bottom line (TBL) reporting• ecological footprint analysis• life-cycle assessment (LCA)• environmental impact assessment (EIA)• industry and population studies, and • supply chain analysis
The University of Sydney http://www.isa.org.usyd.edu.au
The ISA framework

Sustainability Analysis?
• concepts for environmental sustainability
• Life cycle assessment
• Life cycle management/thinking
• Carrying capacity
• Design for the environment (Eco-design)
• Cleaner technology
• Total quality environmental management
• Dematerialisation
• Eco-efficiency
• Industrial ecology
• Extended producer responsibility
Sustainability Analysis?• environmental analysis & procedural tools

Udo de Haes et al (2000)
The Triple Bottom Line – what is it?
A powerful metaphor for considering economic, social and environmental concerns
A reporting framework
Indicators - qualitative v. quantitative
Consistency, comparability, completeness
Information for decision making
A stimulus for organisational change –governance (#4)

http://www.globalreporting.org/guidelines/2002/gri_companion_lite.pdf
Economic:
• wages & pensions
• monies received & paid
• taxes paid and subsidies received
Environmental:
• energy & greenhouse
• materials & effluents
• water & biodiversity
Social:
• labour practices
• human rights
• bribery & corruption
The boundary problem
“It is critical [that] the boundaries adopted for the
purposes of reporting are clearly defined and
obvious to readers of reports. Careful boundary
definition also ensures a report can be verified and
meaningful comparisons can be made between
information from different reporting periods.”
Environment Australia (2003), Triple bottom line reporting in Australia: a guide to reporting against environmental indicators, June 2003.

GRI Boundary Protocol (2005)
The boundary problem 2
Organisation
Mining Legal SteelTrans. BankingElect.
•••
•••
•••
•••
•••
•••
•••
•••
•••
•••
M L E T S B M L E T S B M L E T S B M L E T S B M L E T S B M L E T S B
Supplier level:
∞....
2
1
On-siteBoundary
UpstreamDownstream
Product 2Product 1
Consumer Industry
Interdependencies in economies

Integration
National Input-Output Tables
Structure and function and knock-on effects
Nationaldata
Background to Input-Output Analysis
Wassily Leontief (from 1930s) – Nobel prize
Elements found in many economic models:
“neutral from both an analytical and ideological point of view” (Nobel Laureate Richard Stone)
Static, “snap-shot” of the complex linkages in an economy
Appropriate for reporting and linkage analysis
“Generalised IOA” means that other production factors (eg. labour, imports, energy, etc) are incorporated
Result is a common framework for different indicators
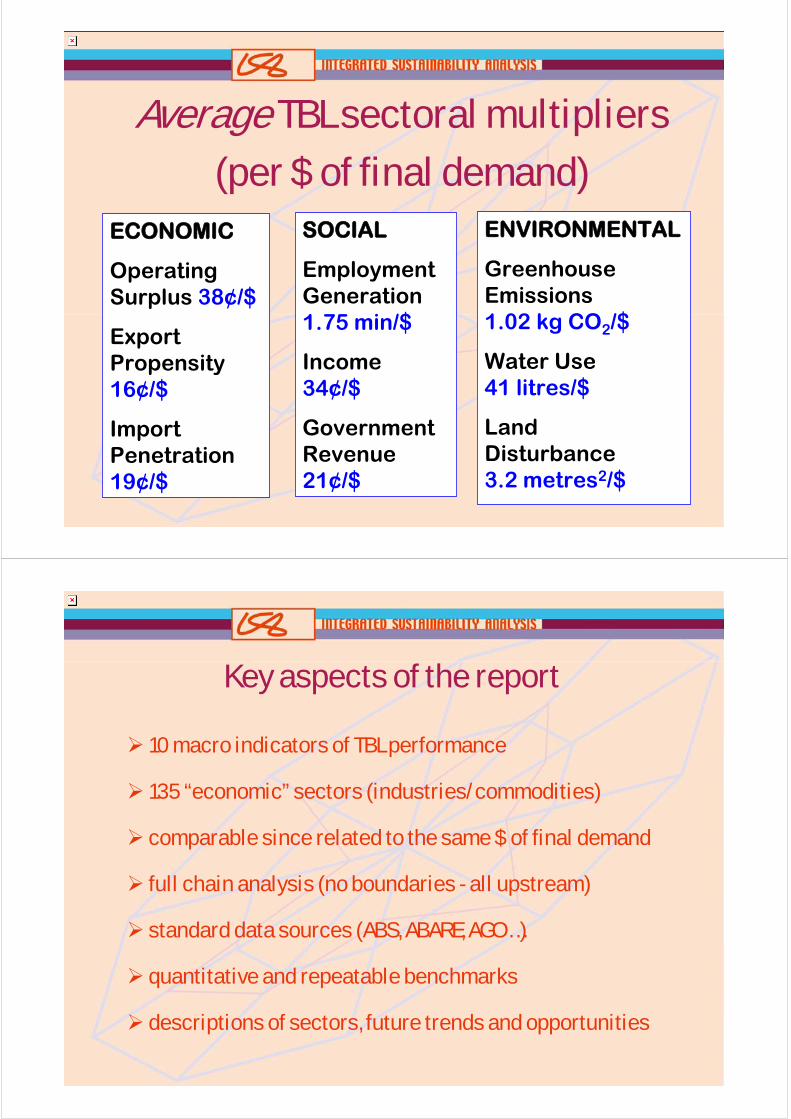
Average TBL sectoral multipliers
(per $ of final demand)ECONOMIC
Operating Surplus 38¢/$
Export Propensity 16¢/$
Import Penetration 19¢/$
SOCIAL
Employment Generation 1.75 min/$
Income 34¢/$
Government Revenue 21¢/$
ENVIRONMENTAL
Greenhouse Emissions 1.02 kg CO2/$
Water Use 41 litres/$
Land Disturbance 3.2 metres2/$
Key aspects of the report
10 macro indicators of TBL performance
135 “economic” sectors (industries/commodities)
comparable since related to the same $ of final demand
full chain analysis (no boundaries - all upstream)
standard data sources (ABS, ABARE, AGO …)
quantitative and repeatable benchmarks
descriptions of sectors, future trends and opportunities

Commercial fishing
0.99
0.52
2.32
1.12
0.70
1.28
0.53
0.13
1.46
1.19
0.1
1.
10.Employment
Income
Land disturbance
Water use
Primary energy
GHG emissions
Gross operating surplus
Imports
Exports
Government revenue
Eg. Sectoral spider diagram
0.1
1.
10.Employment
Income
Land disturbance
Water use
Primary energy
GHG emissions
Gross operating surplus
Imports
Exports
Government revenue
Sector: Banking

0.1
1.
10.Employment
Income
Land disturbance
Water use
Primary energy
GHG emissions
Gross operating surplus
Imports
Exports
Government revenue
Sector: Dairy products
Wheat and other grains (Wh)
0.1
1.
10.Employment
Income
Land disturbance
Water use
Primary energy
GHG emissions
Gross operating surplus
Imports
Exports
Government revenue
0.0
0.5
1.0
1.5
2.0
2.5
Employment (min)
Wheat & other grains
rem
3
2
1
dir
0.00
0.05
0.10
0.15
0.20
0.25
0.30
0.35
0.40
Income ($)
Wheat & other grains
rem
3
2
1
dir

0.0
0.2
0.4
0.6
0.8
1.0
1.2
GHG emissions (kg CO2-e)
Wheat & other grains
rem
3
2
1
dir
Wh 0.687 (0; 67.%)El Wh 0.0234 (1; 2.3%)Ch Wh 0.0173 (1; 1.7%)Fo Wh 0.0114 (1; 1.1%)Sc Cg Wh 0.00936 (2; 0.91%)Fe Wh 0.00925 (1; 0.9%)Wt Wh 0.00874 (1; 0.85%)Rd Wh 0.00853 (1; 0.83%)El Rf Wh 0.00487 (2; 0.47%)Rf Wh 0.00485 (1; 0.47%)Oi Fo Wh 0.00343 (2; 0.33%)El Wt Wh 0.00263 (2; 0.25%)El Ch Wh 0.00261 (2; 0.25%)El St Wh 0.00259 (2; 0.25%)Fr Sc Cg Wh 0.0022 (3; 0.21%)Ap Wh 0.00165 (1; 0.16%)Bc Mp Ho Wh 0.00162 (3; 0.16%)
GHG emissions (kg CO2-e/$)
Structural path analysisWheat and other grains (Wh)
0.0
10.0
20.0
30.0
40.0
50.0
60.0
70.0
80.0
90.0
100.0
Water use (L)
rem
3
2
1
dir
Dc Dp Cn 32.4 (2; 35.%)Ri Fc Cn 12.4 (2; 13.%)Su Fd Cn 8.68 (2; 9.4%)Ws Cn 2.56 (1; 2.8%)Vf Cn 1.8 (1; 1.9%)Ri Fc Bp Cn 1.28 (3; 1.4%)Cn 1.23 (0; 1.3%)Wa Cn 0.888 (1; 0.96%)Wh Fc Cn 0.738 (2; 0.8%)Vf Fd Cn 0.689 (2; 0.75%)El Cn 0.602 (1; 0.65%)Ri Ws Cn 0.572 (2; 0.62%)Bc Mp Fd Cn 0.565 (3; 0.61%)Wh Cn 0.54 (1; 0.59%)Vf Ws Cn 0.519 (2; 0.56%)Wh Fd Cn 0.467 (2; 0.51%)Vf Fp Cn 0.466 (2; 0.51%)
Water use (L/$)
Know your full production chain
Confectionary (Cn) Water: 90 litres per $

Sector: Basic chemicals
0.35% of GDP (55th)
Sector: Basic iron & steel
0.86% of GDP (29th)

Sector: Aluminium
0.17% of GDP (82nd)
Sector Contribution to GDP
0.00
2.00
4.00
6.00
8.00
10.00
1 10 19 28 37 46 55 64 73 82 91 100 109 118 127 136
Sector Number
% o
f T
ota
l G
DP
Aggregation
primary tertiary

Ag, For & Fish
0.1
1.
10.Employment
Income
Land disturbance
Water use
Primary energy
GHG emissions
Gross operating surplus
Imports
Exports
Government revenue
Food
0.1
1.
10.Employment
Income
Land disturbance
Water use
Primary energy
GHG emissions
Gross operating surplus
Imports
Exports
Government revenue
3% GDP 2.5% GDP
Farming and Food
Mining
0.1
1.
10.Employment
Income
Land disturbance
Water use
Primary energy
GHG emissions
Gross operating surplus
Imports
Exports
Government revenue
Manufacturing
0.1
1.
10.Employment
Income
Land disturbance
Water use
Primary energy
GHG emissions
Gross operating surplus
Imports
Exports
Government revenue
4.4% GDP 10.7% GDP
Mining and Manufacturing

Construction
0.1
1.
10.Employment
Income
Land disturbance
Water use
Primary energy
GHG emissions
Gross operating surplus
Imports
Exports
Government revenue
Transp & comm
0.1
1.
10.Employment
Income
Land disturbance
Water use
Primary energy
GHG emissions
Gross operating surplus
Imports
Exports
Government revenue
Construction and Transport-Communications
5.6% GDP 8.7% GDP
Private services
0.1
1.
10.Employment
Income
Land disturbance
Water use
Primary energy
GHG emissions
Gross operating surplus
Imports
Exports
Government revenue
Public services
0.1
1.
10.Employment
Income
Land disturbance
Water use
Primary energy
GHG emissions
Gross operating surplus
Imports
Exports
Government revenue
26.1% GDP 16.7% GDP
Private Services and Public Services
Macro issues• What constitutes ‘below average’performance in an interdependent economy?
• Price and value of food
• Service industries are below average exporters
• Emissions embodied in exports
• ‘Buy Australian’ …
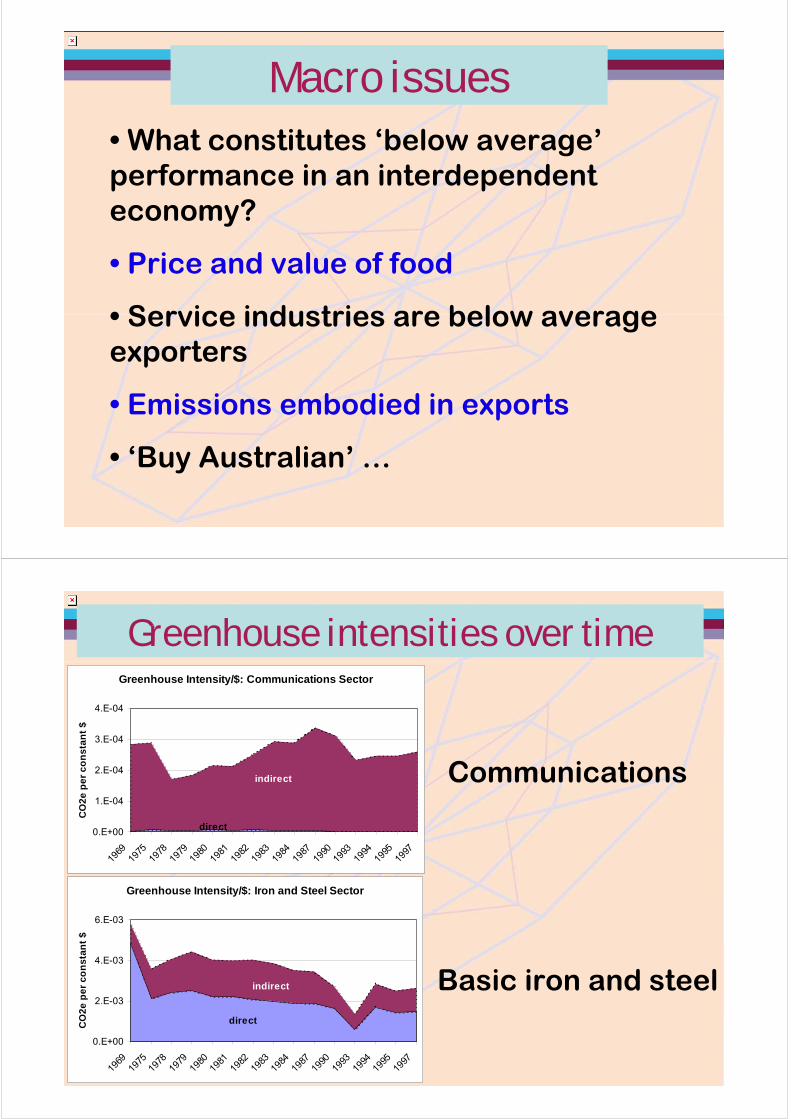
Greenhouse Intensity/$: Communications Sector
0.E+00
1.E-04
2.E-04
3.E-04
4.E-04
1969
1975
1978
1979
1980
1981
1982
1983
1984
1987
1990
1993
1994
1995
1997
CO
2e
pe
r c
on
sta
nt
$
indirect
direct
Greenhouse Intensity/$: Iron and Steel Sector
0.E+00
2.E-03
4.E-03
6.E-03
1969
1975
1978
1979
1980
1981
1982
1983
1984
1987
1990
1993
1994
1995
1997
CO
2e
pe
r c
on
sta
nt
$
indirect
direct
Greenhouse intensities over time
Communications
Basic iron and steel

The next generation model
• Time series
• More focused sectors
• More indicators
• Spatial analysis (states)
• Corporate TBL calculator
Reaction
• National launch (May 24th)
• Complex messages (shopping)
• Farming and food
• Problems (rice and forestry)
• Policy and ‘big business’
• Citizens