Embed Size (px)
Citation preview

The IPCC 4th assessment:Influence of Future Changes in Emissions
on Atmospheric Chemistry by 2030. Jérôme Drevet - Isabelle Bey
Frank Dentener - David Stevenson – Twan Van NoijeAnd all modelers:
J.F. Müller, Arlene Fiore, Tim Butler, Michael Gauss, Didier Hauglustaine, Kengo Sudo, Vincent-Henri Peuch, Oliver Wild, Veronica Montanaro, Jose M. Rodriguez, Martin G.
Schultz, Jean-François Lamarque
GEOS-CHEM meeting04-05-2004

IPCC – AR 4
The IPCC 4th Assessment Report (AR4) will be completed in 2006.
Chapter 7 will focus on Coupling between Changes in the Climate
System and Biogeochemistry.
2 experiments are performed:
• Experiment I (delta O3 - RF): Examines past changes in ozone (1850-
2000) and for the future (by 2100)
• Experiment II (AQ - climate): Examines changes in atmospheric
composition by 2030 using a variety of models (CTMs and CCMs).
- tropospheric ozone
- N-deposition
- NO2 columns

24 Models
IASBKNMITM4TM5MATCH-MPIC-NCEPMATCH-MPIC-ECNWFUIO2LMDzSTOCHEM-HadGEMSTOCHEM-HadAM3GEOS-CHEMGISS
MOCAGE FRSGC_UCI
ULAQ GMIDAO GMICCM MOZECH
LLNL MOZART4
STOCED UM_CAM
CHASER CTMCHASER GCM
GEOS v7.01.02
GEOS3 - 30 verticallevels
4°x5° horizontalgrid resolution

IPCC4 Scenarios
Sim ID emissions
Meteo Description CH4 concentration
S1 CLE-2000 2000 Baseline : Current Legislation of Emissions (CLE) for 2000
1760 ppbv
S2 CLE-2030 2000 CLE for 2030 2088 ppbv
S3 MFR-2030 2000 MFR (Maximum Feasible Reduction) for 2030 : optimistic technology scenario.
1760 ppbv
S4 A2-2030 2000 A2 (the most ‘pessimistic’ IPCC SRES scenario), harmonized with IIASA emissions for 2000
2163 ppbv
S4s A2-2030 2000 A2 with ‘high’ ship emissions 2163 ppbv
S5 CLE-2030 2030 Climate Change Simulation. Prescribed SST data for 2030
2088 ppbv

Anthropogenic Emissions
Agriculture Industry Domestic
Emissions
Traffic TOTAL
CO(Tg CO)
- 38-41 34-74
238-185 139-387
195-171 50-300
471-397 223-761
NMVOC(Tg NMVOC)
- 39-46 40-71
29-24 18-40
48-44 15-65
116-114 73-176
NOx
(Tg NO2)
- 34-36 11-57
5-6 4-15
53-65 28-107
92-107 43-179
SO2
(Tg SO2)
- 88-90 15-148
10-8 4-20
11-16 14-32
109-114 33-200
NH3
(Tg NH3)
53-71
71-74
0.5-0.8 0.8-0.8
6-7 7-8
- 60-79 79-83
CLE-2000 CLE-2030 MFR-2030 A2-2030

O3 annual zonal mean (CLE-2000)
Annual Zonal Mean O3 S1Mask O3>150ppbv
Courtesy: David Stevenson

O3 Budget (CLE-2000)
Values in Tg O3
Model Production Loss P-L Deposition Strat. Calc. Strat. Model.CHASER_CTM 5042 4594 447 948 501 517CHASER_GCM 5032 4620 412 948 536 506FRSGC 5135 4733 401 907 505 555GEOS-CHEM 4490 3770 719 1016 296 508GFDL 5263 5087 176 963 787 939GMICCM 5331 5059 272 862 590 557GMIDAO 5124 4940 184 763 579 541gmigis 4722 4396 326 856 530 537LLNL-IMPACT 5432 5160 271 1014 742 739LMDzINCA 4912 4182 729 1232 502 ***LMDzINCAc 4931 4027 903 1227 324 ***NCAR 4964 4670 293 906 612 684STOCHEM_HadAM3 5331 4821 509 945 435 383TM4 4806 4594 211 720 508 504TM5 4580 4623 -43 827 871 ***UM_CAM 3922 3363 558 1172 614 550MOZECH 6920 6617 303 963 660 ***STOCHEM_HadGEM 5114 3757 1356 1507 151 ***ULAQ 5017 3639 1377 1491 114 688Average 5056 4561 495 1014 519 586

Ozone zonal mean - ΔO3 (S2-S1)
-10 -5 0 5 10 ppbv
Courtesy: David Stevenson

Ozone zonal mean - ΔO3 (S3-S1)
-10 -5 0 5 10 ppbv
Courtesy: David Stevenson

Ozone zonal mean - ΔO3 (S4-S1)
-20 -10 0 10 20 ppbv
Courtesy: David Stevenson

Annual NOy Deposition (Tg N)
Courtesy: Frank Dentener

NOy Deposition (CLE-2000)
Courtesy: Frank Dentener
CHASER (FRCGC)
TM4 (JRC)MOZART4 (NCAR)
GEOS-CHEM
mg N/m2/year

NOy Deposition (S1) – zoom over Europe
CHASER (FRCGC)
TM4 (JRC)MOZART4 (NCAR)
GEOS-CHEM
Courtesy: Frank Dentener
mg N/m2/year

Wet Deposition / Total deposition
Courtesy: Frank Dentener

NOy Wet deposition Evaluation
Courtesy: Frank Dentener CHASER (FRCGC)
TM4 (JRC)MOZART4 (NCAR)
GEOS-CHEM
0 100 200 300 400 500 ( mgN / m2 / year) 0 100 200 300 400 500
0 100 200 300 400 500 ( mgN / m2 / year) 0 100 200 300 400 500
Observations - EMEF Observations - EMEF
Observations - EMEF Observations - EMEF
Model
Model
Model
Model
R=0.78
R=0.81
R=0.70
R=0.84

Annual NHx Deposition (Tg N)
Courtesy: Frank Dentener
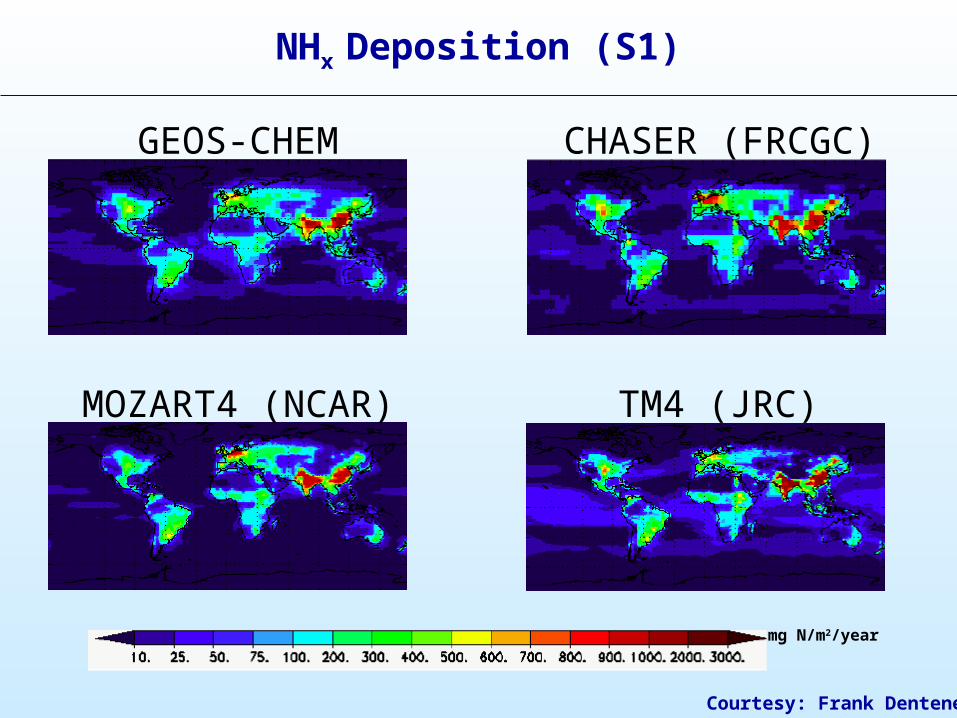
NHx Deposition (S1)
Courtesy: Frank Dentener
CHASER (FRCGC)
TM4 (JRC)MOZART4 (NCAR)
GEOS-CHEM
mg N/m2/year

Wet deposition/Total Deposition
Courtesy: Frank Dentener

N-Deposition in GEOS-CHEM: Comparisons between different runs
NOy Total deposition
0
10
20
30
40
50
60
70
Simulations
Tg
N /
ye
ar
1996 (GEOS-STRAT - 4x5- standard emissions)
1996 (GEOS-STRAT -2x2.5 - standardemissions)
2000 (GEOS3 - 4x5 -standard emissions)
2000 (GEOS3 - 4x5 - CLE-2000 emissions)
2001 (GEOS4 - 2x2.5 -standard emissions)
Wet deposition / Total deposition
0
0.1
0.2
0.3
0.4
0.5
0.6
simulations
1996 (GEOS-STRAT - 4x5- standard emissions)
1996 (GEOS-START -2x2.5 - standardemissions)
2000 (GEOS3 - 4x5 -standard emissions)
2000 (GEOS3 - 4x5 - CLE-2000 emissions)
2001 (GEOS4 - 2x2.5standard emissions)
NHx Total deposition
0102030405060708090
Simulations
Tg
N /
yea
r
1996 (GEOS-STRAT -4x5 standard emissions)
1996 (GEOS-STRAT -2x2.5 - standardemissions)
2000 (GEOS3 - 4x5 -standard emissions)
2000 (GEOS3 - 4x5 -CLE-2000 emissions)
2001 (GEOS4 - 2x2.5standard emissions)
Wet deposition / Total deposition
0
0.1
0.2
0.3
0.4
0.5
0.6
0.7
0.8
Simulations
1996 (GEOS-STRAT -4x5 - standardemissions)
1996 (GEOS-STRAT -4x5 standard emissions)
2000 (GEOS3 - 4x5standard emissions)
2000 (GEOS3 - 4x5 -CLE-2000 emissions)
2001 (GEOS4 - 2x2.5standard emissions)

NO2 column
Courtesy: Twan Van Noije

O3 simulation : - GEOS-CHEM is in the middle range in general - Production and loss rates in the low range- Decrease in concentration for the MFR-2030 scenario in the very high
range. Problem ?- In general it seems that the differences between all models are smaller
than for the previous IPCC.
Deposition :- NOy and NHX Global values and patterns in the middle range- Ratio wet deposition/total deposition in the low range. - Ratio wet deposition/total deposition varies a lot with the version of
GEOS meteorological fields.- Sulfur deposition in the middle range
Conclusion

The End
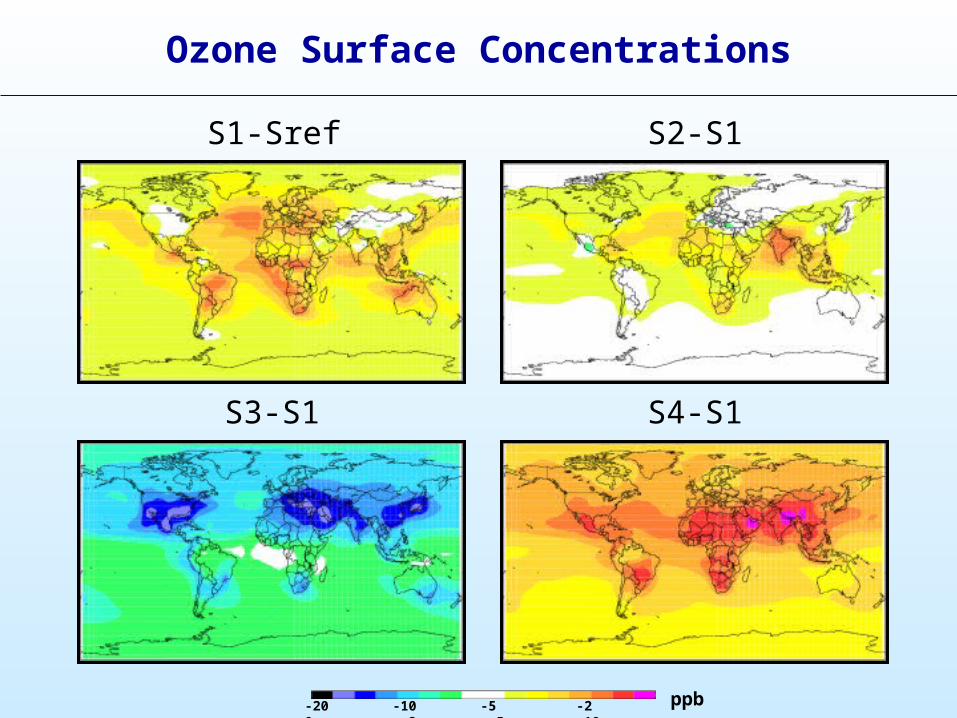
Ozone Surface Concentrations
S1-Sref S2-S1
S3-S1 S4-S1
-20 -10 -5 -2 0 2 5 10 20
ppb

Ozone Column
S1-Sref S2-S1
S3-S1 S4-S1
-15 -7 4 2 0 2 4 7 15
DU

N Emissions
0 0.001 0.002 0.005 0.01 0.02 0.05 0.1 0.2 0.5 1 2 5gN/year
NOx NH3
IIASA-CLE-2000

S1-Sref S2-S1
S3-S1 S4-S1
-5 -0.5 -0.05 -0.005 0 0.005 0.05 0.5 5 gN/m2/year
NOx emissions
S1-Sref S2-S1
S3-S1 S4-S1
-5 -0.5 -0.05 -0.005 0 0.005 0.05 0.5 5 gN/m2/year
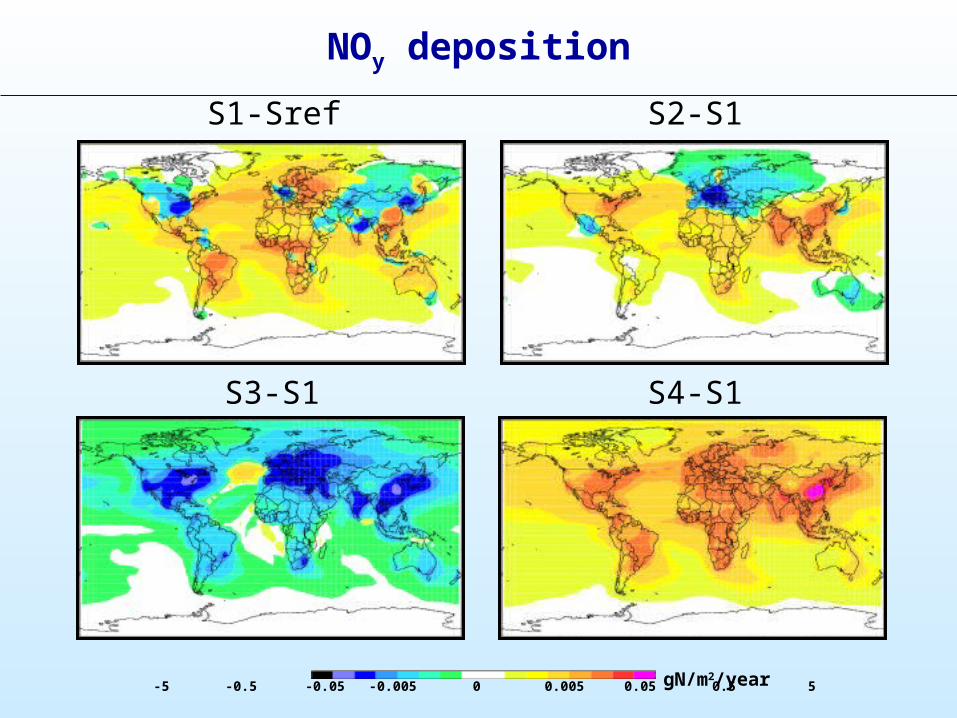
NOy deposition

S1-Sref S2-S1
S3-S1 S4-S1
-5 -0.5 -0.05 -0.005 0 0.005 0.05 0.5 5 gN/m2/year
NH3 emissions

S1-Sref S2-S1
S3-S1 S4-S1
-5 -0.5 -0.05 -0.005 0 0.005 0.05 0.5 5 gN/m2/year
NHx deposition