Embed Size (px)
Citation preview
Clay Minerals (1989) 24, 393-410
T HE ION C O N T E N T A N D M I N E R A L O G Y OF A N O R T H SEA C R E T A C E O U S S H A L E F O R M A T I O N
T. G . J. J O N E S , T. L. H U G H E S AND P. T O M K I N S
Schlumberger Cambridge Research, High Cross, Madingley Road, Cambridge CB3 0HG
(Received 2 June 1988; revised 7 February 1989)
ABSTRACT : The shale from the Witch Ground Graben in the North Sea consists mostly of clay and calcite with relatively small amounts of quartz and plagioclase. The clay mineralogy is dominated by smectite and illite with varying amounts of chlorite and kaolinite. The ion composition was determined by ion chromatography, the porewater anions and cations being removed by leaching the shale with water, while the exchange cations were removed by reacting the shale with a large excess of tetramethylammonium ions. The clay mineralogy from XRD is consistent with the measured values of CEC. The water content and wireline log conductivity of the shale is controlled largely by the CEC (i.e. clay mineralogy). The cation content of the shale section is dominated by Na, with only small concentrations of K, Mg and Ca ions. The total anion concentration, which is dominated by chloride, shows an inverse relation to the concentration of exchange sites in the shale, suggesting that the compaction of the shale is to some extent controlled by a Donnan or salt-exclusion mechanism. Application of the Donnan equilibrium led to the reasonable conclusion that the shale is in compactional equilibrium with an external reservoir of about four times the anion content of seawater. The extent of salt exclusion in the shale is relatively low--a consequence of the high salt concentration in the external formation and the relatively low concentration of exchange sites in the shale.
Shales, defined as sedimentary rocks with a clay content in excess of ~ 40% (Shaw & Weaver , 1965), continue to be a major source of interest and uncertainty in petroleum geology, geochemistry and sedimentary geology in general. The burial and compact ion of shales are considered to play a major role in fluid migrat ion (Burst, 1969; Magara , 1978; Hinch, 1980; Bruce, 1984; Lindgreen, 1985) and overpressure development (Magara , 1975; Carstens & Dypvik, 1981), and to act as sources of both organic and inorganic reactive components (Moncure et al., 1984). The diagenetic processes in shales, part icularly the smectite to illite transit ion (Hower et al., 1976; Dypvik , 1983; Howard & Roy, 1985; Pollastro, 1985; Hall et al., 1986; Colten-Bradley, 1987), continue to at t ract attention. The expulsion of ions and water from shales during compact ion is considered to be an impor tant influence on the chemical composit ion of formation waters in adjacent permeable sediments (White, 1965; Berry, 1969; Graf , 1982).
The high concentrat ion of clays in these rocks, and resulting high density of cation- exchange sites, allows a shale to act as ion-exchange membrane, albeit a compressible membrane, which can give rise to such phenomena as osmosis (Young & Low, 1965; Marine & Fritz, 1981 ; Fr i tz & Marine, 1983; Fri tz, 1986), selective ion filtration and salt exclusion (McKelvey & Milne, 1960; Milen et al., 1963; Hanshaw & Zen, 1965; Hanshaw & Coplen, 1973; Kha raka & Smalley, 1976; Benzel & Graf , 1984; Haydon & Graf , 1986). A consequence of the membrane behaviour of shales is that the expulsion of water and ions will depend not only on the ion composi t ion of the shale (i.e. the exchange cations and the porewater ions), but also on the chemical composit ion of the reservoir into which the shale is
�9 1989 The Mineralogical Society

394 T . G . J . Jones et al.
expelling the electrolyte solution. The establishment of (or the attempt to establish) physico- chemical equilibrium between these mobile species in the shale and an external reservoir gives rise to constraints on the ion composition of the shale. The loss of water during compaction will be accompanied by systematic changes in the porewater composition determined by the anion concentration. Two such contraints on the attainment of a compaction equilibrium are the establishment o fa Donnan distribution (Helfferich, 1962) of ions between the shale and the reservoir, and the existence of an equilibrium swelling pressure to compensate for the equilibrium composition difference. Neither of these two constraints has received much attention in the modelling of shale compaction and the generation of overpressure.
The existence of a Donnan (salt exclusion) equilibrium between a shale and an external reservoir such as a sandstone will generally result in discontinuities of ion composition at the sand-shale bed boundary. Examples of such discontinuities have recently been reported by Brightman et al. (1985) for limestone-shale sequences in the Jurassic and Cretaceous formations of southern England. The salt exclusion equilibrium can act either to restrict entry of ions into the shale from the sandstone, or to restrict the expulsion of ions from the shale. The former type of restriction gives rise to the usual Donnan distribution of ions and would result in the ion concentration in the sandstone exceeding that in the porewater of the shale for each anion and cation. The latter type of restriction arises from the thickness of shale through which the ions are expelled; highly charged anions such as sulphate and carbonate, which would be preferentially expelled, are increasingly retained by the shale at higher concentrations than a simple Donnan equilibrium would predict. The high anion content of shales in these conditions would be explained in terms of the Donnan theory by ascribing to them a low activity coefficient.
The objective of this paper is to examine the mineralogy, water content and ion composition (porewater ions and exchange cations) of a shale section of Cretaceous age from the North Sea and to determine the factors affecting the compaction of the shale. In particular, an attempt is made to demonstrate that membrane-like processes are to some extent controlling the compaction of the shale and its ion content. The relationship between mineralogy and total ion content is also investigated and an attempt is made to correlate the mineralogy and ion content of the shale with the wireline conductivity and gamma-ray logs.
The present study can be compared with a number of earlier studies of the ionic composition of shales concerned with the determination of the porewater composition of these rocks. A common method of extracting the porewater from the shale has been by use of a squeezing cell (Murthy & Ferrell, 1972; Manheim, 1974; Brightman et al., 1985), although the composition of the extract depends on the extent of the compaction. This variation is typical of a compactible ion-exchange membrane and can be explained in terms of the Donnan equilibrium (Smith, 1977; Appelo, 1977). A weakness of the analysis of a shale pore- fluid obtained by extraction is the neglect of the shale's exchange cations, which form a part of the total ion composition and which will be in equilibrium with the porewater cations. The approach adopted in this work is the separate determination of the water content and the total ion composition, with no attempt to partition the total cation content into porewater cations and exchange cations.
D E S C R I P T I O N OF S H A L E S E C T I O N A N D S A M P L E C O L L E C T I O N
The shale cuttings were recovered from a well drilled in the Witch Ground Graben area of the North Sea. The shale formation, which is about 350 ft thick, is of Lower Cretaceous age.

1on content and mineralogy of North Sea shale 395
The cuttings were recovered from the drilling fluid on the shaker screen at a known time which was converted to sample depth from knowledge of the cuttings' lag time and variation of drilled depth with time. The mud was carefully removed from the surface of the cuttings, together with any material visibly altered by contact with the fluid. Most of the shale cuttings showed signs of some surface alteration in transport to the surface, probably caused by the adsorption of water and ions from the drilling fluid. The inner core of the shale cuttings was assumed to be unaltered by the drilling fluid and representative of the in situ composition of the shale. The inner part of the cuttings was preserved by sealing in both air-tight polythene bags and small gas chromatography head-space bottles sealed with butyl rubber septa. The validity of the assumption that the central core of the cuttings has been unaffected by invasion from the mud filtrate can be verified by comparison of the ionic composition of the cuttings with that of the drilling fluid.
E X P E R I M E N T A L
The analysis of the shale cuttings falls into two main categories: chemical composition (principally by ion chromatography) and mineralogy by X-ray diffraction (XRD). Fifteen cuttings samples were analysed for chemical composition and seven of these samples were analysed by XRD.
Chemical analysis
Water content. The water content of the cuttings samples was determined by drying to constant weight at 105~ The water content w is expressed as the weight of water per unit weight of dry shale matrix (kg/kg), a correction having been made for the weight of evaporated salt from the pore-fluid.
Porewater composition. The porewater (or water-soluble) anions and cations were removed from a known weight of dry cutting by leaching with a known volume of deionized water. Typically, 2 g of a dry and crushed cutting was washed with 2 x 40 ml aliquots which were then combined. Concentrations of the anions and cations were determined by ion chromatography (see below), and the ion content expressed as moles of ion per kilogram of dry shale matrix (mol/kg).
Carbonate content by acid dissolution. A known weight of a dry, leached cutting was reacted with a known volume of 0.5 M HCI. The acid filtrate was analysed for Ca and Mg by ion chromatography; the acid insoluble residue was washed and dried to determine the weight loss. Ca and Mg in the cuttings, corrected for the removal of exchange cations, were assumed to be present as carbonate.
Cation-exchange capacity. The CEC of the shale cutting was determined by measuring the release of cations when a known weight of dry, washed (but not acid treated) cuttings was reacted with an excess of tetramethylammonium cations. Typically, 2 g of a dry and crushed cutting was reacted with 2 • 40 ml aliquots of 0.5 M tetramethylammonium bromide (at neutral pH). The two aliquots were combined and diluted by a factor of at least 50. The diluted reaction solution was analysed for monovalent and divalent cations and anions using ion chromatography. The CEC is the summation of the released exchange cations less any residual anions detected in the reaction solution, and is reported as moles of monovalent exchange sites per unit-weight of dry shale matrix (mol/kg).

396 T . G . J . Jones et al.
Ion chromatography analysis. Analysis of cations by ion chromatography was performed on a Dionex 2020i system (Dionex, Camberley, UK) using a chemical suppressor. The cation suppression system consisted of a cation micromembrane suppressor using 0.1 i tetrabutylammonium hydroxide as regenerant. The monovalent cation eluent was 0.01 i HC1 with a flow rate of 1.5 ml/min. The divalent cation eluent was 0-002 M HCI with 0-002 M phenylenediamine dihydrochloride (Fluka chemicals) at a flow rate of 1-5 ml/min.
Two different techniques were used to determine the anion concentration, a chemically suppressed and a chemically unsuppressed (or single-column) technique. The chemically suppressed technique used the Dionex 2020i system with an anion micromembrane suppressor with 0-025 i H2SO4 as regenerant. The anion eluent was a solution of 0-0018 M Na2CO3 and 0-0017 u NaHCO 3 with a flow rate of 1.5 ml/min.
Chemically suppressed ion chromatography techniques are often not suitable to determine the concentration of anions of weak acids such as carbonate. The chemically unsuppressed technique consisted of replacing the anion micromembrane suppressor and Dionex conductivity detector with a Shimadzu HIC-6A electronically suppressed conductivity detector. The eluent was 0.0025 i NaOH (BDH Aristar grade) at a flow rate of 1-5 ml/min.
XRD analysis
XRD analysis of the cuttings was performed on three sample types to give a whole-rock analysis, and 16-2 #m and < 2/zm size fraction compositions. The whole-rock analysis was performed on randomly-oriented powdered samples of the untreated cuttings. The size- fraction analyses were performed on samples with the acid-soluble phases (principally calcite) removed by treatment with 109/o acetic acid. Clay mineral analysis in the two size fractions was performed after saturation of the exchange sites with Mg, ethanediol solvation and heating to 400~ The two size fractions were prepared for XRD as oriented films on glass-fibre pads.
R E S U L T S
Mineralogy and water content
Table 1 shows the results of the XRD cuttings analysis. The non-clay minerals, determined from whole-rock analysis, were calcite, quartz and plagioclase; the total clay content was also determined from the whole-rock analysis. The clay mineralogy of the two size fractions is
TABLE 1. Mineralogy of Cretaceous shale.
Depth (f t ) Ca lc i t e Q u a r t z Plagioclase Smectite Illite Chlor i te Kaolinite
7412 71" 5 2 15 4 0 3 7450 67 4 2 14 10 0 3 7553 27 9 2 40 16 1 4 7598 26 14 3 28 20 9 1 7647 22 15 4 24 22 6 7 7685 26 19 4 23 13 2 12 7737 36 14 4 20 11 5 9
* All mineral concentrations given in Wt~.

1on content and mineralogy of North Sea shale 397
CALCITE(%) SMECTITE(%) ILLITE(%) CEC (mol/kg) W (kg/kg) COND. (S/m) 7 - RAY (API) 30 60 20 40 10 20 0-2 0.4 0;1 0,2 0,3 1 2 30 60
7400 ' ' ' ~ ' ' ' ' ' "
7500- /
7600-
/ / ' / 7700- ,~ /
7750
FIG. 1. Composite log of Cretaceous shale formation showing the depth variation of calcite, smectite and illite (wt% from XRD), cation-exchange capacity (CEC) and water content (w),
and formation conductivity and natural gamma-ray activity (wireline logs).
expressed as a fraction of the total mineral content. There is considerable variation in mineralogy through the shale section, particularly in the relative content of clay and calcite. The total smectite content of the shale reaches a maximum value of 40% at 7553 ft while the total illite content has a maximum value of 22% at 7647 ft; the calcite content reaches its minimum content at this latter depth. The quartz and plagioclase contents generally increase with depth.
Fig. 1 is a composite log of the shale section which shows the variation of CEC and smectite, illite, calcite and water contents with depth; the wireline conductivity and gamma- ray logs are shown for comparison. The measured CEC of the cuttings accurately reflects the clay mineralogy determined by XRD. Assuming that the only significant contributions to the measured CEC are from smectite and illite, the shale CEC can be calculated from
CECcal r = W s.CECs + W i.CECi
where Ws and Wi are the weight fractions of smectite and illite, respectively, determined by XRD, and CECs and CECi are the CEC values of the pure clay minerals. Fig. 2 shows a comparison between the measured and calculated CEC values, using 0.8 mol/kg and 0.1 mol/kg for CEC~ and CEC~, respectively; for example, the cutting from 7598 ft has a measured CEC of 0.22 mol/kg and a calculated value of 0.24 mol/kg.
The composite log (Fig. 1) shows that the wireline conductivity and weight-fraction water content correlate well with the cuttings CEC. The variation of water content with CEC (Fig. 3a) shows the water content approaching a limiting value of ~0.31 at high CEC, which corresponds to a porosity of 45% assuming a matrix density of 2700 kg/m 3. A likely cause of the lower than expected values of w is a slight drying of the high-water-content cuttings samples. The conductivity is approximately linear in the exchange capacity (Fig. 3b),

398 T . G . J . Jones et al.
0.5
~ 0,4
g 0.s
L) r~ t.u < 0.2'
0.1'
CEC,,,o = 0.71CEC~, + 0-07
i
0 0.1 0.2 0'.3 0:4 0.5 MEASURED CEC (mol/kg)
FIG. 2. Comparison of calculated and measured CEC. The linear regression best-fit to the data is shown (correlation coefficient = 0.99).
0 " 4
0.3
0.2 v
0.1
�9 �9 O D O
O D
D
Q
(a)
0 0'-1 0:2 0:3 0;4 0'.5 CEC (mol/kg)
2-5 (b)
B.7CEC-O.07 /co 2-0 �9 �9 ND = �9 �9 �9
~ 1-5 " . t
z o 1.0 (.}
0.5
,
0 0.1 0.2 03 0.4 0.5 CEC (mol/kg)
FIG. 3. (a) Dependence o f water content o f shale on C E C ; (b) var ia t ion o f w i re l ine conduct iv i ty of shale with CEC, showing best-fit linear regression (correlation coefficient = 0.83).

Ion content and mineralogy of North Sea shale 399
although there is some scatter in the data at the higher values of CEC. A linear regression best fit of the data estimates that the conductivity changes by 6.7 S/m per unit change in CEC. The intercept of the regression analysis is sufficiently close to zero to imply that the porewater ions make a negligible contribution to the formation conductivity. This surprising finding is examined further in the Discussion. The wireline gamma-ray response broadly correlates with clay content, as measured by the CEC (Fig. 4a), although the peak in the gamma-ray log (7620 ft) occurs significantly below the maximum in the CEC (7553 ft). An improved correlation is seen between the gamma-ray log and the iUite content (Fig. 4b), indicating that the gamma-ray log is largely responding to the K fixed in the illite (Serra, 1984).
Table 2 shows a comparison between the XRD calcite content of the cuttings and the weight loss on treatment with hydrochloric acid. There is generally good agreement (within 8 ~ of the weight of the cutting) between the two measurements, suggesting that calcite is the principal acid-soluble mineral. Analysis of the acid filtrate for Ca and Mg, however, revealed that the weight loss on acid treatment was not always accounted for by carbonate dissolution, although the trends in the three estimates of calcite were similar. The identity of the
0 " 4 '
0 . 3 '
E 0-2. ~J
0.1"
0
25'
20-
a
15-
- J 10-
2"0 4'o 6'0 do ~, - R A Y ( A P I )
I
Q
(a)
i
lOO
(b)
o 20 ,;o ~o 8'o loo -~ - R A Y ( A P I )
FIG. 4. (a) Relationship between CEC and wireline gamma-ray log; (b) relationship between illite content of shale (wt~o from XRD) and wireline gamma-ray response.
400 T. G. J. Jones et al.
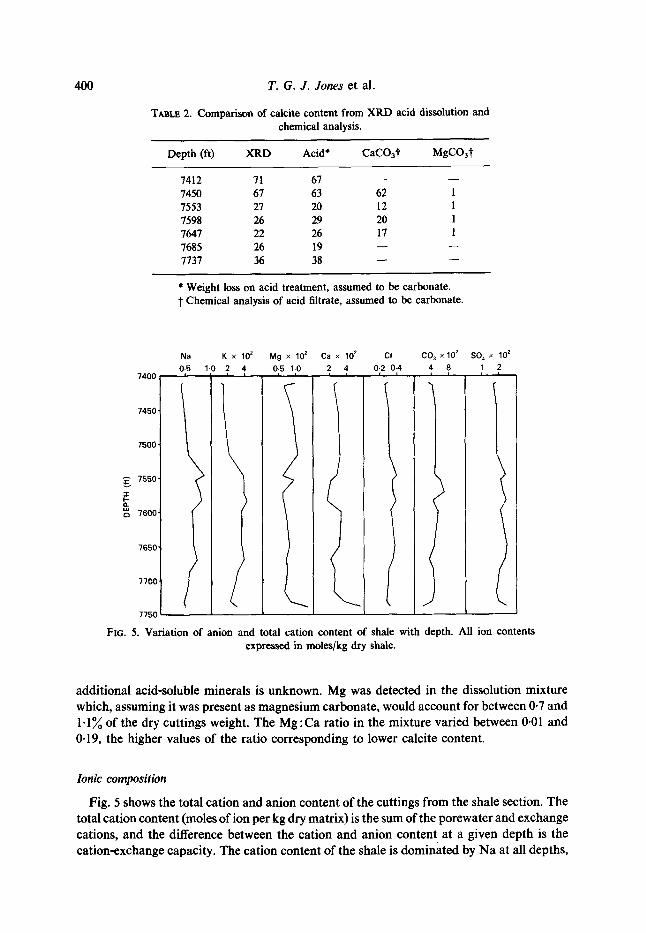
TABLE 2. Comparison of calcite content from XRD acid dissolution and chemical analysis.
Depth (ft) XRD Acid* CaCO3~f MgCO3t
7412 71 67 - - - - 7450 67 63 62 1 7553 27 20 12 1 7598 26 29 20 1 7647 22 26 17 1 7685 26 19 - - - - 7737 36 38 - - - -
* Weight loss on acid treatment, assumed to be carbonate. t Chemical analysis of acid filtrate, assumed to be carbonate.
Na x 10 :~ Mg x 102 Ca 102 CI COz • SO 4 • 10 z
0.5 1.0 4 0-5 1.0 4 0.2 0.4 4 8 1 2 7400 ' i i , i f = i =
7500' t
. / [
�9 / r., 7600
I , 7650 I /
7750
FiG. 5. Variation of anion and total cation content of shale with depth. All ion contents expressed in moles/kg dry shale.
addi t ional acid-soluble minerals is unknown. Mg was detected in the dissolution mixture which, assuming it was present as magnesium carbonate, would account for between 0-7 and 1.1% of the dry cuttings weight. The M g : C a rat io in the mixture varied between 0.01 and 0.19, the higher values of the rat io corresponding to lower calcite content.
Ionic composition
Fig. 5 shows the total cation and anion content of the cuttings from the shale section. The total cat ion content (moles of ion per kg dry matrix) is the sum of the porewater and exchange cations, and the difference between the cat ion and anion content at a given depth is the cation-exchange capacity. The cation content of the shale is dominated by N a at all depths,

Ion content and mineralogy of North Sea shale 401
the K, Mg and Ca contents always being small in comparison. The anion content of the shale consists largely of chloride, although significant quantities of sulphate and carbonate are present. Trace levels of ammonium and nitrate were detected in some porewater samples but were not quantified.
A notable feature of Fig. 5 is the difference in the variation of the cation and anion content through the shale section. The total cation content (largely Na) clearly follows the cation- exchange capacity while the anion content only weakly reflects the changes in CEC through the shale section. This difference is emphasized in Fig. 6 which shows the dependence of the total cation and anion charge (the sum of the product of ion content and ion valency) on CEC. The gradient of a best-fit linear regression analysis of the cation data is about three times that of the corresponding anion data. An attempt to explain the anion content of the shales is made in the next section.
Table 3 presents a summary of the ion composition of several cuttings samples through the shale section. Two notable trends in the data are the increase in the K/Na and SO4/C1 ratios. The Mg/Ca ratio reaches its maximum values in the depth interval 7550-7580 ft which broadly corresponds to the region of maximum CEC and minimum calcite content. Variations in ion content (Fig. 5) through the shale section generally correlate in pairs: Na and K, Ca and Mg, and chloride and sulphate. The exception is the carbonate content which shows an inverse relationship with the total Ca content. The carbonate content in turn shows a good correlation with the CEC, the region of high CEC corresponding to a high porewater carbonate content.
1 -0
0 . 9
0 . 8 -
E v ua 0 . 7 4 r~ t~
~3
0 - 6 '
v -
0 . 5 �84
0 - 4 "
oo
o
o
~
Q o Q
O
Q
FIG. 6. Dependence of the total cation (open circles) and anion (closed circles) content on CEC.
I 0 o) l oT2 0'-3 0)4 o.5
CEC (mol/kg)

402 T. G. J. Jones et al.
TABLE 3. Ion content* of Cretaceous shale.
Depth (ft) Na t Kt K/Na Mgt Cat Mg/Ca C1 CO 3 SO~ SOJC1
7409 0.433 0.012 0.028 0.009 0.029 0.310 0.286 0.034 0-018 0-063 7450 0-476 0-015 0-032 0-009 0-030 0-300 0-297 0-050 0.018 0.061 7553 0.699 0.037 0.053 0-009 0-021 0.439 0.336 0.060 0.021 0.062 7647 0.647 0.036 0"056 0.008 0.031 0-258 0.360 0.046 0.025 0.069 7737 0.496 0.030 0.060 0.013 0-056 0.232 0-310 0.021 0.024 0.077 Mud�82 -- -- 0.013 -- -- 5 -- -- - - 0.041
* Ion content expressed in moi/kg. t Total cation content. �82 Average ion ratios in mud filtrate.
The range of values of the cation and anion ratios can be compared to the values measured in the drilling fluid to estimate the extent to which the cuttings composition has been altered by swelling and ion exchange/salt sorption. The average values of the anion and cation ratios in the mud filtrate (similar in composition to seawater) are shown in Table 3. The ion ratios in the mud f_ltrate are significantly different to those measured in the cuttings, indicating that the cuttings samples analysed are representative of the in situ composition. For example, the average Mg/Ca ratio in the mud filtrate is 5 while the range of this ratio in the cuttings is 0.21 to 0.44. Karlsson et al. (1978) and Dypvik (1981, 1983) have discussed the possible contamination of cuttings by drilling fluids in the determination of the clay mineralogy and ion composition of North Sea shale formations.
I O N I C C O N C E N T R A T I O N S A N D S H A L E C O M P A C T I O N
The measurement of the water content w (kg of water per kilogram of dry shale) of the cuttings enables the concentration of ions in the shale to be determined. The molal concentration of the ions in the shale, expressed as moles per kg water, can be simply obtained by dividing the ion content (moles per kg dry shale) by the water content w. The cation-exchange capacity can also be expressed as a molal concentration A (= CEC/w) of exchange sites per kg of water, enabling the exchange cations to be presented in the same concentration units as the porewater ions.
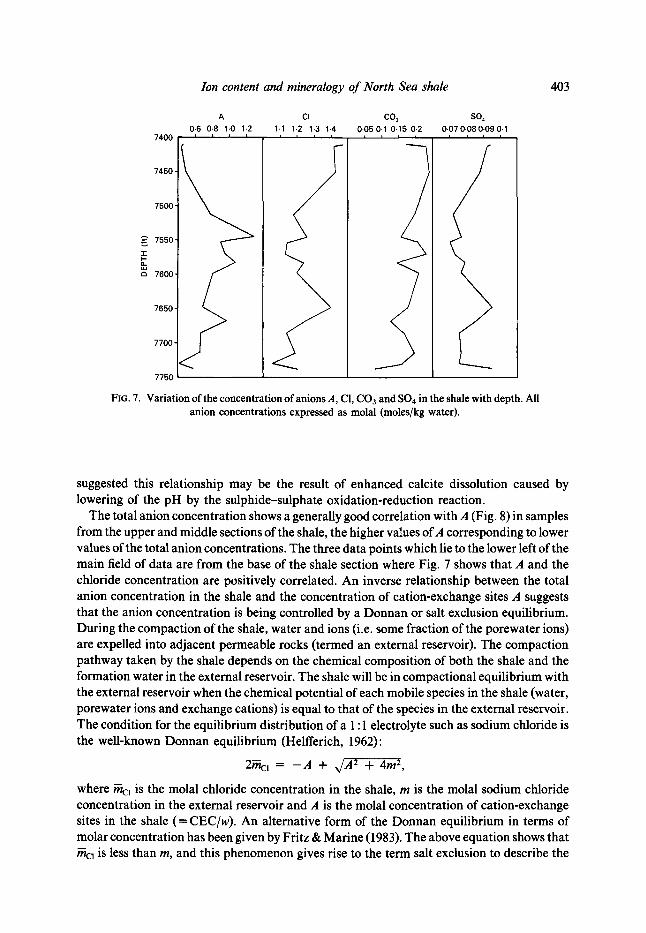
Fig. 7 shows the variation of the chloride, sulphate and carbonate ion concentrations through the shale section, together with the concentration of exchange sites A. The total anion concentration (i.e. the total anion charge (Fig. 5) divided by the water content) through the shale section varies between 1.53 molal and 2.08 molal which is an average of about three times the total seawater anion concentration. The concentrations of chloride, carbonate and sulphate through the shale section show a generally inverse relationship with A, although below ~ 7680 ft the chloride and sulphate concentrations follow the value of A. Within the global changes of the anion concentration, the fine structure of both the chloride and sulphate concentrations show a positive correlation with A whereas the carbonate concentration consistently shows an inverse correlation. These features are particularly marked between 7530 and 7630 ft where there appears to be a weak inverse relationship between carbonate and sulphate concentrations. Kramer (1969) has observed a weak inverse relation between the carbonate and sulphate concentrations of porewaters in various lithologies. Kramer
7400
7450-
el 1.1 1.2 1.3 1.4
C03 0-05 0.1 0.15 0.2
I i i
A 0-6 0.8 1.0 1.2
I I I I
7650-
7700-
7750
7550"
7600-
7500"
S04 0.07 0.08 0-09 0-1
t i i i
<
Ion content and mineralogy of North Sea shale 403
FIG. 7. Variation of the concentration of anions A, C1, C O 3 and SO4 in the shale with depth. All anion concentrations expressed as molal (moles/kg water).
suggested this relationship may be the result of enhanced calcite dissolution caused by lowering of the pH by the sulphide-sulphate oxidation-reduction reaction.
The total anion concentration shows a generally good correlation with A (Fig. 8) in samples from the upper and middle sections of the shale, the higher values of A corresponding to lower values of the total anion concentrations. The three data points which lie to the lower left of the main field of data are from the base of the shale section where Fig. 7 shows that A and the chloride concentration are positively correlated. An inverse relationship between the total anion concentration in the shale and the concentration of cation-exchange sites A suggests that the anion concentration is being controlled by a Donnan or salt exclusion equilibrium. During the compaction of the shale, water and ions (i.e. some fraction of the porewater ions) are expelled into adjacent permeable rocks (termed an external reservoir). The compaction pathway taken by the shale depends on the chemical composition of both the shale and the formation water in the external reservoir. The shale will be in compactional equilibrium with the external reservoir when the chemical potential of each mobile species in the shale (water, porewater ions and exchange cations) is equal to that of the species in the external reservoir. The condition for the equilibrium distribution of a 1 : 1 electrolyte such as sodium chloride is the well-known Donnan equilibrium (Helfferich, 1962):
2K'tCl = --A + ~/A 2 + 4m 2,
where Vncl is the molal chloride concentration in the shale, m is the molal sodium chloride concentration in the external reservoir and A is the molal concentration of cation-exchange sites in the shale ( = CEC/w). An alternative form of the Donnan equilibrium in terms of molar concentration has been given by Fritz & Marine (1983). The above equation shows that ~ncl is less than m, and this phenomenon gives rise to the term salt exclusion to describe the

404 T . G . J . Jones et al.
2.2
2.0 �84
g cJ z 0 t.) z 1.8' 0 z <
1.6.
1.4
0
o
4 014 0~6 0~a 110 1~2 1~4
A (molal)
FIG. 8. Dependence of total anion concentration on the exchange site concentration A.
Donnan equilibrium. Clearly the excluding properties of the shale increase as A increases, i.e. the CEC of the shale increases or its water content decreases. The salt-excluding properties of the shale are diminished if the external electrolyte concentration m is considerably greater than A.
The Donnan equilibrium can be rewritten as
m 2 ----- m c l ( ~ l c 1 -~- A)
which enables the anion concentration of the external reservoir to be calculated at each depth from measured values of K'lcl and A. The Donnan equilibrium can be used to demonstrate compaction equilibrium in a shale section if at each depth the calculated concentration m of the external reservoir is constant and independent of clay mineralogy, water content and porewater concentration K'~Cl. In applying the Donnan equilibrium several assumptions are made: (i) all of the anions in the shale are considered to be monovalent, i.e. the total anion charge is assumed to be chloride; (ii) the ratio of the activity coefficients of the salt in the shale and the external reservoir is assumed to be unity, as implied by the form of the above equation. Fig. 9 shows the variation of the concentrations A, n'/CI and the calculated value of m (from the Donnan equilibrium) through the shale section. The calculated external reservoir composition shows a little less variation than ~CI through the shale section, but still continues to follow the total anion content in the shale. The range of the equivalent chloride ion concentration in the external reservoir is in the range 1.72 to 2.31 molal which is an average of about 3.5 times the total anion concentration in seawater.

0
7400
7500'
t - ,.=, o 7600.
7700"
Ion content and mineralo~gy., of ~~ Sea shale
ANION CONCENTRATION (molal)
0.5 1.0 1.5 2.0 2.5 i i a i i
A mc l m
405
FIG. 9. Variation of A, the total anion concentration ~Cl of the shale and the calculated total anion m of the external reservoir through the shale section.
The extent of the salt-exclusion equilibrium is generally smaU, the ratio mc1/m varying between 0.76 and 0.91. The high electrolyte concentrations measured in the shale, compared to the smaller values of A, are expected to give rise to only modest salt exclusion by the shale. The lower values of the ratio occur in the central region of the shale section where the CEC and water content (and hence A) are larger.
D I S C U S S I O N
A reasonable conclusion which can be drawn from the variation of clay mineralogy, water content and ion composition through the shale section is that the shale is close to compactional equilibrium with an external reservoir of about 3.5 times the concentration of seawater. The relatively high concentrations of carbonate and sulphate measured in the Cretaceous shale suggests that they may have been concentrated by a Donnan restriction mechanism. Although neither the location of the reservoir nor the composition of its formation water is known, the estimated salinity of the reservoir gives a formation water resistivity (RI) of 0.08 Dm at 15.8~ (60~ a value which has been observed in both Upper Cretaceous and Upper Jurassic formations in the North Sea (SPWLA, 1984).
The main factors controlling the ion content of the shale are the parameter A (the CEC and the water content) and the composition of the external reservoir. The water content w is determined by the CEC, and the parameter A which determines the ion distribution during compaction is a function of CEC only. The establishment of a compactional equilibrium between the shale and an external reservoir has probably been facilitated by the high
406 T .G .J . Jones et al.
electrolyte concentration in both formations since the transport coefficients of water and ions (i.e. permeability and diffusivity) in clays and shales increase significantly with electrolyte concentration (Van Olphen, 1977). The high electrolyte concentration in the shale causes the clays to flocculate, giving rise to a more porous fabric than found with clays compacted in the presence of low electrolyte concentration. It is expected that compactional equilibrium will be more difficult to attain in less saline environments where the transport coefficients are lower.
The establishment of compactional equilibrium between the shale and some external reservoir has occurred despite large variation in the electrical conductivity and water content (porosity) through the shale section. The usual interpretation of anomalously high conductivity and porosity (water content) gradients in shale sections is that they are overpressured, i.e. the high pore pressure is associated with a high porosity which gives rise to anomalously high formation conductivity. This study shows that variations in the clay mineralogy through a shale section can give rise to variations in water content, ion content and conductivity which may be unrelated to overpressure phenomena.
An indication of the mobility of the ions in the shale can be obtained from the wireline conductivity response as a function of ion composition. Despite the high porewater concentration, Fig. 3b shows that the electrical conductivity of the shale is almost proportional to CEC, with apparently little contribution from the porewater ions. The apparently low conductivity of the porewater ions can result from either low ionic mobilities or a highly tortuous pore structure. The decrease in the contribution of the porewater ions to the conductivity of the shale is supported by the experimental work of Cremers (1968) who showed that the conductivity of compacting clays becomes largely independent of porewater concentration when values of w of about 0.4 are reached. A low ionic mobility suggests that the porewater ions have a low thermodynamic activity and are characterized by a low activity coefficient (Gast & Spalding, 1966). The inclusion of activity coefficients into the Donnan equilibrium for the partition of sodium chloride between a shale and an external reservoir gives
~/A 4m2 2mcl = - A + 2 + ( f +)____~,
wheref -+ is the ratio of activity coefficients of sodium chloride in the shale and the external reservoir, and assumed to be unity in the simple Donnan theory. Appelo (1977) found values o f f -+ as low as 0.15 for sodium chloride in compacted bentonites, indicating that the porewaters are demonstrating grossly non-ideal behaviour.
The present study can be compared to several other studies concerned with the measurement of the ion content of shales. Hedberg (1967) measured the chloride content of a number of shale and adjacent sandstone formations, although no attempt was made to determine the presence of carbonate or sulphate. From analysis of chloride concentrations in several sand-shale sequences the ratio fflcl/m was found to lie in the region 0.4--0.5, where the average chloride concentration in the sandstone formations ranged from 1.10 molal to 2.85 molal. The shales analysed by Hedberg are therefore showing salt exclusion to a greater extent than the North Sea Cretaceous shale. Hedberg applied the Donnan equilibrium (with f-+ = 1) to the Anahuac shale (A = 1-55 mol/kg) and the Frio sand (average value of m = 1-69 molal) and calculated the average chloride concentration Vncl to be 1.08 molal. The

Ion content and mineralogy of North Sea shale 407
average measured chloride concentration was 0-74 molal which gives a difference of about 20~o between the average values. The chloride concentration through the Anahuac shale was not constant but increased towards the sand-shale boundary. Application of the Donnan equilibrium close to the bed boundary gave a calculated value of Fnci of 1.03 molal which is in slightly better agreement with the measured value of 0.87 molal. A reverse of the calculation to estimate the average concentration of the external reservoir based on the composition of the shale gives a value of 1-30 molal for the salinity of the Frio sand. This estimated value is within the range of values reported for the Frio sand (Morton & Land, 1987) but below the average value of salinity chosen by Hedberg. The Donnan equilibrium predicts that an average value of 0-45 for the ratio 7mci/m gives a fixed ratio between `4 and m of about Aim = 1.8, implying that the range of `4 values studied by Hedberg ranged from 2-0 to 5.1 moles/kg. Hedberg found no definite relationship between the chloride content and clay mineralogy of the shales, but speculated that such a relationship should generally exist.
A comparison between the chloride content of shales and associated sandstones over a depth range 2000-15 000 ft has been made by Chilingarian (1983). A distinction was made between well-compacted and poorly-compacted shales, although the criteria for distinguish- ing the two shale types were not discussed. The comparison shows that at all depths the chloride concentration in the sandstones is significantly higher than that in the shales, and that the exclusion was greater in the more compacted shales. The range of values Vncl/m for the compacted shales was 0.02-0.16 while the ratio in the uncompacted shales varied from 0.17 to 0-73. Chilingarian's data show a continuum of behaviour from almost total exclusion (E,--acJm ~ 0) to little difference between the chloride concentration in the sands and shales (Vncl/m --, 1). Presumably the more compacted shales were characterized by larger values of.4 which implies that w was smaller since Chilingarian claimed that the mineralogies (and hence values of CEC) were similar. The data presented by Chilingarian show no clear variation of the ratio Vnc~/m with depth. The presence of other anions such as carbonate and sulphate in the sands or shales was not discussed.
Schmidt (1973) made a more detailed analysis of the ion composition of a sequence of sandstones and shales between 3000 and 14 000 ft from a well in Calcasieu Parish, Louisiana. The results are particularly interesting in that the sequence includes a massive shale section at about 10 300 ft where the conversion of smectite to illite appears to have occurred with subsequent overpressure development. The Gulf Coast sand-shale sequences above about 10 300 ft clearly show the salt-excluding properties of the shales. The ratio VncJm is about 0.2 from which the Donnan equilibrium suggests that the ratio A/m is ~ 5. The large value of this ratio is surprising, particularly as the anion concentration in the sandstone formations is in the range 1-2 molal. The value of A is therefore in the range 5-10 molal which, for an average CEC of 1 mol/kg, suggests that the water content w is in the range 0-1-0.2 kg/kg (giving porosity values of 21-35~ with an average matrix density of 2700 kg/m3). The extent of salt exclusion by the shales is markedly reduced below about 10 300 ft where the smectite-illite transition has reduced the value of the CEC and hence A, assuming that the water content w has remained constant. A complicating factor in assessing the salt exclusion properties of the shales below 10 300 ft is that the decrease in A has been accompanied by a decrease in m, although the condition Vncl ~ m suggests that the ratio Aim has decreased sharply.
The carbonate content of both the North Sea and Gulf Coast shales is sufficiently high (typically 0.1-0.2 molal in both shales) to warrant further comment. The isolation of the porewater from the North Sea shale yields an alkaline solution saturated with respect to CaCO3, MgCO3 and MgCa(CO3) 2. A disadvantage of the current method of removing the

408 T . G . J . Jones et al.
porewater from a shale by leaching is the dissolution of carbonate minerals and an overestimate of the divalent and carbonate ion concentrations. A further problem is that uptake of carbon dioxide from the atmosphere will distort the measured carbonate concentration. However, the carbonate concentration in the shale samples is considerably greater than that explained by simple carbonate dissolution. Brightman et al. (1985) determined the carbonate concentration and pH of porewater aliquots squeezed from a number of shale samples from the Harwell boreholes, UK. The pH of the solutions extracted from the Kimmeridgr Clay, for example, ranged from 8-3 to 9.5 (reported averages between 8-5 and 8-8) at 12~ and an average pH value of 7-4 at 60~ The measured carbonate levels in the Kimmeridge Clay at 12~ occurred in the range 2.5-5-0 x 10 -3 molal, considerably below the values measured in the present study and those reported by Schmidt.
Schmidt noted that the K concentration in the porewater of the Gulf Coast shales generally increased with depth, a trend which is also seen in the North Sea Cretaceous shale over a very much shorter depth interval. The increase in K concentration in the Gulf Coast shales is particularly interesting as the trend continues into the region of the smectite-illite transition, a process normally considered to consume K (Dunoyer De Segonzac, 1970). The presence of relatively high concentrations of K in the shales suggests that the availability of K for the smectite-iUite transformation is not a rate-determining step. Schmidt speculated that the increasing K concentration in the Gulf Coast shales was due to the dissolution of K feldspar. The origin of the increasing K content in the North Sea Cretaceous shale is unknown. An estimate of the K required to convert the smectite to illite can be made assuming that the CEC of the clay is changed from 0.8 to 0-1 mol/kg during the transformation. The change in CEC is
ACEC = 0-7Ws,
which is an estimate of the quantity of K needed for complete transformation, The ratio CK/ACEC, where CI~ is the local potassium content of the shale (i.e. both porewater and exchange concentration), lies in the region 0.14 to 0.22 for the North Sea Cretaceous shale. In the absence of an external source of K, only about one-fifth of the smectite in the Cretaceous shale could be transformed to illite.
C O N C L U S I O N S
The following conclusions can be stated: 1. The mineral content (from XRD) of the North Sea Cretaceous shale consists largely of
calcite and clay, the calcite content varying from 22 to 71%; the clay mineralogy is dominated by smectite and illite. Good agreement is obtained from a comparison of the measured cation-exchange capacity with that calculated from XRD. The calcite content determined by XRD compares well with the weight loss of the shale by acid treatment, although not all of the weight loss can be accounted for by measurement of Ca and Mg concentration in the acid extract.
2. The water content and wireline conductivity through the shale section correlate well with the shale CEC. A reasonable correlation is obtained between total clay content (as determined by CEC) and the wireline gamma-ray log. Considerably better correlation is obtained between the gamma-ray log and the illite content of the shale.
3. The total cation content of the shale is dominated by Na, with K, Mg and Ca present as only minor ions. The anion content is largely composed of chloride, but carbonate and

1on content and mineralogy o f North Sea shale 409
sulphate represent a significant contribution to the anion composition. The anion content through the shale section shows little variation even though the CEC and water content show considerable change. The carbonate concentration of the shale porewater is in the range 0.1 to 0.2 molal, of which only part can be explained by the dissolution of carbonate minerals during leaching.
4. The total concentration of anions in the shale (expressed as a molal concentration) varies inversely with the concentration of cation sites A (defined by CEC/w and expressed as a molal concentration) which suggests that the anion concentration is determined by a Donnan salt-exclusion equilibrium. The Donnan equilibrium has been applied at each shale composition to determine the composition of the external reservoir into which the shale is compacting. The calculated anion concentration of the external reservoir shows little variation through the shale section, which implies that the shale has reached compactional equilibrium with an external reservoir of about four times the total anion concentration of seawater.
ACKNOWLEDGEMENTS
The authors would like to thank Schlumberger Cambridge Research for permission to publish this paper.
REFERENCES
APPELO C.A.J. (1977) Chemistry of water expelled from compacting clay layers: a model based on Donnan equilibrium. Chem. Geol. 19, 91-98.
BENZEL W.M. & GRAF D.L. (1984) Studies of smectite membrane behavior: importance of layer thickness and fabric in experiments at 20~ Geochim. Cosmochim. Acta 48, 1769-1778.
BERRY F.A.F. (1969) Relative factors influencing membrane filtration effects in geologic environments. Chem. Geol. 4, 295-301.
BRIGHTMAN M.A., BATH A.H., CAVE M.R. & DARLINr W.G. (1985) Pore fluids from the argillaceous rocks of the Harwell region. British Geological Survey Report FLPU 85-6. Keyworth, UK.
BRUCE C.H. (1984) Smectite dehydration--its relation to structural development and hydrocarbon accumulation in Northern Gulf of Mexico basin. Am. Assoc. Pet. Geol. Bull. 68, 673-683.
BURST J.F. (1969) Diagenesis of Gulf Coast clayey sediments and its possible relation to petroleum migration. Am. Assoc. Pet. Geol. Bull. 53, 73-93.
CARSTENS H. & DYPVIK H. (1981) Abnormal formation pressure and shale porosity. Am. Assoc. Pet. Geol. Bull. 65, 344-350.
CI-nLIN6~aAN G.V. (1981) Compactional diagenesis. In: Sediment Diagenesis (A. Parker and B. Sellwood, eds.). D. Reidel, Dodrecht, Boston and Lancaster.
COLTEN-BRADLI~Y V.A. (I 987). Role of pressure in smectite dehydration--Effects on geopressure and smectite- illite transformation. Am. Assoc. Pet. Geol. Bull. 71, 1414-1427.
CREMI3RS A. (1968) Ionic movement in a colloidal environment. DSc Thesis, Catholic University of Louvain. DUNOYER DE SEGONZAC G. (1970). The transformation of clay minerals during diagenesis and low-grade
metamorphism: a review. Sedimentology 15, 281-346. DYPVIK H. (198 I) Drilling mud as a source of geochemical contamination: X-ray diffraction analyses, major
and trace element analyses. Am. Assoc. Pet. Geol. Bull. 64, 744-748. DYPVIK H. (198 I) Clay mineral transformations in Tertiary and Mesozoic sediments from the North Sea. Am.
Assoc. Pet. Geol. Bull. 67, 160-165. FRITZ S.J. & M~d~II,rB I.W. (1983) Experimental support for a predictive osmotic model of clay membranes.
Geochim. Cosmochim. Acta 47, 1515-1522. FRITZ S.J. (1986) Ideality of clay membranes in osmotic processes: A review. Clays Clay Miner. 34, 214--223. G~T R.G. & SPALDING G.E. (1966) Demonstration of a quantitative relationship between activity- and
diffusion-coefficients of Na ion in bentonite-water systems. Proc. Int. Clay Conf., Jerusalem, 331. Israel Program for Scientific Publications, Jerusalem.

410 T . G . J . Jones et al.
GRAF D.L. (1982) Chemical osmosis, reverse chemical osmosis and the origin of subsurface brines. Geochim. Cosmoghim. Acta 46, 1431-1448.
HALL P.L., ASTraL D.M. & McCo~ELL J.D.C. (1986) Thermodynamic and structural aspects of the dehydration of smectites in sedimentary rocks. Clay Miner. 21, 633-648.
HA~SHAW B.B. & Zmq E. (1965) Osmotic equilibrium and overthrust faulting. Geol. Soc. Am. Bull. 76, 1379- 1387.
HANS~tAW B.B. & COPLEN T.B. (1973) Ultrafiltration by compacted clay membrane--II. Sodium ion exclusion at various ionic strengths. Geochim. Cosmochim. Acta 37, 2311-2327.
HAYDON P.R. & GRAF D.L. (1986) Studies of smectite membrane behavior: temperature dependence, 20- 180~ Geochim. Cosmochim. Acta 50, 115-121.
HEDnERO W.H. (1967) Pore water chlorinities of subsurface shales. PhD Thesis, University of Wisconsin. HELFFERICH F. (1962) Ion Exchange. McGraw-Hill, New York. H INCH H.H. (1980) The nature of shales and the dynamics of hydrocarbon expulsion in the Gulf Coast Tertiary
section. Pp. 1-18 in: Problems of Petroleum Migration (W. H. Roberts and R. J. Cordell, editors). AAPG Studies in Geology 10.
HOWARD J,J. & RoY D.M. (1985) Development of layer charge and kinetics of experimental smectite alteration. Clays Clay Miner. 33, 81-88.
HOWER J.E., ESLINOER E.V., HOWER M.E. & PERRY E.A. (1976) Mechanism of burial metamorphism, 1 ; mineralogical and chemical evidence. Geol. Soc. Am. Bull. 87, 725-737.
KARLSSON G.W., VOLLSET J.G., BJORLYKKE K. & JORO~.~SEN P. (1978) Changes in mineralogical composition of Tertiary sediments from North Sea wells. In: Developments in Sedimentology 27, 281-289.
KnARAIO~ Y.K. & SMALLEr W.C. (1976) Flow of water and solutes through compacted clays. Am. Assoc. Pet. Geol. Bull. 60, 973-980.
KIO.MER J.R. (1969) Subsurface brines and mineral equilibria. Chem. Geol. 4, 37-50. LIN~REEN H. (1985) Diagenesis and primary migration in Upper Jurassic claystone source rocks in the North
Sea. Am. Assoc. Pet. Geol. Bull. 69, 525-536. Mxo,oo. K. (1975) Re-evaluation of montmorillonite dehydration as cause of abnormal pressure and
hydrocarbon migration. Am. Assoc. Pet. Geol. Bull. 59, 292-302. MAGARA K. (1978) Compaction and Fluid Migration. Elsevier, Amsterdam, Oxford, New York. M.~,NI-IEIM F.T. (1974) Comparative studies on extraction of sediment interstitial waters: discussion and
comment on the state of interstitial water studies. Clays Clay Miner. 22, 337-343. MARINE I.W. & FRITZ S.J. (1981) Osmotic model to explain anomalous hydraulic heads. Water Resources
Research 17, 73-82. MCKELVEY J.G. & MILNE I.H. (1960) The flow of salt solutions through compacted clay. Clays Clay Miner. 9,
248-259. MILNE I.H., MCKELvEY J.G. & TRUMP R.P. (1964) Semi-permeability of bentonite membranes to brines. Am.
Assoc. Pet. Geol. Bull. 48, 103-105. MONCURE G.K., LAa~,n~ R.W. & SmBERT R.M. (1984) Origin of secondary porosity and cement distribution
in a sandstone/shale sequence from the Frio formation (Oligocene). Pp. 151-161 in: Clastic Diagenesis (D. A. McDonald and R. C. Surdam, editors). AAPG Memoir 37.
MORTO~ R.A. & LAND L.S. (1987) Regional variations in formation water chemistry, Frio formation (Oligocene), Texas Gulf Coast. Am. Assoc. Pet. Geol. Bul. 71, 191-206.
MURTrrr A.S.P. & FERRELL R.E. (1972) Comparative chemical composition of sediment interstitial waters. Clays Clay Miner. 20, 317-321.
POLLASTaO R.M. (1985) Mineralogical and morphological evidence for the formation of illite at the expense of illite/smectite. Clays Clay Miner. 33, 265-274.
SERIO, O. (1984). Fundamentals of Well-Log Interpretation. 1. The Acquisition o f Logging Data. Elsevier, Amsterdam, Oxford, New York.
Scrn~mT G.W. (1973) Interstitial water composition and geochemistry of deep Gulf Coast shales and sandstones. Am. Assoc. Pet. Geol. Bull. 57, 321-337.
SHAW D.B. & WEAVER C.E. (1965) The mineralogical composition of shales. J. Sed. Petrol. 35, 213-222. SMITH J.E. (1977) Thermodynamics of salinity changes accompanying compaction of shaly rocks. Soc. Pet.
Eng. J. Nov., 377-386. SPWLA (1984) North Sea Rw Catalogue. SPWLA London Chapter, London. WHrrE D.E. (1965) Saline water of sedimentary rocks. Pp. 342-366 in: Fluids in Subsurface Environments (A.
Young and J.E. Galley, editors). AAPG Memoir 4. YOUNG, A. & Low P.F. (1965) Osmosis in argillaceous rocks. Bull. Am. Assoc. Pet. Geol. 49, 1004-1008.