Embed Size (px)
Citation preview

Page 1
The Investor
In our 26th year of free service to the South African investing public!
25th April 2012 Volume: 26 Issue: 5
“Its not how much you earn but what you choose to do with your earnings that de-termines who ends up rich………………..” So, if you have followed me until now you will have taken to heart the fact that for the magic of compounding to really go to work for you, you need both an extended period of time and the highest available interest/growth rate.
And of course Mr Average Man usually fails on both counts. Conventionally he uses unit trusts, a pension fund or an insurance policy as his principal vehicle of saving and, sadly, none of these normally deliver high rates of growth. Not surprisingly then, when viewing retrospectively what they have achieved during their first few years of saving and investing, the average person be-comes discouraged by a pathetic growth rate.
Against the 29.02 percent Total Return offered by the average Blue Chip share over the decade ended December 2011, unit trusts have failed miserably in their mission to provide the public with an easy to use means of investing in the share market. Over the same period the average unit trust has delivered a mere 7.86 percent growth plus dividends totalling 3.4 percent or a Total Return of 11.26. So if in the beginning of a savings campaign you plan to use unit trusts because of their ease of use, you need to under-stand why this Total Return average is so low and how to select better-performing funds. Various schools of thought exist as to why the average fund performs so badly. Internationally there is a substantial body of research which ar-
WHAT’S INSIDE
1)The latest in our “How to invest”
series: The Ten-Minute Millionaire
4) Using ShareFinder effectively
6) Cees Bruggemans: Outlook for
the SA economy
10) Brian Kantor: SA Outlook
12) John Mauldin: Spain in crisis
17) Company reports
The Ten-Minute Millionaire
www.rcis.co.za Download a free trial of the world’s most advanced stock exchange selection software

Page 2
gues that the average portfolio manager is quite unable to beat the standard market indices. An-other widely-held view is that the majority of financial institutions that manage unit trusts, have treated them as cash cows; milking them for all they are worth with a barrage of management fees and sales commissions which have so burdened the funds that they are quite unable to per-form.
Whatever the reason, their failure to deliver has led to the development of a new type of fund known as an index tracker. Simply explained, the people who operate these funds do not need any specialist training nor any great investment insight. All that they are required to do is ensure that their tracker funds precisely replicate the constituents of the various share market indices. Officially known as Exchange Traded Funds or, EFTs for short, these funds have a further ad-vantage that they trade daily on stock exchanges during normal trading hours and can therefore be bought and sold just like regular shares on the stock exchange. So, instead of purchasing one share on the stock market you can purchase the performance of the top 40 shares on the JSE with the purchase of a single ETF unit. Most ETFs track an index such as the FTSE/JSE Top 40 Index. For example, the Satrix 40 tracks the FTSE/JSE Top 40 Index. They are similar to unit trusts inasmuch as they are invested in a basket of shares (a group of shares such as the Top 40 companies on the JSE) in the same way as a unit trust does. However whereas most unit trust only trade only once a day, ETFs trade in real time on the stock exchange. In other words they fluctuate in value minute by minute just like ordinary shares and the price is available to the public throughout the day.
For the South African investor, the best of these are the Satrix series of funds which are adminis-tered by the Johannesburg Stock Exchange. Currently there are seven different Satrix funds; the Satrix 40, the Findi, the Indi, the Resi, the Swix, the Divi and the Rafi representing in turn the Top4o Index, the Financial Index, the Industrial Index, the Resources Index and so on.
The Satrix SWIX Top 40 endeavours to replicate the performance of the JSE SWIX Top 40 in-dex. This, shareholder-weighted Top 40 index, makes use of the share register of the top forty companies to reduce the constituent weights for foreign shareholders in these stocks. In addition, the SWIX Top 40 is adjusted for cross-holdings and strategic holdings. The impact is to reduce the weightings of mainly resource and dual-listed stocks in the Top 40 index by approximately half.

Page 3
The asset manager of the Satrix SWIX Top 40 accurately replicates the FTSE/JSE SWIX Top 40 index, by holding the exact weighting and number of shares that constitute this index. Any divi-dends that are paid by the top forty companies are paid out to Satrix SWIX Top 40 shareholders on a quarterly basis. In this way the holders of Satrix SWIX top 40 securities replicate the total performance (capital plus dividend yield) of the top 40 companies listed on the JSE.
The Satrix Rafi weights its underlying constituents using four fundamental factors, rather than pure market capitalisation. These are dividends, cash flow, sales and book value. Secondly, the RAFI 40 tracks the total return version of the FTSE/JSE RAFI 40 index, measuring the total re-turn of the underlying index by combining the capital performance plus the reinvestment of in-come of the constituent companies in the index. All dividends received are immediately rein-vested on behalf of investors. Collectively these funds have shown themselves to be far superior to the average commercially-offered unit trusts and are very worthy of consideration by small investors who do not want to trouble themselves with the problems of choosing individual blue chip shares. There is, however, at this stage a small problem inasmuch as the Satrix series have not been around for long enough to warrant really meaningful comparison with the most recent and best performing of these only becoming available to the public in September 2009. Judging, however, from my comparison graphs on the previous page, the Satrix Divi and the Sa-trix Rafi appear most likely to be your best options as a savings vehicle. However, when we com-pare their performance with the average Blue Chip share in the graph below, neither of the Satrix funds has done all that well. As the second graph composite illustrates, since the Satrix Divi and Rafi were released in September 2009 they have grown by 35 and 38 percent compared with the average Blue Chip share which has grown by 51 percent.
So, assuming once again our example of a young person with a 40-year working life ahead of him and R50 000 to invest, we should note that, allowing once again a 3.5% average dividend yield being ploughed back as the money is earned year by year, we might calculate that were these percentages to remain constant until our investor reached retirement age, the Blue Chip investor would be worth R95.5-million, the investor in the Rafi would be worth R33.9-million and the investor in the Divi would be worth R22.5-million. It goes without saying, I believe, that Blue Chip share win hands down!
Page 4
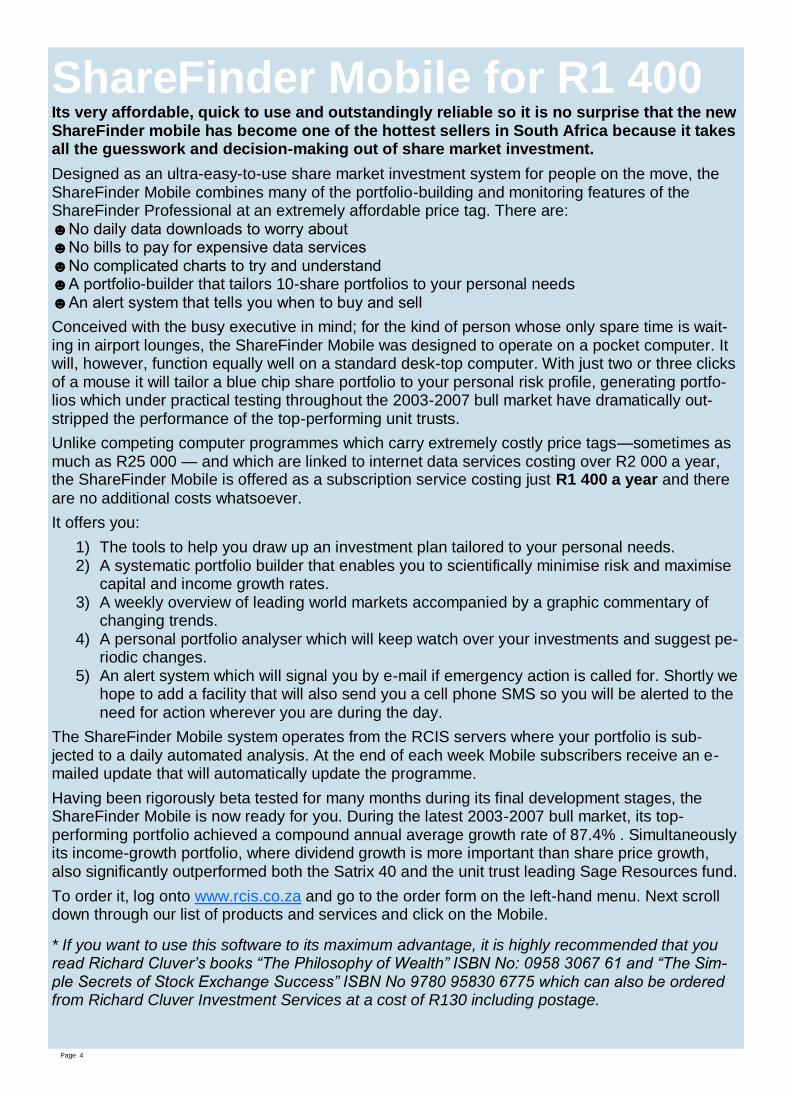
ShareFinder Mobile for R1 400 Its very affordable, quick to use and outstandingly reliable so it is no surprise that the new ShareFinder mobile has become one of the hottest sellers in South Africa because it takes all the guesswork and decision-making out of share market investment.
Designed as an ultra-easy-to-use share market investment system for people on the move, the ShareFinder Mobile combines many of the portfolio-building and monitoring features of the ShareFinder Professional at an extremely affordable price tag. There are: ☻No daily data downloads to worry about ☻No bills to pay for expensive data services ☻No complicated charts to try and understand ☻A portfolio-builder that tailors 10-share portfolios to your personal needs ☻An alert system that tells you when to buy and sell
Conceived with the busy executive in mind; for the kind of person whose only spare time is wait-ing in airport lounges, the ShareFinder Mobile was designed to operate on a pocket computer. It will, however, function equally well on a standard desk-top computer. With just two or three clicks of a mouse it will tailor a blue chip share portfolio to your personal risk profile, generating portfo-lios which under practical testing throughout the 2003-2007 bull market have dramatically out-stripped the performance of the top-performing unit trusts.
Unlike competing computer programmes which carry extremely costly price tags—sometimes as much as R25 000 — and which are linked to internet data services costing over R2 000 a year, the ShareFinder Mobile is offered as a subscription service costing just R1 400 a year and there
are no additional costs whatsoever.
It offers you:
1) The tools to help you draw up an investment plan tailored to your personal needs. 2) A systematic portfolio builder that enables you to scientifically minimise risk and maximise
capital and income growth rates. 3) A weekly overview of leading world markets accompanied by a graphic commentary of
changing trends. 4) A personal portfolio analyser which will keep watch over your investments and suggest pe-
riodic changes. 5) An alert system which will signal you by e-mail if emergency action is called for. Shortly we
hope to add a facility that will also send you a cell phone SMS so you will be alerted to the need for action wherever you are during the day.
The ShareFinder Mobile system operates from the RCIS servers where your portfolio is sub-jected to a daily automated analysis. At the end of each week Mobile subscribers receive an e-mailed update that will automatically update the programme.
Having been rigorously beta tested for many months during its final development stages, the ShareFinder Mobile is now ready for you. During the latest 2003-2007 bull market, its top-performing portfolio achieved a compound annual average growth rate of 87.4% . Simultaneously its income-growth portfolio, where dividend growth is more important than share price growth, also significantly outperformed both the Satrix 40 and the unit trust leading Sage Resources fund.
To order it, log onto www.rcis.co.za and go to the order form on the left-hand menu. Next scroll down through our list of products and services and click on the Mobile.
* If you want to use this software to its maximum advantage, it is highly recommended that you read Richard Cluver’s books “The Philosophy of Wealth” ISBN No: 0958 3067 61 and “The Sim-ple Secrets of Stock Exchange Success” ISBN No 9780 95830 6775 which can also be ordered from Richard Cluver Investment Services at a cost of R130 including postage.

Page 5
Using ShareFinder Effectively
Its been a torrid time at RCIS By Richard Cluver
Its time to thank every one of you for your patience during the past few weeks.
When resident programmer Junaid Karim left us at the end of 2011 we employed a newly gradu-ated computer sciences graduate to replace him. Sadly she proved to be inadequate for the highly demanding role she needed to fill and she left us suddenly in mid-March leaving many of our systems in disarray with the result that many of our customers have had to put up with inter-ruptions in our data services. After careful thought we elected not to simply go into the market-place and hire a new programmer. Instead we have taken the time to take a close look at all our systems and have concluded that our single-minded concentration upon perfecting the perfect share market predictive system over the past few years has left us somewhat behind in some ar-eas such as, for example, the automation of our data dissemination tools. That is why, when a few weeks ago a number of clients stopped receiving weekly data from us, we were not alerted to the fact until they began contacting us.
We have now taken on not one replacement but rather a team of three and we will in the im-mediate future be devoting sig-nificant effort towards both strengthening and automating these systems. Meanwhile An-drew Neilon will be handling telephone support.
I apologise for any inconven-ience you might have experi-enced and thank you for your patience.
You can test the new
ShareFinder Mobile
at no cost for one week
1) Go to: www.sharefinder.co.za 2) Click on “What’s New” in the Products menu. 3) Download your free trial version of ShareFinder Mobile.
ShareFinder Prices
Now you can buy the acclaimed ShareFinder Professional for just R5
000.
You can enjoy the immense power of the Professional with its automatic port-folio building and analysis tools, long-term market outlook projections and greatly-expanded fundamental data tabulations, a comprehensive technical analysis module, 12-month price projections with ongoing accuracy rates in-cluded. To this may be added, at R200 a year, access to the ShareFinder Mobile remote access service which offers a daily portfolio analysis that can be viewed on smart phones, laptops and netbooks wherever wi-fi or 3G con-nectivity is available.
You will need a daily share market prices and volumes feed which costs R1 840 a year (or R150 a month) from InvestorData. You will also need to sub-scribe at an annual cost of R550 to the ShareFinder Supplemental Data ser-vice which keeps the programmes supplied with the detailed balance sheet statistics that enable it to make its quality assessments.
To these may be added the ShareFinder London Stock Exchange database at a cost of R1 100 together with a daily prices and volumes feed from Share-Crazy at £72 annually and supplemental data at R550 a year.
Richard Cluver’s Prospects newsletter service which consists of a weekly e-mail column each Friday and a monthly trading analysis costs R500. Pay si-multaneously for your Supplemental Data service and you can get both for a total of R950.
Our latest ShareFinder Mobile module for on-the-move investors who cannot spare the time to do detailed daily analysis of their portfolios now costs just R1 400 once a year while those who would like to simply receive the daily ShareFinder trading recommendations by E mail can subscribe for R400 for six months. Double that figure and you can also receive the ShareFinder me-dium-term investment recommendations. Alternatively you can subscribe to our weekly e-mail service for long-term investors at R300 for 6 months.
Richard Cluver’s latest books The Simple Secrets of Share Market Success, The Philosophy of Wealth and Footsteps to Fortune are available from RCIS at R130 each while previously-published works cost R90 a copy.

Page 6
By Invitation Dr Cees Bruggemans Chief Economist First National Bank
subscribe to Richard Cluver’s Prospects newsletter service…The preferred e-
mail share market informa-tion service that tells you what and when to buy and sell: www.rcis.co.za
With South Africa having an open economy, for-eign trade amounting close to 30% of demand and supply, and with a low national savings rate making the country dependent on high capital inflows to fund its fixed investment fully, our ex-posure to global events on every front (growth, Rand, inflation, interest rates, asset markets) is traditionally disconcertingly high.
www.fnb.co.za Will the Rand keep trading relatively narrowly around 7.50:$ or make major detours towards 9:$ (or 6:$)? Will CPI inflation still only make a minor hiccup to 6.3% from 6% now before receding towards 5% as compared to having global events conspiring to push it beyond 7% (as oil goes higher and the Rand weakens); or will inflation weaken much faster and further than expected (as oil surprises to the downside, global central banks keep pushing liquidity and Rand firms more)?
Can growth still get wacked to the downside as exports disappoint due to overseas shocks ahead of a new local infrastructure push later this decade firming it? Much anxiety remains focused on
It only costs R500 a year to
Europe, where the next risk instalment(s) may be coming into view. First Greece and then Italy came into focus, in recent weeks overtaken by Spanish fears. But don’t forget about Portugal (though locally denied). EU peripherals are all subjected to the stringiest creditor conditions that north Europeans, ECB and IMF can dream up, with conservative reform governments having in-herited the purple from socialist predecessors only comparatively recently in Portugal, Ireland and Spain, with conservative caretakers in Greece and Italy. Yet interesting shifts are underway in Holland and France (eventually Germany?). This weekend a Dutch right-of-centre governing alliance fell, with September elections (and a new makeover) coming into view. In France, social-ist Hollande trumped (just) conservative Sarkozy.
If both Holland and France throw their political rudders, the conservative Germanic alliance driv-ing European reform and recovery from financial disaster these past two years may acquire new stresses, something southern peripherals may be quick to capitalise with new demands for more understanding in achieving structural reforms. But how would markets react? With relief that aus-terity may take a bit of a backseat in order not to worsen growth and social strains so much? Or with anxiety that fiscal progress takes a backseat and less may be done to force structural reform in support of growth? Could new political quibbling break out in Germanic ranks about future di-rection? Would global markets fear such intensifying uncertainty?

Page 7
Much depends on whether electioneering slogans are far worse than the actual bite of reality once in office. A President Hollande might eventually not quibble to breaking point with the Ger-mans as he might win little that way (though how would this influence German politics?). In Hol-land, how much policy flexibility will the centre retain after the electorate has had its say?
Northerners are increasingly objecting to less government spending as austerity undoes their welfare and pension systems. This may be the Democratic deficit and political pendulum swing-ing but it won’t do so in isolation. Financial markets, too, have a say by pitching asset prices and currencies. Europe may be seen as becoming a lot more fractious, unfocused and more risky, potentially an excellent reason to walk away from.
Such increased selling pressure in coming months may be partially neutralised by ECB actions ensuring market functionality remains preserved. Also, EU politicians have increased the size of their common lifeboat to nearly €1 trill by allowing the old EFSF to run parallel for a while with the new ESM over the next two years. Also, the IMF has collected $430bn in new capital pledges, taking its firepower to nearly $1 trill.
Between these three institutional backstops, Eurozone countries may differ more without immedi-ately losing the plot as financial markets disagree with any watering down of pious intentions to get fiscal finances under control, tighten up on governance and getting structural growth reforms going.
So is there potential for more market mayhem and upheaval as these new twists need to be ac-commodated? It may well be, in which case sell in May and go away? There may be more mar-ket volatility in coming months. It might mean 7.50-9.00:$ Rand trading, wider price ranges for our equity and bond prices (struggling to show improvement), a mixed bag of inflation influences (for while the Rand could be a negative, this could still be neutered by a weaker oil price if global economic trends and political intentions don’t get rail-roaded by regional pre-emption). It isn’t yet obvious how political twists will affect European growth, and premature to assume too much of a South African hit.
For now as we drift into May, the data suggest the economy to be on track for 3% GDP growth. So far there’s no real reason to change this much, even as Europe contemplates its next hurdles and wave-making. It could be another hot northern summer in which only the London Olympics may bring some re-lief.
Stable messy risky with upside potential What would South Africa’s profile look like, say on a 30-year view? Mostly stable (3.5% growth), very messy (noisy transition to who-knows-where), se-vere downside risks (from elite corruption and revolutionary young) with upward potential (the next productive generation coming up the ranks)?
For business and the economics profession, both premised on efficiency rules and result maximization (best results in quickest time), engaging a ship adrift is a challenge. What may look like equilibrium be-tween Big Government, Labour and Business can also be described as an active and enduring state of policy paralysis. In other words, going nowhere in a hurry.
Order Richard Cluver’s
latest book for just R130.00:
Page 8
If leadership is lacking in breaking this impasse from above, in getting us back to a better, faster supply side performance (infrastructure, labour market, education, state bureaucracy), yielding faster income growth and fairer spreading of opportunity, ultimately we may expect a crisis break from below, destroying the existing dispensation. That is, after corrupt elites have first cleaned out and thoroughly thrashed the place. But what if it actually takes a lot of effort and time to break things down completely, while a new upcoming generation actively works to transform us back to a functioning, more efficient, better balanced, sustainable configuration?
Is it a sign of fear and impatience (two very different sentiments) that drive the forced short-term eagerness to get back to even keel quickly? But what if the present set-up is as good as it is go-ing to get for the time being, but with two crucial assumptions?
The outside world, given its outperformance (the East) and problems (the West), should keep creating supportive opportunities for an entity like us and the enormous African hinterland, as we have seen in recent years. And within nothing remains the same under the relentless pressure of demography, technology and trade, along with increased urbanisation and major social changes.
What do you get over time when that is our context? Two centuries after the British took over and started our accelerated modernisation, over a century after the Boer War make-over, half a cen-tury after the onset of the Apartheid interruption, and two decades after the latest changing of the guard, it is remarkable just how steady our national performance has been throughout. We have recorded 3.5% average GDP growth this past century, with only short devi-ating bursts varying from 1% to 5.5%, punctu-ated regularly by recession setbacks.
Most importantly, per capita income is again growing (after a civil war hiatus), with income, wealth and opportunity being spread more than ever before in our modernisation drive. Broad social stagnation has finally been ended (with South Africa showing substantial social mobility now, unlike for instance Brazil) even if great imbalances remain (like Brazil).
When examining our national institutions, and the 9 million formally-employed and 4 million informally employed (those working fulltime) presently driving the economy, it is an engine that has been subjected to some severe wear-and-tear but that is as yet far from broken down. It is an engine that still has a lot of ac-tive economic life remaining, even with a se-ries of hard drivers waiting turns.
That engine can probably be pressed for an-other 30 years of active service without fun-damentally breaking down, provided there isn’t a break in the rules of the game. So the transition may be noisy and very, very messy where efficiency rules are concerned, but a complete collapse is not something that arrives overnight unless wilfully wrecking the rules of the game.
Advertise in The Investor It costs as little as R85 per column centimetre* to carry your marketing message in The Investor. The Investor is published fortnightly on Wednesdays. Current circulation 3715 with current surveys suggesting a readership multiplier of 6. A full page measures 18 cms wide by 26.5 deep. Column width 9 cms. Copy deadline noon on Monday ahead of publication accompanied by payment made by EFT to Richard Cluver Investment Services, First National Bank, Westville Branch Code 223 526 Ac No: 5888 001 2935 Our discounted cost for a full page with colour is R7 500 Half page R3750 Quarter Page R1875 Single column measuring 1 cm deep by 9cms wide R150 Front page ad (Max permitted size 3.5cms deep double column) @ R200/cm. For details phone Guy Macnab on 031 2621722

Page 9
The main downside risks on this score, besides the outside world (or nature) turning unsympa-thetic, probably comes from corruption in high places and desperation from below (especially from those having enjoyed some real education with no chance of gainful deployment and opportu-nity, economically, socially or politically). These are the forces of destruction always present and waiting for a critical weakening of the societal core. But it isn’t as if these elements are the ONLY ones present, vying for control. On a 30-year view, with population growth of 1% and GDP growth of 3.5%, South Africa should DOUBLE its per capita real income and more than halve its 35% unemployment in a labour force by then a third larger than today, significantly broad-ening its participation base. With younger, better qualified, more experienced cadres coming up the ranks and steadily taking over in all walks of life, the present vacuums and paralysis should gradu-ally wane. If this were to be accompanied by an eventual fragment-ing of existing political arrangements under the pressure of dissatisfaction from important sections of society, with new configurations forming, as has repeatedly been the reality this past century, one more thorough shaking of the national can may yield more sustainable arrange-ments than the present. So answering that initial prospects question with some truth serum, one can think of ―relatively stable, very messy, with severe downside risks but upward potential, given enough time to get through past and present trau-mas‖. Not everyone will believe in this formula, either wanting to force progress or simply flee, never mind doing some more leisurely looting. It is this which makes our present epoch so vibrant, with ululating exultation by some and a sense of danger for many others.
Richard Cluver’s three earliest books as a collec-tion for just R180
1)Investment Without Tears 2)Making Money With The Mutuals
3)300 Ways to Make Your Money Grow
Phone Lyndy on 031 2621722
A new book by Richard Cluver
A new 225-page new Richard Cluver book entitled “The Simple Secrets of Stock Ex-change Success” has just been released. Detailing comparisons between the monetary events that sparked the Great Depression of 1929 to 1940 and the current global melt-down, Richard Cluver’s latest work explains how to survive and grow rich in stormy mar-kets. It is priced at R130 and can be ordered by E-Mailing [email protected] with your credit card details or by phoning 031 262 1722

Page 10
Stockbroker’s views by Brian Kantor
Investec Securities
The debt crisis in Europe that flared up in October 2011 has led the IMF to revise lower its fore-casts of global growth made in September last year for its World Economic Outlook (WEO). (International Monetary Fund, World Economic Outlook, Growth Resuming, Dangers Remain, April 2012. All figures included in this report as well as the quotations cited are sourced from this docu-ment)
Its baseline forecast for global growth still represents a satisfactory global growth outlook, with growth in emerging and developing economies expected to hold up much better than in the advanced economies.
The European Union economies, and particularly those at the European periphery have had their growth outlook most damaged, while those economies less dependent on trade with and finance from Europe escape much of the fall out. The growth outlook for the US and Canada has improved since September 2011.
GIP is Greece, Ireland and Portugal, in the heart of the debt storm; while MENA is the Middle East and North African region, with crises of their own to cope with. Russia and its satellites, the Commonwealth of Independent States (CIS) and helped by high oil prices, are barely affected by European woes and Latin America (with its greater dependence on North America) also fares well post the Euro crisis. Sub Sa-haran Africa (SSA) growth prospects have been little affected, given much reduced dependence on Europe as a market for its exports and helped also by high commodity prices, including oil. Europe’s share of SSA exports has fallen by half to 20% as the impor-tance of China and India as markets has grown while that of the US has stabilised – thanks to oil exports from Angola and West Africa. The growth outlook for SSA remains highly promising, with growth of 5.4% and 5.3% expected in 2013 and 2014. SA is expected to grow by 2.7% in 2013 and 3.4% in 2014. For a full break down of the growth forecasts for SSA see the table below. SA, as an important part of SSA, is seen by the IMF as a bit of an exception within the SSA region of which its share is about 30% and falling. The report suggests that: ―South Africa may also transmit global shocks to the rest of the region. It is more exposed to weaknesses in the world economy – particularly to Europe, which remains a major market for its high-value-added exports. Adverse shocks affecting South Africa can quickly spread to neighbouring economies, through their effect on migrant workers’ incomes, trade regional investment, and finance.‖ IMF advice for SSA goes as follows: ―For now, policy makers should focus on rebuilding policy buffers. Many economies in the region have begun to reduce fiscal deficits and tighten monetary policy, particularly where inflation spiked last year. Indeed, inflation pres-sure has already begun to abate in much of the re-gion, mostly on account of lower food prices. Budget-ary discipline will also help generate the room needed to refocus spending on priority areas such as infra-structure, health and education. If downside risks ma-

Page 11
terialize, economies without significant financing constraints should be prepared to loosen policy levers…‖ For SA the advice is rather different: ―The challenge is different in South Africa, which is struggling with subpar growth and very high unemployment. Support for activity remains an important policy objective, and in the event of a protracted slowdown, further monetary easing could be a potential source of stimulus as long as inflation expectations and the core inflation rate remain well contained.‖ (See Chapter 2, pages 7 0 - 7 5 ) The Reserve Bank appears of a similar state of mind. The biggest risk to the SA economy is that of a pro-tracted slowdown made more likely by unsettled economic conditions in Europe. That interest rates in SA have remained at their low current levels for some time now has helped contain the collateral damage from Europe. Low interest rates for longer may well be required until a global recovery and the resolution of the Euro crisis can be predicted with greater confidence. Surely subpar growth identified by the IMF is not easily combined with uncontained inflation expectations and a core inflation rate? The IMF does not indicate why this may be the case. Should the unlikely happen to be the case we would argue for policies that do what they can to sustain growth for an inflation rate over which the monetary authorities have very little control. However it should be noted that the IMF refers to core inflation, that is inflation excluding food, energy and administered prices, and not inflation itself. This is a very important distinction that previous Reserve Bank Governor Tito Mboweni would not allow, but that current Governor Gill Marcus seems to regard as impor-tant: hence the stability of interest rates in SA in the face of exchange rate led weakness linked to the Euro crisis despite the higher inflation that inevitably followed the weaker rand. This IMF advice for SSA is entirely consistent with the general concerns of the IMF – yes fundamental re-forms for the long term but no to simple minded austerity that would reduce demand and slow growth in the short term and add to the difficulty of achieving the reforms that would raise growth rates over the longer term as expressed . To quote the World Economic Outlook : ―Austerity alone cannot treat the economic malaise in the major advanced economies. Policies must also ease the adjustments and better target the fundamental problems-weak households in the United Sates and weak sovereigns in the euro area – by drawing on resources from stronger peers. Policymakers must guard against overplaying the risks related to unconventional monetary support and thereby limiting cen-tral banks’ room for policy manoeuvring. While unconventional policies cannot substitute for fundamental reform, they can limit the risk of another major economy falling into a debt-deflation trap, which could seriously hurt prospects for better poli-cies and higher global growth.‖ The IMF has had very recent success in drawing on re-sources from stronger peers (and an extra US$430bn) to add to the firewall protecting European governments. It has made it very clear to Europe and the European Central Bank (ECB) that aus-terity alone will not succeed. Hopefully the strong Euro-pean peers and the ECB are of a similar mind. ,

Page 12
USA Comment Spain grew a remarkable 8% per year in nominal GDP in the first nine years after the intro-duction of the euro in 1999. During this time, Spain focused its economy on housing and selling "the Mediterranean lifestyle." Millions flocked to its sun-drenched shores, buying houses along the way. As the demand for houses increased, construction became the industry. Housing prices ex-ploded, tripling in just over a decade. Who wouldn't want to get in on the action? Indeed, people invested almost all their assets in real estate. Hundreds of thousands of homes were built; for two decades, one home was built for every additional person in the population.
Now the bubble is bursting. Home prices have started to fall but have much further to go. Hous-ing construction employed one of every seven people. Most of those people will lose their jobs, and there are no new jobs available. His-torically, countries facing this situation have devalued their currency, but the euro has made this impossible. There-fore an "internal" de-valuation is needed, where prices of wages and goods fall in nominal terms. While this is possible, it is painful and slow. Spain's national debt is 50% greater than the headlines report. Spain's debt-to-GDP actually looks pretty reasonable compared to that of other countries. In fact, the United States is in worse shape than Spain on this measure alone. A more comprehensive account of Spain's debt, however, suggests that the country's debt-to-GDP is substantially higher, just at the 90% debt-to-GDP level that Rinehart and Rogoff have identified as diminishing GDP growth. Between 2000 and 2006, Spain's decentralized autonomous regions grew spending, mostly on healthcare and education. None of this debt is counted in the country statistics. Yet health care has proven to be one of the hardest expenditures to cut anywhere in the world, especially with aging populations. When coupled with the fact that Spain is unlikely to be able to grow GDP,
By John Maldin
Now you can invest in London with ShareFinder to guide you
Now you can take advantage of your R2-million foreign investment allowance with the full functionality of the ShareFinder Professional to guide you. A full London Stock Exchange add-on is now available to all owners of the ShareFinder Professional programme at a cost of: R1100. Data downloads from Share Crazy at an annual cost of £72 or by monthly subscription of £7. Payments can be made by credit card. Phone Richard on 031 2621722

Page 13
what seems to be a low debt-to-GDP ratio is actually much higher. Spain's housing prices will fall by an additional 35% Housing was an enormous driver of the Spanish economy, powering incomes from both the construction and real estate industries, as well as the wealth of homeowners from price appreciation. There is no doubt that there was a housing bubble in Spain. What is re-markable is the size of it in both building activity and prices. Here is a chart of houses and population over the last two decades. While the levels are different, the units are the same: a home for every new person added to the popula-tion. In the United States, the picture is very different. We have been adding about 2.5 people to our population for each home we build. Just the sheer number of homes built in Spain is stagger-ing. Some of this will be for-eigners buying second homes, and certainly, this happens more in Spain than in the U.S. But the construction activity was furious. Developers need an incentive to build a house; that incentive is price, usually appreciating. This spurred the market in the U.S., but it did even more so in Spain. Remarkably, despite the fall from the top, housing prices in Spain are still above the peak in the U.S. Nor are they in line with Spanish wages, as you can see below. This is before considering the internal devaluation that must occur. Wages must fall in Spain, and this will put even more pressure on housing prices. One question is why prices have not yet fallen further. There are several reasons. First, mortgages in Spain are all recourse to the borrower. There is no possibility of "jingle mail," where an underwater borrower returns the keys to the bank. In Spain, the bank can come

Page 14
after other assets or earn-ings. So it is preferable to keep paying and hold onto your home in the hope that prices will come back rather than to declare per-sonal bankruptcy. Second, the banks are desperate to keep loans as current and maintaining interest payments so that they can avoid further re-ductions to their already depleted capital. We be-lieve that they are making such modifications as tak-ing an amortizing loan and converting it to a bullet loan. This would reduce the monthly payments, but it increases the risk to the bank, as the borrower is not repaying the loan bit by bit. The number of houses being built and their rapidly increasing prices had the effect of generating
lots of income and jobs. At one point, one in every seven workers was in construction.
This does not count the people that were involved with the marketing, selling, or financing of all of this real estate. The economy depended on housing and construction; now these jobs are gone and they will not return soon. The question remains, what will take their place in the Spanish
economy?
The rapid increase in prices had other dangerous effects as well. Housing provided the best returns on investment of any major asset class from 1990 to 2011. So Spaniards put a frighteningly high percentage (79%) of their wealth into hous-ing. As people age, they will need to sell their real estate to fi-nance their retirement. This would work if there were peo-ple to buy the houses. Accord-ing to the National Statistics Institute of Spain, those near-ing retirement (ages 55-70) will swell by 1.4 million between 2011 and 2021 –these are the home sellers. But the people that are likely to buy (ages 25-40) will decrease by 3.3 million. Given lots of sellers and few buyers, the effect will be twofold. Housing prices will likely continue to fall in the intermediate future, and there will be additional pressure on the government to help retirees more, since their assets will be worth far less than they had planned. Spain has "zombie" banks, which make massive loans to developers and homeowners The banks that lent to homebuyers and to the developers of housing projects have not fully rec-ognized the decline in the value of their assets. While Spain has a few notable, truly international banks (Santander and BBVA) with strong assets and franchises, most of the problems are con-

Page 15
centrated among the domestic savings banks, known collectively as cajas. Spain has tried to rec-oncile the problems with its banking assets, but it has consistently raised the amount of money that is needed to restore solvency to the banking system in a piecemeal fashion. The latest esti-mate is that an additional €50 billion was needed. We believe that the number is more likely a multiple of that, perhaps on the order of €200 billion, given the expected fall in housing price and the highest unemployment in the devel-oped world. Spanish banks still have an inordinate balance sheet exposure to commercial real estate. Too many of these loans are still to real estate developments that are substantially worthless or to assets whose earning power has been diminished by the failing economy. Spain's economy has not become stable and will continue to deterio-rate
Spain's economy is neither competitive nor balanced. Something is needed to replace the jobs in construction and real estate that will not be coming back. Labour costs, however, are simply too high to attract business success-fully. Spain's unit labour costs (in yellow in graph alongside) needs to fall ~15% to match the Euro-pean average or a full ~30% to match Germany.
Falling wages will hurt Spain in multiple connected ways. Housing prices will be pres-sured as homeowners find that they can no longer af-ford to maintain their mortgages or their homes. Consumption is about 60% of the Spanish econ-omy, so falling wages will reduce GDP until real job growth returns. The government will be pres-sured by this initially falling tax base, which will hamper its efforts to reduce the defi-cit. Finally, deflation in wages will lower GDP and make the debt-to-GDP ratio that much
worse.
The introduction of the euro caused massive imbalances, and Spain was a net loser. Here is a chart of the cumu-lative current account bal-ances of the eurozone coun-tries since the inception of the euro.

Page 16
Spain imports far more than it exports, and it has been able to finance this only by leveraging the country to the hilt. The net international investment position (NIIP) of a country is the sum of all its exter-
nal financial assets and liabilities. Countries with a strong positive NIIP have major claims on other na-tions' assets, either in the form of debt or equity, while those that are negative have many more foreign claims on them. Spain's NIIP has been a disaster over the last decade.
An NIIP can go sharply negative for "good" reasons. In the nineteenth century, America had a large nega-tive NIIP, as mostly British capital financed the massive increase of productive capacity in the form of rail-roads, factories, roads, bridges, and other infrastructure. But too much of the decrease in the NIIP of Spain has gone into housing. Housing is not pro-ductive per se; it is consumption for the end user – even if it produces in-come for an owner. Between 2001 and 2011, the NIIP of Spain decreased by €856 billion. We could find no figures that quantified the value that went into housing. But a back-of-the-envelope measure is this: roughly 5 million homes were built, the average size of Spanish homes is roughly 100 m2 and cost per m2 is in a wide range, from €400 to €1,200.Therefore Spain spent €200 to €600 billion on housing over the dec-ade. Too much of the Spain's borrow-ing went into an asset that is unpro-ductive. The EU will not have the firepower or political will to bail out Spain
Spain will need some help from its neighbours. While there has been much talk of the increase in the size of the "firewalls" that Europe has constructed, we remain unconvinced that they have really grown substantially. For example, Germany pledged a maximum of €211 billion to the EFSF, which has been approved by the Bundestag and the Constitutional Court. Neither body has approved a change to this limit. The total size of the ESM and EFSF is not clear at this point, nor is the size of the IMF commitment. Should Spain be denied access to the capital markets like Portugal, Ireland, and Greece and come to rely on help from the public sector, the available resources would be severely strained. Should both Spain and Italy rely on financing, there simply isn't enough money.
Recently, the IMF has announced that it is close to raising $400 billion as a rescue fund. This will help meet the financial needs of the recipient country. But it will also subordinate all the other creditors of that country. The effect might be that creditors become reluctant to lend to a country for fear that they will just suffer subordination once the IMF starts to lend. If the market believes that the IMF loan is big enough to get the country through to stability, then it will continue to lend. If the market does not believe this, the IMF can precipitate the very run it was supposed to prevent.
This does not mean that the measures that the Europeans and the rest of the world have put together are for naught. At some point, there is enough financing to give Spain the time to go through the long and slow process of lowering wages and prices and rebalancing the economy. We are not predicting a sudden col-lapse, nor do we believe that a major restructuring in Spain is either imminent or even probable in the short or intermediate term. But the market will continue to test the resolve of the Spanish government and its people to find a way to restore balance to the economy. In summary, Spain desperately needs to find other industries to replace the real estate sector. This will not be easy or quick – realignment of an economy takes time and patience, neither of which the bond market is known for. Spain's issues are not impossible to solve -- there might be time enough to fix what is broken -- but the path is a narrow one, and the problems involve interlocking variables (housing, wages, employ-ment, and growth). There will be more moments of panic and relief before the final story is told.

Page 17
Company reports COAL 2012/04/25
Coal announced that the first shipment from the company's Vele Colliery in Limpopo Province was loaded into 30 rail wagons at the existing Musina siding on Tuesday, 24 April 2012. This first 'test' shipment train of approximately 1 500 tonnes of thermal coal is destined for the Matola Terminal in Maputo, Mozambique, from where it will be shipped and sold to Asian markets.
The coal was produced as part of the plant product test work that is currently being conducted on both metallurgical and thermal coal at Vele. A key objective of this test train run is to determine axle load capacity of the Transnet Freight Services (TFR) line between Groenbult and Hoedspruit. The test run is expected to confirm TFR's capacity to commence regular, weekly trains from this existing siding and on the existing line.
The shipment coincided with the official delivery of the plant from the project engineering consultants ELB Engineering Services to Vele mine management. Production at the Vele colliery resumed in December 2011 with the extraction of run of mine (ROM) ma-terial. Wet commissioning of the plant was completed in December 2011 and hot commissioning in February 2012. Further test work is currently being undertaken to confirm the design of processing infrastructure to enable the recovery of additional coking coal from the slimes portion of the coal, as well as the production of a secondary thermal product other than coking coal.
GROUP-5 2012/04/25
Shareholders were referred to the cautionary announcements dated 14 October 2011, 21 November 2011, 12 December 2011, 27 January 2012, and 9 March 2012 regarding a potential strategic venture ("potential strategic venture") between Telkom and KT Corporation (collectively "the companies"). Shareholders are advised that the companies have completed the diagnostic review and harmonised their respective findings. The companies are now in the process of finalising the terms of the potential strategic venture. Once the terms have been agreed, the companies will present the potential strategic venture to their respective boards of directors for approval before engaging with key stakeholders and presenting the terms of the potential strategic venture to Telkom shareholders for approval.
Shareholders are once again advised that whilst discussions regarding the potential strategic venture are ongoing, there is still no certainty that a formal transaction will be proposed or concluded. Accordingly, shareholders are advised to continue exercising caution when trading in the company's securities until a further announcement is made.
TELKOM 2012/04/25
Shareholders were referred to the cautionary announcements dated 14 October 2011, 21 November 2011, 12 December 2011, 27 January 2012, and 9 March 2012 regarding a potential strategic venture ("potential strategic venture") between Telkom and KT Corporation (collectively "the companies"). Shareholders are advised that the companies have completed the diagnostic review and harmonised their respective findings. The companies are now in the process of finalising the terms of the potential strategic venture. Once the terms have been agreed, the companies will present the potential strategic venture to their respective boards of directors for approval before engaging with key stakeholders and presenting the terms of the potential strategic venture to Telkom shareholders for approval.
Shareholders are once again advised that whilst discussions regarding the potential strategic venture are ongoing, there is still no certainty that a formal transaction will be proposed or concluded. Accordingly, shareholders are advised to continue exercising caution when trading in the company's securities until a further announcement is made.
AFEAGLE 2012/04/25
Afeagle announced that all resolutions put to shareholders at the general meeting were passed. The company will release another announcement confirming the results of the placing and open offer once the final numbers are confirmed. Terms used but not defined in this announcement shall have the same meaning as those set out in the circular issued by Afeagle to its shareholders on 5 April 2012.
1TIME 2012/04/25
Shareholders are referred to the announcement released on SENS of the JSE on 21 February 2012 and to the definitions con-tained therein ("the announcement") regarding a sale of shares and subscription agreement with Paladin in terms of which Litha will purchase certain Pharmaplan shares from Paladin for cash and Paladin will subscribe for new Litha shares, which together with the other indivisible transactions described in the announcement, shall be referred to as "the transaction". In this regard, shareholders are advised that there has been a delay in the posting of the circular such that the date of the General Meeting of shareholders, which was previously disclosed to be 10h00 on Wednesday, 2 May 2012 ("the general meeting"), will be amended to a later date. Shareholders will be advised of the salient dates and times relating to the transaction on SENS and on the date of distribution of the circular.
LITHA 2012/04/25
Shareholders are referred to the announcement released on SENS of the JSE on 21 February 2012 and to the definitions con-tained therein ("the announcement") regarding a sale of shares and subscription agreement with Paladin in terms of which Litha will purchase certain Pharmaplan shares from Paladin for cash and Paladin will subscribe for new Litha shares, which together

Page 18
with the other indivisible transactions described in the announcement, shall be referred to as "the transaction". In this regard, shareholders are advised that there has been a delay in the posting of the circular such that the date of the General Meeting of shareholders, which was previously disclosed to be 10h00 on Wednesday, 2 May 2012 ("the general meeting"), will be amended to a later date. Shareholders will be advised of the salient dates and times relating to the transaction on SENS and on the date of distribution of the circular.
FOSCHINI 2012/04/25
In terms of the listings requirements of the JSE Limited, companies are required to publish a trading statement as soon as they become reasonably certain that the financial results for the period to be reported on next will be more than 20% different from that of the previous corresponding period. The company advises that its basic and headline earnings per share for the year ended 31 March 2012, are expected to be between 20% and 23% higher than those reported for the year ended 31 March 2011. The financial information on which this trading statement is based has not been reviewed or reported on by the company`s audi-tors. The group`s results for the year ended 31 March 2012 are expected to be released on SENS on 29 May 2012.
LITHA 2012/04/24
Shareholders are referred to the announcement released on SENS of the JSE on 21 February 2012 and to the definitions con-tained therein ("the announcement") regarding a sale of shares and subscription agreement with Paladin in terms of which Litha will purchase certain Pharmaplan shares from Paladin for cash and Paladin will subscribe for new Litha shares, which together with the other indivisible transactions described in the announcement, shall be referred to as "the transaction". In this regard, shareholders are advised that there has been a delay in the posting of the circular such that the date of the General Meeting of shareholders, which was previously disclosed to be 10h00 on Wednesday, 2 May 2012 ("the general meeting"), will be amended to a later date. Shareholders will be advised of the salient dates and times relating to the transaction on SENS and on the date of distribution of the circular.
BONATLA 2012/04/24
Earnings per share and the fully diluted earnings per share for the year ended 31 December 2011 is expected to reflect an im-provement of approximately between 255% and 265% and between 225% and 235% respectively compared to the prior year. Headline earnings and diluted headline earnings per share for the year ended 31 December 2011 is expected to decline by be-tween 95% and 100% compared to the year end results for 31 December 2010. In addition, shareholders are advised that the reviewed preliminary report for the year ended 31 December 2011 is expected to be made available to shareholders on or about 30 April 2012.
HUGE 2012/04/24
Shareholders were referred to the initial trading statement dated 4 April 2012, and are advised that as per that announcement, the company now has clarity with regard to the improvement in earnings and headline earnings per share. Accordingly, shareholders are hereby advised that a reasonable degree of certainty exists that the company anticipates that earnings and headline earnings per share are expected to be between 9.58 and 11.97 cents per share, compared to a loss and headline loss per share of 15.33 and 15.41 cents per share respectively for the prior year corresponding period.
PICKNPAY 2012/04/24
Pick n Pay and BP Southern Africa (BPSA) will roll out small-format Pick n Pay stores at BP service stations in the major metro-politan areas across South Africa. PnP Express stores stock between 1 500 and 2 500 product lines and stay open 24 hours a day, seven days a week, catering to the convenience retail market. The two companies initially signed a memorandum of under-standing in July 2008 and have been testing the model since opening the first two PnP Express stores in Hout Bay and Tokai in the Western Cape at the end of the same year. There are currently nine Pick n Pay Express stores on BP forecourts in South Africa. One hundred and twenty BP Express stores will be converted to PnP Express stores over the next five years. Additional stores may be converted after the initial five-year period. The roll out of PnP Express stores will concentrate on those BP sites which are most suitably located for Pick n Pay's customers. Both companies are confident that the format brings multiple benefits to the two companies, their franchisees, suppliers, and more particularly to South African customers who are in search of eff icient and affordable convenience retailing. The agreement paves the way for significant enterprise development through the develop-ment of new and existing franchisees and will add value to BBBEE. The focus is on convenience meals, pre-packed fresh fruit and vegetables, fresh meat, freshly baked bakery products, as well as a selection of hot foods, including pies, chicken and hot take-away meals. Groceries, including snacks, drinks and cigarettes, magazines and newspapers are also offered. Customers will be able to use their Pick n Pay smart shopper cards throughout the network. BP's signature Wild Bean Cafes are part of the offer-ing.
CONVERGE 2012/04/20
Following the previous trading statements published on 27 February 2012 and 3 April 2012, which latest trading statement ad-vised shareholders that the headline earnings per share for the six months ending 29 February 2012 was expected to be approxi-mately 160% lower compared to the previous six months ended 28 February 2011, the board of directors are reasonably certain that the revised expected decline in the headline earnings per share for the six months ended 29 February 2012 will be approxi-mately 236% compared to the headline earnings per share for the comparable six months period ended 28 February 2011. Earn-ings per share, which were previously expected to be less than 20% different to compared to the prior period, is now expected to be approximately 112% less than the prior comparative period, moving to a loss per share for the six months ended 29 February 2012. This amended trading statement has been issued pursuant to the independent valuation of the company's investment in Future Cell (Pty) Ltd and the associated put and call options between the company and Pepkor Ltd over the remaining 15% inter-est in Future Cell.
GROUP-5 2012/04/20 Business Day reported that Group Five hopes to grow in East and West Africa as South African growth slows. CE Mike Upton said at an investment summit that Group Five sees "West Africa as a big growth area..."
ZCI 2012/04/17
Shareholders were referred to the cautionary announcement released on SENS on 28 February 2012 and in the press on 29 Feb-ruary 2012, wherein it was advised that ZCI has initiated a process intended to realise value from its investment in African Copper Plc ("ACU"), which process may result in the disposal of the company's interest in ACU.

Page 19
The Philosophy of Wealth
How to identify the long-term share market winners R130
Footsteps To Fortune
How to identify me-dium-term invest-ment shares and effectively time the market R130
Investment Without Tears
Richard Cluver’s original best-seller: how to get started on the share market R90
How To Make A Million
A step-by-step guide to the creation of investment wealth R90
300 Ways To Make Your Money Grow
300 Investment growth solutions R90
Making Money With the Mutu-als
How to win as a unit trust investor R90
Books to guide your investment
Shareholders are advised that the process is ongoing and may have a material effect on the price of the company's securities. Accordingly, shareholders are advised to con-tinue exercising caution when dealing in the company's securities until a further an-nouncement is made.
EXXARO 2012/04/17
Shareholders of Exxaro were advised that the audited annual financial statements for the year ended 31 December 2011 issued on 16 April 2012 as part of the 2011 inte-grated annual report are unchanged from the audited group financial results which were published on SENS on 23 February 2012 and in the Press on 24 February 2012.
Notice was given that the eleventh annual general meeting of shareholders of Exxaro will be held at the Exxaro Corporate Centre, Roger Dyason Road, Pretoria West, South Africa, at 10:00 on Tuesday, 22 May 2012 to consider, and if deemed fit, pass with or without modification, the resolutions as set out in the notice of annual general meeting forming part of the 2011 integrated annual report.
In addition, notice is hereby given that a general meeting of shareholders of Exxaro will be held at the Exxaro Corporate Centre, Roger Dyason Road, Pretoria West, South Africa, at 11:00 or immediately after the annual general meeting is finalised or ad-journed, on Tuesday, 22 May 2012 to consider, and if deemed fit, pass with or without modification, the resolutions as set out in the notice of general meeting forming part of the circular to shareholders dated 16 April 2012 relating to the company's proposed replacement employee share ownership plan, including an initial specific issue of shares for cash and a further specific issue of shares for cash; and the approval of the adoption of the company's new Memorandum of Incorporation. The board of directors of Exxaro has determined, in accordance with section 59 of the Companies Act 71 of 2008, as amended, that the record date for shareholders to be recorded as sharehold-ers in the shareholders' register, maintained by the transfer secretaries of the company, in order to be able to attend, participate in and vote at the annual general meeting and the general meeting is Friday, 11 May 2012. Therefore the last day to trade in the com-pany's shares on the JSE in order to be recorded in the share register on the record date is Friday, 4 May 2012.
Dutch multinational, Smit Internationale N.V., and was the losing bidder in a marine engineering bidding process in which Sekunjalo Marine Consortium was the successful bidder. Smit Amandla Marine (Pty) Ltd used technical arguments to contest their lost bid. Sekunjalo as per the SENS Announcements dated 24 February 2012 and 6 March 2012 asked the Department of Agriculture Forestry and Fisheries (DAFF) to withdraw the contract and its status as a preferred bidder and to reissue the tender as per our SENS Announcement
BRIKOR 2012/03/16
Shareholders are referred to the SENS announcement released on 14 October 2011 where shareholders were informed that Brikor has entered into a sale of immovable property agreement on 11 October 2011, for the sale of portion 5 and portion 26 (portions of portion 15) of erf 1250, Clayville Extension 14 Township and Erven 390, 391 and 392, Clayville extension 3 township. The condition precedent to the sale of immovable property agreement was not met and therefore the agreement has lapsed.
Withdrawal of cautionary announcement
Shareholders are referred to the cautionary announcements dated 12 January 2012, 28 November 2011 and 14 October 2011 and are advised that as the sale of immovable property agreement has lapsed, caution is no longer required to be exercised by share-holders when dealing in their Brikor securities.
EFFICIENT 2012/03/16
Shareholders are referred to the trading statement released on SENS on 2 March 2012 wherein Efficient stated that it was not in a position to give the specific guidance re-quired by the JSE Listings Requirement for a trading statement but that the company expected its earnings per share ("EPS") and headline earnings per share ("HEPS") for the six months ended 29 February 2012 to be at least 20% lower than EPS and HEPS for the previous corresponding period. Efficient is now in a position to advise that it expects EPS to be between 0.30cps and 0.36cps and HEPS to be between 0.29cps and 0.35cps for the six months ended 29 February 2012, compared to EPS and HEPS of 6.8 cents in both instances for the six months ended 28 February 2011. The group's unaudited interim results for the six months ended 29 February 2012 are expected to be released on SENS on or about 30 March 2012.