Embed Size (px)
Citation preview
Draft. Not for Quotation
The Intriguing Relationship Between Growth and Institutions in India
Arvind Subramanian International Monetary Fund
Washington D.C.
November 2006
This paper has been prepared for the Spring 2007 issue of the Oxford Review of Economic Policy. It draws upon ongoing work with my colleagues, Prachi Mishra and Petia Topalova. I am grateful to Ejaz Ghani, Shanta Devarajan, Josh Felman, Nurul Islam, Simon Johnson, Devesh Kapur, Sanjay Kathuria, Kalpana Kochhar, Utsav Kumar, Pratap Mehta, Nandan Nilekani, Raghuram Rajan, Krishna Srinivasan, and S. Sriramachandran for useful discussions. Manzoor Gill and Thoihen Singh provided excellent assistance with data.
2
I. Introduction The tepid-to-torrid transformation in India’s economic growth since the early 1980s is one of the big stories of recent times. Whereas “Midnight’s children” saw their standard of living double over forty years, Midnight’s grandchildren—the “India Shining” generation—can expect a five- or six-fold improvement in their lifetimes. But how have India’s public institutions fared over this period? And what is their relationship with this growth transformation? This paper represents a modest attempt at answering these questions. On the first, this paper presents some new empirical evidence on the evolution in selected public institutions at state and national levels. The main findings are twofold: first, that, at least based on the limited number of institutions explored in this paper, there does not seem to be evidence of improvements in the average quality of institutions over time; if anything the evidence leans in the other direction. Second, the divergence “big time” that is evident in growth across the Indian states after the 1980s, seems to be broadly matched by institutional divergence. The second question that this paper addresses is the two-way relationship between economic growth and institutions in India. It does so in terms of two apparent paradoxes. First, why has growth taken-off despite institutional stagnation (see Aiyar, 2006)? And the second, which is the mirror image of the first, why despite 25 years of rapid growth, has there been no perceptible improvement in India’s institutions? The central message of this paper is the following. India’s founding fathers bequeathed a strong set of institutions, much stronger than for the average country. These institutions have played a key role in the turnaround in India’s recent economic performance, a fact that has been overshadowed by, and because of, the more dramatic and necessary reduction in the ownership/regulatory functions of public institutions (a process that is usually described as policy reforms). Over time, though, it is not obvious that India’s public institutions are keeping up with the demands of a rapidly evolving economy. Thus, contrary to the near-universal views that the binding constraints to sustained Chinese-style rates of growth are the need to finish the unfinished task of rolling back the frontiers of the state, giving full play to the energies of the private sector, this paper implies that a future reform agenda should focus equally on strengthening, or reversing the decline in, public institutions. This paper is organized as follows. Section II describes briefly the role of instiutions in a market economy. Section III presents empirical evidence that sheds some light on the evolution in Indian institutions over time and across states. In Section IV, we focus on the effects of institutions on India’s growth performance. In Section V, we look at the impact (or lack thereof) of growth on institutions. Section VI offers some concluding remarks.
3
II. The Role of Public Institutions Recent economic research gives center stage to the role of public institutions in promoting and sustaining long-run development (see North, 1990; Hall and Jones, 1999; Acemoglu et. al., 2001; and Rodrik et. al., 2004). Institutions perform a number of economic functions in a market system that affect efficiency and equity objectives. First, institutions create markets. By protecting property rights, guaranteeing sanctity of contract, and providing law and order, they create an environment in which business and private investment can flourish. Thus, the judiciary, bureaucracy, and police are key institutions in facilitating the development of markets. Second, institutions regulate and/or substitute for markets. The need for these functions arises from some kind of market failure and/or other social objectives such as income distribution that societies wish to fulfill. That is, markets do not deliver what is socially desirable. For example, banks and other financial institutions need to be regulated to ensure that they do not take on excessive risk, which can lead to socially costly bank runs or collapses. The private sector may not deliver education and water to the most needy because they cannot afford to pay for these services. Third, institutions, such as the central banks or fiscal, stabilize markets by ensuring low inflation and macroeconomic stability and helping to avoid financial crises. Finally, institutions legitimize markets through mechanisms of social protection and insurance, and importantly, through mechanisms for redistribution and managing conflict. Democracy is, of course, the institution par excellence for legitimizing markets. The most interesting evolution has been the market-regulating/ownership role of instiutions. For much of the post-war period up to the 1980s, most countries sought to address market failures by the state substituting for markets: hence power, education, telecommunications, and water were provided by the public sector. In the case of India, the reach of the state was especially pervasive. Not only in these areas but in others, including the bulk of manufacturing, public sector ownership was the norm. And where the private sector was allowed, extensive restrictions of Kafkaesque proportions were placed on the terms it could operate under, including the scale of operation, what products could be produced, how much labor could be hired, where plants could be located etc. etc. The great ideological revolution of the last few decades has, of course, been the recognition that the state should cede much of this ground—and not just the old “commanding heights”—to the private sector.1 But even while ceding the function of providing these economic goods and services, the state still has an important regulatory function. And India too, albeit more slowly than most countries, has followed this path of less provision and more regulation, creating institutions such as the Securitites and Exchange Board of India (SEBI),
1 There is a great deal of confusion in the literature between policies and instiutions. In the schema described above, policies can be seen as actions that affect the scope of the state as owner and (over) regulator, while institutions affect the market-creating functions and the more necessary regulatory functions.
4
Telecommunications Authority of India (TRAI), Insurance Regulatory and Development Authority (IRDA), Central Electricity Regulatory Commission (CERC) etc. to undertake the regulatory role. III. How are Indian institutions faring? While the popular perception in India is one of institutional decline, the verdict in the academic debate is understandably much more circumspect. The caution derives in part from the fact that India’s size and heterogeneity resist easy attempts at generalization. Joan Robinson famously noted that everything and its opposite are almost statistically guaranteed to be true in India. Kapur and Mehta (2005) observe that: “Although an observer of contemporary India may be tempted to conclude that India’s public institutions are severely stressed and weakening, in reality their performance has varied both across institutions and over time.” It is true that not all signs point to institutional decline. Kapur (2005) suggests that certain referee institutions, especially the Supreme Court, the Election Commission, and the Presidency have witnessed rejuvenation. The Election Commission, especially since the late 1980s, has fiercely safeguarded its independence, and presided over many difficult elections. In a country where everything else is so politicized, it is remarkable that election results are never contested. The other referee institution, the Supreme Court, has moved beyond the politicized appointments of the late 1970s that gave India a “committed” (Indianspeak for political bias) rather than an independent judiciary. In a landmark ruling in 1993, the Supreme Court effectively shut out the executive from appointments to the Supreme Court. Through minor tinkering and technological upgradation, the Supreme Court has also reduced the large backlog of undecided cases before it from 120,000 to 20,000 (Mehta, 2005). And, through public interest litigation, it has moved aggressively, behaving more like the executive than the judiciary, in resolving long-standing public policy issues; cleaning Delhi’s atmospheric pollution being the best known, but not only, example. While purists balk at this overreach,2 the Supreme Court appears to have gained rather than lost popular legitimacy because of the perception that such overreach is a necessary consequence of and response to an inefficient and weak executive. Further, some of the new institutions such as the Telecommunications Regulatory Authority of India (TRAI), Securities and Exchange Board of India (SEBI), and Insurance Development Regulation Act (IDRA) have performed very respectably, especially considering the novelty of the terrain they have had to navigate. The Central Union Public Service Commission still oversees a selection process that is fair and merit-based.3 Greater decentralization and transparency have been introduced through the Panchayati Raj 2 The Supreme Court recently even decided on the fate of 300 rhesus monkeys held in captivity.
3 This is not true of the state public service commissions, which have been scandal-prone.
5
initiatives and the Right to Information (RTI) Act. And the introduction of computer-based technologies has improved efficiency in a number of areas, with railway users being the most visible beneficiaries of computerized bookings. Moreover, the optimists might argue that lamentations of institutional decline are, like the Rashomon effect, largely self-serving. The lamenters are mostly the elites who see decline only because they no longer have monopoly control over the institutions. Hitherto disadvantaged groups, having acquired voice through the political process, are finally asserting themselves and demanding that public institutions serve their interests too, threatening the exclusive hold of the elites. But the caution in pronouncing on institutional change over time also stems from the lack of serious attempts at quantifying institutional trends in India. Quantification has its pitfalls, but especially so in relation to institutions because there is a maddening variety and diversity of Indian institutions and the measurement of their performance (i.e. of institutional outcomes) is much more difficult. But policy analysis and prescription require empirical/quantitative evidence and difficult though the terrain is, there is no choice but to try and build such evidence. So what is the time-series evidence? Time series indicators of institutions have begun to proliferate. For example, the ICRGE calculates measures of economic risk faced by investors in a country. These are available since the mid-1980s. The World Bank has been compiling a number of indicators (Kaufmann et. al., 2006) of economic and political governance since the mid-1990s. One problem with these measures is that they are subjective—based on perceptions of investors (who tend to be more foreign than domestic)— and vague (they attempt answers to questions such as “how strong is the rule of law?”). The World Bank has begun computing more objective indicators of governance (World Bank, 2006) but these are available only since 2002. Moreover, all these indicators do not distinguish between federal level and state level institutions and thus cannot capture the rich variation within India in terms of institutional performance. We present below more objective/quantitative time series indicators of institutions and institutional performance in India. In terms of the categorization of institutions described earlier, we will focus only on market-creating and market-regulating institutions as these are most obviously related to growth. Our indicators relate to particular institutions (judiciary, bureaucracy, etc.) and the specific outcomes that they are responsible for rather than to general functions that institutions perform which are more difficult to measure. Some of these indicators relate not just to federal level but also state level institutions. In what follows, we shall be focusing on market-creating and market-regulating institutions as these have the greatest impact on growth. Only a few institutions are covered which may not be representative of the multiplicity of institutions in India. For this and other reasons, it should be stressed that the evidence presented below is meant to be illustrative and not by any means conclusive (see also Ahmed and Ghani, 2006). Evidence on evolution in the average quality of institutions
6
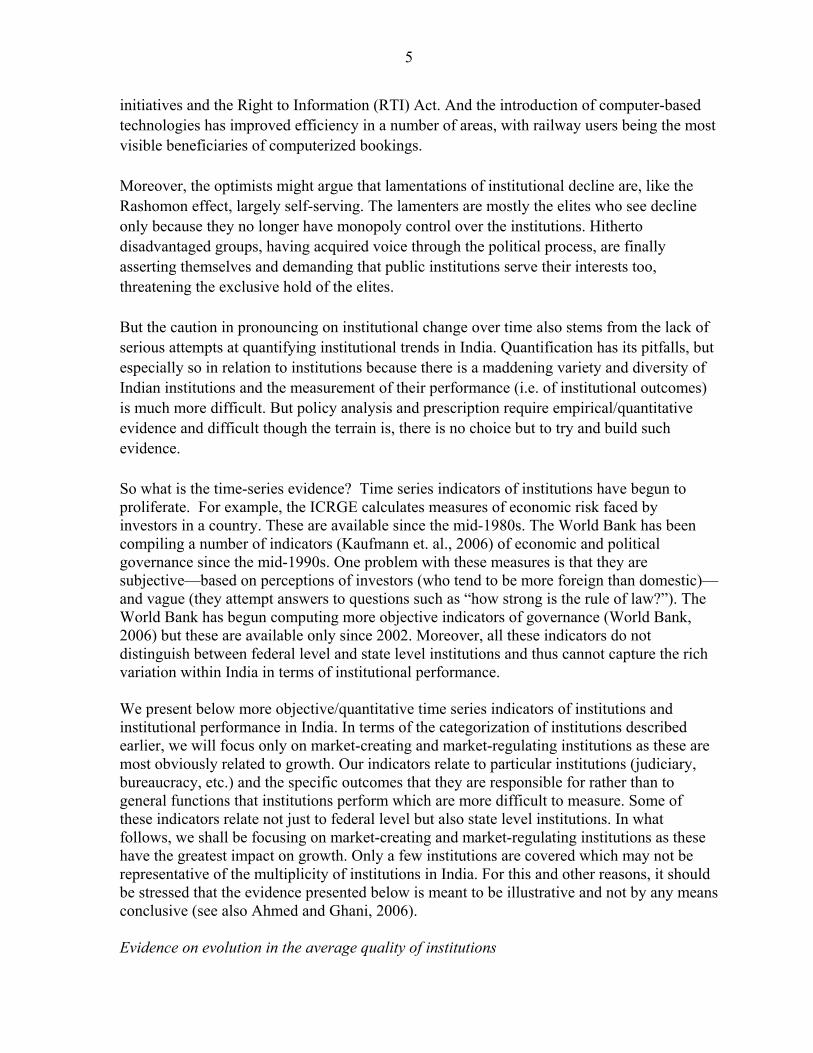
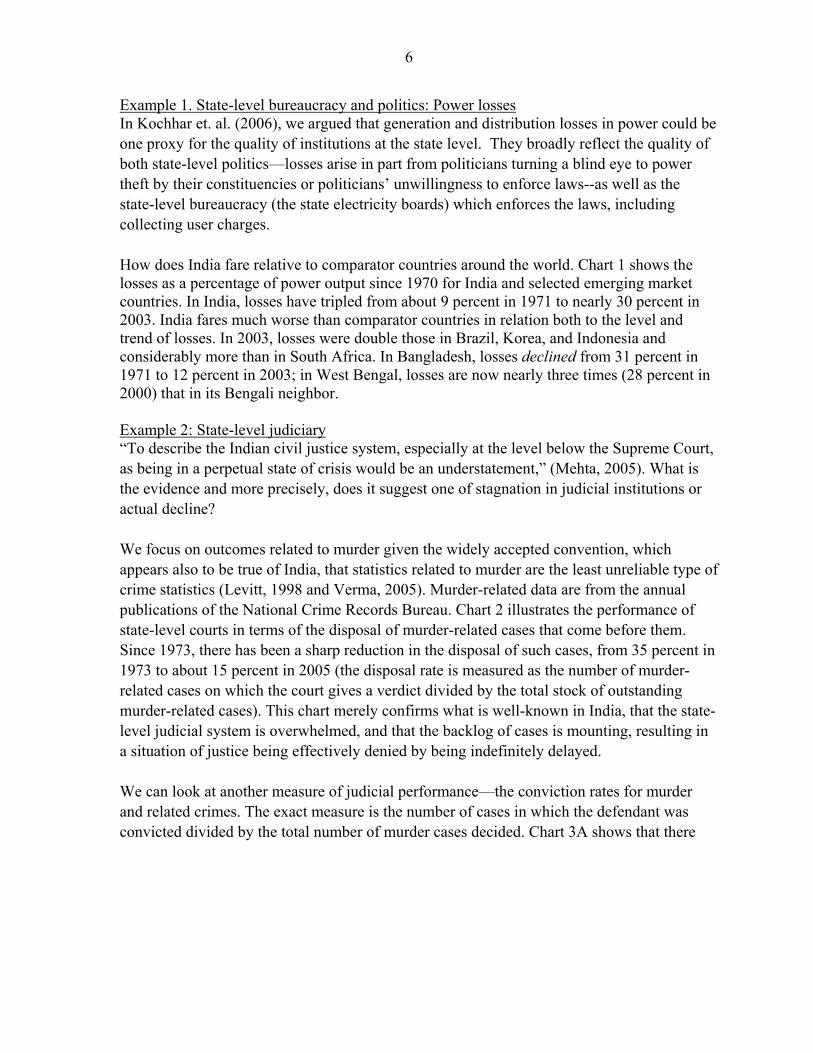
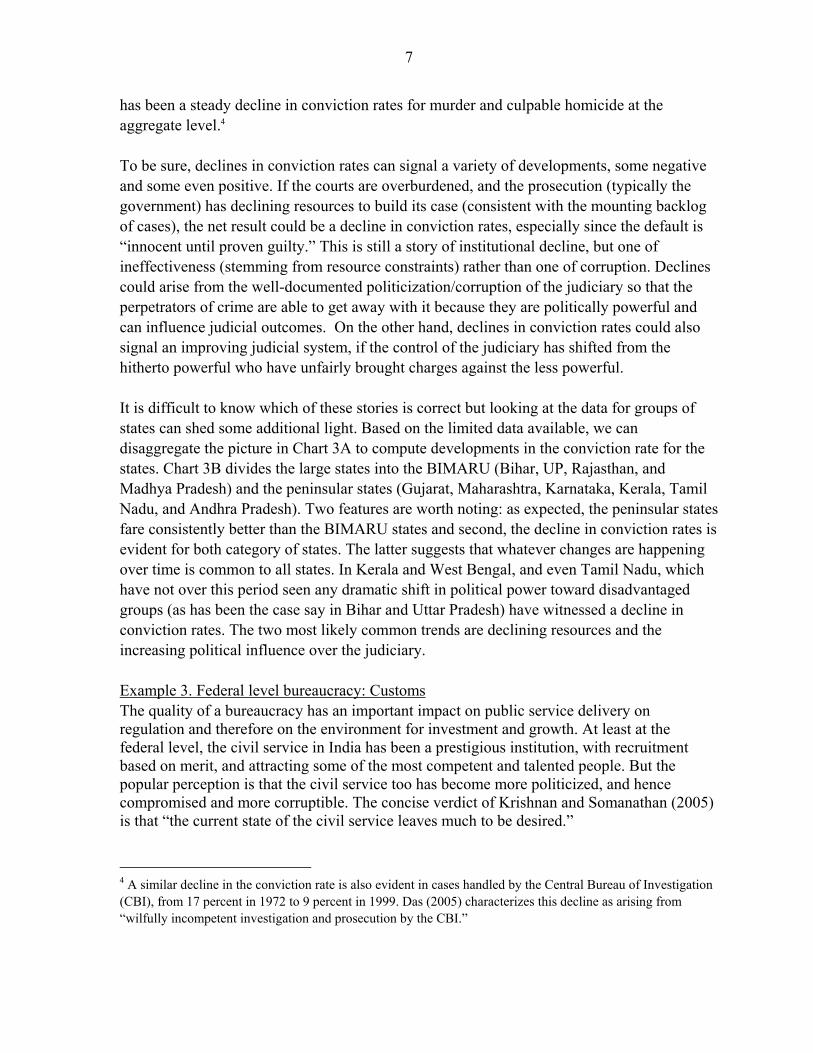
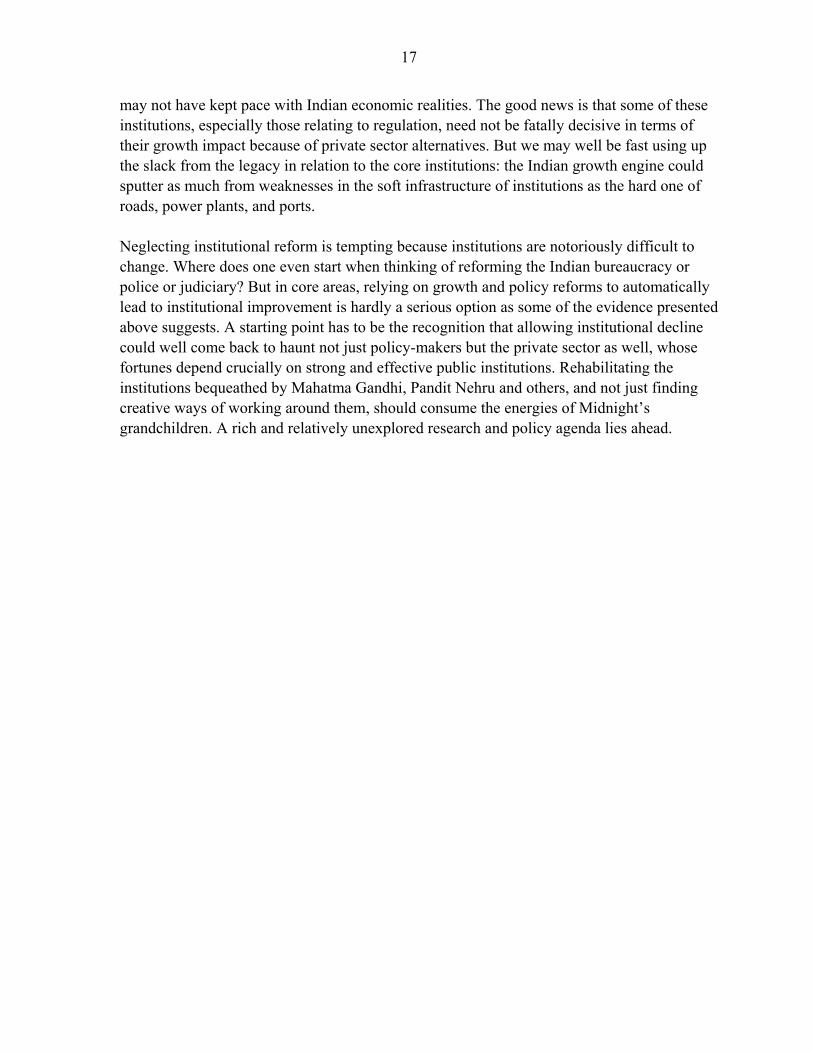
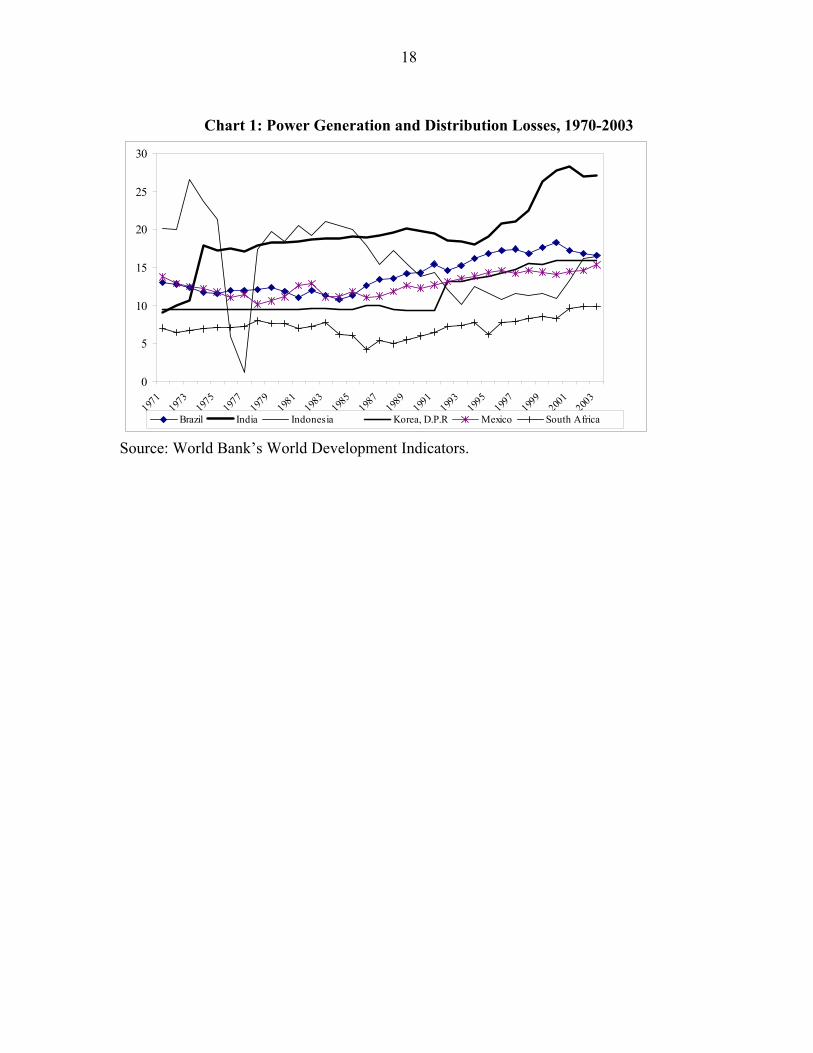
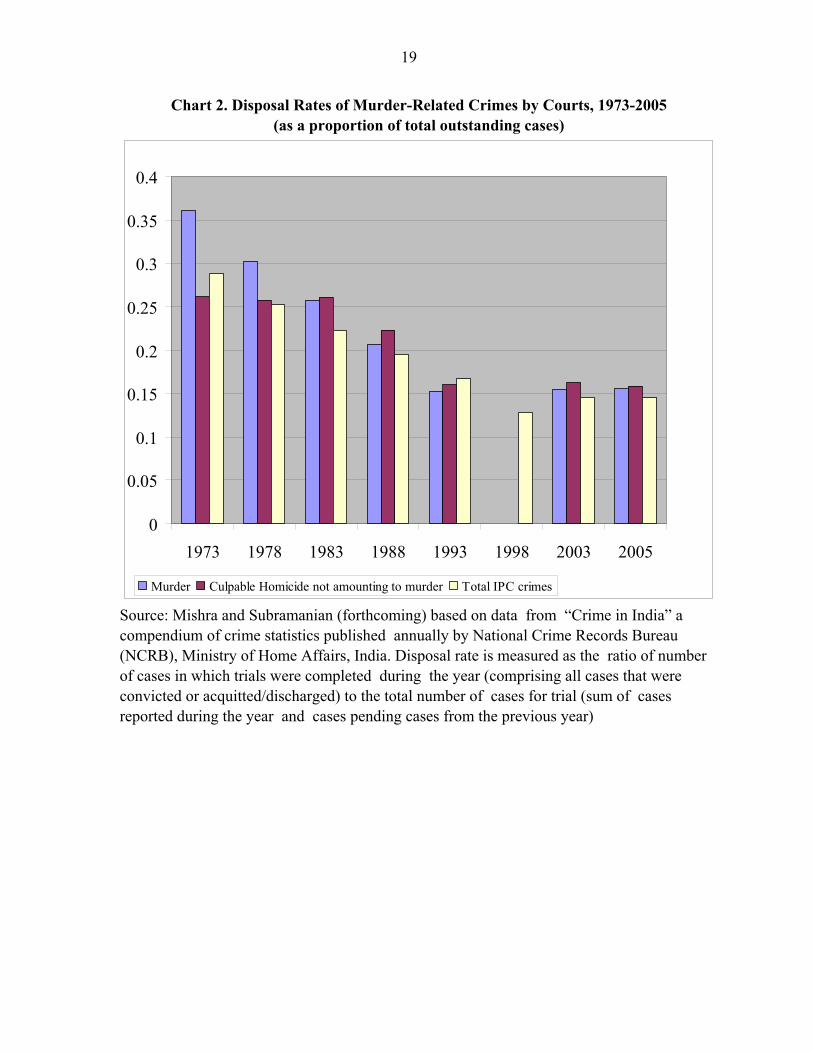
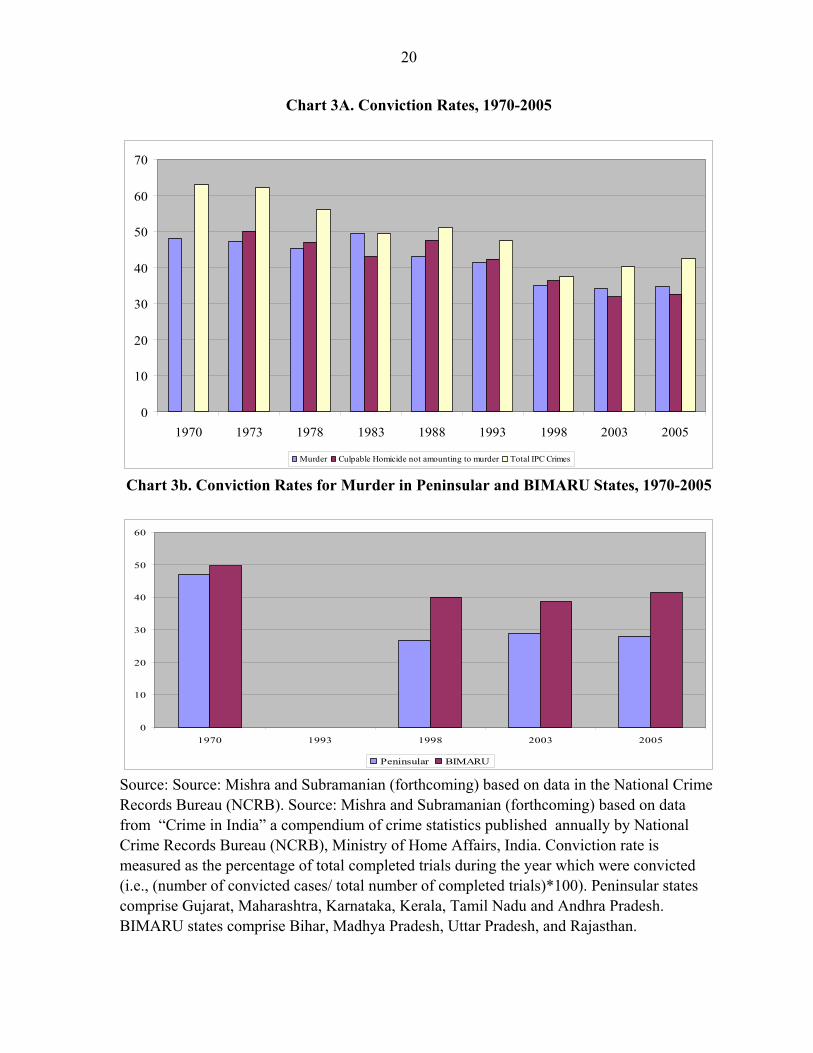
Example 1. State-level bureaucracy and politics: Power losses In Kochhar et. al. (2006), we argued that generation and distribution losses in power could be one proxy for the quality of institutions at the state level. They broadly reflect the quality of both state-level politics—losses arise in part from politicians turning a blind eye to power theft by their constituencies or politicians’ unwillingness to enforce laws--as well as the state-level bureaucracy (the state electricity boards) which enforces the laws, including collecting user charges. How does India fare relative to comparator countries around the world. Chart 1 shows the losses as a percentage of power output since 1970 for India and selected emerging market countries. In India, losses have tripled from about 9 percent in 1971 to nearly 30 percent in 2003. India fares much worse than comparator countries in relation both to the level and trend of losses. In 2003, losses were double those in Brazil, Korea, and Indonesia and considerably more than in South Africa. In Bangladesh, losses declined from 31 percent in 1971 to 12 percent in 2003; in West Bengal, losses are now nearly three times (28 percent in 2000) that in its Bengali neighbor. Example 2: State-level judiciary “To describe the Indian civil justice system, especially at the level below the Supreme Court, as being in a perpetual state of crisis would be an understatement,” (Mehta, 2005). What is the evidence and more precisely, does it suggest one of stagnation in judicial institutions or actual decline? We focus on outcomes related to murder given the widely accepted convention, which appears also to be true of India, that statistics related to murder are the least unreliable type of crime statistics (Levitt, 1998 and Verma, 2005). Murder-related data are from the annual publications of the National Crime Records Bureau. Chart 2 illustrates the performance of state-level courts in terms of the disposal of murder-related cases that come before them. Since 1973, there has been a sharp reduction in the disposal of such cases, from 35 percent in 1973 to about 15 percent in 2005 (the disposal rate is measured as the number of murder-related cases on which the court gives a verdict divided by the total stock of outstanding murder-related cases). This chart merely confirms what is well-known in India, that the state-level judicial system is overwhelmed, and that the backlog of cases is mounting, resulting in a situation of justice being effectively denied by being indefinitely delayed. We can look at another measure of judicial performance—the conviction rates for murder and related crimes. The exact measure is the number of cases in which the defendant was convicted divided by the total number of murder cases decided. Chart 3A shows that there
7
has been a steady decline in conviction rates for murder and culpable homicide at the aggregate level.4 To be sure, declines in conviction rates can signal a variety of developments, some negative and some even positive. If the courts are overburdened, and the prosecution (typically the government) has declining resources to build its case (consistent with the mounting backlog of cases), the net result could be a decline in conviction rates, especially since the default is “innocent until proven guilty.” This is still a story of institutional decline, but one of ineffectiveness (stemming from resource constraints) rather than one of corruption. Declines could arise from the well-documented politicization/corruption of the judiciary so that the perpetrators of crime are able to get away with it because they are politically powerful and can influence judicial outcomes. On the other hand, declines in conviction rates could also signal an improving judicial system, if the control of the judiciary has shifted from the hitherto powerful who have unfairly brought charges against the less powerful. It is difficult to know which of these stories is correct but looking at the data for groups of states can shed some additional light. Based on the limited data available, we can disaggregate the picture in Chart 3A to compute developments in the conviction rate for the states. Chart 3B divides the large states into the BIMARU (Bihar, UP, Rajasthan, and Madhya Pradesh) and the peninsular states (Gujarat, Maharashtra, Karnataka, Kerala, Tamil Nadu, and Andhra Pradesh). Two features are worth noting: as expected, the peninsular states fare consistently better than the BIMARU states and second, the decline in conviction rates is evident for both category of states. The latter suggests that whatever changes are happening over time is common to all states. In Kerala and West Bengal, and even Tamil Nadu, which have not over this period seen any dramatic shift in political power toward disadvantaged groups (as has been the case say in Bihar and Uttar Pradesh) have witnessed a decline in conviction rates. The two most likely common trends are declining resources and the increasing political influence over the judiciary. Example 3. Federal level bureaucracy: Customs The quality of a bureaucracy has an important impact on public service delivery on regulation and therefore on the environment for investment and growth. At least at the federal level, the civil service in India has been a prestigious institution, with recruitment based on merit, and attracting some of the most competent and talented people. But the popular perception is that the civil service too has become more politicized, and hence compromised and more corruptible. The concise verdict of Krishnan and Somanathan (2005) is that “the current state of the civil service leaves much to be desired.”
4 A similar decline in the conviction rate is also evident in cases handled by the Central Bureau of Investigation (CBI), from 17 percent in 1972 to 9 percent in 1999. Das (2005) characterizes this decline as arising from “wilfully incompetent investigation and prosecution by the CBI.”
8
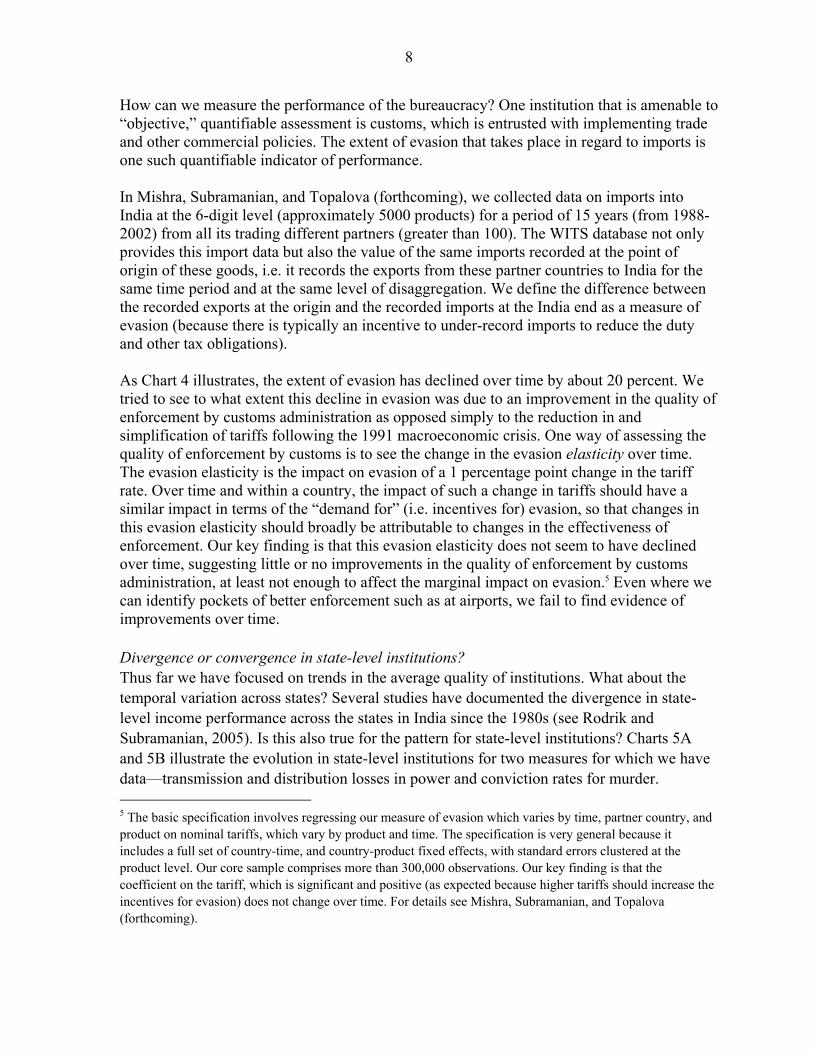
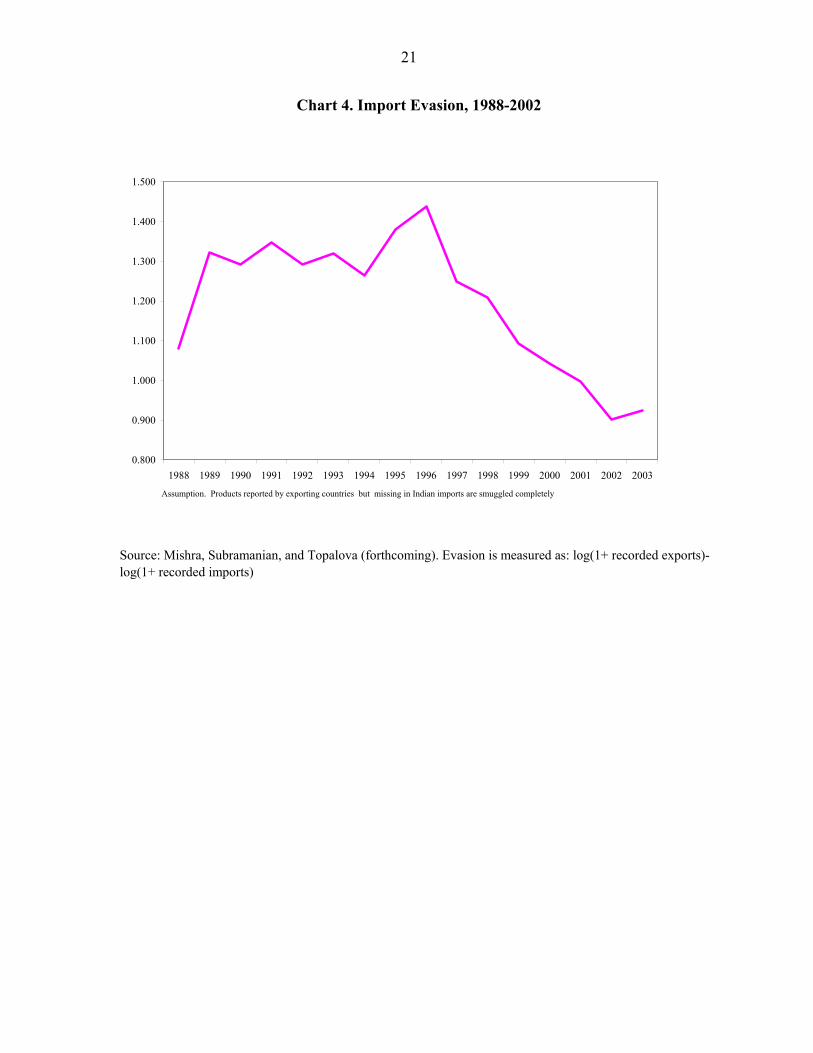
How can we measure the performance of the bureaucracy? One institution that is amenable to “objective,” quantifiable assessment is customs, which is entrusted with implementing trade and other commercial policies. The extent of evasion that takes place in regard to imports is one such quantifiable indicator of performance. In Mishra, Subramanian, and Topalova (forthcoming), we collected data on imports into India at the 6-digit level (approximately 5000 products) for a period of 15 years (from 1988-2002) from all its trading different partners (greater than 100). The WITS database not only provides this import data but also the value of the same imports recorded at the point of origin of these goods, i.e. it records the exports from these partner countries to India for the same time period and at the same level of disaggregation. We define the difference between the recorded exports at the origin and the recorded imports at the India end as a measure of evasion (because there is typically an incentive to under-record imports to reduce the duty and other tax obligations). As Chart 4 illustrates, the extent of evasion has declined over time by about 20 percent. We tried to see to what extent this decline in evasion was due to an improvement in the quality of enforcement by customs administration as opposed simply to the reduction in and simplification of tariffs following the 1991 macroeconomic crisis. One way of assessing the quality of enforcement by customs is to see the change in the evasion elasticity over time. The evasion elasticity is the impact on evasion of a 1 percentage point change in the tariff rate. Over time and within a country, the impact of such a change in tariffs should have a similar impact in terms of the “demand for” (i.e. incentives for) evasion, so that changes in this evasion elasticity should broadly be attributable to changes in the effectiveness of enforcement. Our key finding is that this evasion elasticity does not seem to have declined over time, suggesting little or no improvements in the quality of enforcement by customs administration, at least not enough to affect the marginal impact on evasion.5 Even where we can identify pockets of better enforcement such as at airports, we fail to find evidence of improvements over time. Divergence or convergence in state-level institutions? Thus far we have focused on trends in the average quality of institutions. What about the temporal variation across states? Several studies have documented the divergence in state-level income performance across the states in India since the 1980s (see Rodrik and Subramanian, 2005). Is this also true for the pattern for state-level institutions? Charts 5A and 5B illustrate the evolution in state-level institutions for two measures for which we have data—transmission and distribution losses in power and conviction rates for murder. 5 The basic specification involves regressing our measure of evasion which varies by time, partner country, and product on nominal tariffs, which vary by product and time. The specification is very general because it includes a full set of country-time, and country-product fixed effects, with standard errors clustered at the product level. Our core sample comprises more than 300,000 observations. Our key finding is that the coefficient on the tariff, which is significant and positive (as expected because higher tariffs should increase the incentives for evasion) does not change over time. For details see Mishra, Subramanian, and Topalova (forthcoming).
9
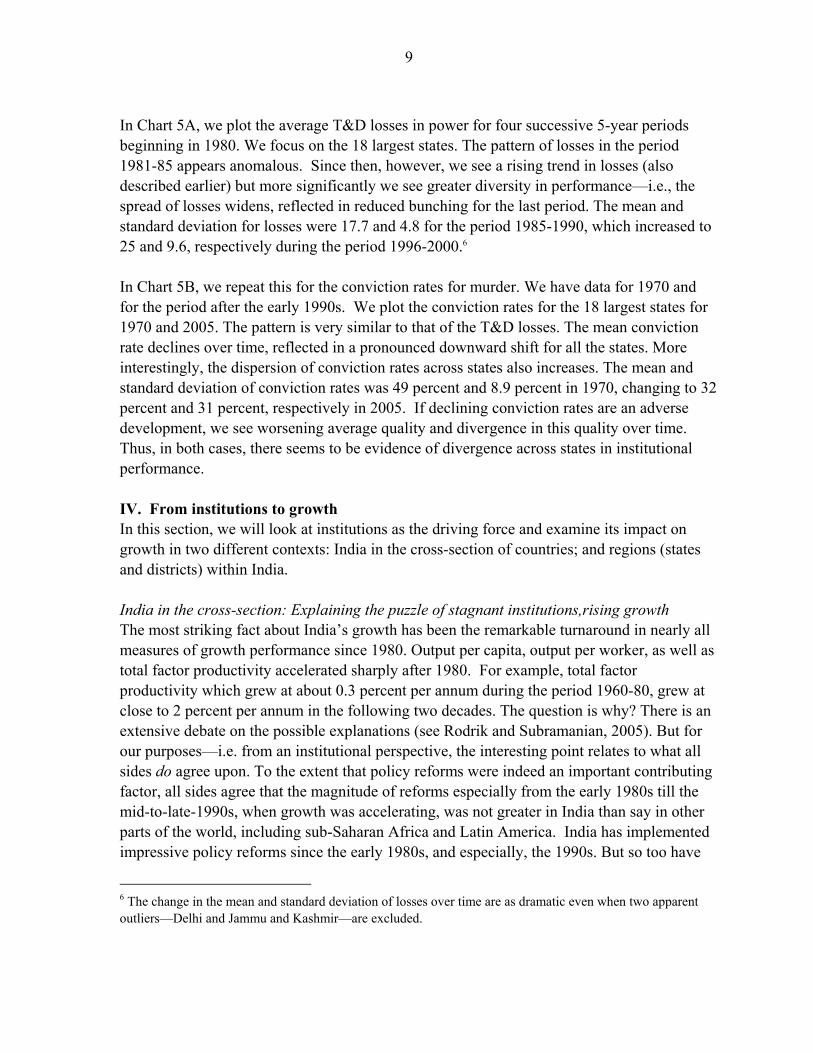
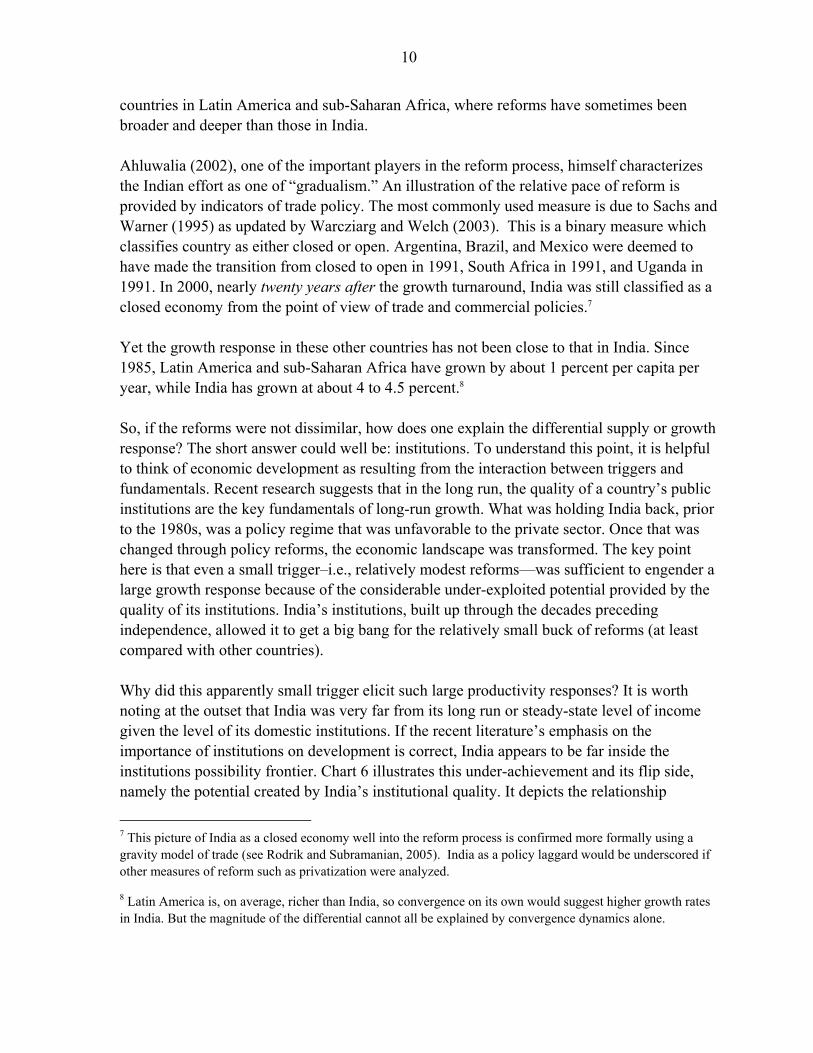
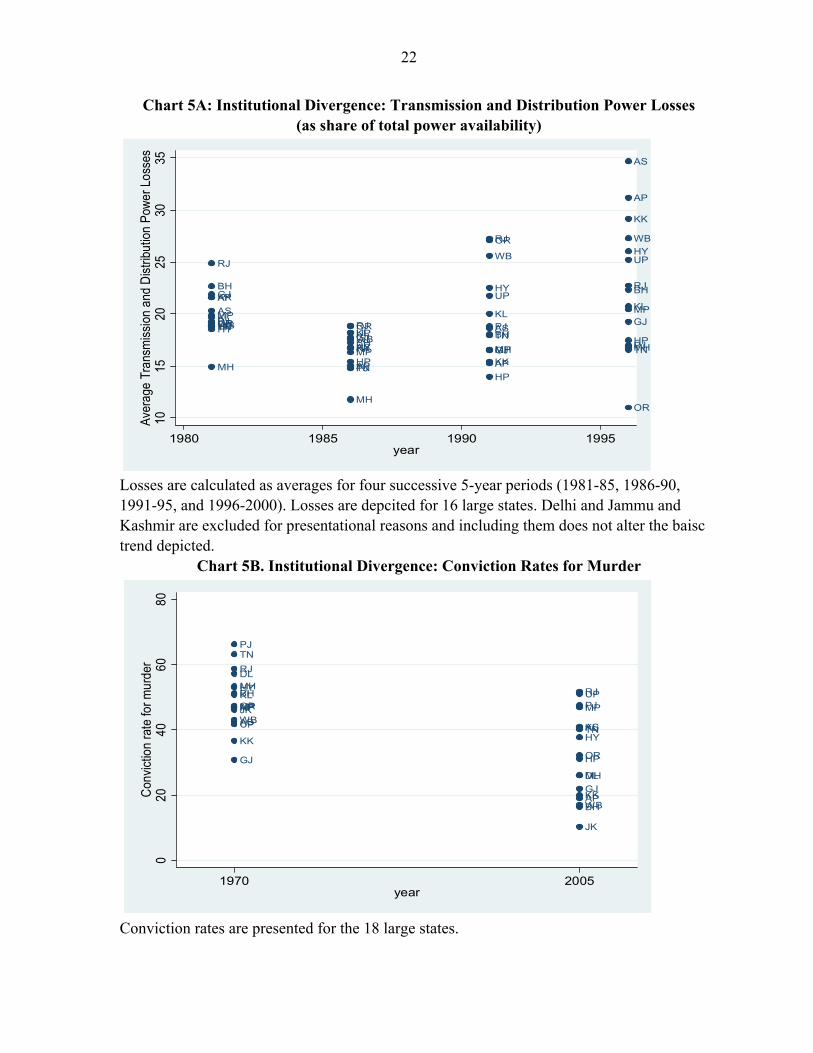
In Chart 5A, we plot the average T&D losses in power for four successive 5-year periods beginning in 1980. We focus on the 18 largest states. The pattern of losses in the period 1981-85 appears anomalous. Since then, however, we see a rising trend in losses (also described earlier) but more significantly we see greater diversity in performance—i.e., the spread of losses widens, reflected in reduced bunching for the last period. The mean and standard deviation for losses were 17.7 and 4.8 for the period 1985-1990, which increased to 25 and 9.6, respectively during the period 1996-2000.6 In Chart 5B, we repeat this for the conviction rates for murder. We have data for 1970 and for the period after the early 1990s. We plot the conviction rates for the 18 largest states for 1970 and 2005. The pattern is very similar to that of the T&D losses. The mean conviction rate declines over time, reflected in a pronounced downward shift for all the states. More interestingly, the dispersion of conviction rates across states also increases. The mean and standard deviation of conviction rates was 49 percent and 8.9 percent in 1970, changing to 32 percent and 31 percent, respectively in 2005. If declining conviction rates are an adverse development, we see worsening average quality and divergence in this quality over time. Thus, in both cases, there seems to be evidence of divergence across states in institutional performance. IV. From institutions to growth In this section, we will look at institutions as the driving force and examine its impact on growth in two different contexts: India in the cross-section of countries; and regions (states and districts) within India. India in the cross-section: Explaining the puzzle of stagnant institutions,rising growth The most striking fact about India’s growth has been the remarkable turnaround in nearly all measures of growth performance since 1980. Output per capita, output per worker, as well as total factor productivity accelerated sharply after 1980. For example, total factor productivity which grew at about 0.3 percent per annum during the period 1960-80, grew at close to 2 percent per annum in the following two decades. The question is why? There is an extensive debate on the possible explanations (see Rodrik and Subramanian, 2005). But for our purposes—i.e. from an institutional perspective, the interesting point relates to what all sides do agree upon. To the extent that policy reforms were indeed an important contributing factor, all sides agree that the magnitude of reforms especially from the early 1980s till the mid-to-late-1990s, when growth was accelerating, was not greater in India than say in other parts of the world, including sub-Saharan Africa and Latin America. India has implemented impressive policy reforms since the early 1980s, and especially, the 1990s. But so too have
6 The change in the mean and standard deviation of losses over time are as dramatic even when two apparent outliers—Delhi and Jammu and Kashmir—are excluded.
10
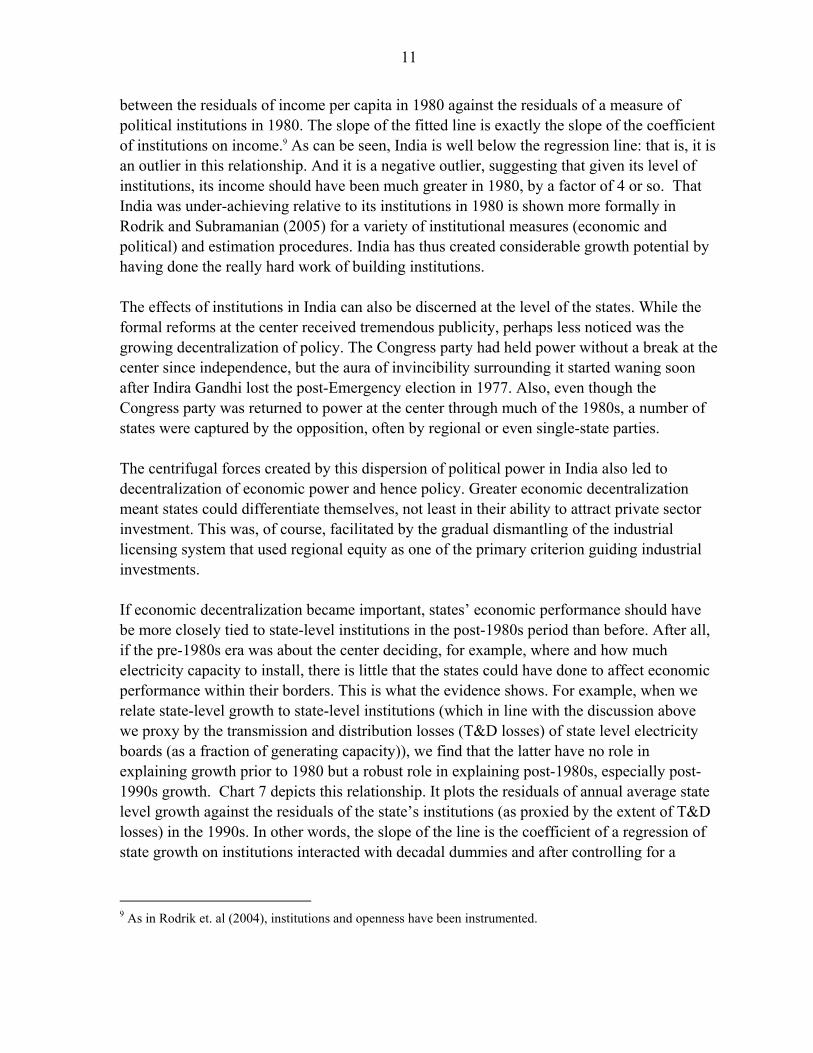
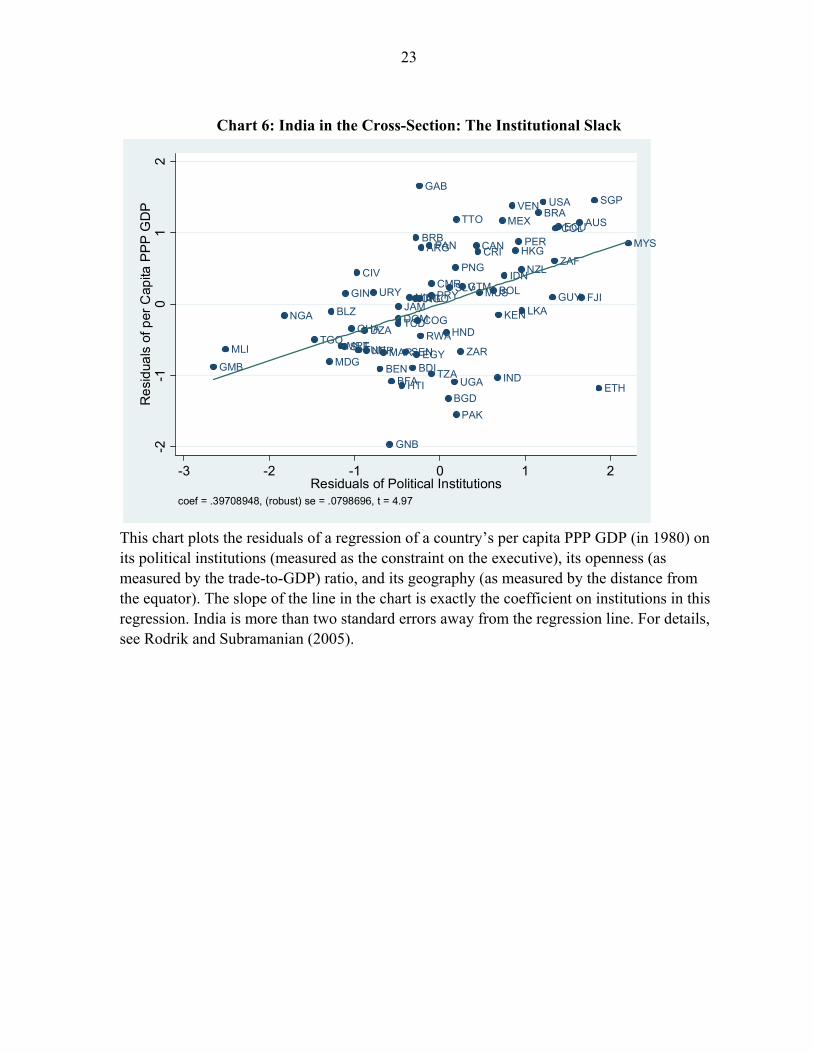
countries in Latin America and sub-Saharan Africa, where reforms have sometimes been broader and deeper than those in India. Ahluwalia (2002), one of the important players in the reform process, himself characterizes the Indian effort as one of “gradualism.” An illustration of the relative pace of reform is provided by indicators of trade policy. The most commonly used measure is due to Sachs and Warner (1995) as updated by Warcziarg and Welch (2003). This is a binary measure which classifies country as either closed or open. Argentina, Brazil, and Mexico were deemed to have made the transition from closed to open in 1991, South Africa in 1991, and Uganda in 1991. In 2000, nearly twenty years after the growth turnaround, India was still classified as a closed economy from the point of view of trade and commercial policies.7 Yet the growth response in these other countries has not been close to that in India. Since 1985, Latin America and sub-Saharan Africa have grown by about 1 percent per capita per year, while India has grown at about 4 to 4.5 percent.8 So, if the reforms were not dissimilar, how does one explain the differential supply or growth response? The short answer could well be: institutions. To understand this point, it is helpful to think of economic development as resulting from the interaction between triggers and fundamentals. Recent research suggests that in the long run, the quality of a country’s public institutions are the key fundamentals of long-run growth. What was holding India back, prior to the 1980s, was a policy regime that was unfavorable to the private sector. Once that was changed through policy reforms, the economic landscape was transformed. The key point here is that even a small trigger–i.e., relatively modest reforms—was sufficient to engender a large growth response because of the considerable under-exploited potential provided by the quality of its institutions. India’s institutions, built up through the decades preceding independence, allowed it to get a big bang for the relatively small buck of reforms (at least compared with other countries). Why did this apparently small trigger elicit such large productivity responses? It is worth noting at the outset that India was very far from its long run or steady-state level of income given the level of its domestic institutions. If the recent literature’s emphasis on the importance of institutions on development is correct, India appears to be far inside the institutions possibility frontier. Chart 6 illustrates this under-achievement and its flip side, namely the potential created by India’s institutional quality. It depicts the relationship
7 This picture of India as a closed economy well into the reform process is confirmed more formally using a gravity model of trade (see Rodrik and Subramanian, 2005). India as a policy laggard would be underscored if other measures of reform such as privatization were analyzed.
8 Latin America is, on average, richer than India, so convergence on its own would suggest higher growth rates in India. But the magnitude of the differential cannot all be explained by convergence dynamics alone.
11
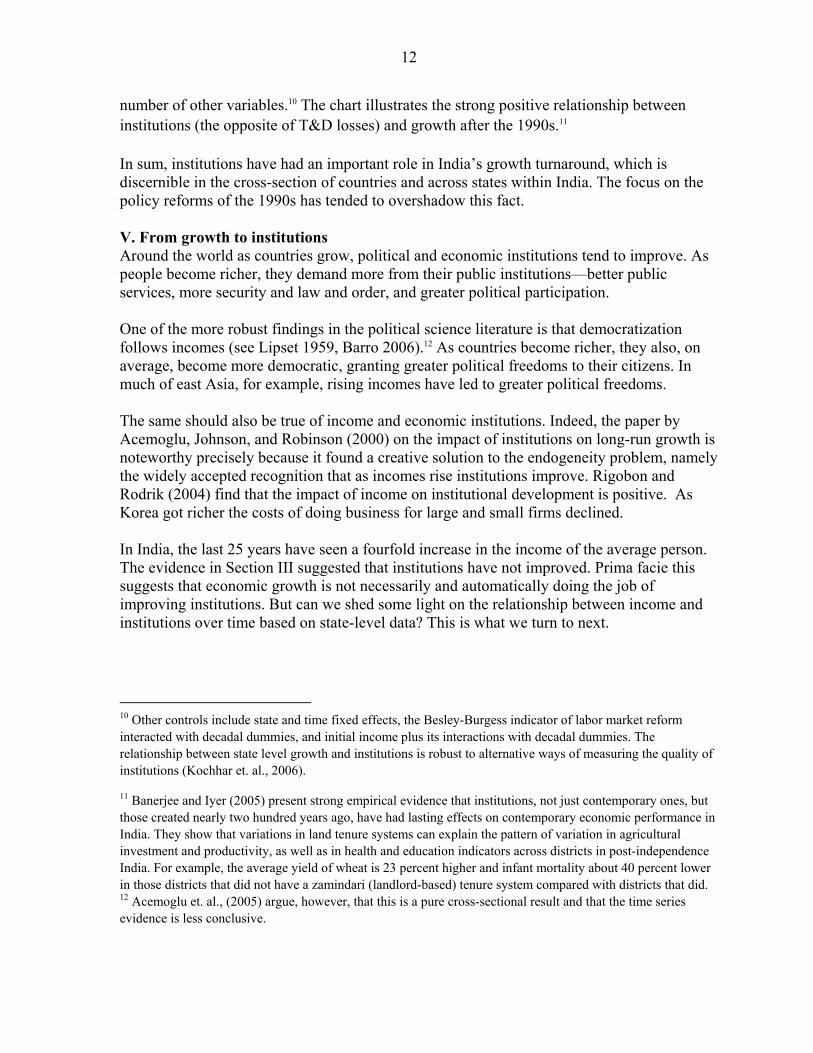
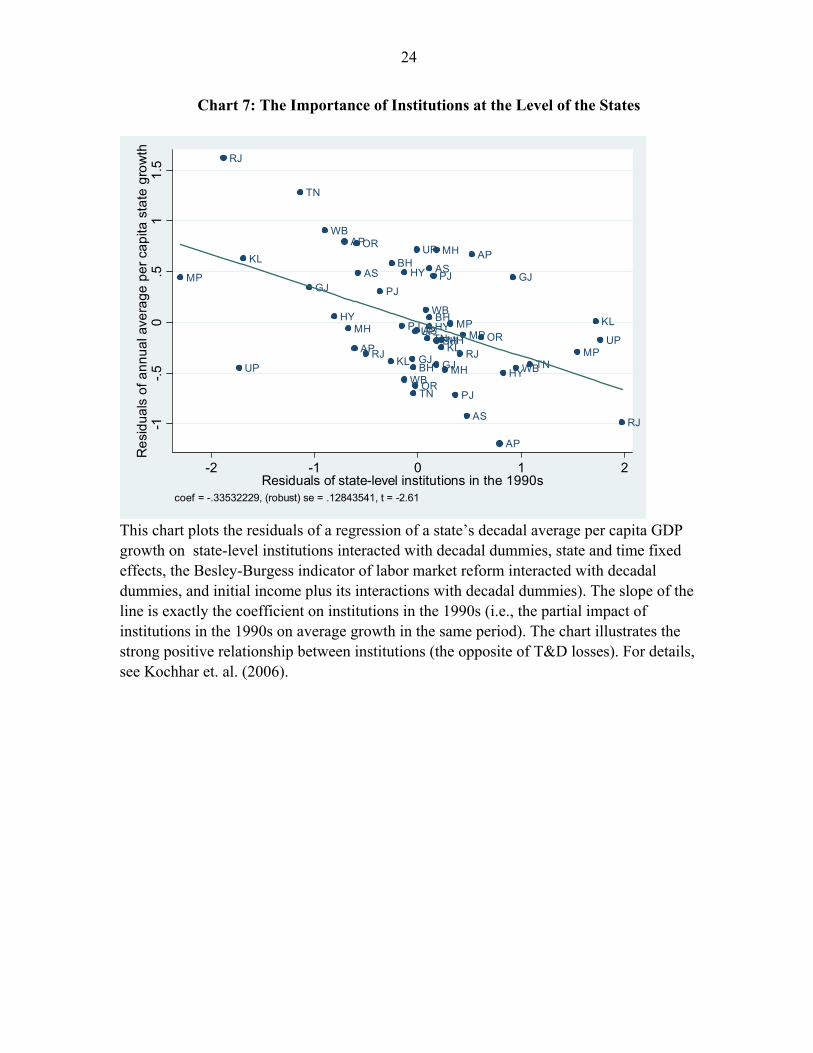
between the residuals of income per capita in 1980 against the residuals of a measure of political institutions in 1980. The slope of the fitted line is exactly the slope of the coefficient of institutions on income.9 As can be seen, India is well below the regression line: that is, it is an outlier in this relationship. And it is a negative outlier, suggesting that given its level of institutions, its income should have been much greater in 1980, by a factor of 4 or so. That India was under-achieving relative to its institutions in 1980 is shown more formally in Rodrik and Subramanian (2005) for a variety of institutional measures (economic and political) and estimation procedures. India has thus created considerable growth potential by having done the really hard work of building institutions. The effects of institutions in India can also be discerned at the level of the states. While the formal reforms at the center received tremendous publicity, perhaps less noticed was the growing decentralization of policy. The Congress party had held power without a break at the center since independence, but the aura of invincibility surrounding it started waning soon after Indira Gandhi lost the post-Emergency election in 1977. Also, even though the Congress party was returned to power at the center through much of the 1980s, a number of states were captured by the opposition, often by regional or even single-state parties. The centrifugal forces created by this dispersion of political power in India also led to decentralization of economic power and hence policy. Greater economic decentralization meant states could differentiate themselves, not least in their ability to attract private sector investment. This was, of course, facilitated by the gradual dismantling of the industrial licensing system that used regional equity as one of the primary criterion guiding industrial investments. If economic decentralization became important, states’ economic performance should have be more closely tied to state-level institutions in the post-1980s period than before. After all, if the pre-1980s era was about the center deciding, for example, where and how much electricity capacity to install, there is little that the states could have done to affect economic performance within their borders. This is what the evidence shows. For example, when we relate state-level growth to state-level institutions (which in line with the discussion above we proxy by the transmission and distribution losses (T&D losses) of state level electricity boards (as a fraction of generating capacity)), we find that the latter have no role in explaining growth prior to 1980 but a robust role in explaining post-1980s, especially post-1990s growth. Chart 7 depicts this relationship. It plots the residuals of annual average state level growth against the residuals of the state’s institutions (as proxied by the extent of T&D losses) in the 1990s. In other words, the slope of the line is the coefficient of a regression of state growth on institutions interacted with decadal dummies and after controlling for a
9 As in Rodrik et. al (2004), institutions and openness have been instrumented.
12
number of other variables.10 The chart illustrates the strong positive relationship between institutions (the opposite of T&D losses) and growth after the 1990s.11 In sum, institutions have had an important role in India’s growth turnaround, which is discernible in the cross-section of countries and across states within India. The focus on the policy reforms of the 1990s has tended to overshadow this fact. V. From growth to institutions Around the world as countries grow, political and economic institutions tend to improve. As people become richer, they demand more from their public institutions—better public services, more security and law and order, and greater political participation. One of the more robust findings in the political science literature is that democratization follows incomes (see Lipset 1959, Barro 2006).12 As countries become richer, they also, on average, become more democratic, granting greater political freedoms to their citizens. In much of east Asia, for example, rising incomes have led to greater political freedoms. The same should also be true of income and economic institutions. Indeed, the paper by Acemoglu, Johnson, and Robinson (2000) on the impact of institutions on long-run growth is noteworthy precisely because it found a creative solution to the endogeneity problem, namely the widely accepted recognition that as incomes rise institutions improve. Rigobon and Rodrik (2004) find that the impact of income on institutional development is positive. As Korea got richer the costs of doing business for large and small firms declined. In India, the last 25 years have seen a fourfold increase in the income of the average person. The evidence in Section III suggested that institutions have not improved. Prima facie this suggests that economic growth is not necessarily and automatically doing the job of improving institutions. But can we shed some light on the relationship between income and institutions over time based on state-level data? This is what we turn to next. 10 Other controls include state and time fixed effects, the Besley-Burgess indicator of labor market reform interacted with decadal dummies, and initial income plus its interactions with decadal dummies. The relationship between state level growth and institutions is robust to alternative ways of measuring the quality of institutions (Kochhar et. al., 2006).
11 Banerjee and Iyer (2005) present strong empirical evidence that institutions, not just contemporary ones, but those created nearly two hundred years ago, have had lasting effects on contemporary economic performance in India. They show that variations in land tenure systems can explain the pattern of variation in agricultural investment and productivity, as well as in health and education indicators across districts in post-independence India. For example, the average yield of wheat is 23 percent higher and infant mortality about 40 percent lower in those districts that did not have a zamindari (landlord-based) tenure system compared with districts that did. 12 Acemoglu et. al., (2005) argue, however, that this is a pure cross-sectional result and that the time series evidence is less conclusive.
13
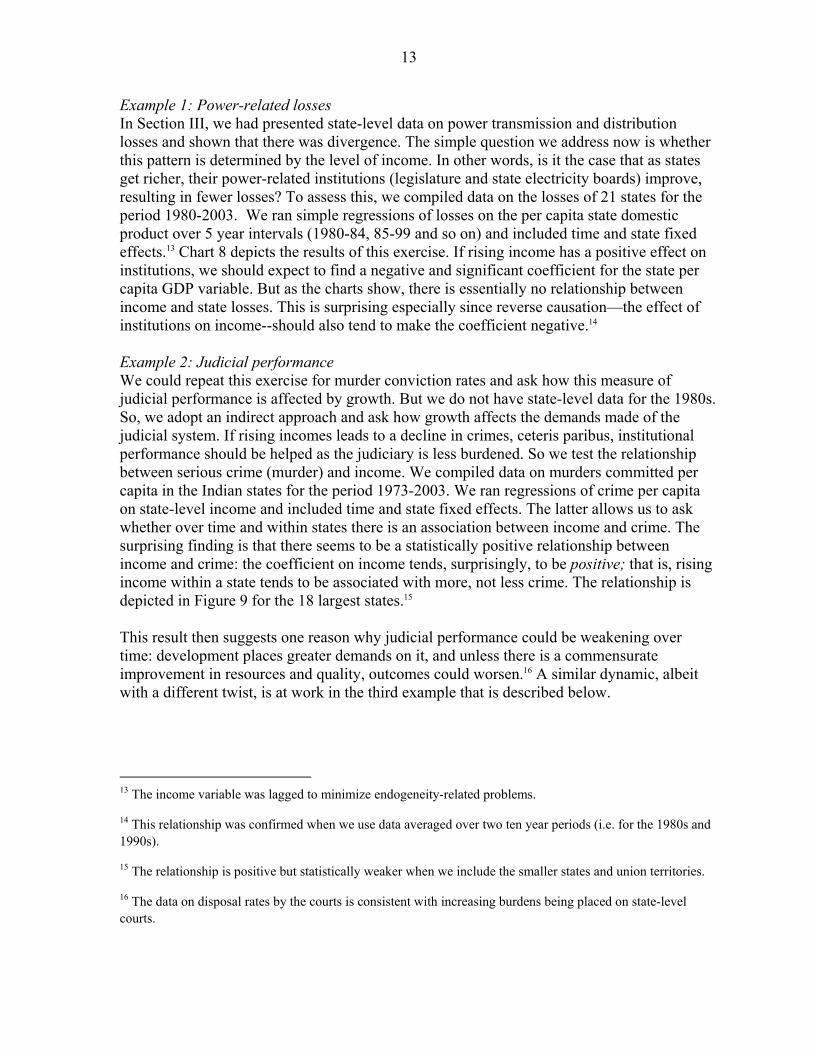
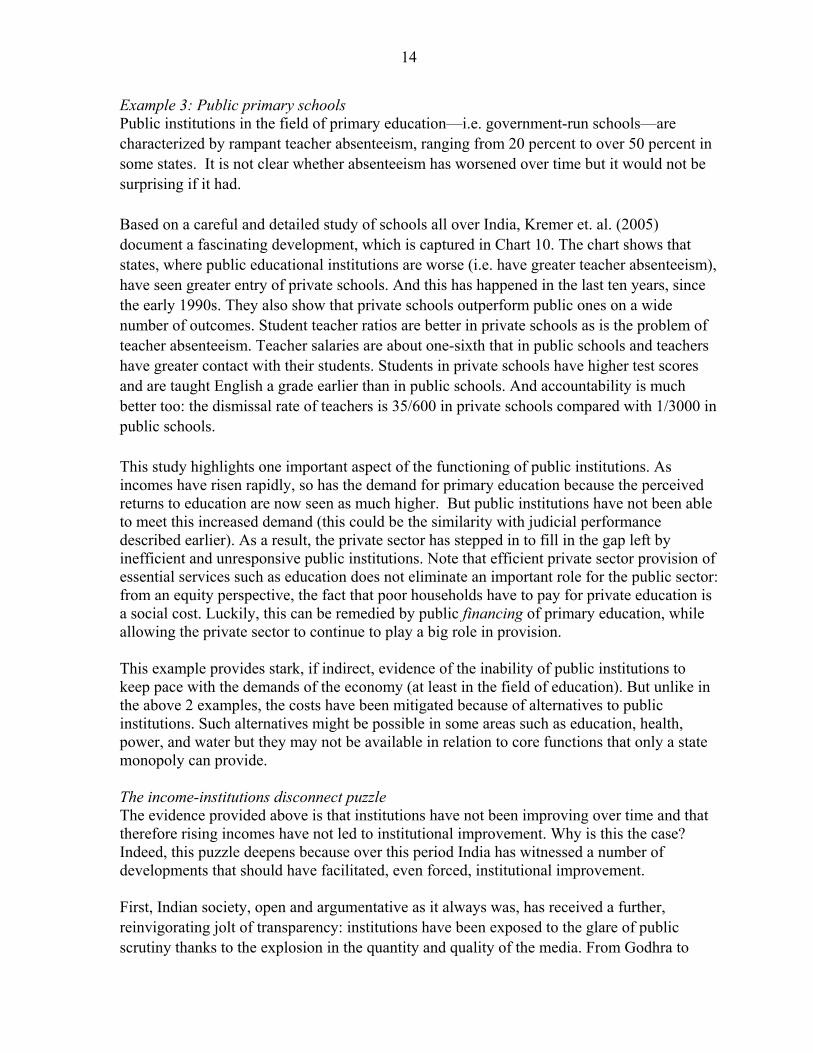
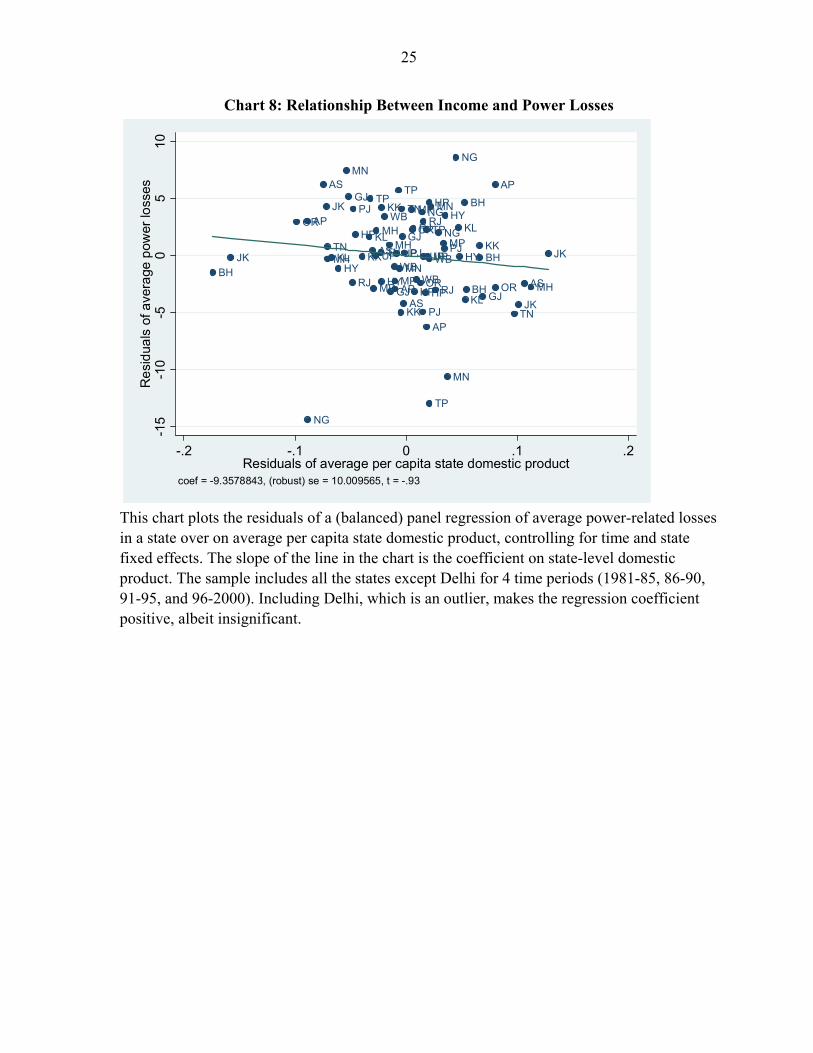
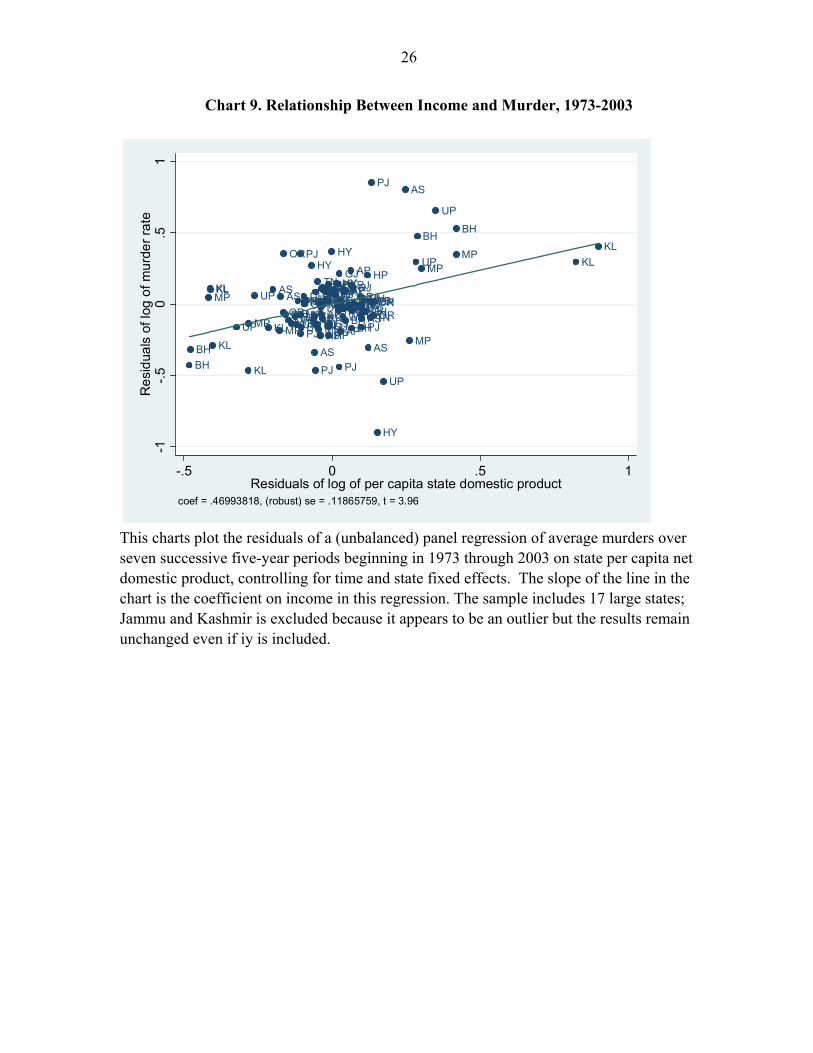
Example 1: Power-related losses In Section III, we had presented state-level data on power transmission and distribution losses and shown that there was divergence. The simple question we address now is whether this pattern is determined by the level of income. In other words, is it the case that as states get richer, their power-related institutions (legislature and state electricity boards) improve, resulting in fewer losses? To assess this, we compiled data on the losses of 21 states for the period 1980-2003. We ran simple regressions of losses on the per capita state domestic product over 5 year intervals (1980-84, 85-99 and so on) and included time and state fixed effects.13 Chart 8 depicts the results of this exercise. If rising income has a positive effect on institutions, we should expect to find a negative and significant coefficient for the state per capita GDP variable. But as the charts show, there is essentially no relationship between income and state losses. This is surprising especially since reverse causation—the effect of institutions on income--should also tend to make the coefficient negative.14 Example 2: Judicial performance We could repeat this exercise for murder conviction rates and ask how this measure of judicial performance is affected by growth. But we do not have state-level data for the 1980s. So, we adopt an indirect approach and ask how growth affects the demands made of the judicial system. If rising incomes leads to a decline in crimes, ceteris paribus, institutional performance should be helped as the judiciary is less burdened. So we test the relationship between serious crime (murder) and income. We compiled data on murders committed per capita in the Indian states for the period 1973-2003. We ran regressions of crime per capita on state-level income and included time and state fixed effects. The latter allows us to ask whether over time and within states there is an association between income and crime. The surprising finding is that there seems to be a statistically positive relationship between income and crime: the coefficient on income tends, surprisingly, to be positive; that is, rising income within a state tends to be associated with more, not less crime. The relationship is depicted in Figure 9 for the 18 largest states.15 This result then suggests one reason why judicial performance could be weakening over time: development places greater demands on it, and unless there is a commensurate improvement in resources and quality, outcomes could worsen.16 A similar dynamic, albeit with a different twist, is at work in the third example that is described below.
13 The income variable was lagged to minimize endogeneity-related problems.
14 This relationship was confirmed when we use data averaged over two ten year periods (i.e. for the 1980s and 1990s).
15 The relationship is positive but statistically weaker when we include the smaller states and union territories.
16 The data on disposal rates by the courts is consistent with increasing burdens being placed on state-level courts.
14
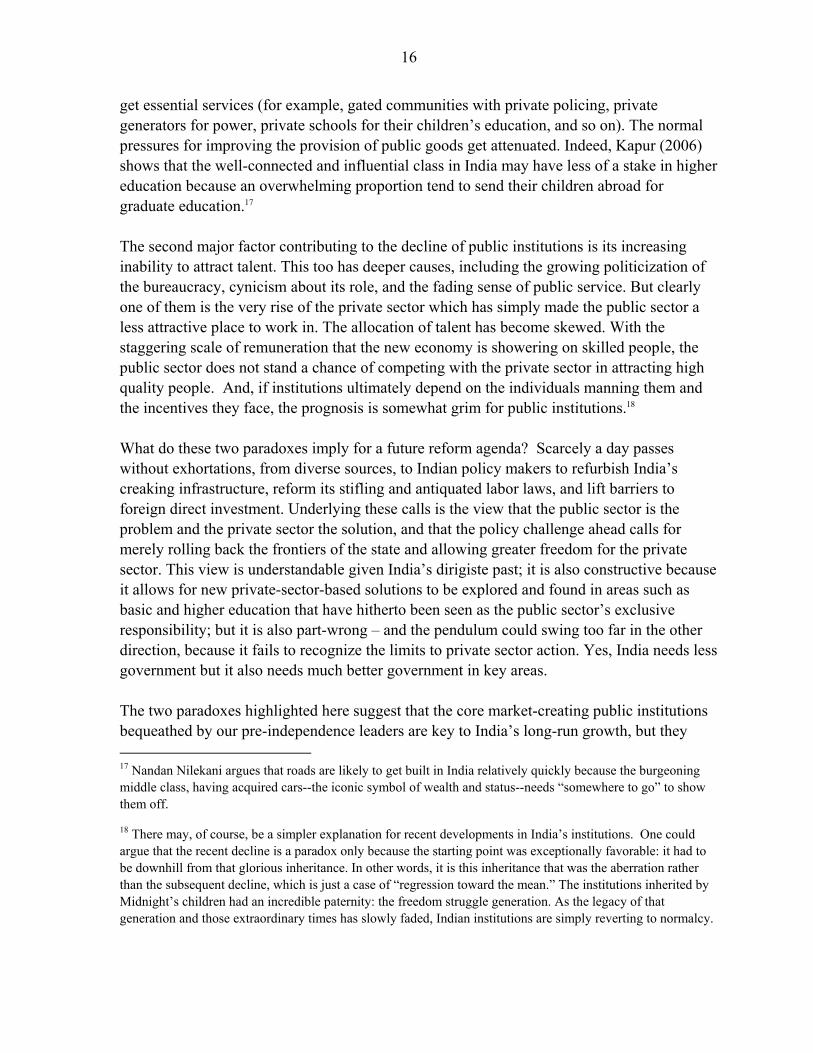
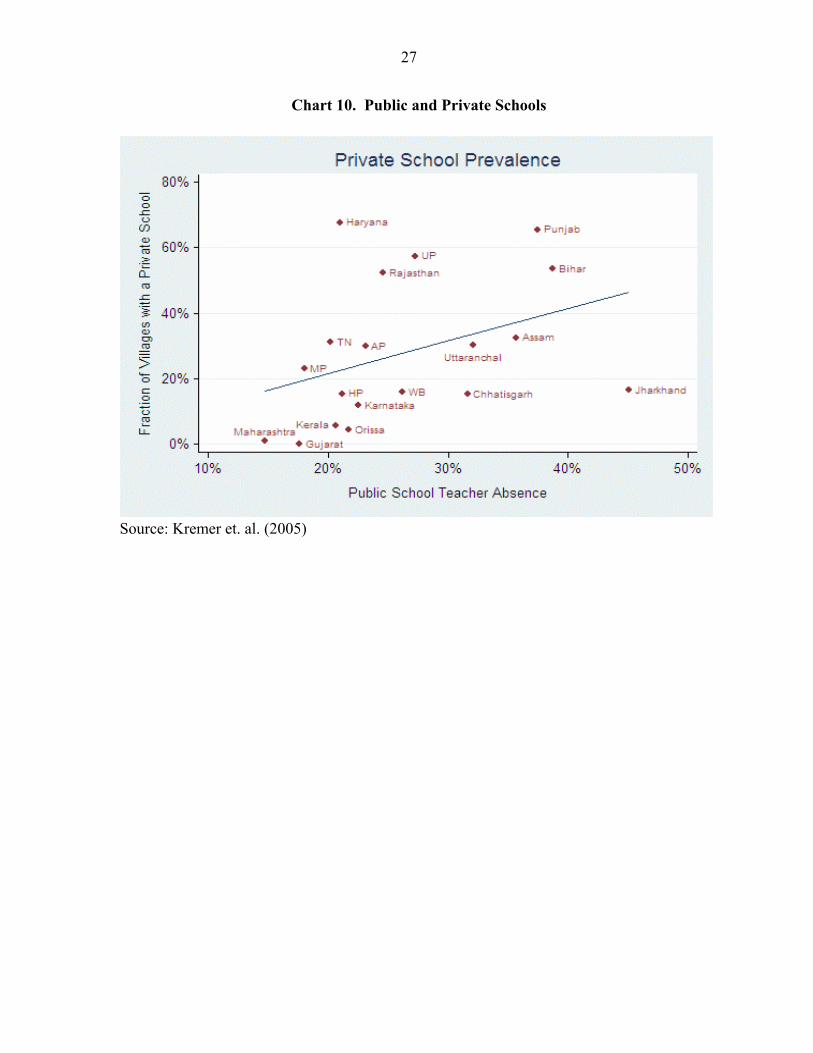
Example 3: Public primary schools Public institutions in the field of primary education—i.e. government-run schools—are characterized by rampant teacher absenteeism, ranging from 20 percent to over 50 percent in some states. It is not clear whether absenteeism has worsened over time but it would not be surprising if it had. Based on a careful and detailed study of schools all over India, Kremer et. al. (2005) document a fascinating development, which is captured in Chart 10. The chart shows that states, where public educational institutions are worse (i.e. have greater teacher absenteeism), have seen greater entry of private schools. And this has happened in the last ten years, since the early 1990s. They also show that private schools outperform public ones on a wide number of outcomes. Student teacher ratios are better in private schools as is the problem of teacher absenteeism. Teacher salaries are about one-sixth that in public schools and teachers have greater contact with their students. Students in private schools have higher test scores and are taught English a grade earlier than in public schools. And accountability is much better too: the dismissal rate of teachers is 35/600 in private schools compared with 1/3000 in public schools. This study highlights one important aspect of the functioning of public institutions. As incomes have risen rapidly, so has the demand for primary education because the perceived returns to education are now seen as much higher. But public institutions have not been able to meet this increased demand (this could be the similarity with judicial performance described earlier). As a result, the private sector has stepped in to fill in the gap left by inefficient and unresponsive public institutions. Note that efficient private sector provision of essential services such as education does not eliminate an important role for the public sector: from an equity perspective, the fact that poor households have to pay for private education is a social cost. Luckily, this can be remedied by public financing of primary education, while allowing the private sector to continue to play a big role in provision. This example provides stark, if indirect, evidence of the inability of public institutions to keep pace with the demands of the economy (at least in the field of education). But unlike in the above 2 examples, the costs have been mitigated because of alternatives to public institutions. Such alternatives might be possible in some areas such as education, health, power, and water but they may not be available in relation to core functions that only a state monopoly can provide. The income-institutions disconnect puzzle The evidence provided above is that institutions have not been improving over time and that therefore rising incomes have not led to institutional improvement. Why is this the case? Indeed, this puzzle deepens because over this period India has witnessed a number of developments that should have facilitated, even forced, institutional improvement. First, Indian society, open and argumentative as it always was, has received a further, reinvigorating jolt of transparency: institutions have been exposed to the glare of public scrutiny thanks to the explosion in the quantity and quality of the media. From Godhra to
15
Tehelka, it seems that not much can elude the prying eyes of the press or television. Greater transparency should have led to more accountable institutions. Second, the license-quota-permit raj, a big source of corruption and patronage, with its deeply corrosive effect on public institutions, is being progressively dismantled. While it is true that the locus of rent-seeking may have shifted—from acquiring import and industrial licenses in the dirigiste policy regime of the past to acquiring land, which is now the priceless government-controlled asset in a booming economy—it would be surprising if there were not fewer rents in the aggregate and hence fewer rent-seekers in the system. Indeed, Chart 4 illustrates this point clearly. There has been a significant decline in evasion as tariffs have come down—fewer rents should have reduced rent-seeking. Third, civil society has become a vibrantly assertive presence in India. Indian civil society has taken on at least two roles: a direct one, in delivering development outcomes, and an indirect one, striving to hold public institutions accountable. Civil society has scored many important successes—from the very visible one of getting Delhi’s environment cleaned up through public interest litigation to phenomenal efforts in the field of education. Civil society can now be fairly described as the fifth pillar of the Indian polity. Fourth, with greater decentralization of political and economic power, the healthy dynamic of competition between states has been unleashed. This allows for demonstration effects: citizens in Bihar can look at their counterparts in Maharashtra and question why they must be in darkness for longer periods without electricity, and why their children must suffer from rampant teacher absenteeism, condemning them to educational backwardness. In turn, this questioning and discontent should have led to a more active, demanding citizenry.
V. Concluding Remarks Why then, despite all these favorable developments, have India’s institutions not improved perceptibly? Some possible explanations, not fully satisfactory, come to mind. Clearly, much more research is required on these issues. Although growth has accelerated and poverty has declined substantially, divergences have increased too. Some regions and groups—for example, the adivasis constituting about 80 million people—have partaken minimally, if at all, of the fruits of economic growth. It is no coincidence that Naxalite activity is strongest in the tribal belt spread across central and eastern India, feeding on the fertile climate of alienation and disenfranchisement. A rising tide need not lift all boats uniformly but if important, identifiable ones are left grounded, that could be a recipe for disaffection, and eventually conflict. Unequal growth also has subtler effects on institutions. Recall the dynamic of growth leading to a greater demand for better public institutions. But if growth is more concentrated at the upper ends of the income spectrum, there is the distinct possibility of what Albert Hirschman called “exit”: the rich opt out of the public system, turning to the private sector to
16
get essential services (for example, gated communities with private policing, private generators for power, private schools for their children’s education, and so on). The normal pressures for improving the provision of public goods get attenuated. Indeed, Kapur (2006) shows that the well-connected and influential class in India may have less of a stake in higher education because an overwhelming proportion tend to send their children abroad for graduate education.17 The second major factor contributing to the decline of public institutions is its increasing inability to attract talent. This too has deeper causes, including the growing politicization of the bureaucracy, cynicism about its role, and the fading sense of public service. But clearly one of them is the very rise of the private sector which has simply made the public sector a less attractive place to work in. The allocation of talent has become skewed. With the staggering scale of remuneration that the new economy is showering on skilled people, the public sector does not stand a chance of competing with the private sector in attracting high quality people. And, if institutions ultimately depend on the individuals manning them and the incentives they face, the prognosis is somewhat grim for public institutions.18 What do these two paradoxes imply for a future reform agenda? Scarcely a day passes without exhortations, from diverse sources, to Indian policy makers to refurbish India’s creaking infrastructure, reform its stifling and antiquated labor laws, and lift barriers to foreign direct investment. Underlying these calls is the view that the public sector is the problem and the private sector the solution, and that the policy challenge ahead calls for merely rolling back the frontiers of the state and allowing greater freedom for the private sector. This view is understandable given India’s dirigiste past; it is also constructive because it allows for new private-sector-based solutions to be explored and found in areas such as basic and higher education that have hitherto been seen as the public sector’s exclusive responsibility; but it is also part-wrong – and the pendulum could swing too far in the other direction, because it fails to recognize the limits to private sector action. Yes, India needs less government but it also needs much better government in key areas. The two paradoxes highlighted here suggest that the core market-creating public institutions bequeathed by our pre-independence leaders are key to India’s long-run growth, but they 17 Nandan Nilekani argues that roads are likely to get built in India relatively quickly because the burgeoning middle class, having acquired cars--the iconic symbol of wealth and status--needs “somewhere to go” to show them off.
18 There may, of course, be a simpler explanation for recent developments in India’s institutions. One could argue that the recent decline is a paradox only because the starting point was exceptionally favorable: it had to be downhill from that glorious inheritance. In other words, it is this inheritance that was the aberration rather than the subsequent decline, which is just a case of “regression toward the mean.” The institutions inherited by Midnight’s children had an incredible paternity: the freedom struggle generation. As the legacy of that generation and those extraordinary times has slowly faded, Indian institutions are simply reverting to normalcy.
17
may not have kept pace with Indian economic realities. The good news is that some of these institutions, especially those relating to regulation, need not be fatally decisive in terms of their growth impact because of private sector alternatives. But we may well be fast using up the slack from the legacy in relation to the core institutions: the Indian growth engine could sputter as much from weaknesses in the soft infrastructure of institutions as the hard one of roads, power plants, and ports. Neglecting institutional reform is tempting because institutions are notoriously difficult to change. Where does one even start when thinking of reforming the Indian bureaucracy or police or judiciary? But in core areas, relying on growth and policy reforms to automatically lead to institutional improvement is hardly a serious option as some of the evidence presented above suggests. A starting point has to be the recognition that allowing institutional decline could well come back to haunt not just policy-makers but the private sector as well, whose fortunes depend crucially on strong and effective public institutions. Rehabilitating the institutions bequeathed by Mahatma Gandhi, Pandit Nehru and others, and not just finding creative ways of working around them, should consume the energies of Midnight’s grandchildren. A rich and relatively unexplored research and policy agenda lies ahead.
18
Chart 1: Power Generation and Distribution Losses, 1970-2003
0
5
10
15
20
25
30
1971
1973
1975
1977
1979
1981
1983
1985
1987
1989
1991
1993
1995
1997
1999
2001
2003
Brazil India Indonesia Korea, D.P.R Mexico South Africa
Source: World Bank’s World Development Indicators.
19
Chart 2. Disposal Rates of Murder-Related Crimes by Courts, 1973-2005 (as a proportion of total outstanding cases)
0
0.05
0.1
0.15
0.2
0.25
0.3
0.35
0.4
1973 1978 1983 1988 1993 1998 2003 2005
Murder Culpable Homicide not amounting to murder Total IPC crimes
Source: Mishra and Subramanian (forthcoming) based on data from “Crime in India” a compendium of crime statistics published annually by National Crime Records Bureau (NCRB), Ministry of Home Affairs, India. Disposal rate is measured as the ratio of number of cases in which trials were completed during the year (comprising all cases that were convicted or acquitted/discharged) to the total number of cases for trial (sum of cases reported during the year and cases pending cases from the previous year)
20
Chart 3A. Conviction Rates, 1970-2005
0
10
20
30
40
50
60
70
1970 1973 1978 1983 1988 1993 1998 2003 2005
Murder Culpable Homicide not amounting to murder Total IPC Crimes
Chart 3b. Conviction Rates for Murder in Peninsular and BIMARU States, 1970-2005
0
10
20
30
40
50
60
1970 1993 1998 2003 2005
Peninsular BIMARU Source: Source: Mishra and Subramanian (forthcoming) based on data in the National Crime Records Bureau (NCRB). Source: Mishra and Subramanian (forthcoming) based on data from “Crime in India” a compendium of crime statistics published annually by National Crime Records Bureau (NCRB), Ministry of Home Affairs, India. Conviction rate is measured as the percentage of total completed trials during the year which were convicted (i.e., (number of convicted cases/ total number of completed trials)*100). Peninsular states comprise Gujarat, Maharashtra, Karnataka, Kerala, Tamil Nadu and Andhra Pradesh. BIMARU states comprise Bihar, Madhya Pradesh, Uttar Pradesh, and Rajasthan.
21
Chart 4. Import Evasion, 1988-2002
0.800
0.900
1.000
1.100
1.200
1.300
1.400
1.500
1988 1989 1990 1991 1992 1993 1994 1995 1996 1997 1998 1999 2000 2001 2002 2003
Assumption. Products reported by exporting countries but missing in Indian imports are smuggled completely
Source: Mishra, Subramanian, and Topalova (forthcoming). Evasion is measured as: log(1+ recorded exports)-log(1+ recorded imports)
22
Chart 5A: Institutional Divergence: Transmission and Distribution Power Losses (as share of total power availability)
APAS
BHGJ
HYHP
KK
KLMP
MH
ORPJ
RJ
TNUPWB
AP
ASBHGJHYHPKK
KL
MP
MH
OR
PJ
RJ
TN
UPWB
AP
ASBH
GJ
HY
HP
KK
KL
MPMH
OR
PJ
RJ
TN
UP
WB
AP
AS
BH
GJ
HY
HP
KK
KLMP
MH
OR
PJ
RJ
TN
UP
WB
1015
2025
3035
Aver
age
Tran
smiss
ion
and
Dist
ribut
ion P
ower
Los
ses
1980 1985 1990 1995year
Losses are calculated as averages for four successive 5-year periods (1981-85, 1986-90, 1991-95, and 1996-2000). Losses are depcited for 16 large states. Delhi and Jammu and Kashmir are excluded for presentational reasons and including them does not alter the baisc trend depicted.
Chart 5B. Institutional Divergence: Conviction Rates for Murder
APAS
BH
DL
GJ
HY
HPJK
KK
KLMP
MH
OR
PJ
RJTN
UPWB
AP
AS
BH
DLGJ
HY
HP
JK
KK
KL
MP
MH
OR
PJRJ
TN
UP
WB
020
4060
80Co
nvict
ion
rate
for m
urde
r
1970 2005year
Conviction rates are presented for the 18 large states.
23
Chart 6: India in the Cross-Section: The Institutional Slack
GMB
MLI
NGA
TGO
MDG
BLZ
MRTSLE
GIN
GHA
CIV
TUN
DZA
NER
URY
BENMAR
GNB
BFA
TCDDOMJAM
HTI
SEN
NIC
BDI
CHL
BRB
EGY
COG
GAB
AGO
RWA
ARGPAN
PRY
TZA
CMR
HND
BGD
SLV
UGA
PNG
TTO
PAK
ZAR
GTM
CANCRI
MUSBOL
IND
KEN
MEX
IDN
VEN
HKGPER
NZL
LKA
BRAUSA
GUY
ZAF
COLECUAUS
FJI
SGP
ETH
MYS
-2-1
01
2R
esid
uals
of p
er C
apita
PP
P G
DP
-3 -2 -1 0 1 2Residuals of Political Institutions
coef = .39708948, (robust) se = .0798696, t = 4.97
This chart plots the residuals of a regression of a country’s per capita PPP GDP (in 1980) on its political institutions (measured as the constraint on the executive), its openness (as measured by the trade-to-GDP) ratio, and its geography (as measured by the distance from the equator). The slope of the line in the chart is exactly the coefficient on institutions in this regression. India is more than two standard errors away from the regression line. For details, see Rodrik and Subramanian (2005).
24
Chart 7: The Importance of Institutions at the Level of the States
MP
RJ
UP
KL
TN
GJ
WB
HY
AP
MH
AP
OR
AS
RJ
PJ
KL
BH
PJ
WB
HY
GJBH
TN
UP
OR
UP
AS
WB
TNHY
AS
BH
PJ
GJ
MH
BHMHKL
MH
MP
PJ
RJ
MP
AS
AP
OR
AP
HY
GJ
WBTNMP
KL
UP
RJ-1-.5
0.5
11.
5R
esid
uals
of a
nnua
l ave
rage
per
cap
ita s
tate
gro
wth
-2 -1 0 1 2Residuals of state-level institutions in the 1990s
coef = -.33532229, (robust) se = .12843541, t = -2.61
This chart plots the residuals of a regression of a state’s decadal average per capita GDP growth on state-level institutions interacted with decadal dummies, state and time fixed effects, the Besley-Burgess indicator of labor market reform interacted with decadal dummies, and initial income plus its interactions with decadal dummies). The slope of the line is exactly the coefficient on institutions in the 1990s (i.e., the partial impact of institutions in the 1990s on average growth in the same period). The chart illustrates the strong positive relationship between institutions (the opposite of T&D losses). For details, see Kochhar et. al. (2006).
25
Chart 8: Relationship Between Income and Power Losses
BHJK
ORAP
NG
AS
JK
TNMHKL
HY
MN
GJ
RJ
PJ
HP
KK
KL
TP
AS
MP
UP
MH
TN
HY
KKWB
MH
GJ
WBMPAP
UP
TP
MN
KK
TN
GJ
AS
PJ
MP
ORRJ
HPWBOR
NG
PJ
RJ
UP
HP
TP
AP
UP
HP
WB
TP
MN
RJ
NGMPPJ
HY
MN
NG
KL
HY
BH
KLBH
KKBH
GJ
AP
OR
TNJK
ASMH
JK
-15
-10
-50
510
Res
idua
ls o
f ave
rage
pow
er lo
sses
-.2 -.1 0 .1 .2Residuals of average per capita state domestic product
coef = -9.3578843, (robust) se = 10.009565, t = -.93
This chart plots the residuals of a (balanced) panel regression of average power-related losses in a state over on average per capita state domestic product, controlling for time and state fixed effects. The slope of the line in the chart is the coefficient on state-level domestic product. The sample includes all the states except Delhi for 4 time periods (1981-85, 86-90, 91-95, and 96-2000). Including Delhi, which is an outlier, makes the regression coefficient positive, albeit insignificant.
26
Chart 9. Relationship Between Income and Murder, 1973-2003
BHBH
MPKLKL
KL
UP
KL
MP
UP
KL
AS
MP
ASOR
OR
RJORWBRJUP
TNHY
PJ
MP
PJUP
DHHPGJDH
HY
APKK
AS
PJ
WB
TN
TN
RJ
WB
MHHPAS
DHAP
MHGJ
KKMHAPHYTNMHKKMHAP
HPGJ
HP
GJ
DH
HY
WBHPPJHY
TN
KK
KK
PJ
GJ
KK
AP
HPWBMHKKHYDHBH
APGJGJ
APRJ
BH
DH
RJWBTN
RJ
ORPJASRJORMHDH
HP
AS
WBTN
PJ
ORORBH
HY
UP
AS
MP
UP
BH
MP
UP
MP
BH
KLKL
-1-.5
0.5
1R
esid
uals
of l
og o
f mur
der r
ate
-.5 0 .5 1Residuals of log of per capita state domestic product
coef = .46993818, (robust) se = .11865759, t = 3.96
This charts plot the residuals of a (unbalanced) panel regression of average murders over seven successive five-year periods beginning in 1973 through 2003 on state per capita net domestic product, controlling for time and state fixed effects. The slope of the line in the chart is the coefficient on income in this regression. The sample includes 17 large states; Jammu and Kashmir is excluded because it appears to be an outlier but the results remain unchanged even if iy is included.
27
Chart 10. Public and Private Schools
Source: Kremer et. al. (2005)
28
References
Acemoglu, Daron, Simon Johnson, and James A. Robinson, "The Colonial Origins of Comparative Development: An Empirical Investigation," American Economic Review, 91, 5, December 2001, 1369-1401. Acemoglu, Daron, Simon Johnson, James A. Robinson, and Pierre Yared, 2005, “Income and Democracy,” National Bureau of Economic Research Working Paper No. 11205. Ahluwalia, M.S., 2002, “Economic Reforms in India Since 1991: Has Gradualism Worked,”
Journal of Economic Perspectives, Vol. 16, No. 7, pp. 67-88. Ahmed, S. and S. Ejaz Ghani, 2006, “South Asia: Growth and Regional Integration,” World
Bank, Washington D.C. Aiyar, Swaminathan, 2006, “Falling Governance, Rising Growth,” Economic Times,
August 2. Banerjee, A., and L. Iyer, 2005, History, institutions and economic performance: the legacy
of colonial land tenure systems in India,” American Economic Review, Vol. 95, No. 4.
Barro, R.J., 1996, “Democracy and Growth,” Journal of Economic Growth, Vol. 1 No. 1, pp. 1-27.
Das, S.K., 2005, “Institutions of Internal Accountability, in Devesh Kapur and Pratap Mehta (ed.), 2005, Public Instiutions in India: Performance and Design, Oxford University Press, New Delhi.
Engerman, Stanley L., and Kenneth L. Sokoloff, “Factor Endowments, Institutions, and Differential Paths of Growth Among New World Economies: A View from Economic Historians of the United States,” National Bureau of Economic Research Working Paper No. H0066, December 1994. Hall, Robert, and Chad I. Jones, “Why Do Some Countries Produce So Much More Output per Worker than Others?” Quarterly Journal of Economics, 114, 1, February 1999, 83-116. Daniel Kaufmann, Aart Kraay, and Massimo Mastruzzi (2006). "Governance Matters V: Aggregate and Individual Governance Indicators 1996-2005". WBPRDWP#4012
29
Kapur, Devesh, 2005, “Explaining Democratic Durability and Economic Performance: The Role of India’s Institutions,” in Devesh Kapur and Pratap Mehta (ed.), 2005, Public Instiutions in India: Performance and Design, Oxford University Press, New Delhi.
Kapur, Devesh, 2006, “Globalization and the Paradox of Indian Democracy,” mimeo, University of Pennsylvania.
Kapur, Devesh, and Pratap Mehta (ed.), 2005, Public Instiutions in India: Performance and Design, Oxford University Press, New Delhi.
Kochhar, Kalpana, Utsav Kumar, Raghuram Rajan, Arvind Subramanian, and Ioannis
Tokatlidis, 2006, “India’s Pattern of Development: What Happened, What Follows,” Journal of Monetary Economics, Vol. 53, pp. 981-1019.
Kremer, Michael; Muralidharan, Karthik; Chaudhury, Nazmul; Rogers, F. Halsey and Hammer, Jeffrey. "Teacher Absence in India: A Snapshot." Journal of the European Economic Association, 2005, 3(2-3), pp. 658-67.
Krishnan, K.P. and T.V. Somanathan, 2005, “Civil Service: An Institutional perspective,” in Devesh Kapur and Pratap Mehta (ed.), 2005, Public Instiutions in India: Performance and Design, Oxford University Press, New Delhi.
Levitt, Steven, D., 1998, “The Relationship Between Crime Reporting and Police: Implications for the use of Uniform Crime Reports,” Journal of Quantitative Criminology, Vol. 14, No.1., pp. 61-81.
Lipset, S.M., 1959, “Some Social Requisites of Democracy: Economic Development and Political Legitimacy,” The American Political Science Review.
Mehta, Pratap, 2005, “India’s Judiciary: “The Promise of Uncertainty,” in Devesh Kapur and Pratap Mehta (ed.), 2005, Public Instiutions in India: Performance and Design, Oxford University Press, New Delhi.
Mishra, P., A. Subramanian, and P. Topalova, 2006, “Tariff Policy, Institutions, and Evasion: The Case of Indian Customs,” mimeo, International Monetary Fund.
Mishra, P., and A. Subramanian, “Determinants of Crime in India,” work-in-progress. North, Douglass C., Institutions, Institutional Change and Economic Performance, New York, Cambridge University Press, 1990. Rigobon, R. and D. Rodrik, 2004, “Rule of Law, Democracy, Openness and Income: Estimating the Interrelationships,” Center for Economic Policy Discussion Paper, No. 4653
30
Rodrik, Dani, and Arvind Subramanian, 2004, “Why India Can Growth at Seven Percent a Year or More? Projections and Reflections” Economic and Political Weekly.
Rodrik, Dani, and Arvind Subramanian, 2005, “From Hindu Growth to Productivity Surge:
The Mystery of the Indian Growth Transition,” IMF Staff Papers, Vol. 52, No. 2.
Rodrik, Dani, Arvind Subramanian, and Francesco Trebbi, 2004, “Institutions Rule: The Primacy of Institutions over Geography and Integration in Economic Development,” Journal of Economic Growth, Vol. 9 (June), pp. 131–65.
Sachs, Jeffery, and Andrew Warner (1995) “Economic reform and the process of global integration,” Brooking Papers on Economic Activity, 1, pp 1-118.
Verma, Arvind, 2005, “The Police in India: Design, Performance, and Adaptability,” in Devesh Kapur and Pratap Mehta (ed.), 2005, Public Instiutions in India: Performance and Design, Oxford University Press, New Delhi.
Wacziarg, Romain, and Karen Horn Welch (2003) “Trade Liberalization and Growth: New Evidence,” Mimeo, Stanford University. World Bank, 2006, Doing Business 2007: How to Reform, World Bank: Washington D.C.