Embed Size (px)
Citation preview

THE INTERNET DEMOCRACY: A PREDICTIVE MODEL BASED ON WEB TEXT MINING
BY
SCOTT PION
A THESIS SUBMITTED IN PARTIAL FULFILLMENT OF THE
REQUIREMENTS FOR THE DEGREE OF
MASTER OF SCIENCE
IN
COMPUTER SCIENCE
UNIVERSITY OF RHODE ISLAND
2007

MASTER OF SCIENCE THESIS
OF
SCOTT PION
APPROVED:
Thesis Committee:
Dean of the Graduate School
UNIVERSITY OF RHODE ISLAND
2007

ABSTRACT
This thesis describes an algorithm that predicts events by mining Internet data. A
number of specialized Internet search engine queries were designed in order to
summarize results from relevant web pages. At the core of these queries was a set
of algorithms that embodied the wisdom of crowds hypothesis. This hypothesis
states that under the proper conditions the aggregated opinion of a large number of
non-experts is more accurate than the opinions of a set of experts. Natural language
processing techniques were used to summarize the opinions expressed on a large
number of web pages. The specialized queries predicted actual events at a
statistically significant level. These data confirmed the hypothesis that the Internet
can function as a wise crowd and make accurate predictions of future events.

iii
ACKNOWLEDGEMENTS
I would like to sincerely thank all the members of my committee. Dr. Hamel has
been helpful to me since I first attended school and took his Artificial Intelligence
course. Dr. Peckham has been useful in a number of areas, including helping me in
two separate projects. Dr. Rynearson has been very informative and helpful in two
separate projects and has been an inspiration to me. Dr. Herve has been helpful
since the first week I attended school several years ago, and has continued to be
supportive. Dr. Eaton was kind enough to volunteer to chair the committee.

iv
TABLE OF CONTENTS ABSTRACT..........................................................................................................ii
ACKNOWLEDGEMENTS ................................................................................iii
TABLE OF CONTENTS .................................................................................... iv
LIST OF TABLES...............................................................................................vi
1. BACKGROUND............................................................................................... 1
1.1 Wisdom of Crowds ....................................................................................... 1 1.2 The Efficient Market Hypothesis .................................................................. 3 1.3 Limits of the Wisdom of Crowds Hypothesis................................................ 4 1.4 Counting Internet Search Results .................................................................. 5
2. GOALS ............................................................................................................. 7 2.1 Areas of Prediction ....................................................................................... 7 2.2 Goals of the Study ........................................................................................ 7
3. METHODOLOGY ........................................................................................... 9
3.1 General Techniques ...................................................................................... 9 3.1.1 Market-based probabilities ..................................................................... 9 3.1.2 The result event itself ........................................................................... 10 3.1.3 A small group of experts ...................................................................... 10 3.1.4 Measures.............................................................................................. 11
3.2 Software ..................................................................................................... 11 3.3 Terminology ............................................................................................... 13 3.4 Hypotheses ................................................................................................. 13 3.5 Areas Studied ............................................................................................. 15 3.6 The 2006 Congressional and Gubernatorial Elections ................................. 15 3.7 Sporting Events and Reality Television Programs....................................... 17 3.8 Economic Data ........................................................................................... 23 3.9 Music Sales and Movie Box Office Receipts............................................... 29
4. RESULTS AND DISCUSSION...................................................................... 32
4.1 Relationship between News for the Month and News for the Week............. 32 4.2 Outliers....................................................................................................... 33 4.3 Movie Box Office Receipts and Music Album Sales ................................... 33 4.4 Sporting events and reality television programs .......................................... 36 4.5 Economic data ............................................................................................ 39 4.6 The 2006 Congressional and Gubernatorial Elections ................................. 44 4.7 Combined results ........................................................................................ 53
5. REPLICATION.............................................................................................. 55
5.1 Methodology .............................................................................................. 55

v
5.1.1 Movie Box Office Receipts and Music Album Sales ............................ 55 5.1.2 Sporting Events and Reality Television Programs ................................ 55
5.2 Results........................................................................................................ 56 5.2.1 Movie Box Office Receipts and Music Album Sales ............................ 56 5.2.2 Sporting Events and Reality Television Programs ................................ 57
5.3. Replication Summary................................................................................. 59
6. CONCLUSION............................................................................................... 60 6.1 Summary .................................................................................................... 60 6.2 Future work ................................................................................................ 61 6.3 Implications................................................................................................ 62
BIBLIOGRAPHY .............................................................................................. 63

vi
LIST OF TABLES
Table 1. Verbs describing rising or falling quantities. ........................................... 27
Table 2. Example output of economic data. .......................................................... 28
Table 3. Sample movie count data. ....................................................................... 30
Table 4. Sample music data. ................................................................................. 30
Table 5. News for the month and news for the week correlations. ......................... 32
Table 6. Movie results. ......................................................................................... 34
Table 7. Music album results. ............................................................................... 35
Table 8. Predicting sporting events results. ........................................................... 36
Table 9. Predicting sporting events betting market................................................ 37
Table 10. Predicting reality television events results. ............................................ 38
Table 11. Predicting reality television probabilities............................................... 39
Table 12. Predicting economic quantities and consensus values. ........................... 40
Table 13. Sample economic data........................................................................... 41
Table 14. Economic quantities over entire period.................................................. 42
Table 15. Election results and probabilities........................................................... 45
Table 16. Web prediction accuracies..................................................................... 46
Table 17. Percent of accurate search results. ......................................................... 49
Table 18. Election results for counts less than 41.................................................. 51
Table 19. Election accuracies for counts less than 41. ........................................... 52
Table 20. All results combined. ............................................................................ 53
Table 21. Movie results. ....................................................................................... 56
Table 22. Music album results. ............................................................................. 57
Table 23. Predicting the sporting events betting market. ....................................... 58
Table 24. Reality television results. ...................................................................... 59

1
1. BACKGROUND
1.1 Wisdom of Crowds This thesis describes a system that predicts future events by mining Internet data.
In the current state of implementation a number of search engine queries were
crafted and the results were counted in order to create a number that represented the
opinions gathered from the web pages that are indexed by the Yahoo! search
engine. At first glance it may seem unlikely that counting all of the results implies
anything about the truth of the results. The Internet is very open, anyone can write
anything without having credentials. Wouldn’t it be better to simply rely on a few
web pages that are well respected? A recent book entitled Wisdom of Crowds : Why
the Many Are Smarter Than the Few and How Collective Wisdom Shapes Business,
Economies, Societies and Nations” (Surowiecki, 2004) has drawn on decades of
research in psychology and behavioral economics to suggest that experts often give
inferior answers when compared to the averaged answers of a large crowd.
An excellent example of how accurate the averaged guesses of a large
number of experts can be occurs when one is trying to guess a quantity, such as
someone’s weight or the number of jelly beans in a jar. In one example given in the
book there was a contest to guess the weight of an ox. There were approximately
800 guesses, and a scientist computed the average of all of the guesses. The
average of the guesses was 1197 pounds, and the actual weight of the ox was 1198
pounds. This averaged guess was better than any of the 800 individual guesses and
demonstrates the idea behind the wisdom of crowds hypothesis that the group as a
whole can be very accurate even if no individual in the group is accurate. The

2
notion is that some people will be slightly too high, others slightly too low, but
these biases will average out and in the end an accurate measure will emerge.
What might be the most obvious example of this phenomenon is democracy.
It is amazing that letting all of the adults in a democracy participate in the political
process, without regard for intelligence, education, political expertise, or even
literacy, can result in a government that functions much better than a dictatorship, a
communist state, or a theocracy. It may be the case that people with different
motivations cancel out people with the opposite motivations. For example, the rich
may cancel out the poor, atheists may cancel out religious traditionalists, and
liberals may cancel out conservatives. This is why it is important to let all
individuals vote. One of the most important criteria for a crowd to be wise is to
have a diverse set of opinions so that any extreme opinion is cancelled out by
another extreme position. Although it was previously mentioned that a group’s
opinion can be averaged, a democracy provides another way of gauging the opinion
of the crowd. This gauging can be accomplished by counting each opinion as a
vote and assuming that the person with the highest vote count is the choice of the
group.
This same voting procedure helps Google to rank which web pages are the
most relevant to a person’s Internet search query (Brin and Page, 1998). The pages
that appear at the top of a Google search are the ones that match the text of the
user’s query and have the highest page rank compared to the other matches. Page
rank is determined by how many web pages link to a given web page. Also, if a

3
page with a high rank links to a web page, this link is weighted more heavily. In a
sense, links to a page are counted like votes for a page.
1.2 The Efficient Market Hypothesis Another common example of the wisdom of crowds is open markets. Most
economists believe that open markets, such as the stock or commodities markets,
are so accurate that it is impossible to predict where prices will be in the future.
This is the well known “efficient market hypothesis” (Fama, 1965). The efficient
market hypothesis states that because all information is released to the public at the
same time, everyone knows what the value of any stock or commodity should be.
For example, when oil prices went up quickly and reached $70 a barrel during the
year 2005, there were a number of people suggesting that oil would continue rising.
The idea behind the efficient market hypothesis is that if everyone knows that oil
will be worth $100 a barrel in 6 months, why would anyone sell it at $70 a barrel
now?
A similar result occurs when buying other things such as houses or cars.
One can often look at houses or cars that are for sale in an electronic database and
sort them by type, location, and price. It is hard to imagine that one would pay too
much for a car or house when one can see houses or cars that are equivalent in
quality but lower in price. This hypothesis can even be useful in terms of
entrepreneurship. If one looks at an undeveloped plot of land in a busy area and
thinks “If I put a coffee shop on this corner, I would make millions,” one must
consider the question: If it is the perfect location, why has it not been developed
yet?

4
1.3 Limits of the Wisdom of Crowds Hypothesis The wisdom of crowds hypothesis is most accurate when it deals with phenomena
that are not perfectly determined, such as predictions. For example, futures markets
often make very accurate predictions about whether interest rates will be changed.
The U.S. government has even suggested a futures market to predict terrorist
attacks (Surowiecki, 2004). The idea of predictive markets has now caught on to
the point where some web sites refer to themselves as prediction markets (Intrade,
2007) and “Prediction Market” has an entry in Wikipedia (2007a). One of the most
famous prediction markets is the Iowa Election Market (U. of Iowa, 2007). Since
1988 the Iowa Election Market has been more accurate than traditional polling
(Wikipedia, 2007). In the current study the TradeSports.com prediction market
(2006) predicted the November 2006 U.S. Senate, House, and gubernatorial
elections with 93% accuracy.
It is important to note that a crowd is not always more accurate than an
expert. Specific conditions must be present (Surowiecki, 2004). If a great deal of
expertise is required then the expert may outperform the crowd. For example, if a
decision about the results of a complex physics experiment were required, an expert
may perform better than a group of non-experts. In a chess match, a world
champion would probably beat a random crowd of 1000 people that voted on every
move (Surowiecki, 2004).
A crowd tends to be most wise when it is similar to a random sample of a
population. In statistics the idea of the random sample is that if one randomly
selects people from a population, one should get a diverse, representative group.
With a crowd, in order to avoid bias, diversity of opinion is very important. Each

5
person should have some private information, even if it’s just their personal
interpretation of publicly known facts. Another factor that tends to make the crowd
wise is independence. If individuals’ opinions are determined by people around
them, then the crowd may simply represent the opinion of the most persuasive
member. The idea of independence and diversity is often seen in politics. The U.S.
has separate but equal branches of government that are supposed to bring
independence and diversity to decisions. This is the opposite of a system of
dictatorship. It is interesting that the term “dictatorship” simply describes a
government with one central leader, but it is such an ineffective system of
governing that the word has become synonymous with brutality. In democracies
diversity if often encouraged by allowing a wide variety of citizens to vote. Voting
is also a very private matter, taking place in a closed booth, which is a key to the
independence of voting.
1.4 Counting Internet Search Results Counting Internet search results has received little attention from the computer
science community. Most research has involved studying the relationship between
an objective measure of performance and the number of results returned by a
Google search (Bagrow et al., 2004, Simkin & Roychowdhury, 2006). Bagrow and
his coauthors studied the relationship between the number of publications a scientist
has produced and the number of search results that were returned by Google. A
total of 449 scientists were randomly chosen from the fields of condensed matter
and statistical physics. The searches took the form of: “Author’s name” AND
“condensed matter” OR “statistical physics” OR “statistical mechanics.” The
6
relationship between the number of search results and the number of publications in
an electronic archive was found to be linear with an R squared of approximately
0.53. This result indicates that there is a relationship between the number of
publications and the number of search results returned.
Another study measured the relationship between the number of Google
search results and the number of opponent aircraft destroyed during World War I
(Simkin & Roychowdhury, 2006). A total of 392 fighter pilots were studied. The
search queries used were fighter name AND (ace OR flying OR pilot OR flieger
OR Fokker OR jasta OR WWI). The authors found an exponential relationship
between fame and aircraft destroyed. The R squared measure between aircraft
destroyed and the logarithm of fame was 0.52. The R squared for the relationship
between the number of Google results and the number of books written about a
given pilot was much higher, at 0.97. These results indicate that there is a strong
relationship between the number of aircraft destroyed and the number of search
results returned.

7
2. GOALS
2.1 Areas of Prediction The goal of this project is to apply the wisdom of crowds hypothesis to the Internet.
The hypothesis is that results from Internet search queries will correlate with the
predictions of an open market at a significance level greater than zero. The wisdom
of crowds hypothesis is often applied to three specific types of predictions. These
predictions are economic indicators, sporting events, and elections. We will
attempt to predict events from these areas in this thesis. The Internet also provides
us with another area to predict. A great deal has been written recently concerning
the Internet and popular culture. With many people able to edit the Internet directly
using sites such as myspace.com, many individuals are able to express their
opinions. Popular culture, by definition, will be written about a great deal. Much
has been written about the fact that more votes are cast for reality show contestants
than presidential candidates. With such a great deal of information available, we
will also be attempting to predict popular culture events. These events are movie
sales, music album sales, and reality television program winners.
2.2 Goals of the Study The question may arise: “If the markets are efficient, then why not simply rely on
these markets rather than testing whether the Internet is an efficient market?” The
first answer is that there will not always be as many markets as there are topics
written about on the Internet. Whenever a market does not exist, the Internet could
be used as a replacement. But the main purpose of this project is not simply to
demonstrate that the Internet can be used as a market. There are already a number

8
of markets that are excellent at predicting events. The main purpose of this study is
to demonstrate the reliability of the Internet. For hundreds of years open markets
have been touted as some of the most wise, predictive elements in human history
(Fama, 1965). As noted earlier, wise markets have predictive power, independence,
and diversity. If the Internet also acts as an efficient market, then it shares these
qualities. Therefore, demonstrating that the Internet can act as an “efficient market”
or “wise crowd” can indicate a great deal about the Internet’s reliability and ability
to predict future events.

9
3. METHODOLOGY
3.1 General Techniques The general methodology of this project is to try to predict the outcome of
events by counting the number of results a set of Internet search queries returns.
These search count results will be compared to three entities:
1. Market-based probabilities.
2. The results of the event itself.
3. A small group of experts.
3.1.1 Market-based probabilities The Internet counts will be compared to the predictions of a relevant market, which
is usually expressed in probabilities. For example, in the case of a sporting event
the counts could be compared to the sports betting market, which will assign a
certain team a higher probability of winning a game. The betting market, like most
open markets, is assumed by many to be efficient (Debnath, Pennock, Giles, &
Lawrence, 2003). Therefore the web count prediction is unlikely to outperform or
even perform equally to any market, but may be expected to make similar
predictions. For this reason there will be a test of whether the web counts are
correlated with the market-based probabilities.
It is expected that the algorithms employed in this study should perform
better when predicting the market than the actual event because, according to the
efficient market hypothesis, the market is supposed to take into account all of the
information that is currently available and make the best prediction. That which the
market cannot predict is supposed to be unpredictable in general, that is, completely

10
random. For example, the market might be able to predict that the probability that a
coin will come up heads when it is tossed is 0.5. However, no market could predict
an actual coin flip event with perfect accuracy, because it is random. Therefore, it
is expected that the web counts should be able to predict the market determined
quantities (such as 0.50) better than the actual event (such as heads or tails).
3.1.2 The result event itself The web counts will be compared to the results of the event itself. For example, if
the New York Yankees have the highest count for the query “will win the World
Series,” do the Yankees actually win the World Series? If not, in what position do
they finish?
3.1.3 A small group of experts According to the wisdom of crowds hypothesis, the crowd is not always accurate, it
is simply better than a smaller number of experts. To test this hypothesis, the first
20 search results were examined in order to determine the opinion of the experts.
This is referred to in this thesis as the “web top 20.” In Internet search, the results
that are returned first are supposed to have a higher “page rank,” indicating more
expertise (Brin and Page, 1998). Therefore, these results may be representative of a
small group of experts. These results were compared to the results for the search of
the entire Internet. If a large crowd is wiser than a smaller number of experts, then
the counts for the entire Internet should be more predictive of an event than the
counts for the top 20 web sites.
This hypothesis may be suspect because, as stated in the background
section, the top Internet search results themselves are determined by all available

11
web sites. If that is the case then we would expect a statistically significant
correlation between the web counts measure and the web top 20 measure. If the
web top 20 is a measure of the wisdom of crowds rather than the experts, then this
will not be an adequate test of expert vs. crowd.
3.1.4 Measures These areas led to five primary measures that were examined in this thesis. These
are the correlations between:
1. The web top 20 and the results of the event.
2. The overall web counts and the results of the event.
3. The market probabilities and the results of the event.
4. The web top 20 and the market probabilities.
5. The overall web counts and the market probabilities.
It is important to note that of the various areas studied, not all of these measures
were available. Some of the areas do not have available markets, and for some it
was not possible to gauge the opinions of experts with the top 20 measure. These
issues will be discussed when the individual areas studied are discussed.
3.2 Software Web search results were counted using the Yahoo! search engine (Yahoo!, 2006).
The Yahoo! Search Web Services API was used along with the Java programming
language in order to automate the search algorithms (Yahoo!, 2006b). One of the
problems with counting Internet search results is that the dates of creation for most
web pages are not available (Tyburski, 2002). Yahoo! does have an option to
retrieve only results updated within the last three months. However, using this

12
option on a search performed on December 16, 2006 with the term “John Kerry will
win” retrieves as its first result a website that is dated May 10, 2004, demonstrating
that date based searches on the web are extremely unreliable. To solve the problem
with dates, searches were also performed on the Yahoo! News website. The
Yahoo! News search results provide the exact date and time of the publication of
each result (Yahoo! News, 2006). For example the query “John Kerry will win the
election” retrieves zero hits on Yahoo! News, but 321 hits from Yahoo! web search
with the option set to retrieve only results updated within the last three months.
It may be suggested that if the news dates are so accurate, then only the
news results should be used. Unfortunately, the number of results from news
searches are very low, so the web search was used in order to be assured that the
number of results achieved would not often be zero. In order to get the most current
results, one search was performed limiting the news results to those published
within the last week. In order to get a larger count, another search was performed
limiting the number of results to those published within the last month, which is the
maximum time period available.
In order to get accurate results, exact phrases, such as “The Patriots will win
the Super Bowl” were searched. The Yahoo! Search API is limiting in that one
cannot combine phrases in quotes with other words, such as “Casino Royale” +
movie. Some computational linguistic approaches, such as parsing, were needed,
and are described in later sections. In order to avoid tainting the results, the web
search was always performed before the event itself. For example, the searches for

13
predicting the 2007 Super Bowl winner were performed before the 2007 Super
Bowl occurred.
3.3 Terminology In the following sections, “web count” will refer to the number of results that are
returned by a search of the entire Internet. “News week” will refer to the number of
results returned by a count of the news results from the prior week. “News month”
will refer to the number of results returned by a count of the news results from the
prior month. “Web top 20” will refer to the measure that only looks at the top 20
results. “Various web measures” will refer to all of these measures simultaneously:
the web count, the news for the week, the news for the month, and the web top 20.
3.4 Hypotheses Because simply counting results on the web has a great deal of noise associated
with it, the hypothesis is that the web count predictions will be able to outperform a
random guess at a statistically significant level. For example, when trying to
predict elections, the hypothesis will be that the accuracy will be statistically higher
than 50% in cases when two candidates are competing. Election data provide an
excellent example of the noise that was encountered. For one datum the attempt
was to predict whether Hillary Clinton would win the New York senate seat in
2006. In a process that will be described later, the query that was used was
“Clinton will win.” This could refer to Bill Clinton winning a presidential election,
Hillary Clinton winning the 2008 presidential election, or Roger Clinton winning a
pie eating contest. Even a more exact statement like “The Patriots will win the
Super Bowl” could refer to the 2006 Super Bowl, even though the attempt is to

14
predict the 2007 Super Bowl. Unfortunately using more exact queries such as “will
win the 2007 Super Bowl” gets only 829 results, whereas a more general query such
as “will win the Super Bowl” gets 96,000 results. The small sample size of the
former query makes it impractical to use the more specific version. Therefore, the
key is to use a query that is general enough to have a large sample size but specific
enough to express the correct predicate. Because more general queries are used it is
expected that a great deal of error may be encountered. This leads to the hypothesis
that any predictions should be more accurate than a chance prediction but certainly
not close to 100% accuracy.
A summary of the hypotheses is listed below. The first is the primary, most
important hypothesis.
1. The correlations between the various web measures and the market-based
probabilities, and the correlations between the various web measures and the
actual results, will be significantly greater than zero at the p < .05 level.
2. The correlations between the web counts and the actual results will be
higher than the correlations between the web top 20 counts and the actual
results. Also, the correlations between the web counts and the market-based
probabilities will be higher than the correlations between the web top 20
counts and the market-based probabilities.
3. The correlations between the various web measures and the market-based
probabilities will be higher than the correlations between the various web
measures and the actual results.

15
3.5 Areas Studied Other details of the methodology used are specific to the area that is being
predicted. There are seven main areas that will be predicted:
1. The 2006 Congressional and gubernatorial elections.
2. Reality television programs.
3. Sporting events.
4. Economic data.
5. Music sales.
6. Movie box office receipts.
3.6 The 2006 Congressional and Gubernatorial Elections We attempted to predict the results of all of the senate races, all of the gubernatorial
races, all of the House of Representative races considered “key races” by CNN
(CNN, 2006a), and all of the races in the states with the seven largest number of
House seats: California, Texas, New York, Florida, Ohio, Pennsylvania, and
Illinois. If CNN reported a candidate as running unopposed then the race was not
included in the study. The candidate information was taken from the CNN website
(CNN, 2006b, 2006c). As described earlier, the counts were retrieved for the entire
web, news for the week, and news for the month. Two candidates were selected to
be studied for each race. In all but two races the Republicans and the Democrats
were chosen. In the Vermont senate race the Republican and independent
candidates were chosen. In the Connecticut senate race the Democrat and
independent were chosen. These candidates were chosen because they were the two
seen as most likely to win according to prediction market data (TradeSports.com,
2006).

16
The first part of the prediction was determining which phrases to use in
order to determine that someone on the web or in a news story was expressing the
fact that they believe a candidate would win. For example, in the case of Hillary
Clinton, possible phrases could be “Clinton will win”, “Clinton will win the seat”,
or “Hillary Clinton will win the senate seat.” More complex phrases are more
likely to express the proper belief, but less likely to be found. The procedure for
creating the queries was to use close races to determine what expressions were used
most commonly. The process started with the simplest queries and then added
more and more complexity at each step. For example:
Clinton will
Clinton will win
Clinton will win the senate
Hillary Clinton will win the senate seat
Names from the top 10 most competitive races were chosen with half being
Republican and half Democrat (Tradesports.com, 2006). To start, the name and the
word “will” (such as “Clinton will”) were used as query phrases. The verbs from
the top 200 results were retrieved. These verbs were visually inspected in order to
determine which ones might indicate that the candidate would win. The verbs
selected were lose, win, beat, defeat, take, hold, keep, and retain. The “name will”
phrase was appended with these verbs above and searched again. The phrases and
the six words following the phrases from the top 50 web search results were
collected. An example would be “McCaskill will win office, but neither will
support.” These phrases were examined in order to determine if there were any

17
phrases that were common to all of the candidates that expressed the belief that the
candidate would win. The two final phrases that were selected were simply “name
will win” and “name will beat.” These phrases allow for a number of false
positives, but the hope was that there would be enough of a signal to be detected
above the noise.
Because of the possibility for a number of false positives, the last name of
candidate alone was searched. For example, “Johnson will win” should be expected
to get a large result count simply because Johnson is such a common name. A
casual inspection indicated that “Johnson will win” often referred to a racecar driver
and a fighter. The total counts for “will win” and “will beat” were added and then
that number was divided by the count of the name alone. This was intended to have
a standardizing effect in cases when one candidate’s name was much more common
than another candidate’s name.
3.7 Sporting Events and Reality Television Programs Sporting events and reality television programs are handled in the same way
because in both cases the task is to predict a winner of an event. Automating the
data gathering for this portion of the project relied heavily on examples from the
“question answering” literature (Gelbukh, 2006). In computer science, the general
task of trying to answer some question posed in natural language is appropriately
called “question answering” (Gelbukh, 2006). Much of the research on question
answering today involves answering questions using the Internet (Mitkov, 2003).
The field of question answering relies heavily on the broader field of natural
language processing.

18
One of the parts of question answering is determining the type of expected
answer. For example, the question “Who was the first American in space?” should
return a proper noun. Another part of question answering is formulating the
question into one or perhaps a number of queries that will be submitted to some
type of search engine. For example, the question “Who was the first American in
space?” may create the query “was the first American in space.” The first noun
preceding the query could then be appended, resulting in a phase such as “Sheppard
was the first American in Space.”
In current project, the Stanford Lexicalized Parser (Klein, 2006) was used in
order to tag parts of speech. A parser is a common tool used in natural language
processing. The Stanford parser is a statistical parser that produces the most likely
structure of sentences. It is used for finding verbs, nouns, and other parts of speech.
The current project searched for answers to questions like “Who will win
the Super Bowl” or “Who will win American idol.” The algorithm is given below
and explained in the following paragraphs.
19
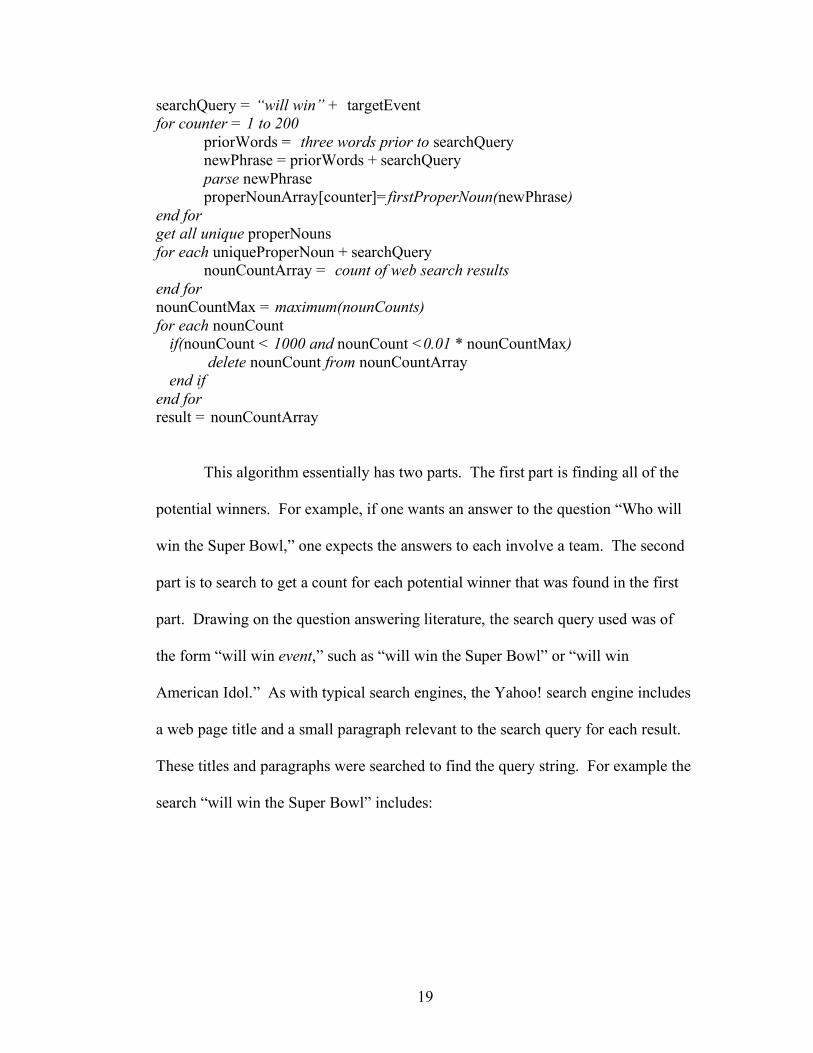
searchQuery = “will win” + targetEvent for counter = 1 to 200 priorWords = three words prior to searchQuery newPhrase = priorWords + searchQuery parse newPhrase properNounArray[counter]=firstProperNoun(newPhrase) end for get all unique properNouns for each uniqueProperNoun + searchQuery nounCountArray = count of web search results end for nounCountMax = maximum(nounCounts) for each nounCount
if(nounCount < 1000 and nounCount <0.01 * nounCountMax) delete nounCount from nounCountArray end if
end for result = nounCountArray
This algorithm essentially has two parts. The first part is finding all of the
potential winners. For example, if one wants an answer to the question “Who will
win the Super Bowl,” one expects the answers to each involve a team. The second
part is to search to get a count for each potential winner that was found in the first
part. Drawing on the question answering literature, the search query used was of
the form “will win event,” such as “will win the Super Bowl” or “will win
American Idol.” As with typical search engines, the Yahoo! search engine includes
a web page title and a small paragraph relevant to the search query for each result.
These titles and paragraphs were searched to find the query string. For example the
search “will win the Super Bowl” includes:

20
• ONLINE EXCLUSIVE: In My Mind: Why Baltimore will win the Super Bowl ... The Penn, a college media publication. ... ONLINE EXCLUSIVE: In My Mind: Why Baltimore will win the Super Bowl. Nate Albright ... media.www.thepenn.org/media/storage/paper930/news/2006/11/17/... - 48k -
The text from the query was then located in each result. The three words preceding
the query text were then appended to the sentence and saved in a text file. In the
above example this would produce: “Mind: Why Baltimore will win the Super
Bowl.” The Stanford Lexicalized Parser (Klein, 2006) was then called from Java
and run on the sentence to try to find the first proper noun preceding “will win the
Super Bowl.” The first proper noun found by the parser was appended to the front
of the query, using the current example this would produce “Baltimore will win the
Super Bowl.” The first 200 results were searched for these proper nouns. Trial and
error indicated that searching 200 results created a good balance between being
thorough and not taking too much time. These searches should end with a large list
of possible winners, such as:
Eagles will win the super bowl
Seahawks will win the super bowl
Falcons will win the super bowl
Each of these proper noun-headed queries was then searched in order to get a result
count. The results that were printed were only those that were at least one percent
of the maximum count or greater than 1000. This check was done to assure that no
one query that received a very small portion of the total was needlessly included.
An example of this output is:

21
Eagles will win the super bowl 276
Seahawks will win the super bowl 119
Falcons will win the super bowl 122
Browns will win the super bowl 33
Pats will win the super bowl 88
As stated at the beginning of the methodology section, these predictions
were compared to the top 20 search results. For the top 20 results, rather than
searching the entire web, only the first 20 results that mentioned a team were
included. Some of the results did mention a team, such as “The Patriots will win
the Super Bowl.” Many others simply asked the question, “Who will win the Super
Bowl.” If the result did not mention a team, it was skipped in the top 20 count.
Therefore, some of the results included in the web top 20 measure were not actually
in the top 20. For example, if the first 10 results did not mention a team, and the
next 20 did, then it would actually be the top 30 results that would be included. A
small example of this output is:
Eagles will win the super bowl 3
Seahawks will win the super bowl 1
Falcons will win the super bowl 2
Browns will win the super bowl 1
There is a potential for noise in this data in that a statement like “The
Patriots will win the Super Bowl” could refer to the 2006 Super Bowl although we
were interested in predicting the 2007 Super Bowl. For this reason it is not

22
expected that any prediction will be perfectly accurate, simply statistically
significant.
The sporting events that were predicted were the World Series of
professional baseball, the Super Bowl of professional football, and the Bowl
Championship Series of college football. The World Series occurred in 2006 and
the Bowl Championship Series and the Super Bowl occurred in 2007. The goal was
to predict the outcome of the event itself as well as the probability that each team
will win the event as determined by the betting market (VegasInsider.com 2006a,
2006b, 2006c). For the World Series and Super Bowl the actual results were
determined either by when the team was eliminated from the playoffs, or, if they
were not in the playoffs, their final standing during the regular season (Wikipedia,
2007c, 2007d). The data for professional football was sampled twice, once three
and a half months before the event, and once one month before the Super Bowl.
The data for the World Series was sampled three weeks before the event. The data
for the Bowl Championship series was sampled three months before the event. For
the Bowl Championship Series the actual results were indicated by the AP top 25
college teams ranking (ESPN, 2007). Any teams not in the top 25 were assigned a
rank of 26. The betting market data was taken from VegasInsider.com (2006a,
2006b, 2006c).
The reality television programs that were predicted were “The Bachelor,”
“America's Next Top Model,” “The Amazing Race,” “The Biggest Loser,”
“Dancing With the Stars,” “Survivor: Cook Island,” and “Project Runway.” All of
these shows aired between August and December of 2006. Results were taken from

23
Wikipedia (2007e, 2007f) and ABC.com (2007). Results were based on when
individuals were eliminated from the contests. Along with attempting to predict the
results of the programs, there was an attempt to predict the probabilities of winning
based on the betting markets. The probabilities of winning were taken from
Bodog.com (2006).
Only certain teams or people will be eligible to win these contests at a given
time. For example, the day before the Super Bowl only two teams have the
potential of winning, but at the beginning of the season 32 teams have the potential
of winning. The teams or people who have no chance of winning were ignored
when analyzing data.
3.8 Economic Data The economic data that were predicted were those found on the Yahoo! Finance
web page (2007). The data included quantities such as GDP, inflation,
unemployment rate, and home sales. With economic data, one is usually interested
in predicting the rise or fall of a given value, such as home sales. Economic data is
different than market traded stocks and commodities in that there is often a
“consensus” number that the market expects. For example, the market may expect
inflation to fall in the month of September. The economic web count predictions
should outperform chance levels because there is a consensus about whether these
values will rise or fall. This is in contrast to stock or commodity prices, which are
supposedly unpredictable according to the efficient market hypothesis (Fama,
1965).

24
The task of this project is to predict whether a given economic quantity will
rise or fall. It is impractical to make exact predictions, such as “New home sales
will be 231,000 on January 28, 2007.” Almost no one would write such an exact
opinion on a web page. The current project predicts whether the values will rise or
fall by preparing search queries that describe the quantities rising or falling and then
counting the number of results that these search queries receive. For example, the
query “inflation will rise” would be searched and the number of results would be
counted. This count would be compared to the count for the query “inflation will
fall,” and whichever received more results would be considered the web count
prediction. However, more accuracy could be gained by searching for a number of
queries that expressed a similar opinion, such as “inflation will soar” or “inflation
will continue to rise.” The algorithm for predicting economic quantities is given
below and described in the following paragraphs.

25
searchQuery = targetQuantity + “will” for counter = 1 to 200 postWords = six words after searchQuery newPhrase = searchQuery + postWords parse newPhrase verbArray[counter]= firstVerb(postWords) end for get all unique verbs exclude all verbs that are not synonyms of rise or fall for each searchQuery + uniqueVerb verbCountArray = count of web search results end for verbCountMax = maximum(verbCountArray) for each verbCount
if(verbCount < 1000 and verbCount <0.01 * verbCountMax) delete verbCount from verbCountArray end if
end for for all verbs synonymous with “rise” riseCount = riseCount + verbCount end for for all verbs synonymous with “fall” fallCount = fallCount + verbCount end for result = riseCount and fallCount
This algorithm is similar to the one for sporting events. There are two steps.
The first step is to find a list of verbs that describes what an individual thinks the
quantity will do. The second part is to search with queries that are appended with
these verbs. It is convenient that in the English language opinions about the future
are often expressed in a very standard manner (Wikipedia, 2007g). The form is
usually: noun will verb. Examples would be “inflation will rise” or “the Patriots
will win.” Therefore, for the economic data, each search query began with the form

26
“quantity will”, such as “inflation will.” The query text was then located within
each search result. The six words following the query text, or the words up to the
end of the sentence, were then appended, such as “inflation will continue to rise as
the Federal.” The top 200 queries were then saved to a text file and parsed using
the Stanford Lexicalized Parser (Klein, 2006) in order to find the first verb that
followed the word “will.” The verbs were used because the goal of this project is to
discover what the quantities will do, such as rise or fall, which are both verbs. Each
of these unique verbs was then appended to the phrase “quantity will,” creating
predictions such as “inflation will drop.” The web results were then counted for
each of these queries. The results that were printed were only those that were at
least one percent of the maximum count or greater than 1000. This was done so
that queries only getting a few results would not be considered.
Although this program was written with the intention of discovering
whether quantities would rise or fall, it could also predict events in general. For
example, if one wanted to know whether the Federal Reserve will raise interest
rates, the output from the program produces the following abbreviated output:
fed will cut 31200
fed will raise 94820
fed will end 1180
fed will leave 5090
fed will keep 44400
All of these verbs describe the lowering (cut), raising (raise), or not changing (end,
leave, keep) of interest rates.

27
The preceding procedure will create queries that search for any type of verb.
For the economic data we are only concerned with those verbs that describe rising
or falling. In order to filter out the verbs that do not describe rising or falling, the
output of a sample of eight quantities was examined. The quantities used were oil
prices, stock prices, stocks, housing prices, home prices, gold prices, the dollar,
commodities, and bonds. The verbs from all of these queries were examined and
grouped into verbs that described rising or falling. Table 1 displays these verbs.
Table 1. Verbs describing rising or falling quantities.
Rise Fall Accelerate Collapse Climb Cool Expand Crash Gain Decline Grow Depreciate Improve Deteriorate Increase Drop Rise Fall Strengthen Plummet Retreat Sink Slide Slow Soften Struggle Suffer Weaken Worsen
Any verbs that were not on this list were not counted when searching for rising or
falling quantities. The counts from all of the rise verbs were summed and referred
to as the “rise count.” The counts from all of the fall verbs were summed and
referred to as the “fall count.” In order to gauge the opinion of the expert, the top
20 results that contained a rise or fall verb were counted. The counts for the web,

28
the news of the last month, and the news of the last week were also examined.
Table 2 displays an example of the output.
Table 2. Example output of economic data.
Top
20 web rise
Top 20
web fall
Web rise
Web fall
News week
rise
News week
fall
News month
rise
News Month
fall Core CPI 16 4 143 33 0 0 0 0
Initial Claims 0 5 0 7 0 0 0 0
Industrial Production 18 2 562 89 0 0 0 0
This table provides a good example of why the web counts were used in addition to
the news counts. The news counts in the table are all zero because no one wrote
any news stories that appeared on the Internet about these particular quantities. If
the number of fall results was greater than the number of rise results, the prediction
was that the quantity would fall, and if the number of rise results was greater than
the number of fall results, the prediction was that the quantity would rise.
In the case of economic data there was a market-based consensus number
that was taken from the Yahoo! Finance website (2007). Therefore one of the tests
was to compare the predictions of the various web measures with that of the
consensus numbers. As stated in the terminology section, “various web measures”
refers to the news counts, the overall web counts, and the web top 20 counts. If the
consensus and the web count both predicted a rise or both predicted a fall for the
quantity then these numbers were considered to be in agreement.

29
The data was collected weekly from 9/23/2006 until 1/21/2007. The data
from the week starting on 11/19/2006 was not collected because the author was not
available to collect it.
3.9 Music Sales and Movie Box Office Receipts Music sales and movie box office receipts will be described together because they
are handled in a similar manner. These tests are the most simple and subject to a
great deal of noise. The test is simply whether the mere mention of a movie or
music album will make it more likely to be successful. This idea is reflected in the
common expression “any publicity is good publicity.” By its nature this data does
not have any consensus or market prediction to use as a comparison, and it also is
not amenable to the format of gauging the top 20 results. Therefore the only
comparison will be to the actual album and movie sales. The hypothesis is that the
movie and album web result counts are correlated with their sales.
For movies, the Yahoo! Movies website (2007a) was searched to determine
the movies that were opening in “wide release.” These searches were done on
Monday in order to predict the movies that were starting on the following
Wednesday or Friday. Unfortunately the Yahoo! Search API is limiting in that one
cannot combine phrases in quotes with other words, such as “Casino Royale” +
movie. Therefore the search queries used were simply the movie name in quotes.
The names of the movies were searched and the number of results were counted for
the web in general, the news for the month, and the news for the week. Table 3
displays some sample movie data.

30
Table 3. Sample movie count data.
Web News Week
News Month
Casino Royale 7,240,000 548 1427
Happy Feet 4,390,000 166 517
Let's Go To Prison 3,750,000 26 66
The relationship between the web, news week, and news month counts and
the amount of money generated by the movies in the opening weekend were
studied. The box office money intake was taken from the Yahoo! Movies website
(2007b).
For music albums, the “Amazon.com: New and Future Releases: Music”
website (2007) was used to determine which albums were being released. The
albums were converted into the form album name artist, such as “There Is A Season
The Byrds.” These queries were then searched and the numbers of results were
counted for the web in general, the news for the month, and the news for the week.
Table 4 displays some sample music data.
Table 4. Sample music data.
Web News Week
News Month
Live at the Fillmore East Neil Young 2440 0 0 9 Damien Rice 3060 2 2 An Other Cup Yusuf 2560 0 0 Doctor's Advocate The Game 1260 8 6
The relationship between the web, news week, and news month counts and
the appearance on the Billboard 200 (2007) chart ranking the week after the release

31
was studied. Only the finishers ranking in the top 10 of the Billboard 200 were
noted.

32
4. RESULTS AND DISCUSSION
4.1 Relationship between News for the Month and News for the Week Table 5 displays the correlations between the results for the news for the month and
news for the week.
Table 5. News for the month and news for the week correlations.
Correlation N
95% c.i. lower
95% c.i. upper
Sports 0.69 119 0.58 0.77 Music 0.98 93 0.97 0.99 Movies 0.96 36 0.92 0.98 Elections 0.96 80 0.94 0.97 Economics 0.78 49 0.64 0.87
The confidence intervals (95% c.i. lower and upper) for the correlations were
computed using the Fisher z transformation because correlations are not normally
distributed (Neter et al., 1996). The variance of the Fisher z is simply a function the
sample size of the correlation.
Each correlation was significantly greater than zero, because the 95%
confidence intervals did not include zero. For the sports, music, and movies data
the correlation displayed is simply the correlation between the count of the web
results for the news week and news month data. For the election data the
correlation displayed is the correlation between the percentage of web results
received for each candidate for the news week and news month data. For the
economic data the correlation displayed is the correlation between the percentage of
web results that indicated a rising quantity for the news week and news month data.

33
Because the correlations were so high, and because the news month had more non-
zero counts than news week, only the news month data will be discussed further.
4.2 Outliers. In many cases there were very extreme outliers that needed to be excluded from the
data. Outliers were a large potential problem in this thesis because correlations are
especially sensitive to outliers (Neter et al, 1996). According to Wikipedia (2007b)
an “extreme” outlier is anything above the third quartile by three times the
interquartile range, regardless of the shape of the distribution. In the current study
in one case a piece of data was 291 times the interquartile range. In this case it was
the music album “Love” by the Beatles. This album led to the query “Love the
Beatles.” Many people use the phrases such as “I love the Beatles” that would be
found by this query. This query count was 918 higher than the median value.
Compare this to the much more uncommon phrase “Light Grenades Incubus” which
was created to find the album “Light Grenades” by the band “Incubus.” Another
example of an outlier would be the movie “The Holiday,” which was released two
weeks before Christmas. Obviously many of the results for the search “The
Holiday” referred to Christmas rather than the movie. These outliers were dealt
with by counting the first 50 search results in order to determine how many false
positives existed. More details on this technique are described in later sections.
4.3 Movie Box Office Receipts and Music Album Sales Table 6 displays the correlation between the web and news month search result
counts and the amount of money generated in the first weekend of a movie’s
release.
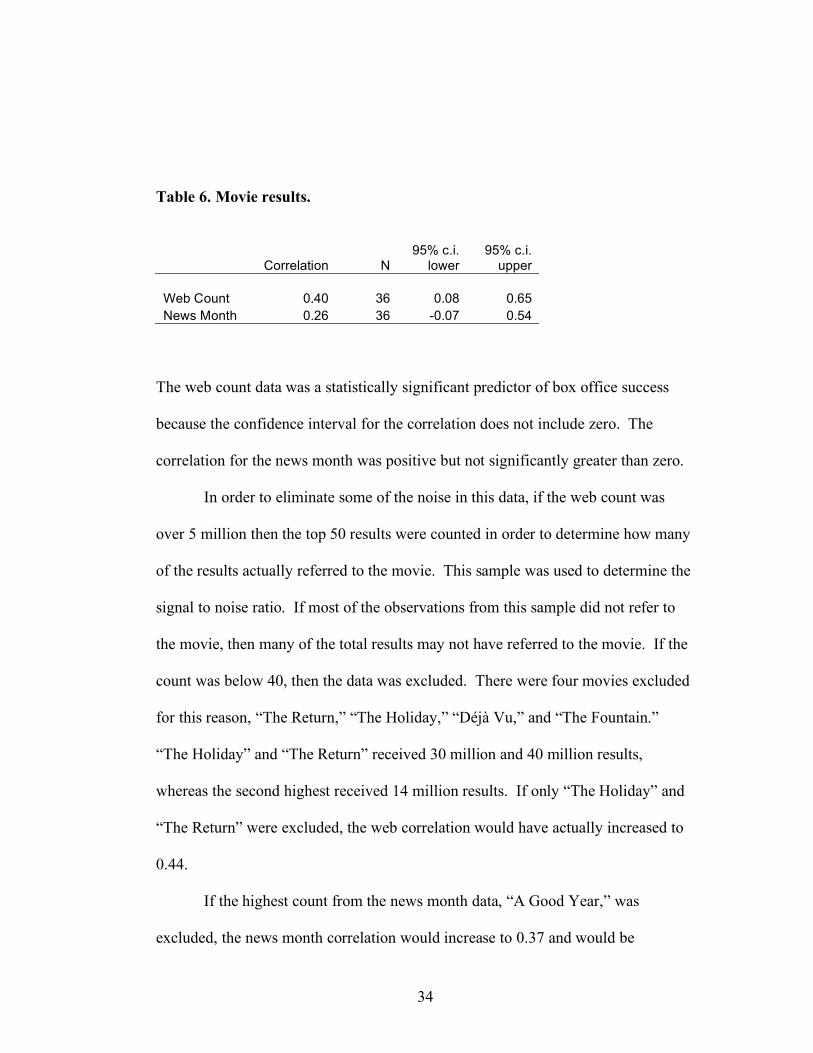
34
Table 6. Movie results.
Correlation N 95% c.i.
lower 95% c.i.
upper Web Count 0.40 36 0.08 0.65 News Month 0.26 36 -0.07 0.54
The web count data was a statistically significant predictor of box office success
because the confidence interval for the correlation does not include zero. The
correlation for the news month was positive but not significantly greater than zero.
In order to eliminate some of the noise in this data, if the web count was
over 5 million then the top 50 results were counted in order to determine how many
of the results actually referred to the movie. This sample was used to determine the
signal to noise ratio. If most of the observations from this sample did not refer to
the movie, then many of the total results may not have referred to the movie. If the
count was below 40, then the data was excluded. There were four movies excluded
for this reason, “The Return,” “The Holiday,” “Déjà Vu,” and “The Fountain.”
“The Holiday” and “The Return” received 30 million and 40 million results,
whereas the second highest received 14 million results. If only “The Holiday” and
“The Return” were excluded, the web correlation would have actually increased to
0.44.
If the highest count from the news month data, “A Good Year,” was
excluded, the news month correlation would increase to 0.37 and would be

35
statistically significant because its 95% confidence interval would not include zero.
This count was taken in November and it is likely that “A good year” referred to
news stories about the year 2006 rather than the movie, such as “It was a good year
for stocks” or “This was a good year for the Democrats.” The original search for
this movie returned 1571 results. A search on January 31 returned 2232 results, and
none of the top 50 referred to the movie.
Table 7 displays the correlation between the web and news month search
counts and the position of the album on the billboard 200 chart. For the sake of
parsimony only albums with positions 1 to 10 were included.
Table 7. Music album results.
Correlation N 95% c.i.
lower 95% c.i.
upper Web Count -0.45 93 -0.60 -0.27 News Month -0.54 93 -0.67 -0.38
These results indicate that the web count and news month data are statistically
significant predictors of the position of an album on the Billboard 200 charts
because the confidence intervals for the correlations do not include zero. These
correlations are negative because a lower position is more indicative of success.
For example, chart position number one is the best seller.
In order to eliminate some of the noise in this data, if the web count was
over 50,000 then the top 50 results were counted in order to determine how many of
the results actually referred to the album. The album “Love” by the Beatles
received 418,000 results because the search query used was “Love the Beatles.”
Only 18% of the top 50 results referred to the album, therefore this observation was

36
excluded from the results. The album “On an Island” by David Gilmore received
185,000 search results. A count of the top 50 results indicated that all of these
referred to the album. This value was so far above the third highest value, which
was only 8,790, that it would have an extreme influence on the correlation.
According to Wikipedia (2007b) this value is considered an “extreme” outlier
because it was above the third quartile by at least three times the interquartile range.
This piece of data was actually above the third quartile by 128 times the
interquartile range. Therefore this piece of data was also excluded.
The albums that did not make the top 10 were given a value of 11.
Although the value of 11 may seem artificial, giving the albums that did not make
the top 10 a value of 100 changed the correlations very little, only lowering each by
0.06.
Overall these results are similar to those for the movies. The relationship
between the counts and the success of the albums is somewhat strong, especially for
the news data.
4.4 Sporting Events and Reality Television Programs Table 8 displays the correlations between various web measures and the outcomes
of college football, professional football, and professional baseball seasons.
Table 8. Predicting sporting events results.
Correlation N 95% c.i.
lower 95% c.i.
upper Web Top 20 -0.48 119 -0.61 -0.33 Web Count -0.38 119 -0.52 -0.21 News Month -0.29 119 -0.45 -0.12 Market -0.62 119 -0.72 -0.50

37
The correlations are negative because those with the highest counts should have the
lowest position, for example first place is considered position number one.
Contrary to our hypotheses, the web top 20 count correlation was slightly higher
than the web count, although not significantly higher, because the confidence
intervals overlap. However, the correlation between the web top 20 and the web
count is a rather high 0.68, making it difficult to differentiate between the two
measures. This is evidence that the web top 20 already incorporates the information
available on the rest of the web. Table 9 displays similar correlations between
various web measures and the probability of winning based on the sports betting
market.
Table 9. Predicting sporting events betting market.
Correlation N 95% c.i.
lower 95% c.i.
upper Web Top 20 0.44 119 0.29 0.58 Web Count 0.55 119 0.41 0.66 News Month 0.47 119 0.32 0.60
As expected, the web count and news month count correlations are slightly higher
for the betting market data than for the actual outcomes of the events. Also in
concordance with our hypothesis, the web count correlation was slightly higher than
the web top 20 count, although not significantly so. Again, this result should be
taken with caution because the two measures are very similar. Contrary to our
hypothesis, the web top 20 count correlation is slightly higher for the actual results
than for the betting market results, although not significantly higher.
Table 10 displays the correlations between various web measures and the
outcomes of reality television programs.

38
Table 10. Predicting reality television events results.
Correlation N 95% c.i.
lower 95% c.i.
upper Web Count -0.45 13 -0.80 0.13 Web Top 20 -0.59 13 -0.86 -0.06 Market -0.84 13 -0.95 -0.55
Unfortunately, only three of the seven reality programs studied had any counts
above one for any of the measures taken. These were “Survivor: Cook Islands,”
“Dancing with the Stars,” and “Project Runway.” Even these programs had few
web results, and all of the news counts were zero, so no news correlations could be
computed. However, the results that were available indicated that there was a rather
strong relationship between the various web measures and the outcomes of the
programs. The market data predicted the results of these contests especially well.
Contrary to our hypothesis, the web top 20 correlation was greater than the web
count correlation. However, the correlation between these two measures was 0.94,
indicating that they are almost exactly the same measurement. This occurred
because the sample size was so small that there were not many more than 20 results
to study. Therefore the web top 20 was almost the entire web in this case. For
example, if the query “will win Dancing with the Stars” gets a web count of less
than 20, then the web count measure and the web top 20 measure are equivalent.
Table 11 displays the correlations between various web measures and the
probabilities of winning reality television programs based on betting probabilities.

39
Table 11. Predicting reality television probabilities.
Correlation N 95% c.i.
lower 95% c.i.
upper Web Count 0.56 13 0.01 0.85 Web Top 20 0.75 13 0.34 0.92
As expected, these correlations are higher than those predicting the actual results,
and both are significantly greater than zero. Again, contrary to our hypothesis, the
web top 20 correlation was greater than the web count correlation. However, none
of these noted differences are statistically significant.
As a whole, the sporting and reality television data support the hypotheses
that the Internet is a statistically significant predictor of future events. However, it
does not support the hypothesis that the web count would outperform the web top
20.
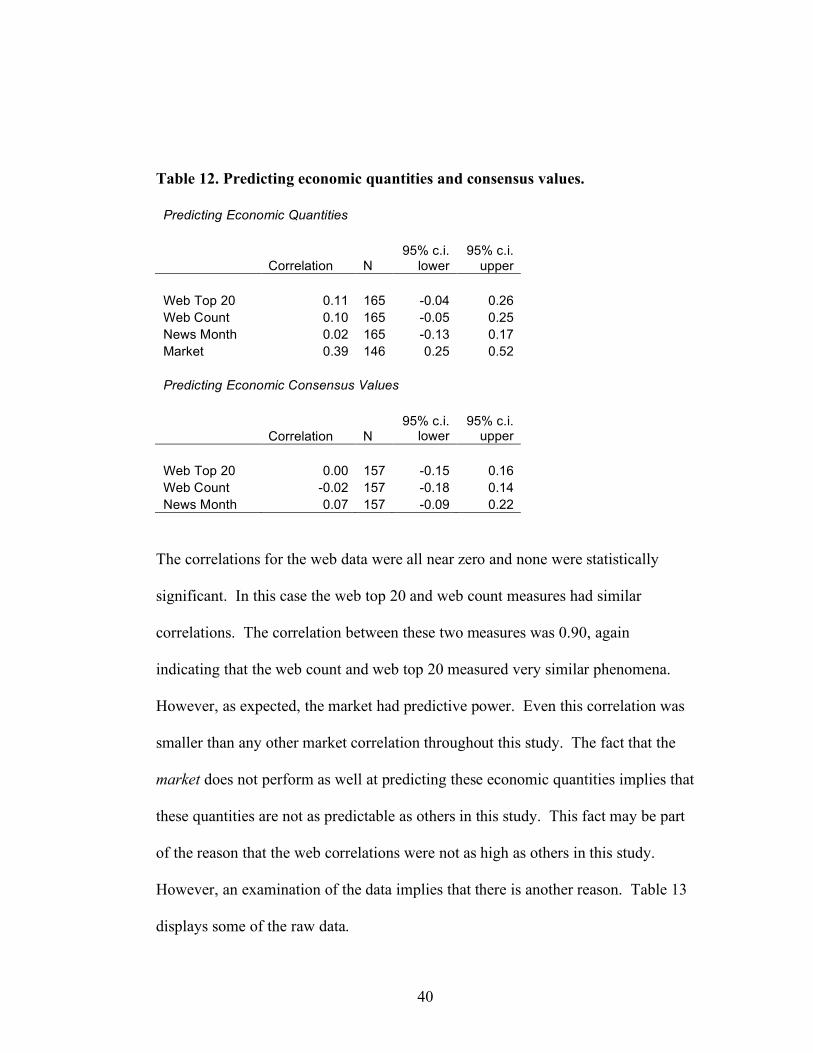
4.5 Economic data Table 12 displays the correlations between various web measures and economic
quantities and economic consensus values.
40
Table 12. Predicting economic quantities and consensus values.
Predicting Economic Quantities
Correlation N 95% c.i.
lower 95% c.i.
upper Web Top 20 0.11 165 -0.04 0.26 Web Count 0.10 165 -0.05 0.25 News Month 0.02 165 -0.13 0.17 Market 0.39 146 0.25 0.52 Predicting Economic Consensus Values
Correlation N 95% c.i.
lower 95% c.i.
upper Web Top 20 0.00 157 -0.15 0.16 Web Count -0.02 157 -0.18 0.14 News Month 0.07 157 -0.09 0.22
The correlations for the web data were all near zero and none were statistically
significant. In this case the web top 20 and web count measures had similar
correlations. The correlation between these two measures was 0.90, again
indicating that the web count and web top 20 measured very similar phenomena.
However, as expected, the market had predictive power. Even this correlation was
smaller than any other market correlation throughout this study. The fact that the
market does not perform as well at predicting these economic quantities implies that
these quantities are not as predictable as others in this study. This fact may be part
of the reason that the web correlations were not as high as others in this study.
However, an examination of the data implies that there is another reason. Table 13
displays some of the raw data.

41
Table 13. Sample economic data.
Top 20 web rise Fall
Web rise Fall
News month
rise Fall Actual Expected Construction Spending 14 6 128 52 2 0 0.003 -0.003 Construction Spending 12 8 795 762 0 0 -0.010 -0.008 Construction Spending 15 5 839 90 1 4 -0.003 0.000 Construction Spending 15 5 226 98 0 0 -0.002 -0.003 Consumer Confidence 11 9 752 273 1 0 -1.200 -1.400 Consumer Confidence 9 9 773 127 3 1 -2.500 0.600 Consumer Confidence 10 9 725 307 0 0 -0.500 1.900 Consumer Confidence 7 11 682 264 1 0 3.700 -3.300 Core CPI 15 5 89 18 0 0 -0.001 0.001 Core CPI 16 4 143 33 0 0 -0.001 0.000 Core CPI 15 5 70 19 0 0 0.002 0.002 Core PPI 3 2 14 2 0 0 0.022 0.011 Core PPI 4 2 30 3 0 0 -0.015 -0.005 Core PPI 3 1 11 1 0 0 -0.011 -0.012 CPI 6 1 696 122 2 0 0.005 0.007 CPI 5 1 1084 0 0 0 0.000 0.002 CPI 5 1 299 3 1 0 0.005 0.004
Each row is from a different time period. This raw data indicates that although the
economic values change quickly, the various web measures do not. This data was
collected on a weekly basis, with different measures being available each week.
The data came out at different time intervals, some as often as bi-weekly. The
actual and expected values would often rise or fall from period to period. However,
most of the web counts would not update as quickly as the data did. The actual data
or the consensus numbers could rise one week, then fall the next, then rise the next.

42
However, from week to week the web counts would usually stay the same, and
could not keep up with the actual results or the predicted results. For this reason it
is unlikely that the various web measures and the actual or expected numbers would
be correlated. A more realistic attempt at prediction would be to try to predict the
rise or fall of a quantity over the entire period studied. This was done by comparing
the first observation with the last observation and determining whether the last had
risen in comparison to the first. The various web measures were averaged in order
to determine whether the web predicted a rise or fall of the quantity. The
correlation between these web counts and the rise and fall of economic quantities
over the entire period studied is displayed in Table 14.
Table 14. Economic quantities over entire period.
Predicting Economic Quantities Over Entire Period
Correlation N 95% c.i.
lower 95% c.i.
upper Web Top 20 0.20 42 -0.12 0.47 Web count 0.20 42 -0.12 0.47 News Month 0.25 42 -0.06 0.51 Market 0.77 35 0.59 0.88 Predicting Economic Consensus Values Over Entire Period
Correlation N 95% c.i.
lower 95% c.i.
upper Web Top 20 0.13 35 -0.21 0.44 Web Count 0.03 35 -0.31 0.36 News Month 0.06 35 -0.28 0.38
These results are slightly better than those for each individual economic
observation. The value for the market is especially higher than the value for the
market for the individual economic observations. This is consistent with the

43
hypothesis that an economic value is more predictable over the long term than the
short term. Also, the correlations for the various web measures are slightly higher
for the long term predictions than the short term predictions. However, none of
these correlations were significantly greater than zero, and therefore the hypothesis
that the web can predict economic quantities was not confirmed.
The economic data was the only data in the study that did not confirm our
hypothesis that the various web measures would be significantly greater than zero.
It is difficult to determine why none of the correlations between the various web
measures and economic data are significant. One potential reason is that our
hypothesis is false and the Internet does not act as an efficient market. However, if
that were the case, then it would be unlikely that the other data would yield
correlations significantly greater than zero. It is also possible that this data is
simply too repetitive, and the web does not update itself quickly enough to keep up.
Movie openings, music albums releases, and reality shows with distinct contestants
only occur once. Major sporting events only occur once a year. Elections for a
given office occur at most once every two years. When individuals express
opinions such as “Chaffee will win,” it is likely that they are writing about the most
current election. However, economic data, such as inflation data, can come out as
often as every two weeks. Therefore, when an individual writes “inflation will
rise,” the individual could be writing about inflation from a month ago or even one
year ago. Therefore, the economic data is noisier than the data from other areas.
Another potential for noise in the economic data is the fact that the queries
used were not very specific. The complication comes from the fact that a query like
44
“inflation will rise” could mean one of two things. It could simply mean that
inflation will be positive rather than negative. However, because inflation is
usually positive, it is more common to use the phrase “inflation will rise” to indicate
that inflation will be higher in the given period than it was in the previous period,
for example, “Inflation will rise from 2.1 percent to 3.2 percent.” This rising or
falling is especially difficult to determine because some economic numbers are
reported at an absolute level, such as home sales at 2.3 million, whereas some
economic numbers are reported at a relative level, such as construction spending
decreasing by 0.3 percent.
4.6 The 2006 Congressional and Gubernatorial Elections The web top 20 data was not available for the elections because simple searches
like “Clinton will win” were used. Top 20 data can only be gathered when a more
general query such as “will win the Super Bowl” is used, because the teams
preceding the query can be extracted from the top 20 results. If the query searched
is simply “Clinton will win” then the top 20 results will all indicate that Clinton will
win the election rather than her opponent. If the query searched is “will win the
Super Bowl” then different teams can be found preceding the query in each of the
top 20 results.
Table 15 displays the correlations between various web measures and the
election results and the election prediction market.

45
Table 15. Election results and probabilities.
Predicting Election Results
Correlation N 95% c.i.
lower 95% c.i.
upper Web Count 0.27 478 0.19 0.35 News Month 0.18 158 0.02 0.32 Web/name 0.28 478 0.19 0.36 News/name 0.15 158 0.00 0.30 Market 0.89 162 0.85 0.92 Predicting Election Market Probabilities
Correlation N 95% c.i.
lower 95% c.i.
upper Web Count 0.49 162 0.36 0.60 News Month 0.33 80 0.12 0.51 Web/name 0.30 162 0.15 0.43 News/name 0.27 80 0.06 0.46
The correlations are between the percentages of the various counts that each
candidate received and the percentage of the total votes that each candidate
received. “Web/name” is the number of web results divided by the number of
results when searching the candidate’s name. Similarly, “News/name” is the
number of news results divided by the number of results when searching the
candidate’s name. “Market prediction” uses the predictions from the
TradeSports.com (2006) to predict the results of the election. The data from
TradeSports.com are probabilities of a candidate winning, so the correlation
displayed is the correlation between the probability of the candidate winning and
the actual percentage of votes received.

46
These results confirm our hypotheses and mirror the results found with
earlier data. All correlations are statistically significant or marginally significant.
The market prediction was the most accurate, and the various web measures all had
higher correlations when predicting the market probabilities than when predicting
the actual results.
Table 16 displays accuracies of the various web measures when predicting
the election results and market predictions.
Table 16. Web prediction accuracies.
Accuracies of web predictions for election results
Correct Incorrect Probability correct
95% c.i. lower
95% c.i. upper
Web count 137 99 0.58 0.52 0.64 News count 45 29 0.61 0.50 0.72 Web/name 145 94 0.61 0.54 0.67 News/name 47 32 0.59 0.49 0.70 Market prediction 76 6 0.93 0.87 0.98 Accuracies of web predictions for market results
Correct Incorrect Probability correct
95% c.i. lower
95% c.i. upper
Web count 56 24 0.70 0.60 0.80 News count 25 12 0.68 0.52 0.83 Web/name 48 33 0.59 0.49 0.70 News/name 27 13 0.68 0.53 0.82
As with the election itself, whichever candidate gets a higher search result count is
considered to be the predicted winner. Ties (cases in which candidates received
equal web result counts) were excluded from the data. Along with predicting the
actual results of the elections, the web count predictions were compared to the

47
predictions of a prediction market, TradeSports.com (2006). The prediction market
presents its predictions as probabilities of candidates winning, so the predicted
winner for the market data was the candidate with the higher probability of
winning.
The market data was especially predictive of the results, with an accuracy
above 0.90. It was expected that there would be more agreement with this
prediction data, because the prediction data is supposed to incorporate all that is
known about the election at the time. As expected, the various web measures
performed better when predicting the market data than the actual election. Most of
the market accuracies are close to 0.7, higher than the accuracies of the predictions
of the actual election.
There was expected to be a great deal of noise in this data. The searches
that were used were simply “candidate will win,” such as “Johnson will win.”
These queries are not precise in that “Johnson” may not refer to the candidate and
“win” may not refer to them winning the election. Therefore, the main criterion
was simply to achieve an accuracy significantly greater than the chance level of
50%. Observing the column “95% c.i. lower”, the lower half of the 95%
confidence interval, it can be seen that all of the predictions are greater than or
equal to 0.49. The actual accuracy of the predictions were quite consistent, all very
close to the value of 0.60 for the election results and close to 0.70 for the market
data.
Earlier it was mentioned that there was a great deal of noise in the queries
that were used to test whether a candidate would win. In order to lessen this noise,

48
the top 50 search results were examined manually to determine which ones referred
to winning the election and which ones did not. There were 495 searches done.
Examining 50 results from each would result in 24,750 examinations. Rather than
doing all of these examinations, the results were broken down by the total number
of search results into deciles. The results were broken down by the total number of
search results because it was expected that the candidates with the highest number
of search results would contain the most noise, as had occurred with data from the
other areas studied. For each of these deciles, the three candidates whose number
of search results was closest to the average of each of the deciles were examined.
Table 17 displays the name of the candidate, the total number of web search results,
the number of results that correctly expressed the opinion that the candidate would
win, the number of results examined, and the percentage that correctly expressed
the opinion that the candidate would win.

49
Table 17. Percent of accurate search results.
Contest Name Web count
Number correct Sample Percent
Connecticut 05 Johnson 1815 0 50 0.00 Illinois 05 White 1856 0 50 0.00 New York Senate Clinton 1858 2 50 0.04 Florida 01 Roberts 455 0 50 0.00 New Jersey Senate Menendez 454 47 50 0.94 South Dakota Governor Rounds 491 0 50 0.00 Maryland Governor Ehrlich 199 38 50 0.76 New York 29 Massa 197 9 50 0.18 Maryland Senate Cardin 195 50 50 1.00 Connecticut 02 Courtney 101 9 40 0.23 Alaska Governor Palin 100 31 35 0.89 Illinois 09 Shannon 100 0 38 0.00
Illinois 08 Bean 56
16 30 0.53 New York 20 Sweeney 54 22 30 0.73 California 45 Roth 54 0 20 0.00
Hawaii Senate Akaka 39
20 20 1.00
Arizona 08 Giffords 40
27 27 1.00 Maine Senate Snowe 40 33 33 1.00 New York 29 Kuhl 27 15 17 0.88 Illinois 06 Roskam 26 14 16 0.88 California 11 Pombo 26 35 35 1.00 California 12 Lantos 10 4 4 1.00 California 17 Farr 10 0 4 0.00 Texas 04 Melancon 10 16 16 1.00 Florida 09 Bilirakis 4 3 3 1.00
Ohio 11 Tubbs- Jones 4 3 3 1.00
Illinois 03 Lipinski 4 2 3 0.67 Ohio 14 LaTourette 1 2 2 1.00

50
Ohio 16 Regula 1 2 2 1.00 Pennsylvania 04 Altmire 1 4 4 1.00
The correlation between the total results and the percentage correct was
-0.56, which was statistically significant. This confirmed the hypothesis that those
with higher counts had more false positives. For example, Johnson often referred to
a boxer winning a fight or a driver winning a race, White often referred to the
“white” color in chess winning the match, and Clinton referred to Hillary Clinton
winning the 2008 presidential nomination. An examination of the data indicated
that there was a large increase in accuracy at the count of 26. The accuracy at the
decile representing a result count of 26 and lower was 0.87. The accuracy of the
deciles above 26 was 0.35. The value at the midpoint of this decile and the one
above, which was 41, was also tested. The average value of the percentage correct
for result counts below 41 was 0.89. The average value of the percentage correct
for result counts 41 or above was 0.35. Therefore the noise for the results below 41
was less than the noise of the results 41 or above. With less noise present, we
expected to have better results when examining only the candidates with result
counts below 41.
Table 18 displays the correlations between various web measures and the
election results and the election prediction market including races in which both
candidates had result counts less than 41.

51
Table 18. Election results for counts less than 41.
Lower than 41 predicting election results
Correlation N 95% c.i.
lower 95% c.i.
upper Web Count 0.46 124 0.30 0.58 Web/Name 0.51 124 0.36 0.63 Market 0.91 20 0.79 0.97 Lower than 41 predicting market data
Correlation N 95% c.i.
lower 95% c.i.
upper Web Count 0.79 20 0.53 0.91 Web/Name 0.91 20 0.78 0.96
For the election results, the web count and web/name correlations were 0.19 and
0.23 higher for this smaller data set than the entire data set. For the market results,
the web count and web/name correlations were 0.30 and 0.70 higher for this smaller
data set than the entire data set. As predicted, eliminating some of the noise in the
election data led to a vast improvement in accuracy.
Table 19 displays the accuracies when including races in which both
candidates had result counts less than 41.

52
Table 19. Election accuracies for counts less than 41.
Lower than 41 predicting election results
Correct Incorrect Probability
correct
95% c.i.
lower
95% c.i.
upper Web Count 38 21 0.64 0.52 0.77 Web/Name 46 16 0.74 0.63 0.85
Lower than 41 predicting market data
Correct Incorrect Probability
correct
95% c.i.
lower
95% c.i.
upper Web Count 7 2 0.78 0.51 1.00 Web/Name 10 0 1.00 N.A. N.A
The results for the news counts are not displayed because there was a sample size of
only 2. As expected, the probability correct and the correlations for the web count
and the web/name is higher than it was when using all of the available data. If
including results less than 41 is more accurate than using all of the data, and
predicting the market data is more accurate than predicting the actual election, then
these results should be the most accurate of all. Table 5 confirms that these are the
most accurate data. The web/name data predicted the market data perfectly.
These final results should be accepted with some caution because the sample
size was rather small when including those with counts under 41. However, even
with the sample size of 478, all of the correlations and accuracy percentages for the
elections were statistically significant or only missed statistical significant by two

53
percent. As a whole, these election results indicate that even noisy data
outperformed chance levels, and some of the least noisy data were 100% accurate.
4.7 Combined results There are a number of different approaches to combine results from separate
studies. Because almost all of the results from the current project are in the form of
correlations, the strategy chosen was to combine all of these data into one single
data set and to calculate correlations between each measurement. Each of these
data sets were measured on very different scales, so each data set was transformed
with the standard normal distribution before any of the calculations were performed
(NAPC, 2007, Measuring Usability, 2007). Table 20 displays the results of this
analysis.
Table 20. All results combined.
All results combined, Predict Actual Results
Correlation N
95% c.i.
lower
95% c.i.
upper Web Top 20 0.42 174 0.29 0.53 Web Count 0.31 781 0.25 0.38 News Month 0.30 448 0.21 0.38 Market 0.75 329 0.70 0.79 All results combined, Predict Market
Correlation N
95% c.i.
lower
95% c.i.
upper Web Top 20 0.40 167 0.26 0.52 Web Count 0.46 329 0.37 0.54 News Month 0.36 234 0.25 0.47

54
These results fit the expected pattern of results almost exactly. In confirmation of
the primary hypothesis, all of these correlations were greater than zero at a
statistically significant level. The market data correlation was significantly greater
than all other correlations. Contrary to our hypothesis, the web top 20 correlations
were greater than the web counts for predicting the actual results, although not
significantly greater. Confirming our hypothesis, the web top 20 correlations were
less than the web counts when predicting the market data, although not significantly
greater. The web count and news month correlations for the market data were both
greater than those for the actual results. In the case of web counts this difference
between the actual results and the market results was nearly statistically significant.
These results confirm all but one hypothesis, which is that the overall web counts
measure would outperform the web top 20 measure. This lack of a difference
between the web top 20 and the web counts may occur because the web counts and
the web top 20 measures were again highly correlated. The correlation was 0.75
when using these combined results. This correlation indicates that the web top 20
already contained much of the information from all of the other web counts.

55
5. REPLICATION
5.1 Methodology In order to further test the techniques used in the prior sections, more data was
gathered after all of the preceding data had been analyzed. The new data was
analyzed in the same way as the previous data had been. This paradigm is similar
to that used in data mining. In data mining one often trains a model on a certain
dataset and then tests the model on another dataset. Rather than waiting for the
events to complete, only the market data, as opposed to the actual results, were
predicted.
There were no events comparable to the 2006 congressional and
gubernatorial elections, so these results were not replicated. The economic web
results were not correlated significantly with the actual results or market data, so
there was no reason to attempt to replicate the economic results.
5.1.1 Movie Box Office Receipts and Music Album Sales The movie and music results were analyzed in the same manner as
previously described. The data was collected between January 29, 2007 and March
12, 2007.
5.1.2 Sporting Events and Reality Television Programs The sports results analyzed were the NBA finals of professional basketball, the
Stanley Cup championship of professional hockey, and the national championship
of college basketball. All of these events were from 2007. The queries used were:
“will win the NBA finals,” “will win the Stanley Cup,” and “will win the NCAA
tournament.” There was a greater challenge with these sports data than with the

56
earlier sports data because there is no popular name for the NBA finals or the
NCAA tournament. This is in contrast to the earlier events predicted; the World
Series, the Super Bowl, and the BCS. All of these queries were searched on March
14, 2007. The betting odds were taken from VegasInsider.com (2007a, 2007b,
2007c).
The reality television programs that were predicted were the versions of
“American Idol” and “The Apprentice” that were in progress during March, 2007.
The data was sampled on March 14, 2007. The betting odds were taken from
Bodog.com (2007).
5.2 Results
5.2.1 Movie Box Office Receipts and Music Album Sales Table 21 displays the correlation between the web and news month search
result counts and the amount of money generated in the first weekend of the
movie’s release.
Table 21. Movie results.
Replicated movie results
Correlation N 95% c.i.
lower 95% c.i.
upper Web Count 0.69 12 0.19 0.91 News Month 0.66 12 0.14 0.90
Original movie results
Correlation N 95% c.i.
lower 95% c.i.
upper Web Count 0.40 36 0.08 0.65 News Month 0.26 36 -0.07 0.54

57
These replicated correlations are greater than the correlations from the earlier
movies data, although not significantly greater. The web count is highly influenced
by the movie “Ghost Rider.” If this data point were eliminated, then the web count
correlation would drop to 0.19, but the news month correlation would drop only
slightly, to 0.54. Overall these results replicate the earlier results indicating that
there were statistically significant correlations between the web and news month
counts and movie box office returns.
Table 22 displays the correlation between the web and news month search
counts and the position of the album on the billboard 200 chart.
Table 22. Music album results.
Replicated music album results
Correlation N 95% c.i.
lower 95% c.i.
upper Web Count -0.50 56 -0.67 -0.27 News Month -0.51 56 -0.68 -0.29
Original music album results
Correlation N 95% c.i.
lower 95% c.i.
upper Web Count -0.45 93 -0.60 -0.27 News Month -0.54 93 -0.67 -0.38
These replicated correlations are very similar to the earlier results, further
confirming our primary hypothesis that the Internet counts are predictive of success.
5.2.2 Sporting Events and Reality Television Programs Table 23 displays correlations between various web measures and the probability of
winning based on the sports betting market.

58
Table 23. Predicting the sporting events betting market.
Replicated: Predicting Sporting Events Betting Markets
Correlation N 95% c.i.
lower 95% c.i.
upper Web Top 20 0.41 64 0.18 0.60 Web Count 0.26 64 0.01 0.47 News Month 0.41 64 0.18 0.60
Original: Predicting Sporting Events Betting Markets
Correlation N 95% c.i.
lower 95% c.i.
upper Web Top 20 0.44 119 0.29 0.58 Web Count 0.55 119 0.41 0.66 News Month 0.47 119 0.32 0.60
These results are very similar to the earlier results. The web count is lower than the
earlier web count, but is still significantly greater than zero. The replicated web
count is not significantly lower than the earlier web count. The web top 20
correlation was greater than the web count correlation, contrary to our hypothesis.
The correlation between the web top 20 and web count was again high, at 0.77.
Table 24 displays the correlations between the web counts and the
probabilities of winning reality television programs based on betting probabilities.

59
Table 24. Reality television results.
Replicated: Predicting Reality Television Probabilities
Correlation N 95% c.i.
lower 95% c.i.
upper Web Count 0.88 12 0.62 0.97
Original: Predicting Reality Television Probabilities
Correlation N 95% c.i.
lower 95% c.i.
upper Web Count 0.56 13 0.01 0.85
The web top 20 and news month measures did not get any counts and therefore
could not be included. The web top 20 did not get any results because all of the
names from the web top 20 were from previous seasons and therefore irrelevant.
The contestants for the show “The Apprentice” all received zero counts so that data
could not be included. Only the data from “American Idol” were included. The
web count correlation is rather high but may be considered misleading. Only one
person received any web count, with all other values being zero. However, the one
person that did get the count was a very large favorite, with a 0.50 chance of
winning against 11 other opponents according to the betting market.
5.3. Replication Summary The results of these replications provide further support for all but one of our
hypotheses. Again the only result not supporting our hypothesis was that the web
count did not outperform the web top 20. Most of the results were either very
similar to the earlier results or even stronger than the earlier results.

60
6. CONCLUSION
6.1 Summary Confirming the primary hypothesis, the majority of evidence collected for this
project indicates that the Internet can be used to make predictions that are more
accurate than chance levels. For all but the economic data, the web search results
and the news search results correlated significantly with the actual results and the
market data. Also as predicted, the correlations tended to be higher for the market
data than for the actual data. This was hypothesized to be the case because the
market data is more predictable than the actual data. The highest correlations from
all of the areas of study were between the market predictions and the actual events,
which is a confirmation of the wisdom of crowds hypothesis and the efficient
market hypothesis. The general pattern of results was similar for the majority of the
areas studied. This pattern was that the market predictions were the most accurate,
followed by the various web measures predicting the market data, followed by the
various web measures predicting the actual results.
The one hypothesis that was not confirmed was that the entire Internet could
outperform a smaller number of experts from the Internet. In the combined results,
the web top 20 correlation was higher than the web count when predicting the
actual results, but the web count correlation was higher than the web top 20 when
predicting the market results. Neither of these differences was statistically
significant, so it is difficult to suggest that either measure outperformed the other.
This is a very complicated result because, as explained in the background section,
the top results from an Internet search engine are actually ranked using data from
the entire Internet. The correlations between the web top 20 and the web counts

61
were rather high (0.68, 0.94, 0.90, 0.75, 0.77), further indicating that the
information from the entire internet is used in ranking the top 20 search results. It is
very difficult to find a difference between two measures if they are very similar.
Future research could attempt to identify the expert opinion in a more independent
way, which would be a more exact test of the wisdom of crowds hypothesis.
The overall results from this thesis indicate that the internet can be used to
make accurate predictions. It is not clear from this research, however, whether it is
better to use the entire internet to make the predictions, or to simply rely on the top
20 results returned by a search engine. However, because the top 20 results are
themselves determined by a crowd, in either case the internet achieves its accuracy
from the wisdom of crowds.
6.2 Future work There is a great deal of future work that could be done in this research area. The
main focus of this project was to collect data, not to create a perfect program to
collect data automatically. Future research could further automate and generalize
the techniques used in this paper. More specific queries could be used, and more
advanced computational linguistics techniques could eliminate some of the false
positives and false negatives that were encountered in the searches. The technique
of counting Internet search results could also be applied to more concrete facts. For
example, one could search with the query “the femur is the largest bone in the
human body” and count how many results this true statement receives. It may be
the case that true statements tend to get more results than false statements. This

62
could lead to improved question answering tools that are based on a sound
statistical foundation.
6.3 Implications Although this data has told us a great deal about how the Internet can be mined to
make predictions, it tells us even more important information about the Internet’s
reliability. Because the Internet is able to operate as an efficient market and a wise
crowd, it tells us that the Internet shares some of the same traits as a wise crowd.
First, it tells us is that the opinions on the Internet are diverse. Second, it tells us
that the opinions expressed on the Internet are at least partially independent of other
opinions. Finally, and most importantly, it tells us that the Internet as a whole
appears to contain accurate information and can predict future events.

63
BIBLIOGRAPHY
Bagrow, J. P. et al. (2004). How famous is a scientist? —Famous to those who
know us. Europhyics Letters, 67(4), 511–516. Retrieved September 28,
2006 from http://people.clarkson.edu/~bolltem/Papers/epl8312.pdf
Billboard.com (2007). Billboard Album Charts – Top 100 Albums – Music Retail
Sales. Retrieved January 31, 2006 from
http://www.billboard.com/bbcom/charts/chart_display.jsp?g=Albums&f=Th
e+Billboard+200
Brin, Sergey and Page, Lawrence. (1998). The Anatomy of a Large-Scale
Hypertextual Web Search Engine. Retrieved January 24, 2007 from
http://infolab.stanford.edu/~backrub/google.html
Bodog.com. (2006). Television and Movie Betting at Bodog Sportsbook. Retrieved
December 17, 2006 from
http://www.bodog.com/sports-betting/tv-film-movie-props.jsp
Bodog.com. (2007). Television and Movie Betting, American Idol Odds at Bodog
Sportsbook. Retrieved March 14, 2007 from
http://www.bodog.com/sports-betting/tv-film-movie-props.jsp
CNN (2006a). CNN.com – Elections 2006. Retrieved December 21, 2006 from
http://www.cnn.com/ELECTION/2006/pages/results/house/
CNN (2006b). CNN.com – Elections 2006. Retrieved December 21, 2006 from
http://www.cnn.com/ELECTION/2006/pages/results/senate/
CNN (2006c). CNN.com – Elections 2006. Retrieved December 21, 2006 from

64
http://www.cnn.com/ELECTION/2006/pages/results/governor/
Debnath, S., Pennock, D.M., Giles, C.L., & Lawrence, S. (2003). Information
incorporation in online in-Game sports betting markets. ACM Conference
on Electronic Commerce, 258-259.
ESPN. (2007). ESPN.com - NCF - 2006 College Football Rankings - Week 17.
Retrieved February, 2007 from http://sports.espn.go.com/ncf/rankingsindex
Fama, Eugene F. (1965). Random Walks in Stock Market Prices. Financial
Analysts Journal, September/October.
Gelbukh, Alexander. (2006). Computational Linguistics and Intelligent Text
Processing. Berlin:Springer.
Intrade. (2007). Intrade Trading Exchange. Retrieved January 24, 2007 from
https://www.intrade.com/v2/
Klein, Dan. (2006). Stanford Lexicalized Parser v1.5.1.
Measuring Usability. (2007). Measuring Usability: What’s a Z-Score and Why Use
it in Usability Testing? Retrieved February 12, 2007 from
http://www.measuringusability.com/z.htm
NAPC. (2007). National Association of Planning Councils (NAPC) Social
Indicators. Retrieved February 12, 2007 from
http://www.socialindicators.com/data.html
Neter, J., Kutner, M. H., Nachtsheim, C.J., & Wasserman, W. (1996). Applied
Linear Regression Analysis. Chicago: Irwin.
Simkin, M.V. & Roychowdhury, V.P. (2006). Theory of Aces: Fame by chance or
merit? Retrieved September 28, 2006 from http://www.citebase.org/cgi-

65
bin/fulltext?format=application/pdf&identifier=oai:arXiv.org:cond-
mat/0310049
Surowiecki, James (2004). Wisdom of Crowds : Why the Many Are Smarter Than
the Few and How Collective Wisdom Shapes Business, Economies, Societies
and Nations. Westminster, MD: Doubleday Publishing.
TradeSports.com (2006). Retrieved October 10, 2006 from
http://www.tradesports.com/aav2/trading/tradingHTML.jsp?eventSelect=co
upon_32&evID=coupon_32&updateList=true&showExpired=false#
Tyburski, Genie. (2002). It's Tough to Get a Good Date with a Search Engine.
Retrieved December 16, 2006 from
http://searchenginewatch.com/showPage.html?page=2160061
University of Iowa, Henry B. Tippie College of Business. (2007). Iowa Electronic
Market. Retrieved January 24, 2007 from
http://www.biz.uiowa.edu/iem/markets/
VegasInsider.com. (2006a). MLB Future Book Odds at VegasInsider.com, the
leader in Sportsbook and Gaming information - MLB Odds, MLB Future.
Retrieved October 4, 2006 from
http://www.vegasinsider.com/mlb/odds/futures/
VegasInsider.com. (2006b). Sportsbook at VegasInsider.com: Online Sports
Betting, Free Sports Picks, Las Vegas Odds, Adult Gambling. Retrieved
October 4, 2006 from
http://www.vegasinsider.com/u/futures/NFL_1336.cfm

66
VegasInsider.com. (2006c). Sportsbook at VegasInsider.com: Online Sports
Betting, Free Sports Picks, Las Vegas Odds, Adult Gambling. Retrieved
October 4, 2006 from
http://www.vegasinsider.com/u/futures/FBC_1435.cfm
VegasInsider.com. (2007a). College Basketball Future Book Odds at
VegasInsider.com, the leader in Sportsbook and Gaming information -
College Basketball Odds, College Basketball Futures, College Basketball
Future Odds. Retrieved March 14, 2007 from
http://www.vegasinsider.com/college-basketball/odds/futures/
VegasInsider.com. (2007b). NBA Future Odds at VegasInsider.com, The Leader in
Sportsbook and Gaming Information - NBA Odds, NBA Futures, NBA
Future Odds. Retrieved March 14, 2007 from
http://www.vegasinsider.com/nba/odds/futures/index.cfm#1479
VegasInsider.com. (2007c). College Basketball Future Book Odds at
VegasInsider.com, the leader in Sportsbook and Gaming information - NHL
Odds, NHL Futures, Pro Hockey Odds, Pro Hockey Futures. Retrieved
March 14, 2007 from
http://www.vegasinsider.com/nhl/odds/futures/
Wikipedia. (2007a). Prediction Market. Retrieved January 24, 2007 from
http://en.wikipedia.org/wiki/Prediction_market
Wikipedia. (2007b). Box Plot. Retrieved January 31, 2007 from
http://en.wikipedia.org/wiki/Box_plot
Wikipedia. (2007c). 2006 NFL Season. Retrieved February 1, 2007 from

67
http://en.wikipedia.org/wiki/2006_NFL_season
Wikipedia. (2007d). 2006 Major League Baseball season. Retrieved February 1,
2007 from
http://en.wikipedia.org/wiki/2006_Major_League_Baseball_season
Wikipedia. (2007e). Survivor: Cook Islands. Retrieved February 1, 2007 from
http://en.wikipedia.org/wiki/Survivor:_Cook_Islands
Wikipedia. (2007f). Project Runway. Retrieved February 1, 2007 from
http://en.wikipedia.org/wiki/Project_Runway#Season_3
Wikipedia. (2007g). Future Tense. Retrieved January 31, 2007 from
http://en.wikipedia.org/wiki/Future_tense
Yahoo! (2006a). http://www.yahoo.com/
Yahoo! (2006b). Yahoo! search web services. Retrieved December 16, 2006 from
http://developer.yahoo.com/search/
Yahoo! Finance (2007). Economic Calendar: Financial Calendars – Yahoo!
Finance. Retrieved January 24, 2006 from
http://biz.yahoo.com/c/ec/200701.html
Yahoo! Movies (2007a). Yahoo! Movies – In Theaters This Weekend. Retrieved
January 31, 2006 from http://movies.yahoo.com/feature/thisweekend.html
Yahoo! Movies (2007b). Yahoo! Movies – Weekend Box Office and Buzz.
Retrieved January 31, 2006 from http://movies.yahoo.com/mv/boxoffice/
Yahoo! News (2006). Retrieved December 16, 2006 from
http://news.search.yahoo.com/news/search?fr=sfp&ei=UTF-8&p=test

68