Embed Size (px)
Citation preview
The International Transport Forum
The International Transport Forum is an intergovernmental organisation with 57 member countries.
It acts as a think tank for transport policy and organises the Annual Summit of transport ministers. ITF is
the only global body that covers all transport modes. The ITF is politically autonomous and
administratively integrated with the OECD.
The ITF works for transport policies that improve peoples’ lives. Our mission is to foster a deeper
understanding of the role of transport in economic growth, environmental sustainability and social
inclusion and to raise the public profile of transport policy.
The ITF organises global dialogue for better transport. We act as a platform for discussion and pre-
negotiation of policy issues across all transport modes. We analyse trends, share knowledge and promote
exchange among transport decision-makers and civil society. The ITF’s Annual Summit is the world’s
largest gathering of transport ministers and the leading global platform for dialogue on transport policy.
The Members of the ITF are: Albania, Armenia, Argentina, Australia, Austria, Azerbaijan, Belarus,
Belgium, Bosnia and Herzegovina, Bulgaria, Canada, Chile, China (People’s Republic of), Croatia,
Czech Republic, Denmark, Estonia, Finland, France, Former Yugoslav Republic of Macedonia, Georgia,
Germany, Greece, Hungary, Iceland, India, Ireland, Israel, Italy, Japan, Korea, Latvia, Liechtenstein,
Lithuania, Luxembourg, Malta, Mexico, Republic of Moldova, Montenegro, Morocco, the Netherlands,
New Zealand, Norway, Poland, Portugal, Romania, Russian Federation, Serbia, Slovak Republic,
Slovenia, Spain, Sweden, Switzerland, Turkey, Ukraine, the United Kingdom and the United States.
International Transport Forum
2, rue André Pascal
F-75775 Paris Cedex 16
www.itf-oecd.org
Working Document
Any findings, interpretations and conclusions expressed herein are those of the authors and do not
necessarily reflect the views of the International Transport Forum or the OECD. Neither the OECD, ITF
nor the authors guarantee the accuracy of any data or other information contained in this publication and
accept no responsibility whatsoever for any consequence of their use. This document and any map
included herein are without prejudice to the status of or sovereignty over any territory, to the delimitation
of international frontiers and boundaries and to the name of any territory, city or area.
ABOUT THIS DOCUMENT – 3
METHODOLOGY FOR BENCHMARKING ROAD SAFETY IN LATIN AMERICA — © OECD/ITF 2016
About this document
This paper was prepared by Sandra Vieira Gomes, Laboratório Nacional de Engenharia Civil. It was
reviewed by Fred Wegman (University of Delft, the Netherlands), Chairman of the IRTAD Group, as
well as Shalom Hakkert (Technion University, Israel), Alberto Escobar (Automobile Club, Chile) and
Elke Hermans (University of Hasselt, Belgium).

TABLE OF CONTENTS – 5
METHODOLOGY FOR BENCHMARKING ROAD SAFETY IN LATIN AMERICA — © OECD/ITF 2016
Table of contents
Methodology for benchmarking road safety in Latin America................................................................. 7
Background and objectives of the project .................................................................................................... 7
Methodological approach............................................................................................................................. 7
Literature review .......................................................................................................................................... 9
International benchmarking of road safety: State of the art ....................................................................... 12
Methodology to assess road safety performance in a selection of Latin America countries ..................... 13
Data analysis: Overview ............................................................................................................................ 14
Detailed description of the data and information ....................................................................................... 15
Next steps ................................................................................................................................................... 19
References .................................................................................................................................................... 21
Annex 1. Country grouping analysis ........................................................................................................ 23
Population density ...................................................................................................................................... 23
Road network length .................................................................................................................................. 24
Motorisation rate ........................................................................................................................................ 24
Mortality rates ............................................................................................................................................ 27
Conclusions ................................................................................................................................................ 29
Annex 2. Conclusions and recommendations of the SUNflower+6 Projects ......................................... 31
SUNflower Project ..................................................................................................................................... 31
SUNflower+6 Project ................................................................................................................................ 32

METHODOLOGY FOR BENCHMARKING ROAD SAFETY IN LATIN AMERICA – 7
METHODOLOGY FOR BENCHMARKING ROAD SAFETY IN LATIN AMERICA — © OECD/ITF 2016
Methodology for benchmarking road safety in Latin America
Background and objectives of the project
In 2014, the International Transport Forum (ITF) at the OECD and the Fédération Internationale de
l’Automobile (FIA) signed a three-year co-operation agreement focusing on the improvement of
worldwide traffic crash data collection and analysis. One of the projects jointly selected for
implementation is the “Benchmarking of road safety performance in Latin American countries”.
Countries may learn to improve road safety from their own experiences and analyses, but also from
systematic comparison with other countries of both their safety performance and their safety
interventions and policies. Benchmarking can be defined as a systematic process of searching for best
practices, innovative ideas and highly effective operating procedures that lead to superior performance
(Hammer and Stranton, 1995). Country benchmarking is a useful tool, used in many regions in many
areas, to compare countries and learn from each other.
The objective of this project is to develop a methodology to assess road safety performance in a
selection of Latin American countries and benchmark their performance against a set of indicators and
best practices. The expected outcome is to offer policy makers in Latin America a tool to assess the
weaknesses and strengths of each country and to identify areas deserving policy attention, where the
experience of other countries may be usefully applied. The results from this benchmarking analysis will
be useful to policy makers and researchers in better understanding road safety, and in learning from each
other in order to design effective road safety policies.
This work inspires from the SUNflower1
project which was conducted in Europe (Koornstra et al.,
2002). Following the presentation of the project to OISEVI General Assembly in April 2015, ten
countries expressed interest in participating in the project: Argentina, Brazil, Chile, Colombia, Costa
Rica, Cuba, Ecuador, Mexico, Paraguay and Uruguay.
The project is implemented in five stages:
1. Development of a methodology – theoretical framework (November – June 2015)
2. Workshop with data experts from Latin America (July 2015)
3. Collection of data and information (November 2015 – January 2016)
4. Benchmarking analysis (February – April 2016)
5. Final Seminar with data experts and decision-makers (spring – summer 2016).
Methodological approach
The purpose of this paper is to describe the theoretical methodology to benchmark road safety
performance in a selection of Latin American countries. The methodological approach is based on the
road safety target hierarchy (see Figure 1) used in the SUNflower project (Koornstra et al., 2002). In this,
8 – METHODOLOGY FOR BENCHMARKING ROAD SAFETY IN LATIN AMERICA
METHODOLOGY FOR BENCHMARKING ROAD SAFETY IN LATIN AMERICA — © OECD/ITF 2016
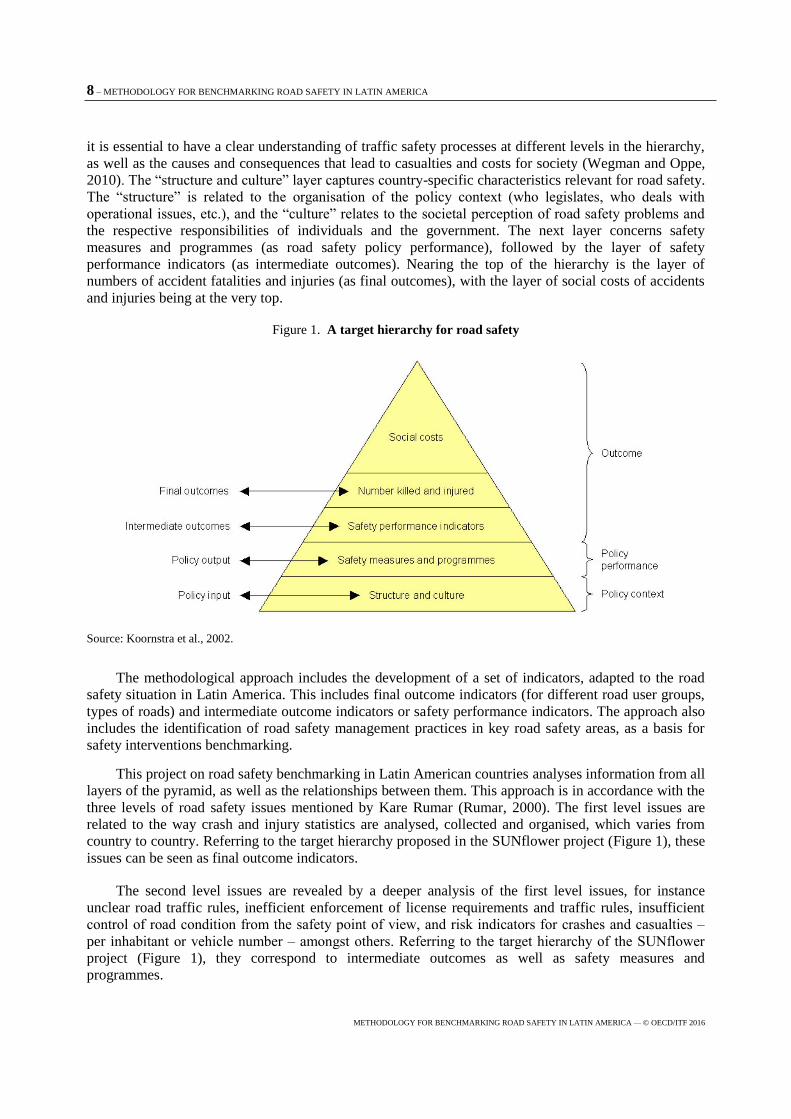
it is essential to have a clear understanding of traffic safety processes at different levels in the hierarchy,
as well as the causes and consequences that lead to casualties and costs for society (Wegman and Oppe,
2010). The “structure and culture” layer captures country-specific characteristics relevant for road safety.
The “structure” is related to the organisation of the policy context (who legislates, who deals with
operational issues, etc.), and the “culture” relates to the societal perception of road safety problems and
the respective responsibilities of individuals and the government. The next layer concerns safety
measures and programmes (as road safety policy performance), followed by the layer of safety
performance indicators (as intermediate outcomes). Nearing the top of the hierarchy is the layer of
numbers of accident fatalities and injuries (as final outcomes), with the layer of social costs of accidents
and injuries being at the very top.
Figure 1. A target hierarchy for road safety
Source: Koornstra et al., 2002.
The methodological approach includes the development of a set of indicators, adapted to the road
safety situation in Latin America. This includes final outcome indicators (for different road user groups,
types of roads) and intermediate outcome indicators or safety performance indicators. The approach also
includes the identification of road safety management practices in key road safety areas, as a basis for
safety interventions benchmarking.
This project on road safety benchmarking in Latin American countries analyses information from all
layers of the pyramid, as well as the relationships between them. This approach is in accordance with the
three levels of road safety issues mentioned by Kare Rumar (Rumar, 2000). The first level issues are
related to the way crash and injury statistics are analysed, collected and organised, which varies from
country to country. Referring to the target hierarchy proposed in the SUNflower project (Figure 1), these
issues can be seen as final outcome indicators.
The second level issues are revealed by a deeper analysis of the first level issues, for instance
unclear road traffic rules, inefficient enforcement of license requirements and traffic rules, insufficient
control of road condition from the safety point of view, and risk indicators for crashes and casualties ‒
per inhabitant or vehicle number ‒ amongst others. Referring to the target hierarchy of the SUNflower
project (Figure 1), they correspond to intermediate outcomes as well as safety measures and
programmes.

METHODOLOGY FOR BENCHMARKING ROAD SAFETY IN LATIN AMERICA – 9
METHODOLOGY FOR BENCHMARKING ROAD SAFETY IN LATIN AMERICA — © OECD/ITF 2016
The third level issues are less visible. They are related to the underlying processes or conditions of
the traffic situation, namely the organisation and management of road safety work ‒ such as central or
distributed responsibilities ‒ or the values and knowledge of road safety measures that the citizens in a
society may have. These issues correspond to the safety measures and programme level and the structure
and culture level from the SUNflower project.
Literature review
It is well recognised, whatever the policy sector under review, that there are many lessons to be
gained from the analysis of a country’s performance and policy in relation to practices in other countries
from the same region, or at the same level of development.
This type of analysis is called “benchmarking”. It consists of a systematic process of searching for
best practices, innovative ideas and highly effective operating procedures that lead to superior
performance (Hammer et al., 1995). Benchmarking is a tool to learn from the performances of others “in
the same class”.
Different types of benchmarking can be distinguished (Shen et al., 2015). One example is product
benchmarking, which compares road safety final outcomes, such as road traffic fatalities and injuries and
mortality rates (ITF, 2013; OECD and ECMT Transport Research Centre, 2006). Programme
benchmarking, on the other hand, compares activities related to human–vehicle–infrastructure
performance, such as drink driving, seat belt wearing, vehicle and road safety ratings, and corresponding
policy action. This approach has been frequently used in current road safety studies since these activities
are causally related to crashes or injuries and can provide a better understanding of the process that leads
to crashes (ITF, 2013; OECD and ECMT Transport Research Centre, 2006).
Strategic and organisational benchmarking compares national road safety strategies, resources,
management and organisational framework. However, due to the lack of appropriate indicators
characterising their features, only some initial attempts have been carried out to date, such as Al-Haji
(2007), Wegman et al. (2008), and Eksler et al. (2009).
Integrated benchmarking requires the development of a road safety index, which combines
individual indicator values into one single score (composite indicator). This type of benchmarking is
particularly useful for international comparisons, when a number of indicators are already available.
Regular comparisons per indicator may only give a simplified vision of the road safety situation, and can
be misleading, since different countries may operate in different circumstances. The use of a composite
road safety indicator (or index) allows to achieve a meaningful benchmarking (Wegman et al., 2008).
Various types of road safety benchmarking have been undertaken in several countries (mainly in
Europe). The sections below provide a summary of the most important road safety benchmarking
projects and provides a literature review of the published results.
SUNflower Project
The first SUNflower project (Koornstra et al., 2002) compared road safety performances,
programmes and policies in Sweden, United Kingdom and The Netherlands. The objectives were to
identify key factors that contributed to road safety improvements in these countries, and how these could
be used in other countries to further improve their performance. The three countries were chosen
because, although being considerably different, they present very similar and good safety records. They
had all implemented, in the preceding decades, targeted and well-planned road safety programmes, and
their policies had similar objectives. However they differed in their implementation in several aspects.
10 – METHODOLOGY FOR BENCHMARKING ROAD SAFETY IN LATIN AMERICA
METHODOLOGY FOR BENCHMARKING ROAD SAFETY IN LATIN AMERICA — © OECD/ITF 2016
The main goal of the project was to better understand the relationship between the developments of
road risks (through the reduction of the number of deaths and serious injuries) and the road safety
policies, programmes, and measures effectively implemented in Sweden, United Kingdom and The
Netherlands. Road safety was described as a pyramid consisting of several layers (as shown in Figure 1).
The analysis focused on assessing the effectiveness of the main road safety measures implemented
in each country and identifying the most effective ones. The analysis then assessed the potential benefits
for each of the three countries of a full implementation of these measures; areas where the countries
could further progress were thus identified. Furthermore, the analysis focuses on national road safety
strategies and fatality risks of comparable road types, road user modes and collisions between modes.
The analysis also included four case study subjects: drinking and driving; seat belt and child restraint
use; local infrastructural improvements on urban and minor rural roads; and safety on main inter-urban
roads. The project examined changes in overall national risk and several, more specific risk trends
between 1980 and 2000. Based on these analyses, the fatality reductions between 1980 and 2000 were
attributed to road safety measures and discussed in the context of the targeted fatality reductions up to
2010.
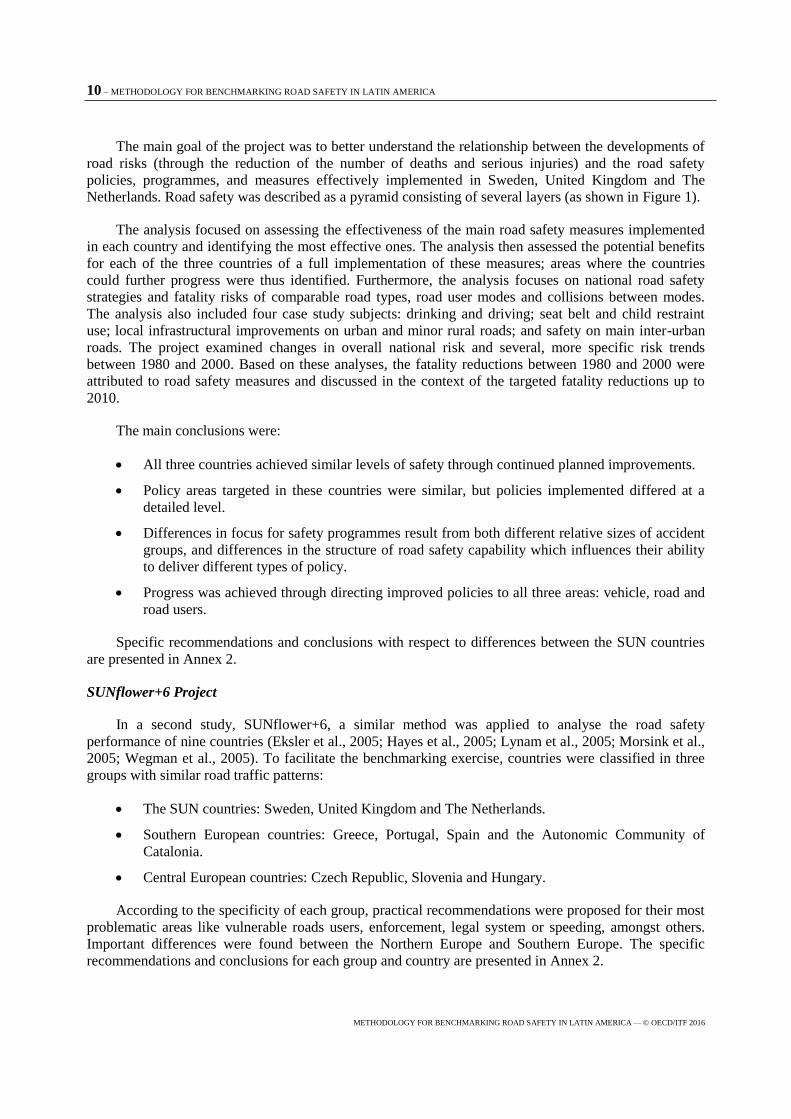
The main conclusions were:
All three countries achieved similar levels of safety through continued planned improvements.
Policy areas targeted in these countries were similar, but policies implemented differed at a
detailed level.
Differences in focus for safety programmes result from both different relative sizes of accident
groups, and differences in the structure of road safety capability which influences their ability
to deliver different types of policy.
Progress was achieved through directing improved policies to all three areas: vehicle, road and
road users.
Specific recommendations and conclusions with respect to differences between the SUN countries
are presented in Annex 2.
SUNflower+6 Project
In a second study, SUNflower+6, a similar method was applied to analyse the road safety
performance of nine countries (Eksler et al., 2005; Hayes et al., 2005; Lynam et al., 2005; Morsink et al.,
2005; Wegman et al., 2005). To facilitate the benchmarking exercise, countries were classified in three
groups with similar road traffic patterns:
The SUN countries: Sweden, United Kingdom and The Netherlands.
Southern European countries: Greece, Portugal, Spain and the Autonomic Community of
Catalonia.
Central European countries: Czech Republic, Slovenia and Hungary.
According to the specificity of each group, practical recommendations were proposed for their most
problematic areas like vulnerable roads users, enforcement, legal system or speeding, amongst others.
Important differences were found between the Northern Europe and Southern Europe. The specific
recommendations and conclusions for each group and country are presented in Annex 2.
METHODOLOGY FOR BENCHMARKING ROAD SAFETY IN LATIN AMERICA – 11
METHODOLOGY FOR BENCHMARKING ROAD SAFETY IN LATIN AMERICA — © OECD/ITF 2016
SUNflowerNext
The SUNflowerNext study (Wegman et al., 2008) focused on 27 countries. The objectives were to
identify the best performing countries, understand why they were performing better than other countries,
and analyse how outstanding practices from the countries which perform “best-in-class” could be
adapted to other countries (Gitelman, Doveh, and Hakkert, 2010; Wegman et al., 2008).
Different ways for creating a composite road safety index and evaluating the robustness of the basic
indicators involved were explored. The road safety performance indicator (RSI) combined three types of
performance indicators (see Figure 1): road safety performance indicators, implementation performance
indicators and policy performance indicators.
A composite road safety index combining these indicators was developed. Two weighting
procedures (principal component analysis2
and factor analysis3) were examined, based on the data
collected for 27 European countries (see also Papadimitriou et al., 2013). This allowed ranking and
grouping the countries according to their safety performance.
The performed analysis revealed that the country rankings ‒ based on the combination of indicators
‒ was different from the traditional ranking of countries ‒ based on mortality rates or fatality rates only.
The inclusion of information on policy performance and implementation performance to the ranking and
grouping process improved the results and made them more meaningful. It gave a more complete picture
of road safety than a ranking based only on fatality rates, which is currently the most common practice.
DaCoTa project
The DaCoTa project was a follow-up of the SafetyNet and the SUNflower related projects, which
had developed the pyramid structure and the concept of road safety performance indicators, and first
calculations were made. The Dacota project had the following four aims:
investigate whether indicators for road safety management can be used in the Road Safety
Index
extend the work on indicators for structural and cultural differences among countries
aggregate the indicators into one single score per layer of the pyramid
investigate whether further integrating the four layers into one single score for the composite
index as a whole would provide any added value.
The DaCoTa project aimed at delivering an instrument to facilitate the comparisons of the overall
road safety situation between countries (Bax et al., 2012). This instrument results from the combination
of indicators called the overall Road Safety Index (RSI) of a country, which describes the road safety
outcomes and the road safety policy performance. These performance indicators were compared at three
different levels (see Figure 2): final outcomes (injuries and crashes), intermediate outcomes (safety
performance indicators such as drink driving, speeding, car safety) and policy output (safety measures
and programmes).
A method to combine the indicators of final outcomes, intermediate outcomes and policy output
layers into one single composite index was developed. The authors calculated the composite index for
each layer and then investigated the value of combining the composite layer-indices in one overall Road
Safety Index. This was done using weighting procedures in order to deduce a weight for each indicator
12 – METHODOLOGY FOR BENCHMARKING ROAD SAFETY IN LATIN AMERICA
METHODOLOGY FOR BENCHMARKING ROAD SAFETY IN LATIN AMERICA — © OECD/ITF 2016
and to compute an index score for each country subsequently. However, different weighting procedures
have their own advantages and limitations, and imply different end results.
Ideally, an overall Road Safety Composite Index would provide an unambiguous ranking of all
countries, taking into account all indicators of safety outcomes. However specific theoretical and
practical problems on the weighting of layer-indexes were encountered, which required further research.
International benchmarking of road safety: State of the art
Countries within the same region, or that have already passed through similar stages of challenges
and development, usually have several common problems that can be identified in close co-operation
and improvements can be expected by learning lessons from existing best practices in other countries
(even if the final solutions or priorities may differ from one country to another, in accordance with their
own safety characteristics) (Shen et al., 2015).
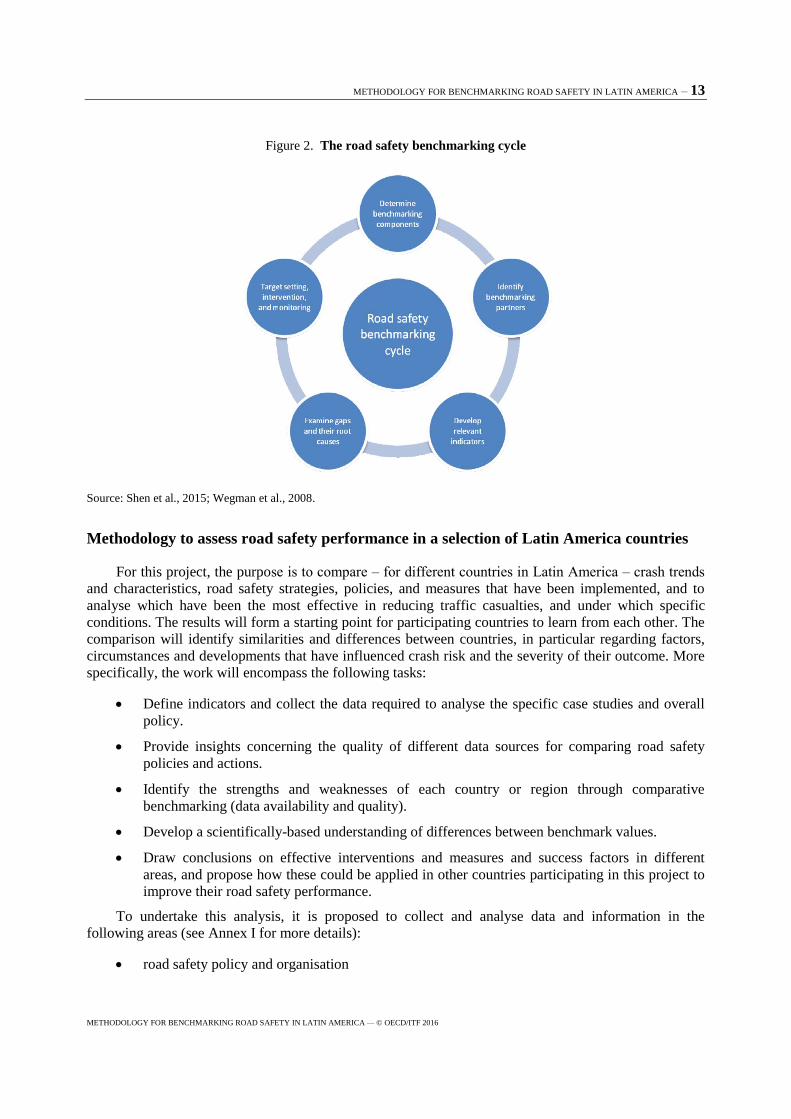
Shen et al. (2015) presented a road safety benchmarking cycle, adapted from Wegman et al. (2008),
with five core activities (see Figure 2):
determine the key components for road safety benchmarking
identify the benchmarking partners (or countries)
construct indicators for meaningful comparisons and data gathering
examine gaps in performance and their root causes
set targets (on final and intermediate outcomes) and monitoring progress.
The development of a road safety index, along with some theoretical and practical issues on this
subject, was discussed. Shen et al. also refer to the work of Al-Haji (2007) and Hermans et al. (2008).
Al-Haji proposed a road safety development index (RSDI), considering three main areas: fatality rates,
road user behaviour and system components (safer vehicles, safer roads, socio-economic level,
enforcement, and organisational performance). For this purpose, four weighting procedures were used:
equal weighting, expert judgments, subjective weights based on previous experience and principal
component analysis.
Hermans et al. (2008) proposed a road safety performance index for cross-country comparison. One
safety performance indicator was defined for each one of the six risk factors: alcohol and drugs, speeds,
protective systems, vehicles, roads, and trauma management. Five weighting procedures were
investigated to combine the separate indicators into one overall index: factor analysis, budget allocation,
analytic hierarchy process, data envelopment analysis, and equal weighting. The results were then
compared with the number of fatalities per million inhabitants. The data envelopment analysis method
was considered the best approach to the road safety ranking.
METHODOLOGY FOR BENCHMARKING ROAD SAFETY IN LATIN AMERICA – 13
METHODOLOGY FOR BENCHMARKING ROAD SAFETY IN LATIN AMERICA — © OECD/ITF 2016
Figure 2. The road safety benchmarking cycle
Source: Shen et al., 2015; Wegman et al., 2008.
Methodology to assess road safety performance in a selection of Latin America countries
For this project, the purpose is to compare ‒ for different countries in Latin America ‒ crash trends
and characteristics, road safety strategies, policies, and measures that have been implemented, and to
analyse which have been the most effective in reducing traffic casualties, and under which specific
conditions. The results will form a starting point for participating countries to learn from each other. The
comparison will identify similarities and differences between countries, in particular regarding factors,
circumstances and developments that have influenced crash risk and the severity of their outcome. More
specifically, the work will encompass the following tasks:
Define indicators and collect the data required to analyse the specific case studies and overall
policy.
Provide insights concerning the quality of different data sources for comparing road safety
policies and actions.
Identify the strengths and weaknesses of each country or region through comparative
benchmarking (data availability and quality).
Develop a scientifically-based understanding of differences between benchmark values.
Draw conclusions on effective interventions and measures and success factors in different
areas, and propose how these could be applied in other countries participating in this project to
improve their road safety performance.
To undertake this analysis, it is proposed to collect and analyse data and information in the
following areas (see Annex I for more details):
road safety policy and organisation
14 – METHODOLOGY FOR BENCHMARKING ROAD SAFETY IN LATIN AMERICA
METHODOLOGY FOR BENCHMARKING ROAD SAFETY IN LATIN AMERICA — © OECD/ITF 2016
general data on the road transport system
road crashes and casualty data, and traffic and road safety trends
case studies on key road safety areas.
In order to improve the benchmarking analysis, it is proposed to group the countries that present
similarities on key indicators (see section on Country grouping). However, as data availability is not yet
fully known, it was agreed that the final grouping, if needed, will be made at a later stage after a
preliminary analysis has been made.
Data analysis: Overview
An initial task is to describe and analyse current road safety strategies, including key interventions
and main stakeholders. Data and information will also be collected to describe the road transport system.
This will include: population data, country area, road length, registered motorised vehicles, annual
distances travelled by vehicles and passengers and fuel sales for motorised vehicles.
Safety data and case studies
Trends in fatal injuries and crashes will be analysed to explain differences identified by the
benchmarking. This will allow to relate the outputs with the key measures implemented by each country
and to identify the effects (positive or negative) of these measures. To identify major road safety issues
in Latin America, the project will encompass the analysis of case studies among the following topics:
pedestrians; powered two-wheelers; drink and driving; speed; seat belts and child restraint use; young
drivers; road infrastructure; vehicle safety; and trauma management. The final selection of case studies
will be made based on country interest and data availability. Case studies will only be undertaken when
at least three countries have good quality data to provide.
Data availability and limitation
During a workshop held in July 2015 with data experts from participating countries, the availability
of data was discussed ‒ in particular regarding information on slightly and severely injured victims.
Some countries do not make a distinction between slight and serious injury; and underreporting of injury
data was also mentioned. As a result, it was decided to limit the benchmarking analysis to fatalities and
fatal crashes ‒ disaggregated by road user type, age group, location and involved vehicles. Data will be
collected up to the year 2013. The analysis may be updated with 2014 data at a later stage.
Concerning time trends, each country will decide on the most appropriate time period – based on
data availability and comprehensiveness ‒ taking into account that the preferred option would be to have
a long timeframe, with data collected in a consistent way. Depending on the data availability, the
development of a composite index similar to the ones proposed in SUNflowerNext and DaCoTa projects
might be considered. The feasibility of this approach will be decided on after the data collection.
In the case that a complete set of data will not be available in the participating countries, data could
be collected at regional or municipal level, and a benchmarking analysis for three to four selected cities
or provinces may be undertaken. Nevertheless, during the workshop held in July 2015, experts indicated
they had enough data to participate at the national level, so neither the regional nor municipal analysis
was considered.
METHODOLOGY FOR BENCHMARKING ROAD SAFETY IN LATIN AMERICA – 15
METHODOLOGY FOR BENCHMARKING ROAD SAFETY IN LATIN AMERICA — © OECD/ITF 2016
Detailed description of the data and information
Road safety policy and organisation
main road safety policies, plans and road network improvement programmes
institutional issues, organisation of roads safety
selected key road safety legislation (e.g. speed limits, maximum authorised level of blood
alcohol content [BAC], seatbelt laws, etc.).
General data describing the road transport system
population: age distribution, geographical (urban/rural) distribution
driver licencing schemes: types, age limits
area (km2), road length (km) by type of road (urban roads, rural roads, motorways)
registered motorised vehicles by type: passenger cars, heavy good vehicles (≥ 3.5 tonnes),
SUVs and light good vehicles (< 3.5 tonnes), powered two-wheelers (motorcycles and
mopeds), coaches/buses, other motor vehicles, bicycles
vehicle-kilometres (by type of vehicles) and passenger–kilometres (public transport,
pedestrians).
Data on fatal road crashes
overall number of fatalities
number of fatalities by user type (car occupants, light-duty vehicle occupants, heavy-duty
vehicle occupants, bus occupants, powered two-wheeler users, cyclists, pedestrians, other road
users)
fatalities distribution by age group and road transport mode (passenger cars, heavy-duty
vehicles, light-duty vehicles, buses, cyclists, powered two-wheelers, pedestrians, others)
number of fatalities resulting from collisions, by type of user (driver, car occupant, lorry
occupant, bus occupant, motorcyclist, mopedist, cyclist, pedestrian, other road users) and in
single crashes or in collisions with different types of vehicles (passenger car, lorry, bus,
motorcycle, moped/cycle, animals, train/tram, other)
crash data by location (type of road, urban roads/ rural roads)
underreporting of road crashes and of road fatalities.
Case studies
Pedestrian
number of pedestrian deaths in collisions with passenger cars, heavy-duty vehicles, light-duty
vehicles, buses, powered two-wheelers, tram, trains and other type of vehicles
age distribution of pedestrian fatalities
trends in pedestrian fatality rates
16 – METHODOLOGY FOR BENCHMARKING ROAD SAFETY IN LATIN AMERICA
METHODOLOGY FOR BENCHMARKING ROAD SAFETY IN LATIN AMERICA — © OECD/ITF 2016
geographic distribution of pedestrian fatal crashes (urban areas/rural areas)
pedestrian fatalities per month, per day of week and by time of day
Powered two-wheelers (PTW)
number of PTW fatalities by type of accident and trends over time
age distribution of PTW fatalities
geographic distribution of PTW fatal crashes (urban areas/rural areas)
PTW drivers and passengers killed, with and without helmet.
Drink and driving
number of screening tests per year, per vehicle car
number of drink and drive infringements
screening tests positive in fatal and injury crashes
number of fatal crashes with driver over the legal alcohol limit
number of screening tests on drivers involved in fatal crashes
number of screening tests performed per accident.
Speed
speed limits per road type, vehicle class, and sanction regime
mean speed per road type
number of speed limits infringements on different types of roads
number of crashes and casualties due to excessive speed on different types of roads.
Seat belts and child restraint systems
seat belt use among drivers and passengers (front seat, back seat) for different road types
seat belt use and child restraint systems (CRS) infringements
seat belt use and CRS among fatal crashes (by age)
Young drivers
number of drivers involved in fatal crashes by driving license holdersʼ age
number of loss-of-control crashes by age group
number of new drivers (male/female)
number of car drivers involved in fatal crashes by age group
number of weekend night crashes by age group
METHODOLOGY FOR BENCHMARKING ROAD SAFETY IN LATIN AMERICA – 17
METHODOLOGY FOR BENCHMARKING ROAD SAFETY IN LATIN AMERICA — © OECD/ITF 2016
Infrastructure safety data from International Road Assessment Programme
Data on infrastructure safety will be collected through the International Road Assessment Programme
(IRAP). Star Rating of roads by road user group involves the proportion of roads classified as 1, 2, 3, 4
or 5 stars for different road users (where traffic volumes > 5 000 a day).
Road characteristics and adaptability to road users include:
roads where pedestrians are present and speed flows at 40km/h or more and which have no
footpath
roads where bicyclists are present and traffic flows at 40km/h or more that have no bicycle
facilities
roads with high motorcycle flows (>=20% of total) and traffic flows at 60km/h or more that
have no motorcycle facilities
roads carrying traffic at 80km/h or more that are undivided single carriageways
curves where traffic flows at 80km/h or more that have hazardous roadsides
intersections where traffic flows at 60km/h or more that have no roundabout, protected turn
lane or interchange.
Post trauma
number of evacuations to trauma centre by type (self, regular ambulance, mobile intensive care
unit, helicopter)
average time for arrival at scene, treatment in the field and arrival for definitive treatment in
hospital
total length (in days) of hospitalisation
number of Emergency Medical Stations (absolute number and per population)
number of trauma beds in permanent medical facilities (absolute number and per population)
length of hospitalisation in intensive care units
number of Emergency Medical Station’s vehicles (absolute number and per population).
Vehicles
total number of vehicles listed by year of manufacture (or year of first registration)
time series for the number of registered vehicles.
Country grouping
At the time of the development of this methodology, ten countries expressed interest in participating
in the project: Argentina, Brazil, Chile, Colombia, Costa Rica, Cuba, Ecuador, Mexico, Paraguay and
Uruguay. As mentioned earlier, a meaningful benchmarking analysis requires comparing subjects that
are comparable. In this respect it was considered useful to distinguish two groups of countries based on
their motorisation, geographical position, population patterns and other characteristics.
18 – METHODOLOGY FOR BENCHMARKING ROAD SAFETY IN LATIN AMERICA
METHODOLOGY FOR BENCHMARKING ROAD SAFETY IN LATIN AMERICA — © OECD/ITF 2016
It is expected that country grouping will increase the degree of “natural association” among
members of the same group, and help to distinguish members from different groups (Anderberg, 1973),
thus offering a more feasible basis for the safety performance comparisons and the transference of
successful experiences. An initial “grouping” analysis was undertaken, taking into account the following
factors:
population density
share of the population in urban and rural areas
motorisation rate
road fatality rate.
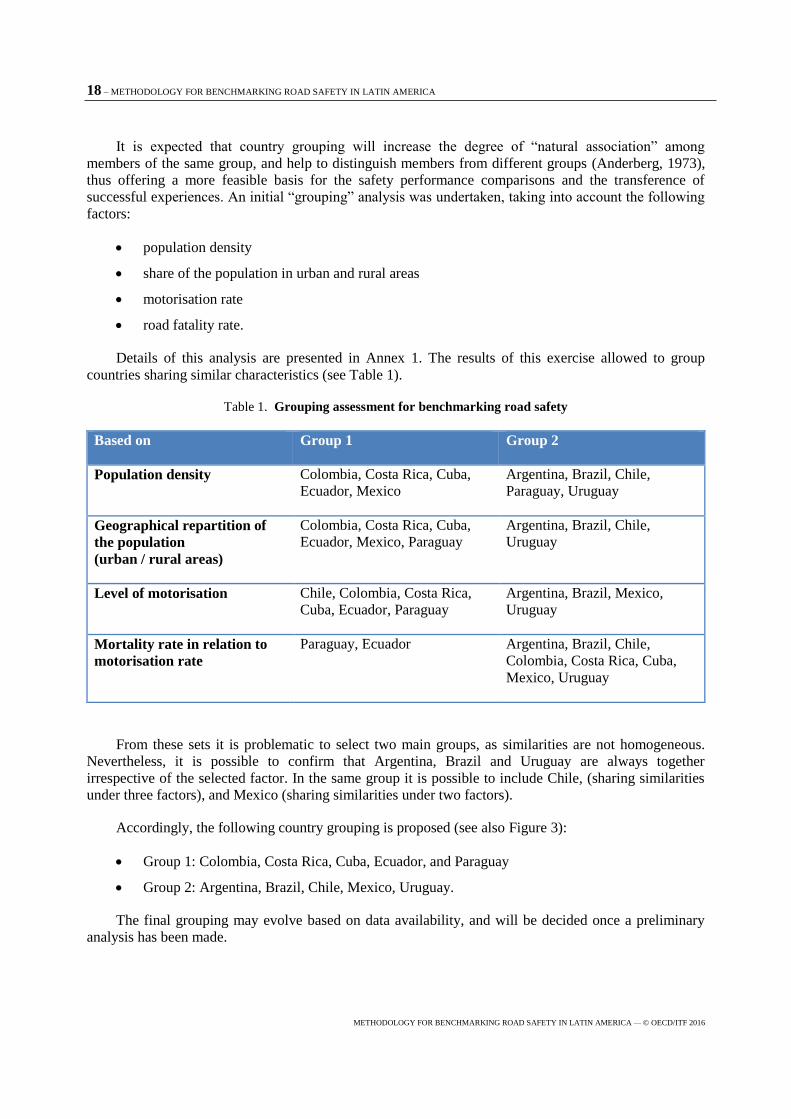
Details of this analysis are presented in Annex 1. The results of this exercise allowed to group
countries sharing similar characteristics (see Table 1).
Table 1. Grouping assessment for benchmarking road safety
Based on Group 1 Group 2
Population density Colombia, Costa Rica, Cuba,
Ecuador, Mexico
Argentina, Brazil, Chile,
Paraguay, Uruguay
Geographical repartition of
the population
(urban / rural areas)
Colombia, Costa Rica, Cuba,
Ecuador, Mexico, Paraguay
Argentina, Brazil, Chile,
Uruguay
Level of motorisation Chile, Colombia, Costa Rica,
Cuba, Ecuador, Paraguay
Argentina, Brazil, Mexico,
Uruguay
Mortality rate in relation to
motorisation rate
Paraguay, Ecuador Argentina, Brazil, Chile,
Colombia, Costa Rica, Cuba,
Mexico, Uruguay
From these sets it is problematic to select two main groups, as similarities are not homogeneous.
Nevertheless, it is possible to confirm that Argentina, Brazil and Uruguay are always together
irrespective of the selected factor. In the same group it is possible to include Chile, (sharing similarities
under three factors), and Mexico (sharing similarities under two factors).
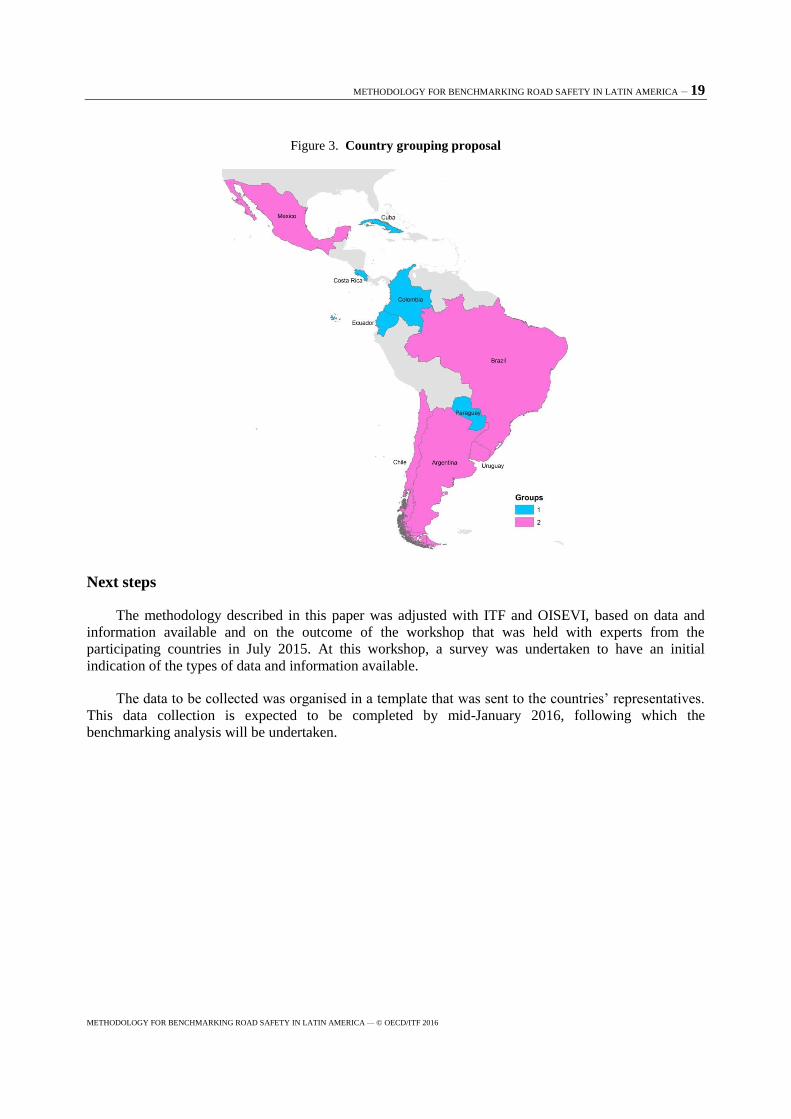
Accordingly, the following country grouping is proposed (see also Figure 3):
Group 1: Colombia, Costa Rica, Cuba, Ecuador, and Paraguay
Group 2: Argentina, Brazil, Chile, Mexico, Uruguay.
The final grouping may evolve based on data availability, and will be decided once a preliminary
analysis has been made.
METHODOLOGY FOR BENCHMARKING ROAD SAFETY IN LATIN AMERICA – 19
METHODOLOGY FOR BENCHMARKING ROAD SAFETY IN LATIN AMERICA — © OECD/ITF 2016
Figure 3. Country grouping proposal
Next steps
The methodology described in this paper was adjusted with ITF and OISEVI, based on data and
information available and on the outcome of the workshop that was held with experts from the
participating countries in July 2015. At this workshop, a survey was undertaken to have an initial
indication of the types of data and information available.
The data to be collected was organised in a template that was sent to the countriesʼ representatives.
This data collection is expected to be completed by mid-January 2016, following which the
benchmarking analysis will be undertaken.
20 – METHODOLOGY FOR BENCHMARKING ROAD SAFETY IN LATIN AMERICA
METHODOLOGY FOR BENCHMARKING ROAD SAFETY IN LATIN AMERICA — © OECD/ITF 2016
Notes
1. The SUNFLOWER project was originally developed to assess road safety in Sweden, United Kingdom and
the Netherlands (SUN-countries), and thereafter was extended and applied to nine countries.
2. Principal component analysis (PCA) is a statistical procedure that uses an orthogonal transformation to
convert a set of observations of possibly correlated variables into a set of values of linearly uncorrelated
variables called principal components.
3. Factor analysis is a statistical method used to describe variability among observed, correlated variables in
terms of a potentially lower number of unobserved variables called factors.
REFERENCES – 21
METHODOLOGY FOR BENCHMARKING ROAD SAFETY IN LATIN AMERICA — © OECD/ITF 2016
References
Al-Haji, G. (2007), Road Safety Development Index (RSDI): Theory, Philosophy and Practice,
Linköping University.
Anderberg, M.R. (1973), Cluster Analysis for Applications, New York: Academic Press.
Bax, C., P. Wesemann, V. Gitelman, Y. Shen, C. Goldenbeld, E. Hermans and L. Aarts (2012),
Developing a Road Safety Index. Deliverable 4.9 of the EC FP7 project DaCoTA.
Eksler, V., J Heinrich, J. Gyurmati, P. Hollo, B. Bensa, N. Bolko and D. Krivek (2005), SUNflower+6.
A comparative study of the development of road safety in the Czech Republic, Slovenia and
Hungary. CDV.
GADM (2015), GADM database of Global Administrative Areas, Digital Chart of the World. www.diva-
gis.org/ (accessed 1 January 2015).
Gitelman, V., E. Doveh and S. Hakkert (2010), "Designing a Composite Indicator for Road Safety".
Safety Science, Vol. 48/9, pp. 1212–1224, DOI:10.1016/j.ssci.2010.01.011.
Hammer, M. and S. Stranton (1995), The Reengineering Revolution: A Handbook. HarperCollins, New
York.
Hayes, S., S. Serrano, L. Giralt, P. Zori, Y. Handanos, C. Lymperi and S. Vieira Gomes (2005),
SUNflower+6. A Comparative Study of the Development of Road Safety in Greece, Portugal,
Spain and Catalonia, (DSD, Ed.). Barcelona.
Hermans, E., F. Van den Bossche and G. Wets (2008), "Combining Road Safety Information in a
Performance Index". Accident, Analysis and Prevention, Vol. 40/4, pp. 1337–44,
DOI:10.1016/j.aap.2008.02.004.
Index Mundi (2015), Index Mundi, www.indexmundi.com/(accessed 20 January 2015).
ITF (2013), Road Safety Annual Report 2013, OECD Publishing, Paris.
DOI: http://dx.doi.org/10.1787/irtad-2013-en
Koornstra, M., D. Lynam, G. Nilsson, P. Noordzij, H-E. Pettersson, F.Wegman and P. Wouters (2002),
SUNflower: A comparative study of the development of road safety in Sweden, the United
Kingdom, and the Netherlands. www.swov.nl/rapport/sunflower/sunflower.pdf.
Lynam, D., G. Nilsson, P. Morsink, B. Sexton, D. Twisk, C. Goldenbeld and F. Wegman (2005),
SUNflower + 6 An extended study of the development of road safety in Sweden, the United
Kingdom, and the Netherlands.
Morsink, P., S. Oppe, M. Reurings and F.Wegman (2005), Development and application of a footprint
methodology for the SUNflower+6 countries. Leidschendam: SWOV.
22 – REFERENCES
METHODOLOGY FOR BENCHMARKING ROAD SAFETY IN LATIN AMERICA — © OECD/ITF 2016
OECD and ECMT Transport Research Center (2006), Country Reports on Road Safety Performance,
(September).
Papadimitriou, E., G. Yannis, F. Bijleveld and J. L.Cardoso (2013), “Exposure Data and Risk Indicators
for Safety Performance Assessment in Europe”. Accident Analysis and Prevention, Vol. 60, pp.
371–83. DOI:10.1016/j.aap.2013.04.040.
Rumar, K. (2000), “Transport Safety Visions, Targets and Strategies: Beyond 2000”, European
Transport Safety Council ETSC, Brussels (January 1999).
Shen, Y., E. Hermans, Q. Bao, T. Brijs, G.Wets and W. Wang (2015), “International Benchmarking of
Road Safety: State of the art”, Transportation Research Part C, Vol. 50, pp. 37–50,
DOI:10.1016/j.trc.2014.07.006.
Wegman, F., J. Commandeur, E. Doveh, V. Eksler, V. Gitelman, S. Hakkert and S. Oppe (2008),
SUNflowerNext: Towards a Composite Road Safety Performance Index, Deliverable D6.16 of the
EU FP6 project SafetyNet.
Wegman, F., V. Eksler, S. Hayes, D. Lynam, P. Morsink and S. Oppe (2005), A comparative study of the
development of road safety in the SUNflower+6 countries, Final Report, Leidschendam: SWOV.
Wegman, F. and S. Oppe (2010), “Benchmarking road safety performances of countries”, Safety Science,
Vol. 48/9, pp. 1203–1211, DOI:10.1016/j.ssci.2010.02.003.
World Health Organization (2013), Global Status Report on Road Safety, Vol. 1, p. 318.
ANNEX 1: COUNTRY GROUPING ANALYSIS – 23
METHODOLOGY FOR BENCHMARKING ROAD SAFETY IN LATIN AMERICA — © OECD/ITF 2016
Annex 1. Country grouping analysis
A grouping analysis was made based on the following information for each country: population
density, road length, motorisation and mortality rates (GADM, 2015; Index Mundi, 2015; World Health
Organization, 2013).
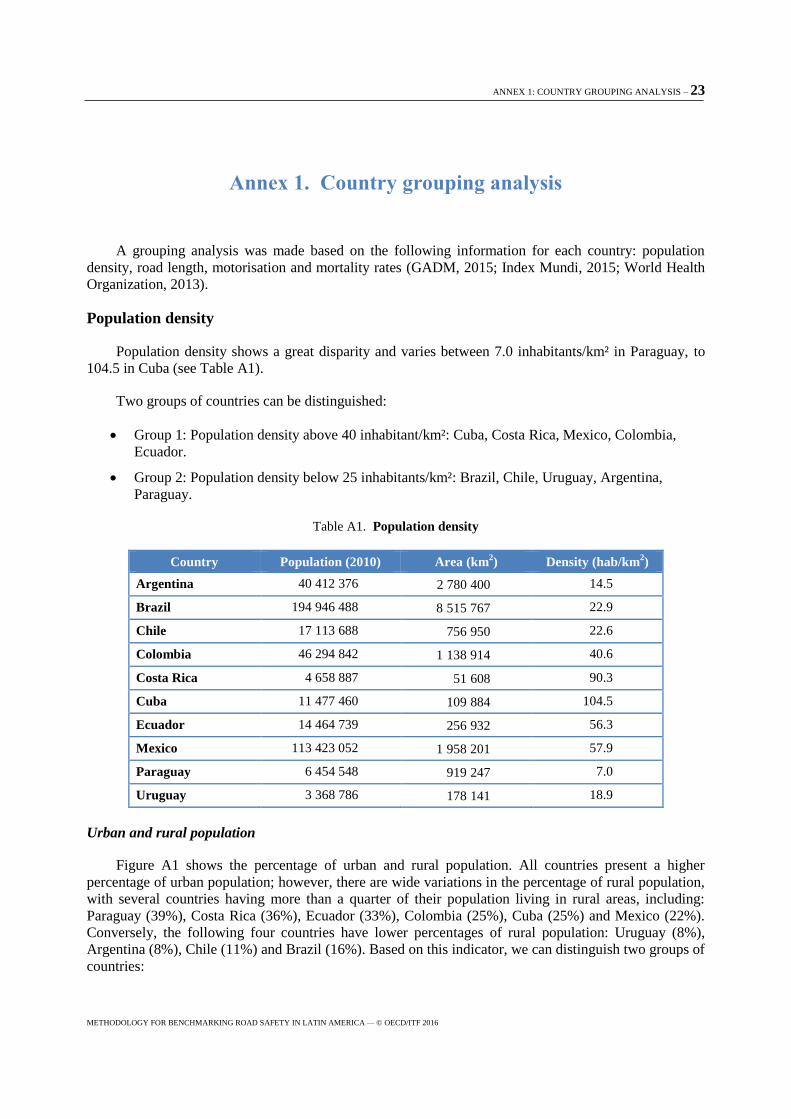
Population density
Population density shows a great disparity and varies between 7.0 inhabitants/km² in Paraguay, to
104.5 in Cuba (see Table A1).
Two groups of countries can be distinguished:
Group 1: Population density above 40 inhabitant/km²: Cuba, Costa Rica, Mexico, Colombia,
Ecuador.
Group 2: Population density below 25 inhabitants/km²: Brazil, Chile, Uruguay, Argentina,
Paraguay.
Table A1. Population density
Country Population (2010) Area (km2) Density (hab/km
2)
Argentina 40 412 376 2 780 400 14.5
Brazil 194 946 488 8 515 767 22.9
Chile 17 113 688 756 950 22.6
Colombia 46 294 842 1 138 914 40.6
Costa Rica 4 658 887 51 608 90.3
Cuba 11 477 460 109 884 104.5
Ecuador 14 464 739 256 932 56.3
Mexico 113 423 052 1 958 201 57.9
Paraguay 6 454 548 919 247 7.0
Uruguay 3 368 786 178 141 18.9
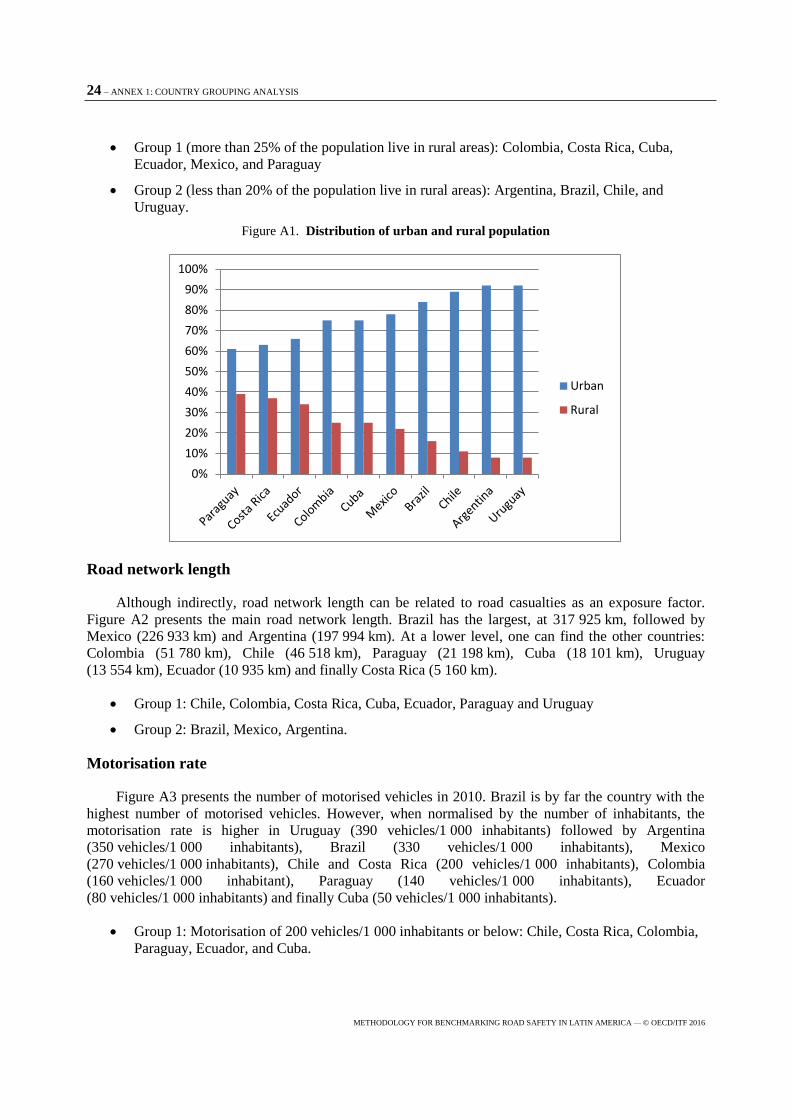
Urban and rural population
Figure A1 shows the percentage of urban and rural population. All countries present a higher
percentage of urban population; however, there are wide variations in the percentage of rural population,
with several countries having more than a quarter of their population living in rural areas, including:
Paraguay (39%), Costa Rica (36%), Ecuador (33%), Colombia (25%), Cuba (25%) and Mexico (22%).
Conversely, the following four countries have lower percentages of rural population: Uruguay (8%),
Argentina (8%), Chile (11%) and Brazil (16%). Based on this indicator, we can distinguish two groups of
countries:
24 – ANNEX 1: COUNTRY GROUPING ANALYSIS
METHODOLOGY FOR BENCHMARKING ROAD SAFETY IN LATIN AMERICA — © OECD/ITF 2016
Group 1 (more than 25% of the population live in rural areas): Colombia, Costa Rica, Cuba,
Ecuador, Mexico, and Paraguay
Group 2 (less than 20% of the population live in rural areas): Argentina, Brazil, Chile, and
Uruguay.
Figure A1. Distribution of urban and rural population
Road network length
Although indirectly, road network length can be related to road casualties as an exposure factor.
Figure A2 presents the main road network length. Brazil has the largest, at 317 925 km, followed by
Mexico (226 933 km) and Argentina (197 994 km). At a lower level, one can find the other countries:
Colombia (51 780 km), Chile (46 518 km), Paraguay (21 198 km), Cuba (18 101 km), Uruguay
(13 554 km), Ecuador (10 935 km) and finally Costa Rica (5 160 km).
Group 1: Chile, Colombia, Costa Rica, Cuba, Ecuador, Paraguay and Uruguay
Group 2: Brazil, Mexico, Argentina.
Motorisation rate
Figure A3 presents the number of motorised vehicles in 2010. Brazil is by far the country with the
highest number of motorised vehicles. However, when normalised by the number of inhabitants, the
motorisation rate is higher in Uruguay (390 vehicles/1 000 inhabitants) followed by Argentina
(350 vehicles/1 000 inhabitants), Brazil (330 vehicles/1 000 inhabitants), Mexico
(270 vehicles/1 000 inhabitants), Chile and Costa Rica (200 vehicles/1 000 inhabitants), Colombia
(160 vehicles/1 000 inhabitant), Paraguay (140 vehicles/1 000 inhabitants), Ecuador
(80 vehicles/1 000 inhabitants) and finally Cuba (50 vehicles/1 000 inhabitants).
Group 1: Motorisation of 200 vehicles/1 000 inhabitants or below: Chile, Costa Rica, Colombia,
Paraguay, Ecuador, and Cuba.
0%
10%
20%
30%
40%
50%
60%
70%
80%
90%
100%
Urban
Rural

ANNEX 1: COUNTRY GROUPING ANALYSIS – 25
METHODOLOGY FOR BENCHMARKING ROAD SAFETY IN LATIN AMERICA — © OECD/ITF 2016
Group 2: Motorisation rate above 250 vehicles/1 000 inhabitants: Argentina, Brazil, Mexico, and
Uruguay. Figure A2. Main road network length (2010)
Source: Index Mundi, 2015.
Figure A3. Number of registered motorised vehicles and motorisation rate (2010)
Source: World Health Organization, 2013.
0
50 000
100 000
150 000
200 000
250 000
300 000
350 000
Ro
ad le
ngt
h (
km)
26 – ANNEX 1: COUNTRY GROUPING ANALYSIS
METHODOLOGY FOR BENCHMARKING ROAD SAFETY IN LATIN AMERICA — © OECD/ITF 2016
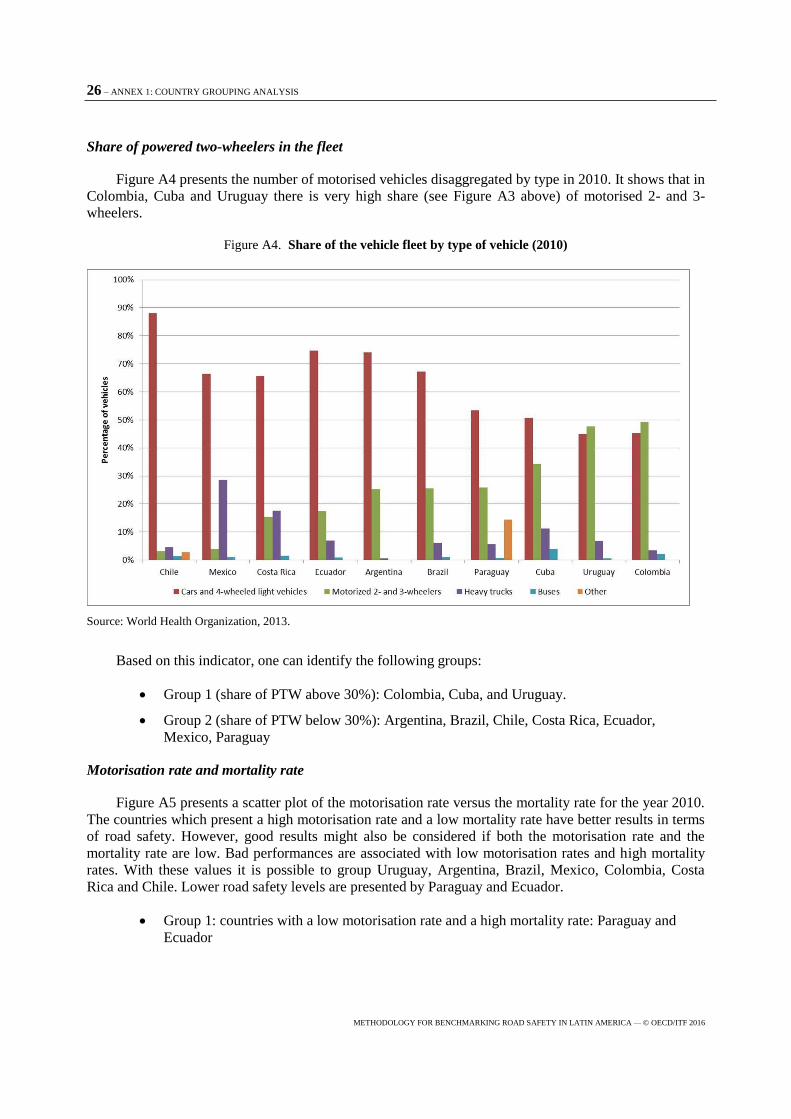
Share of powered two-wheelers in the fleet
Figure A4 presents the number of motorised vehicles disaggregated by type in 2010. It shows that in
Colombia, Cuba and Uruguay there is very high share (see Figure A3 above) of motorised 2- and 3-
wheelers.
Figure A4. Share of the vehicle fleet by type of vehicle (2010)
Source: World Health Organization, 2013.
Based on this indicator, one can identify the following groups:
Group 1 (share of PTW above 30%): Colombia, Cuba, and Uruguay.
Group 2 (share of PTW below 30%): Argentina, Brazil, Chile, Costa Rica, Ecuador,
Mexico, Paraguay
Motorisation rate and mortality rate
Figure A5 presents a scatter plot of the motorisation rate versus the mortality rate for the year 2010.
The countries which present a high motorisation rate and a low mortality rate have better results in terms
of road safety. However, good results might also be considered if both the motorisation rate and the
mortality rate are low. Bad performances are associated with low motorisation rates and high mortality
rates. With these values it is possible to group Uruguay, Argentina, Brazil, Mexico, Colombia, Costa
Rica and Chile. Lower road safety levels are presented by Paraguay and Ecuador.
Group 1: countries with a low motorisation rate and a high mortality rate: Paraguay and
Ecuador

ANNEX 1: COUNTRY GROUPING ANALYSIS – 27
METHODOLOGY FOR BENCHMARKING ROAD SAFETY IN LATIN AMERICA — © OECD/ITF 2016
Group 2: countries with a high motorisation rate and a low mortality rate, or with a low
motorisation rate and a low mortality rate: Uruguay, Argentina, Brazil, Mexico, Chile,
Colombia, Costa Rica and Cuba.
Figure A5. Motorisation rate versus mortality rate (2010)
Source: World Health Organization, 2013.
Mortality rates
Other indicators may be considered in the grouping analysis, including mortality rates: road traffic
deaths rates per population, per motor vehicles and per road length (see Table A2 and Figure A6).
Regarding road traffic deaths per inhabitants, the highest rate is found in Ecuador (with
23.9 deaths/100 000 inhabitants), followed by Uruguay with a similar value of
23.5 deaths/100 000 inhabitants. Lower values are found in Colombia (11.9 deaths/100 000 inhabitants)
and Cuba (7.0 deaths/100 000 inhabitants).
This indicator, however, is not sufficient to assess the safety level of a country as it takes into
account neither the motorisation rate nor the traffic volume. Nevertheless, it is a useful indicator to
consider road safety from a health perspective.
Regarding the number of road traffic deaths per 10 000 motorised vehicles, the higher value was
found in Ecuador, with 31 deaths/10 000 vehicles. Cuba and Paraguay follow, with 13.3 and
13.1 deaths/10 000 vehicles, respectively. The lower values were found in Uruguay and Argentina, with
4.3 and 3.6 deaths/10 000 vehicles respectively.

28 – ANNEX 1: COUNTRY GROUPING ANALYSIS
METHODOLOGY FOR BENCHMARKING ROAD SAFETY IN LATIN AMERICA — © OECD/ITF 2016
As for the number of road traffic deaths per 100 kilometres of road length, the highest value was
presented by Ecuador, with 29.5 deaths/100 kilometres. Costa Rica, Brazil and Colombia follow, with
13.6, 11.5 and 10.6 deaths/100 kilometres respectively. The lower values are presented by Uruguay
(4.1 deaths/100 kilometres) and Argentina (2.6 deaths/100 kilometres).
Table A2. Road traffic deaths rates per population, per motor vehicles and per road length (2010)
Country Road
traffic
deaths
Population Motor
vehicles
Road length
/km
Road traffic
deaths/100 000
inhabitants
Road traffic
deaths/ 10 000
mot. vehicles
Road traffic
deaths/ 100 km
road length
Argentina 5 094 40 412 376 14 163 125 197 994 12.6 3.6 2.6
Brazil 36 499 194 946 488 64 817 974 317 925 18.7 5.6 11.5
Chile 2 071 17 113 688 3 375 523 46 518 12.1 6.1 4.5
Colombia 5 502 46 294 842 7 229 373 51 780 11.9 7.6 10.6
Costa Rica 700 4 658 887 923 591 5 160 15.0 7.6 13.6
Cuba 809 10 477 460 607 675 18 101 7.7 13.3 4.5
Ecuador 3 222 1 039 364 1 039 364 10 935 23.9 31 29.5
Mexico 17 301 30 904 659 30 904 659 226 933 15.3 5.6 7.6
Paraguay 1 206 919 247 919 247 21 198 18.7 13.1 5.7
Uruguay 556 128 7012 13 554 13 554 23.5 4.6 4.1
Figure A6. Road traffic deaths rates per population, per motor vehicles and per road length (2010)
ANNEX 1: COUNTRY GROUPING ANALYSIS – 29
METHODOLOGY FOR BENCHMARKING ROAD SAFETY IN LATIN AMERICA — © OECD/ITF 2016
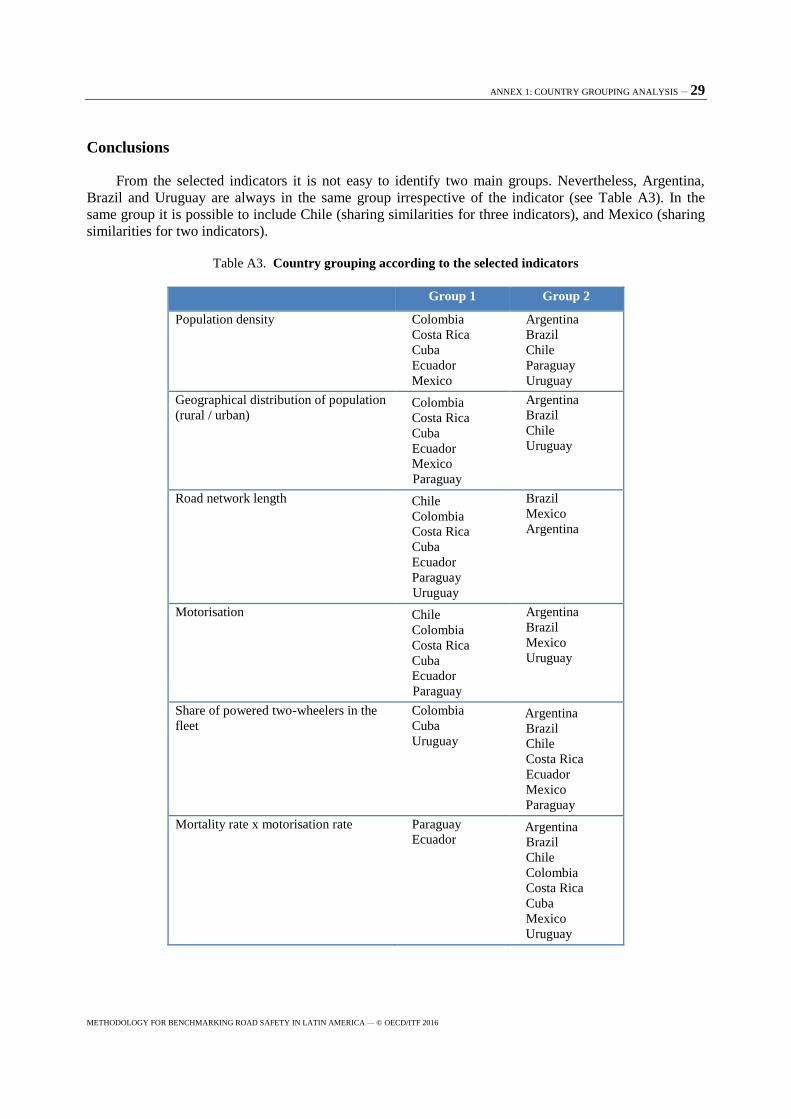
Conclusions
From the selected indicators it is not easy to identify two main groups. Nevertheless, Argentina,
Brazil and Uruguay are always in the same group irrespective of the indicator (see Table A3). In the
same group it is possible to include Chile (sharing similarities for three indicators), and Mexico (sharing
similarities for two indicators).
Table A3. Country grouping according to the selected indicators
Group 1 Group 2
Population density Colombia
Costa Rica
Cuba
Ecuador
Mexico
Argentina
Brazil
Chile
Paraguay
Uruguay
Geographical distribution of population
(rural / urban) Colombia
Costa Rica
Cuba
Ecuador
Mexico
Paraguay
Argentina
Brazil
Chile
Uruguay
Road network length Chile
Colombia
Costa Rica
Cuba
Ecuador
Paraguay
Uruguay
Brazil
Mexico
Argentina
Motorisation Chile
Colombia
Costa Rica
Cuba
Ecuador
Paraguay
Argentina
Brazil
Mexico
Uruguay
Share of powered two-wheelers in the
fleet
Colombia
Cuba
Uruguay
Argentina
Brazil
Chile
Costa Rica
Ecuador
Mexico
Paraguay
Mortality rate x motorisation rate Paraguay
Ecuador Argentina
Brazil
Chile
Colombia
Costa Rica
Cuba
Mexico
Uruguay
30 – ANNEX 1: COUNTRY GROUPING ANALYSIS
METHODOLOGY FOR BENCHMARKING ROAD SAFETY IN LATIN AMERICA — © OECD/ITF 2016
Accordingly, the following country grouping is proposed (see also Figure 3):
Group 1: Colombia, Costa Rica, Cuba, Ecuador, and Paraguay
Group 2: Argentina, Brazil, Chile, Mexico, Uruguay
The final grouping may evolve based on data availability and will be decided once a preliminary
analysis has been made.
ANNEX 2: CONCLUSIONS AND RECOMMENDATIONS OF THE SUNFLOWER+6 PROJECTS – 31
METHODOLOGY FOR BENCHMARKING ROAD SAFETY IN LATIN AMERICA — © OECD/ITF 2016
Annex 2. Conclusions and recommendations of the SUNflower+6
Projects
SUNflower Project
Specific recommendations and conclusions with respect to differences between the SUN countries:
British risks were highest for pedestrians and for motorcyclists ‒ but lowest for car
occupants ‒ compared to the other countries. Factors, which may explain these risk
differences, include the higher traffic density on British roads, the greater use of
roundabouts at junctions, and the lower average speed on main inter-urban roads.
Car occupant risk was highest in Sweden. Factors that may explain this were the higher
Swedish average speed on main roads ‒ despite lower speed limits ‒ and the lower traffic
density and lower speed limit enforcement level.
Dutch mopedists had almost twice as high the risk of those in the other countries and they
drove more kilometres. Dutch cyclist risk was lowest, but still higher than car risk ‒ even
when the risk that cars inflict on other road users is included. And Dutch citizens cycle by
far the most. Factors that may explain the low cyclist risk include the presence of large
numbers of cyclists and the extensive implementation of cycle facilities.
Sweden had 14% driver fatalities over 0.1% BAC in 2000, versus an estimated 17% in the
Netherlands and a reported 20% in Britain. This may be explained by the differences in legal
blood alcohol limits, enforcement policies, and penalties for offending in the three countries.
The risk on Dutch roads other than motorways was about a third higher than the risk on
these types of roads in the other countries. Factors, which might explain this include higher
exposure and risk to mopedists, higher cyclist exposure, lower belt use, and higher junction
density.
Main recommendations for future road safety improvements in the SUN countries:
As car drivers had a higher risk in Sweden than in the other two countries; traffic safety
efforts in Sweden should concentrate on car drivers and their speed behaviour.
Britain would benefit from a lower blood alcohol limit for drinking and driving, more
intensively enforced, but with some relaxation of penalties for the new, lower limit offences.
Britain requires an infrastructure solution that enables pedestrian and motorised traffic to
co-exist at lower fatality levels, for example by extending the length of urban roads with
20 mph (30 km/h) speed limits.
Britain should also give greater emphasis to developing a more extensive, high quality road
network of similar density to that in the other countries; this could encourage greater
acceptance of lower speeds on other roads.
The Netherlands needs to understand why its moped rider risk is so high in order to identify
an appropriate solution.
32 – ANNEX 2:CONCLUSIONS AND RECOMMENDATIONS OF THE SUNFLOWER+6 PROJECTS
METHODOLOGY FOR BENCHMARKING ROAD SAFETY IN LATIN AMERICA — © OECD/ITF 2016
The Netherlands also requires to review its drink-driving problem, to identify how best to
make further reductions in alcohol-related fatalities.
The Netherlands needs to identify an effective strategy to increase seat belt wearing rates to
a similar level as the other two countries.
SUNflower+6 Project
The main conclusions and recommendations for the SUN countries were:
Sweden
Make the transport environment more forgiving, to reduce injuries when accidents occur. This
could reduce the high proportion of elderly pedestrian and cyclist fatalities, and also reduce
injuries among elderly car occupants.
Consider further efforts to improve public acceptance of enforcement initiatives, possibly
through more community partnerships. There would seem to be an opportunity to increase the
use of automatic detection, mainly of speeding offenders. But increased enforcement also needs a
change in the legislative system concerning both fines and vehicle owner responsibility to be as
effective as possible.
Seek, in the longer term, to move to a lower speed limit for two-lane rural roads, and develop a
network of higher quality rural roads which can safely sustain higher speed limits.
United Kingdom
Focus more effort on seeking innovative road designs which cater to mixed vehicular and
vulnerable road user activities at the higher traffic flow levels evident in Britain.
Improve facilities for cycling, especially in the context of the government’s desire to increase
cycling.
Give more attention to helping drivers recognise the presence and behaviour of motorcyclists
within the traffic flow, and give particular attention to countermeasures to reduce bend and
overtaking accidents involving motorcyclists.
Ensure that the latest policy statements on enforcement promising greater visible presence are
accompanied by sufficient resources to achieve this. Ensure that senior police managers
demonstrate a genuine commitment to road safety by maintaining an appropriate level of traffic
policing.
Improve its package of drink-drive measures and particularly increase the real level of detection,
as opposed to the perceived level. The increasing number of speeding offences also suggests that
the balance between enforcement and public awareness might be improved.
Seek, in the longer term, to move to a lower speed limit for two-lane rural roads, and develop a
network of higher quality rural roads which can safely sustain higher speed limits; through this
approach there should be clearer separation in Britain between the road standards (and speed
limit bands) in the rural network.
ANNEX 2:CONCLUSIONS AND RECOMMENDATIONS OF THE SUNFLOWER+6 PROJECTS – 33
METHODOLOGY FOR BENCHMARKING ROAD SAFETY IN LATIN AMERICA — © OECD/ITF 2016
The Netherlands
Continue to increase the share of 30 km/h roads in urban areas, and make pedestrian crossing
design more consistent with road categories.
Seek measures to reduce the high proportion of pedestrian fatalities involving mopeds.
Continue to provide for physical separation of cyclists and motorised traffic on main roads, and
traffic calming measures at intersections.
Increase the training required by moped riders aged 16-17 before access to the road, increase
(correct) helmet wearing rates, and introduce a more structured licensing system and vehicle
registration plates to help enforcement of the behaviour of this group, especially as regards
speeding.
Seek ways of increasing the experience gained by young drivers before they take the driving test,
including considering accompanied driving before the driving test.
Seek ways to make the road environment assist in complying with relevant speed limits and, in
particular, investigate the situation on 80 km/h roads which have a high fatality risk.
Consider if the very high level of speeding offences suggests that a different approach to
modifying speeding behaviour might be needed. Greater focus on enforcement of repeat, or
extreme, offenders should be considered.
The main conclusions and recommendations for the Southern European countries were:
Greece
Improving driver compliance with the existing seat belt law.
Seek ways to improve pedestrian safety with new measures, such as artificial lighting or
improvement of pedestrian visibility.
Increase the level of helmet usage (both motorcycles and mopeds) by better police enforcement
and increased sanctions.
Portugal
Improve the use of seat belt wearing in rear seat occupants.
Seek ways to facilitate safe pedestrian movements on both urban and rural roads passing through
towns, with elderly people at night as the design criteria.
Consider re-training courses and/or enforcement of helmet usage to reduce the proportion of
elderly mopedist fatalities.
Portuguese PTW users need improved training or the introduction of a points-based driving
licence that can curb reckless driving.
Spain
Improve the alcohol controls carried out at accidents.
34 – ANNEX 2:CONCLUSIONS AND RECOMMENDATIONS OF THE SUNFLOWER+6 PROJECTS
METHODOLOGY FOR BENCHMARKING ROAD SAFETY IN LATIN AMERICA — © OECD/ITF 2016
Stricter legal measures to be considered that include the setting of a standard BAC level of
0.2 g/l for motorcyclists; or the establishment of a common, minimum punishment of
unconditional suspension of the driving licence for six months for anyone passing the limit.
Seek measures to improve rear seat belt use.
Consider the introduction of automatic detection of speeding drivers to reduce their numbers, and
to change driver behaviour, in order to lower the number of fatalities due to speeding.
Catalonia
Increase police controls in order to reduce the drink and drive problem.
Extend speed camera control to the entire road network (of locations with speed-related
accidents) to ensure a change in driver behaviour.
Improve the use of child restraint systems and rear seat belts.
The main conclusions and recommendations for the Central European countries were:
Czech Republic
Seek measures to reduce the high proportion of (elderly) pedestrians and cyclist fatalities, and
increased involvement of HGV in road accidents.
Consider more effort to improve public attitudes to enforcement possibly through more frequent
community partnerships.
Consider the application of the special regulations controlling vehicle use by novice drivers.
Consider the recent system of police enforcement: make car owners responsible for the offences
related to their vehicle, reconsider the amount of fines and make more transparent how they are
used.
Revise the methodology of road accidents reporting by the police in order to provide valuable
information for the road safety research community.
Reconsider speed management scheme, with a stronger emphasis on general deterrence and
prevention; and possibly reconsider speed limits on road sections in rural areas. Give more
support to zone 30 applications.
Hungary
Consider the responsibility distribution, as it is not clearly defined which of the ministries has the
main responsibility for road safety.
Increase the resources for road safety improvement, as the existing budget for this purpose is
inadequate.
Focus on education and training courses for drivers in regard to road safety: fundamentally, the
selection of the safe speed and, in general, the strict requirement for obeying rules must assume a
greater role.
Develop effective speed management.
ANNEX 2:CONCLUSIONS AND RECOMMENDATIONS OF THE SUNFLOWER+6 PROJECTS – 35
METHODOLOGY FOR BENCHMARKING ROAD SAFETY IN LATIN AMERICA — © OECD/ITF 2016
Slovenia
Consider the establishment of a central Road (Transport) Safety Agency with proper funding
(budget) to co-ordinate and manage road (transport) safety activities.
Apply legislation changes regarding driving under the influence of alcohol (introduction of zero
BAC limit) in order to influence the patterns of social behaviour related to excessive drinking in
general.
Seek measures to reduce the high proportion of young drivers involved in injury accidents,
especially those involved in weekend night accidents.
Consider effective enforcement of zero BAC and pay even more attention to education and
preventive work in the respective field.
Encourage the implementation of effective speed management.
Encourage further accelerated implementation of traffic calming schemes in built up areas.
Improve the management of the road safety performance indicators data collection system,
including regular research surveys on protective systems use, speeding and alcohol level
distribution among drivers.
International Transport Forum2 rue André Pascal F-75775 Paris Cedex [email protected]