Embed Size (px)
Citation preview

The International Seabed The International Seabed AuthorityAuthorityAuthorityAuthority
Data and information to administer the mineral resources of the Area: The International Seabed Authority’s Geological Model of Polymetallic Nodule Deposits in the Clarion Clipperton Zone and its CDR
SENSITIZATION SEMINAR ISA KINGSTON28 30 M 2011
CDR
28-30 MARCH 2011

Main Mineral ResourcesMain Mineral ResourcesC l D R iC l D R iCentral Data RepositoryCentral Data Repository
Cobalt rich CrustsCobalt rich Crusts
PolymetallicPolymetallicPolymetallicPolymetallicSulphidesSulphides
PolymetallicPolymetallicPolymetallic Polymetallic NodulesNodules
22

Objectives Of The CDRObjectives Of The CDRObjectives Of The CDRObjectives Of The CDRPrior Situation : Large quantity of data collected and Prior Situation : Large quantity of data collected and k t i t b t di d id l ik t i t b t di d id l iknown to exist, but dispersed widely among various known to exist, but dispersed widely among various organizations and companies worldwide :organizations and companies worldwide :–– in different formats, standards and supportsin different formats, standards and supportspppp–– not readily accessible to potential users.not readily accessible to potential users.
The CDR aims to collect and centralize all public and The CDR aims to collect and centralize all public and private data and information on marine mineralprivate data and information on marine mineralprivate data and information on marine mineral private data and information on marine mineral resources.resources.–– Should be accessible to all member states.Should be accessible to all member states.–– Should display the acquired data and information.Should display the acquired data and information.–– Display data in various forms : listing, graphs, Display data in various forms : listing, graphs,
maps…maps…maps…maps…–– develop an integrated database systemdevelop an integrated database system for use as for use as
a management and research toola management and research tool 33

Central Data RepositoryCentral Data RepositoryCentral Data RepositoryCentral Data Repository(a)(a) NOAANOAA –– National Data Center NGDCNational Data Center NGDC –– (United States of America)(United States of America)(a)(a) NOAA NOAA National Data Center, NGDC National Data Center, NGDC (United States of America).(United States of America).(b)(b) U.S. Geological Survey (USGS) U.S. Geological Survey (USGS) –– (United States of America).(United States of America).(c)(c) Ministry of Natural Resources Ministry of Natural Resources –– (Russian Federation).(Russian Federation).(d)(d) COMRA COMRA –– (China).(China).(e)(e) Institute of Marine and Coastal Sciences, Rutgers University Institute of Marine and Coastal Sciences, Rutgers University –– (USA).(USA).(f)(f) Geological Survey of Finland Geological Survey of Finland –– (Finland).(Finland).(g)(g) Federal Institute of Geosciences and Natural Resources Federal Institute of Geosciences and Natural Resources –– (Germany).(Germany).(h)(h) B f R S iB f R S i (A t li )(A t li )(h)(h) Bureau of Resource Sciences Bureau of Resource Sciences –– (Australia).(Australia).((ii)) University of Toronto University of Toronto –– (Canada).(Canada).(j)(j) Geological Survey of Norway Geological Survey of Norway –– (Norway).(Norway).(k)(k) National Institute of OceanographyNational Institute of Oceanography –– (India).(India).(k)(k) National Institute of Oceanography National Institute of Oceanography (India).(India).(l)(l) InterOceanMetalInterOceanMetal Joint Organization (IOM) Joint Organization (IOM) –– (Poland).(Poland).(m)(m) IFREMER IFREMER –– (France).(France).(n)(n) SOPAC SOPAC –– (Fiji).(Fiji).(o)(o) KORDI KORDI –– (Republic of Korea).(Republic of Korea).(p)(p) SCRIPPS Institution of Oceanography SCRIPPS Institution of Oceanography –– (United States of America).(United States of America).(q)(q) DOALOS/United Nations.DOALOS/United Nations. 44
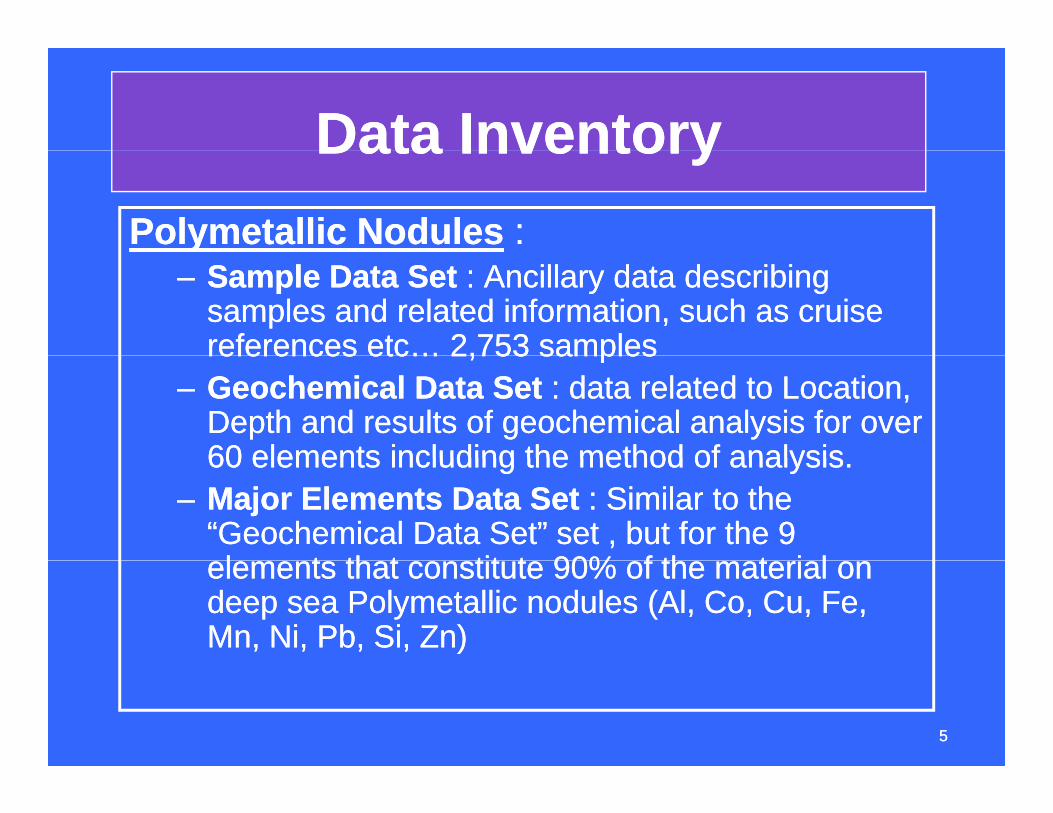
Data InventoryData InventoryData InventoryData InventoryPolymetallicPolymetallic NodulesNodules ::
–– Sample Data SetSample Data Set : Ancillary data describing : Ancillary data describing samples and related information, such as cruise samples and related information, such as cruise references etc… 2,753 samplesreferences etc… 2,753 samplesreferences etc… 2,753 samplesreferences etc… 2,753 samples
–– Geochemical Data SetGeochemical Data Set : data related to Location, : data related to Location, Depth and results of geochemical analysis for over Depth and results of geochemical analysis for over 60 elements including the method of analysis60 elements including the method of analysis60 elements including the method of analysis.60 elements including the method of analysis.
–– Major Elements Data SetMajor Elements Data Set : Similar to the : Similar to the “Geochemical Data Set” set , but for the 9 “Geochemical Data Set” set , but for the 9 l t th t tit t 90% f th t i ll t th t tit t 90% f th t i lelements that constitute 90% of the material on elements that constitute 90% of the material on
deep sea deep sea PolymetallicPolymetallic nodules (Al, Co, Cu, Fe, nodules (Al, Co, Cu, Fe, MnMn, Ni, , Ni, PbPb, Si, Zn), Si, Zn)
55

PolymetallicPolymetallic nodule locations in the nodule locations in the CDRCDRCDRCDR
66

Data InventoryData Inventory --Cobalt rich Cobalt rich f tf tferromanganese crusts.ferromanganese crusts.
–– Sample Data SetSample Data Set : Ancillary data describing : Ancillary data describing samples and related information, etc… 3,533 samples and related information, etc… 3,533 samplessamples
–– Geochemical Data SetGeochemical Data Set : data related to Location, : data related to Location, Geoc e ca ata SetGeoc e ca ata Set da a e a ed o oca o ,da a e a ed o oca o ,Depth , thickness of crusts and results of Depth , thickness of crusts and results of geochemical analysis for over 60 elements geochemical analysis for over 60 elements including their analysis methods.including their analysis methods. –– 3533 records3533 recordsincluding their analysis methods. including their analysis methods. 3533 records3533 records
–– Major Elements Data SetMajor Elements Data Set : Similar to the “Major : Similar to the “Major Elements Set” of the Nodule Data Elements Set” of the Nodule Data –– 3,533 records3,533 records
77

Cobalt rich ferromanganese crust Cobalt rich ferromanganese crust l ti i th CDRl ti i th CDRlocations in the CDRlocations in the CDR
88

Data InventoryData InventoryData InventoryData InventorySeafloor Hydrothermal Vent Systems and Seafloor Hydrothermal Vent Systems and Seafloor Seafloor PolymetallicPolymetallic SulphidesSulphidesIn 2001In 2001--2002, the Secretariat acquired a validated set of data on the worldwide distribution 2002, the Secretariat acquired a validated set of data on the worldwide distribution of seafloor of seafloor polymetallicpolymetallic sulphidessulphides from the Geological Survey of Canada (GSC). During the from the Geological Survey of Canada (GSC). During the first quarter of 2003, the Secretariat integrated that data set into the CDR. The related data first quarter of 2003, the Secretariat integrated that data set into the CDR. The related data q , gq , gis grouped into four functional sets:is grouped into four functional sets:
Deposit Information :Deposit Information : Location data, geological Location data, geological information and description of 327 sites of seafloor information and description of 327 sites of seafloor hydrothermal activity and mineral deposits. hydrothermal activity and mineral deposits. –– Geochemical Data :Geochemical Data : Geochemical analyses for 2,640 Geochemical analyses for 2,640
samples of seafloor samples of seafloor polymetallicpolymetallic sulphidessulphides and hydrothermal and hydrothermal i it t f 69 diff t it ld id C t i fi it t f 69 diff t it ld id C t i fprecipitates from 69 different sites worldwide: Contains for precipitates from 69 different sites worldwide: Contains for
each sample , geochemical analyses for up to 70 elements, each sample , geochemical analyses for up to 70 elements, together with their analyses method, sample type, together with their analyses method, sample type, mineralogical information, deposit location and referencesmineralogical information, deposit location and referencesg , pg , p
99

: Locations of : Locations of polymetallicpolymetallic sulphidessulphidesoccurrences in the CDRoccurrences in the CDR
1010
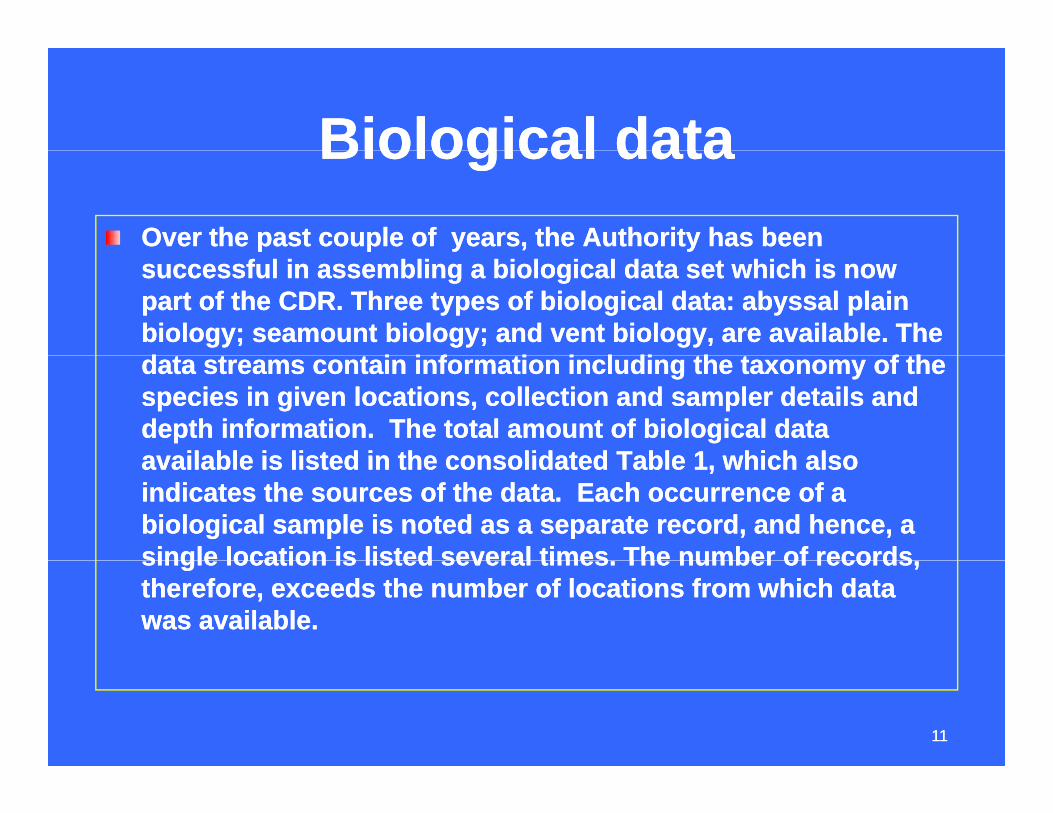
Biological dataBiological dataBiological dataBiological dataOver the past couple of years, the Authority has been Over the past couple of years, the Authority has been successful in assembling a biological data set which is now successful in assembling a biological data set which is now part of the CDR. Three types of biological data: abyssal plain part of the CDR. Three types of biological data: abyssal plain biology; seamount biology; and vent biology, are available. The biology; seamount biology; and vent biology, are available. The d t t t i i f ti i l di th t f thd t t t i i f ti i l di th t f thdata streams contain information including the taxonomy of the data streams contain information including the taxonomy of the species in given locations, collection and sampler details and species in given locations, collection and sampler details and depth information. The total amount of biological data depth information. The total amount of biological data available is listed in the consolidated Table 1 which alsoavailable is listed in the consolidated Table 1 which alsoavailable is listed in the consolidated Table 1, which also available is listed in the consolidated Table 1, which also indicates the sources of the data. Each occurrence of a indicates the sources of the data. Each occurrence of a biological sample is noted as a separate record, and hence, a biological sample is noted as a separate record, and hence, a single location is listed several times The number of recordssingle location is listed several times The number of recordssingle location is listed several times. The number of records, single location is listed several times. The number of records, therefore, exceeds the number of locations from which data therefore, exceeds the number of locations from which data was available. was available.
1111

Biological data locations represented in the CDR
1212

Summary of Data InventorySummary of Data InventoryData Type Polymetallic Nodules Cobalt-rich
Ferromanganese CrustsPolymetallic Sulphides/ Hydrothermal Vent Systems
Geochemical elements 2,753 records 3,533 records 6,000 records
Sample data 2,753 records 3,533 recordsReduced data Set 1,225 recordsMajor elements 2,753 records 3,533 recordsActual data within the ‘Area’
1,944 records 627 records 232 sitesArea
Deposits690 sites
Analysis methods137 protocols
Main source of data US-NGDC US-USGS Canada – GSC, M/s Ambrose Associates
Marine minerals bibliography
~2,500 records 2,500 references
Biological dataAbyssal Plain BiologyAbyssal Plain Biology
666 (662)* recordsFrom CCZ area only
Vent biology 395 (196)* Seamount biology 7,318 (2,915)* records
Main source of data Kaplan Project, Publications, Contractors
Seamounts Online ChEss (Chemosynthetic Ecosystem Science)
* Numbers within brackets show records falling within the Area.1313

Dynamic OnDynamic On--line database queriesline database queries
More FlexibilityMore Flexibility
Selection of subsets based on various parametersSelection of subsets based on various parameters–– Location (lat/Long. Or geographic zones)Location (lat/Long. Or geographic zones)Location (lat/Long. Or geographic zones)Location (lat/Long. Or geographic zones)–– Elements abundanceElements abundance–– Cruise ID and DateCruise ID and Date
Selection based on any user defined criteriaSelection based on any user defined criteria–– With the available forms the end user mayWith the available forms the end user mayWith the available forms, the end user may With the available forms, the end user may
develop his own queries based on any field or develop his own queries based on any field or combination of fieldscombination of fields
1414
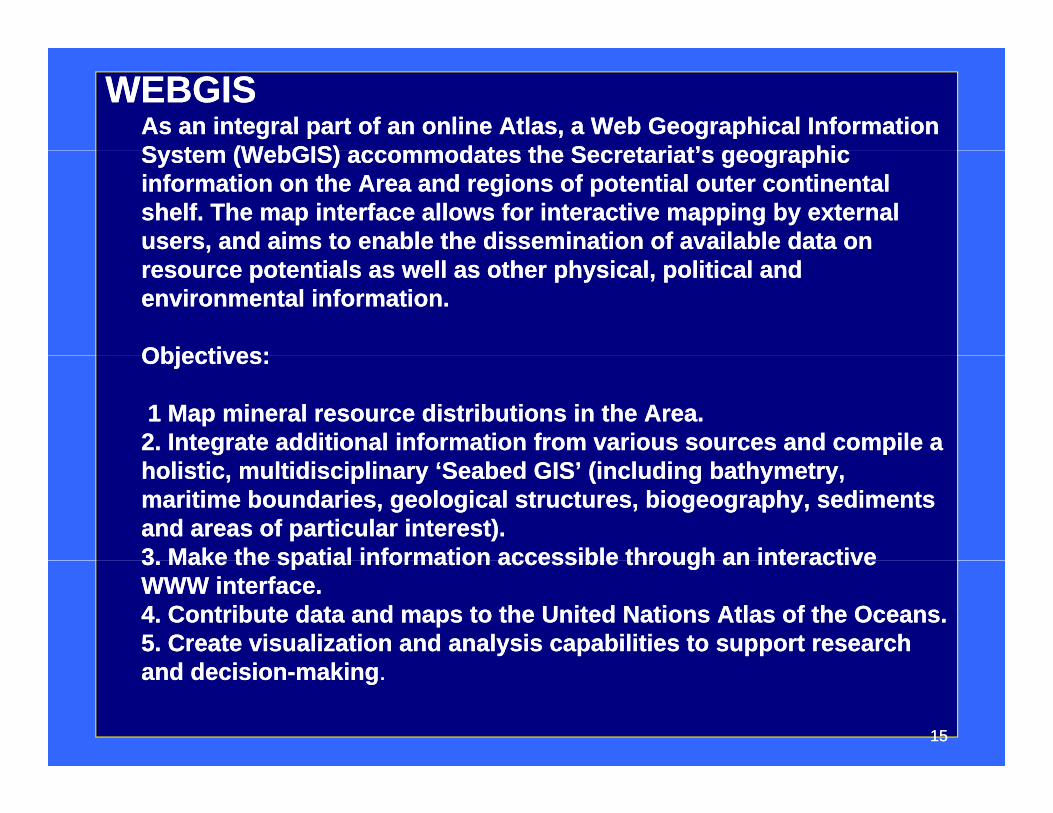
WEBGISWEBGISAsAs an integral part of an online Atlas, a Web Geographical Information an integral part of an online Atlas, a Web Geographical Information System (System (WebGISWebGIS) accommodates the Secretariat’s geographic) accommodates the Secretariat’s geographicSystem (System (WebGISWebGIS) accommodates the Secretariat’s geographic ) accommodates the Secretariat’s geographic information on the Area and regions of potential outer continental information on the Area and regions of potential outer continental shelf. The map interface allows for interactive mapping by external shelf. The map interface allows for interactive mapping by external users, and aims to enable the dissemination of available data on users, and aims to enable the dissemination of available data on resource potentials as well as other physical, political and resource potentials as well as other physical, political and environmental information.environmental information.
Objectives:Objectives:Objectives:Objectives:
1 Map mineral resource distributions in the Area.1 Map mineral resource distributions in the Area.2. Integrate additional information from various sources and compile a 2. Integrate additional information from various sources and compile a holistic, multidisciplinary ‘Seabed GIS’ (including bathymetry, holistic, multidisciplinary ‘Seabed GIS’ (including bathymetry, maritime boundaries, geological structures, biogeography, sediments maritime boundaries, geological structures, biogeography, sediments and areas of particular interest).and areas of particular interest).3 Make the spatial information accessible through an interactive3 Make the spatial information accessible through an interactive3. Make the spatial information accessible through an interactive 3. Make the spatial information accessible through an interactive WWW interface.WWW interface.4. Contribute data and maps to the United Nations Atlas of the Oceans. 4. Contribute data and maps to the United Nations Atlas of the Oceans. 5. Create visualization and analysis capabilities to support research 5. Create visualization and analysis capabilities to support research
d d i id d i i kikiand decisionand decision--makingmaking..
1515
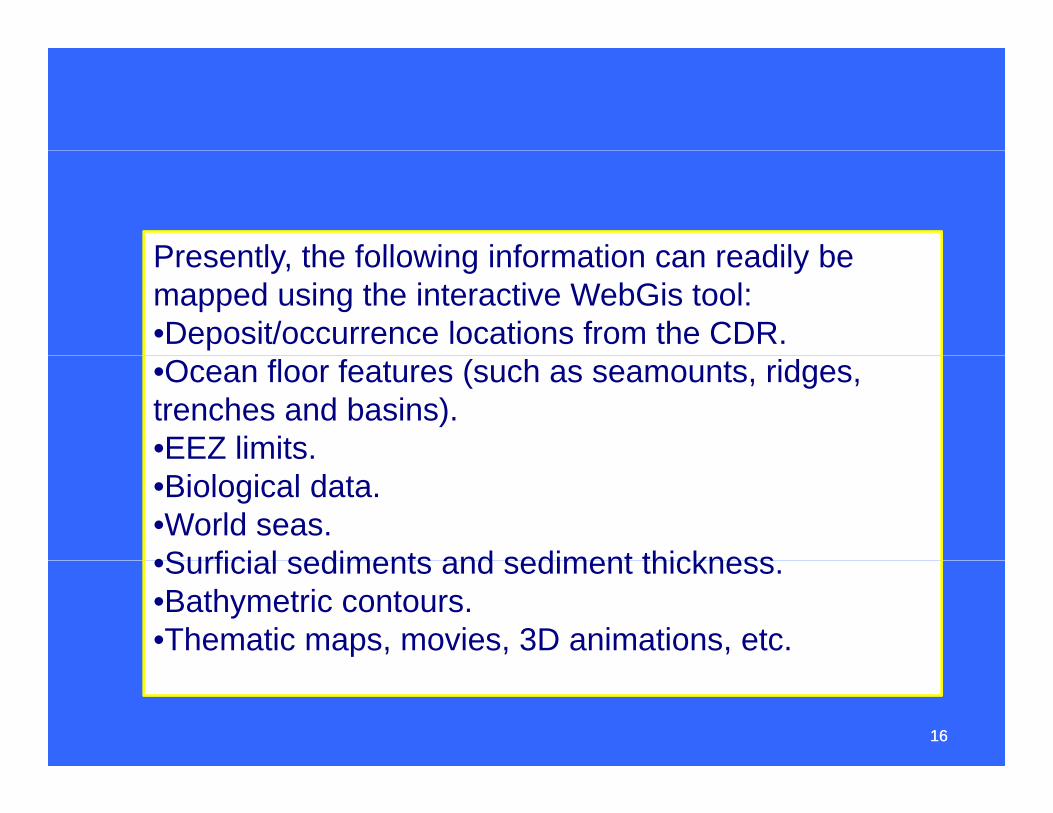
Presently the following information can readily bePresently, the following information can readily be mapped using the interactive WebGis tool: •Deposit/occurrence locations from the CDR.•Ocean floor features (such as seamounts, ridges, trenches and basins).•EEZ limits.EEZ limits.•Biological data.•World seas.•Surficial sediments and sediment thickness•Surficial sediments and sediment thickness.•Bathymetric contours.•Thematic maps, movies, 3D animations, etc.
1616

Patents DatabasePatents DatabaseA survey of international Patents to A survey of international Patents to identify trends in the development of deep identify trends in the development of deep y p py p pseabed mining technology (1960seabed mining technology (1960--1998)1998)–– Related to Related to PolymetallicPolymetallic nodule exploitationnodule exploitation
S R l d i h id ifi i f 3 2S R l d i h id ifi i f 3 2–– Survey Resulted in the identification of 352 Survey Resulted in the identification of 352 patents in 12 patents systemspatents in 12 patents systems
–– Started in 1960, peak in 1983 with 34 patents for Started in 1960, peak in 1983 with 34 patents for , p p, p pthat year. Much reduced pace subsequently.that year. Much reduced pace subsequently.
–– 85% of the patents from USA, JAPAN, USSR85% of the patents from USA, JAPAN, USSR2 searchable CDROMS produced containing2 searchable CDROMS produced containing–– 2 searchable CDROMS produced, containing 2 searchable CDROMS produced, containing patents grouped in 10 volumes and many subpatents grouped in 10 volumes and many sub--volumes according to Design Conceptsvolumes according to Design ConceptsD t b f ll i l t d i th CDR bD t b f ll i l t d i th CDR b–– Database fully implemented in the CDR, can be Database fully implemented in the CDR, can be viewed with ADOBE READERviewed with ADOBE READER
1717

POLYMETALLIC NODULES DATA IN THE RESERVED POLYMETALLIC NODULES DATA IN THE RESERVED AREASAREAS
POLYDAT POLYDAT -- data repository of the reserved data repository of the reserved areas submitted by contractors. areas submitted by contractors.
F kF kFrameworkFramework–– Available DataAvailable Data
CoCo--OrdinatesOrdinates–– Sampling StationSampling Station
T hT hTopography Topography 2335 station data2335 station data
Water depth, abundance,Water depth, abundance,MnMn, Ni, Cu, Co, Ni, Cu, Co1818

AcknowledgementAcknowledgement..
. The Secretariat has so far received data from the . The Secretariat has so far received data from the e Sec eta at as so a ece ed data o t ee Sec eta at as so a ece ed data o t efollowing institutionsfollowing institutions•• NOAANOAA•• USGSUSGS•• InterOceanMetalInterOceanMetal Joint Organization (IOM)Joint Organization (IOM)•• GSC GSC –– Geological Survey of CanadaGeological Survey of Canada•• COMRA, ChinaCOMRA, China
IFREMER FIFREMER F•• IFREMER FranceIFREMER France•• The Republic of KoreaThe Republic of Korea•• DORD JapanDORD Japan•• Inter RidgeInter Ridge•• Inter RidgeInter Ridge•• other public domainsother public domainsWe wish to express our gratitude to these institutions/sites.We wish to express our gratitude to these institutions/sites.
1919

We will strive to excelWe will strive to excelWe will strive to excelWe will strive to excelContinuously update the CDR database with new data sourced from the public domain, Continuously update the CDR database with new data sourced from the public domain, institutions contractors and published literature Try to integrate gravity data seafloor ageinstitutions contractors and published literature Try to integrate gravity data seafloor ageinstitutions, contractors and published literature. Try to integrate gravity data, seafloor age institutions, contractors and published literature. Try to integrate gravity data, seafloor age and other data in to the CDRand other data in to the CDR--WebGISWebGIS by 2011. by 2011. Request the Contractors and other member States to provide any nonRequest the Contractors and other member States to provide any non--proprietary data for proprietary data for addition to the CDR.addition to the CDR.More biological data to be collected from different sources and through collaboration withMore biological data to be collected from different sources and through collaboration withMore biological data to be collected from different sources and through collaboration with More biological data to be collected from different sources and through collaboration with marine scientific institutions and organizations. Also, increase the database with all marine scientific institutions and organizations. Also, increase the database with all environmental, physical meteorological data.environmental, physical meteorological data.Continue to develop a more robust CDR with better graphic interfaces, a searchable Continue to develop a more robust CDR with better graphic interfaces, a searchable database (for example, SQLdatabase (for example, SQL--based query forms) and more userbased query forms) and more user--friendly options. friendly options. Link CDR to Google Earth.Link CDR to Google Earth.Continuously update the bibliographic database Continuously update the bibliographic database Refine the patent searchable database and update the patent database to include all recent Refine the patent searchable database and update the patent database to include all recent patents.patents.Extend the CDR to include map, photograph and video galleries.Extend the CDR to include map, photograph and video galleries.Update the CDR with the data and results of the Geological Model of Update the CDR with the data and results of the Geological Model of PolymetallicPolymetallic Nodule Nodule Deposits in the ClarionDeposits in the Clarion--ClippertonClipperton Fracture Zone project.Fracture Zone project.Strive to establish a museum of marine mineral resources. Strive to establish a museum of marine mineral resources.
2020

40W
P t IIP t II15N
14
Clarion Fracture ZonePart II Part II DEVELOPMENT OF DEVELOPMENT OF
10N
135W
160W
125W
120W
145W
150W
155W
130W
Clipperton Fracture Zone
GEOLOGICAL MODELGEOLOGICAL MODEL AND AND PROSPECTOR’S GUIDE FORPROSPECTOR’S GUIDE FOR
5N
PROSPECTOR S GUIDE FOR PROSPECTOR S GUIDE FOR POLYMETALLIC NODULE POLYMETALLIC NODULE
DEPOSITS IN THE CLARIONDEPOSITS IN THE CLARION0
DEPOSITS IN THE CLARION DEPOSITS IN THE CLARION CLIPPERTON CLIPPERTON ZONEZONE

PROGRAMME OBJECTIVESPROGRAMME OBJECTIVES
11 IMPROVE CLARIONIMPROVE CLARION--CLIPPERTONCLIPPERTON11 IMPROVE CLARIONIMPROVE CLARION--CLIPPERTONCLIPPERTON1.1. IMPROVE CLARIONIMPROVE CLARION CLIPPERTON CLIPPERTON RESOURCE ASSESSMENTRESOURCE ASSESSMENT
2.2. INTEGRATE AVAILABLE RESOURCE AND INTEGRATE AVAILABLE RESOURCE AND
1.1. IMPROVE CLARIONIMPROVE CLARION CLIPPERTON CLIPPERTON RESOURCE ASSESSMENTRESOURCE ASSESSMENT
2.2. INTEGRATE AVAILABLE RESOURCE AND INTEGRATE AVAILABLE RESOURCE AND RELATED ENVIRONMENTAL DATARELATED ENVIRONMENTAL DATA
3.3. PROVIDE USEFUL GUIDELINES FOR PROVIDE USEFUL GUIDELINES FOR
RELATED ENVIRONMENTAL DATARELATED ENVIRONMENTAL DATA
3.3. PROVIDE USEFUL GUIDELINES FOR PROVIDE USEFUL GUIDELINES FOR PROSPECTING AND EXPLORATIONPROSPECTING AND EXPLORATIONPROSPECTING AND EXPLORATIONPROSPECTING AND EXPLORATION
2222

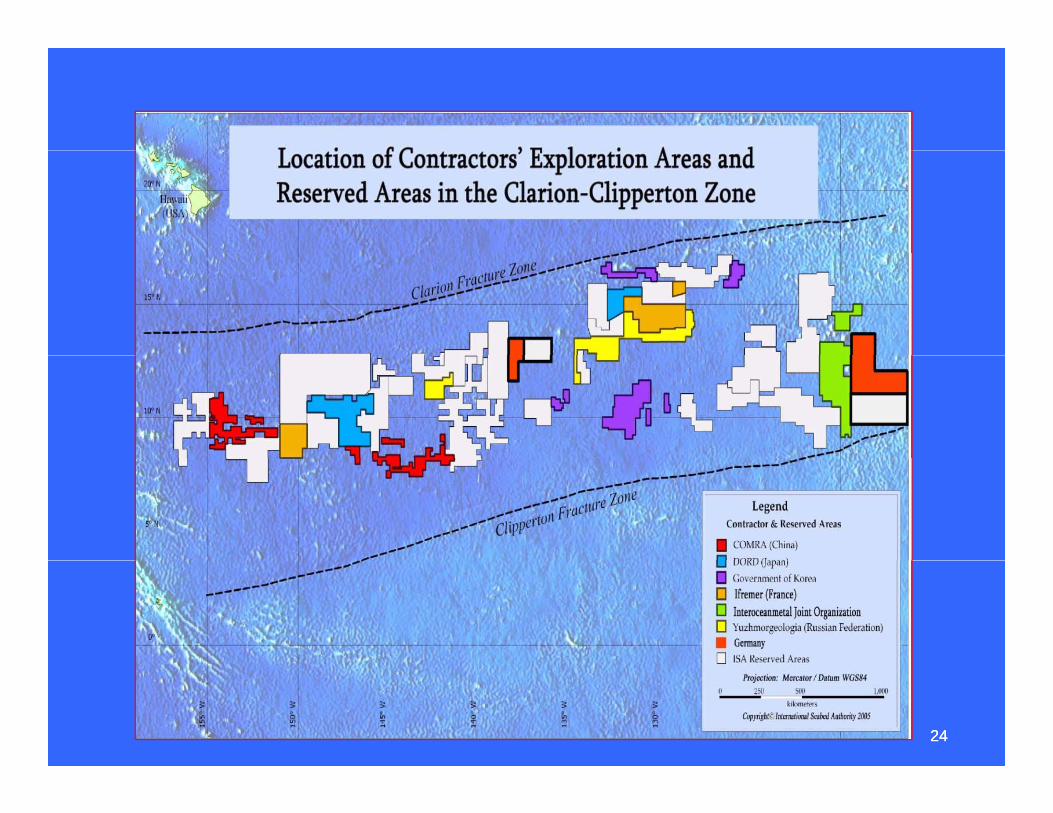
AREA OF INTEREST:110O – 160O W; 0O – 20O N
15N
140W
Clarion Fracture Zone
10N
35W
60W
25W
20W
45W
50W
55W
30W
5N
1316 12 12141515 13
Clipperton Fracture Zone
0
2323
2424

PROGRAMME TEAM
SECRETARIAT
COMRA
CONTRACTORS CONSULTANTS
2525

MAJOR SCHEDULE MILESTONESMILESTONES
MILESTONEMILESTONE COMPLETION DATECOMPLETION DATEMILESTONEMILESTONE1.1. DRAFT REPORTSDRAFT REPORTS2.2. MIDMID--COURSE MTG.COURSE MTG.
COMPLETION DATECOMPLETION DATEJULY 2006JULY 2006
SEPTEMBER 2006SEPTEMBER 20063.3. Interim REPORTSInterim REPORTS4.4. Final reportsFinal reports
20072007--20082008Early 2009Early 2009
5. External Review of 5. External Review of documentsdocuments
66 FINAL WORKSHOPFINAL WORKSHOP
June 2009June 2009
D b 2009D b 20096.6. FINAL WORKSHOPFINAL WORKSHOP7.7. Publication of Publication of
resultsresults
December 2009December 200920102010--20112011
2626

ISA’s secured FTP/VPN siteISA’s secured FTP/VPN siteISA s secured FTP/VPN siteISA s secured FTP/VPN site
Bathymetry data from the public domain.Bathymetry data from the public domain.Additional data acquired from contractors for Additional data acquired from contractors for G M d lG M d l PPGeoModelGeoModel Program.Program.Data/reports submitted by consultantsData/reports submitted by consultantsDigitization and geoDigitization and geo--referencing of bathymetric referencing of bathymetric maps provided by Pioneer Investors.maps provided by Pioneer Investors.
2727
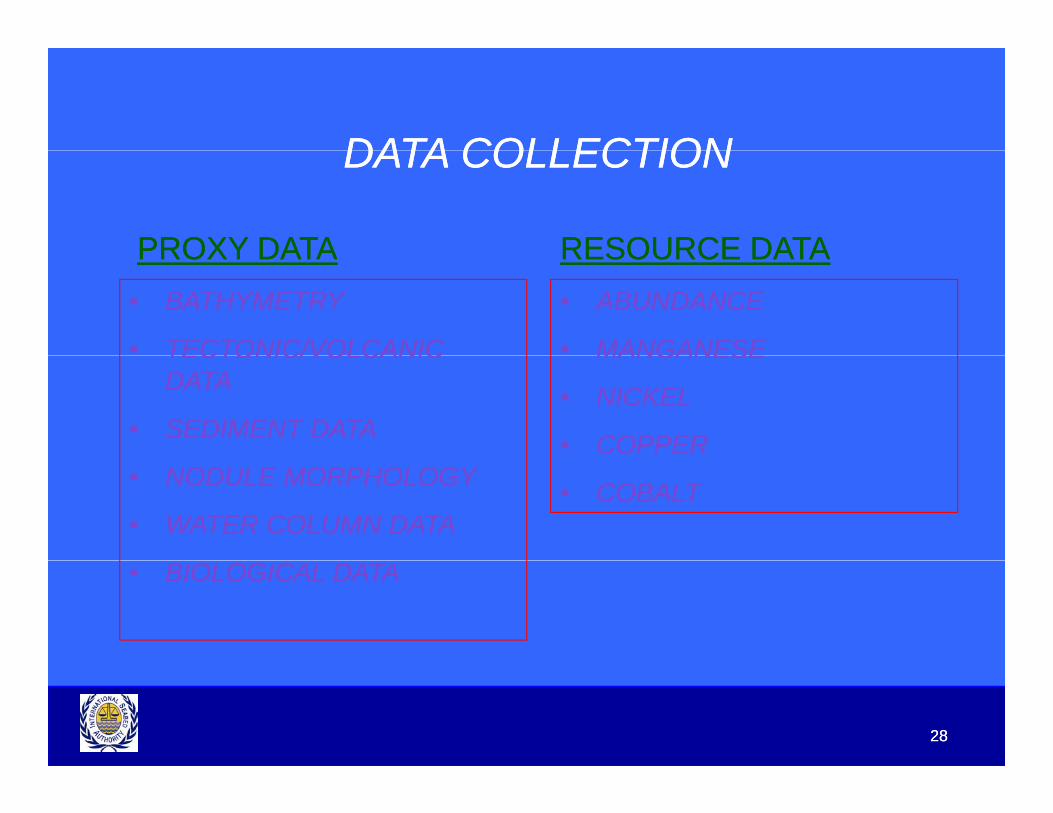
DATA COLLECTIONDATA COLLECTIONDATA COLLECTIONDATA COLLECTION
PROXY DATAPROXY DATA RESOURCE DATARESOURCE DATA•• BATHYMETRYBATHYMETRY
•• TECTONIC/VOLCANICTECTONIC/VOLCANIC
PROXY DATAPROXY DATA RESOURCE DATARESOURCE DATA•• ABUNDANCEABUNDANCE
•• MANGANESEMANGANESETECTONIC/VOLCANIC TECTONIC/VOLCANIC DATADATA
•• SEDIMENT DATASEDIMENT DATA
MANGANESEMANGANESE
•• NICKELNICKEL
•• COPPERCOPPER•• NODULE MORPHOLOGYNODULE MORPHOLOGY
•• WATER COLUMN DATAWATER COLUMN DATA•• COBALTCOBALT
•• BIOLOGICAL DATABIOLOGICAL DATA
2828

Content COMRA KORDI IOM
Polymetallic nodules dataMFES abundance
241+536 station50000 data points
232 stations outside the area 230 +69 +561(abundance and
Geological model Programme‐ additional data provided by contractors
MFES abundance 50000 data points (abundance and chemistry)
Gravity and Magnetic data 6610 points Figures for free-air anomalyand
magnetic intensity andmagnetic anomalyprovided
Meteorology 3396 pointsCTD 7 Profiles 15 profiles
Bathymetric data xyz and grd dataaround 250000 xyz
pointsadditional around 8300 xyz
Have provided multibeam datain
12 sectors in xyz format
2 blocksBlock-1 22 ascii files
Block-2 55 ascii files
around 8300 xyz points single beam echosounding
Sediment type Around 1500 4 sediment cores
Particle size of sediment Around 200
Deep tow photography 4 profiles data
Oth t t d t
2929
Other contractor data
DORD JAPAN 1450 data points Mn/Fe ratios onlyIFREMER- 500 stations nodule abundance, grade data for validation and sediment data

Prospector’s Guide Proxiesp
•• Gridded BathymetryGridded Bathymetry•• Gridded BathymetryGridded Bathymetry
•• Volcanic, tectonic and sediment factorsVolcanic, tectonic and sediment factors
•• Growth model for Growth model for PolymetallicPolymetallic nodulesnodules
•• Nodule coverage Morphology and distribution in eastern CCZNodule coverage Morphology and distribution in eastern CCZ
•• Volcanic, tectonic and sediment factorsVolcanic, tectonic and sediment factors
•• Growth model for Growth model for PolymetallicPolymetallic nodulesnodules
•• Nodule coverage Morphology and distribution in eastern CCZNodule coverage Morphology and distribution in eastern CCZ•• Nodule coverage, Morphology and distribution in eastern CCZNodule coverage, Morphology and distribution in eastern CCZ
•• Sediments in eastern CCZSediments in eastern CCZ
•• Nodule genesis and sediment distribution in Korean Allocated areaNodule genesis and sediment distribution in Korean Allocated area
•• Nodule coverage, Morphology and distribution in eastern CCZNodule coverage, Morphology and distribution in eastern CCZ
•• Sediments in eastern CCZSediments in eastern CCZ
•• Nodule genesis and sediment distribution in Korean Allocated areaNodule genesis and sediment distribution in Korean Allocated area
•• Bathymetry and sediments in COMRA areaBathymetry and sediments in COMRA area
•• Regional examination of sedimentsRegional examination of sediments
•• Bathymetry and sediments in COMRA areaBathymetry and sediments in COMRA area
•• Regional examination of sedimentsRegional examination of sediments
•• Benthic Biological data from CCZBenthic Biological data from CCZ•• Benthic Biological data from CCZBenthic Biological data from CCZ
3030

Bathymetric map of CCZ(from etopo- 1’ depth data)
3131

Coverage of ISA DatasetsCoverage of ISA Datasets
3232

ONEONE--MINUTE BATHYMETRYMINUTE BATHYMETRYONE MINUTE BATHYMETRY
F acture Zone
20N
Clarion Fracture15N
Clipperton Fracture Zone10N
5N
1,000 - 2,000
2,000 - 3,000
3,000 - 4,000
-2,000 - -1,000
-1,000 - 0
0 - 1,000
-5,000 - -4,000
-4,000 - -3,000
-3,000 - -2,000
-6,000 - -5,000
135W
160W
125W
120W
140W
145W
150W
155W
130W
Depths & Elevations in MetersDepths & Elevations in Meters
3333

PROXY DATA:TECTONICS & VOLCANISM
Tectonic sketch of the CCZ
3434

Sediment facies and nodule abundance
3535

PaleoPaleo--reconstruction of CCZreconstruction of CCZ--20 MYA20 MYA
3636

PROXY DATA:nodule morphology
IOM- report on nodule coverage,
p gy
IOM report on nodule coverage, Morphology, and distribution in easternPart of the CCZ.-Based on 926 station data-Discoid type nodules dominateDi t ib ti f d l t h-Distribution of nodule types shows zonality
3737

Classification and characteristics of CCZ nodules 3838

Six factors necessary for nodule growth• Supply of metalspp y• Presence of Nuclei• Antarctic Bottom Water (AABW)• Semi-liquid surface layer• Semi-liquid surface layer• Bioturbation• Internal Stratigraphy
3939

4040

Abundance and Coverage Vs. Water depth
4141

Bathymetry and sedimentsBathymetry and sediments--COMRA east areaCOMRA east area
4242

COMRA West areaCOMRA West areaCOMRA West areaCOMRA West area
4343

Sediment distribution- COMRA east
COMRA-West
4444

PROXY DATA: WATER COLUMN
WATER COLUMN DATA: CCD4545

WATER COLUMN DATA: DEPTH - CCD
4646

CCD vs WATER DEPTHCCD vs WATER DEPTH
Increasing Biological Productivity
CCD WATER DEPTHCCD<WATER DEPTH
CCD>WATER DEPTH
Nodule Deposits
4747

(DEPTH – CCD) vs Abundance(DEPTH – CCD) vs Abundance
4848
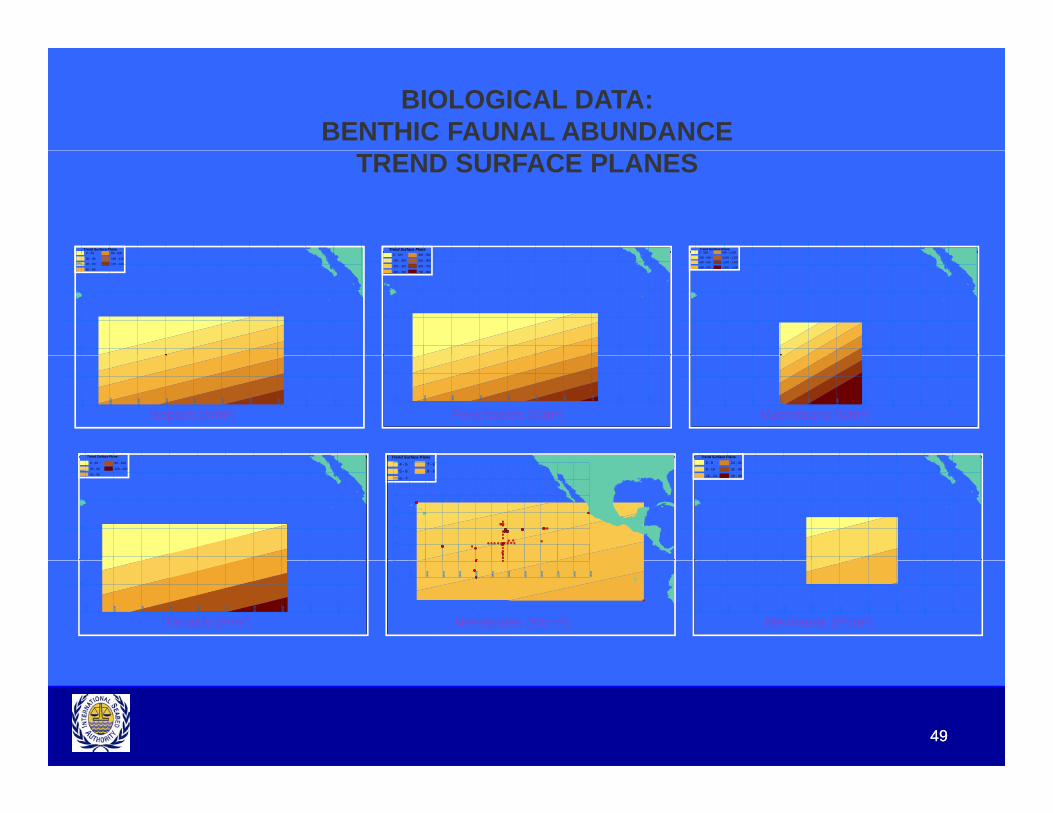
BIOLOGICAL DATA:BENTHIC FAUNAL ABUNDANCE
Trend Surface Plane0 20 80 100
Trend Surface Plane Trend Surface Plane800 - 1 0000 - 200
TREND SURFACE PLANES
0 - 20
20 - 40
40 - 60
60 - 80
80 - 100
100 - 120
120 - 140
20N
10N
15N
25N
20N
10N
15N
25N
0 - 100
100 - 200
200 - 300
300 - 400
400 - 500
500 - 600
600 - 700
700 - 800
20N
10N
15N
25N
800 1,000
1,000 - 1,200
1,200 - 1,400
1,400 - 1,600
0 200
200 - 400
400 - 600
600 - 800
5N
115W
110W
125W
155W
130W
135W
120W
150W
145W
140W
Isopods (#/m2)
5N
115W
110W
125W
155W
130W
135W
120W
150W
140W
145W
Polychaetes (#/m2) Macrofauna (#/m2)
5N
115W
110W
125W
155W
130W
135W
120W
150W
145W
140W
Trend Surface Plane Trend Surface PlaneTrend Surface Plane90 - 120
120 - 150
0 - 30
30 - 60
60 - 90
20N
10N
15N
25N
20N
10N
15N
25N
Trend Surface Plane24 - 32
32 - 40
40 - 48
0 - 8
8 - 16
16 - 24
Trend Surface Plane
7 - 8
8 - 9
4 - 5
5 - 6
6 - 7
5N
20N
15N
10N
35N
25N
30N
Tanaids (#/m2)
5N
115W
110W
125W
155W
130W
135W
120W
150W
145W
140W
Meiofauna (#/cm2)
5N
115W
110W
125W
155W
130W
135W
120W
150W
145W
140W
Nematodes (#/cm2)
110W
115W
130W
125W
120W
160W
135W
150W
140W
145W
155W
0N 105W
4949

Nitrogen export flux
Carbon export flux
5050

Geological ModelGeological Model–– Primary data sourcePrimary data sourcea y data sou cea y data sou ce–– Inferred resourcesInferred resources–– SDSS (Spatial decision supportSDSS (Spatial decision supportSDSS (Spatial decision support SDSS (Spatial decision support
system) Modelingsystem) Modeling
5151

Data SetsData Sets--KORDI models using KORDI models using GeostatisticalGeostatistical and GIS and GIS techniques.techniques.Biogeochemical approach to modeling examines Biogeochemical approach to modeling examines the use of specific proxy variables to predict the use of specific proxy variables to predict deposit characteristics where data are lacking.deposit characteristics where data are lacking.Spatial Decision Support System (SDSS) Spatial Decision Support System (SDSS)
h h d li hi h lh h d li hi h lapproach to the modeling, which employs approach to the modeling, which employs Weights of Evidence Modeling, Fuzzy Logic, Weights of Evidence Modeling, Fuzzy Logic, Logistic Regression and Artificial Neural NetworkLogistic Regression and Artificial Neural NetworkLogistic Regression and Artificial Neural Network Logistic Regression and Artificial Neural Network (ANN) techniques based on the some of proxy (ANN) techniques based on the some of proxy variablesvariablesvariables variables
5252

SAMPLE STATIONS IN SAMPLE STATIONS IN RESOURCE ASSESSMENT RESOURCE ASSESSMENT
SAMPLE STATIONS IN SAMPLE STATIONS IN RESOURCE ASSESSMENT RESOURCE ASSESSMENT SOU C SS SSSOU C SS SSSOU C SS SSSOU C SS SS
20N
Clarion Fracture Zone
15N
Clipperton Fracture Zone
10N
Clipperton
5N
115W
110W
130W
160W
120W
135W
140W
145W
150W
155W
125W
5353

Data CDR KOREA OMCO COMRA IOM
Totals After
Source CDR KOREA OMCO COMRA IOM Screeni
ng # Stations: Abundance
253 329 7,738 52,473 790 61,583
# Stations: Manganese
879 258 5,875 716 664 8,392
#Stations: 711 258 5 900 716 664 8 249Cobalt 711 258 5,900 716 664 8,249
#Stations: Nickel 799 258 5,923 716 664 8,360 Nickel
# Stations: Copper 882 258 5,924 714 664 8,442
5454

Ab d M C b lt Ni k l C
Summary resources
Abundance Manganese Cobalt Nickel Copper
Mean (kg/m2) 5.58 1.51 0.012 0.07 0.06 (kg/ )
Median (kg/m2)
5.06 1.33 0.011 0.06 0.05
Maximum (kg/m2)
24.22 7.71 0.059 0.36 0.33
Minimum (kg/m2)
0.01 0.00 0.000 0.00 0.00
Mean Std. (kg/m2) Error
5.38 2.61 0.036 0.15 0.15
Tonnage 27 063 7 300 58 340 290(106-metric) 27,063 7,300 58 340 290
5555

Estimated Tons (metric tons X 106)
Source Included
Area (km2 X 106) Nodules Mn Co Ni Cu
Reduced area 3.83 21,100 5,950* 46.4* 270* 234*
Total study 4.19 30,700 8,657* 67.5* 393* 341*study area
4.19 30,700 8,657 67.5 393 341
Biogeochemical model
4.85 27,100 7,300 58.0 340 290 model Potential resources of nodules
12.57 62,000 17,500 134.0 761 669
*Estimated using mean metal content values
Inferred resources
5656
Inferred resources

Station map and blocks used in the study
5757

OK- Ordinary KrigingSIS-Sequential Indicator simulation
5858
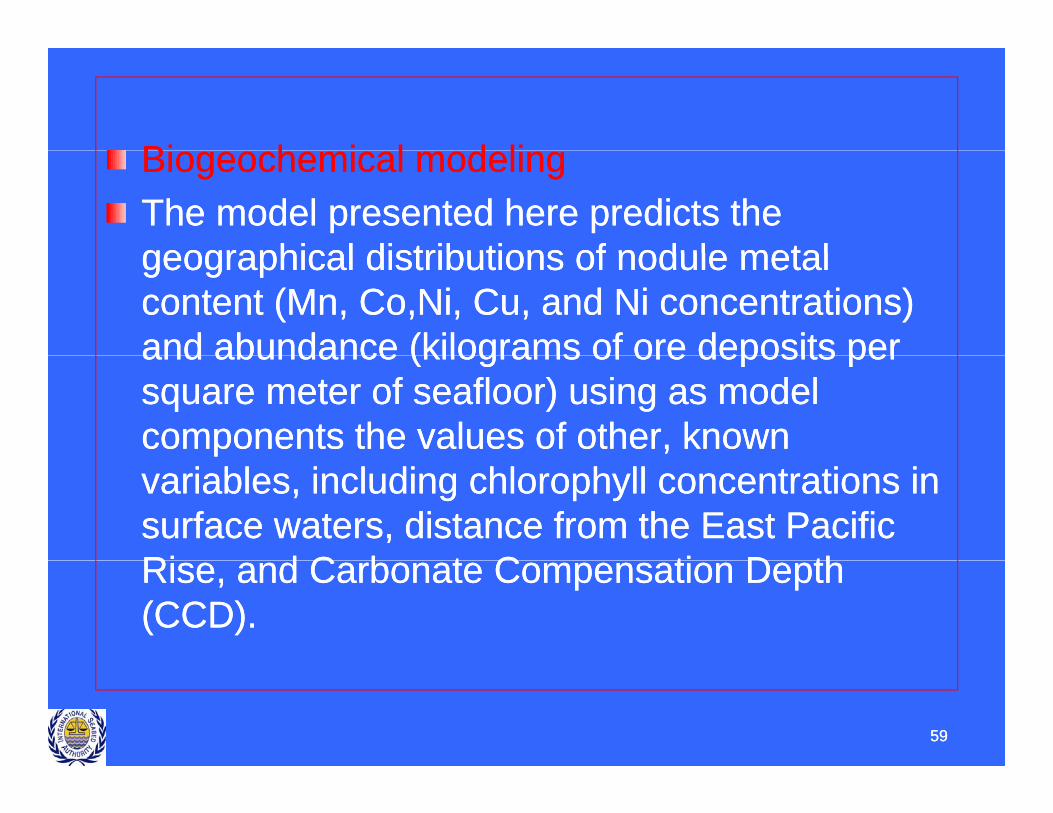
Bi h i l d liBi h i l d liBiogeochemical modelingBiogeochemical modelingThe model presented here predicts the The model presented here predicts the geographical distributions of nodule metalgeographical distributions of nodule metalgeographical distributions of nodule metal geographical distributions of nodule metal content (content (MnMn, , Co,NiCo,Ni, Cu, and Ni concentrations) , Cu, and Ni concentrations) and abundance (kilograms of ore deposits perand abundance (kilograms of ore deposits perand abundance (kilograms of ore deposits per and abundance (kilograms of ore deposits per square meter of seafloor) using as model square meter of seafloor) using as model components the values of other, known components the values of other, known variables, including chlorophyll concentrations in variables, including chlorophyll concentrations in surface waters, distance from the East Pacific surface waters, distance from the East Pacific Ri d C b t C ti D thRi d C b t C ti D thRise, and Carbonate Compensation Depth Rise, and Carbonate Compensation Depth (CCD).(CCD).
5959

Summary of resource estimation-Estimation from biogeochemical modeling
6060

MODEL DEFINITION:GENERAL HYPOTHESIS
MODEL DEFINITION:GENERAL HYPOTHESIS
1. Sources of metals: Land and East Pacific Rise, carried in suspended sediments2. Sediments consumed by zooplankton & converted to larger pellets that sink3. Fecal pellets metabolized by benthic fauna, releasing reduced metals4. Reduced metals scavanged by Mn oxide surfaces
Terrigenous Sediments
12
EastPacific
Rise
134
6161

Proxy variables usedProxy variables usedDi t f EPRDi t f EPRDistance from EPRDistance from EPRChlorophyll content in surface waters The chlorophyll content in Chlorophyll content in surface waters The chlorophyll content in surface waters is closely related to the level of biological activity surface waters is closely related to the level of biological activity taking place and also to the export productivity at the site, (i.e. the taking place and also to the export productivity at the site, (i.e. the flux rate of biogenic material out of surface waters). In this study we flux rate of biogenic material out of surface waters). In this study we use the estimates of chlorophyll content that were determined by use the estimates of chlorophyll content that were determined by bl di hi t i l hi f i it (N ti l O hi D tbl di hi t i l hi f i it (N ti l O hi D tblending historical archives of in situ (National Oceanographic Data blending historical archives of in situ (National Oceanographic Data Center) and satellite (Coastal Zone Color Scanner) chlorophyll data, Center) and satellite (Coastal Zone Color Scanner) chlorophyll data, which were combined using the blended analysis method of which were combined using the blended analysis method of Reynolds (1988) in an attempt to construct an improvedReynolds (1988) in an attempt to construct an improvedReynolds (1988) in an attempt to construct an improved Reynolds (1988) in an attempt to construct an improved climatologicalclimatological seasonal representation of global chlorophyll seasonal representation of global chlorophyll distributions (Gregg, W.W. and M.E. distributions (Gregg, W.W. and M.E. ConkrightConkright, 2000). These data , 2000). These data
il bl l d lil bl l d lare available as seasonal and annual averagesare available as seasonal and annual averages. . Distance from CCDDistance from CCD
6262

Chlorophyll in surface waters
6363

6464

6565

6666

SPATIAL DECISION SUPPORT SYSTEM SPATIAL DECISION SUPPORT SYSTEM MODELING (SDSS)MODELING (SDSS)MODELING (SDSS)MODELING (SDSS)The study is based on data sets compiled The study is based on data sets compiled by other experts that include bathymetry, by other experts that include bathymetry, topography, sediment type, CCD, and topography, sediment type, CCD, and surface chlorophyll. Specific techniques surface chlorophyll. Specific techniques employed in the study include Weights of employed in the study include Weights of Evidence Modeling, Fuzzy Logic, Logistic Evidence Modeling, Fuzzy Logic, Logistic Regression and Artificial Neural Network Regression and Artificial Neural Network (ANN) techniques(ANN) techniques
6767

6868
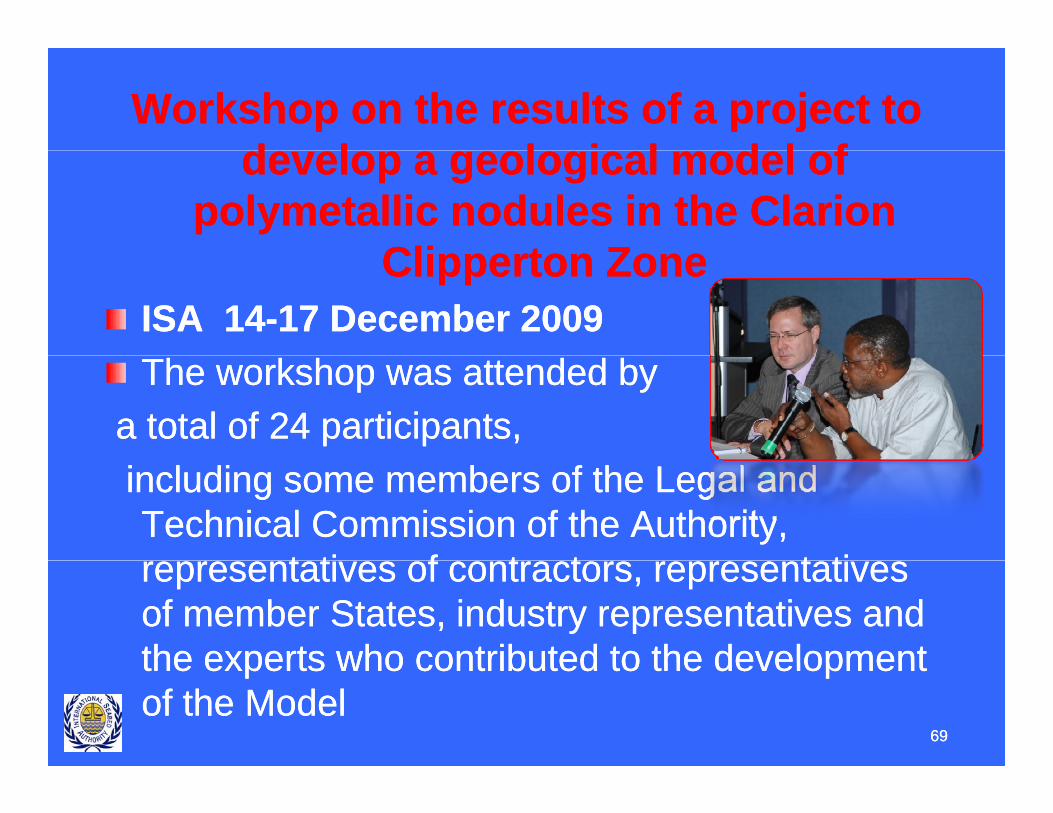
Workshop on the results of a project to Workshop on the results of a project to d l l i l d l fd l l i l d l fdevelop a geological model of develop a geological model of
polymetallicpolymetallic nodules in the Clarion nodules in the Clarion Cli tCli t ZZClippertonClipperton Zone Zone
ISA 14ISA 14--17 December 200917 December 2009The workshop was attended byThe workshop was attended by
a total of 24 participants, a total of 24 participants, including some members of the Legal and including some members of the Legal and Technical Commission of the Authority, Technical Commission of the Authority,
t ti f t t t tit ti f t t t tirepresentatives of contractors, representatives representatives of contractors, representatives of member States, industry representatives and of member States, industry representatives and the experts who contributed to the developmentthe experts who contributed to the developmentthe experts who contributed to the development the experts who contributed to the development of the Model of the Model
6969

7070