Embed Size (px)
Citation preview
The International Network for Bamboo and Rattan (INBAR) is the multilateral development organisation of 41 Member States for the promotion of bamboo and rattan. INBAR supports its members to include bamboo and rattan in their sustainable development action plans and green economy strategies. It promotes innovative ways of using bamboo and rattan to improve rural livelihoods, protect the environment, address climate change and issues of international bamboo and rattan trade and standards. INBAR connects a global network of partners from government, private and NGO sectors to promote a global agenda for sustainable development using bamboo and rattan.
Argentina, Bangladesh, Benin, Bhutan, Burundi, Cameroon, Canada, Chile, China, Colombia, Cuba,
Ecuador, Eritrea, Ethiopia, Ghana, India, Indonesia, Jamaica, Kenya, Liberia, Madagascar, Malawi, Malaysia,
Mozambique, Myanmar, Nepal, Nigeria, Panama, Peru, Rwanda, The Philippines, Senegal, Sierra Leone, Sri
Lanka, Suriname, Tanzania, Togo, Tonga, Uganda, Venezuela and Viet Nam.
Perú
Ecuador
Chile Argentina
ColombiaVenezuela
CubaJamaica
Canada
Madagascar
SurinameSierra Leone Nigeria
TogoSenegal
Benin
Ethiopia
KenyaUganda
Mozambique
TanzaniaRwandaSri Lanka
IndiaNepal
MyanmarMalaysia
Indonesia
PhilippinesViet NamBangladesh
Tonga
Bhutan
China
Panama
Burundi
Eritrea
Malawi
Ghana CameroonLiberia
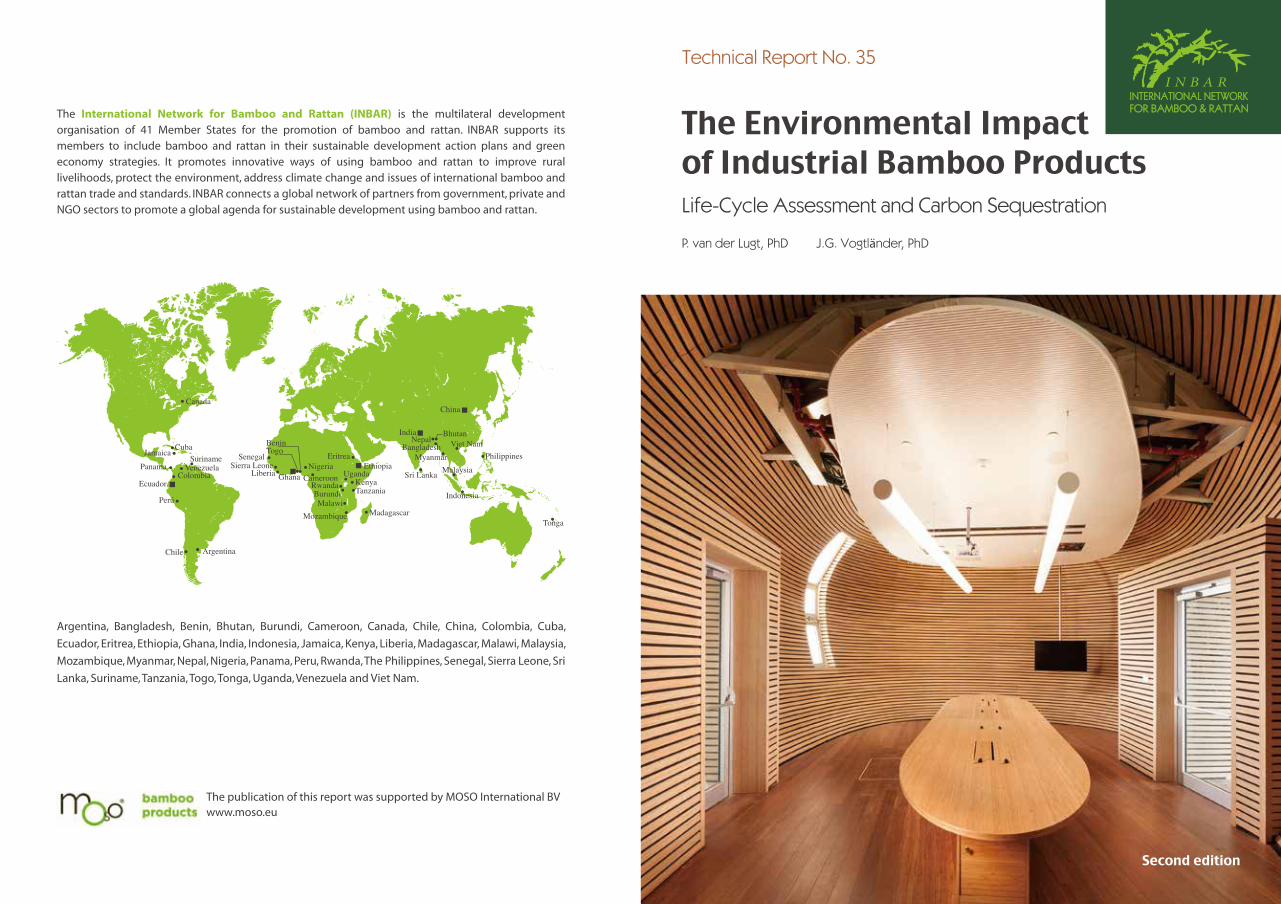
Life-Cycle Assessment and Carbon Sequestration
Second edition
The Environmental Impact of Industrial Bamboo Products
P. van der Lugt, PhD J.G. Vogtländer, PhD
Technical Report No. 35
The publication of this report was supported by MOSO International BV www.moso.eu
International Network for Bamboo and RattanINBAR, the International Network for Bamboo and Rattan, is an intergovernmentalorganization bringing together some 41 countries for the promotion of the ecosystembenefits and values of bamboo and rattan.
Copyright and Fair UseThis publication is licensed for use under the Creative CommonsAttribution–Non-commercial–Share Alike 3.0 Unported Licence. To view this licence, visithttp://creativecommons.org/licenses/by-nc-sa/3.0/ Unless otherwise noted, you are freeto copy, duplicate, or reproduce and distribute, display, or transmit any part of thispublication or portions thereof without permission and to make translations, adaptations,or other derivative works under the following conditions:
Attribution: The work must be attributed, but not in any way that suggestsendorsement by the publisher or the author(s).
Non-commercial: This work may not be used for commercial purposes.
Share Alike: If this work is altered, transformed, or built upon, the resulting work must bedistributed only under the same or similar license to this one.
Keywords: bamboo, life cycle assessment, product, carbon sequestration, climate change, INBAR
All photos are copyright MOSO International and/or INBARCover: Tel-Aviv University, photograph by Elad Gonen
International Network for Bamboo and Rattan (INBAR) is the multilateral development organisation of 41 Member States for the promotion of bamboo and rattan. INBAR supports its members to include bamboo and rattan in their sustainable development action plans and green economy strategies. It promotes innovative ways of using bamboo and rattan to improve rural livelihoods, protect the environment, address climate change and issues of international bamboo and rattan trade and standards. INBAR connects a global network of partners from government, private and NGO sectors to promote a global agenda for sustainable development using bamboo and rattan.
For more information, please visit www.inbar.int. Address: No. 8 Fu Tong Dong Da Jie, Wang Jing, Chaoyang District, Beijing 100102, P.R. China. Tel: +86-10-64706161; Fax: +86-10-64702166; E-mail: [email protected]
This study was conducted in conjunction with the Design for Sustainability (DfS)
Program of the Faculty of Industrial Design Engineering of Delft University of
Technology. DfS focuses on research in the �eld of sustainable development. The mass consumption of goods and services should involve the continuous improvement of environmental, economic and social-cultural values. The central objective of the DfS research programme is the exploration, description, understanding and prediction of problems and opportunities for innovating and designing products and product service systems of superior quality.
For more information please visit www.io.tudelft.nl Address: Delft University of Technology, Faculty of Industrial Design Engineering, Design for Sustainability Program Landbergstraat 15, 2628 CE Delft, the Netherlands Tel +31 (0)152782738; Fax +31 (0)152782956; email: [email protected]
MOSO International was founded in the Netherlands in 1997 and since that time has established itself as the European market leader in the development of innovative and sustainable bamboo products in four product groups: �ooring, outdoor (cladding and decking), panels, veneer and beams and unlimited solutions (customized solutions for industrial clients). Besides product excellence and innovation, sustainability is one of the key drivers of our business. We continuously strive to improve the already excellent environmental performance of MOSO’s bamboo products and the company tries to communicate this in a transparent manner following internationally accepted methodologies. This INBAR Technical Report certainly contributes to that goal.
For more information about MOSO International please visit www.moso.eu. Address: Adam Smithweg 2, 1689 ZW Zwaag, the NetherlandsTel +31(0)229265732; email [email protected]
The publication of this report was supported by MOSO International BV www.moso.eu
International Network for Bamboo and Rattan (INBAR)
PO Box 100102-86, Beijing 100102, P. R. China
Tel: +86-10-6470 6161; Fax: +86-10-6470 2166;
Email: [email protected]
www.inbar.int
ISBN: 978-92-95098-89-3 (printed)
978-92-95098-90-9 (online)
© 2015 INBAR - International Network for Bamboo and Rattan
Printed on recycled paper
Contents
2. INBAR Technical Report No. 351. INBAR Technical Report No. 35
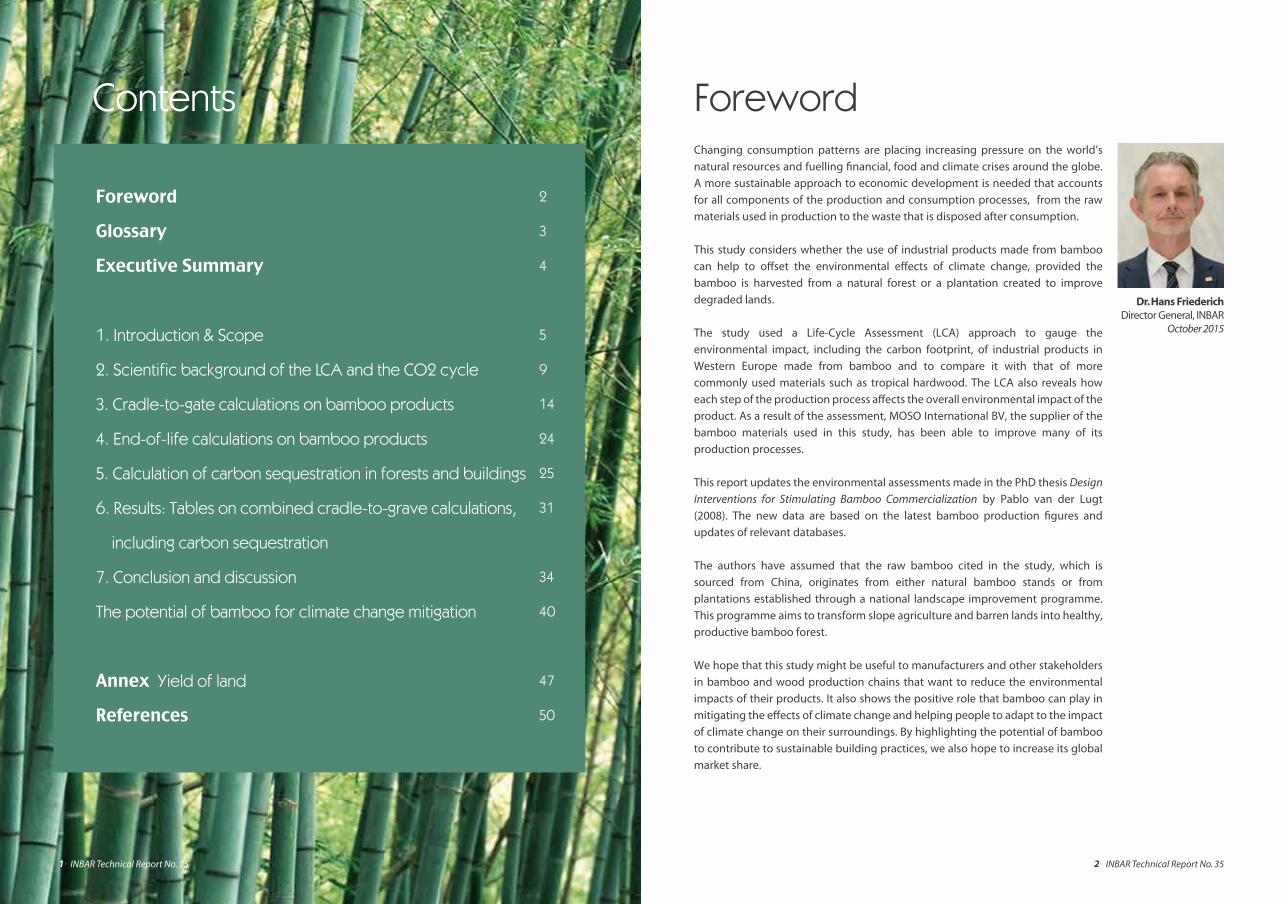
Foreword Changing consumption patterns are placing increasing pressure on the world’s natural resources and fuelling �nancial, food and climate crises around the globe. A more sustainable approach to economic development is needed that accounts for all components of the production and consumption processes, from the raw materials used in production to the waste that is disposed after consumption.
This study considers whether the use of industrial products made from bamboo can help to o�set the environmental e�ects of climate change, provided the bamboo is harvested from a natural forest or a plantation created to improve degraded lands.
The study used a Life-Cycle Assessment (LCA) approach to gauge the environmental impact, including the carbon footprint, of industrial products in Western Europe made from bamboo and to compare it with that of more commonly used materials such as tropical hardwood. The LCA also reveals how each step of the production process a�ects the overall environmental impact of the product. As a result of the assessment, MOSO International BV, the supplier of the bamboo materials used in this study, has been able to improve many of its production processes.
This report updates the environmental assessments made in the PhD thesis Design
Interventions for Stimulating Bamboo Commercialization by Pablo van der Lugt (2008). The new data are based on the latest bamboo production �gures and updates of relevant databases.
The authors have assumed that the raw bamboo cited in the study, which is sourced from China, originates from either natural bamboo stands or from plantations established through a national landscape improvement programme. This programme aims to transform slope agriculture and barren lands into healthy, productive bamboo forest.
We hope that this study might be useful to manufacturers and other stakeholders in bamboo and wood production chains that want to reduce the environmental impacts of their products. It also shows the positive role that bamboo can play in mitigating the e�ects of climate change and helping people to adapt to the impact of climate change on their surroundings. By highlighting the potential of bamboo to contribute to sustainable building practices, we also hope to increase its global market share.
Dr. Hans FriederichDirector General, INBAR
October 2015
Foreword
Glossary
Executive Summary
1. Introduction & Scope
2. Scientific background of the LCA and the CO2 cycle
3. Cradle-to-gate calculations on bamboo products
4. End-of-life calculations on bamboo products
5. Calculation of carbon sequestration in forests and buildings
6. Results: Tables on combined cradle-to-grave calculations,
including carbon sequestration
7. Conclusion and discussion
The potential of bamboo for climate change mitigation
Annex Yield of land
References
2
3
4
5
9
14
24
25
31
34
40
47
50
4. INBAR Technical Report No. 353. INBAR Technical Report No. 35
This report presents the results of a Life-Cycle Assessment (LCA) and carbon footprint analysis of a selection of industrial bamboo products that are manufactured by the company MOSO International. The analysis was done to determine the impact that their production and disposal have on the environment. Bamboo �ooring, decking, panels and beams have been evaluated.
A comprehensive explanation is o�ered of how carbon sequestration can be calculated, following LCA methodology. This LCA is speci�c to the product evaluations described in this report and is not applicable to other manufacturers’ products. The assessment described here is done for the production (cradle-to-gate) plus the waste (end-of-life) stages of the bamboo products, but does not include the user stage (negligable contribution and dependent on personal preferences), when the product is in use by consumers after purchase.
Bamboo products are increasingly found in western markets, with recorded international trade of some $1.86 bn in 2013, the majority of which is imported to European and North American consumer countries. As bamboo products are increasingly perceived as “green” and environmentally friendly, it is important to have an e�ective way to evaluate and verify these claims – to reassure producers and consumers, and help producers �nd ways to make their production system even “greener”. The LCA is a widely used and recognized method for achieving this.
This study shows that if production parameters are optimised, these industrial bamboo products can have a negative carbon footprint over their full life-cycle, from cradle to grave, based on use in Western Europe. This means that the credits gained through carbon sequestration, and from burning to produce electricity in a power plant at the end of each product’s life, outweigh the emissions caused by the production and transport processes.
At end-of-life, it is assumed that 90% of the bamboo products are incinerated in an electrical power plant and 10% will end-up in land�ll, a realistic scenario for Western Europe. The LCA was done in accordance with ISO 14040 and 14044. In addition, the capture and storage (sequestration) of CO2 has been taken into account.
It is hoped that the analysis described here will inform and encourage other bamboo producers to do similar life-cycle analyses of their production systems, to better understand where they can focus investments to reduce the environmental impacts of their products. It also aims to inform policy-makers about the sustainability of bamboo products, to encourage them to specify the use of this resource in national and international policies and investment plans.
Glossary Executive summaryBiogenic CO2 is captured in biomass during the growth of a plant or tree and, consequently, in a biologically-based product.
Carbon footprint is a commonly used methodology in which the greenhouse gas emissions during the life cycle of a product can be measured in terms of their kg CO2 equivalent (CO2e).
Carbon negative is a negative outcome of the carbon footprint of a product, i.e. when carbon credits through carbon sequestration and energy production at the end of life phase are higher than the emissions caused by production and transport.
Carbon sequestration is the process of capturing and storing atmospheric carbon dioxide, in this case in bamboo biomass (forests and products).
Cradle-to-gate assessments describe the aggregated environmental impact of a product during production, i.e. from resource extraction, transport and �nal processing until it is ready for shipment to the customer at the factory gate.
Cradle-to-grave assessments include the aggregated environmental impact of a product during the use and end-of-life phases, thus throughout its full life cycle.
Eco-costs is an indicator in the Life-Cycle Assessment (see below) used to express the total environmental burden of a product over its life cycle on the basis of the prevention of that burden.
Life-Cycle Assessment (LCA) is a methodology used to assess the environmental impact associated with all stages of a product’s life cycle from cradle-to-grave (see above). In contrast to a carbon footprint assessment, LCA is based on several environmental indicators which, besides the Global Warming Potential (carbon footprint), also include acidi�cation, eutrophication, smog, dust, toxicity, depletion, land-use and waste.
Life-Cycle Inventory (LCI) is an element of the LCA, which involves the development of an inventory of the �ows of a product system, including inputs of water, energy, and raw materials and releases to air, land, and water.
6. INBAR Technical Report No. 355. INBAR Technical Report No. 35
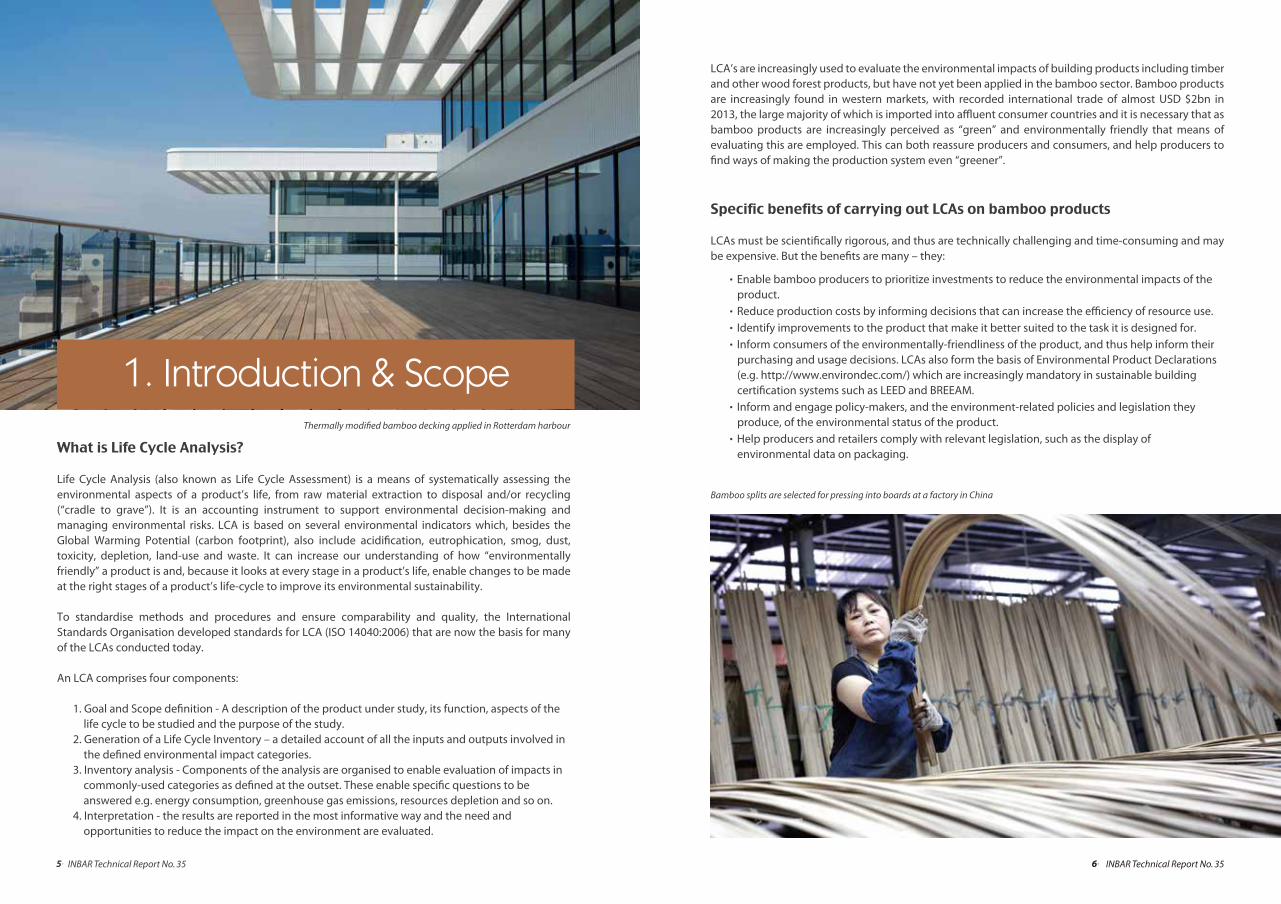
What is Life Cycle Analysis?
Life Cycle Analysis (also known as Life Cycle Assessment) is a means of systematically assessing the environmental aspects of a product’s life, from raw material extraction to disposal and/or recycling (“cradle to grave”). It is an accounting instrument to support environmental decision-making and managing environmental risks. LCA is based on several environmental indicators which, besides the Global Warming Potential (carbon footprint), also include acidi�cation, eutrophication, smog, dust, toxicity, depletion, land-use and waste. It can increase our understanding of how “environmentally friendly” a product is and, because it looks at every stage in a product’s life, enable changes to be made at the right stages of a product’s life-cycle to improve its environmental sustainability. To standardise methods and procedures and ensure comparability and quality, the International Standards Organisation developed standards for LCA (ISO 14040:2006) that are now the basis for many of the LCAs conducted today.
An LCA comprises four components:
1. Goal and Scope de�nition - A description of the product under study, its function, aspects of the life cycle to be studied and the purpose of the study.
2. Generation of a Life Cycle Inventory – a detailed account of all the inputs and outputs involved in the de�ned environmental impact categories.
3. Inventory analysis - Components of the analysis are organised to enable evaluation of impacts in commonly-used categories as de�ned at the outset. These enable speci�c questions to be answered e.g. energy consumption, greenhouse gas emissions, resources depletion and so on.
4. Interpretation - the results are reported in the most informative way and the need and opportunities to reduce the impact on the environment are evaluated.
1. Introduction & Scope
LCA’s are increasingly used to evaluate the environmental impacts of building products including timber and other wood forest products, but have not yet been applied in the bamboo sector. Bamboo products are increasingly found in western markets, with recorded international trade of almost USD $2bn in 2013, the large majority of which is imported into a�uent consumer countries and it is necessary that as bamboo products are increasingly perceived as “green” and environmentally friendly that means of evaluating this are employed. This can both reassure producers and consumers, and help producers to �nd ways of making the production system even “greener”.
Specific benefits of carrying out LCAs on bamboo products
LCAs must be scienti�cally rigorous, and thus are technically challenging and time-consuming and may be expensive. But the bene�ts are many – they:
. Enable bamboo producers to prioritize investments to reduce the environmental impacts of the product.
. Reduce production costs by informing decisions that can increase the e�ciency of resource use.
. Identify improvements to the product that make it better suited to the task it is designed for.
. Inform consumers of the environmentally-friendliness of the product, and thus help inform their purchasing and usage decisions. LCAs also form the basis of Environmental Product Declarations (e.g. http://www.environdec.com/) which are increasingly mandatory in sustainable building certi�cation systems such as LEED and BREEAM.
. Inform and engage policy-makers, and the environment-related policies and legislation they produce, of the environmental status of the product.
. Help producers and retailers comply with relevant legislation, such as the display of environmental data on packaging.
Thermally modi�ed bamboo decking applied in Rotterdam harbour
Bamboo splits are selected for pressing into boards at a factory in China
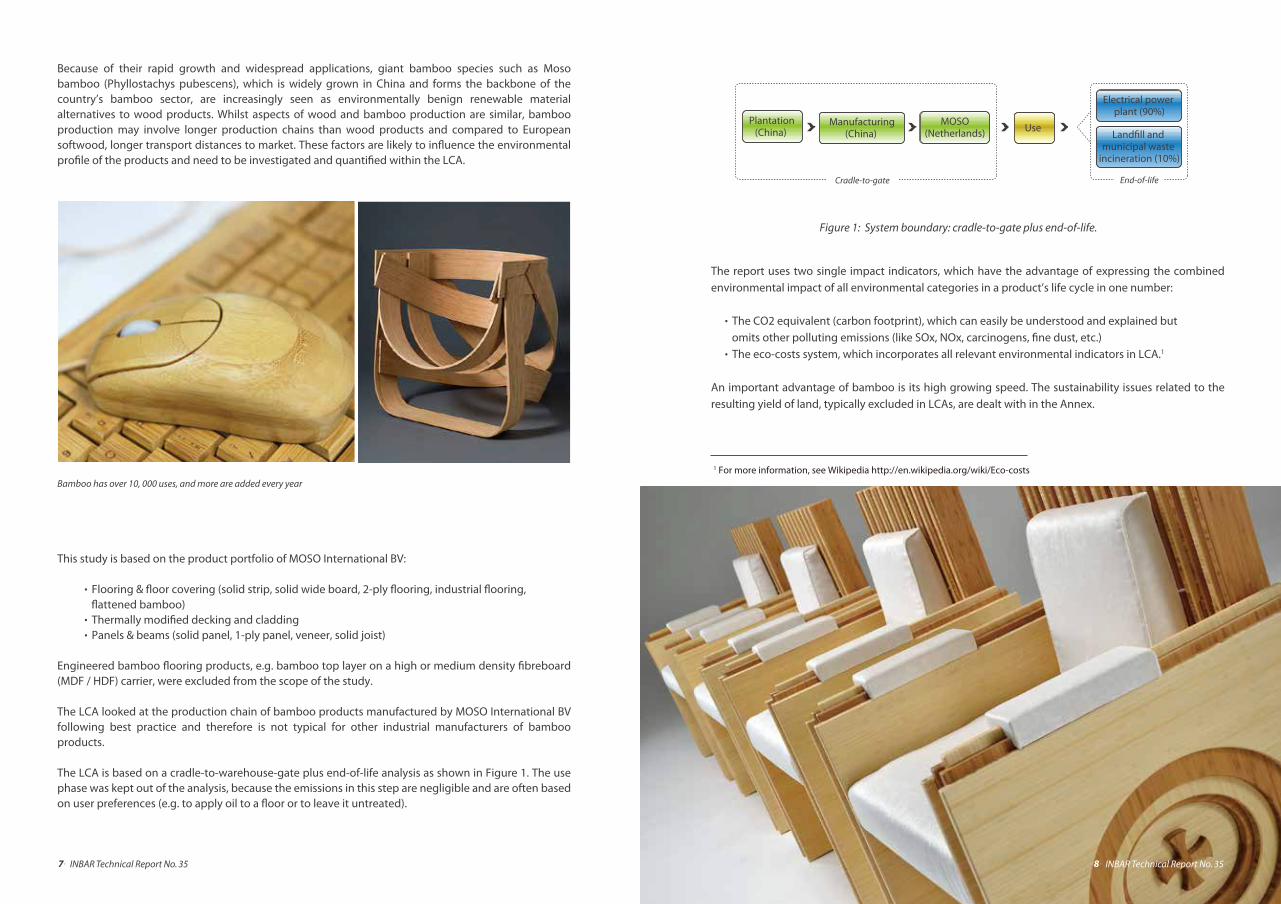
The report uses two single impact indicators, which have the advantage of expressing the combined environmental impact of all environmental categories in a product’s life cycle in one number:
. The CO2 equivalent (carbon footprint), which can easily be understood and explained but omits other polluting emissions (like SOx, NOx, carcinogens, �ne dust, etc.). The eco-costs system, which incorporates all relevant environmental indicators in LCA.1
An important advantage of bamboo is its high growing speed. The sustainability issues related to the resulting yield of land, typically excluded in LCAs, are dealt with in the Annex.
1 For more information, see Wikipedia http://en.wikipedia.org/wiki/Eco-costs
8. INBAR Technical Report No. 357. INBAR Technical Report No. 35
Because of their rapid growth and widespread applications, giant bamboo species such as Moso bamboo (Phyllostachys pubescens), which is widely grown in China and forms the backbone of the country’s bamboo sector, are increasingly seen as environmentally benign renewable material alternatives to wood products. Whilst aspects of wood and bamboo production are similar, bamboo production may involve longer production chains than wood products and compared to European softwood, longer transport distances to market. These factors are likely to in�uence the environmental pro�le of the products and need to be investigated and quanti�ed within the LCA.
This study is based on the product portfolio of MOSO International BV:
. Flooring & �oor covering (solid strip, solid wide board, 2-ply �ooring, industrial �ooring, �attened bamboo) . Thermally modi�ed decking and cladding . Panels & beams (solid panel, 1-ply panel, veneer, solid joist)
Engineered bamboo �ooring products, e.g. bamboo top layer on a high or medium density �breboard (MDF / HDF) carrier, were excluded from the scope of the study.
The LCA looked at the production chain of bamboo products manufactured by MOSO International BV following best practice and therefore is not typical for other industrial manufacturers of bamboo products.
The LCA is based on a cradle-to-warehouse-gate plus end-of-life analysis as shown in Figure 1. The use phase was kept out of the analysis, because the emissions in this step are negligible and are often based on user preferences (e.g. to apply oil to a �oor or to leave it untreated).
Figure 1: System boundary: cradle-to-gate plus end-of-life.
Manufacturing(China)
Electrical power plant (90%)
Land�ll and municipal waste
incineration (10%)
MOSO(Netherlands) Use
Plantation(China)
Cradle-to-gate End-of-life
Bamboo has over 10, 000 uses, and more are added every year
10. INBAR Technical Report No. 359. INBAR Technical Report No. 35
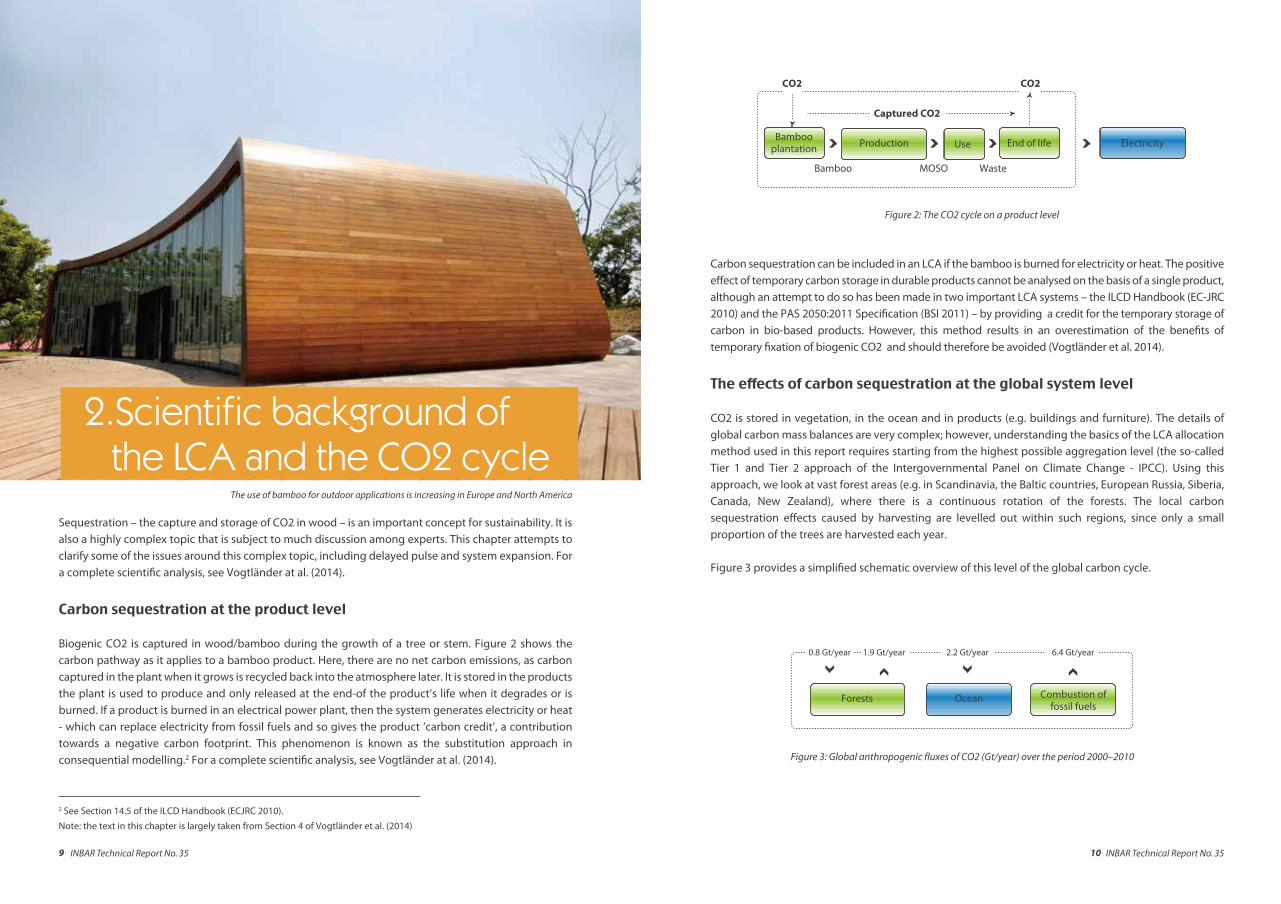
Sequestration – the capture and storage of CO2 in wood – is an important concept for sustainability. It is also a highly complex topic that is subject to much discussion among experts. This chapter attempts to clarify some of the issues around this complex topic, including delayed pulse and system expansion. For a complete scienti�c analysis, see Vogtländer at al. (2014).
Carbon sequestration at the product level
Biogenic CO2 is captured in wood/bamboo during the growth of a tree or stem. Figure 2 shows the carbon pathway as it applies to a bamboo product. Here, there are no net carbon emissions, as carbon captured in the plant when it grows is recycled back into the atmosphere later. It is stored in the products the plant is used to produce and only released at the end-of the product’s life when it degrades or is burned. If a product is burned in an electrical power plant, then the system generates electricity or heat - which can replace electricity from fossil fuels and so gives the product ‘carbon credit’, a contribution towards a negative carbon footprint. This phenomenon is known as the substitution approach in consequential modelling.2 For a complete scienti�c analysis, see Vogtländer at al. (2014).
2 See Section 14.5 of the ILCD Handbook (ECJRC 2010).
Note: the text in this chapter is largely taken from Section 4 of Vogtländer et al. (2014)
2.Scientific background of the LCA and the CO2 cycle
Carbon sequestration can be included in an LCA if the bamboo is burned for electricity or heat. The positive e�ect of temporary carbon storage in durable products cannot be analysed on the basis of a single product, although an attempt to do so has been made in two important LCA systems – the ILCD Handbook (EC-JRC 2010) and the PAS 2050:2011 Speci�cation (BSI 2011) – by providing a credit for the temporary storage of carbon in bio-based products. However, this method results in an overestimation of the bene�ts of temporary �xation of biogenic CO2 and should therefore be avoided (Vogtländer et al. 2014).
The effects of carbon sequestration at the global system level
CO2 is stored in vegetation, in the ocean and in products (e.g. buildings and furniture). The details of global carbon mass balances are very complex; however, understanding the basics of the LCA allocation method used in this report requires starting from the highest possible aggregation level (the so-called Tier 1 and Tier 2 approach of the Intergovernmental Panel on Climate Change - IPCC). Using this approach, we look at vast forest areas (e.g. in Scandinavia, the Baltic countries, European Russia, Siberia, Canada, New Zealand), where there is a continuous rotation of the forests. The local carbon sequestration e�ects caused by harvesting are levelled out within such regions, since only a small proportion of the trees are harvested each year.
Figure 3 provides a simpli�ed schematic overview of this level of the global carbon cycle.
Figure 2: The CO2 cycle on a product level
Production
Bamboo MOSO Waste
UseBamboo
plantation End of life Electricity
Captured CO2
CO2
Figure 3: Global anthropogenic fluxes of CO2 (Gt/year) over the period 2000–2010
Ocean Combustion offossil fuels
Forests
0.8 Gt/year 2.2 Gt/year1.9 Gt/year 6.4 Gt/year
The use of bamboo for outdoor applications is increasing in Europe and North America
CO2
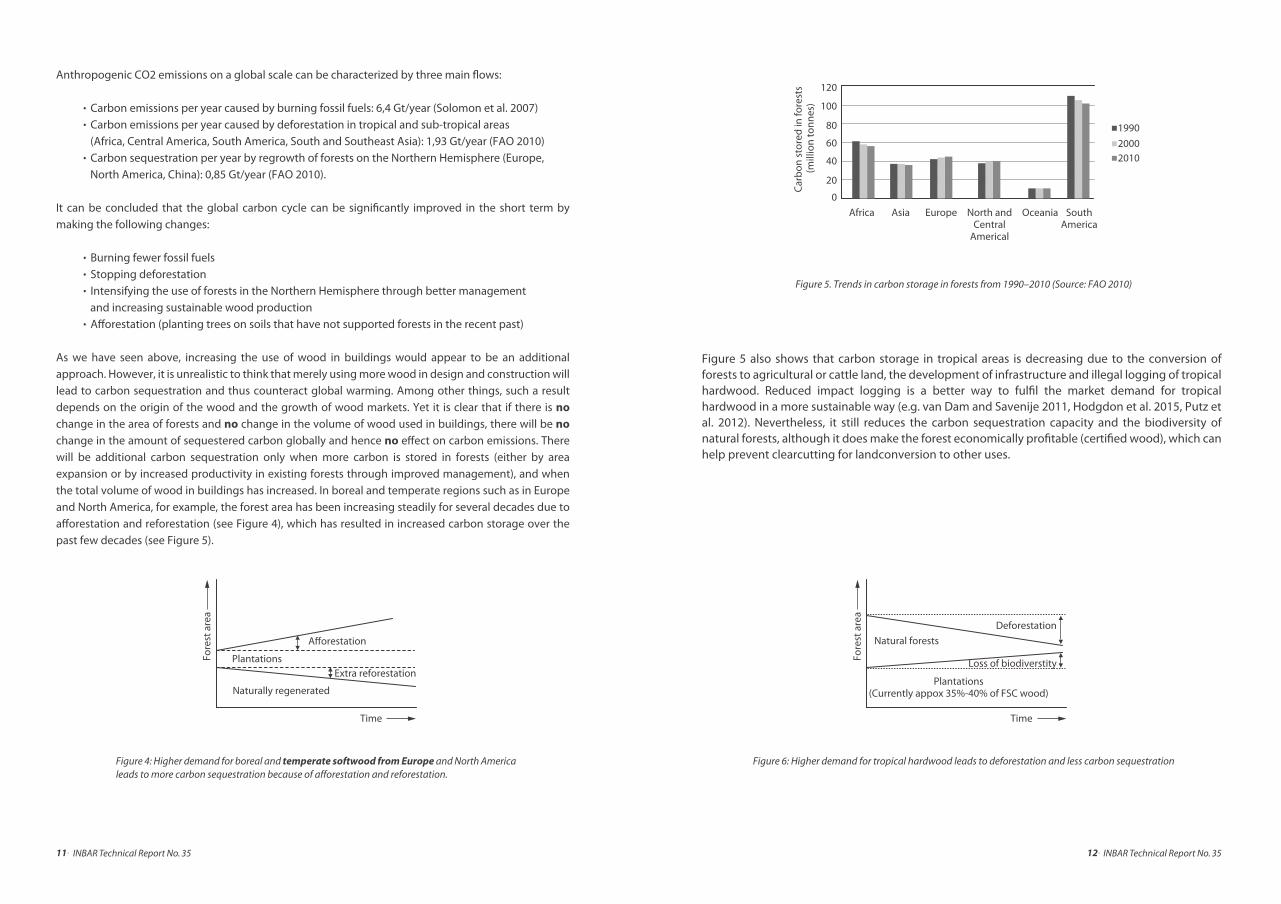
Figure 5 also shows that carbon storage in tropical areas is decreasing due to the conversion of forests to agricultural or cattle land, the development of infrastructure and illegal logging of tropical hardwood. Reduced impact logging is a better way to ful�l the market demand for tropical hardwood in a more sustainable way (e.g. van Dam and Savenije 2011, Hodgdon et al. 2015, Putz et al. 2012). Nevertheless, it still reduces the carbon sequestration capacity and the biodiversity of natural forests, although it does make the forest economically pro�table (certi�ed wood), which can help prevent clearcutting for landconversion to other uses.
Anthropogenic CO2 emissions on a global scale can be characterized by three main �ows:
. Carbon emissions per year caused by burning fossil fuels: 6,4 Gt/year (Solomon et al. 2007)
. Carbon emissions per year caused by deforestation in tropical and sub-tropical areas (Africa, Central America, South America, South and Southeast Asia): 1,93 Gt/year (FAO 2010). Carbon sequestration per year by regrowth of forests on the Northern Hemisphere (Europe, North America, China): 0,85 Gt/year (FAO 2010).
It can be concluded that the global carbon cycle can be signi�cantly improved in the short term by making the following changes:
. Burning fewer fossil fuels
. Stopping deforestation
. Intensifying the use of forests in the Northern Hemisphere through better management and increasing sustainable wood production. A�orestation (planting trees on soils that have not supported forests in the recent past)
As we have seen above, increasing the use of wood in buildings would appear to be an additional approach. However, it is unrealistic to think that merely using more wood in design and construction will lead to carbon sequestration and thus counteract global warming. Among other things, such a result depends on the origin of the wood and the growth of wood markets. Yet it is clear that if there is no change in the area of forests and no change in the volume of wood used in buildings, there will be no change in the amount of sequestered carbon globally and hence no e�ect on carbon emissions. There will be additional carbon sequestration only when more carbon is stored in forests (either by area expansion or by increased productivity in existing forests through improved management), and when the total volume of wood in buildings has increased. In boreal and temperate regions such as in Europe and North America, for example, the forest area has been increasing steadily for several decades due to a�orestation and reforestation (see Figure 4), which has resulted in increased carbon storage over the past few decades (see Figure 5).
12. INBAR Technical Report No. 3511. INBAR Technical Report No. 35
Figure 6: Higher demand for tropical hardwood leads to deforestation and less carbon sequestration
Figure 5. Trends in carbon storage in forests from 1990–2010 (Source: FAO 2010)
Figure 4: Higher demand for boreal and temperate softwood from Europe and North America leads to more carbon sequestration because of afforestation and reforestation.
A�orestation
Plantations
Naturally regenerated
Extra reforestation
Fore
st a
rea
Time
120
100
80
60
40
20
0
Carb
on s
tore
d in
fore
sts
(mill
ion
tonn
es)
199020002010
OceaniaEuropeAsiaAfrica SouthAmerica
North andCentral
Americal
Natural forests
Plantations(Currently appox 35%-40% of FSC wood)
Fore
st a
rea
Time
Deforestation
Loss of biodiverstity
14. INBAR Technical Report No. 3513. INBAR Technical Report No. 35
Carbon sequestration by wood in houses and o�ces is slowly rising globally due to population growth. This additional carbon sequestration, however, is low in comparison with the volume of biomass in the forests: less than 30% of the carbon above the ground ends up in housing (see Section 5, Step 1 and Step 4 in Vogtländer et al [2014]) and for bamboo this di�erence is even greater. See also Chapter 5 of this report.
Another key issue is that carbon sequestration does not increase per house that is built, but per extra house that is built beyond the number of houses required to replace discarded dwellings. This point is often overlooked by LCA practitioners when studying carbon sequestration at the product level during the LCI (Life-Cycle Inventory, i.e., analysis of all input and output �ows in the product system) phase of the assessment. This leads us to the conclusion that as a result of market growth, carbon sequestration is enhanced when more boreal or temperate softwood from Europe and North America is applied in buildings, since more carbon is sequestered in the forests as well as in buildings. This has implications for bamboo as well. Creating additional demand for bamboo would have an e�ect on carbon sequestration that is similar to that of European and North American wood, leading to better forest management and an increase in bamboo forest area (Lou Yiping et al. 2010).In chapter 5 it is explained that the carbon sequestration e�ect of bamboo is mainly caused by the increase of plantations, rather than by the increase of bamboo products (e.g. bamboo in buildings).
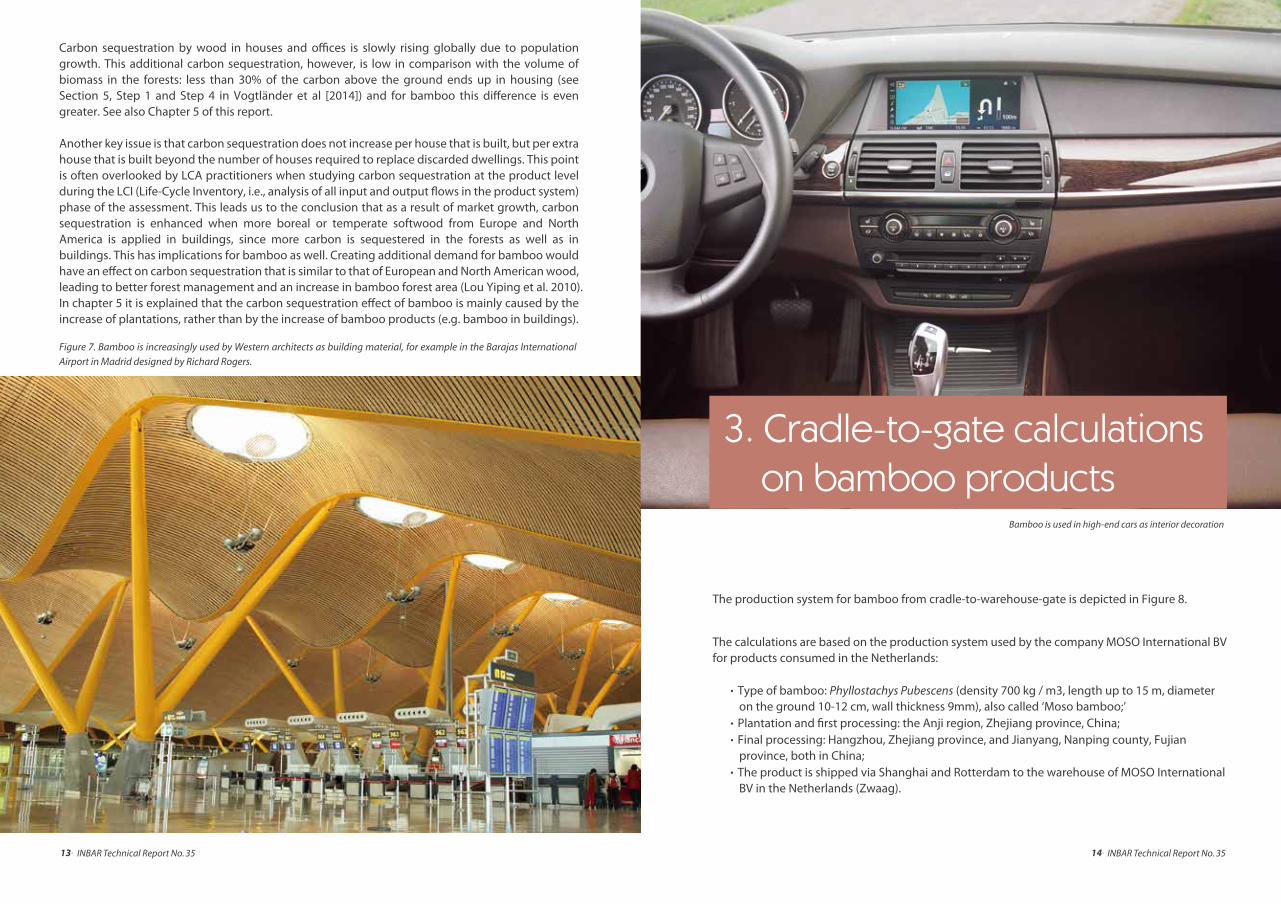
Figure 7. Bamboo is increasingly used by Western architects as building material, for example in the Barajas International
Airport in Madrid designed by Richard Rogers.
3. Cradle-to-gate calculations on bamboo products
The production system for bamboo from cradle-to-warehouse-gate is depicted in Figure 8.
The calculations are based on the production system used by the company MOSO International BV for products consumed in the Netherlands:
. Type of bamboo: Phyllostachys Pubescens (density 700 kg / m3, length up to 15 m, diameter on the ground 10-12 cm, wall thickness 9mm), also called ‘Moso bamboo;’
. Plantation and �rst processing: the Anji region, Zhejiang province, China;
. Final processing: Hangzhou, Zhejiang province, and Jianyang, Nanping county, Fujian province, both in China;
. The product is shipped via Shanghai and Rotterdam to the warehouse of MOSO International BV in the Netherlands (Zwaag).
Bamboo is used in high-end cars as interior decoration
16. INBAR Technical Report No. 3515. INBAR Technical Report No. 35
3 Note: a cogeneration plant for electricity and heat is an opportunity for the future that could reduce the carbon footprint even further.
The three production technologies are further explained below and the LCI is provided for each production technology.
A more comprehensive description of the production processes and tables for the other product varieties can be found in van der Lugt (2008) and van der Lugt et al. (2009a, 2009b). The total scores (carbon footprint as well as eco-costs) of the various industrial bamboo products are provided in Chapter 6.
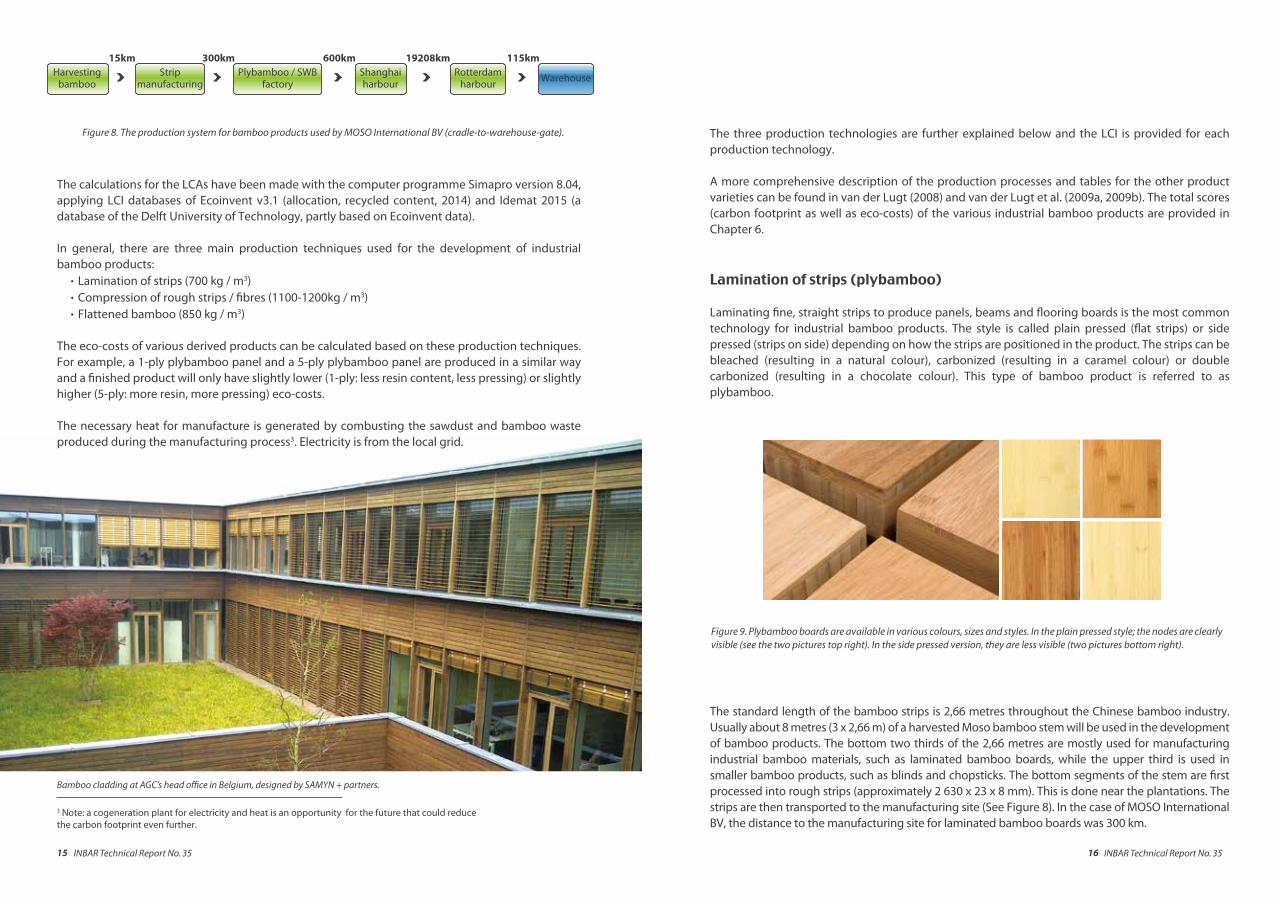
Lamination of strips (plybamboo)
Laminating �ne, straight strips to produce panels, beams and �ooring boards is the most common technology for industrial bamboo products. The style is called plain pressed (�at strips) or side pressed (strips on side) depending on how the strips are positioned in the product. The strips can be bleached (resulting in a natural colour), carbonized (resulting in a caramel colour) or double carbonized (resulting in a chocolate colour). This type of bamboo product is referred to as plybamboo.
The standard length of the bamboo strips is 2,66 metres throughout the Chinese bamboo industry. Usually about 8 metres (3 x 2,66 m) of a harvested Moso bamboo stem will be used in the development of bamboo products. The bottom two thirds of the 2,66 metres are mostly used for manufacturing industrial bamboo materials, such as laminated bamboo boards, while the upper third is used in smaller bamboo products, such as blinds and chopsticks. The bottom segments of the stem are �rst processed into rough strips (approximately 2 630 x 23 x 8 mm). This is done near the plantations. The strips are then transported to the manufacturing site (See Figure 8). In the case of MOSO International BV, the distance to the manufacturing site for laminated bamboo boards was 300 km.
Figure 9. Plybamboo boards are available in various colours, sizes and styles. In the plain pressed style; the nodes are clearly visible (see the two pictures top right). In the side pressed version, they are less visible (two pictures bottom right).
The calculations for the LCAs have been made with the computer programme Simapro version 8.04, applying LCI databases of Ecoinvent v3.1 (allocation, recycled content, 2014) and Idemat 2015 (a database of the Delft University of Technology, partly based on Ecoinvent data).
In general, there are three main production techniques used for the development of industrial bamboo products:
. Lamination of strips (700 kg / m3)
. Compression of rough strips / �bres (1100-1200kg / m3)
. Flattened bamboo (850 kg / m3)
The eco-costs of various derived products can be calculated based on these production techniques. For example, a 1-ply plybamboo panel and a 5-ply plybamboo panel are produced in a similar way and a �nished product will only have slightly lower (1-ply: less resin content, less pressing) or slightly higher (5-ply: more resin, more pressing) eco-costs.
The necessary heat for manufacture is generated by combusting the sawdust and bamboo waste produced during the manufacturing process3. Electricity is from the local grid.
15kmHarvesting
bambooStrip
manufacturingShanghaiharbour
300kmPlybamboo / SWB
factory
600km 19208km 115kmRotterdam
harbour Warehouse
Figure 8. The production system for bamboo products used by MOSO International BV (cradle-to-warehouse-gate).
Bamboo cladding at AGC’s head o�ce in Belgium, designed by SAMYN + partners.
18. INBAR Technical Report No. 3517. INBAR Technical Report No. 35
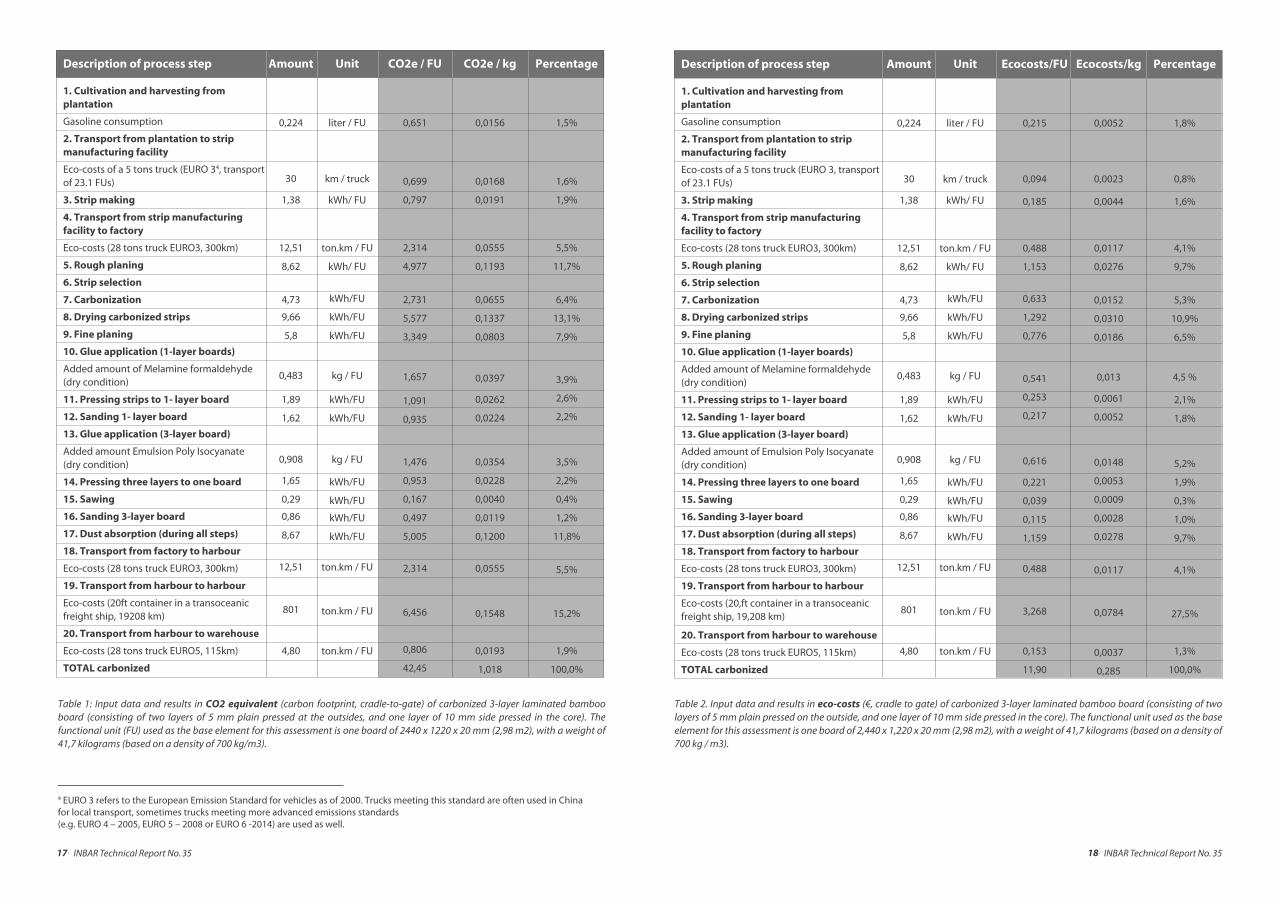
Table 2. Input data and results in eco-costs (€, cradle to gate) of carbonized 3-layer laminated bamboo board (consisting of two layers of 5 mm plain pressed on the outside, and one layer of 10 mm side pressed in the core). The functional unit used as the base element for this assessment is one board of 2,440 x 1,220 x 20 mm (2,98 m2), with a weight of 41,7 kilograms (based on a density of 700 kg / m3).
4 EURO 3 refers to the European Emission Standard for vehicles as of 2000. Trucks meeting this standard are often used in Chinafor local transport, sometimes trucks meeting more advanced emissions standards (e.g. EURO 4 – 2005, EURO 5 – 2008 or EURO 6 -2014) are used as well.
Table 1: Input data and results in CO2 equivalent (carbon footprint, cradle-to-gate) of carbonized 3-layer laminated bamboo board (consisting of two layers of 5 mm plain pressed at the outsides, and one layer of 10 mm side pressed in the core). The functional unit (FU) used as the base element for this assessment is one board of 2440 x 1220 x 20 mm (2,98 m2), with a weight of 41,7 kilograms (based on a density of 700 kg/m3).
Description of process step
1. Cultivation and harvesting from plantation
Gasoline consumption
2. Transport from plantation to strip manufacturing facility
Eco-costs of a 5 tons truck (EURO 34, transport of 23.1 FUs)
3. Strip making
4. Transport from strip manufacturing facility to factory
Eco-costs (28 tons truck EURO3, 300km)
5. Rough planing
6. Strip selection
7. Carbonization
8. Drying carbonized strips
9. Fine planing
10. Glue application (1-layer boards)
Added amount of Melamine formaldehyde (dry condition)
11. Pressing strips to 1- layer board
12. Sanding 1- layer board
13. Glue application (3-layer board)
Added amount Emulsion Poly Isocyanate (dry condition)
14. Pressing three layers to one board
15. Sawing
16. Sanding 3-layer board
17. Dust absorption (during all steps)
18. Transport from factory to harbour
Eco-costs (28 tons truck EURO3, 300km)
19. Transport from harbour to harbour
Eco-costs (20ft container in a transoceanic freight ship, 19208 km)
20. Transport from harbour to warehouse
Eco-costs (28 tons truck EURO5, 115km)
TOTAL carbonized
Amount
0,224
30
1,38
12,51
8,62
4,73
9,66
5,8
0,483
1,89
1,62
0,908
1,65
0,29
0,86
8,67
12,51
801
4,80
Unit
liter / FU
km / truck
kWh/ FU
ton.km / FU
kWh/ FU
kWh/FU
kWh/FU
kWh/FU
kg / FU
kWh/FU
kWh/FU
kg / FU
kWh/FU
kWh/FU
kWh/FU
kWh/FU
ton.km / FU
ton.km / FU
ton.km / FU
CO2e / FU
0,651
0,699
0,797
2,314
4,977
2,731
5,577
3,349
1,657
1,091
0,935
1,476
0,953
0,167
0,497
5,005
2,314
6,456
0,806
42,45
CO2e / kg
0,0156
0,0168
0,0191
0,0555
0,1193
0,0655
0,1337
0,0803
0,0397
0,0262
0,0224
0,0354
0,0228
0,0040
0,0119
0,1200
0,0555
0,1548
0,0193
1,018
Percentage
1,5%
1,6%
1,9%
5,5%
11,7%
6,4%
13,1%
7,9%
3,9%
2,6%
2,2%
3,5%
2,2%
0,4%
1,2%
11,8%
5,5%
15,2%
1,9%
100,0%
Description of process step
1. Cultivation and harvesting from plantation
Gasoline consumption
2. Transport from plantation to strip manufacturing facility
Eco-costs of a 5 tons truck (EURO 3, transport of 23.1 FUs)
3. Strip making
4. Transport from strip manufacturing facility to factory
Eco-costs (28 tons truck EURO3, 300km)
5. Rough planing
6. Strip selection
7. Carbonization
8. Drying carbonized strips
9. Fine planing
10. Glue application (1-layer boards)
Added amount of Melamine formaldehyde (dry condition)
11. Pressing strips to 1- layer board
12. Sanding 1- layer board
13. Glue application (3-layer board)
Added amount of Emulsion Poly Isocyanate (dry condition)
14. Pressing three layers to one board
15. Sawing
16. Sanding 3-layer board
17. Dust absorption (during all steps)
18. Transport from factory to harbour
Eco-costs (28 tons truck EURO3, 300km)
19. Transport from harbour to harbour
Eco-costs (20,ft container in a transoceanic freight ship, 19,208 km)
20. Transport from harbour to warehouse
Eco-costs (28 tons truck EURO5, 115km)
TOTAL carbonized
Amount
0,224
30
1,38
12,51
8,62
4,73
9,66
5,8
0,483
1,89
1,62
0,908
1,65
0,29
0,86
8,67
12,51
801
4,80
Unit
liter / FU
km / truck
kWh/ FU
ton.km / FU
kWh/ FU
kWh/FU
kWh/FU
kWh/FU
kg / FU
kWh/FU
kWh/FU
kg / FU
kWh/FU
kWh/FU
kWh/FU
kWh/FU
ton.km / FU
ton.km / FU
ton.km / FU
Ecocosts/FU
0,215
0,094
0,185
0,488
1,153
0,633
1,292
0,776
0,541
0,253
0,217
0,616
0,221
0,039
0,115
1,159
0,488
3,268
0,153
11,90
Ecocosts/kg
0,0052
0,0023
0,0044
0,0117
0,0276
0,0152
0,0310
0,0186
0,013
0,0061
0,0052
0,0148
0,0053
0,0009
0,0028
0,0278
0,0117
0,0784
0,0037
0,285
Percentage
1,8%
0,8%
1,6%
4,1%
9,7%
5,3%
10,9%
6,5%
4,5 %
2,1%
1,8%
5,2%
1,9%
0,3%
1,0%
9,7%
4,1%
27,5%
1,3%
100,0%
20. INBAR Technical Report No. 3519. INBAR Technical Report No. 35
Compression of rough bamboo fibres
A new production technology places rough bamboo strips in resin after which, under strong compression, they are pressed in moulds to form high-density beams and panels. The result is an extremely hard material (Brinell Hardness ≥ 9,5 kg / mm2 following EN 1534) that looks almost identical to tropical hardwood. Because of the hardness, the material is ideally used for top layers of �ooring and panels for tabletops as well as for outdoor decking. A bene�t of this production technology is that bamboo strips of lower quality can be used as inputs. The product is available in natural or caramel colours and is known as ’High Density’ or ’strand woven bamboo.’ A recent innovation thermally modi�es the input strips for outdoor use, and increases the durability to the highest class possible (Class 1, according to EN 350). Due to the higher resin content (6,2% instead of 3,5%) and compression, this product (brandname "Bamboo X-treme") has an even higher density than the regular strand woven bamboo boards (1,200 kg / m3 instead of 1,080 kg / m3). However, because of thermal modi�cation (an energy-intensive process) and the increased resin content, the environmental impact of this product is higher than that of regular strand woven bamboo.
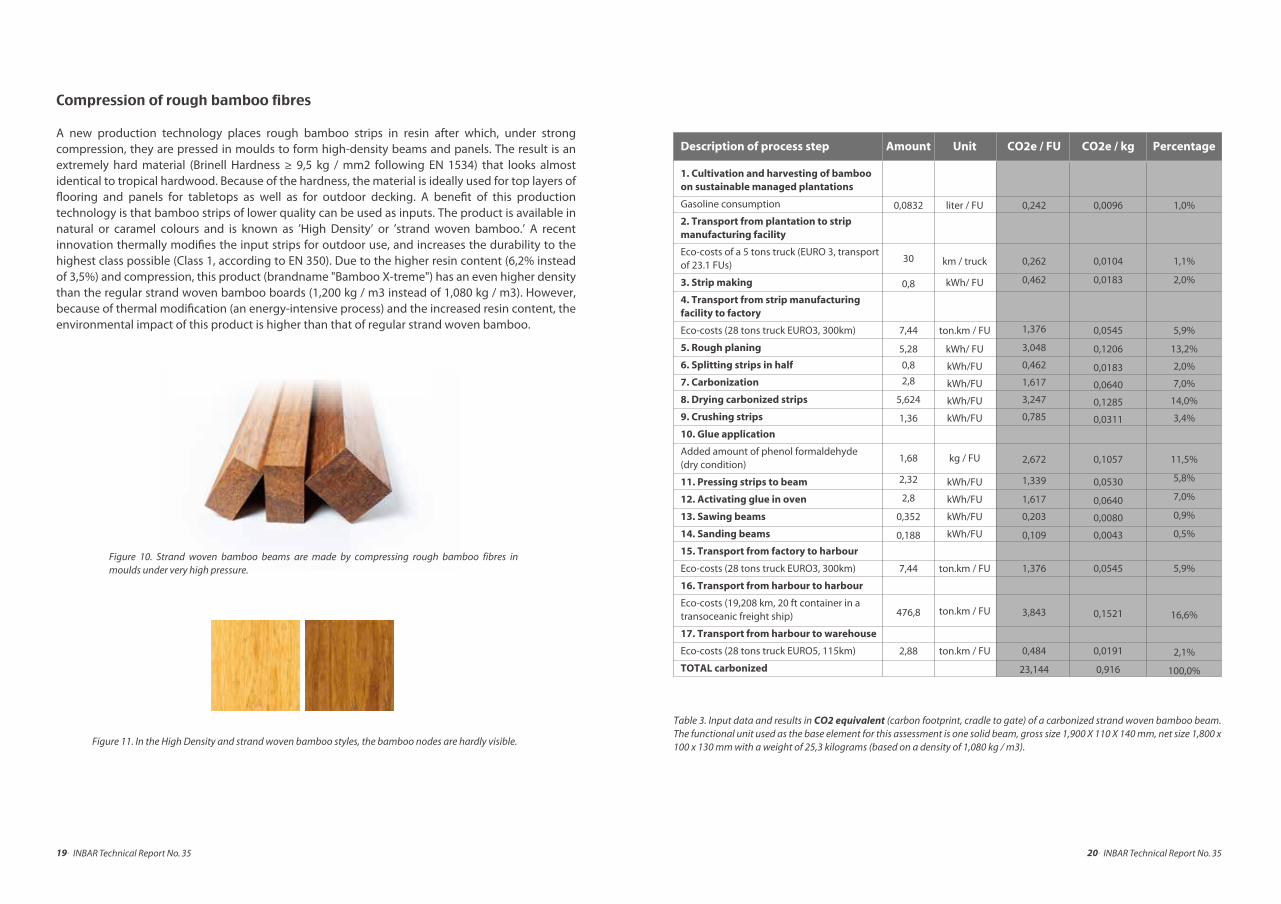
Figure 10. Strand woven bamboo beams are made by compressing rough bamboo fibres in moulds under very high pressure.
Figure 11. In the High Density and strand woven bamboo styles, the bamboo nodes are hardly visible.
Table 3. Input data and results in CO2 equivalent (carbon footprint, cradle to gate) of a carbonized strand woven bamboo beam. The functional unit used as the base element for this assessment is one solid beam, gross size 1,900 X 110 X 140 mm, net size 1,800 x 100 x 130 mm with a weight of 25,3 kilograms (based on a density of 1,080 kg / m3).
Description of process step
1. Cultivation and harvesting of bamboo on sustainable managed plantations
Gasoline consumption
2. Transport from plantation to strip manufacturing facility
Eco-costs of a 5 tons truck (EURO 3, transport of 23.1 FUs)
3. Strip making
4. Transport from strip manufacturing facility to factory
Eco-costs (28 tons truck EURO3, 300km)
5. Rough planing
6. Splitting strips in half
7. Carbonization
8. Drying carbonized strips
9. Crushing strips
10. Glue application
Added amount of phenol formaldehyde (dry condition)
11. Pressing strips to beam
12. Activating glue in oven
13. Sawing beams
14. Sanding beams
15. Transport from factory to harbour
Eco-costs (28 tons truck EURO3, 300km)
16. Transport from harbour to harbour
Eco-costs (19,208 km, 20 ft container in a transoceanic freight ship)
17. Transport from harbour to warehouse
Eco-costs (28 tons truck EURO5, 115km)
TOTAL carbonized
Amount
0,0832
30
0,8
7,44
5,28
0,82,8
5,624
1,36
1,68
2,32
2,8
0,352
0,188
7,44
476,8
2,88
Unit
liter / FU
km / truck
kWh/ FU
ton.km / FU
kWh/ FU
kWh/FU
kWh/FU
kWh/FU
kWh/FU
kg / FU
kWh/FU
kWh/FU
kWh/FU
kWh/FU
ton.km / FU
ton.km / FU
ton.km / FU
CO2e / FU
0,242
0,262
0,462
1,376
3,048
0,462
1,617
3,247
0,785
2,672
1,339
1,617
0,203
0,109
1,376
3,843
0,484
23,144
CO2e / kg
0,0096
0,0104
0,0183
0,0545
0,1206
0,0183
0,0640
0,1285
0,0311
0,1057
0,0530
0,0640
0,0080
0,0043
0,0545
0,1521
0,0191
0,916
Percentage
1,0%
1,1%
2,0%
5,9%
13,2%
2,0%
7,0%
14,0%
3,4%
11,5%
5,8%
7,0%
0,9%
0,5%
5,9%
16,6%
2,1%
100,0%
22. INBAR Technical Report No. 3521. INBAR Technical Report No. 35
Table 4. Input data and results in eco-costs (€, cradle to gate) of a carbonized strand woven bamboo beam. The functional unit used as the base element for this assessment is one solid beam, gross size 1,900 X 110 X 140 mm, net size 1,800 x 100 x 130 mm with a weight of 25,3 kilograms (based on a density of 1,080 kg / m3).
Description of process step
1. Cultivation and harvesting of bamboo on sustainable managed plantations
Gasoline consumption
2. Transport from plantation to strip manufacturing facility
Eco-costs of a 5 tons truck (EURO3, transport of 61,5 FUs)
3. Strip making
4. Transport from strip manufacturing facility to factory
Eco-costs (28 tons truck EURO3, 300km)
5. Rough planing
6. Splitting strips in half
7. Carbonization
8. Drying carbonized strips
9. Crushing strips
10. Glue application
Added amount of Phenol formaldehyde(wet condition)
11. Pressing strips to beam
12. Activating glue in oven
13. Sawing beams
14. Sanding beams
15. Transport from factory to harbour
Eco-costs (28 tons truck EURO3, 300km)
16. Transport from harbour to harbour
Eco-costs (19,208km, 20 ft container in a transoceanic freight ship)
17. Transport from harbour to warehouse
Eco-costs (28 tons truck EURO5, 115km)
TOTAL carbonized
Amount
0,0832
30
0,8
7,44
5,28
0,8
2,8
5,624
1,36
1,68
2,32
2,8
0,352
0,188
7,44
476,8
2,88
Unit
liter / FU
km / truck
kWh/ FU
ton.km / FU
kWh/ FU
kWh/FUkWh/FUkWh/FU
kWh/FU
kg / FU
kWh/FU
kWh/FU
kWh/FU
kWh/FU
ton.km / FU
ton.km / FU
ton.km / FU
Ecocosts/FU
0,08
0,035
0,107
0,290
0,706
0,107
0,374
0,752
0,182
1,074
0,310
0,374
0,047
0,025
0,290
1,945
0,092
6,793
Ecocosts/kg
0,0032
0,0014
0,0042
0,0115
0,0279
0,0042
0,0148
0,0298
0,0072
0,0425
0,0123
0,0148
0,0019
0,0010
0,0115
0,077
0,0036
0,269
Percentage
1,2%
0,5%
1,6%
4,3%
10,4%
1,6%
5,5%
11,1%
2,7%
15,8%
4,6%
5,5%
0,7%
0,4%
4,3%
28,6%
1,4%
100,0%
Flattened bamboo Another recent technology involves cutting the original bamboo stem longitudinally in half and �attening it using a special steam treatment process, after which it can be used to produce �ooring board. As with the strand woven bamboo technology, a larger portion of the bamboo stem can be used as input materials (usually the whole 8m stem). The best �attened segments (2,66m in length) are used as top layer in �ooring boards because of their hardness (Brinell Hardness ≥ 9,5 kg/mm2; EN 1534), whereas lower quality boards (with small visual defects, smaller width) are used as middle or bottom layers of the same 3-ply �ooring board. This production process is more e�cient (a larger part of the input stem can be used; there is less waste) and less glue is required than for plybamboo and strand woven bamboo.
Table 5. Input data and results in CO2 equivalent (carbon footprint, cradle to gate) of a flattened bamboo board. The functional unit used as the base element for this assessment is one 3-ply flooring board, 1210x125x18 mm with a weight of 1,819 kilograms.
Description of process step
1. Cultivation and harvesting from sustainably managed plantation
Gasoline consumption
2. Transport from plantation to factory
Eco-costs of a 5 tons truck (EURO3, transport of 780 FUs)
3. Cutting stem segments longitudinallyin half
4. Removing internal parts of the stem
5. Removing outside parts of the stem
6. Shortening
7. Softening – vapour treatment
8. Flattening boards
9. Finalizing shape - press
10. Surface planing (2 sides)
11. Drying flat boards
12. Cutting to final width
13a. Glue application
Added amount Emulsion Poly Isocyanate (dry condition)
13b. Pressing three layers to one board
14. Balancing (climate chamber)
15. Cutting to final length
16. Transport from factory to harbour
Eco-costs (28 tons truck EURO3, 300km)
17. Transport from harbour to harbour
Eco-costs (20ft container in a transoceanic freight ship, 19,208 km)
18. Transport from harbour to warehouse
Eco-costs (28 tons truck EURO5, 115km)
TOTAL
Amount
0,006
120
0,0066
0,079
0,0260,006
0,0130,063
0,079
0,070
0,459
0,0258
0,023
0,1170,027
0,0158
0,546
35
0,21
Unit
liter / FU
km / truck
kWh/ FU
kWh/ FU
kWh/ FU
kWh/FU
kWh/FU
kWh/FU
kWh/FU
kWh/ FU
kWh/FU
kWh/FU
kg / FU
kWh/FU
kWh/FU
kWh/FU
ton.km / FU
ton.km / FU
ton.km / FU
CO2e / FU
0,016
0,087
0,004
0,045
0,015
0,004
0,007
0,036
0,045
0,041
0,265
0,015
0,037
0,067
0,015
0,009
0,101
0,282
0,035
1,13
CO2e / kg
0,0090
0,0478
0,0021
0,0250
0,0083
0,0020
0,0040
0,0200
0,0250
0,0223
0,1457
0,0082
0,0206
0,0370
0,0085
0,0050
0,0555
0,1548
0,0193
0,620
Percentage
1,5%
7,7%
0,3%
4,0%
1,3%
0,3%
0,6%
3,2%
4,0%
3,6%
23,5%
1,3%
3,3%
6,0%
1,4%
0,8%
8,9%
25,0%
3,1%
100,0%
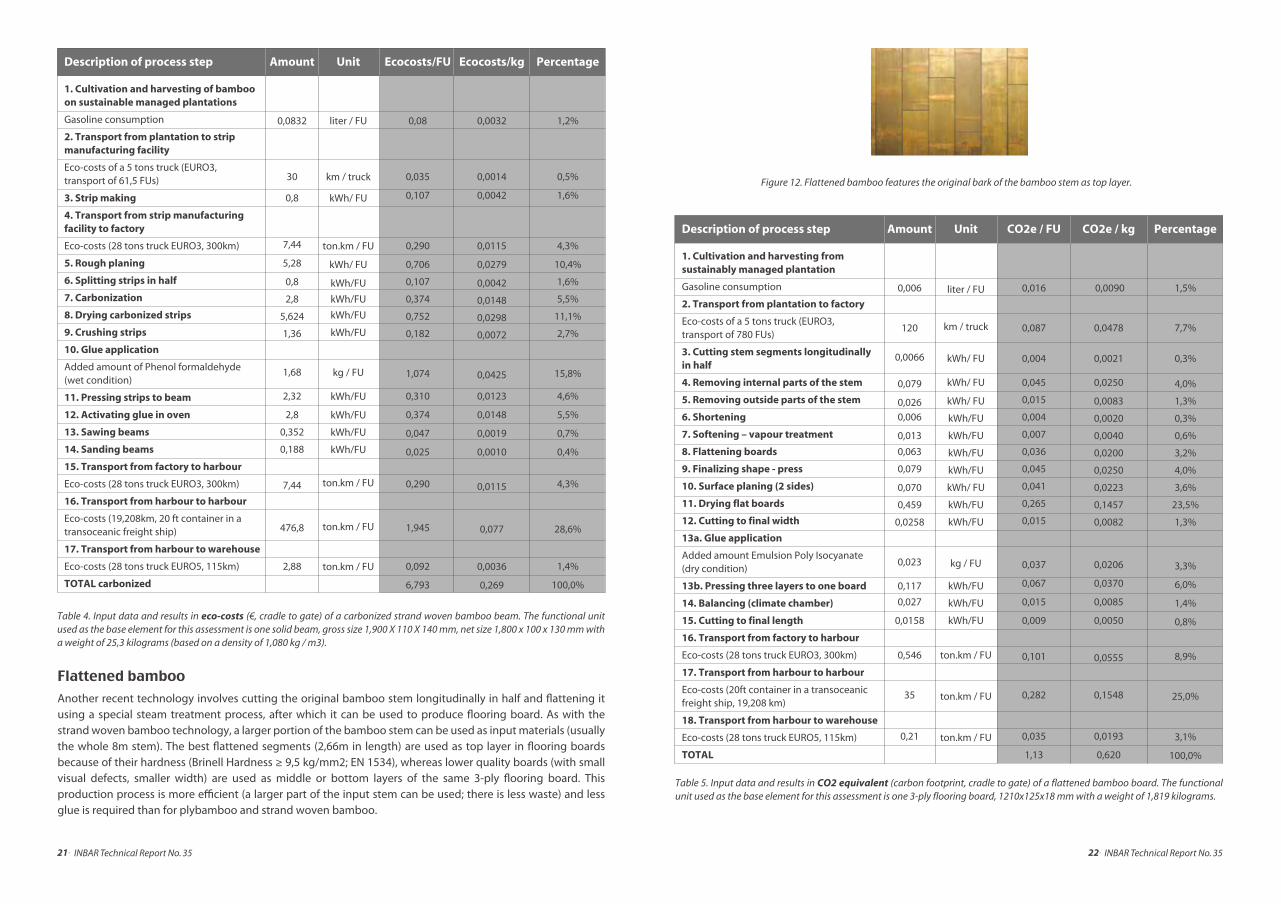
Figure 12. Flattened bamboo features the original bark of the bamboo stem as top layer.
24. INBAR Technical Report No. 3523. INBAR Technical Report No. 35
Table 6. Input data and results in eco-costs (€, cradle to gate) of a flattened bamboo board. The functional unit used as the base element for this assessment is one 3-ply flooring board, 1,210x125x18 mm with a weight of 1,819 kilograms.
Description of process step
1. Cultivation and harvesting from sustainably managed plantation
Gasoline consumption
2. Transport from plantation to factory
Eco-costs of a 5 tons truck (EURO3, transport of 780 FUs)
3. Cutting stem segmentslongitudinally in half
4. Removing internal parts of the stem
5. Removing outside parts of the stem
6. Shortening
7. Softening – vapour treatment
8. Flattening boards
9. Finalizing shape - press
10. Surface planing (2 sides)
11. Drying flat boards
12. Cutting to final width
13a. Glue application
Added amount Emulsion Poly Isocyanate (dry condition)
13b. Pressing three layers to one board
14. Balancing (climate chamber)
15. Cutting to final length
16. Transport from factory to harbour
Eco-costs (28 tons truck EURO3, 300km)
17. Transport from harbour to harbour
Eco-costs (20 ft container in a transoceanic freight ship, 19,208 km)
18. Transport from harbour to warehouse
Eco-costs (28 tons truck EURO5, 115km)
TOTAL
Amount
0,006
120
0,0066
0,079
0,026
0,006
0,013
0,063
0,079
0,070
0,459
0,0258
0,023
0,117
0,027
0,0158
0,546
35
0,21
Unit
liter / FU
km / truck
kWh/ FU
kWh/ FU
kWh/ FU
kWh/FU
kWh/FU
kWh/FU
kWh/FU
kWh/ FU
kWh/FU
kWh/FU
kg / FU
kWh/FU
kWh/FU
kWh/FU
ton.km / FU
ton.km / FU
ton.km / FU
Ecocosts/FU
0,005
0,054
0,001
0,011
0,004
0,001
0,002
0,008
0,011
0,009
0,061
0,003
0,016
0,016
0,004
0,002
0,021
0,143
0,007
0,38
Ecocosts/kg
0,0030
0,0300
0,0005
0,0058
0,0019
0,0005
0,0009
0,0046
0,0058
0,0052
0,0337
0,0019
0,0086
0,0086
0,0020
0,0012
0,0117
0,0784
0,0037
0,208
Percentage
1,4%
14,4%
0,2%
2,8%
0,9%
0,2%
0,4%
2,2%
2,8%
2,5%
16,2%
0,9%
4,1%
4,1%
0,9%
0,6%
5,6%
37,7%
1,8%
100,0%
As explained in Chapter 2, a credit can be earned for avoided fossil fuels if the bamboo (or any other bioproduct such as wood) is burned for electricity or heat.
In many Western European countries, the large majority of wood and bamboo products waste ends up in electrical power plants. Although the e�ciency of a modern coal-�red electrical power plant is higher, i.e. 45% (IEA 2007), the current practice is to combust the biomass in smaller electrical power plants specializing with an approximately 30% lower e�ciency than the large coal plants. It is estimated that just 10% of the material perishes in land�lls. The end-of-life credit for electricity production from bamboo waste is (data from the Idemat database: Idemat2015 Hardwood 12% MC, bamboo, cork, combustion in small electric power plant):
. Carbon footprint: 0,779 kg CO2 per kg of bamboo waste;
. Eco-costs: 0,145 € per kg of bamboo waste.
In this report we assume that 90% of bamboo products will eventually be combusted for the production of electricity and/or heat, leading to a credit of:
. Carbon footprint: 0,779 x 0,9 = 0,70 kg CO2 per kg of bamboo product (MC 12%);
. Eco-costs: 0,145 x 0,9 = 0,131 euro eco-costs per kg of bamboo product (MC 12%).
Although the above scores are according to the formal LCA (ISO 14040 and 14044) and the European LCA manual (EC-JRC 2010), the e�ects of the carbon sequestration at the global level must be taken into account before the �nal result can be calculated. This is treated in the next two chapters.
4. End-of-life calculations on bamboo products
26. INBAR Technical Report No. 3525. INBAR Technical Report No. 35
The calculation of carbon sequestration resulting from land-use change and additional use of bamboo products in the building industry involves �ve steps (the calculation updates the data in Vogtländer et al. [2014]:
1. Calculating the ratio of carbon stored in forests to carbon stored in end products (plybamboo, strand woven bamboo, �attened bamboo). This step complies with the baseline LCA
2. Calculating a land-use change correction factor to re�ect the fact that another type of biomass existed in the area before it was changed to forests / plantations. This step complies with the IPCC standards.
3. Calculating the additional stored carbon in forests and plantations (see Figure 4 in Chapter 2) due to the growth of bamboo production and its allocation to the end products. This step is more realistic than assigning credits for temporary carbon storage as described in PAS 2050 and the ILCD handbook. For more details, see Vogtländer et al. (2014).
4. Calculating the additional stored carbon in the building industry.5. Calculating the total result of carbon sequestration requires the multiplication of the results of
Steps 1, 2, 3 plus the result of Step 4.
Detailed calculations are provided below for the Chinese bamboo production system. The calculations relate to carbon sequestration in industrial bamboo products from cradle to grave. The geographical system boundary is China, as de�ned by FAO (2010).
5. Calculation of carbon sequestration in forests and buildings
Step 1. Calculating the carbon ratio
An end product generally derives from a larger amount of biomass than is contained in its �nal weight. One kg of bamboo equates to about 0,42 kg of bamboo in the end product see also annex. The amounts vary for di�erent bamboo products:
. 0,42 kg d.m. of bamboo, is used in 0,425 kg d.m. �attened bamboo (the resin content is on average approx 1,3 % of the weight of �attened bamboo), 0,431 kg d.m. plybamboo (the resin content is on average approx 2,5 % of the weight of plybamboo),0,435 kg d.m. Strand Woven Bamboo - SWB (the resin content is 3,5 % of the weight of SWB) and for thermally modi�ed “outdoor” SWB 0,446 kg d.m. (the resin content is on average approx 6,2% of the weight of outdoor SWB).
. One kg d.m. of �attened bamboo originates from 1/0,425=2,35 kg dry matter above-ground biomass on the bamboo plantation. One kg d.m. of plybamboo originates from 1/0,431=2,32 kg d.m. above- ground biomass. One kg d.m. indoor strand woven bamboo originates from 1/0.435=2,30 kg d.m. above-ground biomass and one kg outdoor strand woven bamboo originates from 1/0,446=2,24 kg above ground biomass.
. The carbon content of bamboo is 0,5 kg C per kg (Aalde et al. 2006, Verchot et al. 2006). With a molar weight ratio of 3,67 for CO2 versus C, this leads to the following carbon storage on the plantation related to above ground biomass: one kg d.m. �attened bamboo is equivalent to storage of 2,35×0,5x3,67= 4,31 kg CO2; one kg d.m. plybamboo is equivalent to storage of 2,32×0,5x3,67=4,25 kg CO2; one kg d.m. indoor SWB is equivalent to storage of 2,30×0,50x3,67=4,22 kg CO2; and one kg d.m. of outdoor SWB equals storage of 2,24 x0.5x3,67 = 4,11 kg CO2.
These numbers only concern the above ground biomass involved in the �nal bamboo product. However, for bamboo the most important aspect of carbon storage is underground because of the extensive root system and carbon captured in the soil layer, with a ecosystem - stem ratio of 3.15. This number is somewhat conservative compared with various recent studies found in Lou Yiping et al. (2010), see footnote.
The additional CO2 stored underground that is related to bamboo products on the market should also be taken into account, with the �nal result that
. One kg d.m. �attened bamboo is related to 4,31x3,1=13,37 kg CO2 storage in the bamboo ecosystem;
. One kg d.m. plybamboo is related to 4,25x3,1=13,21 kg CO2 storage in the bamboo ecosystem;
. One kg d.m. indoor strand woven bamboo is related to 4,22x3,1=13,09 kg CO2 storage in the bamboo ecosystem for the outdoor strand woven bamboo version, this is 4,11x3,1 = 12,75 kg CO2 storage in the bamboo ecosystem.
5 Besides in the trunks, branches and shrubs, there is CO2 stored below ground in the soil and roots of a plantation. Zhou and Jiang (2004) found that, for a medium intensity-managed Moso bamboo plantation in Lin’an, Zhejiang province, the distribution of biomass above ground versus below ground is 32,2% and 68,8% respectively. Furthermore, Lou Yiping et al (2010) reported the following “Moso bamboo forest ecosystem carbon storage capacity was reported to be between 102 t C/ha and 289 t C/ha, of which 19-33% was stored within the bamboo culms and vegetative layer and 67-81% stored within the soil layer (rhizomes, roots and soil carbon)."
28. INBAR Technical Report No. 35
The calculation
. Grassland: Total above-ground and below-ground non-woody biomass is 7,5 tonnes d.m./ ha (it ranges from 6,5 to 8,5) with a carbon content of 47% (Verchot et al. 2006).
. The biomass on bamboo plantations is 35,8 x 3,1 = 111 tonnes7 d.m./ ha for biomass above and below the ground (Van der Lugt 2009a&b, Zhou and Jiang 2004) with a carbon content of 50%.
. The land-use change correction factor for a�orestation is therefore: [(111 x 0,50) – (7,5 x 0,47)] / (111 x 0,50) = 0,936
Much of the additional Chinese bamboo production in the past has resulted from better management of existing bamboo forests (Lou Yiping et al. 2010). In that case, the land-use change correction factor is 1 for additional bamboo production.
Note that in the case of converted shrubland (according to Aalde et al. [2006] the above ground biomass is 60 tons d.m. for tropical shrubland in continental Asia with root-shoot ratio of 0,4 and carbon content of 46%) to bamboo plantation the land-use change correction factor is [(111 x 0,50) – (84 x 0,46)] / (111 x 0,50) = 0,30
Step 3. Calculating the additional stored carbon in forests and its allocation.
According to van der Lugt and Lobovikov (2008), the annual growth of the market for industrial bamboo products in EU and China ranges between 17% and 25%. However, the establishment of new plantations does not always follow increase in market demand directly but is delayed. This phenomenon was highlighted in the 7th Chinese National Forestry Inventory (State Forestry Administration of P.R. China 2010) where it was shown that the area of bamboo resources in China in 2004-2008 grew from 4,84 million ha to 5,38 million ha in 2008, thus experiencing a growth of 11,18% in 5 years with an average annual growth of 2,24%. The growth of tree forest area in China is at a similar level (11,74%) with a growth of 174,91 million ha to 195,45 million ha during the same period (2004-2008).
More recent �gures (2013) from China’s State Forestry Administration indicate that the growth of bamboo forests and plantations in China has accelerated in recent years, with a growth from 5,38 million ha in 2008 to 6,73 million ha in 2011; this corresponds to an annual growth of 8,36%. Based on a conservative approach, the calculations in this report are based on an average bamboo coverage growth from 2004 – 2011, which corresponds to an annual growth of 5,548.
Given the high GDP growth of the Chinese economy over this period (approximately 7.5%), a 5% increase in new bamboo production seems to be a safe estimation for calculating the additional stored carbon in new bamboo plantations. The related annual growth in carbon storage on plantations is allocated to the total production of bamboo products: for every kg of bamboo, 0,05 kg relates to the new plantations needed to cope with market growth, which adds to the global carbon sequestration accordingly.
7 Note that Lou Yiping et al (2010) have reported considerably higher outputs (101.6-288.5 tC/ha), see also Footnote 5.8 It must be mentioned here that this growth does not always require extra agricultural land. Much of the bamboo production in the past has come from better forest management (Lou Yiping et al. 2010). in fact, one of the short term goals (2011-2015) of the national bamboo development plan is to improve the quality (and therefore yield) of existing 1,9 mio forests (INBAR 2014). Moreover, due to the extensive root system, bamboo is planted in areas where farming is not feasible, e.g., on slopes for erosion prevention and for rehabilitating degraded land and re-establishing functioning and productive ecosystems by improving soil quality and restoring the water table (Kuehl and Lou Yping 2011).
Step 2. Calculating the land-use change correction factor.
The second step in the calculation relates to the fact that before a�orestation, the land had also stored biomass. In this case, the Tier 2 Gain-Loss Method (Verchot et al. 2006) of the IPCC is used to compare the steady state before and after the land use change.
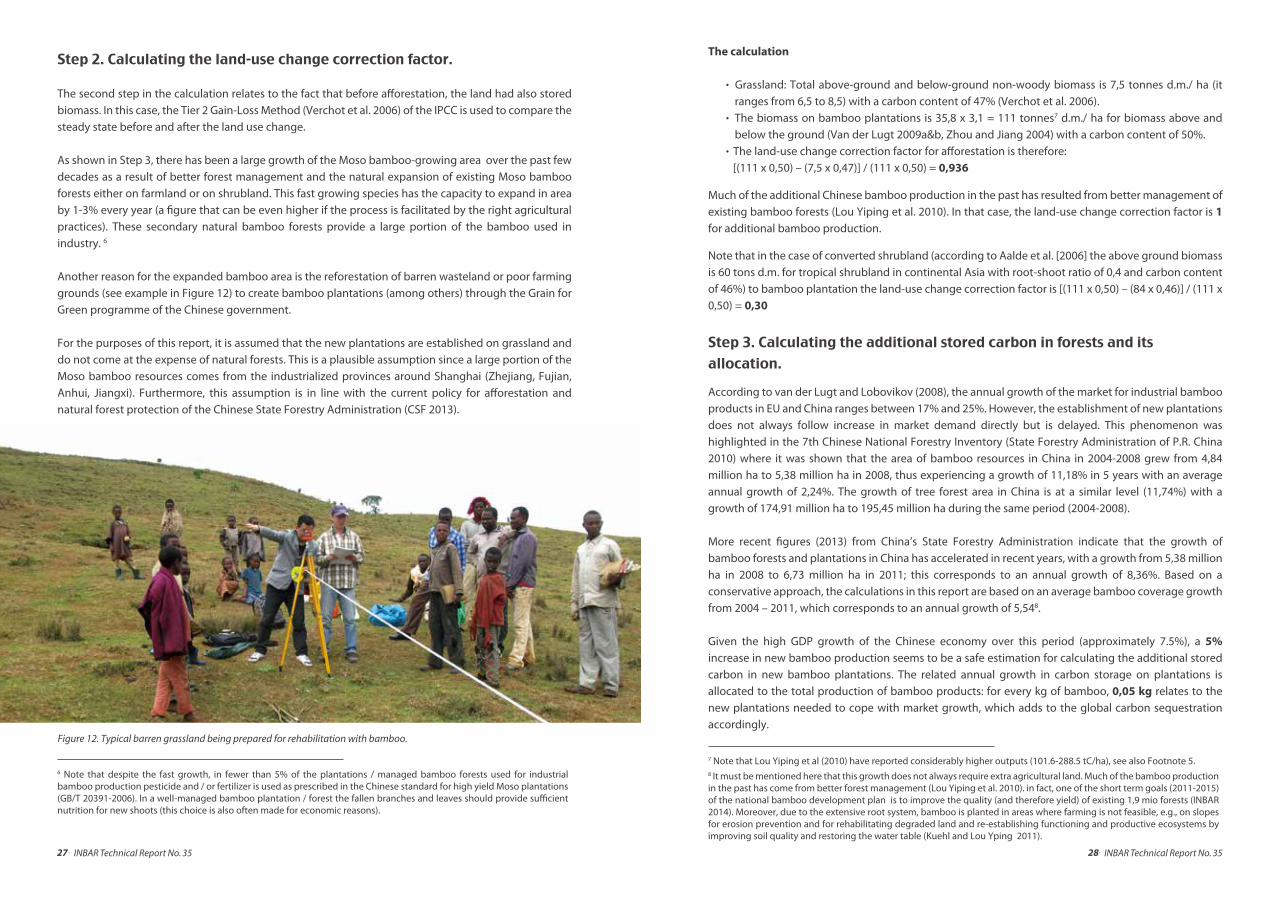
As shown in Step 3, there has been a large growth of the Moso bamboo-growing area over the past few decades as a result of better forest management and the natural expansion of existing Moso bamboo forests either on farmland or on shrubland. This fast growing species has the capacity to expand in area by 1-3% every year (a �gure that can be even higher if the process is facilitated by the right agricultural practices). These secondary natural bamboo forests provide a large portion of the bamboo used in industry. 6
Another reason for the expanded bamboo area is the reforestation of barren wasteland or poor farming grounds (see example in Figure 12) to create bamboo plantations (among others) through the Grain for Green programme of the Chinese government.
For the purposes of this report, it is assumed that the new plantations are established on grassland and do not come at the expense of natural forests. This is a plausible assumption since a large portion of the Moso bamboo resources comes from the industrialized provinces around Shanghai (Zhejiang, Fujian, Anhui, Jiangxi). Furthermore, this assumption is in line with the current policy for a�orestation and natural forest protection of the Chinese State Forestry Administration (CSF 2013).
6 Note that despite the fast growth, in fewer than 5% of the plantations / managed bamboo forests used for industrial bamboo production pesticide and / or fertilizer is used as prescribed in the Chinese standard for high yield Moso plantations (GB/T 20391-2006). In a well-managed bamboo plantation / forest the fallen branches and leaves should provide su�cient nutrition for new shoots (this choice is also often made for economic reasons).
Figure 12. Typical barren grassland being prepared for rehabilitation with bamboo.
27. INBAR Technical Report No. 35
30. INBAR Technical Report No. 3529. INBAR Technical Report No. 35
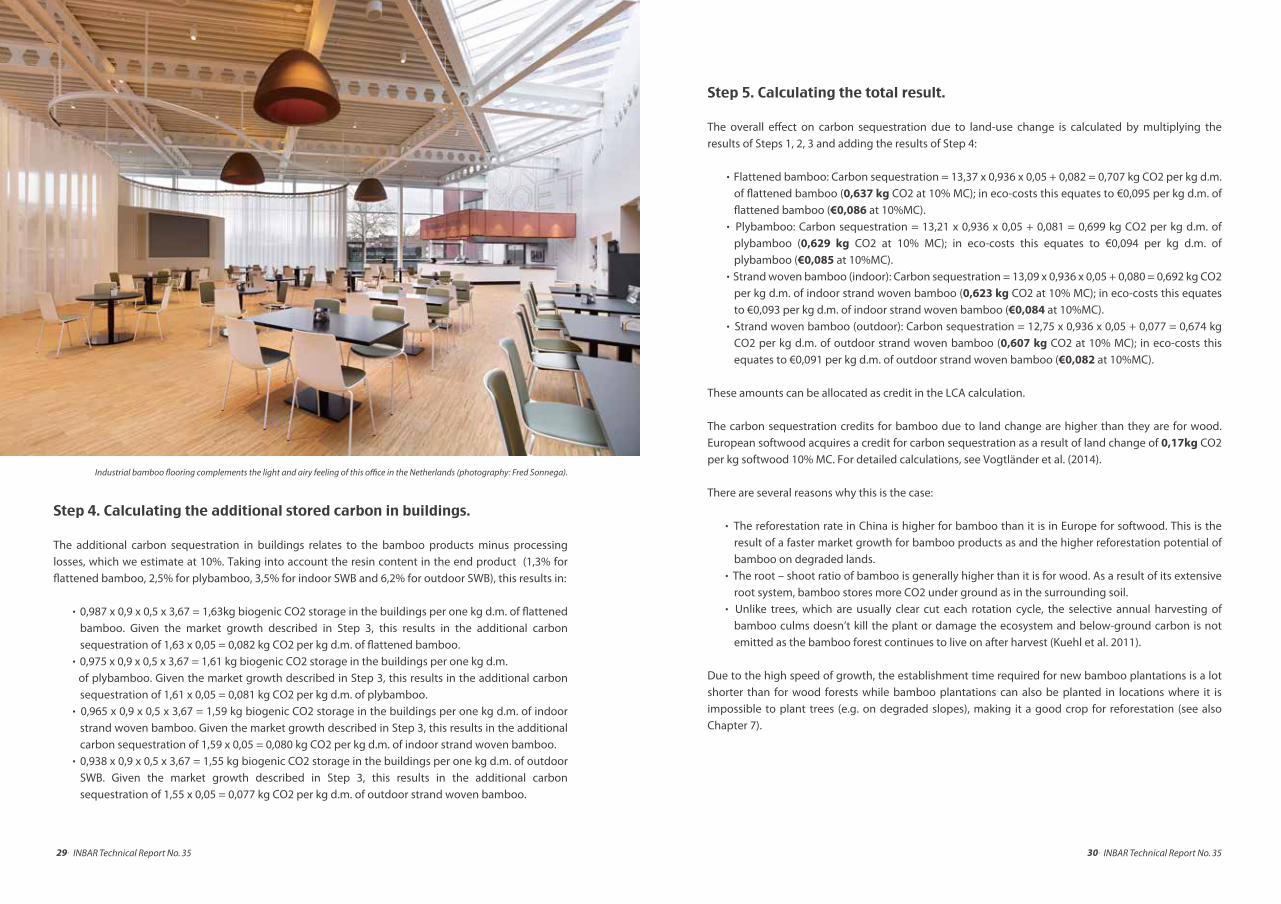
Step 4. Calculating the additional stored carbon in buildings.
The additional carbon sequestration in buildings relates to the bamboo products minus processing losses, which we estimate at 10%. Taking into account the resin content in the end product (1,3% for �attened bamboo, 2,5% for plybamboo, 3,5% for indoor SWB and 6,2% for outdoor SWB), this results in:
. 0,987 x 0,9 x 0,5 x 3,67 = 1,63kg biogenic CO2 storage in the buildings per one kg d.m. of �attened bamboo. Given the market growth described in Step 3, this results in the additional carbon sequestration of 1,63 x 0,05 = 0,082 kg CO2 per kg d.m. of �attened bamboo.
. 0,975 x 0,9 x 0,5 x 3,67 = 1,61 kg biogenic CO2 storage in the buildings per one kg d.m. of plybamboo. Given the market growth described in Step 3, this results in the additional carbon
sequestration of 1,61 x 0,05 = 0,081 kg CO2 per kg d.m. of plybamboo.. 0,965 x 0,9 x 0,5 x 3,67 = 1,59 kg biogenic CO2 storage in the buildings per one kg d.m. of indoor
strand woven bamboo. Given the market growth described in Step 3, this results in the additional carbon sequestration of 1,59 x 0,05 = 0,080 kg CO2 per kg d.m. of indoor strand woven bamboo.
. 0,938 x 0,9 x 0,5 x 3,67 = 1,55 kg biogenic CO2 storage in the buildings per one kg d.m. of outdoor SWB. Given the market growth described in Step 3, this results in the additional carbon sequestration of 1,55 x 0,05 = 0,077 kg CO2 per kg d.m. of outdoor strand woven bamboo.
Step 5. Calculating the total result.
The overall e�ect on carbon sequestration due to land-use change is calculated by multiplying the results of Steps 1, 2, 3 and adding the results of Step 4:
. Flattened bamboo: Carbon sequestration = 13,37 x 0,936 x 0,05 + 0,082 = 0,707 kg CO2 per kg d.m. of �attened bamboo (0,637 kg CO2 at 10% MC); in eco-costs this equates to €0,095 per kg d.m. of �attened bamboo (€0,086 at 10%MC).
. Plybamboo: Carbon sequestration = 13,21 x 0,936 x 0,05 + 0,081 = 0,699 kg CO2 per kg d.m. of plybamboo (0,629 kg CO2 at 10% MC); in eco-costs this equates to €0,094 per kg d.m. of plybamboo (€0,085 at 10%MC).
. Strand woven bamboo (indoor): Carbon sequestration = 13,09 x 0,936 x 0,05 + 0,080 = 0,692 kg CO2 per kg d.m. of indoor strand woven bamboo (0,623 kg CO2 at 10% MC); in eco-costs this equates to €0,093 per kg d.m. of indoor strand woven bamboo (€0,084 at 10%MC).
. Strand woven bamboo (outdoor): Carbon sequestration = 12,75 x 0,936 x 0,05 + 0,077 = 0,674 kg CO2 per kg d.m. of outdoor strand woven bamboo (0,607 kg CO2 at 10% MC); in eco-costs this equates to €0,091 per kg d.m. of outdoor strand woven bamboo (€0,082 at 10%MC).
These amounts can be allocated as credit in the LCA calculation.
The carbon sequestration credits for bamboo due to land change are higher than they are for wood. European softwood acquires a credit for carbon sequestration as a result of land change of 0,17kg CO2 per kg softwood 10% MC. For detailed calculations, see Vogtländer et al. (2014).
There are several reasons why this is the case:
. The reforestation rate in China is higher for bamboo than it is in Europe for softwood. This is the result of a faster market growth for bamboo products as and the higher reforestation potential of bamboo on degraded lands.
. The root – shoot ratio of bamboo is generally higher than it is for wood. As a result of its extensive root system, bamboo stores more CO2 under ground as in the surrounding soil.
. Unlike trees, which are usually clear cut each rotation cycle, the selective annual harvesting of bamboo culms doesn’t kill the plant or damage the ecosystem and below-ground carbon is not emitted as the bamboo forest continues to live on after harvest (Kuehl et al. 2011).
Due to the high speed of growth, the establishment time required for new bamboo plantations is a lot shorter than for wood forests while bamboo plantations can also be planted in locations where it is impossible to plant trees (e.g. on degraded slopes), making it a good crop for reforestation (see also Chapter 7).
Industrial bamboo �ooring complements the light and airy feeling of this o�ce in the Netherlands (photography: Fred Sonnega).
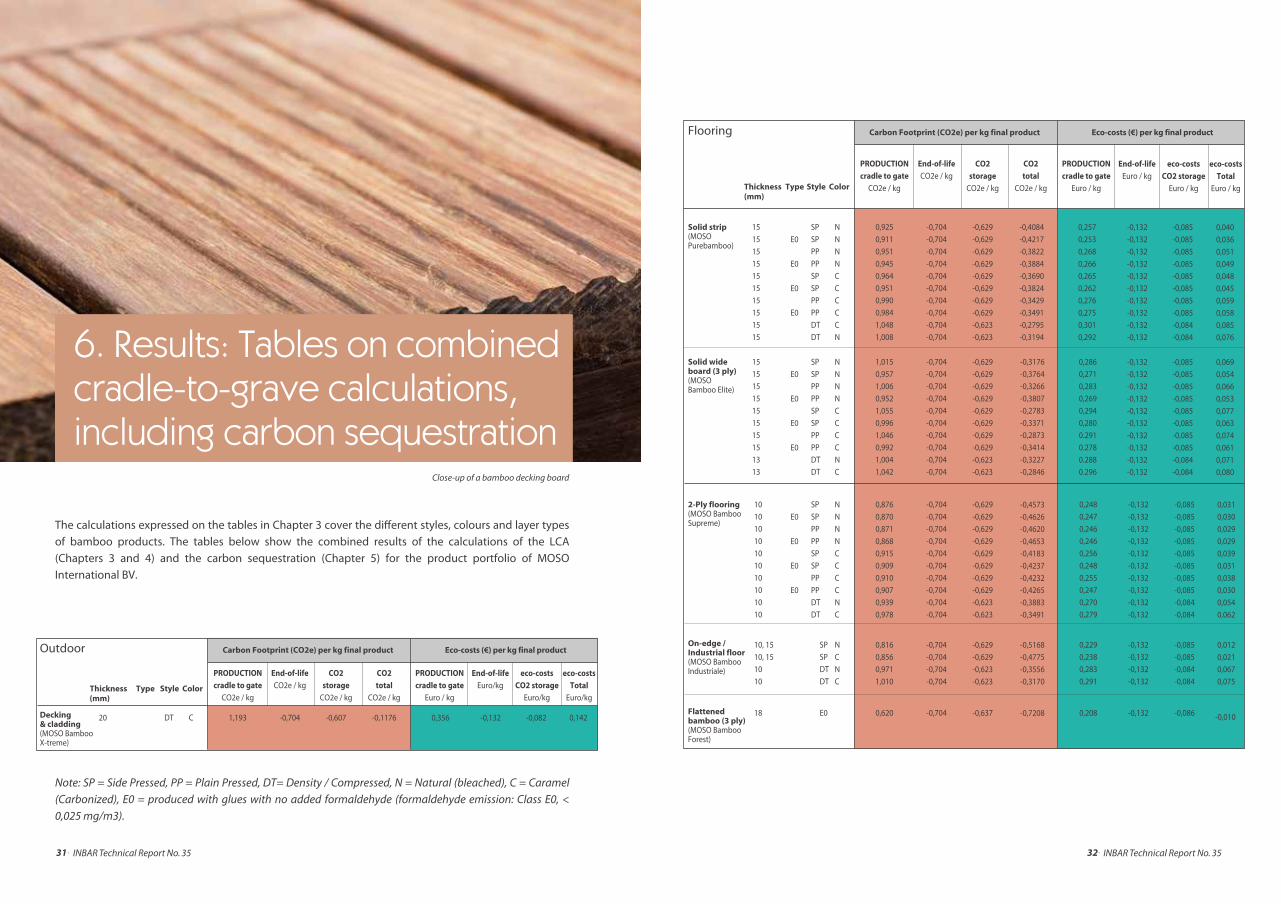
The calculations expressed on the tables in Chapter 3 cover the di�erent styles, colours and layer types of bamboo products. The tables below show the combined results of the calculations of the LCA (Chapters 3 and 4) and the carbon sequestration (Chapter 5) for the product portfolio of MOSO International BV.
Note: SP = Side Pressed, PP = Plain Pressed, DT= Density / Compressed, N = Natural (bleached), C = Caramel
(Carbonized), E0 = produced with glues with no added formaldehyde (formaldehyde emission: Class E0, <
0,025 mg/m3).
6. Results: Tables on combined cradle-to-grave calculations, including carbon sequestration
32. INBAR Technical Report No. 3531. INBAR Technical Report No. 35
Flooring
Thickness(mm)
Solid strip (MOSO Purebamboo)
15
15
15
15
15
15
15
15
15
15
SP
SP
PP
PP
SP
SP
PP
PP
DT
DT
N
N
N
N
C
C
C
C
C
N
E0
E0
E0
E0
Solid wide board (3 ply) (MOSO Bamboo Elite)
15
15
15
15
15
15
15
15
13
13
-0,3176
-0,3764
-0,3266
-0,3807
-0,2783
-0,3371
-0,2873
-0,3414
-0,3227
-0,2846
0,286
0,271
0,283
0,269
0,294
0,280
0.291
0.278
0.288
0.296
SP
SP
PP
PP
SP
SP
PP
PP
DT
DT
N
N
N
N
C
C
C
C
N
C
E0
E0
E0
E0
Carbon Footprint (CO2e) per kg final product Eco-costs (€) per kg final product
0,925
0,911
0,951
0,945
0,964
0,951
0,990
0,984
1,048
1,008
1,015
0,957
1,006
0,952
1,055
0,996
1,046
0,992
1,004
1,042
PRODUCTION
cradle to gate
CO2e / kg
-0,629
-0,629
-0,629
-0,629
-0,629
-0,629
-0,629
-0,629
-0,623
-0,623
-0,629
-0,629
-0,629
-0,629
-0,629
-0,629
-0,629
-0,629
-0,623
-0,623
CO2
storage
CO2e / kgType Style Color
-0,704
-0,704
-0,704
-0,704
-0,704
-0,704
-0,704
-0,704
-0,704
-0,704
End-of-life
CO2e / kg
-0,704
-0,704
-0,704
-0,704
-0,704
-0,704
-0,704
-0,704
-0,704
-0,704
-0,4084
-0,4217
-0,3822
-0,3884
-0,3690
-0,3824
-0,3429
-0,3491
-0,2795
-0,3194
CO2
total
CO2e / kg
0,257
0,253
0,268
0,266
0,265
0,262
0,276
0,275
0,301
0,292
PRODUCTION
cradle to gate
Euro / kg
-0,132
-0,132
-0,132
-0,132
-0,132
-0,132
-0,132
-0,132
-0,132
-0,132
-0,132
-0,132
-0,132
-0,132
-0,132
-0,132
-0,132
-0,132
-0,132
-0,132
End-of-life
Euro / kg
-0,085
-0,085
-0,085
-0,085
-0,085
-0,085
-0,085
-0,085
-0,084
-0,084
-0,085
-0,085
-0,085
-0,085
-0,085
-0,085
-0,085
-0,085
-0,084
-0,084
eco-costs
CO2 storage
Euro / kg
0,040
0,036
0,051
0,049
0,048
0,045
0,059
0,058
0,085
0,076
0,069
0,054
0,066
0,053
0,077
0,063
0,074
0,061
0,071
0,080
eco-costs
Total
Euro / kg
2-Ply flooring (MOSO Bamboo Supreme)
On-edge / Industrial floor(MOSO Bamboo Industriale)
10
10
10
10
10
10
10
10
10
10
10, 15
10, 15
10
10
SP
SP
DT
DT
N
C
N
C
0,876
0,870
0,871
0,868
0,915
0,909
0,910
0,907
0,939
0,978
0,816
0,856
0,971
1,010
-0,704
-0,704
-0,704
-0,704
-0,629
-0,629
-0,623
-0,623
Flattened bamboo (3 ply) (MOSO Bamboo Forest)
18 E0 0,620 -0,704 -0,637 -0,086
-0,704
-0,704
-0,704
-0,704
-0,704
-0,704
-0,704
-0,704
-0,704
-0,704
-0,629
-0,629
-0,629
-0,629
-0,629
-0,629
-0,629
-0,629
-0,623
-0,623
SP
SP
PP
PP
SP
SP
PP
PP
DT
DT
N
N
N
N
C
C
C
C
N
C
E0
E0
E0
E0
0,229
0,238
0,283
0,291
0,208
0,248
0,247
0,246
0,246
0,256
0,248
0,255
0,247
0,270
0,279
-0,132
-0,132
-0,132
-0,132
-0,132
-0,132
-0,132
-0,132
-0,132
-0,132
-0,132
-0,132
-0,132
-0,132
-0,132
-0,085
-0,085
-0,084
-0,084
-0,085
-0,085
-0,085
-0,085
-0,085
-0,085
-0,085
-0,085
-0,084
-0,084
0,012
0,021
0,067
0,075
-0,010
0,031
0,030
0,029
0,029
0,039
0,031
0,038
0,030
0,054
0,062
-0,5168
-0,4775
-0,3556
-0,3170
-0,7208
-0,4573
-0,4626
-0,4620
-0,4653
-0,4183
-0,4237
-0,4232
-0,4265
-0,3883
-0,3491
Decking & cladding (MOSO Bamboo X-treme)
20 DT C
Outdoor
Thickness(mm)
Carbon Footprint (CO2e) per kg final product Eco-costs (€) per kg final product
Type Style Color
PRODUCTION
cradle to gate
CO2e / kg
1,193
End-of-life
CO2e / kg
-0,704
CO2
storage
CO2e / kg
-0,607
CO2
total
CO2e / kg
-0,1176
PRODUCTION
cradle to gate
Euro / kg
0,356
End-of-life
Euro/kg
-0,132
eco-costs
CO2 storage
Euro/kg
-0,082
eco-costs
Total
Euro/kg
0,142
Close-up of a bamboo decking board
34. INBAR Technical Report No. 3533. INBAR Technical Report No. 35
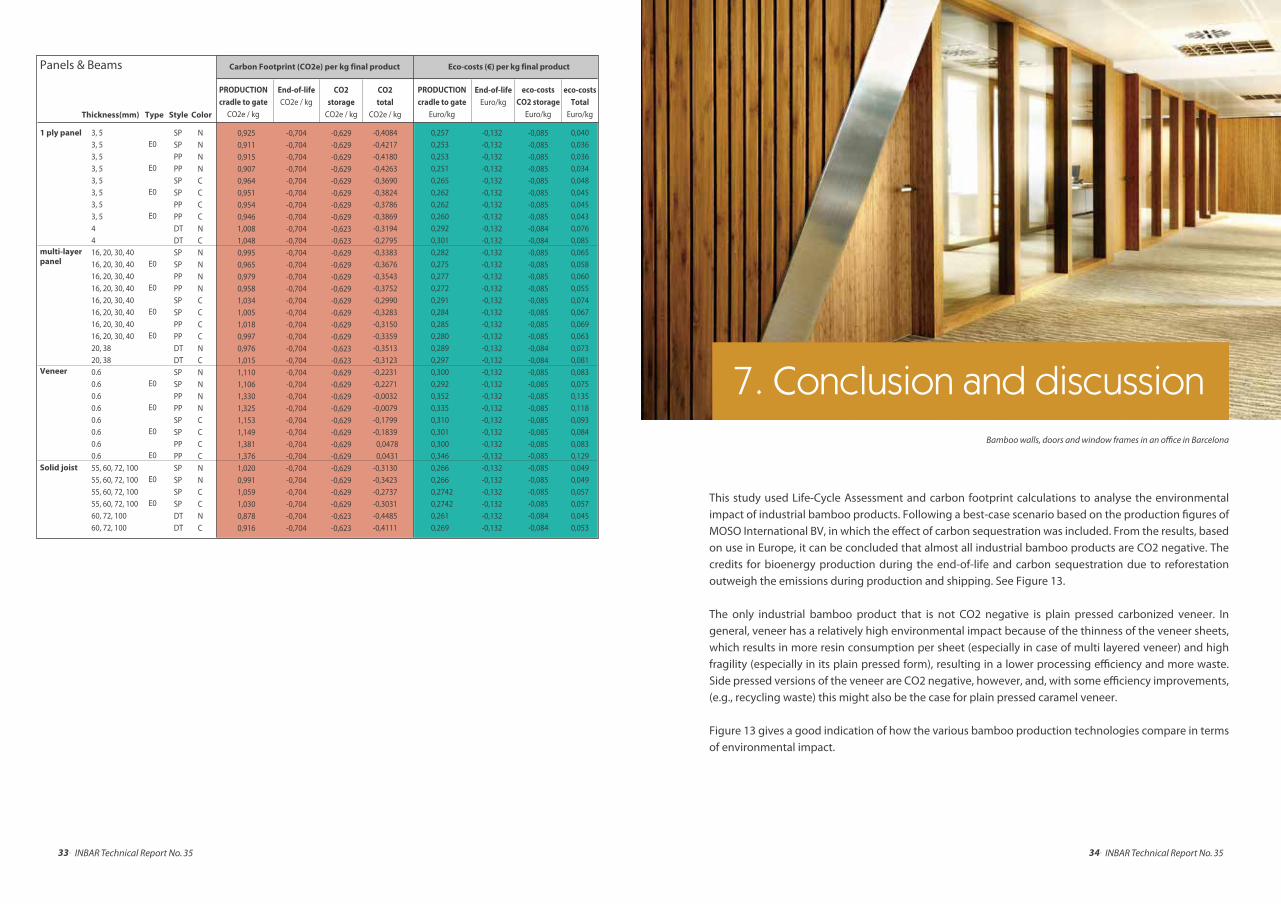
Panels & Beams
Thickness(mm)
1 ply panel
multi-layer panel
Veneer
Solid joist
3, 5
3, 5
3, 5
3, 5
3, 5
3, 5
3, 5
3, 5
4
4
16, 20, 30, 40
16, 20, 30, 40
16, 20, 30, 40
16, 20, 30, 40
16, 20, 30, 40
16, 20, 30, 40
16, 20, 30, 40
16, 20, 30, 40
20, 38
20, 38
0.6
0.6
0.6
0.6
0.6
0.6
0.6
0.6
55, 60, 72, 100
55, 60, 72, 100
55, 60, 72, 100
55, 60, 72, 100
60, 72, 100
60, 72, 100
E0
E0
E0
E0
E0
E0
E0
E0
E0
E0
E0
E0
E0
E0
SP
SP
PP
PP
SP
SP
PP
PP
DT
DT
SP
SP
PP
PP
SP
SP
PP
PP
DT
DT
SP
SP
PP
PP
SP
SP
PP
PP
SP
SP
SP
SP
DT
DT
N
N
N
N
C
C
C
C
N
C
N
N
N
N
C
C
C
C
N
C
N
N
N
N
C
C
C
C
N
N
C
C
N
C
0,925
0,911
0,915
0,907
0,964
0,951
0,954
0,946
1,008
1,048
0,995
0,965
0,979
0,958
1,034
1,005
1,018
0,997
0,976
1,015
1,110
1,106
1,330
1,325
1,153
1,149
1,381
1,376
1,020
0,991
1,059
1,030
0,878
0,916
-0,704
-0,704
-0,704
-0,704
-0,704
-0,704
-0,704
-0,704
-0,704
-0,704
-0,704
-0,704
-0,704
-0,704
-0,704
-0,704
-0,704
-0,704
-0,704
-0,704
-0,704
-0,704
-0,704
-0,704
-0,704
-0,704
-0,704
-0,704
-0,704
-0,704
-0,704
-0,704
-0,704
-0,704
-0,629
-0,629
-0,629
-0,629
-0,629
-0,629
-0,629
-0,629
-0,623
-0,623
-0,629
-0,629
-0,629
-0,629
-0,629
-0,629
-0,629
-0,629
-0,623
-0,623
-0,629
-0,629
-0,629
-0,629
-0,629
-0,629
-0,629
-0,629
-0,629
-0,629
-0,629
-0,629
-0,623
-0,623
Carbon Footprint (CO2e) per kg final product Eco-costs (€) per kg final product
PRODUCTION
cradle to gate
CO2e / kg
0,257
0,253
0,253
0,251
0,265
0,262
0,262
0,260
0,292
0,301
0,282
0,275
0,277
0,272
0,291
0,284
0,285
0,280
0,289
0,297
0,300
0,292
0,352
0,335
0,310
0,301
0,300
0,346
0,266
0,266
0,2742
0,2742
0,261
0,269
PRODUCTION
cradle to gate
Euro/kg
End-of-life
CO2e / kg
-0,132
-0,132
-0,132
-0,132
-0,132
-0,132
-0,132
-0,132
-0,132
-0,132
-0,132
-0,132
-0,132
-0,132
-0,132
-0,132
-0,132
-0,132
-0,132
-0,132
-0,132
-0,132
-0,132
-0,132
-0,132
-0,132
-0,132
-0,132
-0,132
-0,132
-0,132
-0,132
-0,132
-0,132
End-of-life
Euro/kg
-0,085
-0,085
-0,085
-0,085
-0,085
-0,085
-0,085
-0,085
-0,084
-0,084
-0,085
-0,085
-0,085
-0,085
-0,085
-0,085
-0,085
-0,085
-0,084
-0,084
-0,085
-0,085
-0,085
-0,085
-0,085
-0,085
-0,085-0,085
-0,085
-0,085
-0,085
-0,085
-0,084
-0,084
eco-costs
CO2 storage
Euro/kg
0,040
0,036
0,036
0,034
0,048
0,045
0,045
0,043
0,076
0,085
0,065
0,058
0,060
0,055
0,074
0,067
0,069
0,063
0,073
0,081
0,083
0,075
0,135
0,118
0,093
0,084
0,083
0,129
0,049
0,049
0,057
0,057
0,045
0,053
eco-costs
Total
Euro/kg
CO2
storage
CO2e / kg
-0,4084
-0,4217
-0,4180
-0,4263
-0,3690
-0,3824
-0,3786
-0,3869
-0,3194
-0,2795
-0,3383
-0,3676
-0,3543
-0,3752
-0,2990
-0,3283
-0,3150
-0,3359
-0,3513
-0,3123
-0,2231
-0,2271
-0,0032
-0,0079
-0,1799
-0,1839
0,0478
0,0431
-0,3130
-0,3423
-0,2737
-0,3031
-0,4485
-0,4111
CO2
total
CO2e / kgType Style Color
7. Conclusion and discussion
This study used Life-Cycle Assessment and carbon footprint calculations to analyse the environmental impact of industrial bamboo products. Following a best-case scenario based on the production �gures of MOSO International BV, in which the e�ect of carbon sequestration was included. From the results, based on use in Europe, it can be concluded that almost all industrial bamboo products are CO2 negative. The credits for bioenergy production during the end-of-life and carbon sequestration due to reforestation outweigh the emissions during production and shipping. See Figure 13.
The only industrial bamboo product that is not CO2 negative is plain pressed carbonized veneer. In general, veneer has a relatively high environmental impact because of the thinness of the veneer sheets, which results in more resin consumption per sheet (especially in case of multi layered veneer) and high fragility (especially in its plain pressed form), resulting in a lower processing e�ciency and more waste. Side pressed versions of the veneer are CO2 negative, however, and, with some e�ciency improvements, (e.g., recycling waste) this might also be the case for plain pressed caramel veneer.
Figure 13 gives a good indication of how the various bamboo production technologies compare in terms of environmental impact.
Bamboo walls, doors and window frames in an o�ce in Barcelona
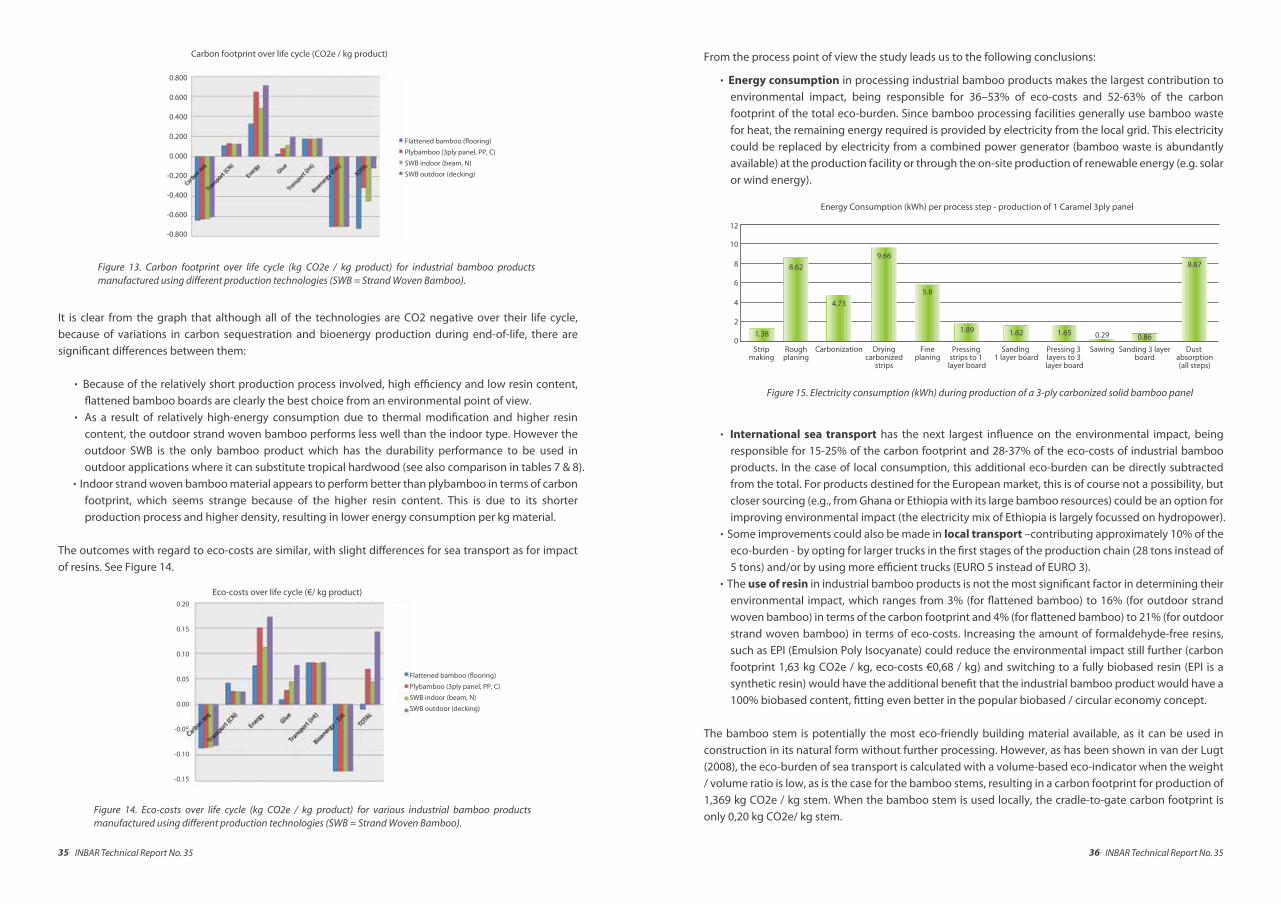
36. INBAR Technical Report No. 3535. INBAR Technical Report No. 35
Figure 13. Carbon footprint over life cycle (kg CO2e / kg product) for industrial bamboo products manufactured using different production technologies (SWB = Strand Woven Bamboo).
Figure 14. Eco-costs over life cycle (kg CO2e / kg product) for various industrial bamboo products manufactured using different production technologies (SWB = Strand Woven Bamboo).
It is clear from the graph that although all of the technologies are CO2 negative over their life cycle, because of variations in carbon sequestration and bioenergy production during end-of-life, there are signi�cant di�erences between them:
. Because of the relatively short production process involved, high e�ciency and low resin content, �attened bamboo boards are clearly the best choice from an environmental point of view.
. As a result of relatively high-energy consumption due to thermal modi�cation and higher resin content, the outdoor strand woven bamboo performs less well than the indoor type. However the outdoor SWB is the only bamboo product which has the durability performance to be used in outdoor applications where it can substitute tropical hardwood (see also comparison in tables 7 & 8).
. Indoor strand woven bamboo material appears to perform better than plybamboo in terms of carbon footprint, which seems strange because of the higher resin content. This is due to its shorter production process and higher density, resulting in lower energy consumption per kg material.
The outcomes with regard to eco-costs are similar, with slight di�erences for sea transport as for impact of resins. See Figure 14.
From the process point of view the study leads us to the following conclusions:
. Energy consumption in processing industrial bamboo products makes the largest contribution to environmental impact, being responsible for 36–53% of eco-costs and 52-63% of the carbon footprint of the total eco-burden. Since bamboo processing facilities generally use bamboo waste for heat, the remaining energy required is provided by electricity from the local grid. This electricity could be replaced by electricity from a combined power generator (bamboo waste is abundantly available) at the production facility or through the on-site production of renewable energy (e.g. solar or wind energy).
. International sea transport has the next largest in�uence on the environmental impact, being responsible for 15-25% of the carbon footprint and 28-37% of the eco-costs of industrial bamboo products. In the case of local consumption, this additional eco-burden can be directly subtracted from the total. For products destined for the European market, this is of course not a possibility, but closer sourcing (e.g., from Ghana or Ethiopia with its large bamboo resources) could be an option for improving environmental impact (the electricity mix of Ethiopia is largely focussed on hydropower).
. Some improvements could also be made in local transport –contributing approximately 10% of the eco-burden - by opting for larger trucks in the �rst stages of the production chain (28 tons instead of 5 tons) and/or by using more e�cient trucks (EURO 5 instead of EURO 3).
. The use of resin in industrial bamboo products is not the most signi�cant factor in determining their environmental impact, which ranges from 3% (for �attened bamboo) to 16% (for outdoor strand woven bamboo) in terms of the carbon footprint and 4% (for �attened bamboo) to 21% (for outdoor strand woven bamboo) in terms of eco-costs. Increasing the amount of formaldehyde-free resins, such as EPI (Emulsion Poly Isocyanate) could reduce the environmental impact still further (carbon footprint 1,63 kg CO2e / kg, eco-costs €0,68 / kg) and switching to a fully biobased resin (EPI is a synthetic resin) would have the additional bene�t that the industrial bamboo product would have a 100% biobased content, �tting even better in the popular biobased / circular economy concept.
The bamboo stem is potentially the most eco-friendly building material available, as it can be used in construction in its natural form without further processing. However, as has been shown in van der Lugt (2008), the eco-burden of sea transport is calculated with a volume-based eco-indicator when the weight / volume ratio is low, as is the case for the bamboo stems, resulting in a carbon footprint for production of 1,369 kg CO2e / kg stem. When the bamboo stem is used locally, the cradle-to-gate carbon footprint is only 0,20 kg CO2e/ kg stem.
Energy Consumption (kWh) per process step - production of 1 Caramel 3ply panel
Carbon footprint over life cycle (CO2e / kg product)
Eco-costs over life cycle (€/ kg product)
0.800
0.600
0.400
0.200
0.000
-0.200
-0.400
-0.600
-0.800
Flattened bamboo (�ooring)
Plybamboo (3ply panel, PP, C)
SWB indoor (beam, N)
SWB outdoor (decking)
Flattened bamboo (�ooring)
Plybamboo (3ply panel, PP, C)
SWB indoor (beam, N)
SWB outdoor (decking)
0.20
0.15
0.10
0.05
0.00
-0.05
-0.10
-0.15
Figure 15. Electricity consumption (kWh) during production of a 3-ply carbonized solid bamboo panel
12
10
8
6
4
2
0Rough
planing
8.62
Dryingcarbonized
strips
9.66
Carbonization
4.73
Fineplaning
5.8
Pressing strips to 1
layer board
1.89
Sanding 1 layer board
1.62
Sawing
0.29
Pressing 3 layers to 3 layer board
1.65
Sanding 3 layerboard
0.86
Dust absorption(all steps)
8.67
Stripmaking
1.38
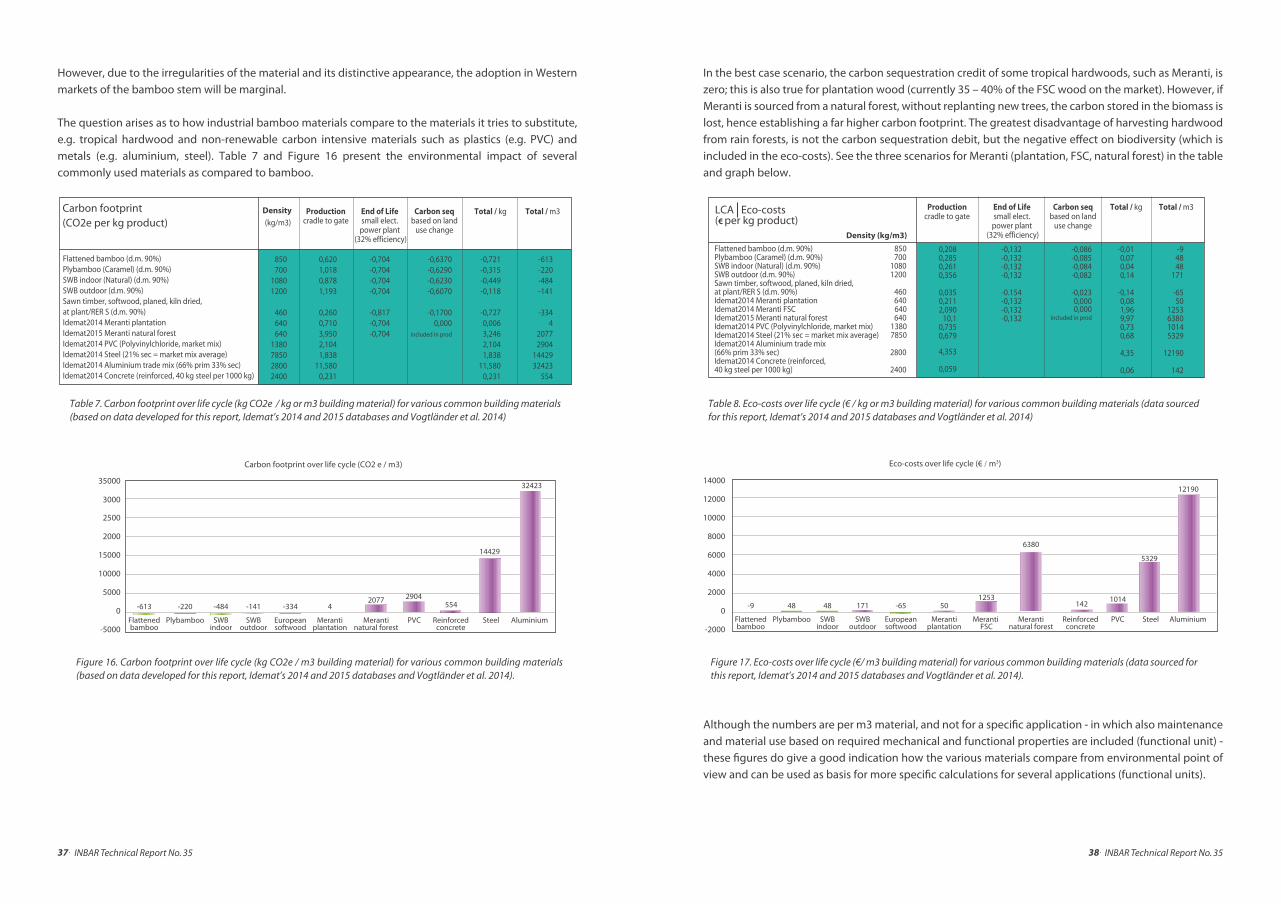
38. INBAR Technical Report No. 3537. INBAR Technical Report No. 35
Table 7. Carbon footprint over life cycle (kg CO2e / kg or m3 building material) for various common building materials (based on data developed for this report, Idemat’s 2014 and 2015 databases and Vogtländer et al. 2014)
Figure 16. Carbon footprint over life cycle (kg CO2e / m3 building material) for various common building materials (based on data developed for this report, Idemat’s 2014 and 2015 databases and Vogtländer et al. 2014).
However, due to the irregularities of the material and its distinctive appearance, the adoption in Western markets of the bamboo stem will be marginal.
The question arises as to how industrial bamboo materials compare to the materials it tries to substitute, e.g. tropical hardwood and non-renewable carbon intensive materials such as plastics (e.g. PVC) and metals (e.g. aluminium, steel). Table 7 and Figure 16 present the environmental impact of several commonly used materials as compared to bamboo.
Carbon footprint(CO2e per kg product)
Productioncradle to gate
0,6201,0180,8781,193
0,2600,7103,9502,1041,838
11,5800,231
-0,704-0,704-0,704-0,704
-0,817-0,704-0,704
-0,6370-0,6290-0,6230-0,6070
-0,17000,000
included in prod
End of Lifesmall elect.
power plant (32% efficiency)
Carbon seqbased on land
use change
-0,721-0,315-0,449-0,118
-0,7270,0063,2462,1041,838
11,5800,231
Total / kg
-613-220-484-141
-3344
20772904
1442932423
554
Total / m3Density
(kg/m3)
Flattened bamboo (d.m. 90%) Plybamboo (Caramel) (d.m. 90%) SWB indoor (Natural) (d.m. 90%) SWB outdoor (d.m. 90%) Sawn timber, softwood, planed, kiln dried, at plant/RER S (d.m. 90%) Idemat2014 Meranti plantationIdemat2015 Meranti natural forestIdemat2014 PVC (Polyvinylchloride, market mix) Idemat2014 Steel (21% sec = market mix average) Idemat2014 Aluminium trade mix (66% prim 33% sec) Idemat2014 Concrete (reinforced, 40 kg steel per 1000 kg)
850 700
1080 1200
460640640
1380785028002400
Table 8. Eco-costs over life cycle (€ / kg or m3 building material) for various common building materials (data sourced for this report, Idemat’s 2014 and 2015 databases and Vogtländer et al. 2014)
Figure 17. Eco-costs over life cycle (€/ m3 building material) for various common building materials (data sourced for this report, Idemat’s 2014 and 2015 databases and Vogtländer et al. 2014).
In the best case scenario, the carbon sequestration credit of some tropical hardwoods, such as Meranti, is zero; this is also true for plantation wood (currently 35 – 40% of the FSC wood on the market). However, if Meranti is sourced from a natural forest, without replanting new trees, the carbon stored in the biomass is lost, hence establishing a far higher carbon footprint. The greatest disadvantage of harvesting hardwood from rain forests, is not the carbon sequestration debit, but the negative e�ect on biodiversity (which is included in the eco-costs). See the three scenarios for Meranti (plantation, FSC, natural forest) in the table and graph below.
Although the numbers are per m3 material, and not for a speci�c application - in which also maintenance and material use based on required mechanical and functional properties are included (functional unit) - these �gures do give a good indication how the various materials compare from environmental point of view and can be used as basis for more speci�c calculations for several applications (functional units).
Productioncradle to gate
End of Lifesmall elect.
power plant (32% efficiency)
Carbon seqbased on land
use change
Total / kg Total / m3
Density (kg/m3)
LCA Eco-costs(€ per kg product)
0,2080,2850,2610,356
0,0350,2112,090
10,10,7350,679
4,353
0,059
-0,132-0,132-0,132-0,132
-0.154-0,132-0,132-0,132
-0,086-0,085-0,084-0,082
-0,0230,0000,000
included in prod
-0,010,070,040,14
-0,140,081,969,970,730,68
4,35
0,06
-94848
171
-6550
1253638010145329
12190
142
Flattened bamboo (d.m. 90%) 850Plybamboo (Caramel) (d.m. 90%) 700SWB indoor (Natural) (d.m. 90%) 1080SWB outdoor (d.m. 90%) 1200Sawn timber, softwood, planed, kiln dried, at plant/RER S (d.m. 90%) 460Idemat2014 Meranti plantation 640Idemat2014 Meranti FSC 640Idemat2015 Meranti natural forest 640Idemat2014 PVC (Polyvinylchloride, market mix) 1380Idemat2014 Steel (21% sec = market mix average) 7850Idemat2014 Aluminium trade mix (66% prim 33% sec) 2800Idemat2014 Concrete (reinforced, 40 kg steel per 1000 kg) 2400
35000
Carbon footprint over life cycle (CO2 e / m3)
3000
2500
2000
15000
10000
5000
0
-5000Aluminium
32423
Steel
14429
Reinforcedconcrete
554
PVC
2904
Merantinatural forest
2077
Merantiplantation
4
Europeansoftwood
-334
SWBoutdoor
-141
SWBindoor
-484
Plybamboo
-220
Flattenedbamboo
-613
Eco-costs over life cycle (€ / m3)
Aluminium
12190
Steel
5329
1014
PVCReinforcedconcrete
142
Merantinatural forest
6380
Meranti FSC
1253
Merantiplantation
50
Europeansoftwood
-65
SWBoutdoor
171
SWBindoor
48
Plybamboo
48
Flattenedbamboo
-9
14000
12000
10000
8000
6000
4000
2000
0
-2000
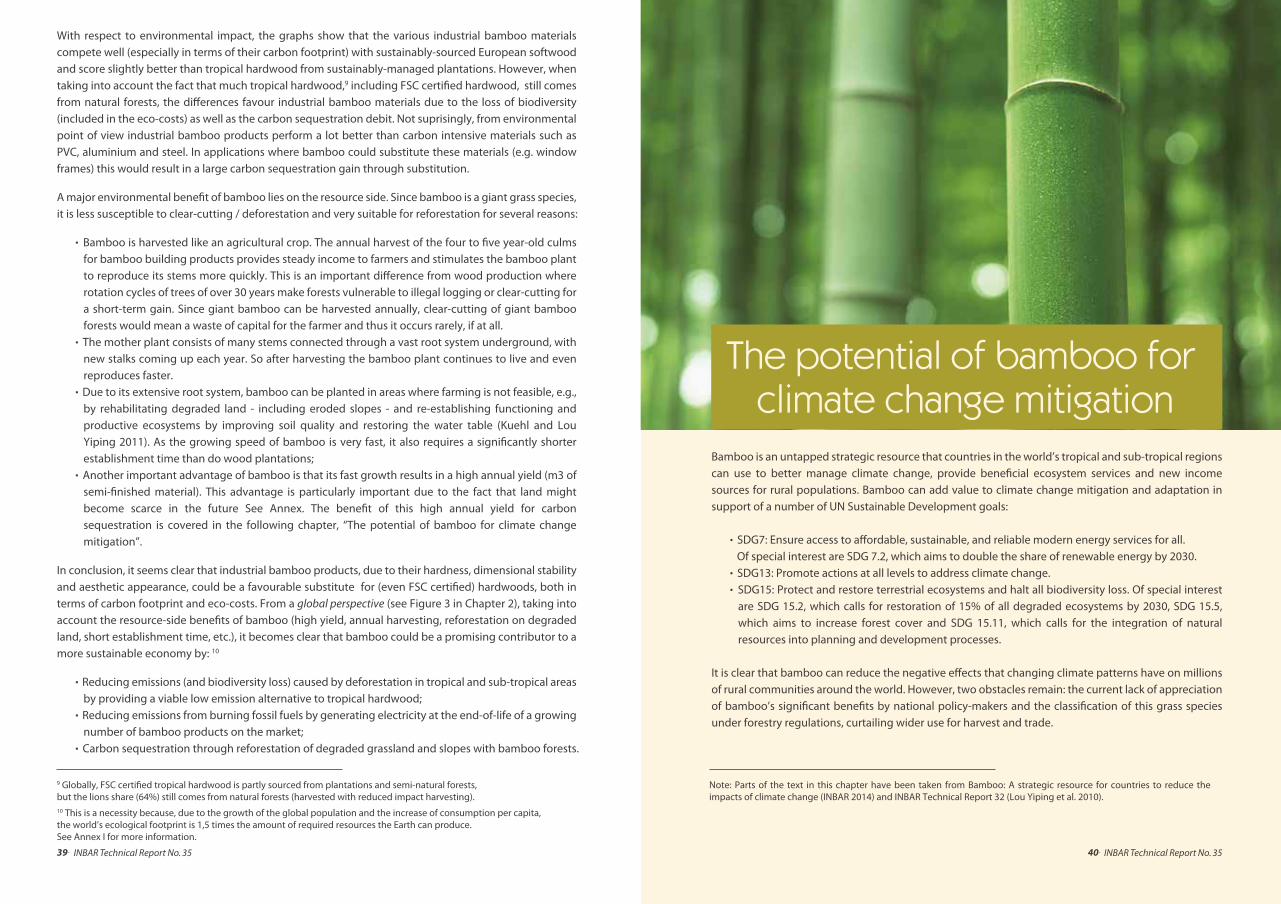
40. INBAR Technical Report No. 3539. INBAR Technical Report No. 35
With respect to environmental impact, the graphs show that the various industrial bamboo materials compete well (especially in terms of their carbon footprint) with sustainably-sourced European softwood and score slightly better than tropical hardwood from sustainably-managed plantations. However, when taking into account the fact that much tropical hardwood,9 including FSC certi�ed hardwood, still comes from natural forests, the di�erences favour industrial bamboo materials due to the loss of biodiversity (included in the eco-costs) as well as the carbon sequestration debit. Not suprisingly, from environmental point of view industrial bamboo products perform a lot better than carbon intensive materials such as PVC, aluminium and steel. In applications where bamboo could substitute these materials (e.g. window frames) this would result in a large carbon sequestration gain through substitution.
A major environmental bene�t of bamboo lies on the resource side. Since bamboo is a giant grass species, it is less susceptible to clear-cutting / deforestation and very suitable for reforestation for several reasons:
. Bamboo is harvested like an agricultural crop. The annual harvest of the four to �ve year-old culms for bamboo building products provides steady income to farmers and stimulates the bamboo plant to reproduce its stems more quickly. This is an important di�erence from wood production where rotation cycles of trees of over 30 years make forests vulnerable to illegal logging or clear-cutting for a short-term gain. Since giant bamboo can be harvested annually, clear-cutting of giant bamboo forests would mean a waste of capital for the farmer and thus it occurs rarely, if at all.
. The mother plant consists of many stems connected through a vast root system underground, with new stalks coming up each year. So after harvesting the bamboo plant continues to live and even reproduces faster.
. Due to its extensive root system, bamboo can be planted in areas where farming is not feasible, e.g., by rehabilitating degraded land - including eroded slopes - and re-establishing functioning and productive ecosystems by improving soil quality and restoring the water table (Kuehl and Lou Yiping 2011). As the growing speed of bamboo is very fast, it also requires a signi�cantly shorter establishment time than do wood plantations;
. Another important advantage of bamboo is that its fast growth results in a high annual yield (m3 of semi-�nished material). This advantage is particularly important due to the fact that land might become scarce in the future See Annex. The bene�t of this high annual yield for carbon sequestration is covered in the following chapter, “The potential of bamboo for climate change mitigation”.
In conclusion, it seems clear that industrial bamboo products, due to their hardness, dimensional stability and aesthetic appearance, could be a favourable substitute for (even FSC certi�ed) hardwoods, both in terms of carbon footprint and eco-costs. From a global perspective (see Figure 3 in Chapter 2), taking into account the resource-side bene�ts of bamboo (high yield, annual harvesting, reforestation on degraded land, short establishment time, etc.), it becomes clear that bamboo could be a promising contributor to a more sustainable economy by: 10
. Reducing emissions (and biodiversity loss) caused by deforestation in tropical and sub-tropical areas by providing a viable low emission alternative to tropical hardwood;
. Reducing emissions from burning fossil fuels by generating electricity at the end-of-life of a growing number of bamboo products on the market;
. Carbon sequestration through reforestation of degraded grassland and slopes with bamboo forests.
9 Globally, FSC certi�ed tropical hardwood is partly sourced from plantations and semi-natural forests, but the lions share (64%) still comes from natural forests (harvested with reduced impact harvesting).10 This is a necessity because, due to the growth of the global population and the increase of consumption per capita, the world’s ecological footprint is 1,5 times the amount of required resources the Earth can produce. See Annex I for more information.
Bamboo is an untapped strategic resource that countries in the world’s tropical and sub-tropical regions can use to better manage climate change, provide bene�cial ecosystem services and new income sources for rural populations. Bamboo can add value to climate change mitigation and adaptation in support of a number of UN Sustainable Development goals:
. SDG7: Ensure access to a�ordable, sustainable, and reliable modern energy services for all. Of special interest are SDG 7.2, which aims to double the share of renewable energy by 2030.. SDG13: Promote actions at all levels to address climate change.. SDG15: Protect and restore terrestrial ecosystems and halt all biodiversity loss. Of special interest
are SDG 15.2, which calls for restoration of 15% of all degraded ecosystems by 2030, SDG 15.5, which aims to increase forest cover and SDG 15.11, which calls for the integration of natural resources into planning and development processes.
It is clear that bamboo can reduce the negative e�ects that changing climate patterns have on millions of rural communities around the world. However, two obstacles remain: the current lack of appreciation of bamboo’s signi�cant bene�ts by national policy-makers and the classi�cation of this grass species under forestry regulations, curtailing wider use for harvest and trade.
The potential of bamboo for climate change mitigation
Note: Parts of the text in this chapter have been taken from Bamboo: A strategic resource for countries to reduce the impacts of climate change (INBAR 2014) and INBAR Technical Report 32 (Lou Yiping et al. 2010).
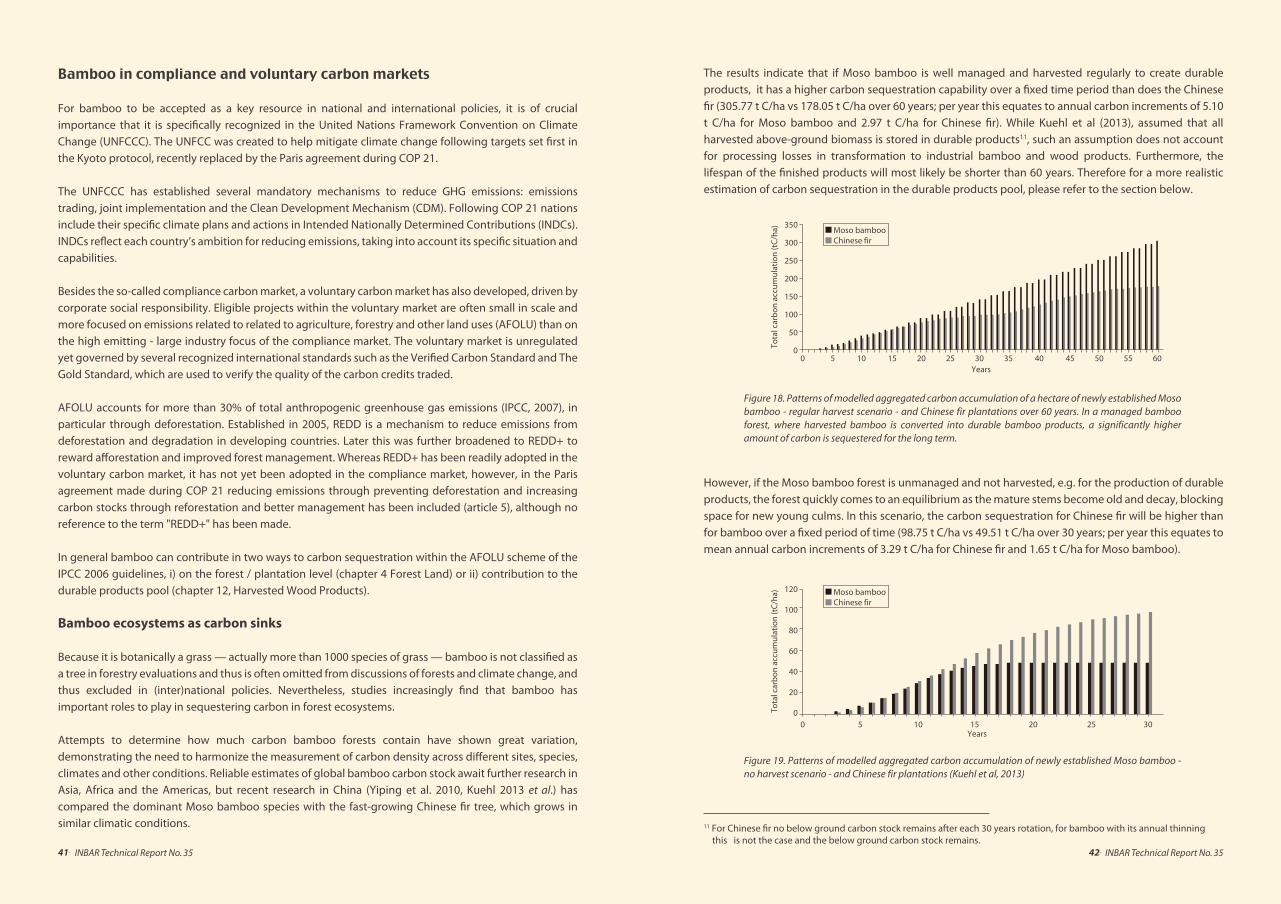
42. INBAR Technical Report No. 3541. INBAR Technical Report No. 35
Bamboo in compliance and voluntary carbon markets
For bamboo to be accepted as a key resource in national and international policies, it is of crucial importance that it is speci�cally recognized in the United Nations Framework Convention on Climate Change (UNFCCC). The UNFCC was created to help mitigate climate change following targets set �rst in the Kyoto protocol, recently replaced by the Paris agreement during COP 21.
The UNFCCC has established several mandatory mechanisms to reduce GHG emissions: emissions trading, joint implementation and the Clean Development Mechanism (CDM). Following COP 21 nations include their speci�c climate plans and actions in Intended Nationally Determined Contributions (INDCs). INDCs re�ect each country’s ambition for reducing emissions, taking into account its speci�c situation and capabilities.
Besides the so-called compliance carbon market, a voluntary carbon market has also developed, driven by corporate social responsibility. Eligible projects within the voluntary market are often small in scale and more focused on emissions related to related to agriculture, forestry and other land uses (AFOLU) than on the high emitting - large industry focus of the compliance market. The voluntary market is unregulated yet governed by several recognized international standards such as the Veri�ed Carbon Standard and The Gold Standard, which are used to verify the quality of the carbon credits traded.
AFOLU accounts for more than 30% of total anthropogenic greenhouse gas emissions (IPCC, 2007), in particular through deforestation. Established in 2005, REDD is a mechanism to reduce emissions from deforestation and degradation in developing countries. Later this was further broadened to REDD+ to reward a�orestation and improved forest management. Whereas REDD+ has been readily adopted in the voluntary carbon market, it has not yet been adopted in the compliance market, however, in the Paris agreement made during COP 21 reducing emissions through preventing deforestation and increasing carbon stocks through reforestation and better management has been included (article 5), although no reference to the term "REDD+" has been made.
In general bamboo can contribute in two ways to carbon sequestration within the AFOLU scheme of the IPCC 2006 guidelines, i) on the forest / plantation level (chapter 4 Forest Land) or ii) contribution to the durable products pool (chapter 12, Harvested Wood Products).
Bamboo ecosystems as carbon sinks
Because it is botanically a grass — actually more than 1000 species of grass — bamboo is not classi�ed as a tree in forestry evaluations and thus is often omitted from discussions of forests and climate change, and thus excluded in (inter)national policies. Nevertheless, studies increasingly �nd that bamboo has important roles to play in sequestering carbon in forest ecosystems.
Attempts to determine how much carbon bamboo forests contain have shown great variation, demonstrating the need to harmonize the measurement of carbon density across di�erent sites, species, climates and other conditions. Reliable estimates of global bamboo carbon stock await further research in Asia, Africa and the Americas, but recent research in China (Yiping et al. 2010, Kuehl 2013 et al.) has compared the dominant Moso bamboo species with the fast-growing Chinese �r tree, which grows in similar climatic conditions.
The results indicate that if Moso bamboo is well managed and harvested regularly to create durable products, it has a higher carbon sequestration capability over a �xed time period than does the Chinese �r (305.77 t C/ha vs 178.05 t C/ha over 60 years; per year this equates to annual carbon increments of 5.10 t C/ha for Moso bamboo and 2.97 t C/ha for Chinese �r). While Kuehl et al (2013), assumed that all harvested above-ground biomass is stored in durable products11, such an assumption does not account for processing losses in transformation to industrial bamboo and wood products. Furthermore, the lifespan of the �nished products will most likely be shorter than 60 years. Therefore for a more realistic estimation of carbon sequestration in the durable products pool, please refer to the section below.
Figure 18. Patterns of modelled aggregated carbon accumulation of a hectare of newly established Moso bamboo - regular harvest scenario - and Chinese fir plantations over 60 years. In a managed bamboo forest, where harvested bamboo is converted into durable bamboo products, a significantly higher amount of carbon is sequestered for the long term.
Figure 19. Patterns of modelled aggregated carbon accumulation of newly established Moso bamboo - no harvest scenario - and Chinese fir plantations (Kuehl et al, 2013)
However, if the Moso bamboo forest is unmanaged and not harvested, e.g. for the production of durable products, the forest quickly comes to an equilibrium as the mature stems become old and decay, blocking space for new young culms. In this scenario, the carbon sequestration for Chinese �r will be higher than for bamboo over a �xed period of time (98.75 t C/ha vs 49.51 t C/ha over 30 years; per year this equates to mean annual carbon increments of 3.29 t C/ha for Chinese �r and 1.65 t C/ha for Moso bamboo).
11 For Chinese �r no below ground carbon stock remains after each 30 years rotation, for bamboo with its annual thinning this is not the case and the below ground carbon stock remains.
Tota
l car
bon
accu
mul
atio
n (t
C/ha
)
Moso bambooChinese fir
Years0 5 10 15 20 25 30 35 40 45 50 55 60
350
300
250
200
150
100
50
0
Moso bambooChinese fir
Tota
l car
bon
accu
mul
atio
n (t
C/ha
)
Years0 5 10 15 20 25 30
120
100
80
60
40
20
0
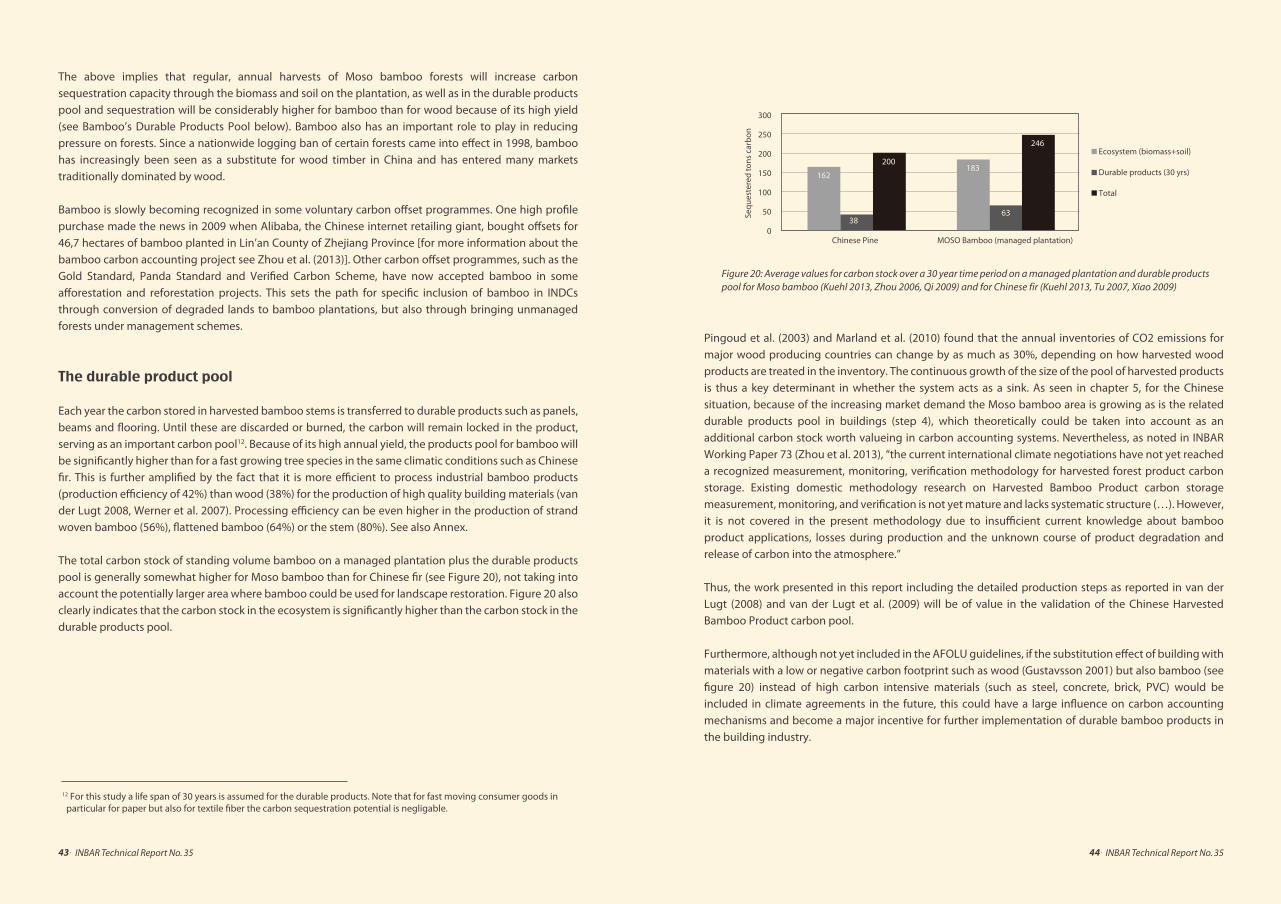
44. INBAR Technical Report No. 3543. INBAR Technical Report No. 35
The durable product pool
Each year the carbon stored in harvested bamboo stems is transferred to durable products such as panels, beams and �ooring. Until these are discarded or burned, the carbon will remain locked in the product, serving as an important carbon pool12. Because of its high annual yield, the products pool for bamboo will be signi�cantly higher than for a fast growing tree species in the same climatic conditions such as Chinese �r. This is further ampli�ed by the fact that it is more e�cient to process industrial bamboo products (production e�ciency of 42%) than wood (38%) for the production of high quality building materials (van der Lugt 2008, Werner et al. 2007). Processing e�ciency can be even higher in the production of strand woven bamboo (56%), �attened bamboo (64%) or the stem (80%). See also Annex.
The total carbon stock of standing volume bamboo on a managed plantation plus the durable products pool is generally somewhat higher for Moso bamboo than for Chinese �r (see Figure 20), not taking into account the potentially larger area where bamboo could be used for landscape restoration. Figure 20 also clearly indicates that the carbon stock in the ecosystem is signi�cantly higher than the carbon stock in the durable products pool.
Pingoud et al. (2003) and Marland et al. (2010) found that the annual inventories of CO2 emissions for major wood producing countries can change by as much as 30%, depending on how harvested wood products are treated in the inventory. The continuous growth of the size of the pool of harvested products is thus a key determinant in whether the system acts as a sink. As seen in chapter 5, for the Chinese situation, because of the increasing market demand the Moso bamboo area is growing as is the related durable products pool in buildings (step 4), which theoretically could be taken into account as an additional carbon stock worth valueing in carbon accounting systems. Nevertheless, as noted in INBAR Working Paper 73 (Zhou et al. 2013), “the current international climate negotiations have not yet reached a recognized measurement, monitoring, veri�cation methodology for harvested forest product carbon storage. Existing domestic methodology research on Harvested Bamboo Product carbon storage measurement, monitoring, and veri�cation is not yet mature and lacks systematic structure (…). However, it is not covered in the present methodology due to insu�cient current knowledge about bamboo product applications, losses during production and the unknown course of product degradation and release of carbon into the atmosphere.”
Thus, the work presented in this report including the detailed production steps as reported in van der Lugt (2008) and van der Lugt et al. (2009) will be of value in the validation of the Chinese Harvested Bamboo Product carbon pool.
Furthermore, although not yet included in the AFOLU guidelines, if the substitution e�ect of building with materials with a low or negative carbon footprint such as wood (Gustavsson 2001) but also bamboo (see �gure 20) instead of high carbon intensive materials (such as steel, concrete, brick, PVC) would be included in climate agreements in the future, this could have a large in�uence on carbon accounting mechanisms and become a major incentive for further implementation of durable bamboo products in the building industry.
The above implies that regular, annual harvests of Moso bamboo forests will increase carbon sequestration capacity through the biomass and soil on the plantation, as well as in the durable products pool and sequestration will be considerably higher for bamboo than for wood because of its high yield (see Bamboo’s Durable Products Pool below). Bamboo also has an important role to play in reducing pressure on forests. Since a nationwide logging ban of certain forests came into e�ect in 1998, bamboo has increasingly been seen as a substitute for wood timber in China and has entered many markets traditionally dominated by wood.
Bamboo is slowly becoming recognized in some voluntary carbon o�set programmes. One high pro�le purchase made the news in 2009 when Alibaba, the Chinese internet retailing giant, bought o�sets for 46,7 hectares of bamboo planted in Lin’an County of Zhejiang Province [for more information about the bamboo carbon accounting project see Zhou et al. (2013)]. Other carbon o�set programmes, such as the Gold Standard, Panda Standard and Veri�ed Carbon Scheme, have now accepted bamboo in some a�orestation and reforestation projects. This sets the path for speci�c inclusion of bamboo in INDCs through conversion of degraded lands to bamboo plantations, but also through bringing unmanaged forests under management schemes.
Figure 20: Average values for carbon stock over a 30 year time period on a managed plantation and durable products pool for Moso bamboo (Kuehl 2013, Zhou 2006, Qi 2009) and for Chinese fir (Kuehl 2013, Tu 2007, Xiao 2009)
Sequ
este
red
tons
car
bon
Chinese Pine MOSO Bamboo (managed plantation)
300
250
200
150
100
50
0
Total
Durable products (30 yrs)
Ecosystem (biomass+soil)
6338
246
200
162183
12 For this study a life span of 30 years is assumed for the durable products. Note that for fast moving consumer goods in particular for paper but also for textile �ber the carbon sequestration potential is negligable.
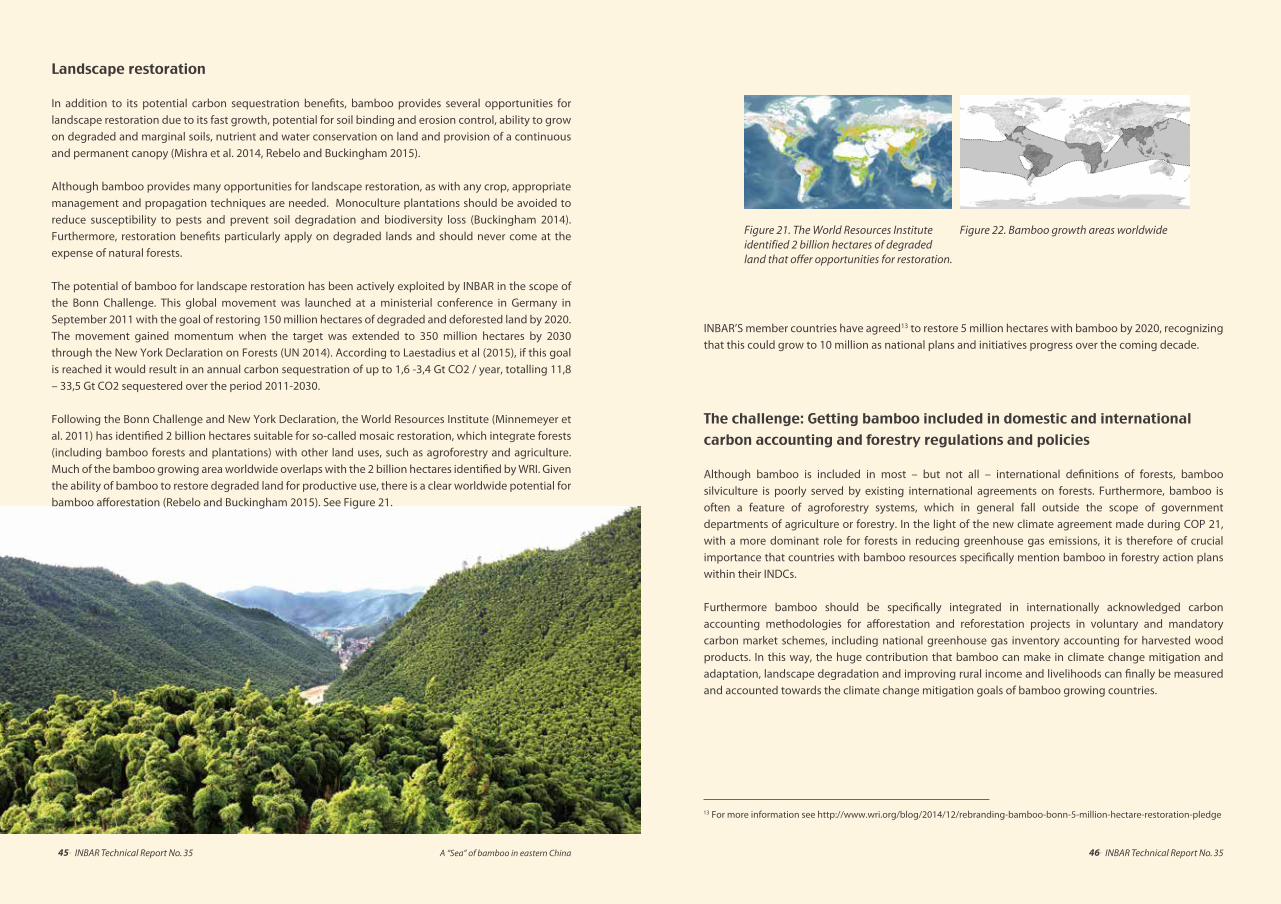
46. INBAR Technical Report No. 3545. INBAR Technical Report No. 35
Landscape restoration
In addition to its potential carbon sequestration bene�ts, bamboo provides several opportunities for landscape restoration due to its fast growth, potential for soil binding and erosion control, ability to grow on degraded and marginal soils, nutrient and water conservation on land and provision of a continuous and permanent canopy (Mishra et al. 2014, Rebelo and Buckingham 2015).
Although bamboo provides many opportunities for landscape restoration, as with any crop, appropriate management and propagation techniques are needed. Monoculture plantations should be avoided to reduce susceptibility to pests and prevent soil degradation and biodiversity loss (Buckingham 2014). Furthermore, restoration bene�ts particularly apply on degraded lands and should never come at the expense of natural forests.
The potential of bamboo for landscape restoration has been actively exploited by INBAR in the scope of the Bonn Challenge. This global movement was launched at a ministerial conference in Germany in September 2011 with the goal of restoring 150 million hectares of degraded and deforested land by 2020. The movement gained momentum when the target was extended to 350 million hectares by 2030 through the New York Declaration on Forests (UN 2014). According to Laestadius et al (2015), if this goal is reached it would result in an annual carbon sequestration of up to 1,6 -3,4 Gt CO2 / year, totalling 11,8 – 33,5 Gt CO2 sequestered over the period 2011-2030.
Following the Bonn Challenge and New York Declaration, the World Resources Institute (Minnemeyer et al. 2011) has identi�ed 2 billion hectares suitable for so-called mosaic restoration, which integrate forests (including bamboo forests and plantations) with other land uses, such as agroforestry and agriculture. Much of the bamboo growing area worldwide overlaps with the 2 billion hectares identi�ed by WRI. Given the ability of bamboo to restore degraded land for productive use, there is a clear worldwide potential for bamboo a�orestation (Rebelo and Buckingham 2015). See Figure 21.
INBAR’S member countries have agreed13 to restore 5 million hectares with bamboo by 2020, recognizing that this could grow to 10 million as national plans and initiatives progress over the coming decade.
The challenge: Getting bamboo included in domestic and international carbon accounting and forestry regulations and policies
Although bamboo is included in most – but not all – international de�nitions of forests, bamboo silviculture is poorly served by existing international agreements on forests. Furthermore, bamboo is often a feature of agroforestry systems, which in general fall outside the scope of government departments of agriculture or forestry. In the light of the new climate agreement made during COP 21, with a more dominant role for forests in reducing greenhouse gas emissions, it is therefore of crucial importance that countries with bamboo resources speci�cally mention bamboo in forestry action plans within their INDCs.
Furthermore bamboo should be speci�cally integrated in internationally acknowledged carbon accounting methodologies for a�orestation and reforestation projects in voluntary and mandatory carbon market schemes, including national greenhouse gas inventory accounting for harvested wood products. In this way, the huge contribution that bamboo can make in climate change mitigation and adaptation, landscape degradation and improving rural income and livelihoods can �nally be measured and accounted towards the climate change mitigation goals of bamboo growing countries.
13 For more information see http://www.wri.org/blog/2014/12/rebranding-bamboo-bonn-5-million-hectare-restoration-pledge
Figure 21. The World Resources Instituteidentified 2 billion hectares of degraded land that offer opportunities for restoration.
Figure 22. Bamboo growth areas worldwide
A “Sea” of bamboo in eastern China
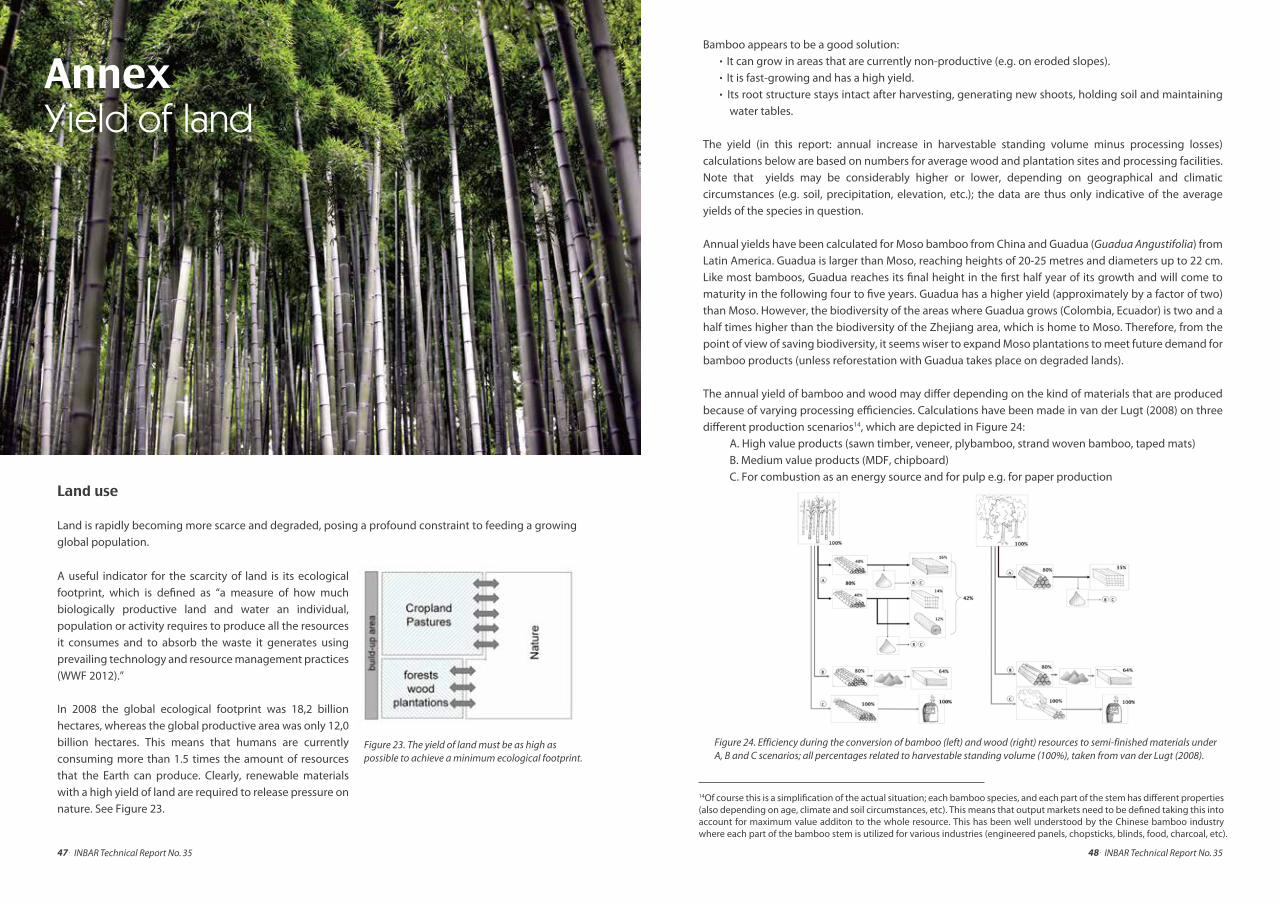
48. INBAR Technical Report No. 3547. INBAR Technical Report No. 35
Figure 23. The yield of land must be as high as possible to achieve a minimum ecological footprint.
Land use
Land is rapidly becoming more scarce and degraded, posing a profound constraint to feeding a growing global population.
A useful indicator for the scarcity of land is its ecological footprint, which is de�ned as “a measure of how much biologically productive land and water an individual, population or activity requires to produce all the resources it consumes and to absorb the waste it generates using prevailing technology and resource management practices (WWF 2012).”
In 2008 the global ecological footprint was 18,2 billion hectares, whereas the global productive area was only 12,0 billion hectares. This means that humans are currently consuming more than 1.5 times the amount of resources that the Earth can produce. Clearly, renewable materials with a high yield of land are required to release pressure on nature. See Figure 23.
Annex Yield of land
Figure 24. Efficiency during the conversion of bamboo (left) and wood (right) resources to semi-finished materials under A, B and C scenarios; all percentages related to harvestable standing volume (100%), taken from van der Lugt (2008).
Bamboo appears to be a good solution:. It can grow in areas that are currently non-productive (e.g. on eroded slopes).. It is fast-growing and has a high yield.. Its root structure stays intact after harvesting, generating new shoots, holding soil and maintaining
water tables.
The yield (in this report: annual increase in harvestable standing volume minus processing losses) calculations below are based on numbers for average wood and plantation sites and processing facilities. Note that yields may be considerably higher or lower, depending on geographical and climatic circumstances (e.g. soil, precipitation, elevation, etc.); the data are thus only indicative of the average yields of the species in question.
Annual yields have been calculated for Moso bamboo from China and Guadua (Guadua Angustifolia) from Latin America. Guadua is larger than Moso, reaching heights of 20-25 metres and diameters up to 22 cm. Like most bamboos, Guadua reaches its �nal height in the �rst half year of its growth and will come to maturity in the following four to �ve years. Guadua has a higher yield (approximately by a factor of two) than Moso. However, the biodiversity of the areas where Guadua grows (Colombia, Ecuador) is two and a half times higher than the biodiversity of the Zhejiang area, which is home to Moso. Therefore, from the point of view of saving biodiversity, it seems wiser to expand Moso plantations to meet future demand for bamboo products (unless reforestation with Guadua takes place on degraded lands).
The annual yield of bamboo and wood may di�er depending on the kind of materials that are produced because of varying processing e�ciencies. Calculations have been made in van der Lugt (2008) on three di�erent production scenarios14, which are depicted in Figure 24:
A. High value products (sawn timber, veneer, plybamboo, strand woven bamboo, taped mats)B. Medium value products (MDF, chipboard)C. For combustion as an energy source and for pulp e.g. for paper production
14Of course this is a simpli�cation of the actual situation; each bamboo species, and each part of the stem has di�erent properties (also depending on age, climate and soil circumstances, etc). This means that output markets need to be de�ned taking this into account for maximum value additon to the whole resource. This has been well understood by the Chinese bamboo industry where each part of the bamboo stem is utilized for various industries (engineered panels, chopsticks, blinds, food, charcoal, etc).
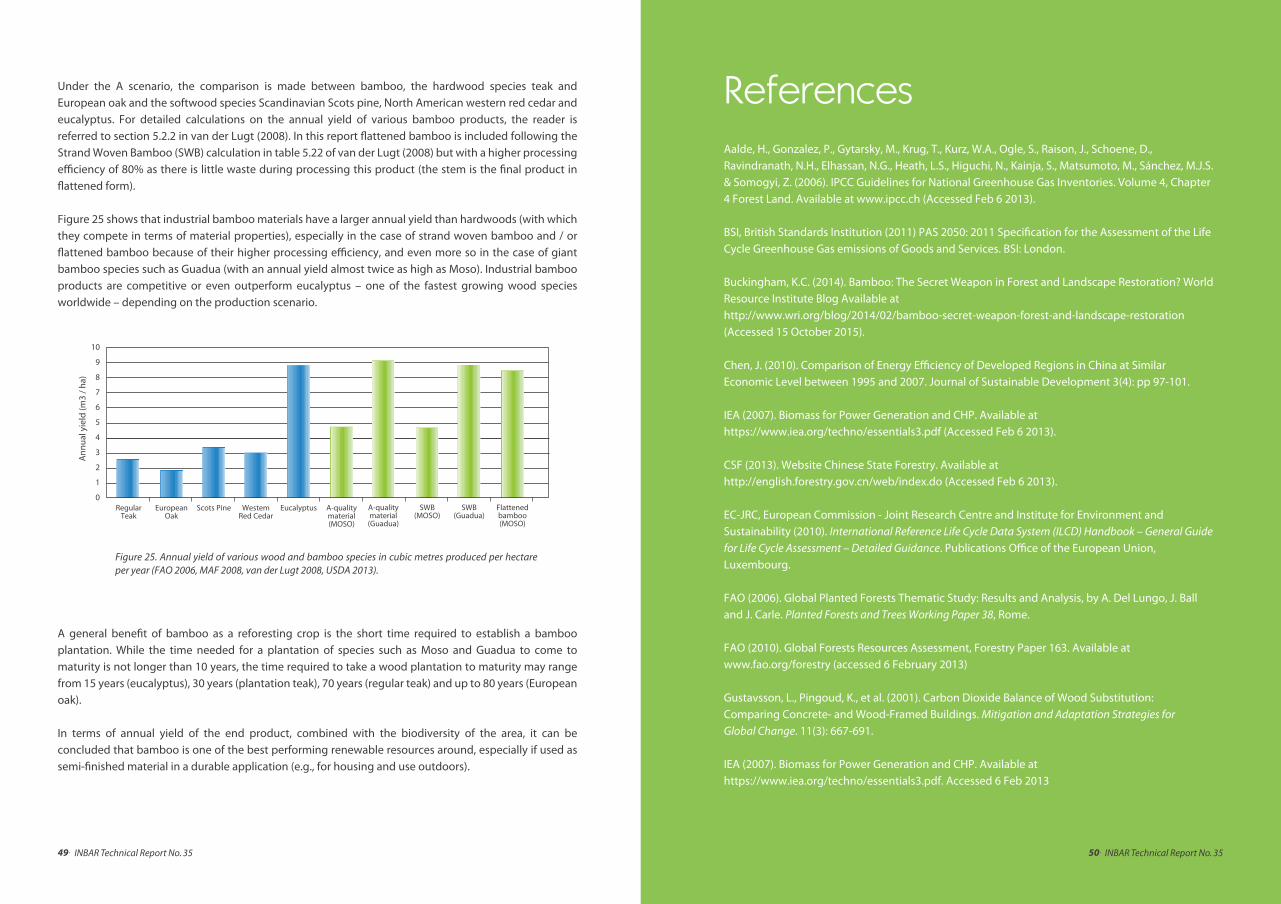
50. INBAR Technical Report No. 3549. INBAR Technical Report No. 35
Under the A scenario, the comparison is made between bamboo, the hardwood species teak and European oak and the softwood species Scandinavian Scots pine, North American western red cedar and eucalyptus. For detailed calculations on the annual yield of various bamboo products, the reader is referred to section 5.2.2 in van der Lugt (2008). In this report �attened bamboo is included following the Strand Woven Bamboo (SWB) calculation in table 5.22 of van der Lugt (2008) but with a higher processing e�ciency of 80% as there is little waste during processing this product (the stem is the �nal product in �attened form).
Figure 25 shows that industrial bamboo materials have a larger annual yield than hardwoods (with which they compete in terms of material properties), especially in the case of strand woven bamboo and / or �attened bamboo because of their higher processing e�ciency, and even more so in the case of giant bamboo species such as Guadua (with an annual yield almost twice as high as Moso). Industrial bamboo products are competitive or even outperform eucalyptus – one of the fastest growing wood species worldwide – depending on the production scenario.
A general bene�t of bamboo as a reforesting crop is the short time required to establish a bamboo plantation. While the time needed for a plantation of species such as Moso and Guadua to come to maturity is not longer than 10 years, the time required to take a wood plantation to maturity may range from 15 years (eucalyptus), 30 years (plantation teak), 70 years (regular teak) and up to 80 years (European oak).
In terms of annual yield of the end product, combined with the biodiversity of the area, it can be concluded that bamboo is one of the best performing renewable resources around, especially if used as semi-�nished material in a durable application (e.g., for housing and use outdoors).
Figure 25. Annual yield of various wood and bamboo species in cubic metres produced per hectare per year (FAO 2006, MAF 2008, van der Lugt 2008, USDA 2013).
Aalde, H., Gonzalez, P., Gytarsky, M., Krug, T., Kurz, W.A., Ogle, S., Raison, J., Schoene, D., Ravindranath, N.H., Elhassan, N.G., Heath, L.S., Higuchi, N., Kainja, S., Matsumoto, M., Sánchez, M.J.S. & Somogyi, Z. (2006). IPCC Guidelines for National Greenhouse Gas Inventories. Volume 4, Chapter 4 Forest Land. Available at www.ipcc.ch (Accessed Feb 6 2013).
BSI, British Standards Institution (2011) PAS 2050: 2011 Speci�cation for the Assessment of the Life Cycle Greenhouse Gas emissions of Goods and Services. BSI: London.
Buckingham, K.C. (2014). Bamboo: The Secret Weapon in Forest and Landscape Restoration? World Resource Institute Blog Available at http://www.wri.org/blog/2014/02/bamboo-secret-weapon-forest-and-landscape-restoration (Accessed 15 October 2015).
Chen, J. (2010). Comparison of Energy E�ciency of Developed Regions in China at Similar Economic Level between 1995 and 2007. Journal of Sustainable Development 3(4): pp 97-101.
IEA (2007). Biomass for Power Generation and CHP. Available at https://www.iea.org/techno/essentials3.pdf (Accessed Feb 6 2013).
CSF (2013). Website Chinese State Forestry. Available at http://english.forestry.gov.cn/web/index.do (Accessed Feb 6 2013).
EC-JRC, European Commission - Joint Research Centre and Institute for Environment and Sustainability (2010). International Reference Life Cycle Data System (ILCD) Handbook – General Guide
for Life Cycle Assessment – Detailed Guidance. Publications O�ce of the European Union, Luxembourg.
FAO (2006). Global Planted Forests Thematic Study: Results and Analysis, by A. Del Lungo, J. Ball and J. Carle. Planted Forests and Trees Working Paper 38, Rome.
FAO (2010). Global Forests Resources Assessment, Forestry Paper 163. Available at www.fao.org/forestry (accessed 6 February 2013)
Gustavsson, L., Pingoud, K., et al. (2001). Carbon Dioxide Balance of Wood Substitution:Comparing Concrete- and Wood-Framed Buildings. Mitigation and Adaptation Strategies for
Global Change. 11(3): 667-691.
IEA (2007). Biomass for Power Generation and CHP. Available athttps://www.iea.org/techno/essentials3.pdf. Accessed 6 Feb 2013
References
7
8
9
10
6
4
5
0
1
2
3
RegularTeak
Ann
ual y
ield
(m3
/ ha)
A-qualitymaterial(Guadua)
A-qualitymaterial(MOSO)
EucalyptusWestemRed Cedar
Scots PineEuropeanOak
SWB(MOSO)
SWB(Guadua)
Flattenedbamboo(MOSO)
52. INBAR Technical Report No. 3551. INBAR Technical Report No. 35
Pingoud, K., Perälä, A.-L., et al., (2003). Greenhouse Gas Impacts of Harvested Wood Products.
Evaluation and Development of Methods. VTT Tiedotteita, Research Notes 2189. 120 pp.
Putz, F.E., Zuidema, P.A., Synnott, T., Peña-Claros, M., Pinard, M.A., Sheil, D., Vanclay, J.K., Sist, P., Gourlet-Fleury, S., Griscom, B., Palmer, J. & Zagt, R. (2012). Sustaining Conservation Values in Selectively Logged Tropical Forests: The Attained and the Attainable. Conservation Letters, 5 (2012) 296–303.
Rebelo, C. & Buckingham, K.C (2015, in publication). Bamboo: The Opportunities for Forest and Landscape Restoration. Unasylva: Forest and Landscape Restoration.
Solomon, S., Qin, D., Manning, M., Chen, Z., Marquis, M., Averyt, K.B., Tignor, M. & Miller, H.L. (2007).IPCC Fourth Assessment Report: Climate Change (AR4), The Physical Science Basis. Contribution of Working Group I to the Fourth Assessment Report of the Intergovernmental Panel on Climate Change. Cambridge University Press: Cambridge, UK. Available at www.ipcc.ch (accessed 6 February 2013)
State Forestry Administration of P.R. China (2010). China’s Forest Resources Status and Dynamic Change. Forestry Economics, (2):66-72.
UN. (2014). Forests: New York Declaration on Forests Action Statements and Action Plans. United Nations Climate Summit. 23rd September 2014; United Nations. Available at http://www.un.org/climatechange/summit/action-areas/#forests
USDA Forest Service (2013). Silvics manuals. Available at http://www.na.fs.fed.us/pubs/silvics_manual/Volume_1/thuja/plicata.htm
Van Dam, J. & Savenije, H. (2011). Enhancing the Trade of Legally Produced Timber - A Guide to
Initiatives. Tropenbos International: Wageningen, the Netherlands.
Van der Lugt, P. & Lobovikov, M. (2008). Markets for Bamboo Products in the West. Bois et Forêts des
Tropiques, 295(1): pp 81-90. CIRAD: Paris, France.
Van der Lugt, P. (2008). Design interventions for stimulating bamboo commercialization.PhD thesis. Delft University of Technology. ISBN 978-90-5155-047-4, VSSD: Delft, the Netherlands.
Van der Lugt, P., Vogtländer, J.G. & Brezet J.C (2009a). Bamboo, a Sustainable Solution for Western
Europe. Design cases, LCAs and Land-use. ISBN 978-90-6562-196-2, VSSD: Delft, the Netherlands.
Van der Lugt, P., Vogtländer, J.G., &Brezet J.C. (2009b). Bamboo, a Sustainable Solution for Western Europe. INBAR Technical Report no. 30. International Network for Bamboo and Rattan, Beijing.
Hodgdon, B.D., Hughell, D., Ramos, V.H. & Balas McNab, R. (2015). Deforestation Trends in the Maya
Biosphere Reserve, Guatemala (2000-2013). Rainforest Alliance, CONAP, Wildlife Conservation Society.
INBAR (2014). Bamboo: A Strategic Resource for Countries to Reduce the Effects of Climate Change. INBAR Policy Synthesis Report No. 1.
IPCC, 2007. Agriculture in Climate Change 2007: Mitigation. Contribution of Working Group III to the Fourth Assessment Report of the Intergovernmental Panel on Climate Change. Cambridge University Press: Cambridge, UK and New York, NY, USA:
Kuehl, Y. & Yiping, L. (2011). Carbon Off-setting with Bamboo. INBAR Working Paper 71. International Network for Bamboo and Rattan: Beijing, China.
Kuehl, Y., Henley, G. & Yiping, L. (2011). The Climate Change Challenge and Bamboo: Mitigation and
Adaptation. INBAR Working Paper 65. International Network for Bamboo and Rattan: Beijing, China.
Laestadius, L., Buckingham, K., Maginnis, S. & Saint-Laurent, C. (2015).Back to Bonn and Beyond: A History of Forest Landscape Restoration and an Outlook for the FutureUnasylva: Forest and Landscape Restoration
Laestadius, L., Maginnis, S., Minnemayer, S., Patapov, P., Saint-Laurent, C. & Sizer, N. (2011). Mapping Opportunities for Forest Landscape Restoration. Unasylva 238; Vol. 62. 2011/12
Yiping, L., Yanxia, L., Buckingham, K., Henley, G. & Guomo, Z. (2010). Bamboo and Climate Change
Mitigation. INBAR Technical Report no. 32. International Network for Bamboo and Rattan: Beijing, China.
MAF - New Zealand Ministry of Agriculture and Forestry (2008). Afforestation Grant Scheme Guidelines.
Marland, E. S., Stellar, K., et al., (2010). A distributed approach to accounting for carbon inwood products, Mitigation and Adaptation Strategies for Global Change. 15(1): 71-91.
Minnemeyer, S., Laestadius, L., Sizer, N., Saint-Laurent, C. & Potapov, P. 2011. A World of Opportunity. Washington, D.C., World Resources Institute. Available at: www.wri.org/restoringforests.
Mishra, G., Giri, K., Panday, S., Kumar, R. & Bisht, N.S. 2014. Bamboo: Potential Resource for Eco-Restoration of Degraded Lands. Journal of Biology and Earth Sciences, 4 (2) 130-136
Qi, L. H., Liu G. L.,Fan S. H., et al., (2009). E�ects of Di�erent Tending Measures on CarbonDensity, Storage, and Allocation Pattern of Phyllostachy edulis Forests in Western Fujian Province.Chinese Journal of Ecology. 28(8): 1482-1488. (In Chinese with English summary).

Verchot, L., Krug, T., Lasco, R.D., Ogle, S., Raison, J., Yue Li, Martino, D.L., McConkey, B.G. & Smith, P. (2006). IPCC Guidelines for National Greenhouse Gas Inventories. Volume 4, Chapter 6 Grass Land. Available at www.ipcc.ch (Accessed 6 February 2013)
Vogtländer, J.G. (2010). A Practical Guide to LCA for Students, Designers and Business Managers,
Cradle-to-Grave and Cradle-to-Cradle. VSSD: Delft, the Netherlands
Vogtländer J.G., Baetens B., Bijma A., Brandjes E., Lindeijer E., Segers M., Witte F., Brezet J.C. & Hendriks C. (2010a). LCA-based Assessment of Sustainability: the Eco-costs/Value Ratio (EVR).VSSD: Delft, the Netherlands. ISBN 978-90-6562-233-4
Vogtländer, J.G., Van der Lugt, P. & Brezet, J.C. (2010b); The Sustainability of Bamboo Products for Local and Western European Applications. LCAs and Land-Use; Journal of Cleaner Production 18 (2010) 1260-1269
Vogtländer, J.G. (2014). Life Cycle Assessment and Carbon Sequestration - Bamboo Products of MOSO
International – Update 2014. Delft University of Technology
Vogtländer, J.G., van der Velden N.M. & Van der Lugt, P. (2014). Carbon Sequestration in LCA: A Proposal for a New Approach Based on the Global Carbon Cycle: Cases on Wood and on Bamboo. Int J Life Cycle Assessment, (2014) 19: 13-23
Werner F., Althaus H.J., Künninger T., Richter K. & Jungbluth N (2007) Life Cycle Inventories of Wood as Fuel and Construction Material. Ecoinvent Report No. 9. Swiss Centre for Life Cycle Inventories, Dübendorf
WWF (2012). Living Planet Report. WWF International, Gland, Switzerland, Gland, Switzerland
Xiao, F. M., Fan, S. H., Wang, S. L., et al., (2009). Soil Carbon Cycle of Phyllostachy edulis
Plantation in Huitong Region, Hunan Province. Scientia Silave Sinicae, 6: 11-15. (In Chinese withEnglish summary).
Zhou, G. M. & Jiang, P. K., (2004). Density, storage and spatial distribution of carbon in Phyllostachys pubescens forest. Scientia Silvae Sinicae, 6: 20-24. (In Chinese with English summary).
Zhou, G. M. (2006). Research on Bamboo Forest Ecosystem Carbon Storage, Distribution and
Fixation. Ph. D Dissertation. Zhejiang University.
Zhou G., Shi Y., Lou Y., Li J., Kuehl, Y., Chen, J., Ma, G., He Y., Wang X. and Yu T. (2013). Methodology
for Carbon Accounting and Monitoring of Bamboo Afforestation Projects in China. INBAR.
53. INBAR Technical Report No. 35