Embed Size (px)
Citation preview
The internationaldevelopment of
the French economy
Investments
2017
Foreign investment
2017
1Introduction
10INTERNATIONAL
CONTEXT
4-5FOREWORD
6-72017 SUMMARY
Co
nte
nts
2Foreign
investment in France
in 2017
22
PROJECTS AND JOBS
26
SOURCE COUNTRIES
31
BUSINESS ACTIVITIES
39
BUSINESS SECTORS
44
INVESTMENT TYPES
48
FINANCIAL INVESTMENTS
3Investment
attractiveness of France’s regions
in 201756
REGIONAL ANALYSIS
66THE CONTRIBUTION
OF FOREIGN SUBSIDIARIES TO FRANCE’S REGIONAL ECONOMIES
4Appendices
78JOB-CREATING PHYSICAL INVESTMENT
SELECTION CRITERIA
82BUSINESS FRANCE
- 5 -
2 0 1 7 R E P O R T - B U S I N E S S F R A N C E FOREIGN INVESTMENT IN FRANCE
FOREWORD
The way France is seen abroad has improved no end in recent times.
International media coverage of the election of France’s President in May 2017 helped to shape an image of France as a country resisting the extremes of right and left, and eager to face a future of reforms led by a trusted new generation of politicians.
Today, foreign investors are hailing our country as a sound business destination, with a fascinatingly creative economy. More than half of foreign decision-makers1 (54%) believe that France has become a more compelling proposition in recent years, while 84% (up 10%pts) now consider France to be an attractive business location.
The evidence itself could not be clearer: France’s attractiveness is growing constantly.
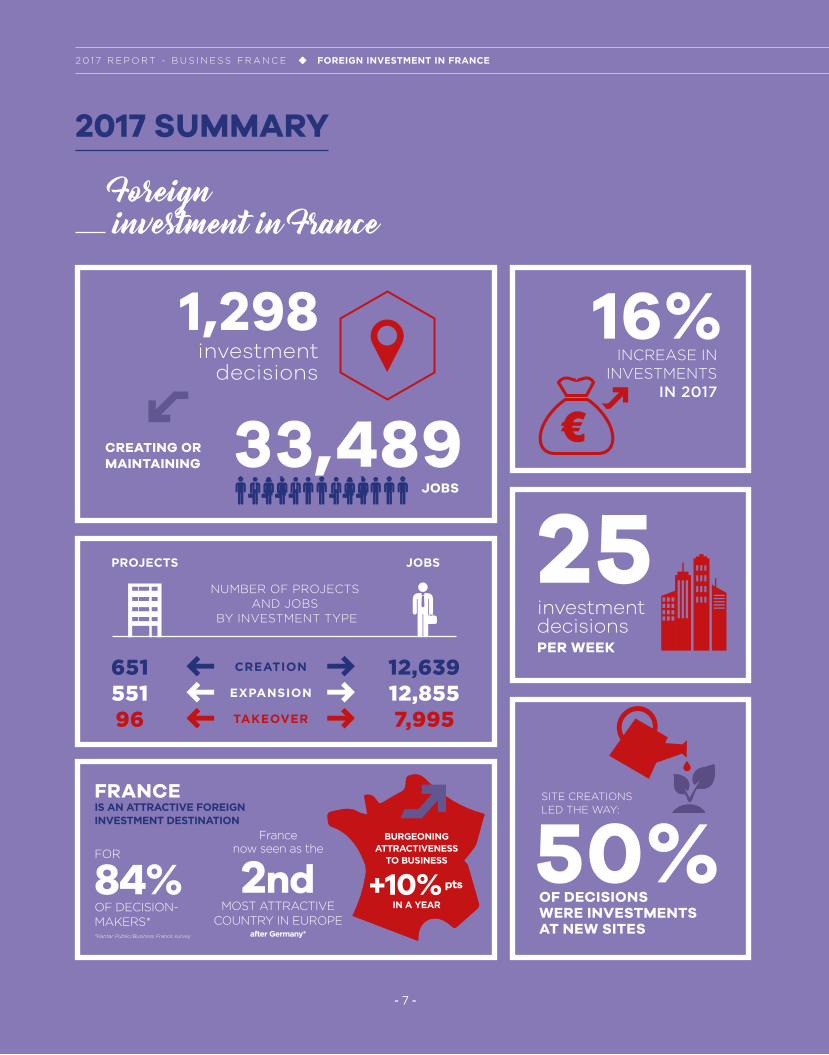
In 2017, an average of 25 new investment decisions were recorded every week, with France receiving 1,298 job-creating foreign investments, up 16% from 1,117 in 2016. Together, these investments created or maintained 33,489 jobs.
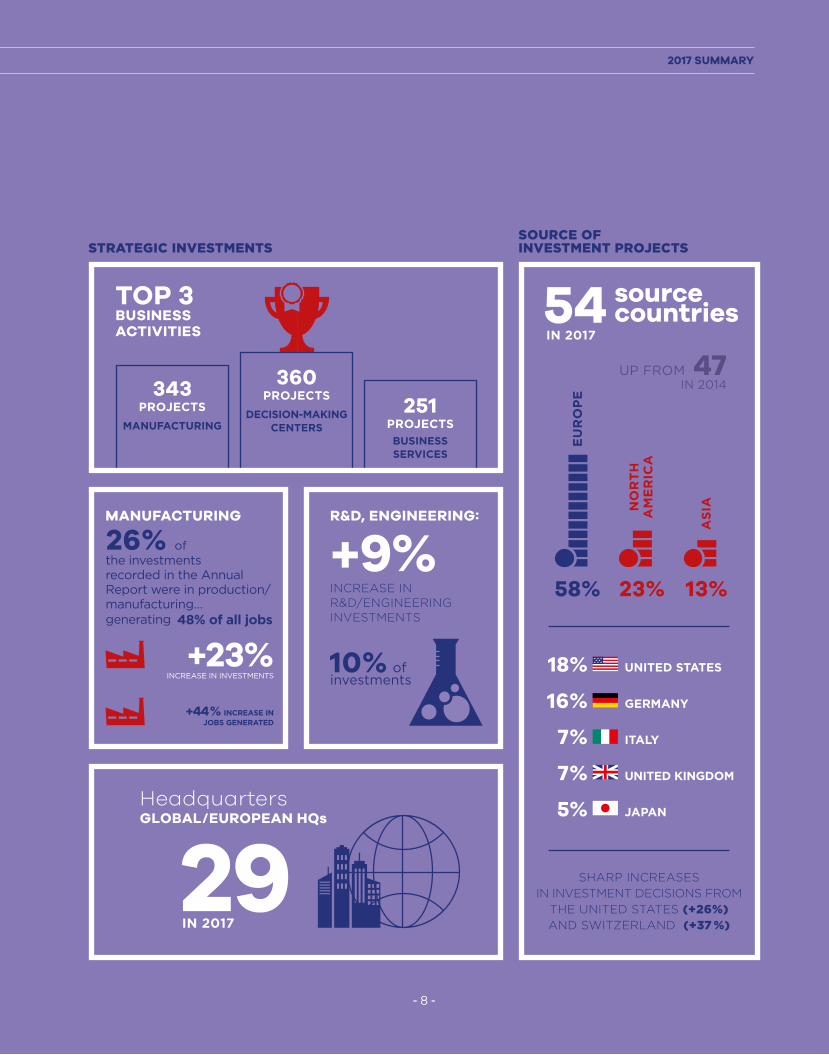
When asked about the criteria making France attractive to investment, chief executives of multinational businesses established in France pointed, among other things, to France’s industrial base (84%). In the light of such recognition, France continues to attract investment to ‘strategic’ activities, and has now been Europe’s leading destination for foreign investment in industry for more than 15 years.
In 2017, investments in production / manufacturing operations were up 23% year-on-year, accounting for 26% of all foreign investments in France and 48% of jobs thereby generated.
Examples include General Electric (United States), which decided to invest €120 million to establish a new wind turbine blade production facility in Cherbourg (Normandy), creating more than 500 jobs; Toyota, which announced a new €300 million investment at its Toyota Motor Manufacturing France vehicle production facility in Onnaing, near Valenciennes (Hauts de France region); and Dutch firm Plukon, which acquired ailing French group Duc’s poultry slaughter and meat processing sites in the Bretagne (Brittany), Occitanie and Ile de France (Paris) regions. This €20 million investment to modernize production facilities saved nearly 800 jobs.
Innovation is another of France’s main draws as a business destination.
More than eight in 10 (85%) foreign business leaders say that pro-innovation government policy has made France a more attractive location for their companies, and the 125 investment decisions involving R&D, engineering and design in 2017 bear out this trend.
Investments such as these included those by American firm ZenDesk, a global leader in customer service software development, which decided to double its R&D personnel in Montpellier by recruiting a further 50 engineers. Meanwhile, German group Sartorius, which specializes in producing consumables for the pharmaceutical industry, decided to significantly increase R&D capacity by hiring 200 new employees, including 80 at its facility near Marseille.
The spectacular rise in funding startups through venture and growth capital is also making France one of the world’s leading startup nations. In the most recent EY Venture Capital survey, France was ranked second in Europe for fundraising, both in terms of the number of deals and the sums raised, which exceeded a record €2.5 billion in 2017 (up 16.2%). Another report, “Tech Funding Trends in France” by CB Insights, highlighted the sound health of fundraising in France, with 743 funding deals confirmed in 2017 totaling US$3.2 billion (up 49%). The three largest fundraising rounds in France in 2017 – Actility (€75 million), ManoMano (€60 million) and Vestiaire Collective (€58 million) – are all in their own way symbols of French entrepreneurial momentum and success.
While more French startups are going global than ever before, increasing numbers of their foreign counterparts are heading to France to build their business. NanoRaven, a Brazilian startup and 2017 French Tech Ticket winner that designs and builds communication systems for nanosatellites, set up in Montpellier, close to the city’s University Space Center, the only French higher education establishment to offer the European Space Agency’s “Fly Your Satellite” program. Meanwhile, Mexican FinTech startup ZaveApp, another 2017 French Tech Ticket winner, offering virtual piggy bank services for smartphones, decided to establish itself in France and join the Station F incubator in Paris.
This report sheds light on the twin aspects determining the international development of the French economy, highlighting the gains to be made by businesses
1 Kantar France/Business France survey, 2017.
- 5 -
FOREWORD
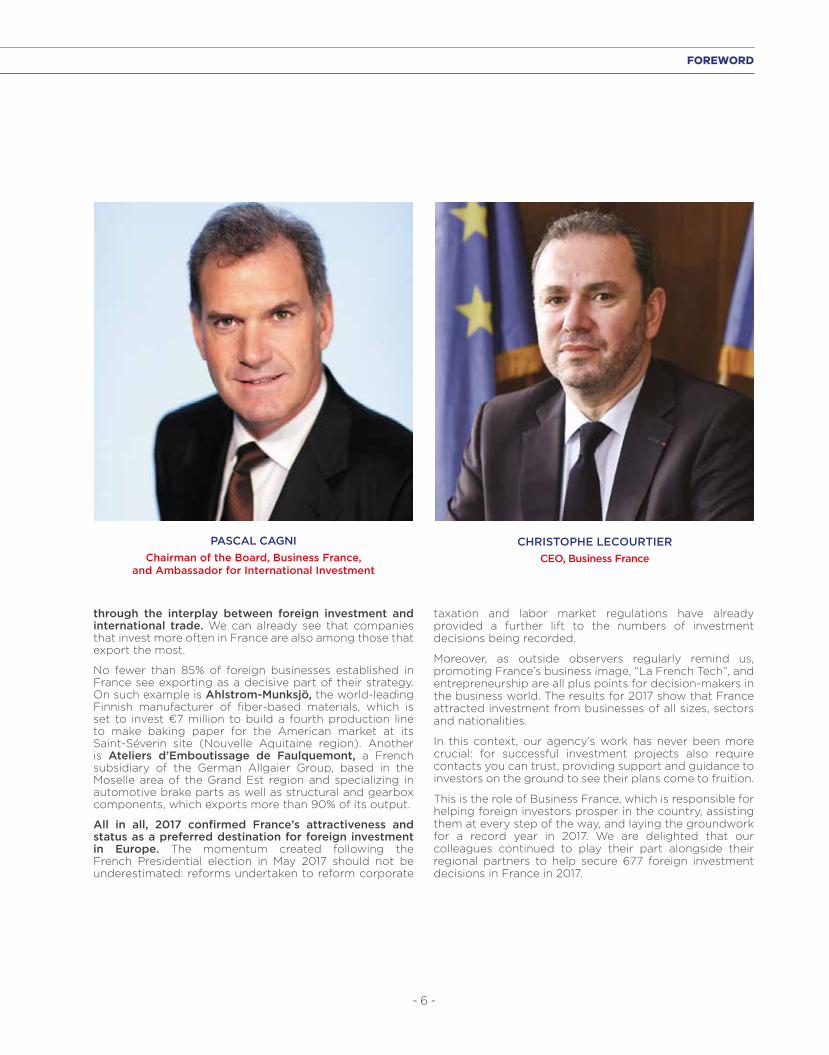
CHRISTOPHE LECOURTIERCEO, Business France
PASCAL CAGNIChairman of the Board, Business France,
and Ambassador for International Investment
through the interplay between foreign investment and international trade. We can already see that companies that invest more often in France are also among those that export the most.
No fewer than 85% of foreign businesses established in France see exporting as a decisive part of their strategy. On such example is Ahlstrom-Munksjö, the world-leading Finnish manufacturer of fiber-based materials, which is set to invest €7 million to build a fourth production line to make baking paper for the American market at its Saint-Séverin site (Nouvelle Aquitaine region). Another is Ateliers d’Emboutissage de Faulquemont, a French subsidiary of the German Allgaier Group, based in the Moselle area of the Grand Est region and specializing in automotive brake parts as well as structural and gearbox components, which exports more than 90% of its output.
All in all, 2017 confirmed France’s attractiveness and status as a preferred destination for foreign investment in Europe. The momentum created following the French Presidential election in May 2017 should not be underestimated: reforms undertaken to reform corporate
taxation and labor market regulations have already provided a further lift to the numbers of investment decisions being recorded.
Moreover, as outside observers regularly remind us, promoting France’s business image, “La French Tech”, and entrepreneurship are all plus points for decision-makers in the business world. The results for 2017 show that France attracted investment from businesses of all sizes, sectors and nationalities.
In this context, our agency’s work has never been more crucial: for successful investment projects also require contacts you can trust, providing support and guidance to investors on the ground to see their plans come to fruition.
This is the role of Business France, which is responsible for helping foreign investors prosper in the country, assisting them at every step of the way, and laying the groundwork for a record year in 2017. We are delighted that our colleagues continued to play their part alongside their regional partners to help secure 677 foreign investment decisions in France in 2017.
- 6 -
- 7 -
Foreign investment in France
651 12,639551 12,85596 7,995
CREATION
EXPANSION
TAKEOVER
NUMBER OF PROJECTS AND JOBS
BY INVESTMENT TYPE
PROJECTS JOBS 25
INCREASE IN INVESTMENTS
IN 2017
16%
SITE CREATIONS LED THE WAY:
OF DECISIONS WERE INVESTMENTS AT NEW SITES
50%
CREATING OR MAINTAINING
JOBS
33,489
investmentdecisions
1,298
FRANCEIS AN ATTRACTIVE FOREIGN INVESTMENT DESTINATION
*Kantar Public/Business France survey
MOST ATTRACTIVE COUNTRY IN EUROPE
after Germany*
France now seen as the
2nd84%OF DECISION- MAKERS*
+10% pts
BURGEONING ATTRACTIVENESS
TO BUSINESS
IN A YEAR
2017 SUMMARY
investment decisionsPER WEEK
FOR
- 7 -
2 0 1 7 R E P O R T - B U S I N E S S F R A N C E FOREIGN INVESTMENT IN FRANCE
- 7 -
- 8 -
2017 SUMMARY
STRATEGIC INVESTMENTS
MANUFACTURING R&D, ENGINEERING:
48% of all jobs
26% of +9%INCREASE IN R&D/ENGINEERING INVESTMENTS
investments
the investments recorded in the Annual Report were in production/ manufacturing… generating
10% of
HeadquartersGLOBAL/EUROPEAN HQs
29IN 2017
SHARP INCREASES IN INVESTMENT DECISIONS FROM
THE UNITED STATES (+26%) AND SWITZERLAND (+37 %)
54 sourcecountries
+23% INCREASE IN INVESTMENTS
+44 % INCREASE IN JOBS GENERATED
ITALY7%
UNITED KINGDOM 7%
GERMANY16%
JAPAN5%
UNITED STATES 18%
EU
RO
PE
58%
NO
RT
H
AM
ER
ICA
23%
AS
IA
13%
SOURCE OFINVESTMENT PROJECTS
IN 2017
IN 2014UP FROM 47
TOP 3 BUSINESS ACTIVITIES
BUSINESS SERVICES
251PROJECTS
DECISION-MAKING CENTERS
360PROJECTS
MANUFACTURING
343PROJECTS
- 8 -- 8 -

1

Introduction10 INTERNATIONAL CONTEXT
- 11 -
2 0 1 7 R E P O R T - B U S I N E S S F R A N C E FOREIGN INVESTMENT IN FRANCE
CROISSANCEMONDIALE
INTERNATIONALCONTEXT
The aim of this report is to analyze trends in job-creating foreign investment in France, providing key information on inward investment and talking points about the country’s attractiveness to business. In addition to decision-makers hailing France’s structural advantages over other countries, renewed growth throughout the global economy is improving the French business climate. This conducive context for companies to pursue their international development by tapping into growing markets is boosting France’s investment attractiveness, which is now entering a new phase.
GLOBAL GROWTH ON THE RISE
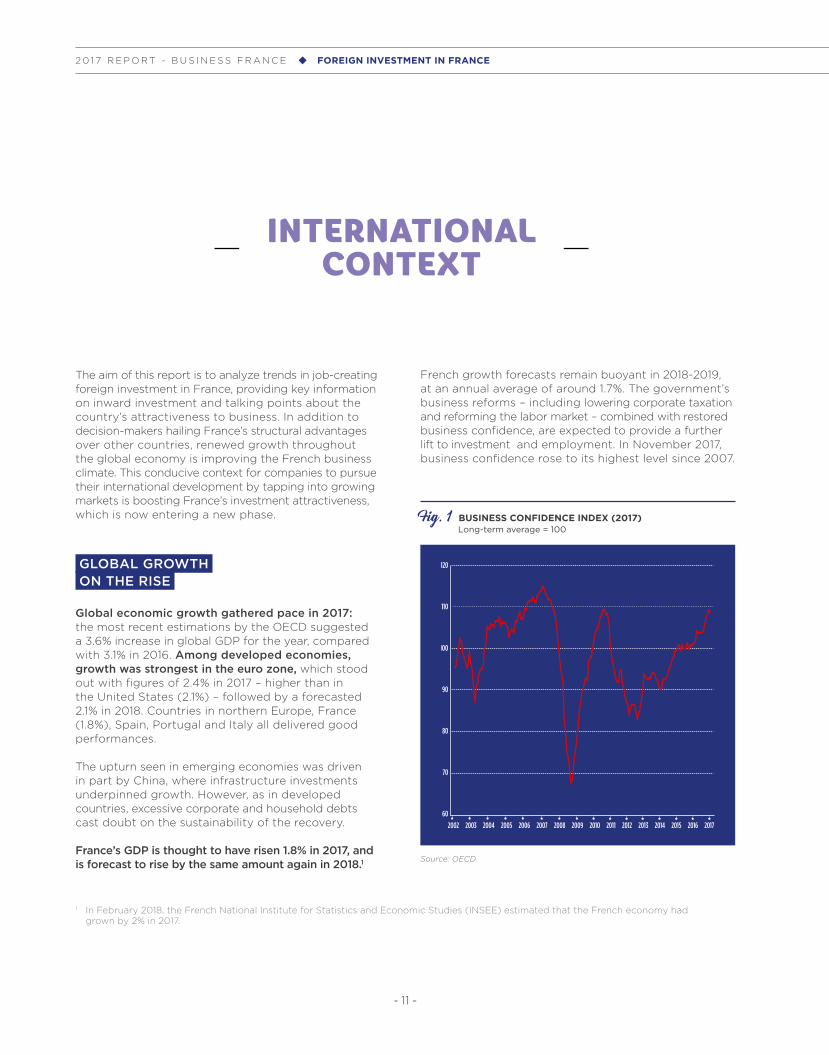
Global economic growth gathered pace in 2017: the most recent estimations by the OECD suggested a 3.6% increase in global GDP for the year, compared with 3.1% in 2016. Among developed economies, growth was strongest in the euro zone, which stood out with figures of 2.4% in 2017 – higher than in the United States (2.1%) – followed by a forecasted 2.1% in 2018. Countries in northern Europe, France (1.8%), Spain, Portugal and Italy all delivered good performances.
The upturn seen in emerging economies was driven in part by China, where infrastructure investments underpinned growth. However, as in developed countries, excessive corporate and household debts cast doubt on the sustainability of the recovery.
France’s GDP is thought to have risen 1.8% in 2017, and is forecast to rise by the same amount again in 2018.1 Source: OECD
French growth forecasts remain buoyant in 2018-2019, at an annual average of around 1.7%. The government’s business reforms – including lowering corporate taxation and reforming the labor market – combined with restored business confidence, are expected to provide a further lift to investment and employment. In November 2017, business confidence rose to its highest level since 2007.
120
110
100
90
80
70
60
Graph1. Croissance économique mondiale
Graph2. Attractivité de la France
Graph6. Évolution régionale des flux d'IDE (2016-2017)
Graph7. Flux d'IDE entrants : top 10 des pays d'accueil (2017)
Chap1.1
2002 2003 2004 2005 2006 2007 2008 2009 2010 2011 2012 2013 2014 2015 2016 2017
2016 2017NorthAmerica
Transitioneconomies
Developing Asia and Oceania
Europe Africa Latin America and the Caribbean
Other developed countries
1,814
1,518
-164
-144
-11 11 408
-33% -27% -17% -1% 2% 3% 11%
0 50 100 150 200 250 300 350
United States
China
Hong Kong
Netherlands
Ireland
Australia
Brazil
Singapore
France
India
311
144
85
68
66
60
60
58
45
2014 2016 2017
100
90
80
70
60
50
40
30
20
10
0
39
33
28
38
35
27
54
26
20
US$ billion
50
Fig. 1 BUSINESS CONFIDENCE INDEX (2017)Long-term average = 100
1 In February 2018, the French National Institute for Statistics and Economic Studies (INSEE) estimated that the French economy had grown by 2% in 2017.
- 12 -
1 . INTRODUCTION
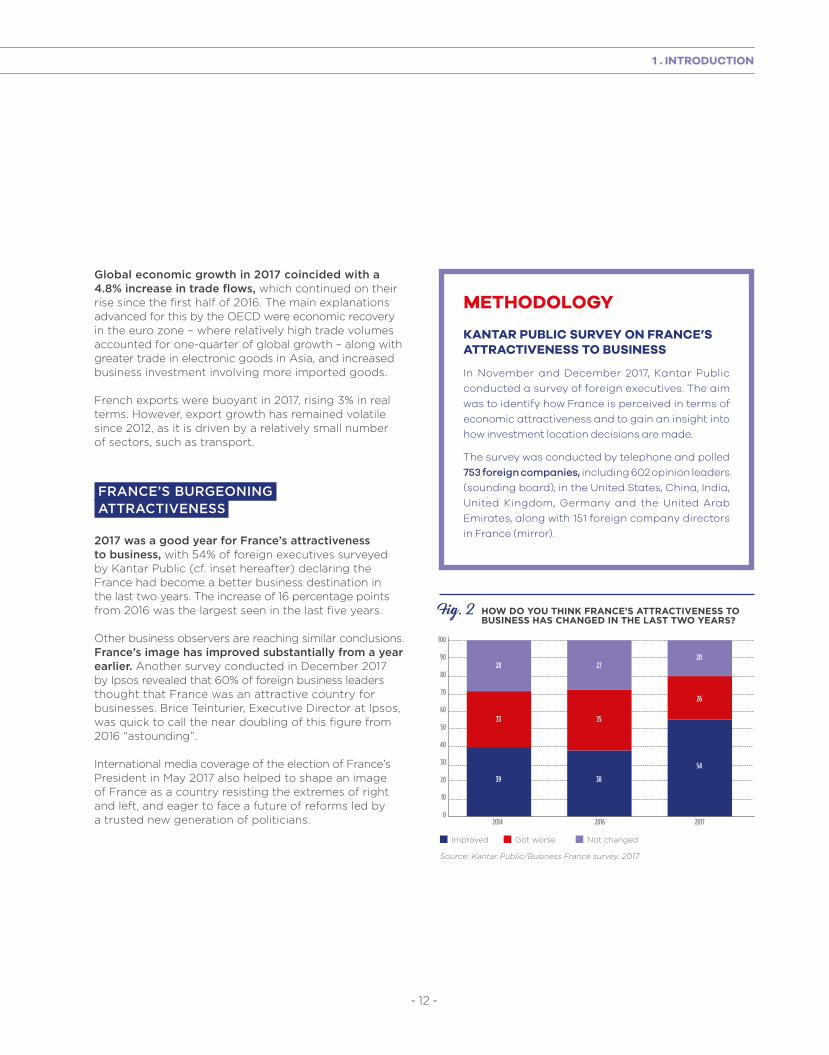
Source: Kantar Public/Business France survey, 2017
METHODOLOGY
KANTAR PUBLIC SURVEY ON FRANCE’S ATTRACTIVENESS TO BUSINESS
In November and December 2017, Kantar Public
conducted a survey of foreign executives. The aim
was to identify how France is perceived in terms of
economic attractiveness and to gain an insight into
how investment location decisions are made.
The survey was conducted by telephone and polled
753 foreign companies, including 602 opinion leaders
(sounding board), in the United States, China, India,
United Kingdom, Germany and the United Arab
Emirates, along with 151 foreign company directors
in France (mirror).
Global economic growth in 2017 coincided with a 4.8% increase in trade flows, which continued on their rise since the first half of 2016. The main explanations advanced for this by the OECD were economic recovery in the euro zone – where relatively high trade volumes accounted for one-quarter of global growth – along with greater trade in electronic goods in Asia, and increased business investment involving more imported goods.
French exports were buoyant in 2017, rising 3% in real terms. However, export growth has remained volatile since 2012, as it is driven by a relatively small number of sectors, such as transport.
FRANCE’S BURGEONING ATTRACTIVENESS
2017 was a good year for France’s attractiveness to business, with 54% of foreign executives surveyed by Kantar Public (cf. inset hereafter) declaring the France had become a better business destination in the last two years. The increase of 16 percentage points from 2016 was the largest seen in the last five years.
Other business observers are reaching similar conclusions. France’s image has improved substantially from a year earlier. Another survey conducted in December 2017 by Ipsos revealed that 60% of foreign business leaders thought that France was an attractive country for businesses. Brice Teinturier, Executive Director at Ipsos, was quick to call the near doubling of this figure from 2016 “astounding”.
International media coverage of the election of France’s President in May 2017 also helped to shape an image of France as a country resisting the extremes of right and left, and eager to face a future of reforms led by a trusted new generation of politicians.
120
110
100
90
80
70
60
Graph1. Croissance économique mondiale
Graph2. Attractivité de la France
Graph6. Évolution régionale des flux d'IDE (2016-2017)
Graph7. Flux d'IDE entrants : top 10 des pays d'accueil (2017)
Chap1.1
2002 2003 2004 2005 2006 2007 2008 2009 2010 2011 2012 2013 2014 2015 2016 2017
2016 2017NorthAmerica
Transitioneconomies
Developing Asia and Oceania
Europe Africa Latin America and the Caribbean
Other developed countries
1,814
1,518
-164
-144
-11 11 408
-33% -27% -17% -1% 2% 3% 11%
0 50 100 150 200 250 300 350
United States
China
Hong Kong
Netherlands
Ireland
Australia
Brazil
Singapore
France
India
311
144
85
68
66
60
60
58
45
2014 2016 2017
100
90
80
70
60
50
40
30
20
10
0
39
33
28
38
35
27
54
26
20
US$ billion
50
Fig. 2 HOW DO YOU THINK FRANCE’S ATTRACTIVENESS TO BUSINESS HAS CHANGED IN THE LAST TWO YEARS?
Improved Got worse Not changed
- 13 -
2 0 1 7 R E P O R T - B U S I N E S S F R A N C E FOREIGN INVESTMENT IN FRANCE
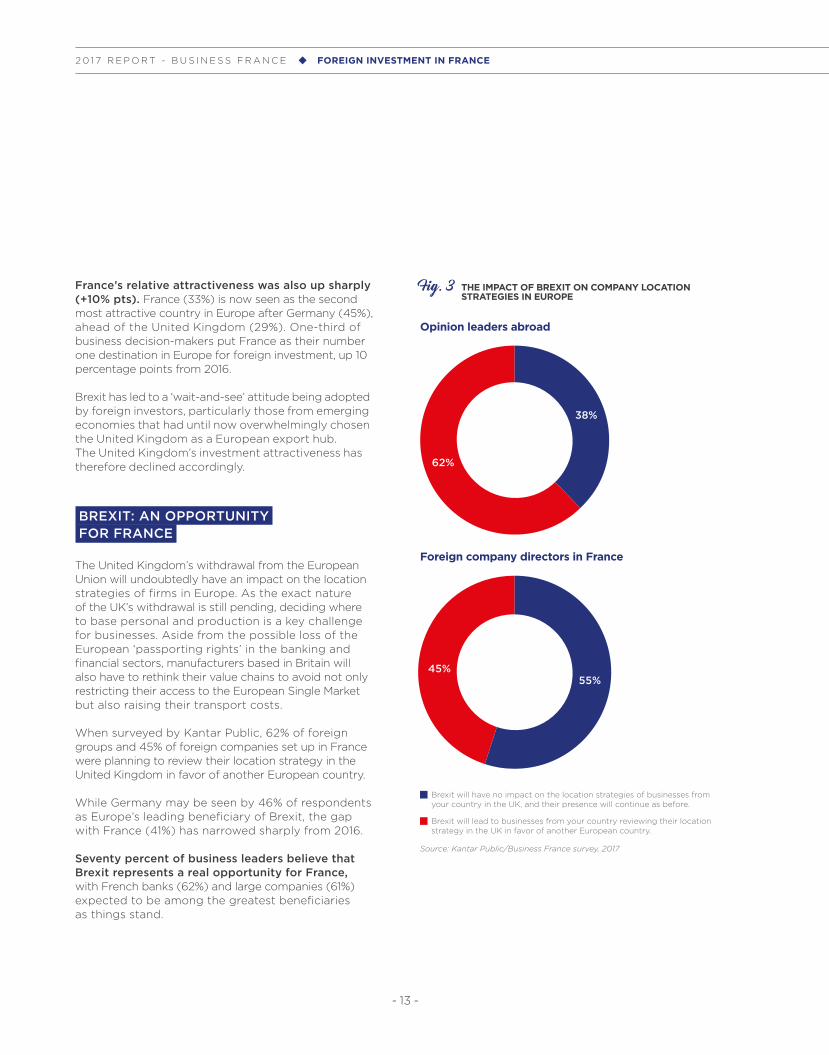
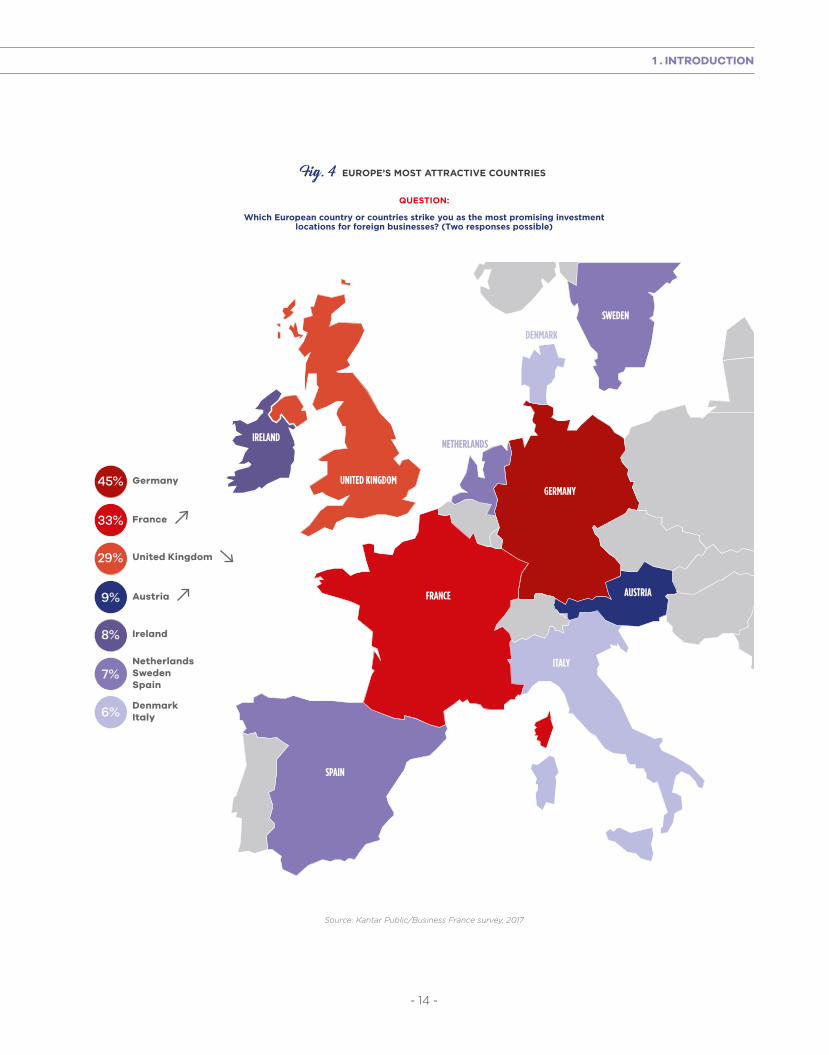
France’s relative attractiveness was also up sharply (+10% pts). France (33%) is now seen as the second most attractive country in Europe after Germany (45%), ahead of the United Kingdom (29%). One-third of business decision-makers put France as their number one destination in Europe for foreign investment, up 10 percentage points from 2016.
Brexit has led to a ‘wait-and-see’ attitude being adopted by foreign investors, particularly those from emerging economies that had until now overwhelmingly chosen the United Kingdom as a European export hub. The United Kingdom’s investment attractiveness has therefore declined accordingly.
BREXIT: AN OPPORTUNITY FOR FRANCE
The United Kingdom’s withdrawal from the European Union will undoubtedly have an impact on the location strategies of firms in Europe. As the exact nature of the UK’s withdrawal is still pending, deciding where to base personal and production is a key challenge for businesses. Aside from the possible loss of the European ‘passporting rights’ in the banking and financial sectors, manufacturers based in Britain will also have to rethink their value chains to avoid not only restricting their access to the European Single Market but also raising their transport costs.
When surveyed by Kantar Public, 62% of foreign groups and 45% of foreign companies set up in France were planning to review their location strategy in the United Kingdom in favor of another European country.
While Germany may be seen by 46% of respondents as Europe’s leading beneficiary of Brexit, the gap with France (41%) has narrowed sharply from 2016.
Seventy percent of business leaders believe that Brexit represents a real opportunity for France, with French banks (62%) and large companies (61%) expected to be among the greatest beneficiaries as things stand.
Fig. 3 THE IMPACT OF BREXIT ON COMPANY LOCATION STRATEGIES IN EUROPE
Opinion leaders abroad
38%
62%
Foreign company directors in France
55%45%
Source: Kantar Public/Business France survey, 2017
Brexit will have no impact on the location strategies of businesses from your country in the UK, and their presence will continue as before.
Brexit will lead to businesses from your country reviewing their location strategy in the UK in favor of another European country.
- 14 -
1 . INTRODUCTION
UNITED KINGDOM
SPAIN
ITALY
GERMANY
NETHERLANDS
SWEDEN
DENMARK
AUSTRIA
IRELAND
FRANCE
UNITED KINGDOM
SPAIN
ITALY
GERMANY
NETHERLANDS
SWEDEN
DENMARK
AUSTRIA
IRELAND
FRANCE
Germany45%
France33%
United Kingdom29%
Austria9%
Ireland8%
NetherlandsSweden Spain
7%
DenmarkItaly6%
QUESTION:
Which European country or countries strike you as the most promising investment locations for foreign businesses? (Two responses possible)
Fig. 4 EUROPE’S MOST ATTRACTIVE COUNTRIES
Source: Kantar Public/Business France survey, 2017
- 15 -
2 0 1 7 R E P O R T - B U S I N E S S F R A N C E FOREIGN INVESTMENT IN FRANCE
SPAIN
ITALY
GERMANY
POLAND
NETHERLANDS
BELGIUM
SWEDEN
AUSTRIA
IRELAND
FRANCE
ESPAGNE
ITALIE
ALLEMAGNE
POLOGNE
PAYS-BAS
BELGIQUE
SUÈDE
AUTRICHE
IRLANDE
FRANCE
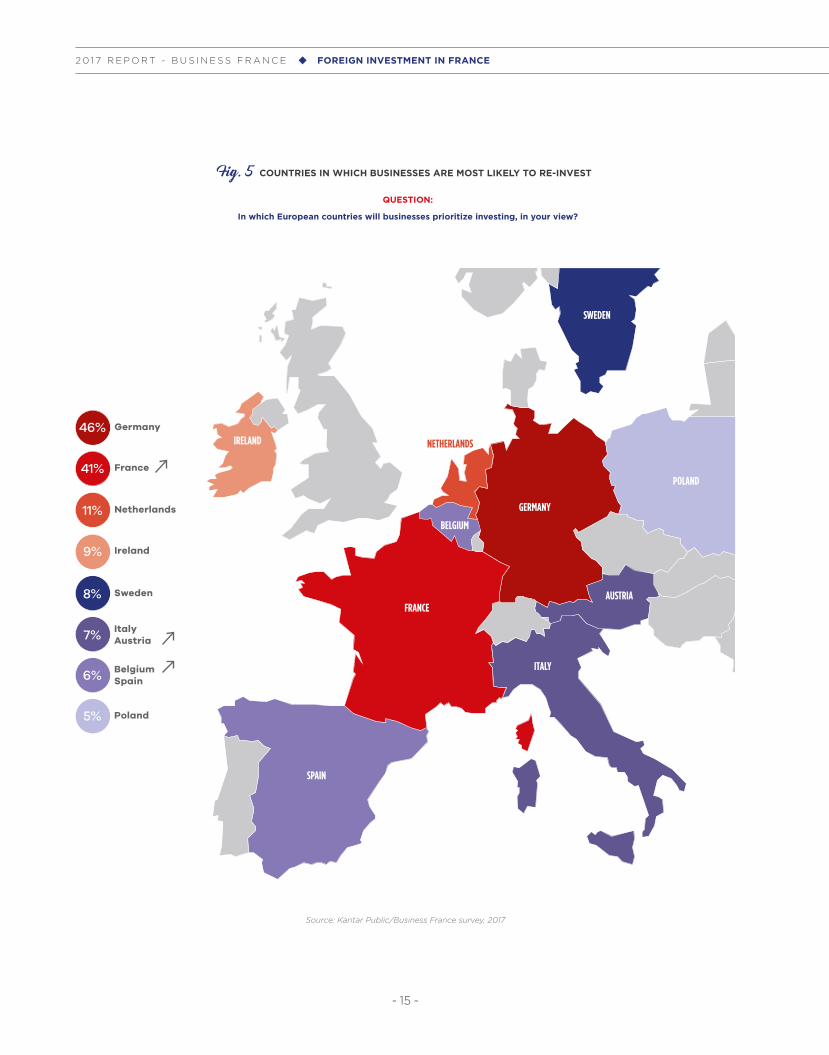
Germany46%
France41%
Ireland9%
Netherlands11%
Sweden 8%
ItalyAustria7%
BelgiumSpain6%
Poland5%
QUESTION:
In which European countries will businesses prioritize investing, in your view?
Fig. 5 COUNTRIES IN WHICH BUSINESSES ARE MOST LIKELY TO RE-INVEST
Source: Kantar Public/Business France survey, 2017
- 16 -
1 . INTRODUCTION
Multiple key strengths of a changing France
FRANCE RANKED FIRST FOR ‘SOFT POWER’ AMONG THE
WORLD’S LEADING NATIONS IN 2017
This report by PR firm Portland Communications examined the influence held by countries in six key areas – government, culture, education, engagement, enterprise, and digital – and highlighted a number of France’s strengths, including having a vast diplomatic network, and belonging to more multilateral and international organizations than any other country in the world.
FRANCE’S GLOBAL INFLUENCE ALSO
DETERMINED BY BUSINESS PERFORMANCES
According to the 2017 Fortune Global 500, there were 29 French firms among the world’s 500 largest companies. For the eighth year in a row in 2017, France came top in the Deloitte Technology Fast 500 EMEA, with 97 of the 500 fastest-growing technology companies in Europe, the Middle East and Africa. The top 10 French companies in the standings were: Ubitransports, Adikteev, Adomik, Actility, Interactiv Group, Delair, Quantmetry, BeAM, Voip Télécom and Biosynex.
FRENCH VENTURE CAPITAL GROWING RAPIDLY
France was ranked second in Europe for the number and value of venture capital deals in 2017. According to the most recent EY Venture Capital in France survey, sums invested in venture capital in France reached an all-time peak of €2.5 billion in 2017.
EUROPEAN BANKING AUTHORITY TO LEAVE
LONDON POST-BREXIT FOR PARIS IN 2019
Eight cities had applied to host the European banking regulator, including Luxembourg, Brussels, Warsaw and Vienna. Paris is already home to the European Securities and Markets Authority, one of the two other European financial supervisory bodies.
PARIS’ 12 MILLION+ INHABITANTS MAKE IT
EUROPE’S LARGEST URBAN AREA AND A TRULY
GLOBAL CITY
Home to more than 940,000 businesses and 650,000 students, it is also the leading host city for trade shows, the euro zone’s largest financial center, and Europe’s leading hotspot for R&D, boasting internat ional ly renowned educational institutions, such as HEC and ESSEC, which both feature in the top five of the Financial Times’ Masters in Management rankings.
FRANCE HOSTS MAJOR INTERNATIONAL SPORTING
EVENTS EVERY YEAR
The list in 2018 includes golf’s Ryder Cup, along with the Formula 1 French Grand Prix, the Gay Games, and the Women’s European Handball Championship, before the Women’s Football World Cup in 2019, the Rugby World Cup in 2023, and the Paris Olympics in 2024.
Paris was officially awarded the 2024 summer Olympic and Paralympic Games on September 13, 2017 at a ceremony in Peru. It will be the third occasion the French capital has hosted the games after 1900 and 1924. This time, 15,000 athletes and 20,000 journalists are expected to attend.
- 17 -
2 0 1 7 R E P O R T - B U S I N E S S F R A N C E FOREIGN INVESTMENT IN FRANCE
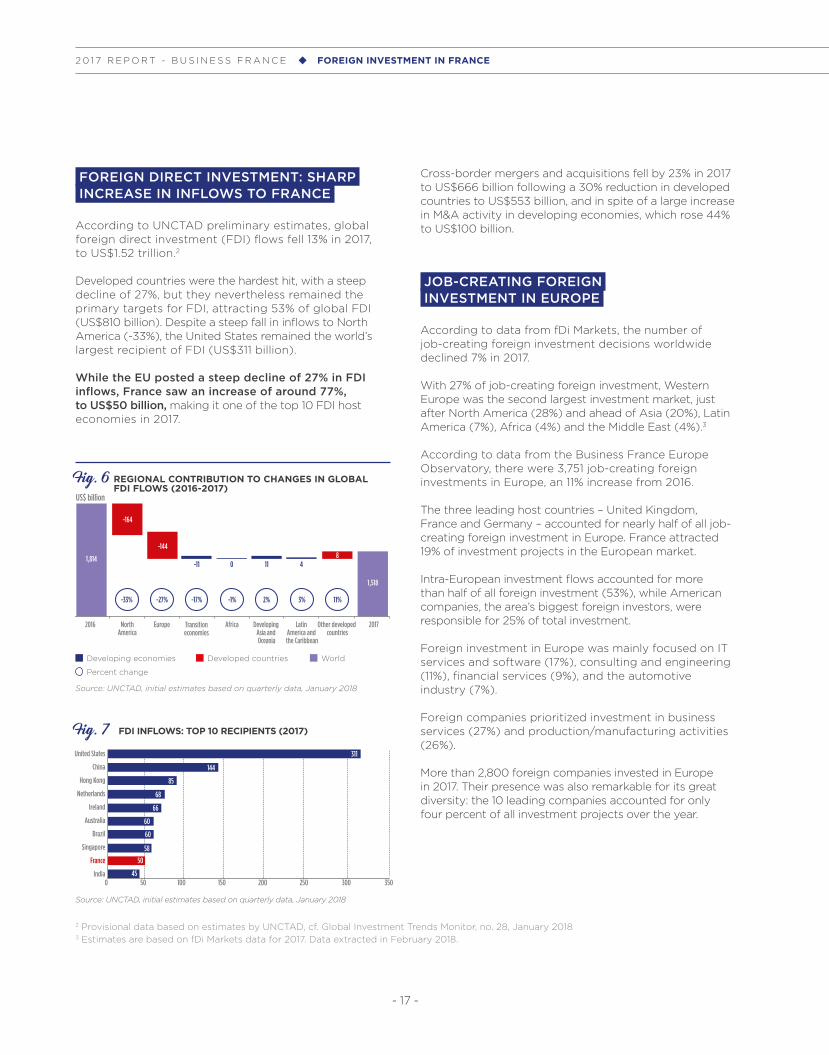
FOREIGN DIRECT INVESTMENT: SHARPINCREASE IN INFLOWS TO FRANCE
According to UNCTAD preliminary estimates, global foreign direct investment (FDI) flows fell 13% in 2017, to US$1.52 trillion.2
Developed countries were the hardest hit, with a steep decline of 27%, but they nevertheless remained the primary targets for FDI, attracting 53% of global FDI (US$810 billion). Despite a steep fall in inflows to North America (-33%), the United States remained the world’s largest recipient of FDI (US$311 billion).
While the EU posted a steep decline of 27% in FDI inflows, France saw an increase of around 77%, to US$50 billion, making it one of the top 10 FDI host economies in 2017.
JOB-CREATING FOREIGN INVESTMENT IN EUROPE
According to data from fDi Markets, the number of job-creating foreign investment decisions worldwide declined 7% in 2017.
With 27% of job-creating foreign investment, Western Europe was the second largest investment market, just after North America (28%) and ahead of Asia (20%), Latin America (7%), Africa (4%) and the Middle East (4%).3
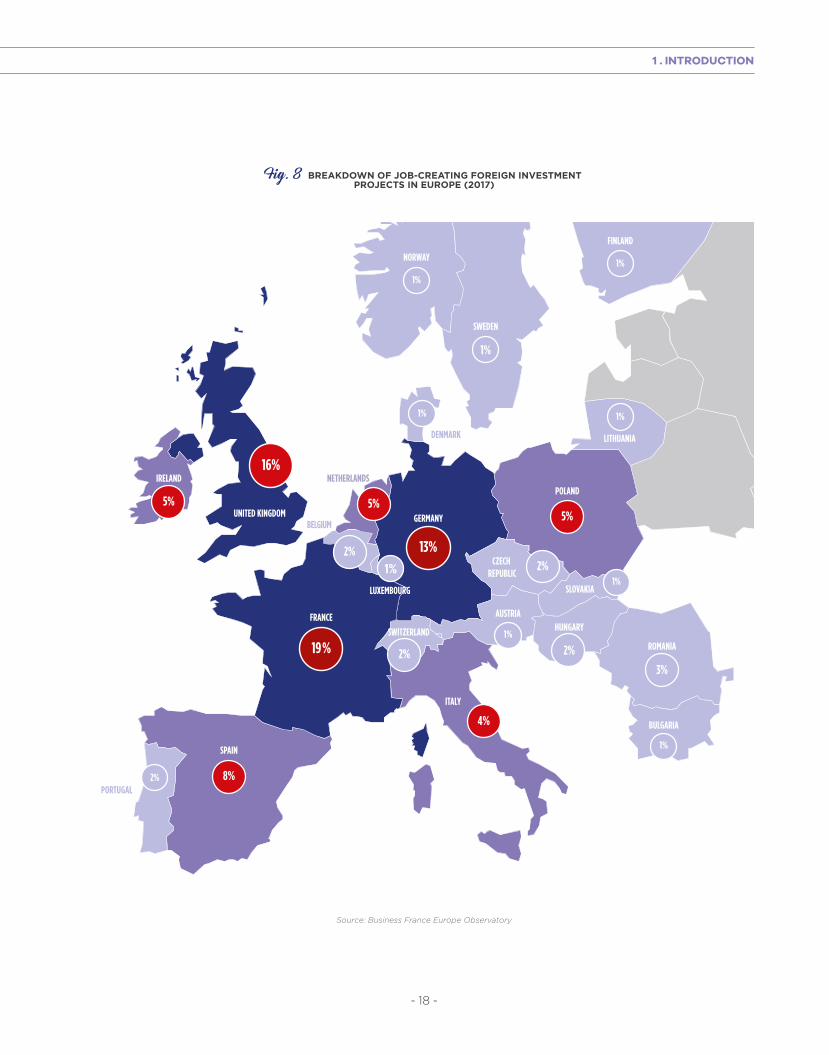
According to data from the Business France Europe Observatory, there were 3,751 job-creating foreign investments in Europe, an 11% increase from 2016.
The three leading host countries – United Kingdom, France and Germany – accounted for nearly half of all job-creating foreign investment in Europe. France attracted 19% of investment projects in the European market.
Intra-European investment flows accounted for more than half of all foreign investment (53%), while American companies, the area’s biggest foreign investors, were responsible for 25% of total investment.
Foreign investment in Europe was mainly focused on IT services and software (17%), consulting and engineering (11%), financial services (9%), and the automotive industry (7%).
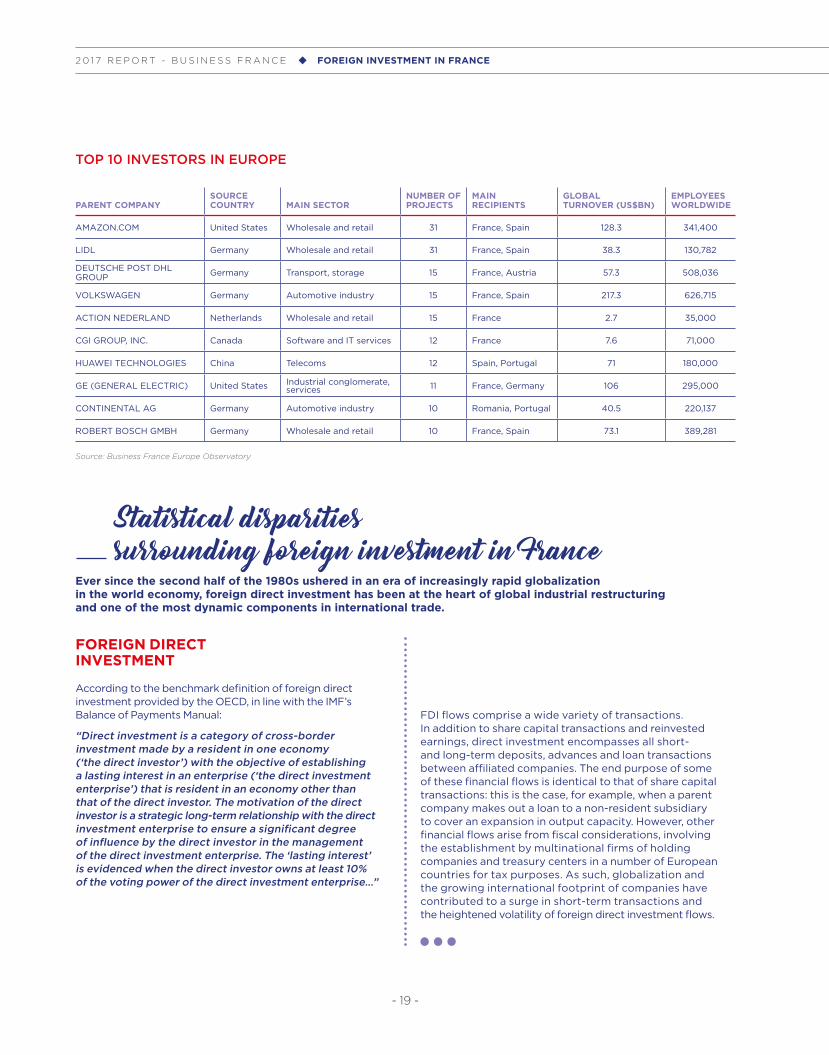
Foreign companies prioritized investment in business services (27%) and production/manufacturing activities (26%).
More than 2,800 foreign companies invested in Europe in 2017. Their presence was also remarkable for its great diversity: the 10 leading companies accounted for only four percent of all investment projects over the year.
Cross-border mergers and acquisitions fell by 23% in 2017 to US$666 billion following a 30% reduction in developed countries to US$553 billion, and in spite of a large increase in M&A activity in developing economies, which rose 44% to US$100 billion.
2 Provisional data based on estimates by UNCTAD, cf. Global Investment Trends Monitor, no. 28, January 20183 Estimates are based on fDi Markets data for 2017. Data extracted in February 2018.
120
110
100
90
80
70
60
Graph1. Croissance économique mondiale
Graph2. Attractivité de la France
Graph6. Évolution régionale des flux d'IDE (2016-2017)
Graph7. Flux d'IDE entrants : top 10 des pays d'accueil (2017)
Chap1.1
2002 2003 2004 2005 2006 2007 2008 2009 2010 2011 2012 2013 2014 2015 2016 2017
2016 2017NorthAmerica
Transitioneconomies
Developing Asia and Oceania
Europe Africa Latin America and the Caribbean
Other developed countries
1,814
1,518
-164
-144
-11 11 408
-33% -27% -17% -1% 2% 3% 11%
0 50 100 150 200 250 300 350
United States
China
Hong Kong
Netherlands
Ireland
Australia
Brazil
Singapore
France
India
311
144
85
68
66
60
60
58
45
2014 2016 2017
100
90
80
70
60
50
40
30
20
10
0
39
33
28
38
35
27
54
26
20
US$ billion
50
Fig. 6 REGIONAL CONTRIBUTION TO CHANGES IN GLOBAL FDI FLOWS (2016-2017)
Source: UNCTAD, initial estimates based on quarterly data, January 2018
Developing economies
Percent change
Developed countries World
120
110
100
90
80
70
60
Graph1. Croissance économique mondiale
Graph2. Attractivité de la France
Graph6. Évolution régionale des flux d'IDE (2016-2017)
Graph7. Flux d'IDE entrants : top 10 des pays d'accueil (2017)
Chap1.1
2002 2003 2004 2005 2006 2007 2008 2009 2010 2011 2012 2013 2014 2015 2016 2017
2016 2017NorthAmerica
Transitioneconomies
Developing Asia and Oceania
Europe Africa Latin America and the Caribbean
Other developed countries
1,814
1,518
-164
-144
-11 11 408
-33% -27% -17% -1% 2% 3% 11%
0 50 100 150 200 250 300 350
United States
China
Hong Kong
Netherlands
Ireland
Australia
Brazil
Singapore
France
India
311
144
85
68
66
60
60
58
45
2014 2016 2017
100
90
80
70
60
50
40
30
20
10
0
39
33
28
38
35
27
54
26
20
US$ billion
50
Fig. 7 FDI INFLOWS: TOP 10 RECIPIENTS (2017)
Source: UNCTAD, initial estimates based on quarterly data, January 2018
- 18 -
1 . INTRODUCTION
19 %
16%
5%
1%
1%
3%
4%
2%
2%
1%
1%
2% 8%
2%
5%
13%
UNITED KINGDOM
SPAIN
ITALY
GERMANY
SWITZERLAND
BELGIUM
NETHERLANDS
SWEDEN
1%
NORWAY
FINLAND
HUNGARY
ROMANIA
BULGARIA
SLOVAKIA
CZECH REPUBLIC
LITHUANIADENMARK
AUSTRIA
LUXEMBOURG
PORTUGAL
IRELAND
FRANCE
POLAND
1%
1%
1%
2%
5%
1%
Fig. 8 BREAKDOWN OF JOB-CREATING FOREIGN INVESTMENT PROJECTS IN EUROPE (2017)
Source: Business France Europe Observatory
- 19 -
2 0 1 7 R E P O R T - B U S I N E S S F R A N C E FOREIGN INVESTMENT IN FRANCE
PARENT COMPANYSOURCE COUNTRY MAIN SECTOR
NUMBER OF PROJECTS
MAIN RECIPIENTS
GLOBAL TURNOVER (US$BN)
EMPLOYEES WORLDWIDE
AMAZON.COM United States Wholesale and retail 31 France, Spain 128.3 341,400
LIDL Germany Wholesale and retail 31 France, Spain 38.3 130,782
DEUTSCHE POST DHL GROUP Germany Transport, storage 15 France, Austria 57.3 508,036
VOLKSWAGEN Germany Automotive industry 15 France, Spain 217.3 626,715
ACTION NEDERLAND Netherlands Wholesale and retail 15 France 2.7 35,000
CGI GROUP, INC. Canada Software and IT services 12 France 7.6 71,000
HUAWEI TECHNOLOGIES China Telecoms 12 Spain, Portugal 71 180,000
GE (GENERAL ELECTRIC) United States Industrial conglomerate, services 11 France, Germany 106 295,000
CONTINENTAL AG Germany Automotive industry 10 Romania, Portugal 40.5 220,137
ROBERT BOSCH GMBH Germany Wholesale and retail 10 France, Spain 73.1 389,281
FOREIGN DIRECT INVESTMENT
According to the benchmark definition of foreign direct investment provided by the OECD, in line with the IMF’s Balance of Payments Manual:
“Direct investment is a category of cross-border investment made by a resident in one economy (‘the direct investor’) with the objective of establishing a lasting interest in an enterprise (‘the direct investment enterprise’) that is resident in an economy other than that of the direct investor. The motivation of the direct investor is a strategic long-term relationship with the direct investment enterprise to ensure a significant degree of influence by the direct investor in the management of the direct investment enterprise. The ‘lasting interest’ is evidenced when the direct investor owns at least 10% of the voting power of the direct investment enterprise…”
TOP 10 INVESTORS IN EUROPE
Ever since the second half of the 1980s ushered in an era of increasingly rapid globalization in the world economy, foreign direct investment has been at the heart of global industrial restructuring and one of the most dynamic components in international trade.
Statistical disparities surrounding foreign investment in France
FDI flows comprise a wide variety of transactions. In addition to share capital transactions and reinvested earnings, direct investment encompasses all short- and long-term deposits, advances and loan transactions between affiliated companies. The end purpose of some of these financial flows is identical to that of share capital transactions: this is the case, for example, when a parent company makes out a loan to a non-resident subsidiary to cover an expansion in output capacity. However, other financial flows arise from fiscal considerations, involving the establishment by multinational firms of holding companies and treasury centers in a number of European countries for tax purposes. As such, globalization and the growing international footprint of companies have contributed to a surge in short-term transactions and the heightened volatility of foreign direct investment flows.
Source: Business France Europe Observatory
- 20 -
1 . INTRODUCTION
PARENT COMPANYSOURCE COUNTRY MAIN SECTOR
NUMBER OF PROJECTS
MAIN RECIPIENTS
GLOBAL TURNOVER (US$BN)
EMPLOYEES WORLDWIDE
AMAZON.COM United States Wholesale and retail 31 France, Spain 128.3 341,400
LIDL Germany Wholesale and retail 31 France, Spain 38.3 130,782
DEUTSCHE POST DHL GROUP Germany Transport, storage 15 France, Austria 57.3 508,036
VOLKSWAGEN Germany Automotive industry 15 France, Spain 217.3 626,715
ACTION NEDERLAND Netherlands Wholesale and retail 15 France 2.7 35,000
CGI GROUP, INC. Canada Software and IT services 12 France 7.6 71,000
HUAWEI TECHNOLOGIES China Telecoms 12 Spain, Portugal 71 180,000
GE (GENERAL ELECTRIC) United States Industrial conglomerate, services 11 France, Germany 106 295,000
CONTINENTAL AG Germany Automotive industry 10 Romania, Portugal 40.5 220,137
ROBERT BOSCH GMBH Germany Wholesale and retail 10 France, Spain 73.1 389,281
UNCTAD collects and aggregates FDI flow data provided by central banks without differentiating between the various components of these flows. Accordingly, no distinction is made between tax avoidance by businesses (intra-group loans) and new investment sites (share capital transactions in the strict sense of the term). Furthermore, the financial flows arising from internal loans made by multinational firms (intra-group loans) frequently comprise any number of transactions in both directions, inward and outward, which offset each other during the course of the year. The major fluctuations in intra-group loans render FDI flows extremely volatile.
To estimate FDI flows, both the IMF and the OECD now recommend using the “extended directional principle” methodology, which provides a more realistic economic picture of these transactions. It involves adjusting for intra-group loans so as to obtain a single annual net figure for each multinational group, instead of recording each and every transaction, which are often offset by one another, throughout the year. The Banque de France is one of the few central banks to apply the extended directional principle, thereby limiting the impact that intra-group loans between subsidiaries have on FDI flows. For this reason alone, any form of international comparison would be inappropriate at the current time.
DATA CONCERNING CROSS-BORDER MERGERS AND ACQUISITIONS
These statistics are mainly compiled by private consulting firms (e.g. Thomson Reuters, Zephyr), indicating the number of companies which have been acquired by foreign firms and the financial sums involved.
DATA CONCERNING THE PRESENCE OF FOREIGN BUSINESSES IN FRANCE
The French National Institute for Statistics and Economic Studies (INSEE) draws on the “Financial Links Between Companies Survey” (“LiFi”) conducted among businesses in France to compile its statistics on the economic activity of foreign subsidiaries in the country. A threshold of 50% of the voting rights or capital stock is set to establish whether or not a business is foreign-owned. ESANE statistics combine administrative data (obtained from
annual corporate profit declarations provided to the French tax authorities and from annual social security data containing payroll information) with data obtained from a sample of companies surveyed by questionnaire to produce structural business statistics. These databases contain data on foreign-owned resident company employment, turnover, investment in tangible assets and foreign trade.
PHYSICAL JOB-CREATING INVESTMENT
The need to assess the role and impact of direct investment, not only in financial terms but also on employment, has highlighted the prerequisite nature of accompanying data on the microeconomic activity of multinational firms. By analyzing individual company data, the diversity of businesses in the French economy can be more readily understood.
Since 1993, Business France and France’s regional economic development bodies have worked together in partnership to record all job-creating foreign investment decisions in France (cf. Appendix). The Annual Report on Foreign Investment in France analyzes foreign investments and their contribution to the French economy, listing confirmed projects and detailing the number of jobs that each one generates. It provides detailed statistical analysis by business sector, business activity, investment type, source country, and host region. Data concerning the amounts involved in specific investment projects are not always made available by companies, and so form no part of the analysis.
Business France also conducts an observatory of job-creating foreign investment across Europe, as do private organizations such as fDi Markets and EY. This involves recording all confirmed investment decisions that have been announced as such in the press. These databases provide detailed statistics by business sector, business activity, investment type, source country and host region.

2
Foreign investment in France in 201722 PROJECTS AND JOBS
26 SOURCE COUNTRIES
31 BUSINESS ACTIVITIES
39 BUSINESS SECTORS
44 INVESTMENT TYPES
48 FINANCIAL INVESTMENTS
- 23 -
2 0 1 7 R E P O R T - B U S I N E S S F R A N C E FOREIGN INVESTMENT IN FRANCE
PROJECTS AND JOBS
Rising number of new inward investment
decisions in 2017
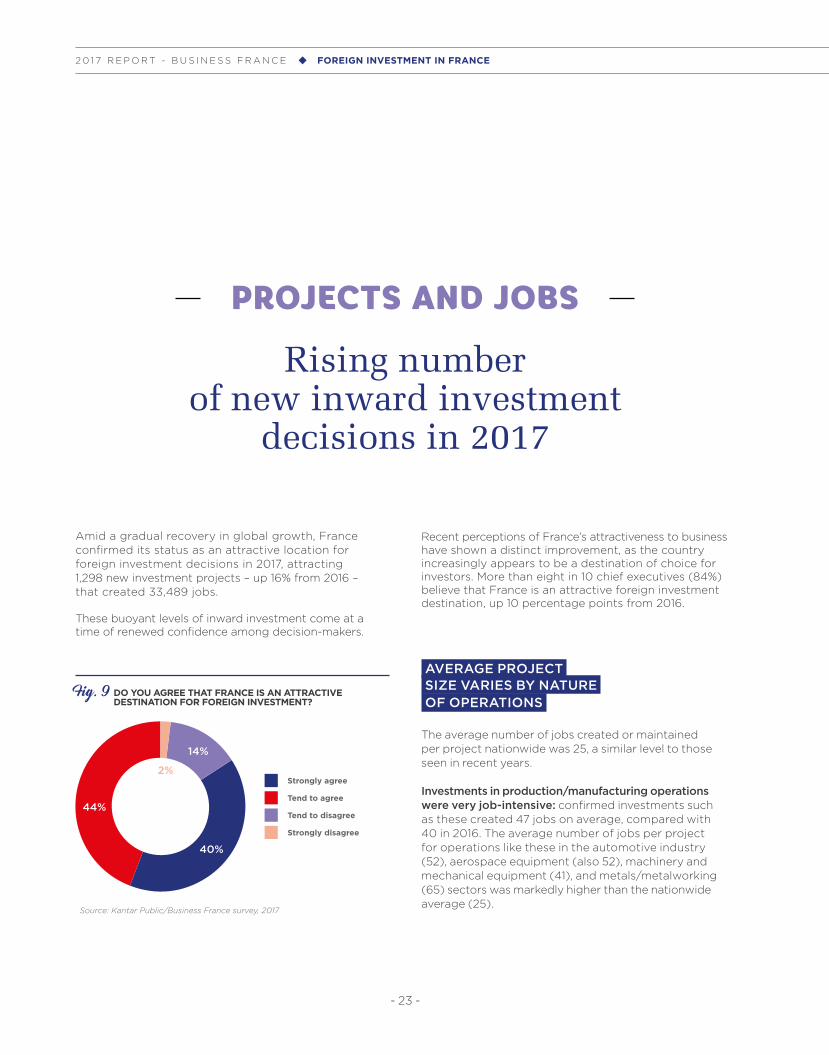
Amid a gradual recovery in global growth, France confirmed its status as an attractive location for foreign investment decisions in 2017, attracting 1,298 new investment projects – up 16% from 2016 – that created 33,489 jobs.
These buoyant levels of inward investment come at a time of renewed confidence among decision-makers.
Fig. 9 DO YOU AGREE THAT FRANCE IS AN ATTRACTIVE DESTINATION FOR FOREIGN INVESTMENT?
Source: Kantar Public/Business France survey, 2017
AVERAGE PROJECT SIZE VARIES BY NATURE OF OPERATIONS
The average number of jobs created or maintained per project nationwide was 25, a similar level to those seen in recent years.
Investments in production/manufacturing operations were very job-intensive: confirmed investments such as these created 47 jobs on average, compared with 40 in 2016. The average number of jobs per project for operations like these in the automotive industry (52), aerospace equipment (also 52), machinery and mechanical equipment (41), and metals/metalworking (65) sectors was markedly higher than the nationwide average (25).
Recent perceptions of France’s attractiveness to business have shown a distinct improvement, as the country increasingly appears to be a destination of choice for investors. More than eight in 10 chief executives (84%) believe that France is an attractive foreign investment destination, up 10 percentage points from 2016.
Strongly agree
Tend to agree
Tend to disagree
Strongly disagree
14%
40%
44%
2%
- 24 -
2 . FOREIGN INVESTMENT IN FRANCE IN 2017
35,000
30,000
25,000
20,000
15,000
10,000
5,000
0
0 10 20 30 40 50 60
%
% %
Unknown
Large
SMEs
Mid-size
Machinery
Cosmetics/perfumes
Automotive
Metals Chemicals/plastics
Financial services
Furnishings
Consumer electronics
Medical eqpt.
Electrical/IT eqpt.
Wholesale/retail
TextilesMedia/publishing
HospitalityPharmaceuticals
Agri-food
Energy/recycling
Consulting
Glass/ceramics
Software/IT services
Aerospace/naval/rail
Telecoms/ISPs
Transport/storage
Electronic componentsOther services
Construction
0 5 10 15 20 25 30 35 40%
High value-added industry
High value-added services
Low value-added industry
Low value-added services
2007 2008 2009 2010 2011 2012 2013 2014 2015 2016 2017
1,400
1,200
1,000
800
600
400
200
0
Wider criteria
Wider criteria
1,117
1,298
962
26,535
30,108
25 %
20 %
15 %
10 %
5 %
0 %
Telec
oms,
inter
net s
ervic
e pro
vider
sEle
ctron
ic co
mpon
ents
Aero
spac
e, na
val a
nd ra
ilway
equip
ment
Electr
ical/e
lectro
nic/IT
equip
ment
Medic
al/su
rgica
l equ
ipmen
t, diag
nosti
cs an
d dev
ices
Auto
motiv
e ind
ustry
Chem
icals,
plas
tics
Cons
tructi
on, b
uildin
g mate
rials
Perfu
mes,
cosm
etics
Agri-
food
, agr
icultu
re, fis
hing
Cons
umer
elec
tronic
s
Textile
s, ind
ustri
al tex
tiles, c
lothin
g and
acces
sorie
s
Finan
cial s
ervic
es, b
ankin
g and
insu
rance
Metal
s, me
talwo
rking
Energ
y, rec
yclin
g, ot
her c
once
ssion
s
Glass,
ceram
ics, m
ineral
s, wo
od, p
aper
Trans
port,
stor
age
Mach
inery
and m
echa
nical
equip
ment
Cons
ulting
, eng
ineer
ing an
d bus
iness
serv
ices
Phar
mace
utica
ls an
d biot
echn
ologie
s
Softw
are an
d IT s
ervic
es
Educ
ation
and t
rainin
g
Proximity to markets and other company operations
Potential for research partnershipswith French academia
Quality of R&D personnel
Proximity to French innovation clusters
Access to finance
Amount of state aid for R&D
Cost of R&D operations
Investment opportunities through acquisitions of French firms
“Unattractive” sub-total
Growth in jobs (%)
Growth in projects (%)
Sectors experiencing job and project growth
Sectors experiencing project growth
“Attractive” sub-total
-50
1,014
Average number of projects(2007-2017): 729
624 641 639 782 698 693 685 740 734 814 968
2007 2008 2009 2010 2011 2012 2013 2014 2015 2016 2017
Average number of jobs (2007-2017): 30,092
34,517 28,965 32,15331,932 31,815 27,958 25,908 29,631 25,478 32,77029,889
90
80
70
60
50
40
30
20
10
0
16
14
12
10
8
6
4
2
0
Metal
s, me
talwo
rking
Glass,
ceram
ics,
mine
rals,
wood
, pap
er
Chem
icals,
plas
tics
Agri-
food
, agr
icultu
re, fis
hing
Electr
onic
comp
onen
ts
Electr
ical/e
lectro
nic/IT
equip
ment
Media
, pub
lishin
g
Energ
y, rec
yclin
g,ot
her c
once
ssion
sPh
arma
ceut
icals
and b
iotec
hnolo
gies
Perfu
mes,
cosm
etics
Furn
ishing
s, ho
useh
old go
ods
Texti
les, in
dustr
ial te
xtiles
,clo
thing
and a
ccesso
ries
Cons
ulting
, eng
ineer
ingan
d bus
iness
serv
ices
Cons
umer
elec
tronic
sTra
nspo
rt, st
orag
eSo
ftware
and I
T ser
vices
Medic
al/su
rgica
l equ
ipmen
t,dia
gnos
tics a
nd de
vices
Cons
tructi
on,
build
ing
mat
erial
s
Auto
motiv
e ind
ustry
Aero
spac
e, na
val a
ndrai
lway
equip
ment
Mach
inery
and
mech
anica
l equ
ipmen
t
% %
60
50
40
30
20
10
0
25
15
10
5
0
%
corporates
companies
33,682 33,489
5014
18
19
19
20
22
25
25
37
49 33
45 36
48 33
50 29
47 31
48 28
44
121
2
2 17
2 17
2 17
18
3 20
3 22
3 22 32
50 100 150 200
250
200
150
100
50
0
-50
-100
-150
86
82
81
81
80
78
75
75
3,500
3,000
2,500
2,000
1,500
1,000
500
0
180
160
140
120
100
80
60
40
20
0
United States
United Kingdom
Germany
Netherlands
Luxembourg
Canada
Belgium
Italy
Spain
Switzerland
Norway
Japan
Ireland
Denmark
Other
0 50 100 150 200 250 300 350 400 450
0 5,000 10,000 15,000 20,000 25,000
United States
United Kingdom
Germany
Netherlands
Belgium
Canada
Spain
Italy
Indonesia
China
Switzerland
Luxembourg
New Zealand
Other
0 5 000
2013 2014 2015 2016 2017
81%
19%
79%
21%
69%
31%
63%
37%
65%
35%
2013 2014 2015 2016 2017
66%
34%
56%
44%
53%
47%
50%
50%
55%
45%
2013 2014 2015 2016 2017
1,200
1,000
800
600
400
200
0
126
40
166
233
61
198
681
78
202
989
61
50
130
783
179
2013 2014 2015 2016 2017
70
60
50
40
30
20
10
0
5.5
5
9.3
7.1
8
23.2
12.7
5
47.8
20.5
3.8
15.7
23
17.7
36.4
392
342
31
19
19
18
15
11
11
11
8
7
7
5
40
24,236
16,640
13,076
3,180
2,845
2,262
1,780
814
582
412
382
367
133
257
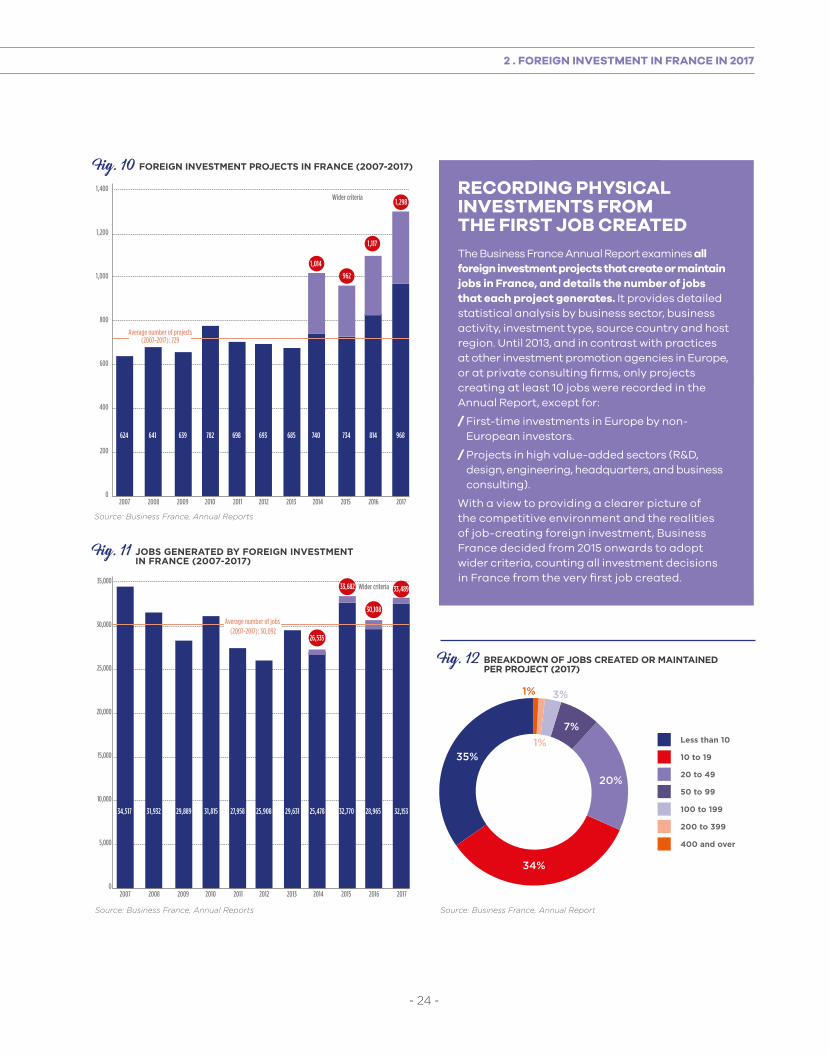
Source: Business France, Annual Reports
Fig. 11 JOBS GENERATED BY FOREIGN INVESTMENT IN FRANCE (2007-2017)
RECORDING PHYSICAL INVESTMENTS FROM THE FIRST JOB CREATEDThe Business France Annual Report examines all foreign investment projects that create or maintain jobs in France, and details the number of jobs that each project generates. It provides detailed statistical analysis by business sector, business activity, investment type, source country and host region. Until 2013, and in contrast with practices at other investment promotion agencies in Europe, or at private consulting firms, only projects creating at least 10 jobs were recorded in the Annual Report, except for:
/ First-time investments in Europe by non-European investors.
/ Projects in high value-added sectors (R&D, design, engineering, headquarters, and business consulting).
With a view to providing a clearer picture of the competitive environment and the realities of job-creating foreign investment, Business France decided from 2015 onwards to adopt wider criteria, counting all investment decisions in France from the very first job created.
Fig. 12 BREAKDOWN OF JOBS CREATED OR MAINTAINED PER PROJECT (2017)
Source: Business France, Annual Report
35,000
30,000
25,000
20,000
15,000
10,000
5,000
0
0 10 20 30 40 50 60
%
% %
Unknown
Large
SMEs
Mid-size
Machinery
Cosmetics/perfumes
Automotive
Metals Chemicals/plastics
Financial services
Furnishings
Consumer electronics
Medical eqpt.
Electrical/IT eqpt.
Wholesale/retail
TextilesMedia/publishing
HospitalityPharmaceuticals
Agri-food
Energy/recycling
Consulting
Glass/ceramics
Software/IT services
Aerospace/naval/rail
Telecoms/ISPs
Transport/storage
Electronic componentsOther services
Construction
0 5 10 15 20 25 30 35 40%
High value-added industry
High value-added services
Low value-added industry
Low value-added services
2007 2008 2009 2010 2011 2012 2013 2014 2015 2016 2017
1,400
1,200
1,000
800
600
400
200
0
Wider criteria
Wider criteria
1,117
1,298
962
26,535
30,108
25 %
20 %
15 %
10 %
5 %
0 %
Telec
oms,
inter
net s
ervic
e pro
vider
sEle
ctron
ic co
mpon
ents
Aero
spac
e, na
val a
nd ra
ilway
equip
ment
Electr
ical/e
lectro
nic/IT
equip
ment
Medic
al/su
rgica
l equ
ipmen
t, diag
nosti
cs an
d dev
ices
Auto
motiv
e ind
ustry
Chem
icals,
plas
tics
Cons
tructi
on, b
uildin
g mate
rials
Perfu
mes,
cosm
etics
Agri-
food
, agr
icultu
re, fis
hing
Cons
umer
elec
tronic
s
Textile
s, ind
ustri
al tex
tiles, c
lothin
g and
acces
sorie
s
Finan
cial s
ervic
es, b
ankin
g and
insu
rance
Metal
s, me
talwo
rking
Energ
y, rec
yclin
g, ot
her c
once
ssion
s
Glass,
ceram
ics, m
ineral
s, wo
od, p
aper
Trans
port,
stor
age
Mach
inery
and m
echa
nical
equip
ment
Cons
ulting
, eng
ineer
ing an
d bus
iness
serv
ices
Phar
mace
utica
ls an
d biot
echn
ologie
s
Softw
are an
d IT s
ervic
es
Educ
ation
and t
rainin
g
Proximity to markets and other company operations
Potential for research partnershipswith French academia
Quality of R&D personnel
Proximity to French innovation clusters
Access to finance
Amount of state aid for R&D
Cost of R&D operations
Investment opportunities through acquisitions of French firms
“Unattractive” sub-total
Growth in jobs (%)
Growth in projects (%)
Sectors experiencing job and project growth
Sectors experiencing project growth
“Attractive” sub-total
-50
1,014
Average number of projects(2007-2017): 729
624 641 639 782 698 693 685 740 734 814 968
2007 2008 2009 2010 2011 2012 2013 2014 2015 2016 2017
Average number of jobs (2007-2017): 30,092
34,517 28,965 32,15331,932 31,815 27,958 25,908 29,631 25,478 32,77029,889
90
80
70
60
50
40
30
20
10
0
16
14
12
10
8
6
4
2
0
Metal
s, me
talwo
rking
Glass,
ceram
ics,
mine
rals,
wood
, pap
er
Chem
icals,
plas
tics
Agri-
food
, agr
icultu
re, fis
hing
Electr
onic
comp
onen
ts
Electr
ical/e
lectro
nic/IT
equip
ment
Media
, pub
lishin
g
Energ
y, rec
yclin
g,ot
her c
once
ssion
sPh
arma
ceut
icals
and b
iotec
hnolo
gies
Perfu
mes,
cosm
etics
Furn
ishing
s, ho
useh
old go
ods
Texti
les, in
dustr
ial te
xtiles
,clo
thing
and a
ccesso
ries
Cons
ulting
, eng
ineer
ingan
d bus
iness
serv
ices
Cons
umer
elec
tronic
sTra
nspo
rt, st
orag
eSo
ftware
and I
T ser
vices
Medic
al/su
rgica
l equ
ipmen
t,dia
gnos
tics a
nd de
vices
Cons
tructi
on,
build
ing
mat
erial
s
Auto
motiv
e ind
ustry
Aero
spac
e, na
val a
ndrai
lway
equip
ment
Mach
inery
and
mech
anica
l equ
ipmen
t
% %
60
50
40
30
20
10
0
25
15
10
5
0
%
corporates
companies
33,682 33,489
5014
18
19
19
20
22
25
25
37
49 33
45 36
48 33
50 29
47 31
48 28
44
121
2
2 17
2 17
2 17
18
3 20
3 22
3 22 32
50 100 150 200
250
200
150
100
50
0
-50
-100
-150
86
82
81
81
80
78
75
75
3,500
3,000
2,500
2,000
1,500
1,000
500
0
180
160
140
120
100
80
60
40
20
0
United States
United Kingdom
Germany
Netherlands
Luxembourg
Canada
Belgium
Italy
Spain
Switzerland
Norway
Japan
Ireland
Denmark
Other
0 50 100 150 200 250 300 350 400 450
0 5,000 10,000 15,000 20,000 25,000
United States
United Kingdom
Germany
Netherlands
Belgium
Canada
Spain
Italy
Indonesia
China
Switzerland
Luxembourg
New Zealand
Other
0 5 000
2013 2014 2015 2016 2017
81%
19%
79%
21%
69%
31%
63%
37%
65%
35%
2013 2014 2015 2016 2017
66%
34%
56%
44%
53%
47%
50%
50%
55%
45%
2013 2014 2015 2016 2017
1,200
1,000
800
600
400
200
0
126
40
166
233
61
198
681
78
202
989
61
50
130
783
179
2013 2014 2015 2016 2017
70
60
50
40
30
20
10
0
5.5
5
9.3
7.1
8
23.2
12.7
5
47.8
20.5
3.8
15.7
23
17.7
36.4
392
342
31
19
19
18
15
11
11
11
8
7
7
5
40
24,236
16,640
13,076
3,180
2,845
2,262
1,780
814
582
412
382
367
133
257
Fig. 10 FOREIGN INVESTMENT PROJECTS IN FRANCE (2007-2017)
Source: Business France, Annual Reports
Less than 10
10 to 19
20 to 49
50 to 99
100 to 199
200 to 399
400 and over
35%
34%
20%
7%
3%
1%
1%
- 25 -
2 0 1 7 R E P O R T - B U S I N E S S F R A N C E FOREIGN INVESTMENT IN FRANCE
They chose FranceGROWING CONTRIBUTION OF LARGE CORPORATESTO EMPLOYMENT
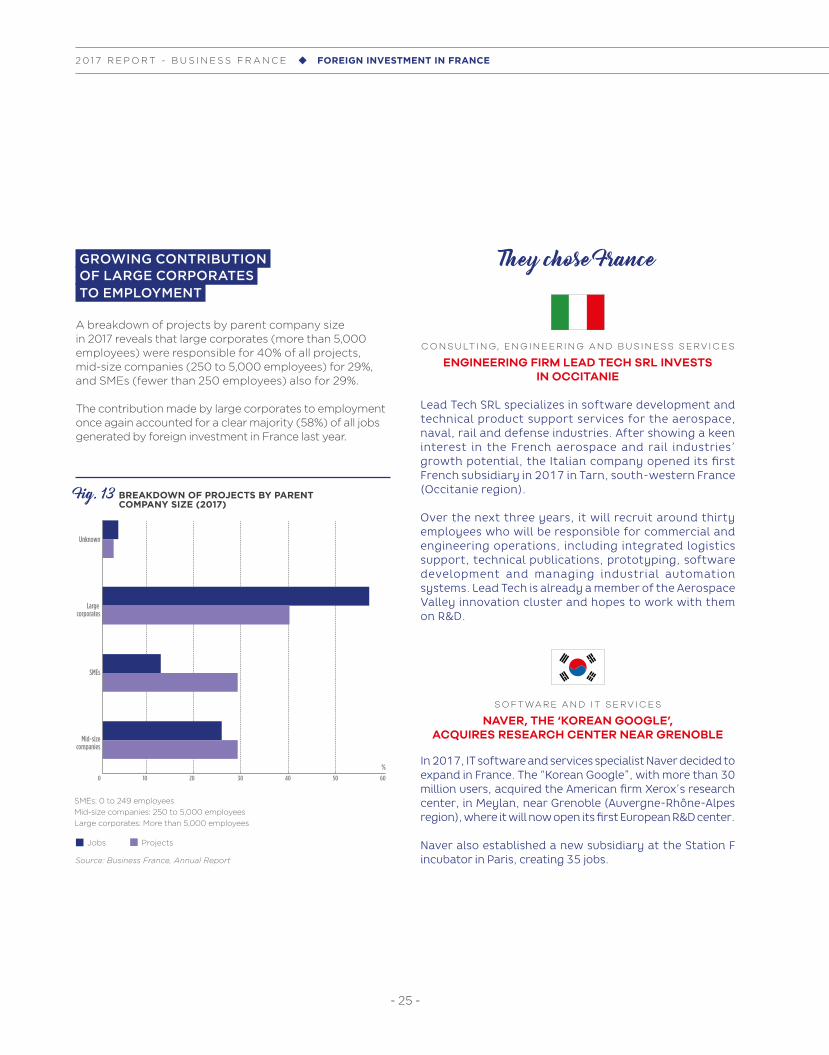
A breakdown of projects by parent company size in 2017 reveals that large corporates (more than 5,000 employees) were responsible for 40% of all projects, mid-size companies (250 to 5,000 employees) for 29%, and SMEs (fewer than 250 employees) also for 29%.
The contribution made by large corporates to employment once again accounted for a clear majority (58%) of all jobs generated by foreign investment in France last year.
Source: Business France, Annual Report
Fig. 13 BREAKDOWN OF PROJECTS BY PARENT COMPANY SIZE (2017)
35,000
30,000
25,000
20,000
15,000
10,000
5,000
0
0 10 20 30 40 50 60
%
% %
Unknown
Large
SMEs
Mid-size
Machinery
Cosmetics/perfumes
Automotive
Metals Chemicals/plastics
Financial services
Furnishings
Consumer electronics
Medical eqpt.
Electrical/IT eqpt.
Wholesale/retail
TextilesMedia/publishing
HospitalityPharmaceuticals
Agri-food
Energy/recycling
Consulting
Glass/ceramics
Software/IT services
Aerospace/naval/rail
Telecoms/ISPs
Transport/storage
Electronic componentsOther services
Construction
0 5 10 15 20 25 30 35 40%
High value-added industry
High value-added services
Low value-added industry
Low value-added services
2007 2008 2009 2010 2011 2012 2013 2014 2015 2016 2017
1,400
1,200
1,000
800
600
400
200
0
Wider criteria
Wider criteria
1,117
1,298
962
26,535
30,108
25 %
20 %
15 %
10 %
5 %
0 %
Telec
oms,
inter
net s
ervic
e pro
vider
sEle
ctron
ic co
mpon
ents
Aero
spac
e, na
val a
nd ra
ilway
equip
ment
Electr
ical/e
lectro
nic/IT
equip
ment
Medic
al/su
rgica
l equ
ipmen
t, diag
nosti
cs an
d dev
ices
Auto
motiv
e ind
ustry
Chem
icals,
plas
tics
Cons
tructi
on, b
uildin
g mate
rials
Perfu
mes,
cosm
etics
Agri-
food
, agr
icultu
re, fis
hing
Cons
umer
elec
tronic
s
Textile
s, ind
ustri
al tex
tiles, c
lothin
g and
acces
sorie
s
Finan
cial s
ervic
es, b
ankin
g and
insu
rance
Metal
s, me
talwo
rking
Energ
y, rec
yclin
g, ot
her c
once
ssion
s
Glass,
ceram
ics, m
ineral
s, wo
od, p
aper
Trans
port,
stor
age
Mach
inery
and m
echa
nical
equip
ment
Cons
ulting
, eng
ineer
ing an
d bus
iness
serv
ices
Phar
mace
utica
ls an
d biot
echn
ologie
s
Softw
are an
d IT s
ervic
es
Educ
ation
and t
rainin
g
Proximity to markets and other company operations
Potential for research partnershipswith French academia
Quality of R&D personnel
Proximity to French innovation clusters
Access to finance
Amount of state aid for R&D
Cost of R&D operations
Investment opportunities through acquisitions of French firms
“Unattractive” sub-total
Growth in jobs (%)
Growth in projects (%)
Sectors experiencing job and project growth
Sectors experiencing project growth
“Attractive” sub-total
-50
1,014
Average number of projects(2007-2017): 729
624 641 639 782 698 693 685 740 734 814 968
2007 2008 2009 2010 2011 2012 2013 2014 2015 2016 2017
Average number of jobs (2007-2017): 30,092
34,517 28,965 32,15331,932 31,815 27,958 25,908 29,631 25,478 32,77029,889
90
80
70
60
50
40
30
20
10
0
16
14
12
10
8
6
4
2
0
Metal
s, me
talwo
rking
Glass,
ceram
ics,
mine
rals,
wood
, pap
er
Chem
icals,
plas
tics
Agri-
food
, agr
icultu
re, fis
hing
Electr
onic
comp
onen
ts
Electr
ical/e
lectro
nic/IT
equip
ment
Media
, pub
lishin
g
Energ
y, rec
yclin
g,ot
her c
once
ssion
sPh
arma
ceut
icals
and b
iotec
hnolo
gies
Perfu
mes,
cosm
etics
Furn
ishing
s, ho
useh
old go
ods
Texti
les, in
dustr
ial te
xtiles
,clo
thing
and a
ccesso
ries
Cons
ulting
, eng
ineer
ingan
d bus
iness
serv
ices
Cons
umer
elec
tronic
sTra
nspo
rt, st
orag
eSo
ftware
and I
T ser
vices
Medic
al/su
rgica
l equ
ipmen
t,dia
gnos
tics a
nd de
vices
Cons
tructi
on,
build
ing
mat
erial
s
Auto
motiv
e ind
ustry
Aero
spac
e, na
val a
ndrai
lway
equip
ment
Mach
inery
and
mech
anica
l equ
ipmen
t
% %
60
50
40
30
20
10
0
25
15
10
5
0
%
corporates
companies
33,682 33,489
5014
18
19
19
20
22
25
25
37
49 33
45 36
48 33
50 29
47 31
48 28
44
121
2
2 17
2 17
2 17
18
3 20
3 22
3 22 32
50 100 150 200
250
200
150
100
50
0
-50
-100
-150
86
82
81
81
80
78
75
75
3,500
3,000
2,500
2,000
1,500
1,000
500
0
180
160
140
120
100
80
60
40
20
0
United States
United Kingdom
Germany
Netherlands
Luxembourg
Canada
Belgium
Italy
Spain
Switzerland
Norway
Japan
Ireland
Denmark
Other
0 50 100 150 200 250 300 350 400 450
0 5,000 10,000 15,000 20,000 25,000
United States
United Kingdom
Germany
Netherlands
Belgium
Canada
Spain
Italy
Indonesia
China
Switzerland
Luxembourg
New Zealand
Other
0 5 000
2013 2014 2015 2016 2017
81%
19%
79%
21%
69%
31%
63%
37%
65%
35%
2013 2014 2015 2016 2017
66%
34%
56%
44%
53%
47%
50%
50%
55%
45%
2013 2014 2015 2016 2017
1,200
1,000
800
600
400
200
0
126
40
166
233
61
198
681
78
202
989
61
50
130
783
179
2013 2014 2015 2016 2017
70
60
50
40
30
20
10
0
5.5
5
9.3
7.1
8
23.2
12.7
5
47.8
20.5
3.8
15.7
23
17.7
36.4
392
342
31
19
19
18
15
11
11
11
8
7
7
5
40
24,236
16,640
13,076
3,180
2,845
2,262
1,780
814
582
412
382
367
133
257
Jobs Projects
SMEs: 0 to 249 employeesMid-size companies: 250 to 5,000 employeesLarge corporates: More than 5,000 employees
S O F T WA R E A N D I T S E RV I C E S
NAVER, THE ‘KOREAN GOOGLE’, ACQUIRES RESEARCH CENTER NEAR GRENOBLE
In 2017, IT software and services specialist Naver decided to expand in France. The “Korean Google”, with more than 30 million users, acquired the American firm Xerox’s research center, in Meylan, near Grenoble (Auvergne-Rhône-Alpes region), where it will now open its first European R&D center.
Naver also established a new subsidiary at the Station F incubator in Paris, creating 35 jobs.
C O N S U LT I N G, E N G I N E E R I N G A N D B U S I N E S S S E RV I C E S
ENGINEERING FIRM LEAD TECH SRL INVESTS IN OCCITANIE
Lead Tech SRL specializes in software development and technical product support services for the aerospace, naval, rail and defense industries. After showing a keen interest in the French aerospace and rail industries’ growth potential, the Italian company opened its first French subsidiary in 2017 in Tarn, south-western France (Occitanie region).
Over the next three years, it will recruit around thirty employees who will be responsible for commercial and engineering operations, including integrated logistics support, technical publications, prototyping, software development and managing industrial automation systems. Lead Tech is already a member of the Aerospace Valley innovation cluster and hopes to work with them on R&D.
- 26 -
2 . FOREIGN INVESTMENT IN FRANCE IN 2017
S O F T WA R E A N D I T S E RV I C E S
ZENDESK DOUBLES ITS R&D WORKFORCE IN MONTPELLIER
Founded in 2007, Zendesk is a global leader in customer service software development with more than 2,000 employees worldwide.
After taking over the French startup “We are Cloud”, the Montpellier-based designer behind BIME Analytics software, Zendesk decided in 2017 to relocate to a larger site in the southern French city and to recruit 50 R&D engineers.
The company also decided to open a base at the Station F incubator in Paris, where it will provide support to around 50 startups.
P H A R M A C E U T I C A L S A N D B I O T E C H N O L O G I E S
BOEHRINGER INGELHEIM ACQUIRES MERIAL
After acquiring Merial in early 2017, this German pharmaceutical group invested €70 million in new headquarters for its animal health business in France, creating 125 jobs to fulfil support functions previously provided by former shareholder Sanofi.
S O F T WA R E A N D I T S E RV I C E S
FUJITSU OPENS ARTIFICIAL INTELLIGENCE CENTER OF EXCELLENCE IN PARIS
Business France has provided support to the Japanese technology giant since June 2016 in its discussions with French public-sector artificial intelligence (AI) research bodies, various leading companies on the French stock market (CAC 40), specialist investment funds and incubators.
An updated roadmap has now led to an investment of €50 million and a new AI center of excellence within the École Polytechnique’s Drahi-X Novation incubator, as well as a joint research program with the French Institute for Research in Computer Science and Automation (INRIA), and a data-sharing development project with startup Scality.
- 27 -
2 0 1 7 R E P O R T - B U S I N E S S F R A N C E FOREIGN INVESTMENT IN FRANCE
SOURCE COUNTRIES
European businesses lead the way among investors
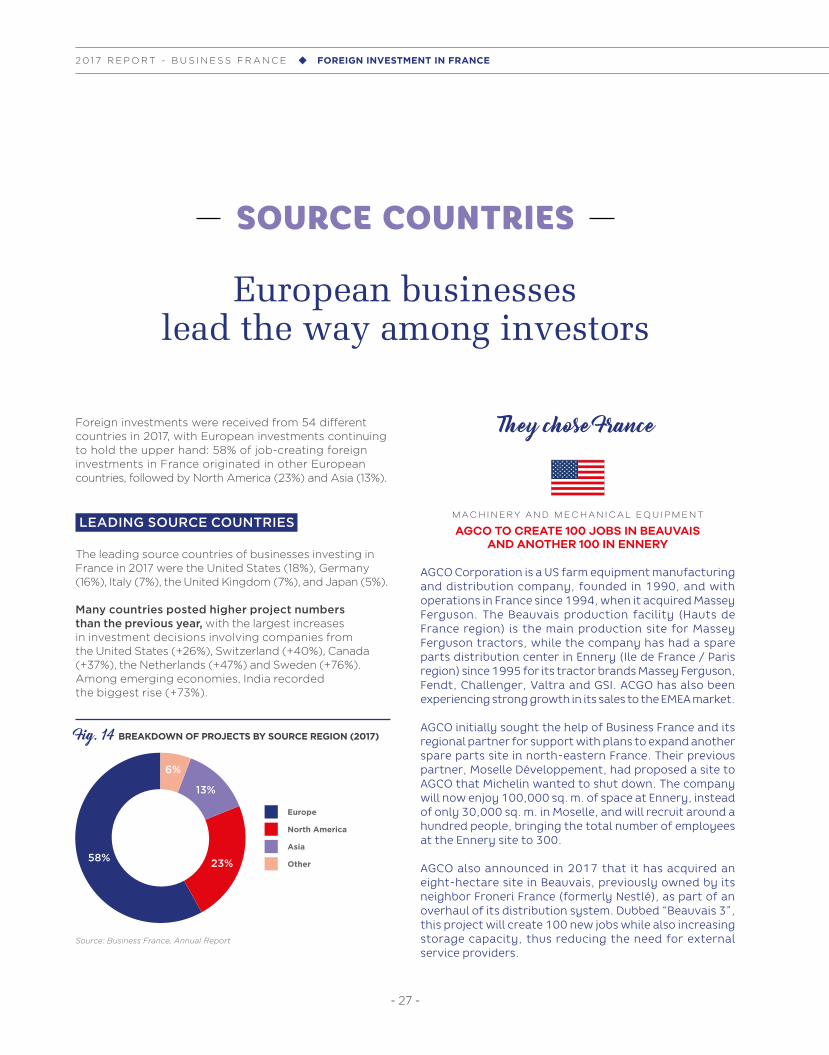
Foreign investments were received from 54 different countries in 2017, with European investments continuing to hold the upper hand: 58% of job-creating foreign investments in France originated in other European countries, followed by North America (23%) and Asia (13%).
LEADING SOURCE COUNTRIES
The leading source countries of businesses investing in France in 2017 were the United States (18%), Germany (16%), Italy (7%), the United Kingdom (7%), and Japan (5%).
Many countries posted higher project numbers than the previous year, with the largest increases in investment decisions involving companies from the United States (+26%), Switzerland (+40%), Canada (+37%), the Netherlands (+47%) and Sweden (+76%). Among emerging economies, India recorded the biggest rise (+73%).
Fig. 14 BREAKDOWN OF PROJECTS BY SOURCE REGION (2017)
Source: Business France, Annual Report
They chose France
Europe
North America
Asia
Other
13%
23%58%
6%
M A C H I N E R Y A N D M E C H A N I C A L E Q U I P M E N T
AGCO TO CREATE 100 JOBS IN BEAUVAIS AND ANOTHER 100 IN ENNERY
AGCO Corporation is a US farm equipment manufacturing and distribution company, founded in 1990, and with operations in France since 1994, when it acquired Massey Ferguson. The Beauvais production facility (Hauts de France region) is the main production site for Massey Ferguson tractors, while the company has had a spare parts distribution center in Ennery (Ile de France / Paris region) since 1995 for its tractor brands Massey Ferguson, Fendt, Challenger, Valtra and GSI. ACGO has also been experiencing strong growth in its sales to the EMEA market.
AGCO initially sought the help of Business France and its regional partner for support with plans to expand another spare parts site in north-eastern France. Their previous partner, Moselle Développement, had proposed a site to AGCO that Michelin wanted to shut down. The company will now enjoy 100,000 sq. m. of space at Ennery, instead of only 30,000 sq. m. in Moselle, and will recruit around a hundred people, bringing the total number of employees at the Ennery site to 300.
AGCO also announced in 2017 that it has acquired an eight-hectare site in Beauvais, previously owned by its neighbor Froneri France (formerly Nestlé), as part of an overhaul of its distribution system. Dubbed “Beauvais 3”, this project will create 100 new jobs while also increasing storage capacity, thus reducing the need for external service providers.
- 28 -
2 . FOREIGN INVESTMENT IN FRANCE IN 2017
S O F T WA R E A N D I T S E RV I C E S
CGI GROUP TO CREATE MORETHAN 1,000 JOBS IN FRANCE
Founded in 1976, CGI is one of the world’s leading independent IT and business process services firms. CGI is also Canada’s leading investor in France, with 11,000 employees and consultants across the country and a further 1,000 hires announced in 2017.
In September the same year, it also chose Lyon, in preference to Stuttgart (Germany) and the US west coast, as the location for a global center of excellence for supply chain digitization.
CGI recently created its own programming school (U’DEV) in France, focusing on digital and IT development, in partnership with the IPI and EPSI Schools of Computer Science. Financed entirely by CGI, the work-study training program will give the 180 students registered on the course the skills they need to find a permanent position within a digital company.
Business France and its regional partners have been supporting the company with its expansion by helping with various enquiries, from tax issues to HR or training, and putting them in touch with the relevant authorities.
S O F T WA R E A N D I T S E RV I C E S
IBM OPENS A EUROPEAN R&D CENTER ON CYBER SECURITY IN LILLE
Global leader in IT services and business solutions IBM opened a Security Operations Center in 2017 at its new campus in Lille’s Euratechnologies cluster.
Inaugurated in December, the center will create between 80 and 100 new jobs over the next three years.
A U T O M O T I V E I N D U S T R Y
VOLVO AB EXPANDS IN AUVERGNE-RHONE-ALPES
Commercial vehicle-maker Renault Trucks, part of the Swedish Volvo Group, announced several expansions in 2017 at production sites in France, creating more than 160 jobs in the Auvergne-Rhône-Alpes region, including 50 people in Bourg-en-Bresse and 117 in Vénissieux.
S O F T WA R E A N D I T S E RV I C E S
PROCSEA ESTABLISHES FIRST ONLINE SEAFOOD MARKETPLACE IN RENNES
Swiss startup Procsea, which established itself in Rennes (Bretagne/Brittany region) in May 2016, created an online fish market for maritime professionals in 2017.
This B2B platform connects restaurant owners and wholesalers who buy fish in bulk during auctions at France’s many fishing ports. Renaud Enjalbert, Procsea’s founder, explains: “Each wholesaler is carefully selected before being added to the list. We feature a wide range of fish, and ask traders to only sell the very best. This is essential when the target markets are gourmet restaurants and five-star hotels, for whom we’ve created bespoke quality standards. It is up to them to decide what they want and how much they’re willing to pay.”
Procsea’s business model is also based on service provision, which includes dealing with customs formalities, billing in foreign currencies, chasing outstanding invoices, logistics, and business loan protection. Procsea applies a commission of between 5 and 12% to each transaction, with the rate depending on the destination country and the level of service provided.
In late 2016, a fundraising campaign helped Procsea to launch a new version of its platform and to expand its team. In 2017, the 10-strong Rennes team joined the Village by CA Ille-et-Vilaine startup accelerator, which will provide a supportive environment to foster Procsea’s development for up to one year.
- 29 -
2 0 1 7 R E P O R T - B U S I N E S S F R A N C E FOREIGN INVESTMENT IN FRANCE
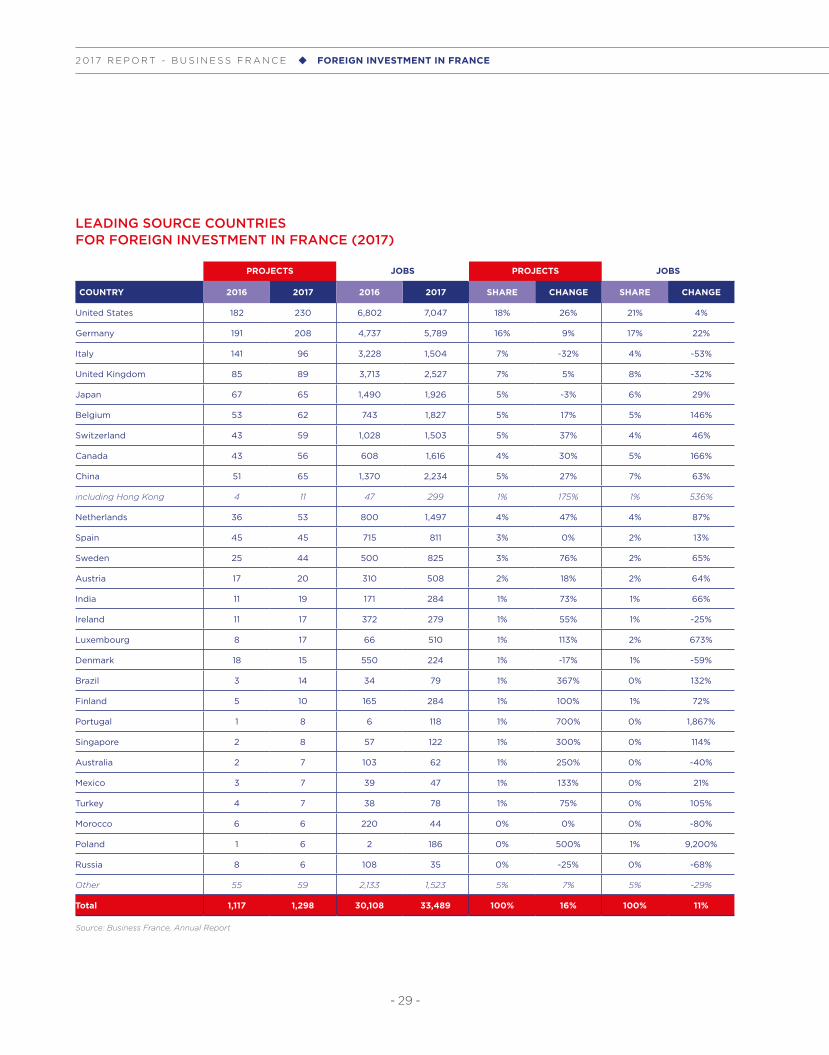
LEADING SOURCE COUNTRIES FOR FOREIGN INVESTMENT IN FRANCE (2017)
PROJECTS JOBS PROJECTS JOBS
COUNTRY 2016 2017 2016 2017 SHARE CHANGE SHARE CHANGE
United States 182 230 6,802 7,047 18% 26% 21% 4%
Germany 191 208 4,737 5,789 16% 9% 17% 22%
Italy 141 96 3,228 1,504 7% -32% 4% -53%
United Kingdom 85 89 3,713 2,527 7% 5% 8% -32%
Japan 67 65 1,490 1,926 5% -3% 6% 29%
Belgium 53 62 743 1,827 5% 17% 5% 146%
Switzerland 43 59 1,028 1,503 5% 37% 4% 46%
Canada 43 56 608 1,616 4% 30% 5% 166%
China 51 65 1,370 2,234 5% 27% 7% 63%
including Hong Kong 4 11 47 299 1% 175% 1% 536%
Netherlands 36 53 800 1,497 4% 47% 4% 87%
Spain 45 45 715 811 3% 0% 2% 13%
Sweden 25 44 500 825 3% 76% 2% 65%
Austria 17 20 310 508 2% 18% 2% 64%
India 11 19 171 284 1% 73% 1% 66%
Ireland 11 17 372 279 1% 55% 1% -25%
Luxembourg 8 17 66 510 1% 113% 2% 673%
Denmark 18 15 550 224 1% -17% 1% -59%
Brazil 3 14 34 79 1% 367% 0% 132%
Finland 5 10 165 284 1% 100% 1% 72%
Portugal 1 8 6 118 1% 700% 0% 1,867%
Singapore 2 8 57 122 1% 300% 0% 114%
Australia 2 7 103 62 1% 250% 0% -40%
Mexico 3 7 39 47 1% 133% 0% 21%
Turkey 4 7 38 78 1% 75% 0% 105%
Morocco 6 6 220 44 0% 0% 0% -80%
Poland 1 6 2 186 0% 500% 1% 9,200%
Russia 8 6 108 35 0% -25% 0% -68%
Other 55 59 2,133 1,523 5% 7% 5% -29%
Total 1,117 1,298 30,108 33,489 100% 16% 100% 11%
Source: Business France, Annual Report
- 30 -
2 . FOREIGN INVESTMENT IN FRANCE IN 2017
American investments in France rose sharply in 2017, up 26% from the previous year. The United States was the leading source country for investment in France and the chief provider of jobs, with 230 investment decisions, equating to 18% of all job-creating foreign investment recorded and 21% of jobs generated. American firms stood out for their commitment to research and development: with 33 investment projects, the United States accounted for more than one-quarter of all inward R&D investments and 31% of jobs generated in this area, as well as 49% of jobs generated by foreign logistics investments.
German investments in France remained buoyant, rising 9% from 2016, with 208 projects equating to 16% of foreign investments and 17% of jobs generated. German firms were among the main contributors to production/manufacturing operations, providing 16% of all foreign investment decisions and 20% of jobs generated in this area, along with logistics (24% of foreign investments and 28% of jobs).
Italy remained the third biggest foreign investor in France in 2017, despite a 32% fall in project numbers from 2016. With 96 investment decisions, Italy accounted for 7% of projects and 4% of jobs generated. Italian firms mainly invested in production/manufacturing operations (28% of Italian investments in France during the year).
The United Kingdom remained France’s fourth largest foreign investor in 2017, as British investments remained steady at 89 projects, providing 8% of all jobs generated by foreign investment. British investors were particularly active with retail outlets, accounting for 14% of all projects in this area. Leading investments involved names such as Action France, Lush France and Primark, all drawn to France by strong domestic demand.
Japan was the leading Asian investor in France in 2017, and fifth among all source countries with 65 investment decisions. Nearly two-thirds of all Japanese investments involved setting up decision-making centers (32%) and production/manufacturing operations (32%).
Inward investments from China, India and Brazil – the world’s leading emerging economies – were buoyant in 2017, with 93 investment decisions making up 7% of all inward investment in France.
They chose France
T E X T I L E S , C L O T H I N G
ASICS TO OPEN SOUTHERN EUROPE DISTRIBUTION CENTER IN OCCITANIE
After a review forming part of its strategic development plan following sustained growth, ASICS Europe recently decided to streamline its logistics in Europe.
The result of its deliberations included an €11 million investment in a new distribution center at a site near Montpellier-Méditerranée airport in Mauguio (Occitanie region), which beat off competition from Barcelona.
The Japanese firm and world’s fourth largest sports equipment maker expects to maintain 55 jobs at the new site and create 50 new ones.
S O F T WA R E A N D I T S E RV I C E S
INNOVATIVE STARTUP ZIFY SETS UP IN PARIS
Zify’s flagship product is a dynamic, artificial intelligence-based mobile application for short- and medium-distance urban travel. It aims to help people save on travel costs, thereby reducing congestion and making cities more sustainable. Zify also helps businesses reduce costs and encourages them to become better citizens along with their employees.
Zify has been supported by Business France and its partner Paris&Co throughout the setup process. The Indian startup received help in obtaining French residence permits, joining the French Tech Ticket program (Zify was one of the winners in season 2), meeting with the authorities to help set up the company, establishing business contacts and fundraising.
- 31 -
2 0 1 7 R E P O R T - B U S I N E S S F R A N C E FOREIGN INVESTMENT IN FRANCE
A G R I - F O O D
US INDUSTRIAL BAKERY EAST BALT INVESTS IN PARIS REGION
The American company confirmed plans to invest €30 million in a bread roll production facility for the Burger King franchise in Brétigny, Ile de France (Paris region), creating 60 new jobs.
A E R O S PA C E , N AVA L A N D R A I LWAY E Q U I P M E N T
NANNI INDUSTRIES INVESTS IN R&D IN NOUVELLE AQUITAINE
Based in La Teste de Buch in Nouvelle Aquitaine, Nanni Industries specializes in making marine diesel engines and generators. It employs around 60 people in its French design office and production facility, and is a subsidiary of Italian firm Nanni Trading SRL, which has revenues of €20 million, and a network of 90 exclusive importers around the globe.
It is one of the top three in the global market for inboard diesel engines and made R&D investments in France once again in 2017 when it launched a program to create new products. The company has been awarded a grant from the regional government and plans to create around fifteen new jobs.
A U T O M O T I V E I N D U S T R Y
BYD OPENS FIRST PRODUCTION FACILITY IN HAUTS DE FRANCE
Chinese firm and global leader in electric buses and batteries BYD (Build Your Dreams) chose Allonne, just outside Beauvais, in 2017 as the location for its new electric bus assembly facility. The site chosen is the first greenfield manufacturing investment by a Chinese company in the region, a rare event in both France and Europe, as Chinese investors tend to acquire existing manufacturing locations.
BYD also has plans to create an R&D and design center at the site. The initial investment phase will amount to €10 million, creating 100 jobs.
W H O L E S A L E A N D R E TA I L
NEW AMAZON DISTRIBUTION CENTER IN PROVENCE-ALPES-CÔTE D’AZUR
The American e-commerce giant chose the area around Bouc-Bel-Air, between Aix-en-Provence and Marseille, as the location for its fifth distribution center in France.
The village’s close proximity to major highways means that Amazon will be able to roll out its faster “last mile” delivery service. The Bouc-Bel-Air site is due to become a hub that will serve the area between Montpellier and Nice.
- 32 -
2 . FOREIGN INVESTMENT IN FRANCE IN 2017
BUSINESS ACTIVITIES
France’s increasing attractiveness to investors seen in large number
of new investment decisions in strategic activities
The operations of companies can be broken down into a variety of business activities: production/manufacturing, R&D, business services, consumer services, logistics and distribution, retail outlets, decision-making centers and headquarters.
INCREASE IN NEW DECISION-MAKING CENTERS IN 2017
Various entities within multinational corporations play a role in decision-making processes, including the company’s registered office, strategic and operational divisions, and R&D centers. Accordingly, decision-making is becoming increasingly fragmented, leading to the disappearance of single-site pyramidal decision-making structures. As companies become global, they have to create regional decision-making centers, as a result of which the power to make decisions is dispersed across large distances.
A large increase (+28%) in foreign investments involving decision-making centers was seen in 2017, with first-time investments in France or Europe rising by 36% and 92%, respectively, from the previous year. The upward trend in these investments – comprising all services or commercial activities designed to secure a foothold and establish a business to serve the French or European market – reflects growing confidence
They chose France
in France as an investment location. Most first-time investments in Europe were made by firms from the United States, China, Canada and Japan.
The number of investment decisions involving global and European headquarters based in France declined slightly to 29 in 2017. American firms were responsible for one-third of all projects involving global headquarters, while those involving French headquarters rose to 37.
E L E C T R I C A L / E L E C T R O N I C / I T E Q U I P M E N T
H3 DYNAMICS SETS UP EUROPEAN HEADQUARTERS IN PARIS
The Singapore-based group H3 Dynamics, comprising three entities (HES Energy Systems, HAS Awareness Systems and HUS Unmanned Systems), specializes in safety and maintenance telerobotics, as well as hydrogen fuel cell systems.
In 2017, H3 Dynamics set up its European headquarters and an R&D center in Paris to develop a data analysis platform, creating 35 jobs, including around twenty in R&D.
- 33 -
2 0 1 7 R E P O R T - B U S I N E S S F R A N C E FOREIGN INVESTMENT IN FRANCE
BREAKDOWN OF PROJECTS BY BUSINESS ACTIVITY (2017)
PROJECTS JOBS PROJECTS JOBS
BUSINESS ACTIVITIES 2016 2017 2016 2017 SHARE CHANGE SHARE CHANGE
Decision-making centers 266 360 2,936 4,165 28% 35% 12% 42%
First-time investments in Europe 48 92 288 735 7% 92% 2% 155%
First-time investments in France 148 202 1,248 2,374 16% 36% 7% 90%
Global / European headquarters 36 29 468 345 2% -19% 1% -26%
French headquarters 34 37 932 711 3% 9% 2% -24%
Logistics 72 62 3,863 3,082 5% -14% 9% -20%
Retail outlets 114 126 3,459 1,839 10% 11% 5% -47%
Production / Manufacturing 280 343 11,271 16,213 26% 23% 48% 44%
R&D, engineering, design 115 125 2,612 2,282 10% 9% 7% -13%
R&D 72 83 1,001 1,461 6% 15% 4% 46%
Engineering 43 42 1,611 821 3% -2% 2% -49%
Business services 210 251 4,139 4,893 19% 20% 15% 18%
Consumer services 60 31 1,828 1,015 2% -48% 3% -44%
Total 1,117 1,298 30,108 33,489 100% 16% 100% 11%
S O F T WA R E A N D I T S E RV I C E S
SENTIO SPORTS ANALYTICS OPENS FIRST EUROPEAN BASE IN AUVERGNE-RHÔNE-ALPES
Sentio Sports Analytics is the first foreign startup to have taken part in the French Tech Ticket program through the Tarmac incubator in Grenoble. It has successfully developed real-time tracking technology for sports players and teams, without them needing to wear sensors.
After a successful test season with the Turkish football league, and a number of Italian teams, Sentio is considering recruiting up to ten people in France to roll out its cutting-edge technology across European football leagues and other sports, such as rugby and handball, as well as to investigate new business models.
S O F T WA R E A N D I T S E RV I C E S
‘TEXT AS A SERVICE’ STARTUP INSTAPLY CHOOSES FRANCE
California startup Instaply specializes in developing cloud-based “text as a service” applications and customer relationship management messaging solutions, enabling brands and stores to engage with customers in real time by SMS.
Founded in San Francisco in 2012, this fast-growing startup decided in 2017 to set up a new European decision-making center in Paris (Ile de France region) as well as an office in Lille (Hauts de France region), creating around fifteen jobs.
- 34 -
2 . FOREIGN INVESTMENT IN FRANCE IN 2017
METHODOLOGY
DECISION-MAKING CENTERS
At multinational firms with numerous sites in Europe,
the activities carried on by decision-making centers
can include acting as:
/ A Global or European Headquarters, covering
perhaps not only Europe, but also northern Africa
and the Middle East.
/ A French Headquarters, responsible for
coordinating all a foreign company’s operations
in France.
Headquarters can be defined as internal structures
with a leader and team responsible for making
strategic decisions that have a bearing on all or part
of the company, particularly regarding investment
and jobs.
Business France also includes first-time investments
in France or Europe under the decision-making
center category. These investments comprise
all services or commercial activities designed to
secure a foothold and establish a business to serve
the French or European market; the structures
are generally smaller in size and are designed for
operations of this scope to be run from France.
Activities such as those described above create
value – directly or indirectly – and are vital to the
regions in which they are based. Firstly, headquarters
require a highly qualified workforce, and can employ
anywhere from a few hundred to a few thousand
people in major corporations, depending on the
business sector and scope for decision-making.
Secondly, where a company decides to locate
its headquarters makes it more likely that other
operations, such as research laboratories, will follow.
It therefore becomes important for regions to remain
competitive should they wish to attract, consolidate
and retain economic activity.
E L E C T R I C A L / E L E C T R O N I C / I T E Q U I P M E N T
ION SCIENCE ESTABLISHES FIRST FRENCH OFFICE IN PROVENCE-ALPES-CÔTE D’AZUR
UK industrial gas detector manufacturer Ion Science is to open its first subsidiary in France. Ion Science France will be its third in Europe and its fourth in the world, all supported by a global network of distributors. This new investment will help underpin the company’s position in the French petrochemical, biochemical, oil and gas industries.
Duncan Johns, Managing Director of Ion Science, explains: “With increasing numbers of customers in Europe, opening an office in France has always been an important strategic step for us. As we always sell through distributors, we’re confident that the new office will enable us to provide a better service and gain greater market share.”
S O F T WA R E A N D I T S E RV I C E S
MIABOX OPENS FIRST EUROPEAN SUBSIDIARY IN BRITTANY
Ivorian startup Miabox has developed a video on demand (VOD) platform and live streaming TV service specializing in African and South American content.
It was therefore keen to set up a European-based subsidiary to boost sales and establish better links with target audiences, telecommunications operators and audiovisual production groups. The startup was also looking to conduct R&D and raise funds for its international expansion.
After shortlisting both France and the Netherlands, Miabox ultimately chose the French city of Rennes in Bretagne (Brittany) due to its tailor-made ecosystem, including the Media & Networks innovation cluster, the IMT Atlantique digital technology school, as well as numerous large firms and SMEs specializing in connected TV. The investment is expected to create 27 jobs.
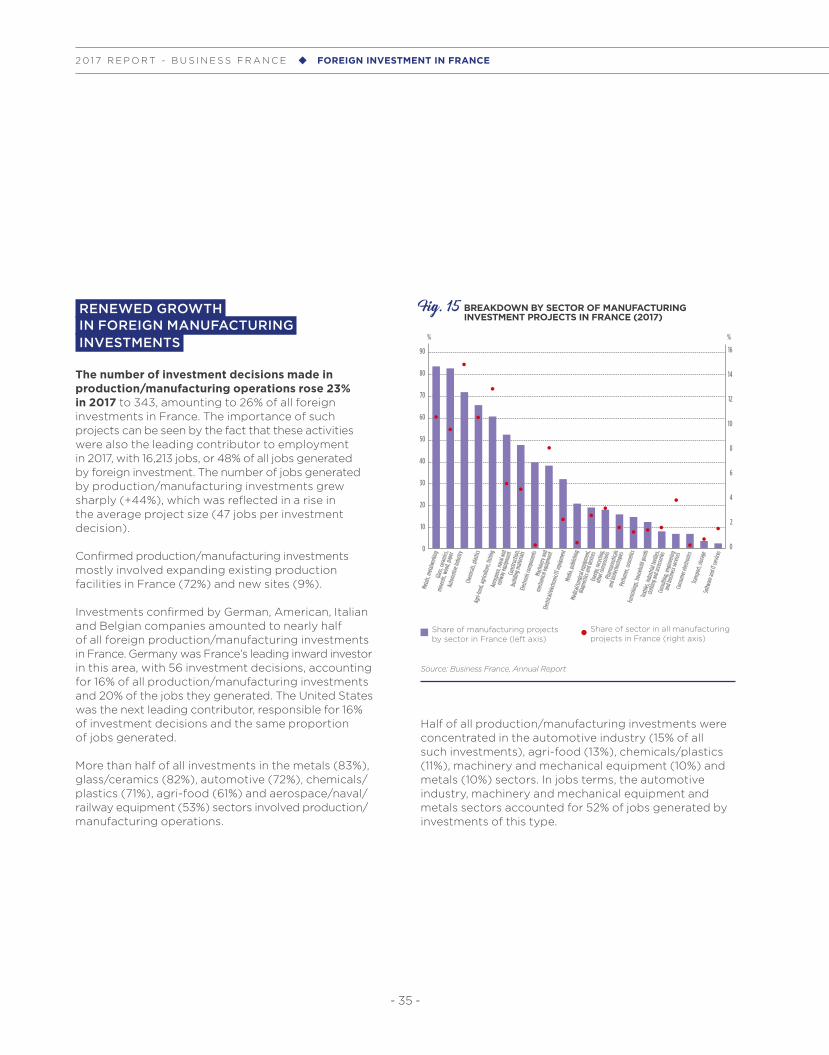
- 35 -
2 0 1 7 R E P O R T - B U S I N E S S F R A N C E FOREIGN INVESTMENT IN FRANCE
RENEWED GROWTH IN FOREIGN MANUFACTURINGINVESTMENTS
The number of investment decisions made in production/manufacturing operations rose 23% in 2017 to 343, amounting to 26% of all foreign investments in France. The importance of such projects can be seen by the fact that these activities were also the leading contributor to employment in 2017, with 16,213 jobs, or 48% of all jobs generated by foreign investment. The number of jobs generated by production/manufacturing investments grew sharply (+44%), which was reflected in a rise in the average project size (47 jobs per investment decision).
Confirmed production/manufacturing investments mostly involved expanding existing production facilities in France (72%) and new sites (9%).
Investments confirmed by German, American, Italian and Belgian companies amounted to nearly half of all foreign production/manufacturing investments in France. Germany was France’s leading inward investor in this area, with 56 investment decisions, accounting for 16% of all production/manufacturing investments and 20% of the jobs they generated. The United States was the next leading contributor, responsible for 16% of investment decisions and the same proportion of jobs generated.
More than half of all investments in the metals (83%), glass/ceramics (82%), automotive (72%), chemicals/plastics (71%), agri-food (61%) and aerospace/naval/railway equipment (53%) sectors involved production/manufacturing operations.
Fig. 15 BREAKDOWN BY SECTOR OF MANUFACTURING INVESTMENT PROJECTS IN FRANCE (2017)
Source: Business France, Annual Report
Share of manufacturing projects by sector in France (left axis)
Share of sector in all manufacturing projects in France (right axis)
35,000
30,000
25,000
20,000
15,000
10,000
5,000
0
0 10 20 30 40 50 60
%
% %
Unknown
Large
SMEs
Mid-size
Machinery
Cosmetics/perfumes
Automotive
Metals Chemicals/plastics
Financial services
Furnishings
Consumer electronics
Medical eqpt.
Electrical/IT eqpt.
Wholesale/retail
TextilesMedia/publishing
HospitalityPharmaceuticals
Agri-food
Energy/recycling
Consulting
Glass/ceramics
Software/IT services
Aerospace/naval/rail
Telecoms/ISPs
Transport/storage
Electronic componentsOther services
Construction
0 5 10 15 20 25 30 35 40%
High value-added industry
High value-added services
Low value-added industry
Low value-added services
2007 2008 2009 2010 2011 2012 2013 2014 2015 2016 2017
1,400
1,200
1,000
800
600
400
200
0
Wider criteria
Wider criteria
1,117
1,298
962
26,535
30,108
25 %
20 %
15 %
10 %
5 %
0 %
Telec
oms,
inter
net s
ervic
e pro
vider
sEle
ctron
ic co
mpon
ents
Aero
spac
e, na
val a
nd ra
ilway
equip
ment
Electr
ical/e
lectro
nic/IT
equip
ment
Medic
al/su
rgica
l equ
ipmen
t, diag
nosti
cs an
d dev
ices
Auto
motiv
e ind
ustry
Chem
icals,
plas
tics
Cons
tructi
on, b
uildin
g mate
rials
Perfu
mes,
cosm
etics
Agri-
food
, agr
icultu
re, fis
hing
Cons
umer
elec
tronic
s
Textile
s, ind
ustri
al tex
tiles, c
lothin
g and
acces
sorie
s
Finan
cial s
ervic
es, b
ankin
g and
insu
rance
Metal
s, me
talwo
rking
Energ
y, rec
yclin
g, ot
her c
once
ssion
s
Glass,
ceram
ics, m
ineral
s, wo
od, p
aper
Trans
port,
stor
age
Mach
inery
and m
echa
nical
equip
ment
Cons
ulting
, eng
ineer
ing an
d bus
iness
serv
ices
Phar
mace
utica
ls an
d biot
echn
ologie
s
Softw
are an
d IT s
ervic
es
Educ
ation
and t
rainin
g
Proximity to markets and other company operations
Potential for research partnershipswith French academia
Quality of R&D personnel
Proximity to French innovation clusters
Access to finance
Amount of state aid for R&D
Cost of R&D operations
Investment opportunities through acquisitions of French firms
“Unattractive” sub-total
Growth in jobs (%)
Growth in projects (%)
Sectors experiencing job and project growth
Sectors experiencing project growth
“Attractive” sub-total
-50
1,014
Average number of projects(2007-2017): 729
624 641 639 782 698 693 685 740 734 814 968
2007 2008 2009 2010 2011 2012 2013 2014 2015 2016 2017
Average number of jobs (2007-2017): 30,092
34,517 28,965 32,15331,932 31,815 27,958 25,908 29,631 25,478 32,77029,889
90
80
70
60
50
40
30
20
10
0
16
14
12
10
8
6
4
2
0
Metal
s, me
talwo
rking
Glass,
ceram
ics,
mine
rals,
wood
, pap
er
Chem
icals,
plas
tics
Agri-
food
, agr
icultu
re, fis
hing
Electr
onic
comp
onen
ts
Electr
ical/e
lectro
nic/IT
equip
ment
Media
, pub
lishin
g
Energ
y, rec
yclin
g,ot
her c
once
ssion
sPh
arma
ceut
icals
and b
iotec
hnolo
gies
Perfu
mes,
cosm
etics
Furn
ishing
s, ho
useh
old go
ods
Texti
les, in
dustr
ial te
xtiles
,clo
thing
and a
ccesso
ries
Cons
ulting
, eng
ineer
ingan
d bus
iness
serv
ices
Cons
umer
elec
tronic
sTra
nspo
rt, st
orag
eSo
ftware
and I
T ser
vices
Medic
al/su
rgica
l equ
ipmen
t,dia
gnos
tics a
nd de
vices
Cons
tructi
on,
build
ing
mat
erial
s
Auto
motiv
e ind
ustry
Aero
spac
e, na
val a
ndrai
lway
equip
ment
Mach
inery
and
mech
anica
l equ
ipmen
t
% %
60
50
40
30
20
10
0
25
15
10
5
0
%
corporates
companies
33,682 33,489
5014
18
19
19
20
22
25
25
37
49 33
45 36
48 33
50 29
47 31
48 28
44
121
2
2 17
2 17
2 17
18
3 20
3 22
3 22 32
50 100 150 200
250
200
150
100
50
0
-50
-100
-150
86
82
81
81
80
78
75
75
3,500
3,000
2,500
2,000
1,500
1,000
500
0
180
160
140
120
100
80
60
40
20
0
United States
United Kingdom
Germany
Netherlands
Luxembourg
Canada
Belgium
Italy
Spain
Switzerland
Norway
Japan
Ireland
Denmark
Other
0 50 100 150 200 250 300 350 400 450
0 5,000 10,000 15,000 20,000 25,000
United States
United Kingdom
Germany
Netherlands
Belgium
Canada
Spain
Italy
Indonesia
China
Switzerland
Luxembourg
New Zealand
Other
0 5 000
2013 2014 2015 2016 2017
81%
19%
79%
21%
69%
31%
63%
37%
65%
35%
2013 2014 2015 2016 2017
66%
34%
56%
44%
53%
47%
50%
50%
55%
45%
2013 2014 2015 2016 2017
1,200
1,000
800
600
400
200
0
126
40
166
233
61
198
681
78
202
989
61
50
130
783
179
2013 2014 2015 2016 2017
70
60
50
40
30
20
10
0
5.5
5
9.3
7.1
8
23.2
12.7
5
47.8
20.5
3.8
15.7
23
17.7
36.4
392
342
31
19
19
18
15
11
11
11
8
7
7
5
40
24,236
16,640
13,076
3,180
2,845
2,262
1,780
814
582
412
382
367
133
257
Half of all production/manufacturing investments were concentrated in the automotive industry (15% of all such investments), agri-food (13%), chemicals/plastics (11%), machinery and mechanical equipment (10%) and metals (10%) sectors. In jobs terms, the automotive industry, machinery and mechanical equipment and metals sectors accounted for 52% of jobs generated by investments of this type.
- 36 -
2 . FOREIGN INVESTMENT IN FRANCE IN 2017
They chose France
T R A N S P O R T, S T O R A G E
EKOL LOGISTIQUES OPENS TWO NEW DISTRIBUTION CENTERS IN 2017
Turkish carrier Ekol currently operates a weekly sea freight service, with capacity for 185 semi-trailers and containers, between Izmir, in Turkey, and the southern French port of Sète. The company now plans to introduce a second service, to arrive in France every Sunday, following the launch of a vessel with capacity for 200 semi-trailers.
In Sète, Ekol has already expanded its distribution center from 6,500 sq. m. to 10,000 sq. m., and now plans to grow there by employing a further 80 people by the end of 2018, including 30 French drivers. With this expansion in mind, Ekol opened two further distribution centers in November 2017, each measuring 2,000 sq. m., in Feyzin, near Lyon (Auvergne-Rhône-Alpes region), and Villeparisis (Ile de France / Paris region). There are currently 14 jobs spread over the two sites, with an additional 10 positions to be created by the end of 2018. Ekol has also acquired 25 tractor units registered in France and plans to purchase another 25 by the end of the year.
A U T O M O T I V E I N D U S T R Y
TOYOTA ANNOUNCES €300 MILLION INVESTMENT IN HAUTS DE FRANCE
Toyota Motor Corporation announced a new €300 million investment at its Toyota Motor Manufacturing France (TMMF) vehicle production facility in Onnaing, near Valenciennes, in northern France. Over the coming months, the site will be gradually upgraded to house new equipment, technology and systems in preparation for the introduction of the Toyota New Global Architecture (TNGA) platform. Toyota initially intends to offer permanent contracts to 300 temporary staff to start preparatory work, with the possibility of 400 new permanent positions being created once the site has reached its output target of 300,000 vehicles per year.
T R A N S P O R T, S T O R A G E
P&O PORTS DROPS ANCHOR IN SÈTE TO BOOST CONTAINER ACTIVITY
This subsidiary of DP World won the call for project proposals to increase container activity at the commercial port of Sète, in southern France, following the completion of a new 470m-long wharf in October 2016.
The partnership between P&O Ports and the Port of Sète was officially signed on July 11, 2017, and it is hoped that an estimated investment of some €30-40 million will generate around fifty new jobs over three years.
M E TA L S , M E TA LW O R K I N G
CUKI COFRESCO OPENS NEW PRODUCTION FACILITY IN AUVERGNE-RHÔNE-ALPES
Cuki Cofresco is the Italian leader in food packaging, with 400 employees and revenues of €200 million.
Following its purchase of Ecopla (the last manufacturer of aluminum trays in France, which went into administration in 2016), the Italian group decided to open a French subsidiary in the Auvergne-Rhône-Alpes region to run a manufacturing business.
By choosing the town of Grésivaudan in the French Alps as the location for the new site, it preserved over two decades of expertise developed by former workers at Ecopla.
This major industrial project will see €15 million invested and 44 new jobs created over the next three years. The French government has been able to support the Italian company’s investment in France by granting them a €2 million business development loan, to be repaid once Cuki France has become well established.
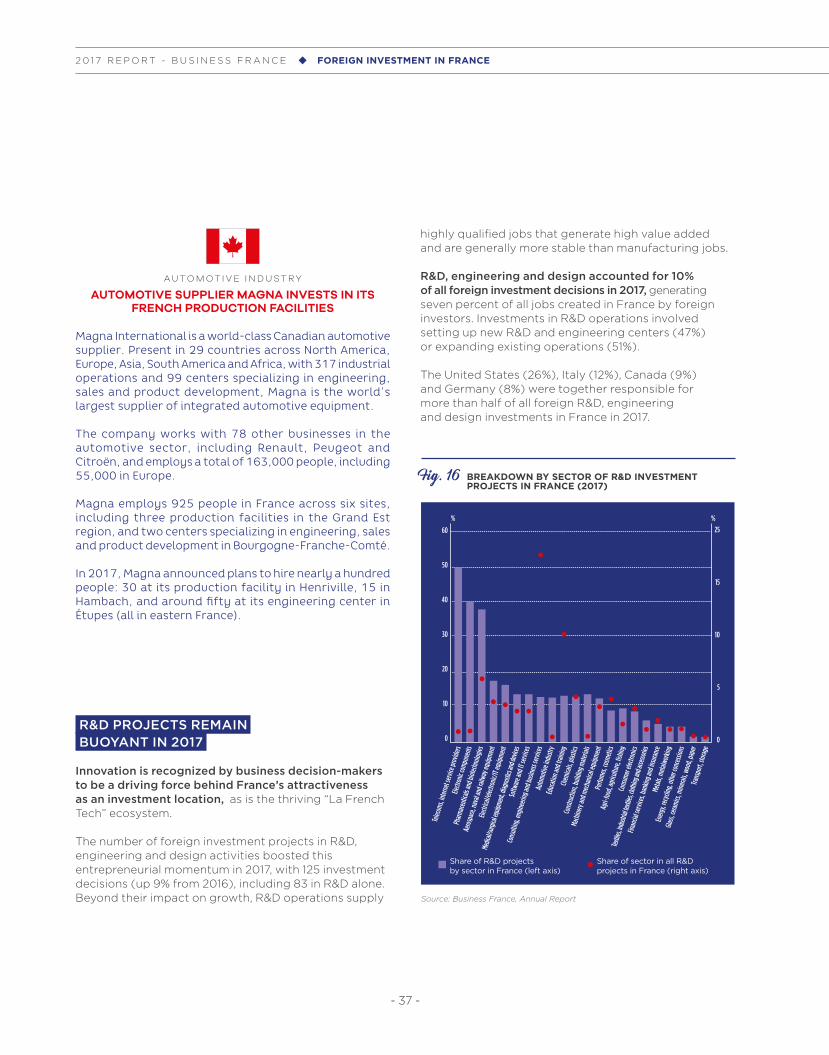
- 37 -
2 0 1 7 R E P O R T - B U S I N E S S F R A N C E FOREIGN INVESTMENT IN FRANCE
R&D PROJECTS REMAIN BUOYANT IN 2017
Innovation is recognized by business decision-makers to be a driving force behind France’s attractiveness as an investment location, as is the thriving “La French Tech” ecosystem.
The number of foreign investment projects in R&D, engineering and design activities boosted this entrepreneurial momentum in 2017, with 125 investment decisions (up 9% from 2016), including 83 in R&D alone. Beyond their impact on growth, R&D operations supply
highly qualified jobs that generate high value added and are generally more stable than manufacturing jobs.
R&D, engineering and design accounted for 10% of all foreign investment decisions in 2017, generating seven percent of all jobs created in France by foreign investors. Investments in R&D operations involved setting up new R&D and engineering centers (47%) or expanding existing operations (51%).
The United States (26%), Italy (12%), Canada (9%) and Germany (8%) were together responsible for more than half of all foreign R&D, engineering and design investments in France in 2017.
Fig. 16 BREAKDOWN BY SECTOR OF R&D INVESTMENT PROJECTS IN FRANCE (2017)
Share of R&D projects by sector in France (left axis)
Share of sector in all R&D projects in France (right axis)
Source: Business France, Annual Report
35,000
30,000
25,000
20,000
15,000
10,000
5,000
0
0 10 20 30 40 50 60
%
% %
Unknown
Large
SMEs
Mid-size
Machinery
Cosmetics/perfumes
Automotive
Metals Chemicals/plastics
Financial services
Furnishings
Consumer electronics
Medical eqpt.
Electrical/IT eqpt.
Wholesale/retail
TextilesMedia/publishing
HospitalityPharmaceuticals
Agri-food
Energy/recycling
Consulting
Glass/ceramics
Software/IT services
Aerospace/naval/rail
Telecoms/ISPs
Transport/storage
Electronic componentsOther services
Construction
0 5 10 15 20 25 30 35 40%
High value-added industry
High value-added services
Low value-added industry
Low value-added services
2007 2008 2009 2010 2011 2012 2013 2014 2015 2016 2017
1,400
1,200
1,000
800
600
400
200
0
Wider criteria
Wider criteria
1,117
1,298
962
26,535
30,108
25 %
20 %
15 %
10 %
5 %
0 %
Telec
oms,
inter
net s
ervic
e pro
vider
sEle
ctron
ic co
mpon
ents
Aero
spac
e, na
val a
nd ra
ilway
equip
ment
Electr
ical/e
lectro
nic/IT
equip
ment
Medic
al/su
rgica
l equ
ipmen
t, diag
nosti
cs an
d dev
ices
Auto
motiv
e ind
ustry
Chem
icals,
plas
tics
Cons
tructi
on, b
uildin
g mate
rials
Perfu
mes,
cosm
etics
Agri-
food
, agr
icultu
re, fis
hing
Cons
umer
elec
tronic
s
Textile
s, ind
ustri
al tex
tiles, c
lothin
g and
acces
sorie
s
Finan
cial s
ervic
es, b
ankin
g and
insu
rance
Metal
s, me
talwo
rking
Energ
y, rec
yclin
g, ot
her c
once
ssion
s
Glass,
ceram
ics, m
ineral
s, wo
od, p
aper
Trans
port,
stor
age
Mach
inery
and m
echa
nical
equip
ment
Cons
ulting
, eng
ineer
ing an
d bus
iness
serv
ices
Phar
mace
utica
ls an
d biot
echn
ologie
s
Softw
are an
d IT s
ervic
es
Educ
ation
and t
rainin
g
Proximity to markets and other company operations
Potential for research partnershipswith French academia
Quality of R&D personnel
Proximity to French innovation clusters
Access to finance
Amount of state aid for R&D
Cost of R&D operations
Investment opportunities through acquisitions of French firms
“Unattractive” sub-total
Growth in jobs (%)
Growth in projects (%)
Sectors experiencing job and project growth
Sectors experiencing project growth
“Attractive” sub-total
-50
1,014
Average number of projects(2007-2017): 729
624 641 639 782 698 693 685 740 734 814 968
2007 2008 2009 2010 2011 2012 2013 2014 2015 2016 2017
Average number of jobs (2007-2017): 30,092
34,517 28,965 32,15331,932 31,815 27,958 25,908 29,631 25,478 32,77029,889
90
80
70
60
50
40
30
20
10
0
16
14
12
10
8
6
4
2
0Me
tals,
metal
worki
ngGla
ss, ce
ramics
,mi
neral
s, wo
od, p
aper
Chem
icals,
plas
tics
Agri-
food
, agr
icultu
re, fis
hing
Electr
onic
comp
onen
ts
Electr
ical/e
lectro
nic/IT
equip
ment
Media
, pub
lishin
g
Energ
y, rec
yclin
g,ot
her c
once
ssion
sPh
arma
ceut
icals
and b
iotec
hnolo
gies
Perfu
mes,
cosm
etics
Furn
ishing
s, ho
useh
old go
ods
Texti
les, in
dustr
ial te
xtiles
,clo
thing
and a
ccesso
ries
Cons
ulting
, eng
ineer
ingan
d bus
iness
serv
ices
Cons
umer
elec
tronic
sTra
nspo
rt, st
orag
eSo
ftware
and I
T ser
vices
Medic
al/su
rgica
l equ
ipmen
t,dia
gnos
tics a
nd de
vices
Cons
tructi
on,
build
ing
mat
erial
s
Auto
motiv
e ind
ustry
Aero
spac
e, na
val a
ndrai
lway
equip
ment
Mach
inery
and
mech
anica
l equ
ipmen
t
% %
60
50
40
30
20
10
0
25
15
10
5
0
%
corporates
companies
33,682 33,489
5014
18
19
19
20
22
25
25
37
49 33
45 36
48 33
50 29
47 31
48 28
44
121
2
2 17
2 17
2 17
18
3 20
3 22
3 22 32
50 100 150 200
250
200
150
100
50
0
-50
-100
-150
86
82
81
81
80
78
75
75
3,500
3,000
2,500
2,000
1,500
1,000
500
0
180
160
140
120
100
80
60
40
20
0
United States
United Kingdom
Germany
Netherlands
Luxembourg
Canada
Belgium
Italy
Spain
Switzerland
Norway
Japan
Ireland
Denmark
Other
0 50 100 150 200 250 300 350 400 450
0 5,000 10,000 15,000 20,000 25,000
United States
United Kingdom
Germany
Netherlands
Belgium
Canada
Spain
Italy
Indonesia
China
Switzerland
Luxembourg
New Zealand
Other
0 5 000
2013 2014 2015 2016 2017
81%
19%
79%
21%
69%
31%
63%
37%
65%
35%
2013 2014 2015 2016 2017
66%
34%
56%
44%
53%
47%
50%
50%
55%
45%
2013 2014 2015 2016 2017
1,200
1,000
800
600
400
200
0
126
40
166
233
61
198
681
78
202
989
61
50
130
783
179
2013 2014 2015 2016 2017
70
60
50
40
30
20
10
0
5.5
5
9.3
7.1
8
23.2
12.7
5
47.8
20.5
3.8
15.7
23
17.7
36.4
392
342
31
19
19
18
15
11
11
11
8
7
7
5
40
24,236
16,640
13,076
3,180
2,845
2,262
1,780
814
582
412
382
367
133
257
A U T O M O T I V E I N D U S T R Y
AUTOMOTIVE SUPPLIER MAGNA INVESTS IN ITS FRENCH PRODUCTION FACILITIES
Magna International is a world-class Canadian automotive supplier. Present in 29 countries across North America, Europe, Asia, South America and Africa, with 317 industrial operations and 99 centers specializing in engineering, sales and product development, Magna is the world’s largest supplier of integrated automotive equipment.
The company works with 78 other businesses in the automotive sector, including Renault, Peugeot and Citroën, and employs a total of 163,000 people, including 55,000 in Europe.
Magna employs 925 people in France across six sites, including three production facilities in the Grand Est region, and two centers specializing in engineering, sales and product development in Bourgogne-Franche-Comté.
In 2017, Magna announced plans to hire nearly a hundred people: 30 at its production facility in Henriville, 15 in Hambach, and around fifty at its engineering center in Étupes (all in eastern France).
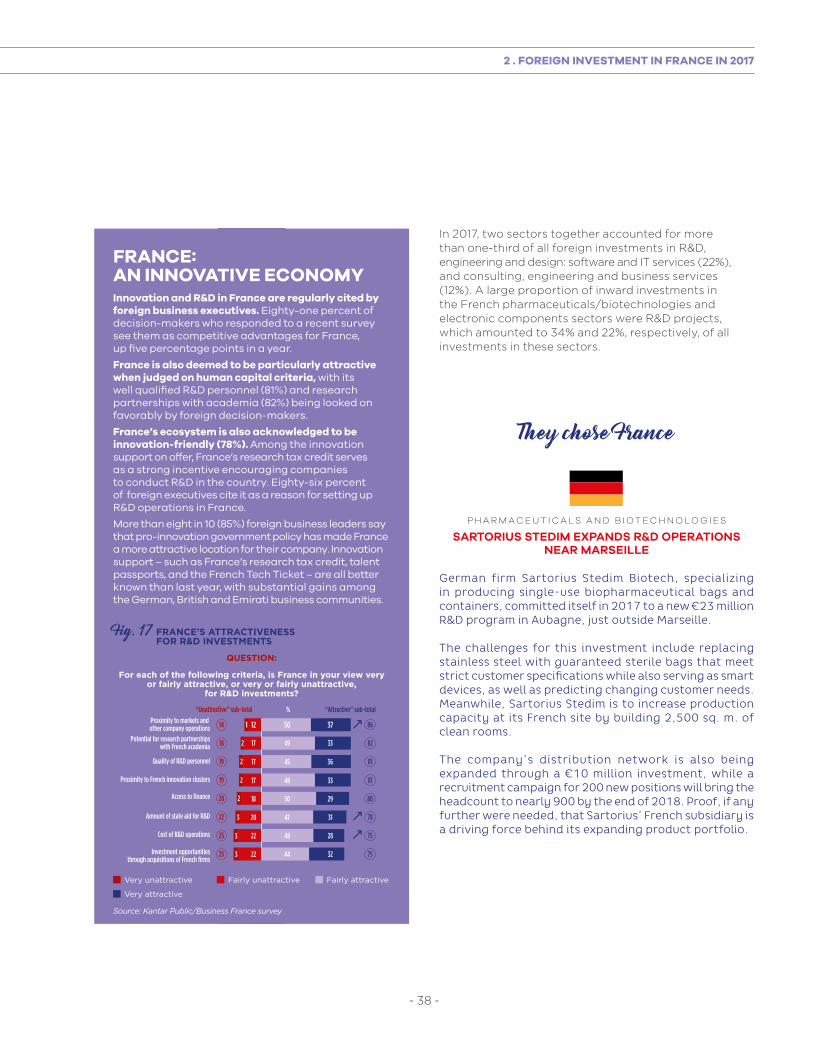
- 38 -
2 . FOREIGN INVESTMENT IN FRANCE IN 2017
FRANCE: AN INNOVATIVE ECONOMYInnovation and R&D in France are regularly cited by foreign business executives. Eighty-one percent of decision-makers who responded to a recent survey see them as competitive advantages for France, up five percentage points in a year.
France is also deemed to be particularly attractive when judged on human capital criteria, with its well qualified R&D personnel (81%) and research partnerships with academia (82%) being looked on favorably by foreign decision-makers.
France’s ecosystem is also acknowledged to be innovation-friendly (78%). Among the innovation support on offer, France’s research tax credit serves as a strong incentive encouraging companies to conduct R&D in the country. Eighty-six percent of foreign executives cite it as a reason for setting up R&D operations in France.
More than eight in 10 (85%) foreign business leaders say that pro-innovation government policy has made France a more attractive location for their company. Innovation support – such as France’s research tax credit, talent passports, and the French Tech Ticket – are all better known than last year, with substantial gains among the German, British and Emirati business communities.
QUESTION:
For each of the following criteria, is France in your view very or fairly attractive, or very or fairly unattractive,
for R&D investments?
35,000
30,000
25,000
20,000
15,000
10,000
5,000
0
0 10 20 30 40 50 60
%
% %
Unknown
Large
SMEs
Mid-size
Machinery
Cosmetics/perfumes
Automotive
Metals Chemicals/plastics
Financial services
Furnishings
Consumer electronics
Medical eqpt.
Electrical/IT eqpt.
Wholesale/retail
TextilesMedia/publishing
HospitalityPharmaceuticals
Agri-food
Energy/recycling
Consulting
Glass/ceramics
Software/IT services
Aerospace/naval/rail
Telecoms/ISPs
Transport/storage
Electronic componentsOther services
Construction
0 5 10 15 20 25 30 35 40%
High value-added industry
High value-added services
Low value-added industry
Low value-added services
2007 2008 2009 2010 2011 2012 2013 2014 2015 2016 2017
1,400
1,200
1,000
800
600
400
200
0
Wider criteria
Wider criteria
1,117
1,298
962
26,535
30,108
25 %
20 %
15 %
10 %
5 %
0 %
Telec
oms,
inter
net s
ervic
e pro
vider
sEle
ctron
ic co
mpon
ents
Aero
spac
e, na
val a
nd ra
ilway
equip
ment
Electr
ical/e
lectro
nic/IT
equip
ment
Medic
al/su
rgica
l equ
ipmen
t, diag
nosti
cs an
d dev
ices
Auto
motiv
e ind
ustry
Chem
icals,
plas
tics
Cons
tructi
on, b
uildin
g mate
rials
Perfu
mes,
cosm
etics
Agri-
food
, agr
icultu
re, fis
hing
Cons
umer
elec
tronic
s
Textile
s, ind
ustri
al tex
tiles, c
lothin
g and
acces
sorie
s
Finan
cial s
ervic
es, b
ankin
g and
insu
rance
Metal
s, me
talwo
rking
Energ
y, rec
yclin
g, ot
her c
once
ssion
s
Glass,
ceram
ics, m
ineral
s, wo
od, p
aper
Trans
port,
stor
age
Mach
inery
and m
echa
nical
equip
ment
Cons
ulting
, eng
ineer
ing an
d bus
iness
serv
ices
Phar
mace
utica
ls an
d biot
echn
ologie
s
Softw
are an
d IT s
ervic
es
Educ
ation
and t
rainin
g
Proximity to markets and other company operations
Potential for research partnershipswith French academia
Quality of R&D personnel
Proximity to French innovation clusters
Access to finance
Amount of state aid for R&D
Cost of R&D operations
Investment opportunities through acquisitions of French firms
“Unattractive” sub-total
Growth in jobs (%)
Growth in projects (%)
Sectors experiencing job and project growth
Sectors experiencing project growth
“Attractive” sub-total
-50
1,014
Average number of projects(2007-2017): 729
624 641 639 782 698 693 685 740 734 814 968
2007 2008 2009 2010 2011 2012 2013 2014 2015 2016 2017
Average number of jobs (2007-2017): 30,092
34,517 28,965 32,15331,932 31,815 27,958 25,908 29,631 25,478 32,77029,889
90
80
70
60
50
40
30
20
10
0
16
14
12
10
8
6
4
2
0
Metal
s, me
talwo
rking
Glass,
ceram
ics,
mine
rals,
wood
, pap
er
Chem
icals,
plas
tics
Agri-
food
, agr
icultu
re, fis
hing
Electr
onic
comp
onen
ts
Electr
ical/e
lectro
nic/IT
equip
ment
Media
, pub
lishin
g
Energ
y, rec
yclin
g,ot
her c
once
ssion
sPh
arma
ceut
icals
and b
iotec
hnolo
gies
Perfu
mes,
cosm
etics
Furn
ishing
s, ho
useh
old go
ods
Texti
les, in
dustr
ial te
xtiles
,clo
thing
and a
ccesso
ries
Cons
ulting
, eng
ineer
ingan
d bus
iness
serv
ices
Cons
umer
elec
tronic
sTra
nspo
rt, st
orag
eSo
ftware
and I
T ser
vices
Medic
al/su
rgica
l equ
ipmen
t,dia
gnos
tics a
nd de
vices
Cons
tructi
on,
build
ing
mat
erial
s
Auto
motiv
e ind
ustry
Aero
spac
e, na
val a
ndrai
lway
equip
ment
Mach
inery
and
mech
anica
l equ
ipmen
t
% %
60
50
40
30
20
10
0
25
15
10
5
0
%
corporates
companies
33,682 33,489
5014
18
19
19
20
22
25
25
37
49 33
45 36
48 33
50 29
47 31
48 28
44
121
2
2 17
2 17
2 17
18
3 20
3 22
3 22 32
50 100 150 200
250
200
150
100
50
0
-50
-100
-150
86
82
81
81
80
78
75
75
3,500
3,000
2,500
2,000
1,500
1,000
500
0
180
160
140
120
100
80
60
40
20
0
United States
United Kingdom
Germany
Netherlands
Luxembourg
Canada
Belgium
Italy
Spain
Switzerland
Norway
Japan
Ireland
Denmark
Other
0 50 100 150 200 250 300 350 400 450
0 5,000 10,000 15,000 20,000 25,000
United States
United Kingdom
Germany
Netherlands
Belgium
Canada
Spain
Italy
Indonesia
China
Switzerland
Luxembourg
New Zealand
Other
0 5 000
2013 2014 2015 2016 2017
81%
19%
79%
21%
69%
31%
63%
37%
65%
35%
2013 2014 2015 2016 2017
66%
34%
56%
44%
53%
47%
50%
50%
55%
45%
2013 2014 2015 2016 2017
1,200
1,000
800
600
400
200
0
126
40
166
233
61
198
681
78
202
989
61
50
130
783
179
2013 2014 2015 2016 2017
70
60
50
40
30
20
10
0
5.5
5
9.3
7.1
8
23.2
12.7
5
47.8
20.5
3.8
15.7
23
17.7
36.4
392
342
31
19
19
18
15
11
11
11
8
7
7
5
40
24,236
16,640
13,076
3,180
2,845
2,262
1,780
814
582
412
382
367
133
257
Very unattractive Fairly unattractive Fairly attractive
Very attractive
Source: Kantar Public/Business France survey
Fig. 17 FRANCE’S ATTRACTIVENESS FOR R&D INVESTMENTS
In 2017, two sectors together accounted for more than one-third of all foreign investments in R&D, engineering and design: software and IT services (22%), and consulting, engineering and business services (12%). A large proportion of inward investments in the French pharmaceuticals/biotechnologies and electronic components sectors were R&D projects, which amounted to 34% and 22%, respectively, of all investments in these sectors.
They chose France
P H A R M A C E U T I C A L S A N D B I O T E C H N O L O G I E S
SARTORIUS STEDIM EXPANDS R&D OPERATIONS NEAR MARSEILLE
German firm Sartorius Stedim Biotech, specializing in producing single-use biopharmaceutical bags and containers, committed itself in 2017 to a new €23 million R&D program in Aubagne, just outside Marseille.
The challenges for this investment include replacing stainless steel with guaranteed sterile bags that meet strict customer specifications while also serving as smart devices, as well as predicting changing customer needs. Meanwhile, Sartorius Stedim is to increase production capacity at its French site by building 2,500 sq. m. of clean rooms.
The company’s distribution network is also being expanded through a €10 million investment, while a recruitment campaign for 200 new positions will bring the headcount to nearly 900 by the end of 2018. Proof, if any further were needed, that Sartorius’ French subsidiary is a driving force behind its expanding product portfolio.
- 39 -
2 0 1 7 R E P O R T - B U S I N E S S F R A N C E FOREIGN INVESTMENT IN FRANCE
S O F T WA R E A N D I T S E RV I C E S
SYMPHONY COMMUNICATION SERVICES, A ‘UNICORN’ COMES TO SOPHIA ANTIPOLIS
Founded in 2014 in Silicon Valley, Symphony is a secure cloud-based instant-messaging and content sharing platform. The company has more than 300,000 users worldwide, most of whom are financial professionals.
Now a ‘unicorn’ worth more than US$1 billion, Symphony decided in 2017 to set up its first European R&D center in the Sophia Antipolis technology park, near Nice, creating a hundred new jobs for highly qualified engineers in cloud technologies.
S O F T WA R E A N D I T S E RV I C E S
TRUCKNET OPENS FIRST EUROPEAN BASE IN PARIS REGION
Israeli firm Trucknet has confirmed its taste for innovation by developing a system for sharing data and streamlining the transport of goods. Their cloud platform is aimed squarely at transport professionals, enabling them to share floor space, thereby improving profitability and reducing environmental impacts. Following Trucknet’s participation in the 2015 United Nations Climate Change Conference, this leading logistics company decided to open its first European base in France in 2017.
S O F T WA R E A N D I T S E RV I C E S
UPSKILLS SETS UP GLOBAL R&D CENTER IN PARIS REGION
Singapore-based Upskills provides expertise in software solutions for the investment banking and financial institutions sector in Asia-Pacific, the Middle East and Europe.
After opening subsidiaries in Asia, Upskills decided to reshuffle its operations and open a global R&D center in France, while maintaining its headquarters and most of the consultancy side of the business in Asia.
Their investment in France is expected to create around thirty jobs, mainly in R&D.
- 40 -
2 . FOREIGN INVESTMENT IN FRANCE IN 2017
BUSINESS SECTOR ANALYSIS
Foreign investors in France operate in a variety of sectors
There were 746 investment decisions in the manufacturing sector in 2017, accounting for 57% of all inward investment projects. Service-sector companies were responsible for 552 investment decisions (43%).
The leading sectors of companies investing in France in 2017 were software and IT services (14%), consulting, engineering and business services (9%), wholesale and retail (8%), machinery and mechanical equipment (7%), agri-food (6%), and the automotive industry (6%).
The source of investments in France in 2017 varied by business sector. While American investments were particularly prevalent in the software/IT services sector (35% of all foreign investment decisions in this area) as well as the electrical/electronic/IT equipment sector (20%), German firms stood out for making a third of all foreign investments in the automotive industry, wholesale/retail, and energy sectors. Italian companies meanwhile made a key contribution in metals/metalworking and aerospace/naval/railway equipment, accounting for a quarter of all foreign investments in these sectors.
They chose France
S O F T WA R E A N D I T S E RV I C E S
COMARCH SAS SETS UP BUSINESS IN HAUTS DE FRANCE
Polish software publisher Comarch SAS, which also specializes in high value-added IT services and solutions for the retail trade, invested €8.3 million in 2017 in Lezennes, northern France, to build a data center to serve its customers in Western Europe. The investment led to the recruitment of 10 people in 2017, with a further thirty jobs set to be created by the end of 2019.
S O F T WA R E A N D I T S E RV I C E S
MINDMAZE INVESTS IN FRENCH BRAIN POWER
This Swiss ‘unicorn’ valued at US$1 billion, founded in 2012, specializes in developing virtual reality software to help with the neurological rehabilitation of stroke victims. The startup established itself in France in 2017, and has an R&D center in Paris, where a dozen researchers have been working on how to interpret brain signals.
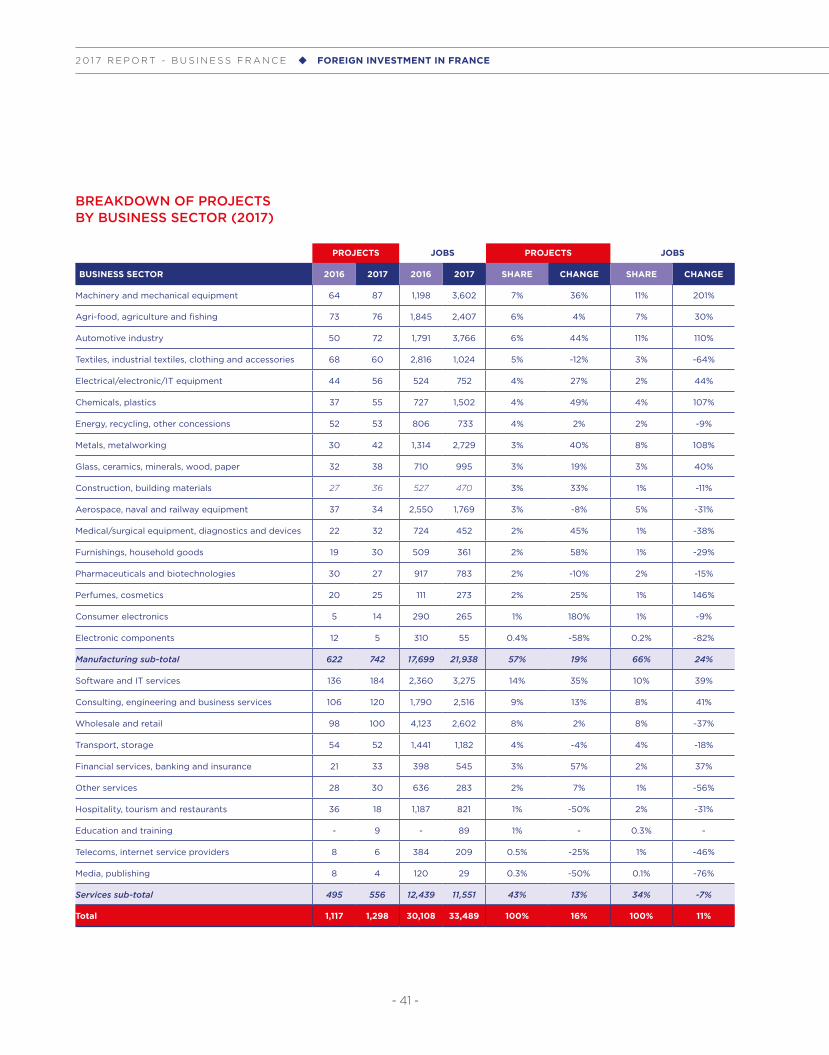
- 41 -
2 0 1 7 R E P O R T - B U S I N E S S F R A N C E FOREIGN INVESTMENT IN FRANCE
BREAKDOWN OF PROJECTS BY BUSINESS SECTOR (2017)
PROJECTS JOBS PROJECTS JOBS
BUSINESS SECTOR 2016 2017 2016 2017 SHARE CHANGE SHARE CHANGE
Machinery and mechanical equipment 64 87 1,198 3,602 7% 36% 11% 201%
Agri-food, agriculture and fishing 73 76 1,845 2,407 6% 4% 7% 30%
Automotive industry 50 72 1,791 3,766 6% 44% 11% 110%
Textiles, industrial textiles, clothing and accessories 68 60 2,816 1,024 5% -12% 3% -64%
Electrical/electronic/IT equipment 44 56 524 752 4% 27% 2% 44%
Chemicals, plastics 37 55 727 1,502 4% 49% 4% 107%
Energy, recycling, other concessions 52 53 806 733 4% 2% 2% -9%
Metals, metalworking 30 42 1,314 2,729 3% 40% 8% 108%
Glass, ceramics, minerals, wood, paper 32 38 710 995 3% 19% 3% 40%
Construction, building materials 27 36 527 470 3% 33% 1% -11%
Aerospace, naval and railway equipment 37 34 2,550 1,769 3% -8% 5% -31%
Medical/surgical equipment, diagnostics and devices 22 32 724 452 2% 45% 1% -38%
Furnishings, household goods 19 30 509 361 2% 58% 1% -29%
Pharmaceuticals and biotechnologies 30 27 917 783 2% -10% 2% -15%
Perfumes, cosmetics 20 25 111 273 2% 25% 1% 146%
Consumer electronics 5 14 290 265 1% 180% 1% -9%
Electronic components 12 5 310 55 0.4% -58% 0.2% -82%
Manufacturing sub-total 622 742 17,699 21,938 57% 19% 66% 24%
Software and IT services 136 184 2,360 3,275 14% 35% 10% 39%
Consulting, engineering and business services 106 120 1,790 2,516 9% 13% 8% 41%
Wholesale and retail 98 100 4,123 2,602 8% 2% 8% -37%
Transport, storage 54 52 1,441 1,182 4% -4% 4% -18%
Financial services, banking and insurance 21 33 398 545 3% 57% 2% 37%
Other services 28 30 636 283 2% 7% 1% -56%
Hospitality, tourism and restaurants 36 18 1,187 821 1% -50% 2% -31%
Education and training - 9 - 89 1% - 0.3% -
Telecoms, internet service providers 8 6 384 209 0.5% -25% 1% -46%
Media, publishing 8 4 120 29 0.3% -50% 0.1% -76%
Services sub-total 495 556 12,439 11,551 43% 13% 34% -7%
Total 1,117 1,298 30,108 33,489 100% 16% 100% 11%
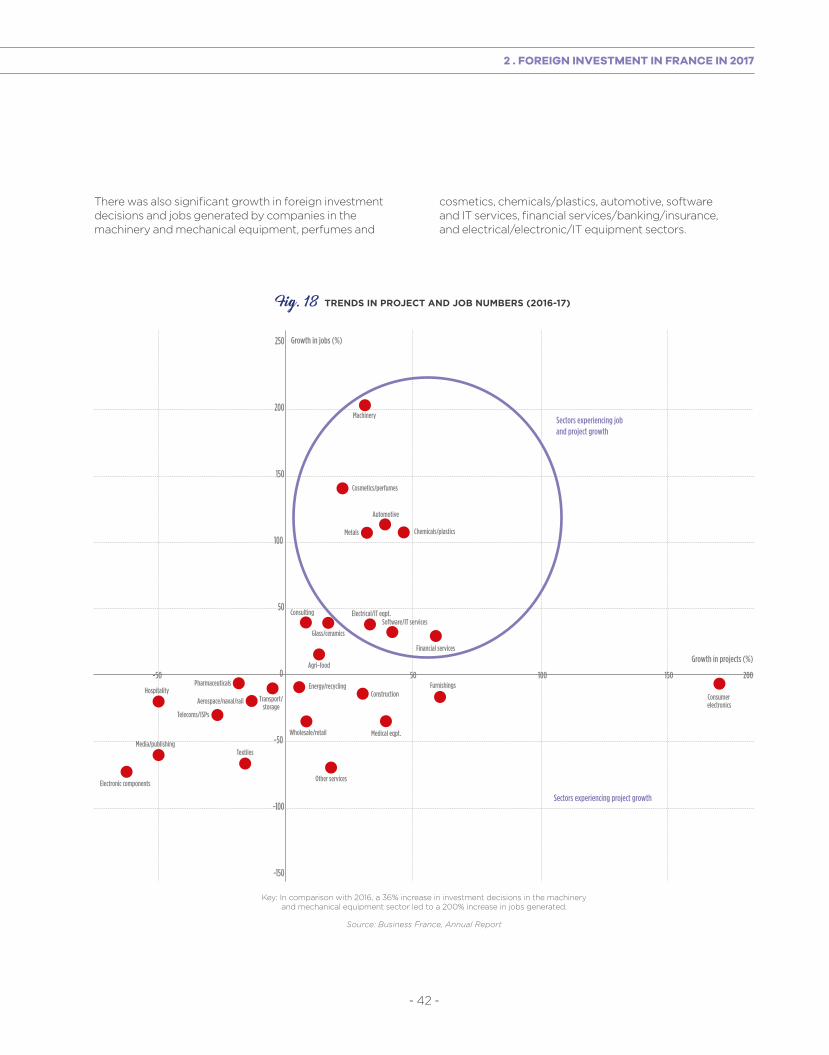
- 42 -
2 . FOREIGN INVESTMENT IN FRANCE IN 2017
There was also significant growth in foreign investment decisions and jobs generated by companies in the machinery and mechanical equipment, perfumes and
35,000
30,000
25,000
20,000
15,000
10,000
5,000
0
0 10 20 30 40 50 60
%
% %
Unknown
Large
SMEs
Mid-size
Machinery
Cosmetics/perfumes
Automotive
Metals Chemicals/plastics
Financial services
Furnishings
Consumer electronics
Medical eqpt.
Electrical/IT eqpt.
Wholesale/retail
TextilesMedia/publishing
HospitalityPharmaceuticals
Agri-food
Energy/recycling
Consulting
Glass/ceramics
Software/IT services
Aerospace/naval/rail
Telecoms/ISPs
Transport/storage
Electronic componentsOther services
Construction
0 5 10 15 20 25 30 35 40%
High value-added industry
High value-added services
Low value-added industry
Low value-added services
2007 2008 2009 2010 2011 2012 2013 2014 2015 2016 2017
1,400
1,200
1,000
800
600
400
200
0
Wider criteria
Wider criteria
1,117
1,298
962
26,535
30,108
25 %
20 %
15 %
10 %
5 %
0 %
Telec
oms,
inter
net s
ervic
e pro
vider
sEle
ctron
ic co
mpon
ents
Aero
spac
e, na
val a
nd ra
ilway
equip
ment
Electr
ical/e
lectro
nic/IT
equip
ment
Medic
al/su
rgica
l equ
ipmen
t, diag
nosti
cs an
d dev
ices
Auto
motiv
e ind
ustry
Chem
icals,
plas
tics
Cons
tructi
on, b
uildin
g mate
rials
Perfu
mes,
cosm
etics
Agri-
food
, agr
icultu
re, fis
hing
Cons
umer
elec
tronic
s
Textile
s, ind
ustri
al tex
tiles, c
lothin
g and
acces
sorie
s
Finan
cial s
ervic
es, b
ankin
g and
insu
rance
Metal
s, me
talwo
rking
Energ
y, rec
yclin
g, ot
her c
once
ssion
s
Glass,
ceram
ics, m
ineral
s, wo
od, p
aper
Trans
port,
stor
age
Mach
inery
and m
echa
nical
equip
ment
Cons
ulting
, eng
ineer
ing an
d bus
iness
serv
ices
Phar
mace
utica
ls an
d biot
echn
ologie
s
Softw
are an
d IT s
ervic
es
Educ
ation
and t
rainin
g
Proximity to markets and other company operations
Potential for research partnershipswith French academia
Quality of R&D personnel
Proximity to French innovation clusters
Access to finance
Amount of state aid for R&D
Cost of R&D operations
Investment opportunities through acquisitions of French firms
“Unattractive” sub-total
Growth in jobs (%)
Growth in projects (%)
Sectors experiencing job and project growth
Sectors experiencing project growth
“Attractive” sub-total
-50
1,014
Average number of projects(2007-2017): 729
624 641 639 782 698 693 685 740 734 814 968
2007 2008 2009 2010 2011 2012 2013 2014 2015 2016 2017
Average number of jobs (2007-2017): 30,092
34,517 28,965 32,15331,932 31,815 27,958 25,908 29,631 25,478 32,77029,889
90
80
70
60
50
40
30
20
10
0
16
14
12
10
8
6
4
2
0
Metal
s, me
talwo
rking
Glass,
ceram
ics,
mine
rals,
wood
, pap
er
Chem
icals,
plas
tics
Agri-
food
, agr
icultu
re, fis
hing
Electr
onic
comp
onen
ts
Electr
ical/e
lectro
nic/IT
equip
ment
Media
, pub
lishin
g
Energ
y, rec
yclin
g,ot
her c
once
ssion
sPh
arma
ceut
icals
and b
iotec
hnolo
gies
Perfu
mes,
cosm
etics
Furn
ishing
s, ho
useh
old go
ods
Texti
les, in
dustr
ial te
xtiles
,clo
thing
and a
ccesso
ries
Cons
ulting
, eng
ineer
ingan
d bus
iness
serv
ices
Cons
umer
elec
tronic
sTra
nspo
rt, st
orag
eSo
ftware
and I
T ser
vices
Medic
al/su
rgica
l equ
ipmen
t,dia
gnos
tics a
nd de
vices
Cons
tructi
on,
build
ing
mat
erial
s
Auto
motiv
e ind
ustry
Aero
spac
e, na
val a
ndrai
lway
equip
ment
Mach
inery
and
mech
anica
l equ
ipmen
t
% %
60
50
40
30
20
10
0
25
15
10
5
0
%
corporates
companies
33,682 33,489
5014
18
19
19
20
22
25
25
37
49 33
45 36
48 33
50 29
47 31
48 28
44
121
2
2 17
2 17
2 17
18
3 20
3 22
3 22 32
50 100 150 200
250
200
150
100
50
0
-50
-100
-150
86
82
81
81
80
78
75
75
3,500
3,000
2,500
2,000
1,500
1,000
500
0
180
160
140
120
100
80
60
40
20
0
United States
United Kingdom
Germany
Netherlands
Luxembourg
Canada
Belgium
Italy
Spain
Switzerland
Norway
Japan
Ireland
Denmark
Other
0 50 100 150 200 250 300 350 400 450
0 5,000 10,000 15,000 20,000 25,000
United States
United Kingdom
Germany
Netherlands
Belgium
Canada
Spain
Italy
Indonesia
China
Switzerland
Luxembourg
New Zealand
Other
0 5 000
2013 2014 2015 2016 2017
81%
19%
79%
21%
69%
31%
63%
37%
65%
35%
2013 2014 2015 2016 2017
66%
34%
56%
44%
53%
47%
50%
50%
55%
45%
2013 2014 2015 2016 2017
1,200
1,000
800
600
400
200
0
126
40
166
233
61
198
681
78
202
989
61
50
130
783
179
2013 2014 2015 2016 2017
70
60
50
40
30
20
10
0
5.5
5
9.3
7.1
8
23.2
12.7
5
47.8
20.5
3.8
15.7
23
17.7
36.4
392
342
31
19
19
18
15
11
11
11
8
7
7
5
40
24,236
16,640
13,076
3,180
2,845
2,262
1,780
814
582
412
382
367
133
257
Fig. 18 TRENDS IN PROJECT AND JOB NUMBERS (2016-17)
Key: In comparison with 2016, a 36% increase in investment decisions in the machinery and mechanical equipment sector led to a 200% increase in jobs generated.
Source: Business France, Annual Report
cosmetics, chemicals/plastics, automotive, software and IT services, financial services/banking/insurance, and electrical/electronic/IT equipment sectors.
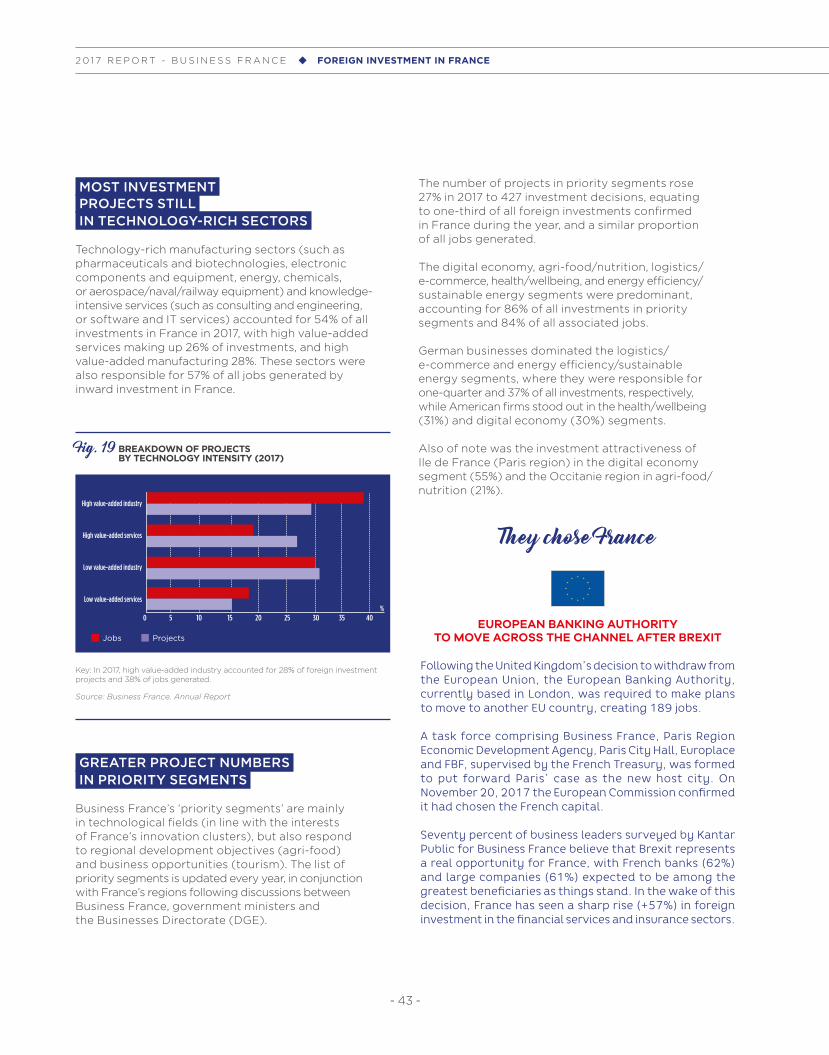
- 43 -
2 0 1 7 R E P O R T - B U S I N E S S F R A N C E FOREIGN INVESTMENT IN FRANCE
MOST INVESTMENT PROJECTS STILL IN TECHNOLOGY-RICH SECTORS
Technology-rich manufacturing sectors (such as pharmaceuticals and biotechnologies, electronic components and equipment, energy, chemicals, or aerospace/naval/railway equipment) and knowledge-intensive services (such as consulting and engineering, or software and IT services) accounted for 54% of all investments in France in 2017, with high value-added services making up 26% of investments, and high value-added manufacturing 28%. These sectors were also responsible for 57% of all jobs generated by inward investment in France.
GREATER PROJECT NUMBERS IN PRIORITY SEGMENTS
Business France’s ‘priority segments’ are mainly in technological fields (in line with the interests of France’s innovation clusters), but also respond to regional development objectives (agri-food) and business opportunities (tourism). The list of priority segments is updated every year, in conjunction with France’s regions following discussions between Business France, government ministers and the Businesses Directorate (DGE).
The number of projects in priority segments rose 27% in 2017 to 427 investment decisions, equating to one-third of all foreign investments confirmed in France during the year, and a similar proportion of all jobs generated.
The digital economy, agri-food/nutrition, logistics/ e-commerce, health/wellbeing, and energy efficiency/sustainable energy segments were predominant, accounting for 86% of all investments in priority segments and 84% of all associated jobs.
German businesses dominated the logistics/ e-commerce and energy efficiency/sustainable energy segments, where they were responsible for one-quarter and 37% of all investments, respectively, while American firms stood out in the health/wellbeing (31%) and digital economy (30%) segments.
Also of note was the investment attractiveness of Ile de France (Paris region) in the digital economy segment (55%) and the Occitanie region in agri-food/nutrition (21%).
35,000
30,000
25,000
20,000
15,000
10,000
5,000
0
0 10 20 30 40 50 60
%
% %
Unknown
Large
SMEs
Mid-size
Machinery
Cosmetics/perfumes
Automotive
Metals Chemicals/plastics
Financial services
Furnishings
Consumer electronics
Medical eqpt.
Electrical/IT eqpt.
Wholesale/retail
TextilesMedia/publishing
HospitalityPharmaceuticals
Agri-food
Energy/recycling
Consulting
Glass/ceramics
Software/IT services
Aerospace/naval/rail
Telecoms/ISPs
Transport/storage
Electronic componentsOther services
Construction
0 5 10 15 20 25 30 35 40%
High value-added industry
High value-added services
Low value-added industry
Low value-added services
2007 2008 2009 2010 2011 2012 2013 2014 2015 2016 2017
1,400
1,200
1,000
800
600
400
200
0
Wider criteria
Wider criteria
1,117
1,298
962
26,535
30,108
25 %
20 %
15 %
10 %
5 %
0 %
Telec
oms,
inter
net s
ervic
e pro
vider
sEle
ctron
ic co
mpon
ents
Aero
spac
e, na
val a
nd ra
ilway
equip
ment
Electr
ical/e
lectro
nic/IT
equip
ment
Medic
al/su
rgica
l equ
ipmen
t, diag
nosti
cs an
d dev
ices
Auto
motiv
e ind
ustry
Chem
icals,
plas
tics
Cons
tructi
on, b
uildin
g mate
rials
Perfu
mes,
cosm
etics
Agri-
food
, agr
icultu
re, fis
hing
Cons
umer
elec
tronic
s
Textile
s, ind
ustri
al tex
tiles, c
lothin
g and
acces
sorie
s
Finan
cial s
ervic
es, b
ankin
g and
insu
rance
Metal
s, me
talwo
rking
Energ
y, rec
yclin
g, ot
her c
once
ssion
s
Glass,
ceram
ics, m
ineral
s, wo
od, p
aper
Trans
port,
stor
age
Mach
inery
and m
echa
nical
equip
ment
Cons
ulting
, eng
ineer
ing an
d bus
iness
serv
ices
Phar
mace
utica
ls an
d biot
echn
ologie
s
Softw
are an
d IT s
ervic
es
Educ
ation
and t
rainin
g
Proximity to markets and other company operations
Potential for research partnershipswith French academia
Quality of R&D personnel
Proximity to French innovation clusters
Access to finance
Amount of state aid for R&D
Cost of R&D operations
Investment opportunities through acquisitions of French firms
“Unattractive” sub-total
Growth in jobs (%)
Growth in projects (%)
Sectors experiencing job and project growth
Sectors experiencing project growth
“Attractive” sub-total
-50
1,014
Average number of projects(2007-2017): 729
624 641 639 782 698 693 685 740 734 814 968
2007 2008 2009 2010 2011 2012 2013 2014 2015 2016 2017
Average number of jobs (2007-2017): 30,092
34,517 28,965 32,15331,932 31,815 27,958 25,908 29,631 25,478 32,77029,889
90
80
70
60
50
40
30
20
10
0
16
14
12
10
8
6
4
2
0
Metal
s, me
talwo
rking
Glass,
ceram
ics,
mine
rals,
wood
, pap
er
Chem
icals,
plas
tics
Agri-
food
, agr
icultu
re, fis
hing
Electr
onic
comp
onen
ts
Electr
ical/e
lectro
nic/IT
equip
ment
Media
, pub
lishin
g
Energ
y, rec
yclin
g,ot
her c
once
ssion
sPh
arma
ceut
icals
and b
iotec
hnolo
gies
Perfu
mes,
cosm
etics
Furn
ishing
s, ho
useh
old go
ods
Texti
les, in
dustr
ial te
xtiles
,clo
thing
and a
ccesso
ries
Cons
ulting
, eng
ineer
ingan
d bus
iness
serv
ices
Cons
umer
elec
tronic
sTra
nspo
rt, st
orag
eSo
ftware
and I
T ser
vices
Medic
al/su
rgica
l equ
ipmen
t,dia
gnos
tics a
nd de
vices
Cons
tructi
on,
build
ing
mat
erial
s
Auto
motiv
e ind
ustry
Aero
spac
e, na
val a
ndrai
lway
equip
ment
Mach
inery
and
mech
anica
l equ
ipmen
t
% %
60
50
40
30
20
10
0
25
15
10
5
0
%
corporates
companies
33,682 33,489
5014
18
19
19
20
22
25
25
37
49 33
45 36
48 33
50 29
47 31
48 28
44
121
2
2 17
2 17
2 17
18
3 20
3 22
3 22 32
50 100 150 200
250
200
150
100
50
0
-50
-100
-150
86
82
81
81
80
78
75
75
3,500
3,000
2,500
2,000
1,500
1,000
500
0
180
160
140
120
100
80
60
40
20
0
United States
United Kingdom
Germany
Netherlands
Luxembourg
Canada
Belgium
Italy
Spain
Switzerland
Norway
Japan
Ireland
Denmark
Other
0 50 100 150 200 250 300 350 400 450
0 5,000 10,000 15,000 20,000 25,000
United States
United Kingdom
Germany
Netherlands
Belgium
Canada
Spain
Italy
Indonesia
China
Switzerland
Luxembourg
New Zealand
Other
0 5 000
2013 2014 2015 2016 2017
81%
19%
79%
21%
69%
31%
63%
37%
65%
35%
2013 2014 2015 2016 2017
66%
34%
56%
44%
53%
47%
50%
50%
55%
45%
2013 2014 2015 2016 2017
1,200
1,000
800
600
400
200
0
126
40
166
233
61
198
681
78
202
989
61
50
130
783
179
2013 2014 2015 2016 2017
70
60
50
40
30
20
10
0
5.5
5
9.3
7.1
8
23.2
12.7
5
47.8
20.5
3.8
15.7
23
17.7
36.4
392
342
31
19
19
18
15
11
11
11
8
7
7
5
40
24,236
16,640
13,076
3,180
2,845
2,262
1,780
814
582
412
382
367
133
257
Fig. 19 BREAKDOWN OF PROJECTS BY TECHNOLOGY INTENSITY (2017)
Source: Business France, Annual Report
They chose France
Jobs Projects
Key: In 2017, high value-added industry accounted for 28% of foreign investment projects and 38% of jobs generated.
EUROPEAN BANKING AUTHORITY TO MOVE ACROSS THE CHANNEL AFTER BREXIT
Following the United Kingdom’s decision to withdraw from the European Union, the European Banking Authority, currently based in London, was required to make plans to move to another EU country, creating 189 jobs.
A task force comprising Business France, Paris Region Economic Development Agency, Paris City Hall, Europlace and FBF, supervised by the French Treasury, was formed to put forward Paris’ case as the new host city. On November 20, 2017 the European Commission confirmed it had chosen the French capital.
Seventy percent of business leaders surveyed by Kantar Public for Business France believe that Brexit represents a real opportunity for France, with French banks (62%) and large companies (61%) expected to be among the greatest beneficiaries as things stand. In the wake of this decision, France has seen a sharp rise (+57%) in foreign investment in the financial services and insurance sectors.
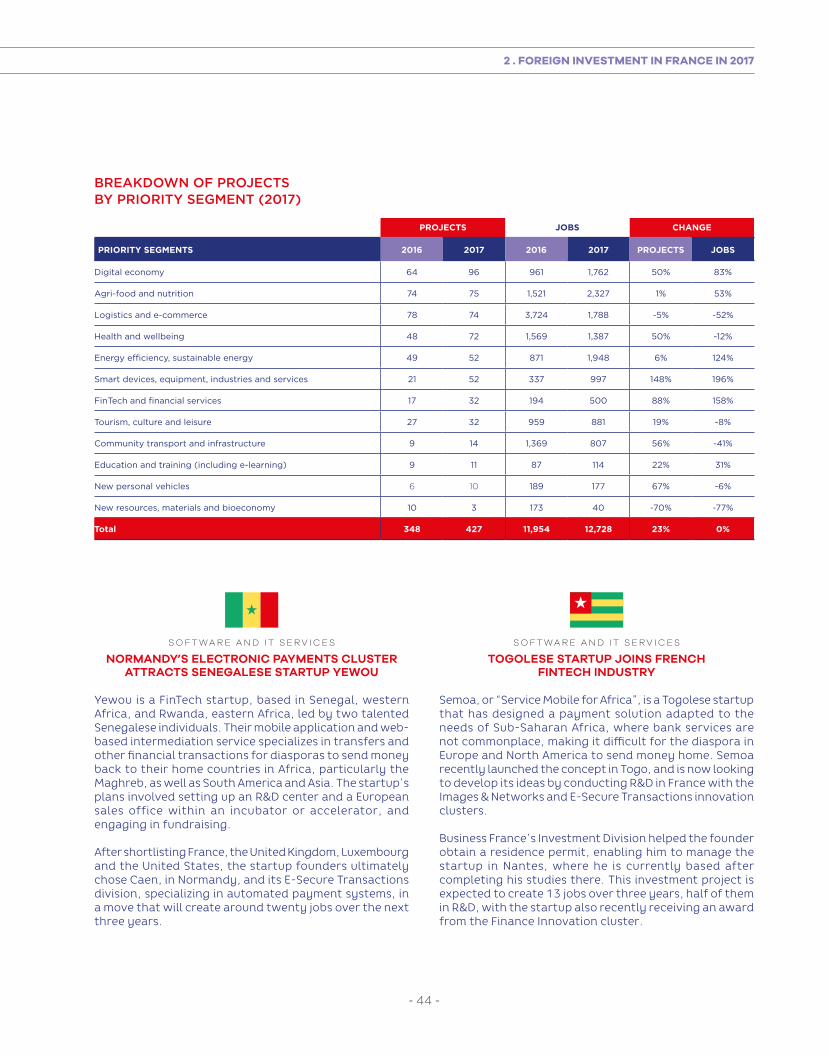
- 44 -
2 . FOREIGN INVESTMENT IN FRANCE IN 2017
BREAKDOWN OF PROJECTS BY PRIORITY SEGMENT (2017)
PROJECTS JOBS CHANGE
PRIORITY SEGMENTS 2016 2017 2016 2017 PROJECTS JOBS
Digital economy 64 96 961 1,762 50% 83%
Agri-food and nutrition 74 75 1,521 2,327 1% 53%
Logistics and e-commerce 78 74 3,724 1,788 -5% -52%
Health and wellbeing 48 72 1,569 1,387 50% -12%
Energy efficiency, sustainable energy 49 52 871 1,948 6% 124%
Smart devices, equipment, industries and services 21 52 337 997 148% 196%
FinTech and financial services 17 32 194 500 88% 158%
Tourism, culture and leisure 27 32 959 881 19% -8%
Community transport and infrastructure 9 14 1,369 807 56% -41%
Education and training (including e-learning) 9 11 87 114 22% 31%
New personal vehicles 6 10 189 177 67% -6%
New resources, materials and bioeconomy 10 3 173 40 -70% -77%
Total 348 427 11,954 12,728 23% 0%
S O F T WA R E A N D I T S E RV I C E S
TOGOLESE STARTUP JOINS FRENCH FINTECH INDUSTRY
Semoa, or “Service Mobile for Africa”, is a Togolese startup that has designed a payment solution adapted to the needs of Sub-Saharan Africa, where bank services are not commonplace, making it difficult for the diaspora in Europe and North America to send money home. Semoa recently launched the concept in Togo, and is now looking to develop its ideas by conducting R&D in France with the Images & Networks and E-Secure Transactions innovation clusters.
Business France’s Investment Division helped the founder obtain a residence permit, enabling him to manage the startup in Nantes, where he is currently based after completing his studies there. This investment project is expected to create 13 jobs over three years, half of them in R&D, with the startup also recently receiving an award from the Finance Innovation cluster.
S O F T WA R E A N D I T S E RV I C E S
NORMANDY’S ELECTRONIC PAYMENTS CLUSTER ATTRACTS SENEGALESE STARTUP YEWOU
Yewou is a FinTech startup, based in Senegal, western Africa, and Rwanda, eastern Africa, led by two talented Senegalese individuals. Their mobile application and web-based intermediation service specializes in transfers and other financial transactions for diasporas to send money back to their home countries in Africa, particularly the Maghreb, as well as South America and Asia. The startup’s plans involved setting up an R&D center and a European sales office within an incubator or accelerator, and engaging in fundraising.
After shortlisting France, the United Kingdom, Luxembourg and the United States, the startup founders ultimately chose Caen, in Normandy, and its E-Secure Transactions division, specializing in automated payment systems, in a move that will create around twenty jobs over the next three years.
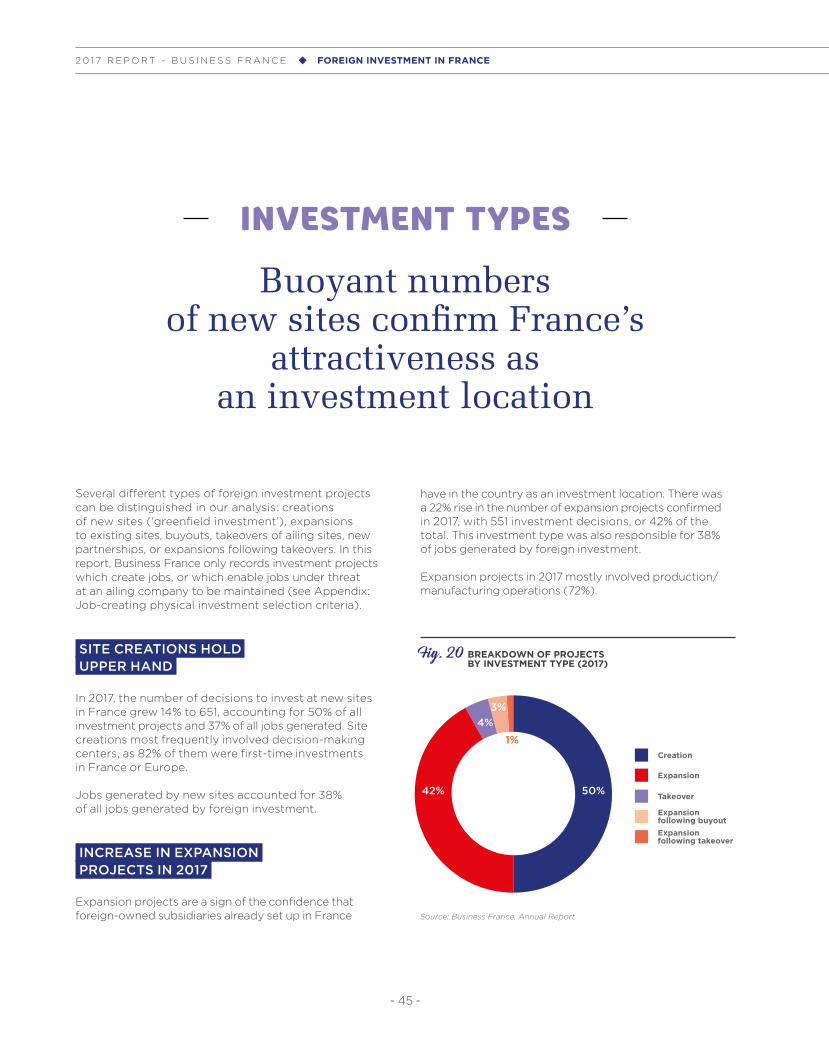
- 45 -
2 0 1 7 R E P O R T - B U S I N E S S F R A N C E FOREIGN INVESTMENT IN FRANCE
INVESTMENT TYPES
Buoyant numbers of new sites confirm France’s
attractiveness as an investment location
Several different types of foreign investment projects can be distinguished in our analysis: creations of new sites (‘greenfield investment’), expansions to existing sites, buyouts, takeovers of ailing sites, new partnerships, or expansions following takeovers. In this report, Business France only records investment projects which create jobs, or which enable jobs under threat at an ailing company to be maintained (see Appendix: Job-creating physical investment selection criteria).
SITE CREATIONS HOLD UPPER HAND
In 2017, the number of decisions to invest at new sites in France grew 14% to 651, accounting for 50% of all investment projects and 37% of all jobs generated. Site creations most frequently involved decision-making centers, as 82% of them were first-time investments in France or Europe.
Jobs generated by new sites accounted for 38% of all jobs generated by foreign investment.
INCREASE IN EXPANSION PROJECTS IN 2017
Expansion projects are a sign of the confidence that foreign-owned subsidiaries already set up in France
have in the country as an investment location. There was a 22% rise in the number of expansion projects confirmed in 2017, with 551 investment decisions, or 42% of the total. This investment type was also responsible for 38% of jobs generated by foreign investment.
Expansion projects in 2017 mostly involved production/manufacturing operations (72%).
Fig. 20 BREAKDOWN OF PROJECTS BY INVESTMENT TYPE (2017)
Source: Business France, Annual Report
Creation
Expansion
Expansionfollowing buyout
Takeover
Expansionfollowing takeover
42% 50%
3%
1%
4%

- 46 -
2 . FOREIGN INVESTMENT IN FRANCE IN 2017
BREAKDOWN OF PROJECTS BY INVESTMENT TYPE (2016-17)
PROJECTS JOBS PROJECTS JOBS
INVESTMENT TYPE 2016 2017 2016 2017 SHARE CHANGE SHARE CHANGE
Creation 569 651 11,520 12,639 50% 14% 38% 10%
Expansion 452 551 12,391 12,855 42% 22% 38% 4%
Expansion following buyout 37 33 669 844 3% -11% 3% 26%
Takeover 49 56 4,898 6,846 4% 14% 20% 40%
Expansion following takeover 10 7 360 305 1% -30% 1% -52%
Total 1,117 1,298 30,108 33,489 100% 16% 100% 11%
They chose France
A U T O M O T I V E I N D U S T R Y
CUMMINS EXPANDS ITS MANUFACTURING OPERATIONS IN BRITTANY
Indiana-based automotive parts supplier Cummins, Inc. designs, makes and distributes diesel and natural gas engines, as well as related products such as filters and turbochargers. It has annual revenues coming to nearly €20 billion and employs more than 50,000 people around the world.
In 2017, it moved a production line from Turkey to its Quimper site in Bretagne (Brittany) in a €7 million investment, creating a further 21 jobs.
C O N S U LT I N G, E N G I N E E R I N G A N D B U S I N E S S S E RV I C E S
THE BIOTECH QUALITY GROUP MAKES FIRST-TIME INVESTMENT IN PARIS REGION
Founded in 2011 in Brussels, Belgium, the Biotech Quality Group (BQG) is a consulting firm focusing on improving performance in the biopharmaceutical and medical device industries. By anticipating specific issues arising from changing regulations, the firm can provide permanent solutions to quality and production compliance issues. BQG is particularly renowned for its breakthrough methods, developed by its R&D center with the support of the Brussels Institute for Research and Innovation (Innoviris).
Considered a pioneer in its field, BQG develops innovative methods that harmonize performance and regulatory compliance, with the team supporting several companies throughout the entire life cycle of a particular drug or medical device.
After reaching the final of the EY Promising Company of the Year 2016 in Belgium, the firm announced in 2017 that it would be opening a subsidiary in France, consolidating its position across French-speaking Europe. The Paris-based French subsidiary, which currently has around fifteen employees, has also been receiving support from Business France.
TAKEOVERS OF AILING SITES
Takeovers of ailing sites by foreign investors enable economic activities under threat to be maintained. These investments contribute to the regeneration of struggling regions and to safeguarding jobs. In 2016, they saved more than 6,800 jobs, or 20% of all jobs generated by foreign investment decisions in France.
- 47 -
2 0 1 7 R E P O R T - B U S I N E S S F R A N C E FOREIGN INVESTMENT IN FRANCE
They chose France
P E R F U M E S , C O S M E T I C S
ECOWIPES ACQUIRES GRAND EST-BASED HYDRA COSMETICS
Polish toilet and home-care product manufacturer EcoWipes EWS acquired the Grand Est-based company Hydra Cosmetics, resulting in 47 jobs being maintained. It now plans to invest to upgrade the facility, with a view to increasing production capacity.
C H E M I C A L S , P L A S T I C S
INDORAMA VENTURES TO TRANSFORM PRODUCTION FACILITY IN GRAND EST
In 2017, Indorama Ventures, the largest producer of petrochemicals in Thailand, acquired Durafiber Technologies (Grand Est region), which specializes in durable technical textiles for industrial applications, tire reinforcement and specialty products. The acquisition of Durafiber Technologies will modernize the plant and underpin the group’s strategy to seek growth opportunities in high value-added products. All 224 jobs were maintained and an immediate €20 million investment to transform the plant to make it ‘Industry 4.0 ready’ was also announced.
M A C H I N E R Y A N D M E C H A N I C A L E Q U I P M E N T
JOBS UNDER THREAT SAVED BY ATLAS TAKEOVER IN HAUTS DE FRANCE
Based in Ganderkesee, in Germany’s Lower Saxony region, Atlas GmbH specializes in making construction machinery. In 2017, the company decided to acquire TIM, a manufacturer of cabins for heavy equipment (excavators, trucks, forklifts, etc.) based in Quaëdypre (Hauts de France region) threatened by insolvency proceedings. This decision led to 446 out of 480 jobs being maintained.
E L E C T R I C A L / E L E C T R O N I C / I T E Q U I P M E N T
NIDEC CORPORATION ACQUIRES AND INVESTS IN LEROY-SOMER
Having acquired French company Leroy-Somer (Ile de France / Paris region) in 2016, the Japanese Nidec Corporation, one of the world’s leading manufacturers of electric motors, entered into a partnership in December 2017 with Groupe PSA, forming a joint venture involving R&D and the production/marketing of electric vehicle motors.
The agreement covers an investment of €220 million split equally between the two groups. The first step will be to develop these new components, while the new R&D center will open in 2019 in the PSA Powertrain Center of Excellence in Carrières-sous-Poissy (also Paris region), employing 50 people.
A U T O M O T I V E I N D U S T R Y
FLEX-N-GATE ANNOUNCES TAKEOVER OF AUTOMOTIVE
EXTERIORS EUROPE
In January 2017, American firm Flex-N-Gate, the 10th largest automotive parts supplier in the United States, acquired Automotive Exteriors Europe (AEE), whose 800 employees specialize in making bumpers, tailgates and front/rear vehicle components, especially for PSA Peugeot-Citroën.
The new management plans to diversify the business and its customer portfolio, despite having profited from the success of Peugeot’s 3008 SUV.
In March 2017, AEE announced it was hiring 70 new personnel to meet its workload, with a further 120 new roles to be filled between July 2017 and June 2018 at its manufacturing sites in the Grand Est region, Bourgogne-Franche-Comté, Ile de France (Paris region) and Hauts de France. At the end of 2017, AEE had more than 1,000 permanent and temporary employees, including 350 in R&D.
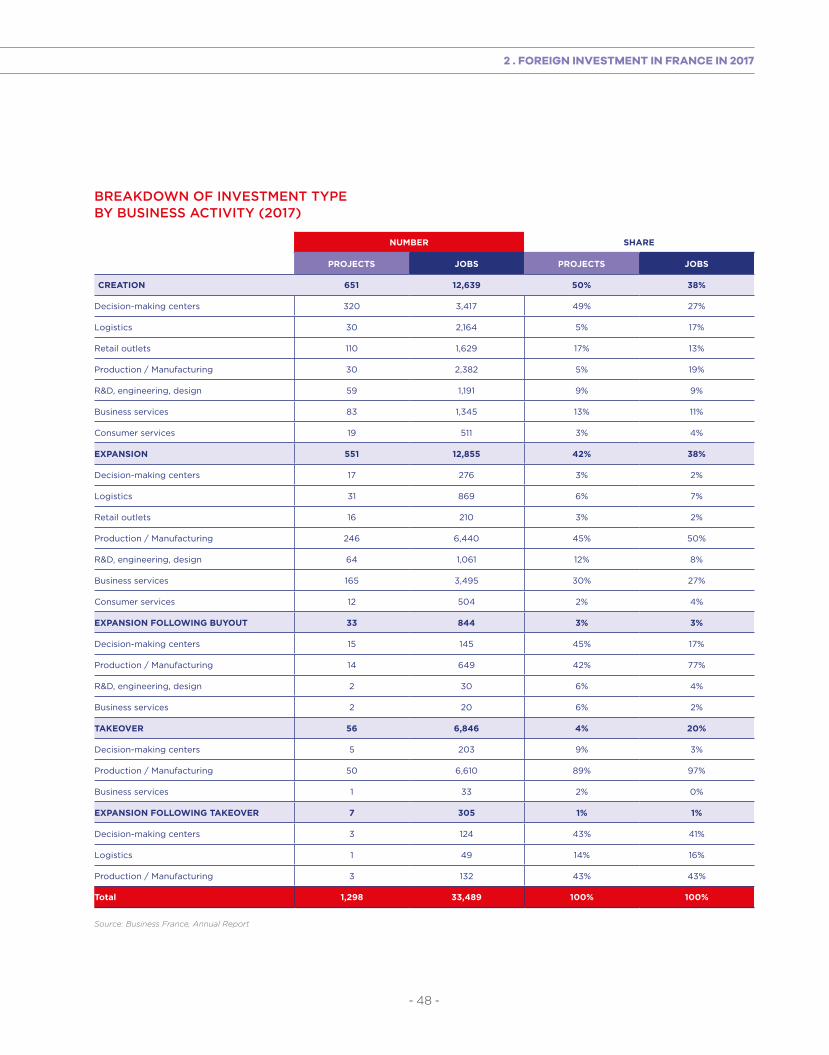
- 48 -
2 . FOREIGN INVESTMENT IN FRANCE IN 2017
NUMBER SHARE
PROJECTS JOBS PROJECTS JOBS
CREATION 651 12,639 50% 38%
Decision-making centers 320 3,417 49% 27%
Logistics 30 2,164 5% 17%
Retail outlets 110 1,629 17% 13%
Production / Manufacturing 30 2,382 5% 19%
R&D, engineering, design 59 1,191 9% 9%
Business services 83 1,345 13% 11%
Consumer services 19 511 3% 4%
EXPANSION 551 12,855 42% 38%
Decision-making centers 17 276 3% 2%
Logistics 31 869 6% 7%
Retail outlets 16 210 3% 2%
Production / Manufacturing 246 6,440 45% 50%
R&D, engineering, design 64 1,061 12% 8%
Business services 165 3,495 30% 27%
Consumer services 12 504 2% 4%
EXPANSION FOLLOWING BUYOUT 33 844 3% 3%
Decision-making centers 15 145 45% 17%
Production / Manufacturing 14 649 42% 77%
R&D, engineering, design 2 30 6% 4%
Business services 2 20 6% 2%
TAKEOVER 56 6,846 4% 20%
Decision-making centers 5 203 9% 3%
Production / Manufacturing 50 6,610 89% 97%
Business services 1 33 2% 0%
EXPANSION FOLLOWING TAKEOVER 7 305 1% 1%
Decision-making centers 3 124 43% 41%
Logistics 1 49 14% 16%
Production / Manufacturing 3 132 43% 43%
Total 1,298 33,489 100% 100%
Source: Business France, Annual Report
BREAKDOWN OF INVESTMENT TYPE BY BUSINESS ACTIVITY (2017)
- 49 -
2 0 1 7 R E P O R T - B U S I N E S S F R A N C E FOREIGN INVESTMENT IN FRANCE
FINANCIAL INVESTMENTS
Facility upgrades and safeguarding investments, technology
and commercial partnerships
Our data collection procedure identifies a variety of different ways in which foreign-owned subsidiaries establish themselves in France, reflecting the diverse international development strategies of multinational firms. The most common financial investments recorded in 2017 were mergers and acquisitions, facility upgrades and safeguarding investments, along with technology, commercial and industrial partnerships.
FACILITY UPGRADES AND SAFEGUARDING INVESTMENTS
Facility upgrades and safeguarding investments involve replacing obsolete equipment with new production technology to increase output capacity or improve the company’s productivity. These investments also preserve the business sites of foreign subsidiaries and save jobs that might otherwise ultimately have been lost. In 2017, a total of 90 facility upgrades or safeguarding investments were recorded by Business France and its regional partners.
Facility upgrades or safeguarding investments recorded in France were mainly carried out by American (22%)
They chose France
and German (19%) firms, while more than three-quarters of these investments involved production/manufacturing operations.
E N E R GY, R E CYC L I N G
FIBRE EXCELLENCE, THE FRENCH SUBSIDIARY OF INDONESIAN SINAR MAS GROUP, CONFIRMS
MAJOR SAFEGUARDING INVESTMENT
This subsidiary of a leading Indonesian conglomerate – and a major investor in France since it acquired two pulp mills along with an energy subsidiary and wood supplier in 2010 – confirmed substantial investment of €10-12 million in 2017 to build a 25MW biomass cogeneration unit along with a pilot biorefining facility at its Saint Gaudens site in the Occitanie region (south-western France), safeguarding the futures of 300 employees.
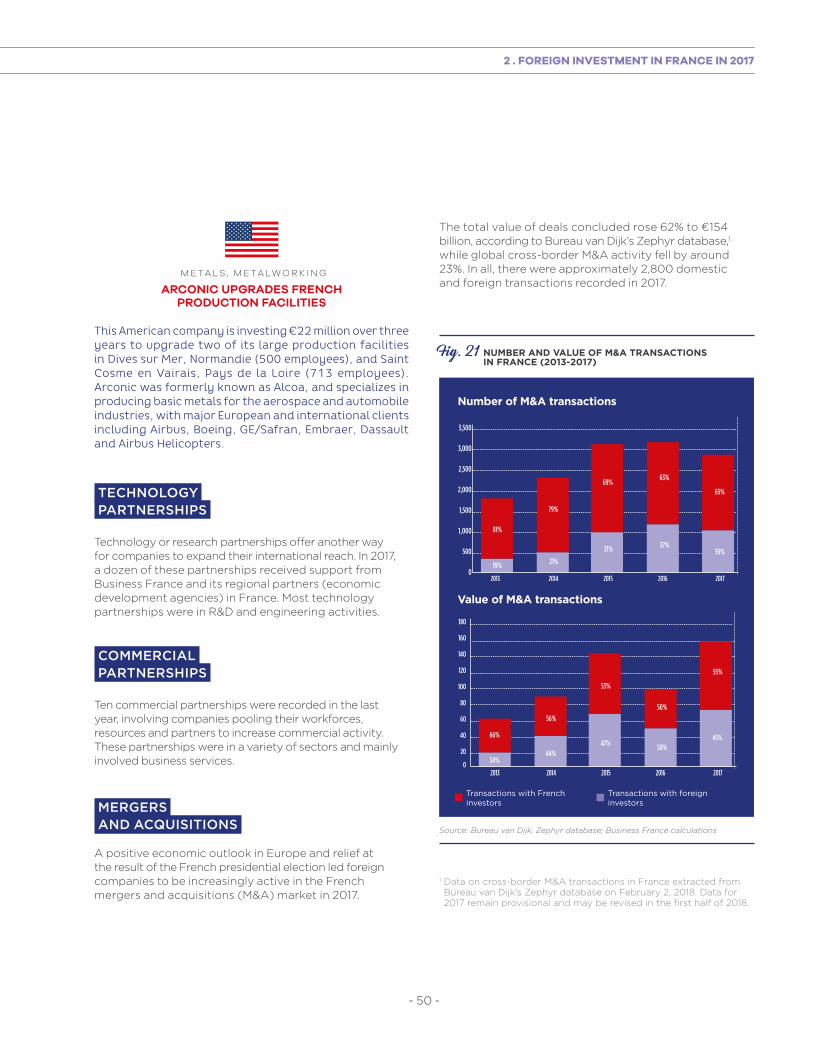
- 50 -
2 . FOREIGN INVESTMENT IN FRANCE IN 2017
TECHNOLOGY PARTNERSHIPS
Technology or research partnerships offer another way for companies to expand their international reach. In 2017, a dozen of these partnerships received support from Business France and its regional partners (economic development agencies) in France. Most technology partnerships were in R&D and engineering activities.
COMMERCIAL PARTNERSHIPS
Ten commercial partnerships were recorded in the last year, involving companies pooling their workforces, resources and partners to increase commercial activity. These partnerships were in a variety of sectors and mainly involved business services.
MERGERSAND ACQUISITIONS
A positive economic outlook in Europe and relief at the result of the French presidential election led foreign companies to be increasingly active in the French mergers and acquisitions (M&A) market in 2017.
1 Data on cross-border M&A transactions in France extracted from Bureau van Dijk’s Zephyr database on February 2, 2018. Data for 2017 remain provisional and may be revised in the first half of 2018.
Number of M&A transactions
Value of M&A transactions
35,000
30,000
25,000
20,000
15,000
10,000
5,000
0
0 10 20 30 40 50 60
%
% %
Unknown
Large
SMEs
Mid-size
Machinery
Cosmetics/perfumes
Automotive
Metals Chemicals/plastics
Financial services
Furnishings
Consumer electronics
Medical eqpt.
Electrical/IT eqpt.
Wholesale/retail
TextilesMedia/publishing
HospitalityPharmaceuticals
Agri-food
Energy/recycling
Consulting
Glass/ceramics
Software/IT services
Aerospace/naval/rail
Telecoms/ISPs
Transport/storage
Electronic componentsOther services
Construction
0 5 10 15 20 25 30 35 40%
High value-added industry
High value-added services
Low value-added industry
Low value-added services
2007 2008 2009 2010 2011 2012 2013 2014 2015 2016 2017
1,400
1,200
1,000
800
600
400
200
0
Wider criteria
Wider criteria
1,117
1,298
962
26,535
30,108
25 %
20 %
15 %
10 %
5 %
0 %
Telec
oms,
inter
net s
ervic
e pro
vider
sEle
ctron
ic co
mpon
ents
Aero
spac
e, na
val a
nd ra
ilway
equip
ment
Electr
ical/e
lectro
nic/IT
equip
ment
Medic
al/su
rgica
l equ
ipmen
t, diag
nosti
cs an
d dev
ices
Auto
motiv
e ind
ustry
Chem
icals,
plas
tics
Cons
tructi
on, b
uildin
g mate
rials
Perfu
mes,
cosm
etics
Agri-
food
, agr
icultu
re, fis
hing
Cons
umer
elec
tronic
s
Textile
s, ind
ustri
al tex
tiles, c
lothin
g and
acces
sorie
s
Finan
cial s
ervic
es, b
ankin
g and
insu
rance
Metal
s, me
talwo
rking
Energ
y, rec
yclin
g, ot
her c
once
ssion
s
Glass,
ceram
ics, m
ineral
s, wo
od, p
aper
Trans
port,
stor
age
Mach
inery
and m
echa
nical
equip
ment
Cons
ulting
, eng
ineer
ing an
d bus
iness
serv
ices
Phar
mace
utica
ls an
d biot
echn
ologie
s
Softw
are an
d IT s
ervic
es
Educ
ation
and t
rainin
g
Proximity to markets and other company operations
Potential for research partnershipswith French academia
Quality of R&D personnel
Proximity to French innovation clusters
Access to finance
Amount of state aid for R&D
Cost of R&D operations
Investment opportunities through acquisitions of French firms
“Unattractive” sub-total
Growth in jobs (%)
Growth in projects (%)
Sectors experiencing job and project growth
Sectors experiencing project growth
“Attractive” sub-total
-50
1,014
Average number of projects(2007-2017): 729
624 641 639 782 698 693 685 740 734 814 968
2007 2008 2009 2010 2011 2012 2013 2014 2015 2016 2017
Average number of jobs (2007-2017): 30,092
34,517 28,965 32,15331,932 31,815 27,958 25,908 29,631 25,478 32,77029,889
90
80
70
60
50
40
30
20
10
0
16
14
12
10
8
6
4
2
0
Metal
s, me
talwo
rking
Glass,
ceram
ics,
mine
rals,
wood
, pap
er
Chem
icals,
plas
tics
Agri-
food
, agr
icultu
re, fis
hing
Electr
onic
comp
onen
ts
Electr
ical/e
lectro
nic/IT
equip
ment
Media
, pub
lishin
g
Energ
y, rec
yclin
g,ot
her c
once
ssion
sPh
arma
ceut
icals
and b
iotec
hnolo
gies
Perfu
mes,
cosm
etics
Furn
ishing
s, ho
useh
old go
ods
Texti
les, in
dustr
ial te
xtiles
,clo
thing
and a
ccesso
ries
Cons
ulting
, eng
ineer
ingan
d bus
iness
serv
ices
Cons
umer
elec
tronic
sTra
nspo
rt, st
orag
eSo
ftware
and I
T ser
vices
Medic
al/su
rgica
l equ
ipmen
t,dia
gnos
tics a
nd de
vices
Cons
tructi
on,
build
ing
mat
erial
s
Auto
motiv
e ind
ustry
Aero
spac
e, na
val a
ndrai
lway
equip
ment
Mach
inery
and
mech
anica
l equ
ipmen
t
% %
60
50
40
30
20
10
0
25
15
10
5
0
%
corporates
companies
33,682 33,489
5014
18
19
19
20
22
25
25
37
49 33
45 36
48 33
50 29
47 31
48 28
44
121
2
2 17
2 17
2 17
18
3 20
3 22
3 22 32
50 100 150 200
250
200
150
100
50
0
-50
-100
-150
86
82
81
81
80
78
75
75
3,500
3,000
2,500
2,000
1,500
1,000
500
0
180
160
140
120
100
80
60
40
20
0
United States
United Kingdom
Germany
Netherlands
Luxembourg
Canada
Belgium
Italy
Spain
Switzerland
Norway
Japan
Ireland
Denmark
Other
0 50 100 150 200 250 300 350 400 450
0 5,000 10,000 15,000 20,000 25,000
United States
United Kingdom
Germany
Netherlands
Belgium
Canada
Spain
Italy
Indonesia
China
Switzerland
Luxembourg
New Zealand
Other
0 5 000
2013 2014 2015 2016 2017
81%
19%
79%
21%
69%
31%
63%
37%
65%
35%
2013 2014 2015 2016 2017
66%
34%
56%
44%
53%
47%
50%
50%
55%
45%
2013 2014 2015 2016 2017
1,200
1,000
800
600
400
200
0
126
40
166
233
61
198
681
78
202
989
61
50
130
783
179
2013 2014 2015 2016 2017
70
60
50
40
30
20
10
0
5.5
5
9.3
7.1
8
23.2
12.7
5
47.8
20.5
3.8
15.7
23
17.7
36.4
392
342
31
19
19
18
15
11
11
11
8
7
7
5
40
24,236
16,640
13,076
3,180
2,845
2,262
1,780
814
582
412
382
367
133
257
Fig. 21 NUMBER AND VALUE OF M&A TRANSACTIONS IN FRANCE (2013-2017)
Transactions with French investors
Transactions with foreign investors
Source: Bureau van Dijk, Zephyr database; Business France calculations
The total value of deals concluded rose 62% to €154 billion, according to Bureau van Dijk’s Zephyr database,1 while global cross-border M&A activity fell by around 23%. In all, there were approximately 2,800 domestic and foreign transactions recorded in 2017.
M E TA L S , M E TA LW O R K I N G
ARCONIC UPGRADES FRENCH PRODUCTION FACILITIES
This American company is investing €22 million over three years to upgrade two of its large production facilities in Dives sur Mer, Normandie (500 employees), and Saint Cosme en Vairais, Pays de la Loire (713 employees). Arconic was formerly known as Alcoa, and specializes in producing basic metals for the aerospace and automobile industries, with major European and international clients including Airbus, Boeing, GE/Safran, Embraer, Dassault and Airbus Helicopters.
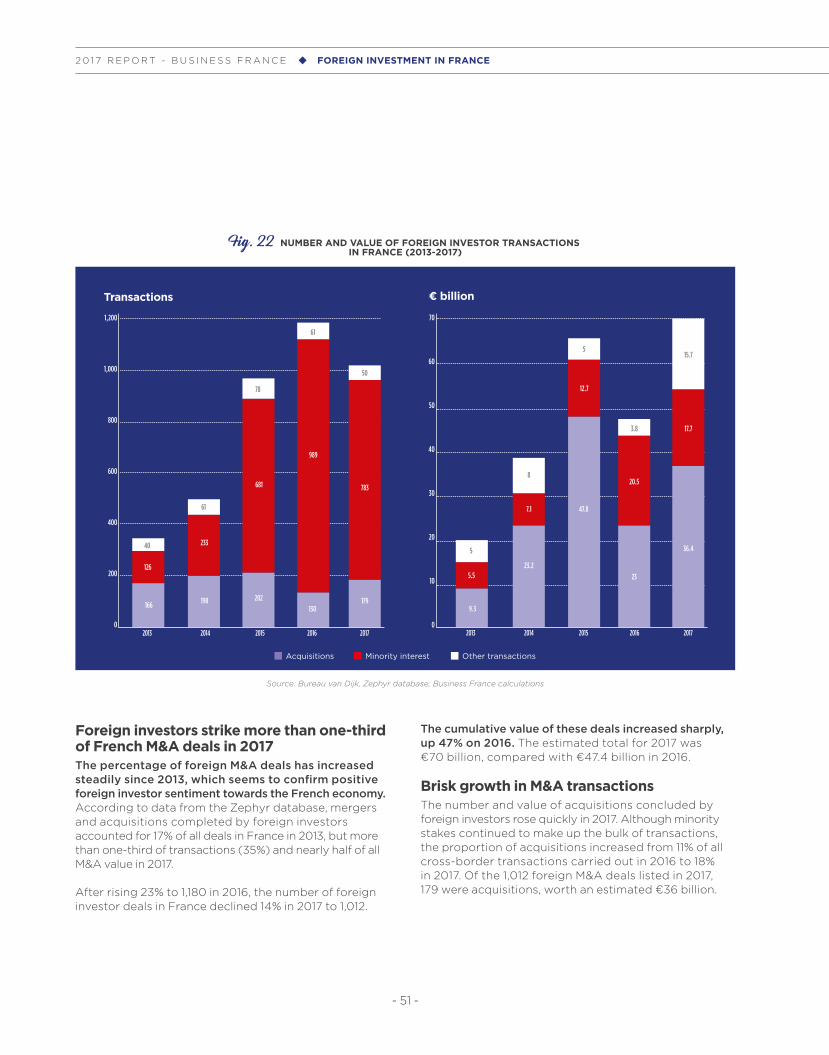
- 51 -
2 0 1 7 R E P O R T - B U S I N E S S F R A N C E FOREIGN INVESTMENT IN FRANCE
Foreign investors strike more than one-third of French M&A deals in 2017The percentage of foreign M&A deals has increased steadily since 2013, which seems to confirm positive foreign investor sentiment towards the French economy. According to data from the Zephyr database, mergers and acquisitions completed by foreign investors accounted for 17% of all deals in France in 2013, but more than one-third of transactions (35%) and nearly half of all M&A value in 2017.
After rising 23% to 1,180 in 2016, the number of foreign investor deals in France declined 14% in 2017 to 1,012.
Transactions € billion
35,000
30,000
25,000
20,000
15,000
10,000
5,000
0
0 10 20 30 40 50 60
%
% %
Unknown
Large
SMEs
Mid-size
Machinery
Cosmetics/perfumes
Automotive
Metals Chemicals/plastics
Financial services
Furnishings
Consumer electronics
Medical eqpt.
Electrical/IT eqpt.
Wholesale/retail
TextilesMedia/publishing
HospitalityPharmaceuticals
Agri-food
Energy/recycling
Consulting
Glass/ceramics
Software/IT services
Aerospace/naval/rail
Telecoms/ISPs
Transport/storage
Electronic componentsOther services
Construction
0 5 10 15 20 25 30 35 40%
High value-added industry
High value-added services
Low value-added industry
Low value-added services
2007 2008 2009 2010 2011 2012 2013 2014 2015 2016 2017
1,400
1,200
1,000
800
600
400
200
0
Wider criteria
Wider criteria
1,117
1,298
962
26,535
30,108
25 %
20 %
15 %
10 %
5 %
0 %
Telec
oms,
inter
net s
ervic
e pro
vider
sEle
ctron
ic co
mpon
ents
Aero
spac
e, na
val a
nd ra
ilway
equip
ment
Electr
ical/e
lectro
nic/IT
equip
ment
Medic
al/su
rgica
l equ
ipmen
t, diag
nosti
cs an
d dev
ices
Auto
motiv
e ind
ustry
Chem
icals,
plas
tics
Cons
tructi
on, b
uildin
g mate
rials
Perfu
mes,
cosm
etics
Agri-
food
, agr
icultu
re, fis
hing
Cons
umer
elec
tronic
s
Textile
s, ind
ustri
al tex
tiles, c
lothin
g and
acces
sorie
s
Finan
cial s
ervic
es, b
ankin
g and
insu
rance
Metal
s, me
talwo
rking
Energ
y, rec
yclin
g, ot
her c
once
ssion
s
Glass,
ceram
ics, m
ineral
s, wo
od, p
aper
Trans
port,
stor
age
Mach
inery
and m
echa
nical
equip
ment
Cons
ulting
, eng
ineer
ing an
d bus
iness
serv
ices
Phar
mace
utica
ls an
d biot
echn
ologie
s
Softw
are an
d IT s
ervic
es
Educ
ation
and t
rainin
g
Proximity to markets and other company operations
Potential for research partnershipswith French academia
Quality of R&D personnel
Proximity to French innovation clusters
Access to finance
Amount of state aid for R&D
Cost of R&D operations
Investment opportunities through acquisitions of French firms
“Unattractive” sub-total
Growth in jobs (%)
Growth in projects (%)
Sectors experiencing job and project growth
Sectors experiencing project growth
“Attractive” sub-total
-50
1,014
Average number of projects(2007-2017): 729
624 641 639 782 698 693 685 740 734 814 968
2007 2008 2009 2010 2011 2012 2013 2014 2015 2016 2017
Average number of jobs (2007-2017): 30,092
34,517 28,965 32,15331,932 31,815 27,958 25,908 29,631 25,478 32,77029,889
90
80
70
60
50
40
30
20
10
0
16
14
12
10
8
6
4
2
0
Metal
s, me
talwo
rking
Glass,
ceram
ics,
mine
rals,
wood
, pap
er
Chem
icals,
plas
tics
Agri-
food
, agr
icultu
re, fis
hing
Electr
onic
comp
onen
ts
Electr
ical/e
lectro
nic/IT
equip
ment
Media
, pub
lishin
g
Energ
y, rec
yclin
g,ot
her c
once
ssion
sPh
arma
ceut
icals
and b
iotec
hnolo
gies
Perfu
mes,
cosm
etics
Furn
ishing
s, ho
useh
old go
ods
Texti
les, in
dustr
ial te
xtiles
,clo
thing
and a
ccesso
ries
Cons
ulting
, eng
ineer
ingan
d bus
iness
serv
ices
Cons
umer
elec
tronic
sTra
nspo
rt, st
orag
eSo
ftware
and I
T ser
vices
Medic
al/su
rgica
l equ
ipmen
t,dia
gnos
tics a
nd de
vices
Cons
tructi
on,
build
ing
mat
erial
s
Auto
motiv
e ind
ustry
Aero
spac
e, na
val a
ndrai
lway
equip
ment
Mach
inery
and
mech
anica
l equ
ipmen
t
% %
60
50
40
30
20
10
0
25
15
10
5
0
%
corporates
companies
33,682 33,489
5014
18
19
19
20
22
25
25
37
49 33
45 36
48 33
50 29
47 31
48 28
44
121
2
2 17
2 17
2 17
18
3 20
3 22
3 22 32
50 100 150 200
250
200
150
100
50
0
-50
-100
-150
86
82
81
81
80
78
75
75
3,500
3,000
2,500
2,000
1,500
1,000
500
0
180
160
140
120
100
80
60
40
20
0
United States
United Kingdom
Germany
Netherlands
Luxembourg
Canada
Belgium
Italy
Spain
Switzerland
Norway
Japan
Ireland
Denmark
Other
0 50 100 150 200 250 300 350 400 450
0 5,000 10,000 15,000 20,000 25,000
United States
United Kingdom
Germany
Netherlands
Belgium
Canada
Spain
Italy
Indonesia
China
Switzerland
Luxembourg
New Zealand
Other
0 5 000
2013 2014 2015 2016 2017
81%
19%
79%
21%
69%
31%
63%
37%
65%
35%
2013 2014 2015 2016 2017
66%
34%
56%
44%
53%
47%
50%
50%
55%
45%
2013 2014 2015 2016 2017
1,200
1,000
800
600
400
200
0
126
40
166
233
61
198
681
78
202
989
61
50
130
783
179
2013 2014 2015 2016 2017
70
60
50
40
30
20
10
0
5.5
5
9.3
7.1
8
23.2
12.7
5
47.8
20.5
3.8
15.7
23
17.7
36.4
392
342
31
19
19
18
15
11
11
11
8
7
7
5
40
24,236
16,640
13,076
3,180
2,845
2,262
1,780
814
582
412
382
367
133
257
Fig. 22 NUMBER AND VALUE OF FOREIGN INVESTOR TRANSACTIONS IN FRANCE (2013-2017)
Source: Bureau van Dijk, Zephyr database; Business France calculations
Acquisitions Minority interest Other transactions
The cumulative value of these deals increased sharply, up 47% on 2016. The estimated total for 2017 was €70 billion, compared with €47.4 billion in 2016. Brisk growth in M&A transactionsThe number and value of acquisitions concluded by foreign investors rose quickly in 2017. Although minority stakes continued to make up the bulk of transactions, the proportion of acquisitions increased from 11% of all cross-border transactions carried out in 2016 to 18% in 2017. Of the 1,012 foreign M&A deals listed in 2017, 179 were acquisitions, worth an estimated €36 billion.
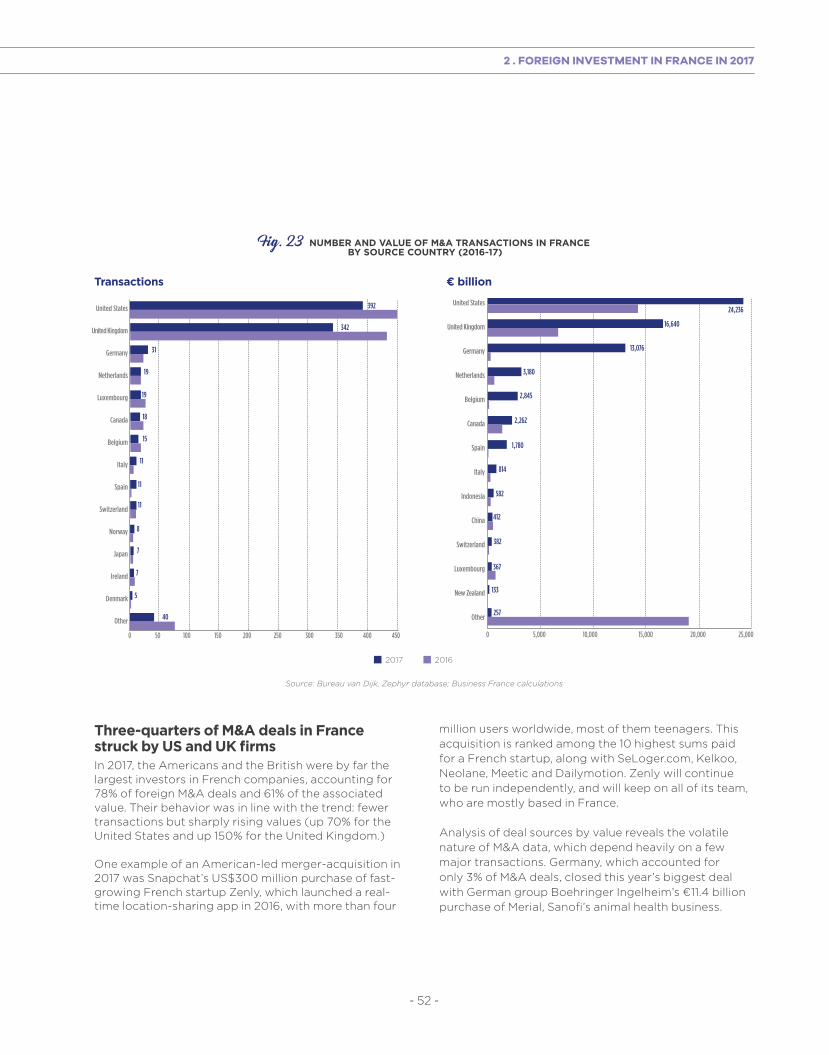
- 52 -
2 . FOREIGN INVESTMENT IN FRANCE IN 2017
Three-quarters of M&A deals in France struck by US and UK firms In 2017, the Americans and the British were by far the largest investors in French companies, accounting for 78% of foreign M&A deals and 61% of the associated value. Their behavior was in line with the trend: fewer transactions but sharply rising values (up 70% for the United States and up 150% for the United Kingdom.)
One example of an American-led merger-acquisition in 2017 was Snapchat’s US$300 million purchase of fast-growing French startup Zenly, which launched a real-time location-sharing app in 2016, with more than four
million users worldwide, most of them teenagers. This acquisition is ranked among the 10 highest sums paid for a French startup, along with SeLoger.com, Kelkoo, Neolane, Meetic and Dailymotion. Zenly will continue to be run independently, and will keep on all of its team, who are mostly based in France.
Analysis of deal sources by value reveals the volatile nature of M&A data, which depend heavily on a few major transactions. Germany, which accounted for only 3% of M&A deals, closed this year’s biggest deal with German group Boehringer Ingelheim’s €11.4 billion purchase of Merial, Sanofi’s animal health business.
35,000
30,000
25,000
20,000
15,000
10,000
5,000
0
0 10 20 30 40 50 60
%
% %
Unknown
Large
SMEs
Mid-size
Machinery
Cosmetics/perfumes
Automotive
Metals Chemicals/plastics
Financial services
Furnishings
Consumer electronics
Medical eqpt.
Electrical/IT eqpt.
Wholesale/retail
TextilesMedia/publishing
HospitalityPharmaceuticals
Agri-food
Energy/recycling
Consulting
Glass/ceramics
Software/IT services
Aerospace/naval/rail
Telecoms/ISPs
Transport/storage
Electronic componentsOther services
Construction
0 5 10 15 20 25 30 35 40%
High value-added industry
High value-added services
Low value-added industry
Low value-added services
2007 2008 2009 2010 2011 2012 2013 2014 2015 2016 2017
1,400
1,200
1,000
800
600
400
200
0
Wider criteria
Wider criteria
1,117
1,298
962
26,535
30,108
25 %
20 %
15 %
10 %
5 %
0 %
Telec
oms,
inter
net s
ervic
e pro
vider
sEle
ctron
ic co
mpon
ents
Aero
spac
e, na
val a
nd ra
ilway
equip
ment
Electr
ical/e
lectro
nic/IT
equip
ment
Medic
al/su
rgica
l equ
ipmen
t, diag
nosti
cs an
d dev
ices
Auto
motiv
e ind
ustry
Chem
icals,
plas
tics
Cons
tructi
on, b
uildin
g mate
rials
Perfu
mes,
cosm
etics
Agri-
food
, agr
icultu
re, fis
hing
Cons
umer
elec
tronic
s
Textile
s, ind
ustri
al tex
tiles, c
lothin
g and
acces
sorie
s
Finan
cial s
ervic
es, b
ankin
g and
insu
rance
Metal
s, me
talwo
rking
Energ
y, rec
yclin
g, ot
her c
once
ssion
s
Glass,
ceram
ics, m
ineral
s, wo
od, p
aper
Trans
port,
stor
age
Mach
inery
and m
echa
nical
equip
ment
Cons
ulting
, eng
ineer
ing an
d bus
iness
serv
ices
Phar
mace
utica
ls an
d biot
echn
ologie
s
Softw
are an
d IT s
ervic
es
Educ
ation
and t
rainin
g
Proximity to markets and other company operations
Potential for research partnershipswith French academia
Quality of R&D personnel
Proximity to French innovation clusters
Access to finance
Amount of state aid for R&D
Cost of R&D operations
Investment opportunities through acquisitions of French firms
“Unattractive” sub-total
Growth in jobs (%)
Growth in projects (%)
Sectors experiencing job and project growth
Sectors experiencing project growth
“Attractive” sub-total
-50
1,014
Average number of projects(2007-2017): 729
624 641 639 782 698 693 685 740 734 814 968
2007 2008 2009 2010 2011 2012 2013 2014 2015 2016 2017
Average number of jobs (2007-2017): 30,092
34,517 28,965 32,15331,932 31,815 27,958 25,908 29,631 25,478 32,77029,889
90
80
70
60
50
40
30
20
10
0
16
14
12
10
8
6
4
2
0
Metal
s, me
talwo
rking
Glass,
ceram
ics,
mine
rals,
wood
, pap
er
Chem
icals,
plas
tics
Agri-
food
, agr
icultu
re, fis
hing
Electr
onic
comp
onen
ts
Electr
ical/e
lectro
nic/IT
equip
ment
Media
, pub
lishin
g
Energ
y, rec
yclin
g,ot
her c
once
ssion
sPh
arma
ceut
icals
and b
iotec
hnolo
gies
Perfu
mes,
cosm
etics
Furn
ishing
s, ho
useh
old go
ods
Texti
les, in
dustr
ial te
xtiles
,clo
thing
and a
ccesso
ries
Cons
ulting
, eng
ineer
ingan
d bus
iness
serv
ices
Cons
umer
elec
tronic
sTra
nspo
rt, st
orag
eSo
ftware
and I
T ser
vices
Medic
al/su
rgica
l equ
ipmen
t,dia
gnos
tics a
nd de
vices
Cons
tructi
on,
build
ing
mat
erial
s
Auto
motiv
e ind
ustry
Aero
spac
e, na
val a
ndrai
lway
equip
ment
Mach
inery
and
mech
anica
l equ
ipmen
t
% %
60
50
40
30
20
10
0
25
15
10
5
0
%
corporates
companies
33,682 33,489
5014
18
19
19
20
22
25
25
37
49 33
45 36
48 33
50 29
47 31
48 28
44
121
2
2 17
2 17
2 17
18
3 20
3 22
3 22 32
50 100 150 200
250
200
150
100
50
0
-50
-100
-150
86
82
81
81
80
78
75
75
3,500
3,000
2,500
2,000
1,500
1,000
500
0
180
160
140
120
100
80
60
40
20
0
United States
United Kingdom
Germany
Netherlands
Luxembourg
Canada
Belgium
Italy
Spain
Switzerland
Norway
Japan
Ireland
Denmark
Other
0 50 100 150 200 250 300 350 400 450
0 5,000 10,000 15,000 20,000 25,000
United States
United Kingdom
Germany
Netherlands
Belgium
Canada
Spain
Italy
Indonesia
China
Switzerland
Luxembourg
New Zealand
Other
0 5 000
2013 2014 2015 2016 2017
81%
19%
79%
21%
69%
31%
63%
37%
65%
35%
2013 2014 2015 2016 2017
66%
34%
56%
44%
53%
47%
50%
50%
55%
45%
2013 2014 2015 2016 2017
1,200
1,000
800
600
400
200
0
126
40
166
233
61
198
681
78
202
989
61
50
130
783
179
2013 2014 2015 2016 2017
70
60
50
40
30
20
10
0
5.5
5
9.3
7.1
8
23.2
12.7
5
47.8
20.5
3.8
15.7
23
17.7
36.4
392
342
31
19
19
18
15
11
11
11
8
7
7
5
40
24,236
16,640
13,076
3,180
2,845
2,262
1,780
814
582
412
382
367
133
257
Transactions € billion
Fig. 23 NUMBER AND VALUE OF M&A TRANSACTIONS IN FRANCE BY SOURCE COUNTRY (2016-17)
Source: Bureau van Dijk, Zephyr database; Business France calculations
2017 2016
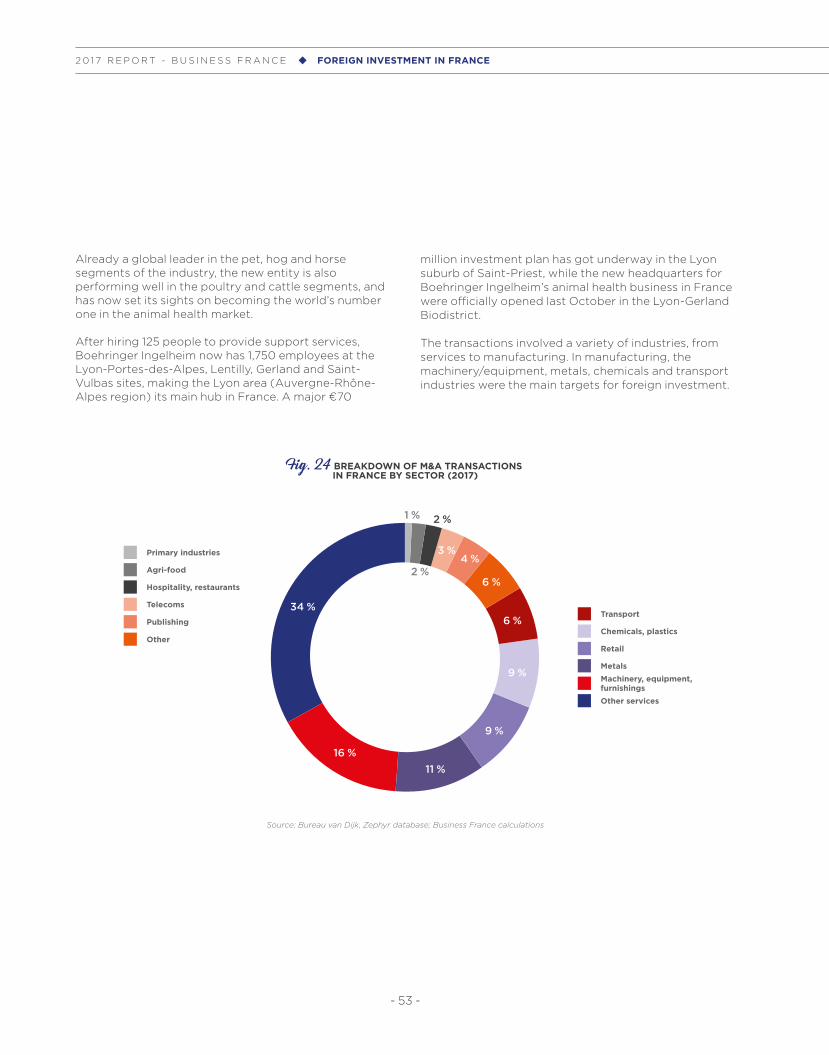
- 53 -
2 0 1 7 R E P O R T - B U S I N E S S F R A N C E FOREIGN INVESTMENT IN FRANCE
Fig. 24 BREAKDOWN OF M&A TRANSACTIONS IN FRANCE BY SECTOR (2017)
Source: Bureau van Dijk, Zephyr database; Business France calculations
34 %
16 %
11 %
9 %
9 %
6 %
6 %
4 %3 %
2 %
2 %
1 %
Transport
Chemicals, plastics
Retail
Metals
Machinery, equipment, furnishings
Other services
Primary industries
Agri-food
Hospitality, restaurants
Telecoms
Publishing
Other
Already a global leader in the pet, hog and horse segments of the industry, the new entity is also performing well in the poultry and cattle segments, and has now set its sights on becoming the world’s number one in the animal health market.
After hiring 125 people to provide support services, Boehringer Ingelheim now has 1,750 employees at the Lyon-Portes-des-Alpes, Lentilly, Gerland and Saint-Vulbas sites, making the Lyon area (Auvergne-Rhône-Alpes region) its main hub in France. A major €70
million investment plan has got underway in the Lyon suburb of Saint-Priest, while the new headquarters for Boehringer Ingelheim’s animal health business in France were officially opened last October in the Lyon-Gerland Biodistrict.
The transactions involved a variety of industries, from services to manufacturing. In manufacturing, the machinery/equipment, metals, chemicals and transport industries were the main targets for foreign investment.
- 54 -
2 . FOREIGN INVESTMENT IN FRANCE IN 2017
METHODOLOGY
MERGERS AND ACQUISITIONS
Bureau van Dijk’s Zephyr database tracks M&A deals throughout the world. Updated daily, it contains information on different types of transactions, including acquisitions, initial public offerings (IPOs), partial interest acquisitions and venture capital investments.
The Zephyr team is based in the United Kingdom and Singapore and works in 30 languages from a variety of sources, including press articles, company press releases, IPO announcements and websites. The shareholder structures and financial profiles of the deal parties (sellers, targets and buyers) are an integral part of Zephyr and are taken largely from the Orbis database.
A distinction should be made between minority interest and full acquisitions: The statistics on mergers and acquisitions encompass not only acquisitions – which entail a transfer control of the targeted company, with the investor holding over 50% of the equity in that company after the transaction –
but also equity acquisitions by minority shareholders who simply wish to invest in a company, without acquiring a controlling interest. Thus, the purchase of a two percent equity stake in a company by an investor who already holds a 49% stake in the same company will be counted as an acquisition. On the other hand, the purchase of a two percent equity stake by an investor who previously held a 10% stake will be counted as a minority interest acquisition.
The methodology used to establish the statistics on cross-border mergers and acquisitions differs from that used by central banks to assess the amount of foreign investment in a country. By convention, foreign direct investment (FDI) is considered to occur when a company holds at least 10% of the equity or voting rights of a firm based in another country. Unlike FDI figures, cross-border M&A statistics usually include all acquisitions of equity in a company by a non-resident company, with no minimum stake threshold.
THE FRENCH MERGERS AND ACQUISITIONS MARKETThe French M&A market encompasses various
categories of financial transactions in which all
or part of the equity of a company domiciled in
France is transferred to another company, be it
French or foreign. Companies frequently grow
inorganically like this in an effort to maximize
their capacity to take advantage of market upturns.
However, changes in the total value of M&A
transactions should be treated with caution for
two reasons: firstly, the lack of available data for
a significant proportion of the transactions recorded
in France (27% in 2017, 20% in 2016), and secondly,
foreign exchange effects, including the depreciation
of the euro against a number of foreign currencies.

3
Investment attractiveness of France’s regions in 201756 REGIONAL ANALYSIS
66 THE CONTRIBUTION OF FOREIGN SUBSIDIARIES TO FRANCE’S REGIONAL ECONOMIES
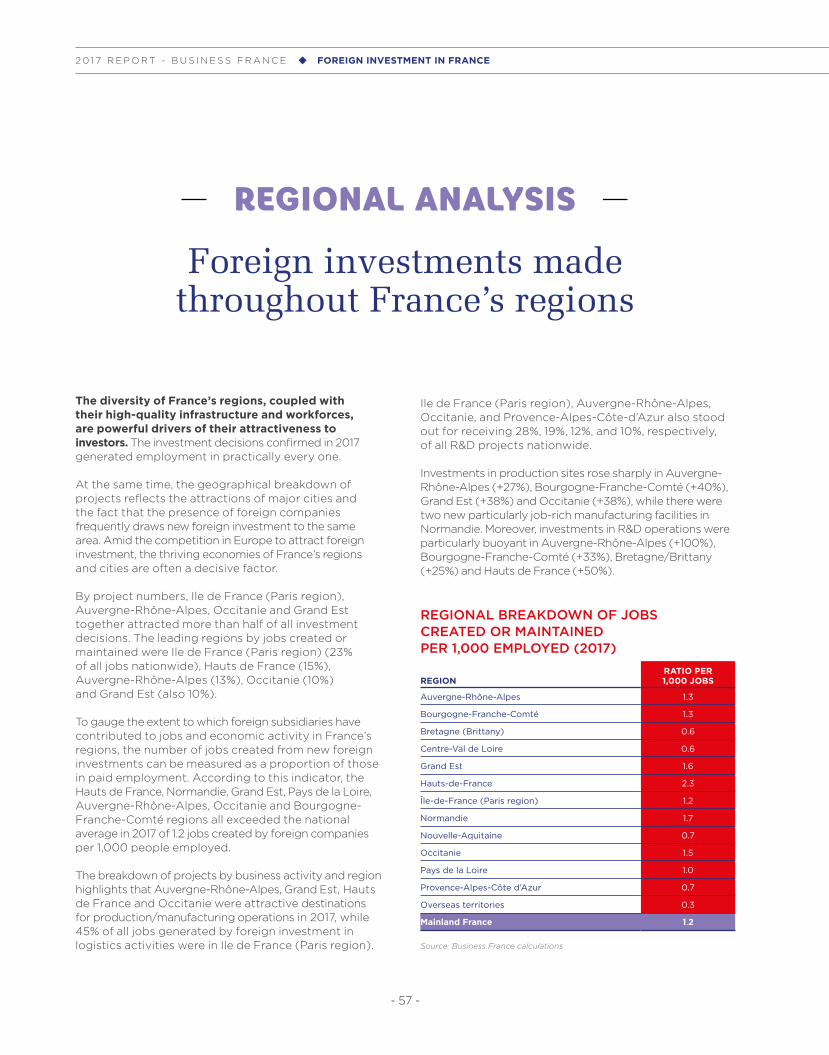
- 57 -
2 0 1 7 R E P O R T - B U S I N E S S F R A N C E FOREIGN INVESTMENT IN FRANCE
REGIONAL ANALYSIS
Foreign investments made throughout France’s regions
The diversity of France’s regions, coupled with their high-quality infrastructure and workforces, are powerful drivers of their attractiveness to investors. The investment decisions confirmed in 2017 generated employment in practically every one.
At the same time, the geographical breakdown of projects reflects the attractions of major cities and the fact that the presence of foreign companies frequently draws new foreign investment to the same area. Amid the competition in Europe to attract foreign investment, the thriving economies of France’s regions and cities are often a decisive factor.
By project numbers, Ile de France (Paris region), Auvergne-Rhône-Alpes, Occitanie and Grand Est together attracted more than half of all investment decisions. The leading regions by jobs created or maintained were Ile de France (Paris region) (23% of all jobs nationwide), Hauts de France (15%), Auvergne-Rhône-Alpes (13%), Occitanie (10%) and Grand Est (also 10%).
To gauge the extent to which foreign subsidiaries have contributed to jobs and economic activity in France’s regions, the number of jobs created from new foreign investments can be measured as a proportion of those in paid employment. According to this indicator, the Hauts de France, Normandie, Grand Est, Pays de la Loire, Auvergne-Rhône-Alpes, Occitanie and Bourgogne-Franche-Comté regions all exceeded the national average in 2017 of 1.2 jobs created by foreign companies per 1,000 people employed.
The breakdown of projects by business activity and region highlights that Auvergne-Rhône-Alpes, Grand Est, Hauts de France and Occitanie were attractive destinations for production/manufacturing operations in 2017, while 45% of all jobs generated by foreign investment in logistics activities were in Ile de France (Paris region).
REGIONAL BREAKDOWN OF JOBS CREATED OR MAINTAINED PER 1,000 EMPLOYED (2017)
REGIONRATIO PER 1,000 JOBS
Auvergne-Rhône-Alpes 1.3
Bourgogne-Franche-Comté 1.3
Bretagne (Brittany) 0.6
Centre-Val de Loire 0.6
Grand Est 1.6
Hauts-de-France 2.3
Île-de-France (Paris region) 1.2
Normandie 1.7
Nouvelle-Aquitaine 0.7
Occitanie 1.5
Pays de la Loire 1.0
Provence-Alpes-Côte d’Azur 0.7
Overseas territories 0.3
Mainland France 1.2
Ile de France (Paris region), Auvergne-Rhône-Alpes, Occitanie, and Provence-Alpes-Côte-d’Azur also stood out for receiving 28%, 19%, 12%, and 10%, respectively, of all R&D projects nationwide.
Investments in production sites rose sharply in Auvergne-Rhône-Alpes (+27%), Bourgogne-Franche-Comté (+40%), Grand Est (+38%) and Occitanie (+38%), while there were two new particularly job-rich manufacturing facilities in Normandie. Moreover, investments in R&D operations were particularly buoyant in Auvergne-Rhône-Alpes (+100%), Bourgogne-Franche-Comté (+33%), Bretagne/Brittany (+25%) and Hauts de France (+50%).
Source: Business France calculations
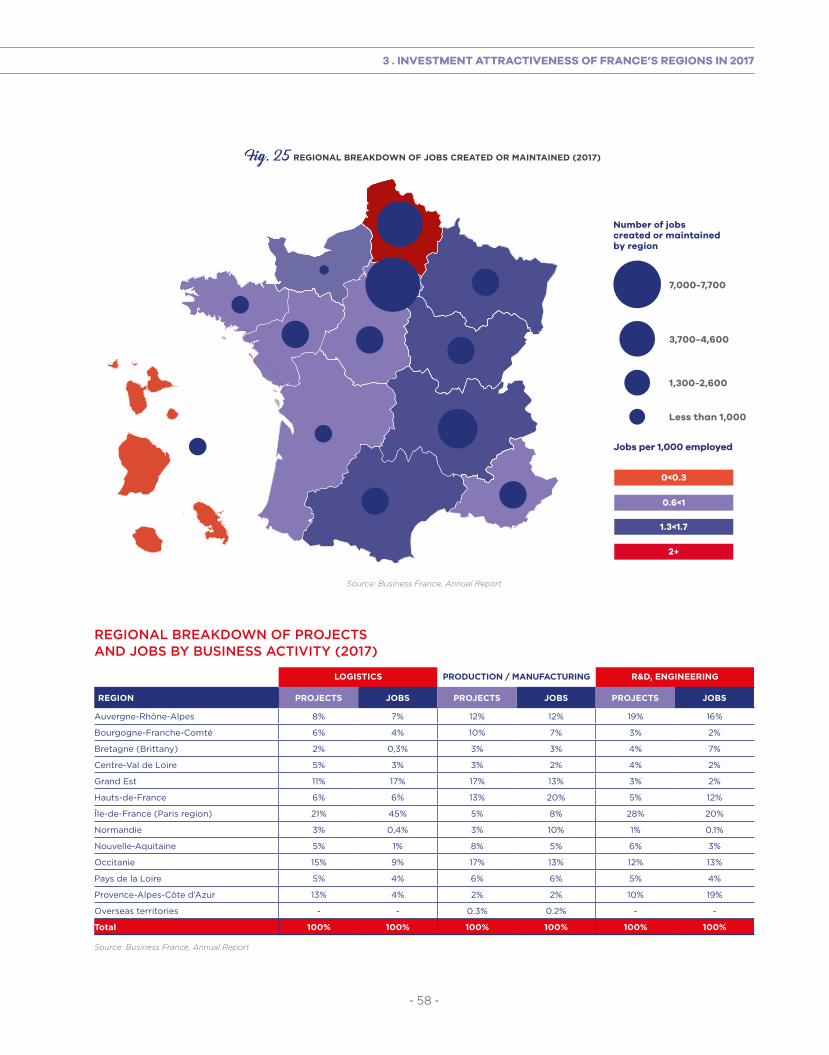
- 58 -
3 . INVESTMENT ATTRACTIVENESS OF FRANCE’S REGIONS IN 2017
REGIONAL BREAKDOWN OF PROJECTS AND JOBS BY BUSINESS ACTIVITY (2017)
LOGISTICS PRODUCTION / MANUFACTURING R&D, ENGINEERING
REGION PROJECTS JOBS PROJECTS JOBS PROJECTS JOBS
Auvergne-Rhône-Alpes 8% 7% 12% 12% 19% 16%
Bourgogne-Franche-Comté 6% 4% 10% 7% 3% 2%
Bretagne (Brittany) 2% 0,3% 3% 3% 4% 7%
Centre-Val de Loire 5% 3% 3% 2% 4% 2%
Grand Est 11% 17% 17% 13% 3% 2%
Hauts-de-France 6% 6% 13% 20% 5% 12%
Île-de-France (Paris region) 21% 45% 5% 8% 28% 20%
Normandie 3% 0,4% 3% 10% 1% 0.1%
Nouvelle-Aquitaine 5% 1% 8% 5% 6% 3%
Occitanie 15% 9% 17% 13% 12% 13%
Pays de la Loire 5% 4% 6% 6% 5% 4%
Provence-Alpes-Côte d’Azur 13% 4% 2% 2% 10% 19%
Overseas territories - - 0.3% 0.2% - -
Total 100% 100% 100% 100% 100% 100%
Jobs per 1,000 employed
0<0.3
Number of jobs created or maintained by region
7,000-7,700
3,700-4,600
1,300-2,600
Less than 1,000
Source: Business France, Annual Report
Fig. 25 REGIONAL BREAKDOWN OF JOBS CREATED OR MAINTAINED (2017)
Source: Business France, Annual Report
0.6<1
1.3<1.7
2+
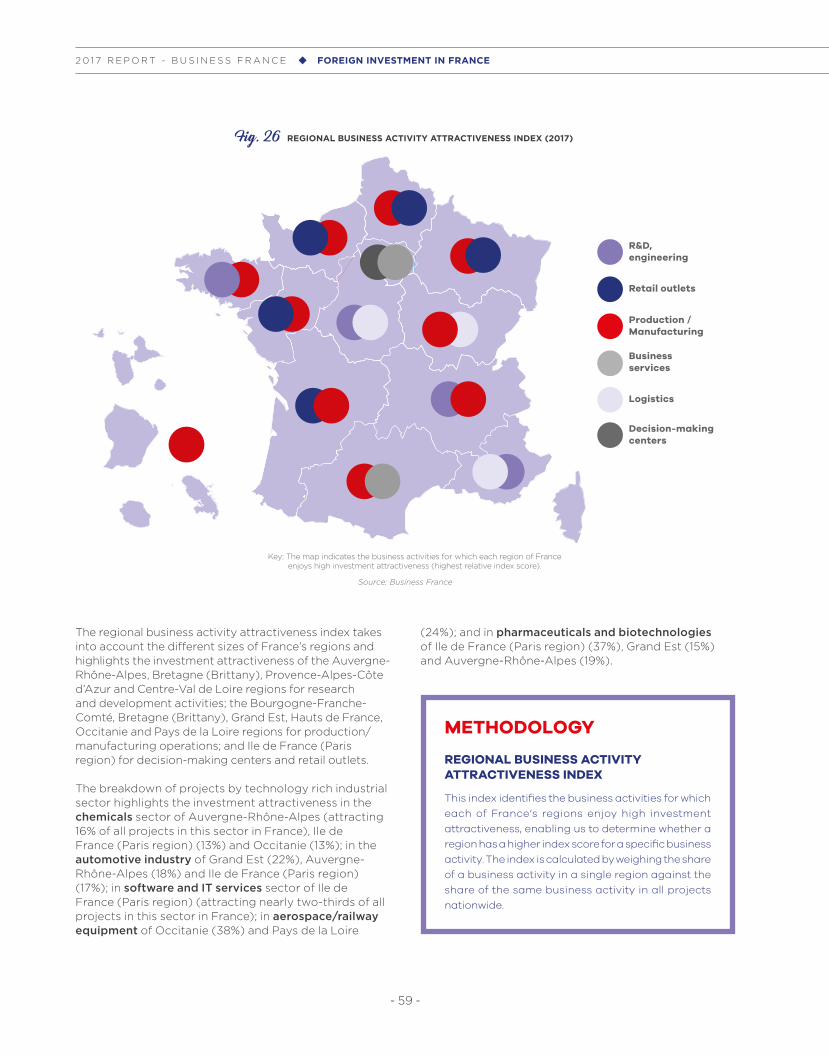
- 59 -
2 0 1 7 R E P O R T - B U S I N E S S F R A N C E FOREIGN INVESTMENT IN FRANCE
R&D, engineering
Business services
Retail outlets
Logistics
Production / Manufacturing
Decision-making centers
(24%); and in pharmaceuticals and biotechnologies of Ile de France (Paris region) (37%), Grand Est (15%) and Auvergne-Rhône-Alpes (19%).
The regional business activity attractiveness index takes into account the different sizes of France’s regions and highlights the investment attractiveness of the Auvergne-Rhône-Alpes, Bretagne (Brittany), Provence-Alpes-Côte d’Azur and Centre-Val de Loire regions for research and development activities; the Bourgogne-Franche-Comté, Bretagne (Brittany), Grand Est, Hauts de France, Occitanie and Pays de la Loire regions for production/manufacturing operations; and Ile de France (Paris region) for decision-making centers and retail outlets.
The breakdown of projects by technology rich industrial sector highlights the investment attractiveness in the chemicals sector of Auvergne-Rhône-Alpes (attracting 16% of all projects in this sector in France), Ile de France (Paris region) (13%) and Occitanie (13%); in the automotive industry of Grand Est (22%), Auvergne-Rhône-Alpes (18%) and Ile de France (Paris region) (17%); in software and IT services sector of Ile de France (Paris region) (attracting nearly two-thirds of all projects in this sector in France); in aerospace/railway equipment of Occitanie (38%) and Pays de la Loire
METHODOLOGY
REGIONAL BUSINESS ACTIVITY ATTRACTIVENESS INDEX
This index identifies the business activities for which
each of France’s regions enjoy high investment
attractiveness, enabling us to determine whether a
region has a higher index score for a specific business
activity. The index is calculated by weighing the share
of a business activity in a single region against the
share of the same business activity in all projects
nationwide.
Key: The map indicates the business activities for which each region of France enjoys high investment attractiveness (highest relative index score).
Fig. 26 REGIONAL BUSINESS ACTIVITY ATTRACTIVENESS INDEX (2017)
Source: Business France
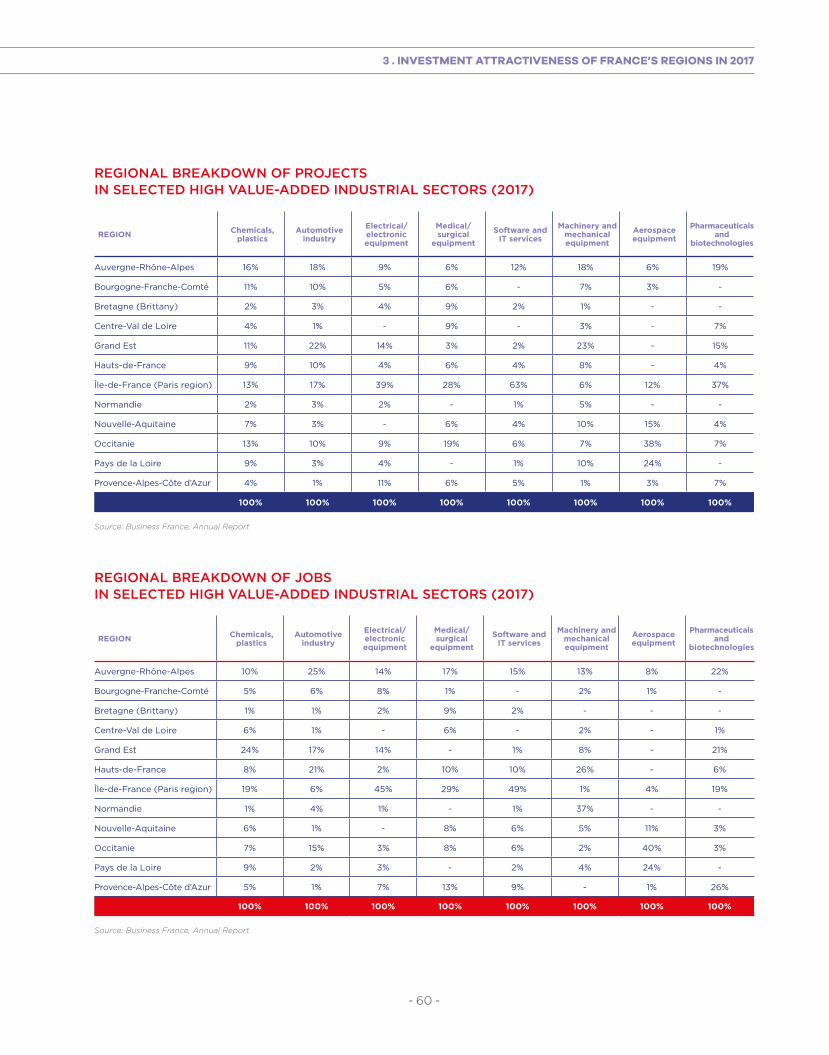
- 60 -
3 . INVESTMENT ATTRACTIVENESS OF FRANCE’S REGIONS IN 2017
REGIONAL BREAKDOWN OF PROJECTS IN SELECTED HIGH VALUE-ADDED INDUSTRIAL SECTORS (2017)
REGION Chemicals, plastics
Automotive industry
Electrical/electronic equipment
Medical/ surgical
equipment
Software and IT services
Machinery and mechanical equipment
Aerospace equipment
Pharmaceuticals and
biotechnologies
Auvergne-Rhône-Alpes 16% 18% 9% 6% 12% 18% 6% 19%
Bourgogne-Franche-Comté 11% 10% 5% 6% - 7% 3% -
Bretagne (Brittany) 2% 3% 4% 9% 2% 1% - -
Centre-Val de Loire 4% 1% - 9% - 3% - 7%
Grand Est 11% 22% 14% 3% 2% 23% - 15%
Hauts-de-France 9% 10% 4% 6% 4% 8% - 4%
Île-de-France (Paris region) 13% 17% 39% 28% 63% 6% 12% 37%
Normandie 2% 3% 2% - 1% 5% - -
Nouvelle-Aquitaine 7% 3% - 6% 4% 10% 15% 4%
Occitanie 13% 10% 9% 19% 6% 7% 38% 7%
Pays de la Loire 9% 3% 4% - 1% 10% 24% -
Provence-Alpes-Côte d’Azur 4% 1% 11% 6% 5% 1% 3% 7%
100% 100% 100% 100% 100% 100% 100% 100%
REGIONAL BREAKDOWN OF JOBS IN SELECTED HIGH VALUE-ADDED INDUSTRIAL SECTORS (2017)
REGION Chemicals, plastics
Automotive industry
Electrical/electronic equipment
Medical/ surgical
equipment
Software and IT services
Machinery and mechanical equipment
Aerospace equipment
Pharmaceuticals and
biotechnologies
Auvergne-Rhône-Alpes 10% 25% 14% 17% 15% 13% 8% 22%
Bourgogne-Franche-Comté 5% 6% 8% 1% - 2% 1% -
Bretagne (Brittany) 1% 1% 2% 9% 2% - - -
Centre-Val de Loire 6% 1% - 6% - 2% - 1%
Grand Est 24% 17% 14% - 1% 8% - 21%
Hauts-de-France 8% 21% 2% 10% 10% 26% - 6%
Île-de-France (Paris region) 19% 6% 45% 29% 49% 1% 4% 19%
Normandie 1% 4% 1% - 1% 37% - -
Nouvelle-Aquitaine 6% 1% - 8% 6% 5% 11% 3%
Occitanie 7% 15% 3% 8% 6% 2% 40% 3%
Pays de la Loire 9% 2% 3% - 2% 4% 24% -
Provence-Alpes-Côte d’Azur 5% 1% 7% 13% 9% - 1% 26%
100% 100% 100% 100% 100% 100% 100% 100%
Source: Business France, Annual Report
Source: Business France, Annual Report
- 61 -
AEF: A modest firm from Moselle serving the world’s luxury car market
Hailing from the Moselle area of the Grand Est region, Ateliers d’Emboutissage de Faulquemont (AEF) is a subsidiary of the Allgaier Group, a family company founded in 1906 in a small cutting and punching-tool workshop near the German city of Stuttgart.
Today, Allgaier is an internationally renowned group operating across the globe in two separate sectors. Its automotive division develops and manufactures punching tools, punched parts and complex systems such as fuel tanks, while its process technology division offers a full range of washing, drying, cooling, sieving and sorting systems.
By acquiring and setting up various subsidiaries, the firm has succeeded in establishing a strong presence in the world’s leading industrialized nations. Every day, some 1,700 employees put all their knowledge and experience into meeting their customers’ requirements.
An automotive base in FaulquemontIn 1977, the company’s owner, Professor Dieter Hundt, decided to move some of its production to France to improve order fulfilment for its main customer, which was based in Paris at the time. Faulquemont appeared to be an
ideal location for the new operation. The area had changed rapidly since the closure of its mine, and its new industrial park was not too far away from the parent company in Stuttgart.
“There were 15 employees initially, and the site made parts for a braking system that was assembled in the Paris region,” recalls Jean-Luc Schneider, Managing Director since 2008. Faulquemont is the group’s sole French production facility and boasts renowned expertise: “Our core businesses are punching and assembly in all their forms. We also carry out electrophoretic painting, a chemical process that gives parts an extremely smooth surface finish,” explains Mr. Schneider.
The firm caters primarily for the automotive industry, making brake parts, as well as structural, gearbox and sunroof components, along with brake disc guards. It also supplies parts for some of BMW’s electric vehicles. “We work with all the major German car makers,” says Mr. Schneider, citing Volkswagen, Audi, BMW, Daimler and Porsche. “99.8% of our output is exported. We are currently seeking to generate business with French brands,” he adds.
A new name after 40 years in Moselle AEF has now been renamed Allgaier France, adopting its German parent company’s identity, and recently signed a seven-year, €100 million deal with Daimler to supply structural parts for vehicle shells.
The site currently employs around 200 people, including a few temporary workers. But Mr. Schneider firmly intends to increase the firm’s workforce as its sales grow: “Over the next two years, our turnover is set to rise from €29 million to €34 million, €39 million and eventually €43 million,” he says with cautious optimism. Moreover, Allgaier France invests around €2 million in its production facilities each year.
Innovation for long-term successThe company has resolved to keep investing over the coming years, especially in areas that will significantly boost innovation capacity, with clear aims to ensure that production at Faulquemont remains at the forefront of technology.
SPOTLIGHT REGIONAL SUCCESS STORIES
99.8% of our output is
exported. We are currently seeking
to generate business with French brands
- 61 -
2 0 1 7 R E P O R T - B U S I N E S S F R A N C E FOREIGN INVESTMENT IN FRANCE
- 62 -
With this state-of- the-art facility, we can speed up product development and enhance the site’s overall operating system.
3 . INVESTMENT ATTRACTIVENESS OF FRANCE’S REGIONS IN 2017
Allgaier France consequently acquired robotic units recently to make structural parts and battery brackets as part of a brand-new project. More projects are now underway, including initiatives focusing on energy efficiency, the industry of the future and production area optimization. A small workshop extension is also in the pipeline.
Hill-Rom’s world-class facility in BrittanyThe Hill-Rom Group specializes in medical equipment and technology, with a presence in Bretagne (Brittany) since 1991, when it acquired the Pluvigner site, which used to make medical beds and hospital furniture. Over the years, the plant has diversified into manufacturing therapeutic surfaces and distributing surgical consumables.
Growth through “Wellbeing and Performance”In 2013, the plant ran into serious difficulties due to a loss of competitiveness and performance, causing it to reassess its business structure and take a different path. This transformation process, backed by every employee, was centered on a shared objective: customer satisfaction. It also became a human journey, revolving around one key question: how can the production facility improve its performance without negatively impacting the welfare of employees? The question led to the creation of the “Wellbeing and Performance” approach, which now defines the site.
First of all, Hill-Rom took on the issue of safety, resulting in zero accidents being recorded in 2017. It then moved on to quality, automatically improving productivity and maintaining a continuous cycle of improvement. New processes have reduced stock and saved space, enabling new tasks to be performed that were previously carried out abroad.
In addition to production, staff at Pluvigner manage logistics, sales, purchasing, samples, spare parts, R&D and financial transactions. Consequently, half of the tasks performed at the site support the Hill-Rom Group’s business worldwide, the aim being to make Pluvigner a global center of operational excellence.
French innovation center spearheading international developmentThe site’s transformation was supported by significant investments, including €2 million in 2017. On top of new machines that will increase production line automation, including a painting robot and two laser cutters for metal bars, the test laboratory has seen its capacity double, while a prototyping laboratory, created as part of a new innovation center, was inaugurated in mid-2017 by Loïg Chesnais-Girard, President of the Regional Council. Around forty employees develop and test new products in the unit, an important endeavor given that tomorrow’s beds will feature more and more technology, such as integrated patient weighing systems, vital-sign management, and treatment optimization.
According to Marc Capdeville, Executive Director of the Pluvigner site, this innovation center is a crucial part of the business: “With this state-of-the-art facility, we can speed up product development and enhance the site’s overall operating system. The innovation center will primarily serve Pluvigner, while also supporting sites in other parts of the world.” According to Loïg Chesnais-Girard, it comes as recognition for his region’s “innovation capacity and investment attractiveness. It is also the result of collaboration between the company and the local authorities.”
- 62 -
- 63 -
We intend to grow further in 2018, with a view to providing customer training support and conducting R&D projects
In just four years, Pluvigner has gone from being a struggling site to leading operational excellence on behalf of a multinational. At the end of January 2018, this impressive turnaround was acknowledged by the Medef employers’ federation, the French Quality Association (AFQP) and the French government’s Business Directorate (DGE), which awarded the Hill-Rom site in Pluvigner the nationwide Operational Excellence prize for 2018 in the mid-size company category.
Bertrandt gets closer to its customers in Toulouse
Bertrandt is the world’s second largest automotive engineering company, offering development solutions for the automotive and aerospace industries. Based in Germany, and headquartered in Ehningen, near Stuttgart, it boasts a presence in Europe, China and the United States, its 53 sites employing 13,000 people and generating sales of €990 million in 2016. The firm’s main French entity is located in Vélizy-Villacoublay (Paris region).
Since 2014, the Toulouse site, in south-west France, has grown around its engine and testing operations, electronics and support services focused on quality, production and project management, with a workforce that has continued to double every year.
End-to-end support and developmentAs an engineering partner to the ‘mobility industries’, the group’s various business lines are driven by the desire to develop the best possible solution for every client. Its services cover each stage of the manufacturing process and every project phase: design, research, development, mock-ups, tool building and vehicle construction, as well as production planning, launch and follow-up.
In addition, the various development stages are validated with simulations, prototyping and testing. Specific expertise, and in-depth project and process management experience make Bertrandt a valuable partner when it comes to effectively managing the development process from start to finish.
The company’s main customers include European car manufacturers and equipment suppliers, as well as major players in the aerospace and rail sectors.
The Toulouse site’s workforce has doubled each year since 2014, and now employs 85 people, including engineers, technicians and administrative personnel. The site is aiming to expand in every segment of the mobility market and values its proximity to its clients, which include Continental, NXP, Hella, Siemens and Airbus, as well as their subcontractors.
“Our aim is to offer our clients quality and technical sophistication. We already have two premises in Toulouse and intend to grow further in 2018, with a view to providing customer training support and conducting R&D projects,” says the site manager.
Bertrandt is also a member of the Automotech cluster set up by the regional economic development agency. According to the firm, Automotech has enabled the emergence of a network within the region and the collective development of Toulouse’s automotive sector. It has also fostered a number of fruitful partnerships. Bertrandt recently exhibited its products and services at the Toulouse motor show, and in March 2018 the Toulouse-based entity will also be attending the myjob@futurauto fair showcasing the automotive industry in the Occitanie region.
- 63 -
2 0 1 7 R E P O R T - B U S I N E S S F R A N C E FOREIGN INVESTMENT IN FRANCE
- 64 -
This is a superb opportunity to position the company in a rapidly growing market, with a strong emphasis on technology.
3 . INVESTMENT ATTRACTIVENESS OF FRANCE’S REGIONS IN 2017
Poly-Imprim’ goes upmarket in Nouvelle Aquitaine
Poly-Imprim’ is a firm that specializes in printing adhesive bottle labels. Based in the town of Touvérac, in the Nouvelle Aquitaine region, the firm was taken over by Italian group Eurostampa in 2015. Since then, Poly-Imprim’ has seen its sales grow and its workforce almost double in size to around forty people in 2017. The expansion planned to install new production facilities will increase the plant’s surface area from 1,500 to 2,700 sq. m. in 2018.
The investments made at the Touvérac site will come to a total of €5 million (€2 million has already been invested and €3 million has been set aside for 2017-2020), enabling Poly-Imprim’ to continue to grow and generate revenues of €7 million in 2018, when around fifty people will be employed at the site. The Nouvelle Aquitaine Regional Council has assisted the company with its investments by providing various subsidies.
Eurostampa operates in the particularly niche market of making labels for high-end glass bottles (cognac, champagne and wine) and has five production sites around the world, employing 650 people and generating €140 in annual sales. The Italian group was keen to invest in France to be closer to potential customers, eventually choosing the Nouvelle Aquitaine-based company for the quality of its products.
ASTI Technologies Group sets up first European subsidiary in Mulhouse
ASTI Technologies Group, a Spanish industry 4.0 company with 150 employees, chose to set up its first European subsidiary in Mulhouse, in the Grand Est region. This was very much a strategic decision by the firm, which has been operating in France since 2010, generating sales of over €10 million in the country in 2016, making up 40% of its overall turnover.
Based in Burgos, in Spain’s Castile and León region, ASTI is an engineering company that specializes in the study, design, manufacture and maintenance of automated
logistics solutions to optimize in-company transport using Automated Guided Vehicles (AGVs). Its European base in Mulhouse, in the heart of an innovative industry 4.0 ecosystem, brings it closer to its clients in the automotive sector (PSA and Faurecia in particular) and the agri-food industry. ASTI’s CEO, Verónica Pascual, believes “this is a superb opportunity to position the company in a rapidly growing market, with a strong emphasis on technology.”
ASTI received strong backing from the Alsace Attractiveness Agency (AAA), which supported the firm throughout its dealings with partners in the region, the Grand Est Regional Council and the Mulhouse Intermunicipal Council, as well as Business France Madrid, which initially met with the company.
ASTI plans to create 50 jobs in the wider Mulhouse area over the next three years, and the company is already involved in a number of R&D projects with partners in industry and academia.
- 64 -
- 65 -
The network identifies international
trends and enhances automotive design
with new ideas from various continents and
cultures.
Mercedes opens an ‘Advanced Design Center’ near Nice
Mercedes is set to open an “Advanced Design Center” at the Sophia Antipolis technology park to underpin its universal design network. Boasting specialist skills, the network identifies international trends and enhances automotive design with new ideas from various continents and cultures.
The Advanced Design Center will be a new home for designers in France. With a surface area of more than 3,000 sq. m., the building will offer enough space for around 50 designers. “Thanks to its fully glazed design, the entire building will be bathed in soft Mediterranean light, offering ideal working conditions for designers,” points out Mercedes.
Every one of Mercedes-Benz’s key design disciplines will be represented at the site: traditional exteriors and interiors, digital design, as well as UI and UX, which are rapidly growing in importance at a time when driverless vehicles and human-machine communication are becoming increasingly prevalent.
Cizeta Medicali’s new site committed to product and service innovation
Cizeta Medicali is an Italian firm specializing in the design and production of innovative devices for medical compression applications (socks, bandages, knee supports, compresses and support stockings).
Its French subsidiary is based in Saint-Amand-Montrond, in the Centre-Val de Loire region, and has enjoyed steady growth for several years now. As part of its organic growth plan, Cizeta Medicali is continuing to invest to increase its presence in the French market in line with its requirements and those of its clients, which are among the sector’s leading manufacturers. Twenty new jobs, many of which have already been filled, will boost the site’s current workforce of more than 70.
The company is firmly committed to product and service innovation, as demonstrated by the recent launch of an innovative internationally patented splint, after four years of in-house development. The device, which can halve the time it takes to walk again after a sprain, is receiving support from Business France to boost sales in overseas markets. The firm also achieves service innovation, offering training applications for smartphones aimed at users and practitioners (pharmacists and orthopedists).
- 65 -
2 0 1 7 R E P O R T - B U S I N E S S F R A N C E FOREIGN INVESTMENT IN FRANCE
- 66 -
Young French talent is now more European than ever and that will be crucial for us, given that our projects take place in multiple countries.
3 . INVESTMENT ATTRACTIVENESS OF FRANCE’S REGIONS IN 2017
Kobaltblau chooses France to fast-track its growth across Europe
Kobaltblau is a pan-European information system strategy consulting firm that specializes in switching IS departments to the Agile model, setting up cloud solutions and defining master plans.
The company employs 45 consultants who combine expertise in the organization and governance of IT services with advanced tech skills, with a view to driving digital transformation in companies. Kobaltblau’s consultants are both strategically and operationally minded, which sees them implement innovative methods such as Scrum, Agile, Lean Startup and Design Thinking to ensure that their customers enjoy a successful transformation.
A hyper-connected region brimming with talent
Founded in Germany two years ago, and already present in the Swiss and Austrian markets, Kobaltblau identified Ile de France (Paris region) as a springboard for its growth in Europe. Frédéric Cuny, one of the German company’s co-founders and the Executive Director for France, explains why setting up operations in Ile de France was a crucial strategic choice to underpin Kobaltblau’s competitiveness.
“Paris and Ile de France are right at the heart of Europe. No other region is better connected to other European countries and financial centers. Our clients are major groups and mid-size companies who all have headquarters in the area. What’s more, the region boasts world-renowned higher education and research establishments brimming with the talent and skills we need to remain at the forefront of innovation.”
Kobaltblau intends to recruit a dozen more consultants in 2018: “Young French talent is now more European than ever and that will be crucial for us, given that our projects take place in multiple countries.”
German prowess
The business has grown to be very popular in Germany: “We banked on trends that set us apart from major firms, and went from a handful of consultants to 45 in the space of just a year! Our core areas are cloud computing and organizational agility, but we also focus on developing prototypes. The recent shift towards agility has marked a profound change in how consulting is performed: colossal projects are being replaced by more manageable mobile units and setup concepts that are more visual and more fun.”
The firm’s background in Germany adds credibility to this implementation project: “Our customers buy into our core belief that innovation arises from thoroughness and perseverance. What’s more, data protection laws in Germany are extremely strict. So when it comes to implementing cloud solutions, the manufacturers we work for in France have every confidence in us.”
- 66 -
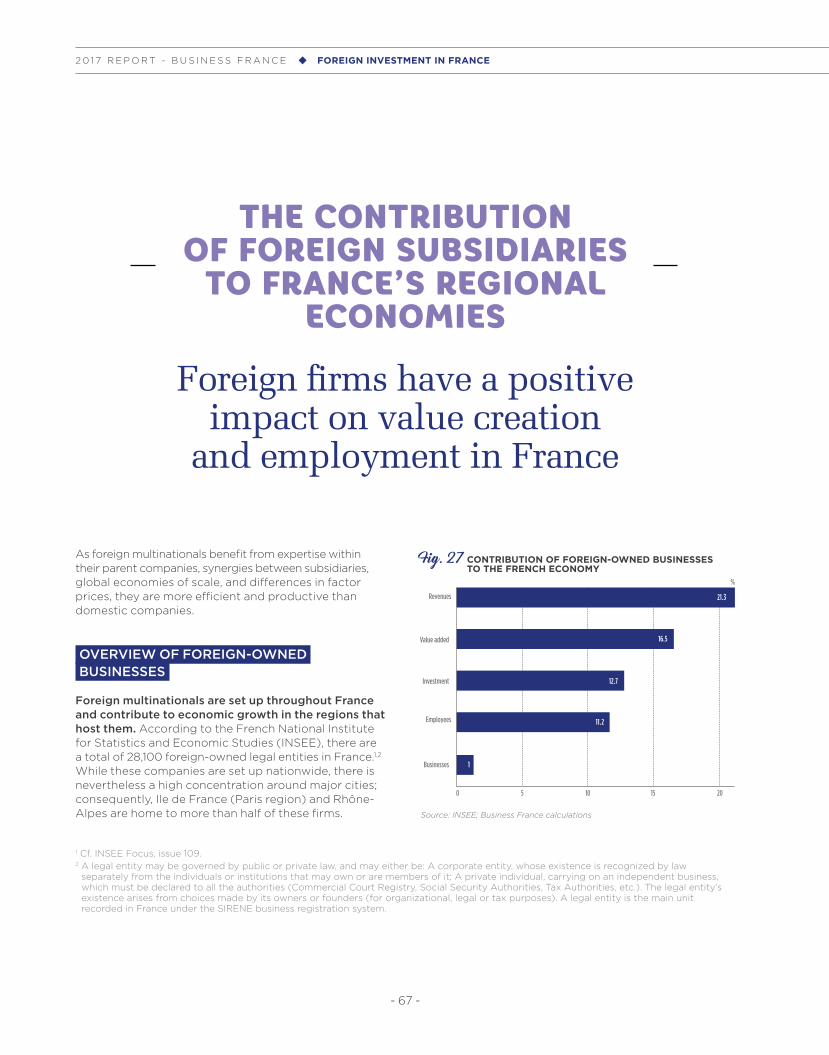
- 67 -
2 0 1 7 R E P O R T - B U S I N E S S F R A N C E FOREIGN INVESTMENT IN FRANCE
THE CONTRIBUTION OF FOREIGN SUBSIDIARIES
TO FRANCE’S REGIONAL ECONOMIES
Foreign firms have a positive impact on value creation
and employment in France
As foreign multinationals benefit from expertise within their parent companies, synergies between subsidiaries, global economies of scale, and differences in factor prices, they are more efficient and productive than domestic companies.
OVERVIEW OF FOREIGN-OWNED BUSINESSES
Foreign multinationals are set up throughout France and contribute to economic growth in the regions that host them. According to the French National Institute for Statistics and Economic Studies (INSEE), there are a total of 28,100 foreign-owned legal entities in France.1,2 While these companies are set up nationwide, there is nevertheless a high concentration around major cities; consequently, Ile de France (Paris region) and Rhône-Alpes are home to more than half of these firms.
1 Cf. INSEE Focus, issue 109.2 A legal entity may be governed by public or private law, and may either be: A corporate entity, whose existence is recognized by law
separately from the individuals or institutions that may own or are members of it; A private individual, carrying on an independent business, which must be declared to all the authorities (Commercial Court Registry, Social Security Authorities, Tax Authorities, etc.). The legal entity’s existence arises from choices made by its owners or founders (for organizational, legal or tax purposes). A legal entity is the main unit recorded in France under the SIRENE business registration system.
Graph1. Chap3
Revenues
0 5 10 15 20
Value added
Investment
Businesses
Employees
21.3
16.5
12.7
11.2
1
United States
Germany
United Kingdom
Netherlands
Switzerland
Belgium
Luxembourg
Sweden
Italy
Spain
Japan
Denmark
Ireland
Canada
Hong Kong
Austria
South Africa
Finland
China
Portugal
0 50,000 100,000 200,000150,000 250,000 300,000 350,000
%
En %
En %
50
40
30
20
10
0
%
Industry Wholesale/retail, motor vehicle
repair
Businessservices
Transport,storage
Accommodation,food services
Construction OtherInformation,communication
80
70
60
50
40
30
20
10
0
80
70
60
50
40
30
20
10
0
Comp
osan
ts éle
ctron
iques
Fab.
d'éq
uipts
d'irra
diatio
n méd
icale
Fab.
de m
achin
es et
équip
ts n.
c. ail
leurs
Autre
s ind
ustri
es m
anuf
actu
rière
s
Trava
il du b
ois, in
dustr
iesdu
papie
r et i
mpr
imer
ieFa
b. de
prod
uits m
étall
iques
Indus
trie p
harm
aceu
tique
Fab.
d'au
tres p
dts m
inéra
uxno
n mét
alliqu
esInd
ustri
e aut
omob
ileFa
b. d'
équip
ts éle
ctriqu
esAg
ricult
ure,
sylvi
cultu
re et
pêch
eCo
nstru
ction
nava
le, fe
rrovia
ireÉd
ition
, aud
iovisu
el et
diffu
sion
Prod
. & di
strib.
eau,
gesti
on dé
chet
sAc
tivité
s scie
ntifi
ques
et te
chniq
ues
Activ
ités i
nfor
mat
iques
Fab.
des t
extil
es, in
dustr
ies
de l'h
abille
men
t, cu
ir et
chau
ssure
s
Méta
llurg
ie
Fab.
de de
nrée
s alim
enta
ires,
boiss
ons
Indus
trie c
himiqu
e
Com
posa
nts é
lectro
nique
sÉq
uipts
d'irra
diatio
n méd
ic.Mé
tallu
rgie
Autre
s ind
ustri
es
Indus
trie c
himiqu
e
Indus
trie p
harm
aceu
tique
Fab.
pdts
mét
alliqu
esCa
outch
ouc,
plasti
que
Indus
trie a
utom
obile
Trava
il du b
ois, in
dustr
ies
du pa
pier e
t im
prim
erie
Fab.
d'éq
uipts
électr
iques
Fab.
d'au
tres p
dts m
inéra
ux no
n mét
alliqu
es
Activ
ités i
nfor
mat
iques
Instru
m. e
t app
ar. de
mes
ure
Activ
ités f
inanc
ières
et d'
assu
ranc
e
Activ
ités s
pécia
lisée
s, sci
entif
iques
et te
chniq
ues
Fab.
text
iles,
indus
tries
habil
lemen
t
Autre
s acti
vités
Fab.
de m
achin
es et
équip
ts Fa
b. de
nrée
s alim
enta
ires,
boiss
ons
Fig. 27 CONTRIBUTION OF FOREIGN-OWNED BUSINESSES TO THE FRENCH ECONOMY
Source: INSEE; Business France calculations
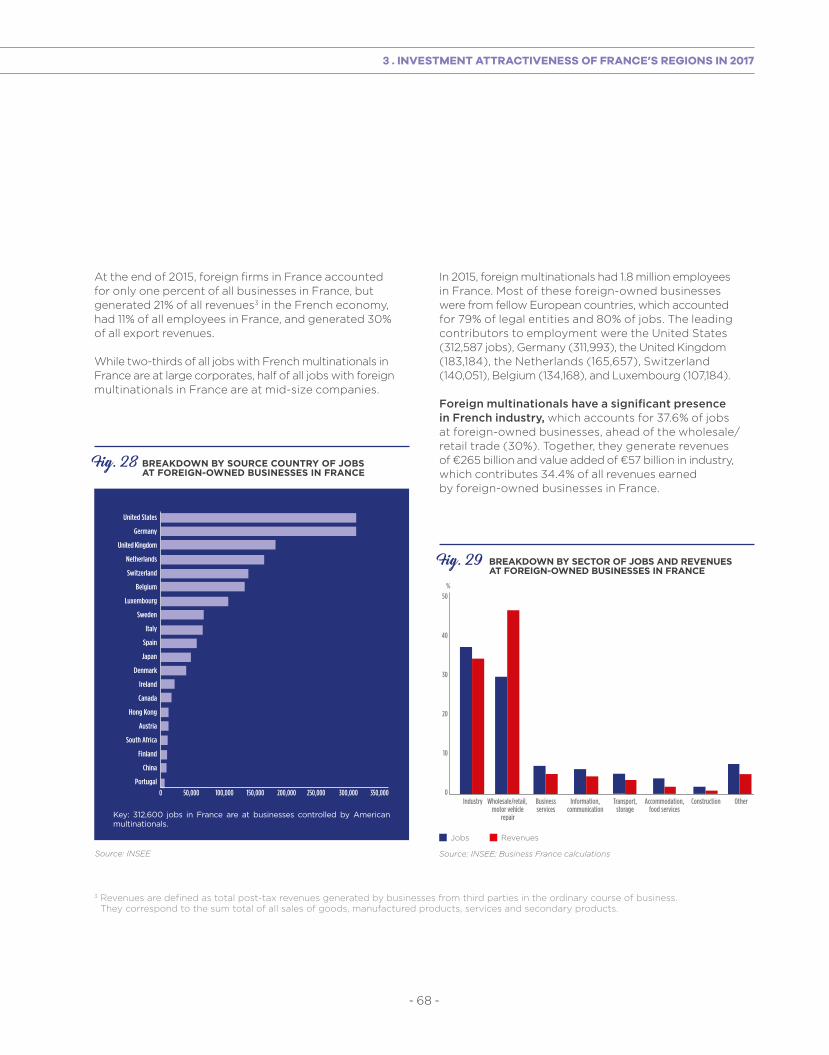
- 68 -
3 . INVESTMENT ATTRACTIVENESS OF FRANCE’S REGIONS IN 2017
At the end of 2015, foreign firms in France accounted for only one percent of all businesses in France, but generated 21% of all revenues3 in the French economy, had 11% of all employees in France, and generated 30% of all export revenues.
While two-thirds of all jobs with French multinationals in France are at large corporates, half of all jobs with foreign multinationals in France are at mid-size companies.
In 2015, foreign multinationals had 1.8 million employees in France. Most of these foreign-owned businesses were from fellow European countries, which accounted for 79% of legal entities and 80% of jobs. The leading contributors to employment were the United States (312,587 jobs), Germany (311,993), the United Kingdom (183,184), the Netherlands (165,657), Switzerland (140,051), Belgium (134,168), and Luxembourg (107,184).
Foreign multinationals have a significant presence in French industry, which accounts for 37.6% of jobs at foreign-owned businesses, ahead of the wholesale/retail trade (30%). Together, they generate revenues of €265 billion and value added of €57 billion in industry, which contributes 34.4% of all revenues earned by foreign-owned businesses in France.
3 Revenues are defined as total post-tax revenues generated by businesses from third parties in the ordinary course of business. They correspond to the sum total of all sales of goods, manufactured products, services and secondary products.
Graph1. Chap3
Revenues
0 5 10 15 20
Value added
Investment
Businesses
Employees
21.3
16.5
12.7
11.2
1
United States
Germany
United Kingdom
Netherlands
Switzerland
Belgium
Luxembourg
Sweden
Italy
Spain
Japan
Denmark
Ireland
Canada
Hong Kong
Austria
South Africa
Finland
China
Portugal
0 50,000 100,000 200,000150,000 250,000 300,000 350,000
%
En %
En %
50
40
30
20
10
0
%
Industry Wholesale/retail, motor vehicle
repair
Businessservices
Transport,storage
Accommodation,food services
Construction OtherInformation,communication
80
70
60
50
40
30
20
10
0
80
70
60
50
40
30
20
10
0
Comp
osan
ts éle
ctron
iques
Fab.
d'éq
uipts
d'irra
diatio
n méd
icale
Fab.
de m
achin
es et
équip
ts n.
c. ail
leurs
Autre
s ind
ustri
es m
anuf
actu
rière
s
Trava
il du b
ois, in
dustr
iesdu
papie
r et i
mpr
imer
ieFa
b. de
prod
uits m
étall
iques
Indus
trie p
harm
aceu
tique
Fab.
d'au
tres p
dts m
inéra
uxno
n mét
alliqu
esInd
ustri
e aut
omob
ileFa
b. d'
équip
ts éle
ctriqu
esAg
ricult
ure,
sylvi
cultu
re et
pêch
eCo
nstru
ction
nava
le, fe
rrovia
ireÉd
ition
, aud
iovisu
el et
diffu
sion
Prod
. & di
strib.
eau,
gesti
on dé
chet
sAc
tivité
s scie
ntifi
ques
et te
chniq
ues
Activ
ités i
nfor
mat
iques
Fab.
des t
extil
es, in
dustr
ies
de l'h
abille
men
t, cu
ir et
chau
ssure
s
Méta
llurg
ie
Fab.
de de
nrée
s alim
enta
ires,
boiss
ons
Indus
trie c
himiqu
e
Com
posa
nts é
lectro
nique
sÉq
uipts
d'irra
diatio
n méd
ic.Mé
tallu
rgie
Autre
s ind
ustri
es
Indus
trie c
himiqu
e
Indus
trie p
harm
aceu
tique
Fab.
pdts
mét
alliqu
esCa
outch
ouc,
plasti
que
Indus
trie a
utom
obile
Trava
il du b
ois, in
dustr
ies
du pa
pier e
t im
prim
erie
Fab.
d'éq
uipts
électr
iques
Fab.
d'au
tres p
dts m
inéra
ux no
n mét
alliqu
es
Activ
ités i
nfor
mat
iques
Instru
m. e
t app
ar. de
mes
ure
Activ
ités f
inanc
ières
et d'
assu
ranc
e
Activ
ités s
pécia
lisée
s, sci
entif
iques
et te
chniq
ues
Fab.
text
iles,
indus
tries
habil
lemen
t
Autre
s acti
vités
Fab.
de m
achin
es et
équip
ts Fa
b. de
nrée
s alim
enta
ires,
boiss
ons
Key: 312,600 jobs in France are at businesses controlled by American multinationals.
Graph1. Chap3
Revenues
0 5 10 15 20
Value added
Investment
Businesses
Employees
21.3
16.5
12.7
11.2
1
United States
Germany
United Kingdom
Netherlands
Switzerland
Belgium
Luxembourg
Sweden
Italy
Spain
Japan
Denmark
Ireland
Canada
Hong Kong
Austria
South Africa
Finland
China
Portugal
0 50,000 100,000 200,000150,000 250,000 300,000 350,000
%
En %
En %
50
40
30
20
10
0
%
Industry Wholesale/retail, motor vehicle
repair
Businessservices
Transport,storage
Accommodation,food services
Construction OtherInformation,communication
80
70
60
50
40
30
20
10
0
80
70
60
50
40
30
20
10
0
Comp
osan
ts éle
ctron
iques
Fab.
d'éq
uipts
d'irra
diatio
n méd
icale
Fab.
de m
achin
es et
équip
ts n.
c. ail
leurs
Autre
s ind
ustri
es m
anuf
actu
rière
s
Trava
il du b
ois, in
dustr
iesdu
papie
r et i
mpr
imer
ieFa
b. de
prod
uits m
étall
iques
Indus
trie p
harm
aceu
tique
Fab.
d'au
tres p
dts m
inéra
uxno
n mét
alliqu
esInd
ustri
e aut
omob
ileFa
b. d'
équip
ts éle
ctriqu
esAg
ricult
ure,
sylvi
cultu
re et
pêch
eCo
nstru
ction
nava
le, fe
rrovia
ireÉd
ition
, aud
iovisu
el et
diffu
sion
Prod
. & di
strib.
eau,
gesti
on dé
chet
sAc
tivité
s scie
ntifi
ques
et te
chniq
ues
Activ
ités i
nfor
mat
iques
Fab.
des t
extil
es, in
dustr
ies
de l'h
abille
men
t, cu
ir et
chau
ssure
s
Méta
llurg
ie
Fab.
de de
nrée
s alim
enta
ires,
boiss
ons
Indus
trie c
himiqu
e
Com
posa
nts é
lectro
nique
sÉq
uipts
d'irra
diatio
n méd
ic.Mé
tallu
rgie
Autre
s ind
ustri
es
Indus
trie c
himiqu
e
Indus
trie p
harm
aceu
tique
Fab.
pdts
mét
alliqu
esCa
outch
ouc,
plasti
que
Indus
trie a
utom
obile
Trava
il du b
ois, in
dustr
ies
du pa
pier e
t im
prim
erie
Fab.
d'éq
uipts
électr
iques
Fab.
d'au
tres p
dts m
inéra
ux no
n mét
alliqu
es
Activ
ités i
nfor
mat
iques
Instru
m. e
t app
ar. de
mes
ure
Activ
ités f
inanc
ières
et d'
assu
ranc
e
Activ
ités s
pécia
lisée
s, sci
entif
iques
et te
chniq
ues
Fab.
text
iles,
indus
tries
habil
lemen
t
Autre
s acti
vités
Fab.
de m
achin
es et
équip
ts Fa
b. de
nrée
s alim
enta
ires,
boiss
ons
Fig. 28 BREAKDOWN BY SOURCE COUNTRY OF JOBS AT FOREIGN-OWNED BUSINESSES IN FRANCE
Fig. 29 BREAKDOWN BY SECTOR OF JOBS AND REVENUES AT FOREIGN-OWNED BUSINESSES IN FRANCE
Jobs Revenues
Source: INSEE; Business France calculationsSource: INSEE
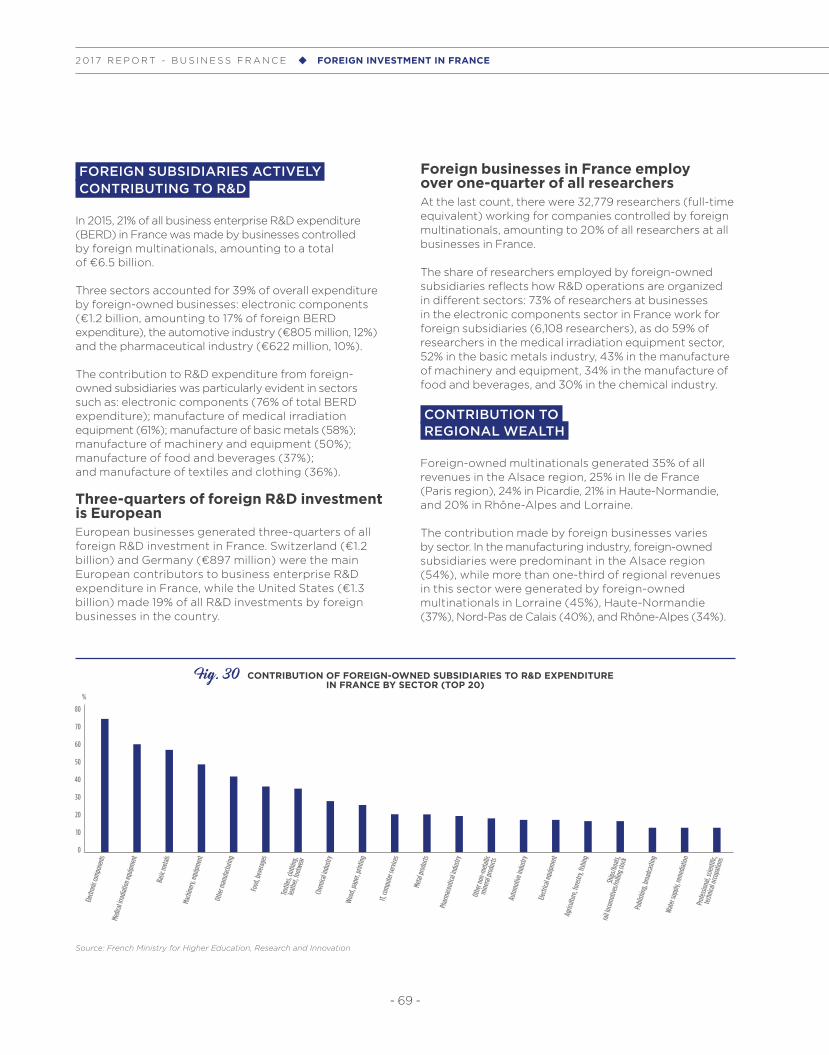
- 69 -
2 0 1 7 R E P O R T - B U S I N E S S F R A N C E FOREIGN INVESTMENT IN FRANCE
Foreign businesses in France employ over one-quarter of all researchersAt the last count, there were 32,779 researchers (full-time equivalent) working for companies controlled by foreign multinationals, amounting to 20% of all researchers at all businesses in France.
The share of researchers employed by foreign-owned subsidiaries reflects how R&D operations are organized in different sectors: 73% of researchers at businesses in the electronic components sector in France work for foreign subsidiaries (6,108 researchers), as do 59% of researchers in the medical irradiation equipment sector, 52% in the basic metals industry, 43% in the manufacture of machinery and equipment, 34% in the manufacture of food and beverages, and 30% in the chemical industry.
CONTRIBUTION TOREGIONAL WEALTH
Foreign-owned multinationals generated 35% of all revenues in the Alsace region, 25% in Ile de France (Paris region), 24% in Picardie, 21% in Haute-Normandie, and 20% in Rhône-Alpes and Lorraine.
The contribution made by foreign businesses varies by sector. In the manufacturing industry, foreign-owned subsidiaries were predominant in the Alsace region (54%), while more than one-third of regional revenues in this sector were generated by foreign-owned multinationals in Lorraine (45%), Haute-Normandie (37%), Nord-Pas de Calais (40%), and Rhône-Alpes (34%).
FOREIGN SUBSIDIARIES ACTIVELY CONTRIBUTING TO R&D
In 2015, 21% of all business enterprise R&D expenditure (BERD) in France was made by businesses controlled by foreign multinationals, amounting to a total of €6.5 billion.
Three sectors accounted for 39% of overall expenditure by foreign-owned businesses: electronic components (€1.2 billion, amounting to 17% of foreign BERD expenditure), the automotive industry (€805 million, 12%) and the pharmaceutical industry (€622 million, 10%).
The contribution to R&D expenditure from foreign- owned subsidiaries was particularly evident in sectors such as: electronic components (76% of total BERD expenditure); manufacture of medical irradiation equipment (61%); manufacture of basic metals (58%); manufacture of machinery and equipment (50%); manufacture of food and beverages (37%); and manufacture of textiles and clothing (36%).
Three-quarters of foreign R&D investment is EuropeanEuropean businesses generated three-quarters of all foreign R&D investment in France. Switzerland (€1.2 billion) and Germany (€897 million) were the main European contributors to business enterprise R&D expenditure in France, while the United States (€1.3 billion) made 19% of all R&D investments by foreign businesses in the country.
Graph1. Chap3
Chiffre d’affaires
0 5 10 15 20
Valeur ajoutée
Investissement
Nombre d’entreprises
Nombre de personnesemployées
21,3
16,5
12,7
11,2
1
États-Unis
Allemagne
Grande-Bretagne
Pays-Bas
Suisse
Belgique
Luxembourg
Suède
Italie
Espagne
Japon
Danemark
Irlande
Canada
Hong-Kong
Autriche
Afrique du Sud
Finlande
Chine
Portugal
0 50 000 100 000 200 000150 000 250 000 300 000 350 000
En %
%
%
50
40
30
20
10
0
En %
Industrie Commerce,réparation
d'automobile
Services auxentreprises
Transports etentreposage
Hébergement etrestauration
Construction AutresInformation et communication
80
70
60
50
40
30
20
10
0
80
70
60
50
40
30
20
10
0
Electr
onic
comp
onen
ts
Medic
al irr
adiat
ion eq
uipm
ent
Mach
inery,
equip
men
t
Othe
r man
ufac
turin
g
Woo
d, pa
per, p
rintin
g
Meta
l pro
ducts
Phar
mac
eutic
al ind
ustry
Othe
r non
-met
allic
mine
ral p
rodu
cts
Auto
mot
ive in
dustr
y
Electr
ical e
quipm
ent
Agric
ultur
e, fo
restr
y, fis
hing
Ships
/boa
ts,
rail l
ocom
otive
s/roll
ing st
ock
Publi
shing
, bro
adca
sting
Wat
er su
pply,
rem
ediat
ion
Prof
essio
nal, s
cient
ific,
tech
nical
occu
patio
ns
IT, co
mpu
ter s
ervic
es
Text
iles,
cloth
ing,
leath
er, fo
otwe
ar
Basic
met
als
Food
, bev
erag
es
Chem
ical in
dustr
y
Electr
onic
comp
onen
ts
Medic
al irr
adiat
ion eq
uipm
ent
Othe
r man
ufac
turin
g
Mach
inery,
equip
men
t
Text
iles,
cloth
ing, le
athe
r, foo
twea
r
Meta
l pro
ducts
Rubb
er an
d plas
tic pr
oduc
ts
Auto
mot
ive in
dustr
y
Woo
d, pa
per, p
rintin
g
Electr
ical e
quipm
ent
Othe
r non
-met
allic
mine
ral p
rodu
cts
IT, co
mpu
ter s
ervic
esMe
asur
ing, t
estin
g, na
vig. in
st.;
watch
es/cl
ocks
Finan
cial s
ervic
es, in
sura
nce
Prof
essio
nal, s
cient
ific,
tech
nical
occu
patio
ns
Phar
mac
eutic
al ind
ustry
Food
, bev
erag
es
Basic
met
als
Othe
r ser
vices
Chem
ical in
dustr
y
Fig. 30 CONTRIBUTION OF FOREIGN-OWNED SUBSIDIARIES TO R&D EXPENDITURE IN FRANCE BY SECTOR (TOP 20)
Source: French Ministry for Higher Education, Research and Innovation
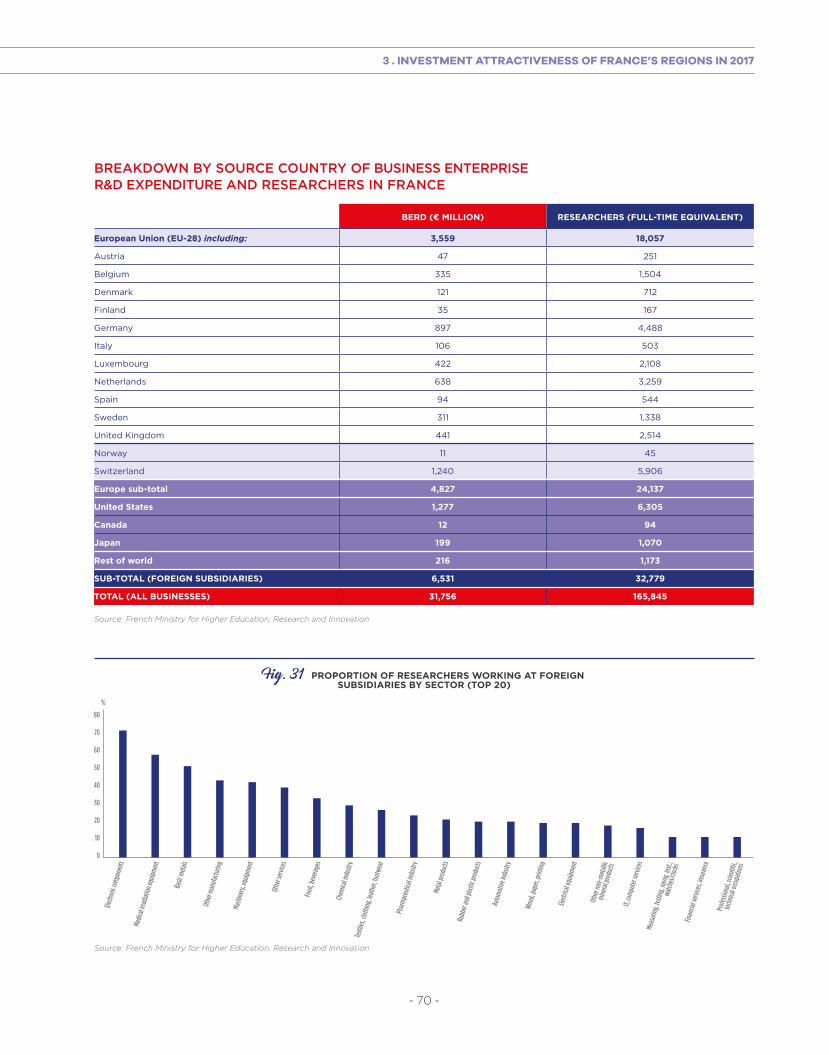
- 70 -
3 . INVESTMENT ATTRACTIVENESS OF FRANCE’S REGIONS IN 2017
Graph1. Chap3
Chiffre d’affaires
0 5 10 15 20
Valeur ajoutée
Investissement
Nombre d’entreprises
Nombre de personnesemployées
21,3
16,5
12,7
11,2
1
États-Unis
Allemagne
Grande-Bretagne
Pays-Bas
Suisse
Belgique
Luxembourg
Suède
Italie
Espagne
Japon
Danemark
Irlande
Canada
Hong-Kong
Autriche
Afrique du Sud
Finlande
Chine
Portugal
0 50 000 100 000 200 000150 000 250 000 300 000 350 000
En %
%
%
50
40
30
20
10
0
En %
Industrie Commerce,réparation
d'automobile
Services auxentreprises
Transports etentreposage
Hébergement etrestauration
Construction AutresInformation et communication
80
70
60
50
40
30
20
10
0
80
70
60
50
40
30
20
10
0
Electr
onic
comp
onen
ts
Medic
al irr
adiat
ion eq
uipm
ent
Mach
inery,
equip
men
t
Othe
r man
ufac
turin
g
Woo
d, pa
per, p
rintin
g
Meta
l pro
ducts
Phar
mac
eutic
al ind
ustry
Othe
r non
-met
allic
mine
ral p
rodu
cts
Auto
mot
ive in
dustr
y
Electr
ical e
quipm
ent
Agric
ultur
e, fo
restr
y, fis
hing
Ships
/boa
ts,
rail l
ocom
otive
s/roll
ing st
ock
Publi
shing
, bro
adca
sting
Wat
er su
pply,
rem
ediat
ion
Prof
essio
nal, s
cient
ific,
tech
nical
occu
patio
ns
IT, co
mpu
ter s
ervic
es
Text
iles,
cloth
ing,
leath
er, fo
otwe
ar
Basic
met
als
Food
, bev
erag
es
Chem
ical in
dustr
y
Electr
onic
comp
onen
ts
Medic
al irr
adiat
ion eq
uipm
ent
Othe
r man
ufac
turin
g
Mach
inery,
equip
men
t
Text
iles,
cloth
ing, le
athe
r, foo
twea
r
Meta
l pro
ducts
Rubb
er an
d plas
tic pr
oduc
ts
Auto
mot
ive in
dustr
y
Woo
d, pa
per, p
rintin
g
Electr
ical e
quipm
ent
Othe
r non
-met
allic
mine
ral p
rodu
cts
IT, co
mpu
ter s
ervic
esMe
asur
ing, t
estin
g, na
vig. in
st.;
watch
es/cl
ocks
Finan
cial s
ervic
es, in
sura
nce
Prof
essio
nal, s
cient
ific,
tech
nical
occu
patio
ns
Phar
mac
eutic
al ind
ustry
Food
, bev
erag
es
Basic
met
als
Othe
r ser
vices
Chem
ical in
dustr
y
Fig. 31 PROPORTION OF RESEARCHERS WORKING AT FOREIGN SUBSIDIARIES BY SECTOR (TOP 20)
Source: French Ministry for Higher Education, Research and Innovation
BREAKDOWN BY SOURCE COUNTRY OF BUSINESS ENTERPRISE R&D EXPENDITURE AND RESEARCHERS IN FRANCE
BERD (€ MILLION) RESEARCHERS (FULL-TIME EQUIVALENT)
European Union (EU-28) including: 3,559 18,057
Austria 47 251
Belgium 335 1,504
Denmark 121 712
Finland 35 167
Germany 897 4,488
Italy 106 503
Luxembourg 422 2,108
Netherlands 638 3,259
Spain 94 544
Sweden 311 1,338
United Kingdom 441 2,514
Norway 11 45
Switzerland 1,240 5,906
Europe sub-total 4,827 24,137
United States 1,277 6,305
Canada 12 94
Japan 199 1,070
Rest of world 216 1,173
SUB-TOTAL (FOREIGN SUBSIDIARIES) 6,531 32,779
TOTAL (ALL BUSINESSES) 31,756 165,845
Source: French Ministry for Higher Education, Research and Innovation
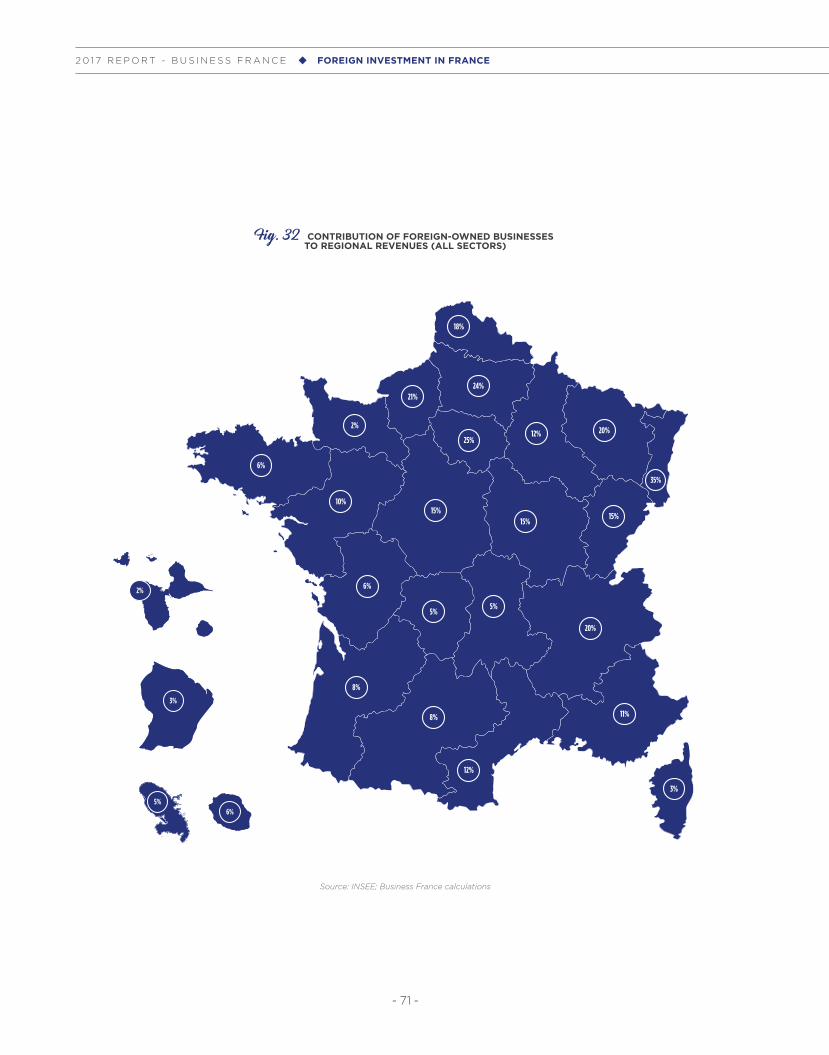
- 71 -
2 0 1 7 R E P O R T - B U S I N E S S F R A N C E FOREIGN INVESTMENT IN FRANCE
2%
6%
5%5%
8%
8%
2% 3% 5%6%
3%
6%
11%
12%
10%15%
15%15%
12%
18%
21%
20%
35%
24%
25%
20%
2%
6%
5%5%
8%
8%
2% 3% 5%6%
3%
6%
11%
12%
10%15%
15%15%
12%
18%
21%
20%
35%
24%
25%
20%
2%
6%
5%5%
8%
8%
2% 3% 5%6%
3%
6%
11%
12%
10%15%
15%15%
12%
18%
21%
20%
35%
24%
25%
20%
2%
6%
5%5%
8%
8%
2% 3% 5%6%
3%
6%
11%
12%
10%15%
15%15%
12%
18%
21%
20%
35%
24%
25%
20%
Fig. 32 CONTRIBUTION OF FOREIGN-OWNED BUSINESSES TO REGIONAL REVENUES (ALL SECTORS)
Source: INSEE; Business France calculations
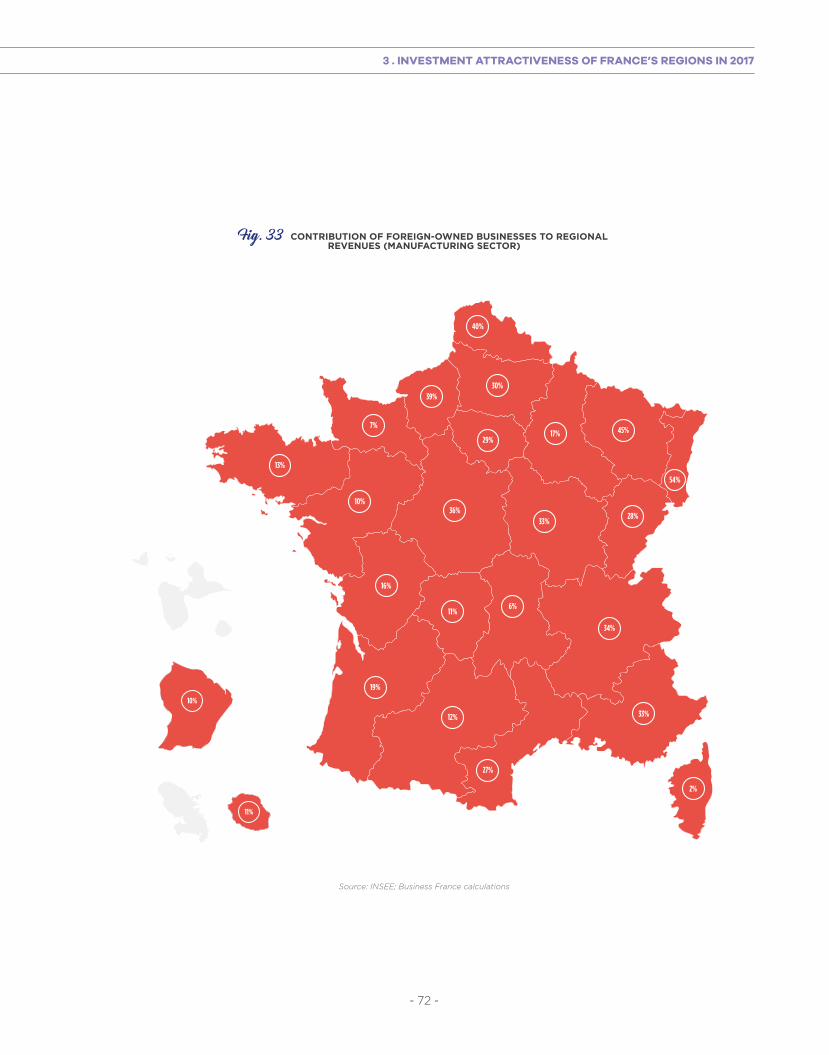
- 72 -
3 . INVESTMENT ATTRACTIVENESS OF FRANCE’S REGIONS IN 2017
7%
13%
6%11%
12%
19%
10%11%
2%
16%
33%
27%
10%36%
33%28%
17%
40%
39%
45%
54%
30%
29%
34%
7%
13%
6%11%
12%
19%
10%11%
2%
16%
33%
27%
10%36%
33%28%
17%
40%
39%
45%
54%
30%
29%
34%
7%
13%
6%11%
12%
19%
10%11%
2%
16%
33%
27%
10%36%
33%28%
17%
40%
39%
45%
54%
30%
29%
34%
7%
13%
6%11%
12%
19%
10%11%
2%
16%
33%
27%
10%36%
33%28%
17%
40%
39%
45%
54%
30%
29%
34%
Fig. 33 CONTRIBUTION OF FOREIGN-OWNED BUSINESSES TO REGIONAL REVENUES (MANUFACTURING SECTOR)
Source: INSEE; Business France calculations
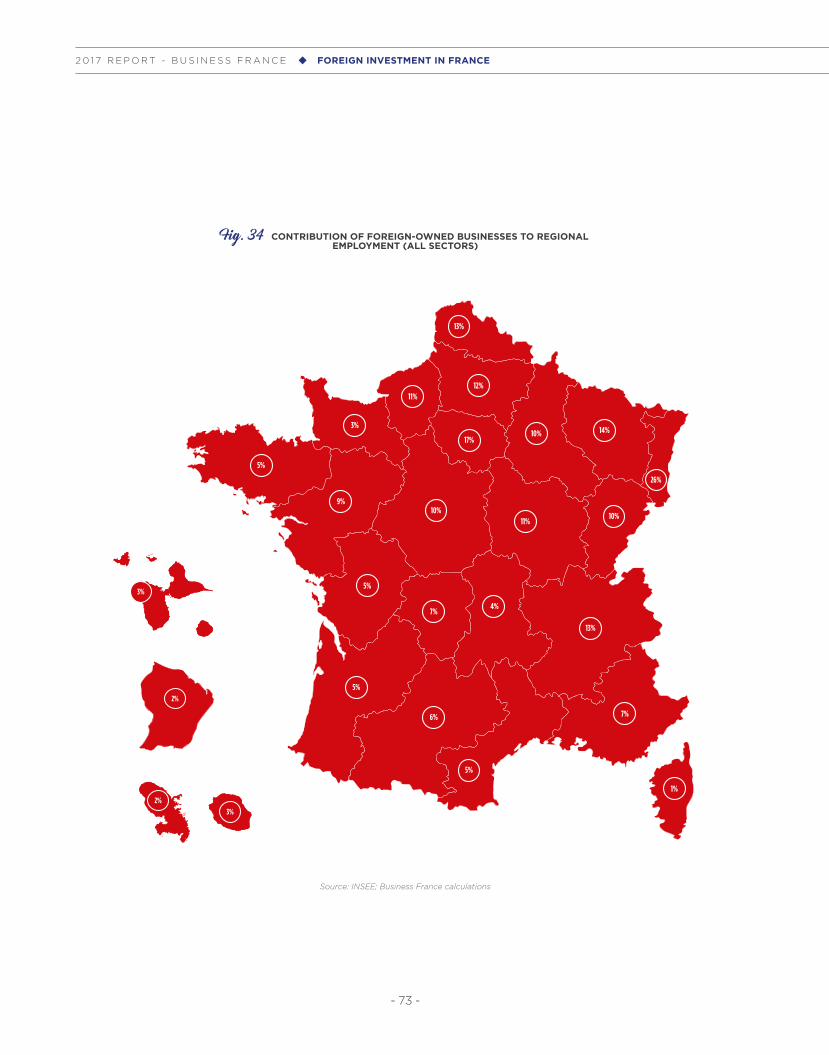
- 73 -
2 0 1 7 R E P O R T - B U S I N E S S F R A N C E FOREIGN INVESTMENT IN FRANCE
Fig. 34 CONTRIBUTION OF FOREIGN-OWNED BUSINESSES TO REGIONAL EMPLOYMENT (ALL SECTORS)
Source: INSEE; Business France calculations
3%
5%
4%7%
6%
5%
3%
1%
2%2%3%
5%
7%
5%
9%10%
11%10%
10%
13%
11%
14%
26%
12%
17%
13%
3%
5%
4%7%
6%
5%
3%
1%
2%2%3%
5%
7%
5%
9%10%
11%10%
10%
13%
11%
14%
26%
12%
17%
13%
3%
5%
4%7%
6%
5%
3%
1%
2%2%3%
5%
7%
5%
9%10%
11%10%
10%
13%
11%
14%
26%
12%
17%
13%
3%
5%
4%7%
6%
5%
3%
1%
2%2%3%
5%
7%
5%
9%10%
11%10%
10%
13%
11%
14%
26%
12%
17%
13%
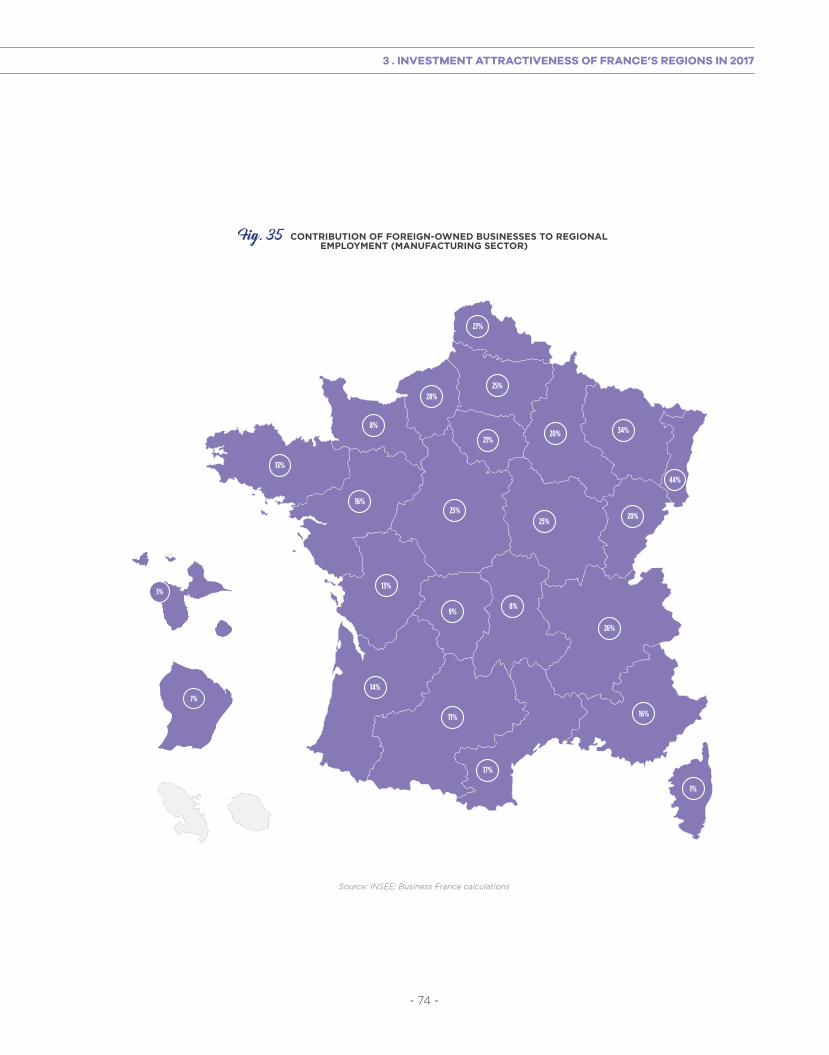
- 74 -
3 . INVESTMENT ATTRACTIVENESS OF FRANCE’S REGIONS IN 2017
Fig. 35 CONTRIBUTION OF FOREIGN-OWNED BUSINESSES TO REGIONAL EMPLOYMENT (MANUFACTURING SECTOR)
Source: INSEE; Business France calculations
8%
13%
8%9%
11%
14%
1%
7%3%
13%
16%
17%
16%25%
25%20%
20%
27%
28%
34%
44%
25%
21%
26%
8%
13%
8%9%
11%
14%
1%
7%3%
13%
16%
17%
16%25%
25%20%
20%
27%
28%
34%
44%
25%
21%
26%
8%
13%
8%9%
11%
14%
1%
7%3%
13%
16%
17%
16%25%
25%20%
20%
27%
28%
34%
44%
25%
21%
26%
8%
13%
8%9%
11%
14%
1%
7%3%
13%
16%
17%
16%25%
25%20%
20%
27%
28%
34%
44%
25%
21%
26%
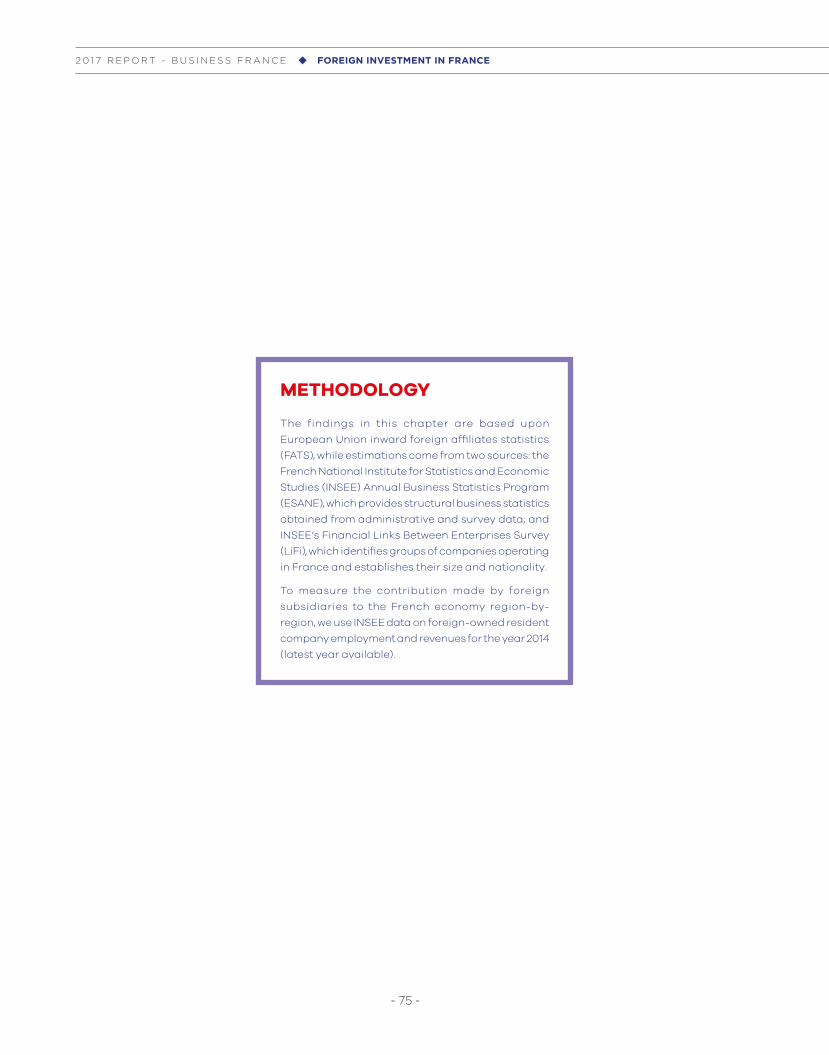
- 75 -
2 0 1 7 R E P O R T - B U S I N E S S F R A N C E FOREIGN INVESTMENT IN FRANCE
METHODOLOGY
The findings in this chapter are based upon
European Union inward foreign affiliates statistics
(FATS), while estimations come from two sources: the
French National Institute for Statistics and Economic
Studies (INSEE) Annual Business Statistics Program
(ESANE), which provides structural business statistics
obtained from administrative and survey data; and
INSEE’s Financial Links Between Enterprises Survey
(LiFi), which identifies groups of companies operating
in France and establishes their size and nationality.
To measure the contribution made by foreign
subsidiaries to the French economy region-by-
region, we use INSEE data on foreign-owned resident
company employment and revenues for the year 2014
(latest year available).
- 76 -
3 . INVESTMENT ATTRACTIVENESS OF FRANCE’S REGIONS IN 2017
A MAJOR CONTRIBUTION TO EMPLOYMENT
Although foreign-owned businesses account for only one percent of all businesses in France, they play a critical role in French regional development. For example, they account for one-quarter of all jobs in the Alsace region (26%), 17% in Ile de France (Paris region), 14% in Lorraine, and 13% in the Rhône-Alpes and Nord-Pas de Calais regions.
More than 30,000 French businesses have established themselves in foreign countries, while 28,000 foreign companies have French operations in which they have made job-creating investments.
France is a preferred location for inward investment, ranking ninth in the world for FDI flows (UNCTAD, 2018), after the United States, China (including Hong Kong), the Netherlands, Ireland, Australia, Brazil, and Singapore.
The French economy is very open to foreign investment.Data from the French National Institute for Statistics and Economic Studies (INSEE) states that foreign subsidiaries:/ Provide jobs for 11% of the workforce in France
/ Generate 21% of all revenues in France/ Carry out 13% of investments by businesses
44.5% of the equity of companies listed on the CAC 40 is owned by foreign investors. (Banque de France, September 2017)
Foreign subsidiaries in France account for 21% of all business enterprise R&D expenditure (BERD) in France. (French Ministries for Primary & Secondary Education / Higher Education, Research and Innovation, 2017)
Twenty-nine of the world’s top 500 companies are French, while 29 are German and 24 are British. (Fortune Global 500, 2017)
The open nature of the French economy
The contribution of foreign-owned companies is particularly significant in manufacturing, where 21% of all jobs in the sector are provided by these companies. Their contribution is higher than the national average in Alsace (44%), Lorraine (34%), Haute-Normandie (28%), Nord-Pas de Calais (27%), Rhône-Alpes (26%), and Picardie (25%).

4

Appendices78 JOB-CREATING PHYSICAL INVESTMENT
SELECTION CRITERIA
82 BUSINESS FRANCE
- 79 -
2 0 1 7 R E P O R T - B U S I N E S S F R A N C E FOREIGN INVESTMENT IN FRANCE
JOB-CREATING PHYSICAL INVESTMENT
SELECTION CRITERIA
Established in 1993 in partnership with France’s regional economic development agencies, the Annual Report provides a summary of all foreign investment projects creating sustainable employment in France, listing confirmed projects and detailing the number of jobs that each project generates.
It provides detailed statistical analysis by business sector, business activity, investment type, source country and host region. Data concerning the amounts involved in specific investment projects are not always made available by companies, and so form no part of the analysis.
COMPANY NATIONALITY
Initial analysis of company nationality depends on the location of its registered office, which determines the jurisdiction that applies. This principle is refined
by the notion of a company’s genuine registered office under French law, which is established through jurisprudence. This concept involves determining the place where, inter alia, meetings of the company’s management bodies are held, strategic decisions are taken, and key contracts are signed.
Accordingly, and in line with European Union guidelines, the French National Institute for Statistics and Economic Studies (INSEE) considers that the controlling country of a multinational corporation is defined by the country in which the entity possessing operational control is established and where financial information concerning all of its subsidiaries is usually consolidated.
The Annual Report on Foreign Investment in France is a way
of analyzing foreign investment projects and their contribution
to the French economy
- 80 -
4 . APPENDICES
For certain firms, this entity may not necessarily correspond to the head of the group or parent company. Under this definition, the nationality of the firm’s leading shareholders has no bearing on that which is assigned to the firm as a whole.
The initial analysis is refined by the notion of control over the activities of the firm’s subsidiaries. The statistical criterion chosen for data collection is majority control (ownership of more than 50% of the firm’s shares with voting rights). It is assumed that share ownership of more than 50% confers genuine control over the firm, even though in certain cases control may be exercised with less than this amount.
JOB NUMBERS
The Annual Report is based on the publicly announced number of jobs to be created or maintained over the next three years, which is the approximate time frame that companies use when planning investments.
DATA GATHERING AND VALIDATION
Three methods are used to select the projects in the Annual Report:
/ An analysis of the competitive environment by consulting observatories of globally mobile investment that track public announcements of job-creating foreign investments in France and Europe.
/ Projects detected by Business France, primarily through its network of international offices.
/ Data collected by France’s regional economic development agencies for their areas through contact with economic stakeholders and foreign investors.
Based on these sources, the Annual Report is compiled using a cross-validation process of each identified project between Business France, France’s regional economic development agencies and other regional partners.
PROJECT COMPLETION RATE
Reports and rankings published by investment promotion agencies provide a list of investment decisions (or public announcements for some consultants). Business France conducted a retrospective study in 2010 of projects in the 2007 Annual Report to analyze the impact of challenging economic conditions on the project completion rate. In the study sample (320 projects), almost 90% of the decisions recorded in 2007 had been executed. The completion rate for takeovers of ailing companies was 98%.
Concurrently, the study showed that the distinction of being foreign did not protect companies investing in France against the risks inherent in starting a business and the economic climate. As such, 20% of the investment projects reported in 2007 experienced problems, and in some cases ceased trading altogether.
DISPARITIES BETWEEN THE DATA PUBLISHED BY BUSINESS FRANCE, FDI MARKETS AND EY
The way in which information is recorded in the Annual Report makes it a uniquely reliable database offering unrivalled coverage of recorded investments compared with publications by private consulting firms, such as IBM/PLI, fDi Markets and EY.
Differences in scope and calculation methods – such as the exclusion of retail outlets, the hotel sector, takeovers of ailing sites and expansions following takeovers – offer a partial explanation of the significant disparities observed between these different data sets.
However, beyond such methodological differences, most disparities arise from the fact that numerous investment projects receive no coverage by way of a press article or press release. These projects therefore remain undetected by the business intelligence tools used by private consulting firms. However, Business France has access to this information through data shared by its overseas offices and partners in France’s regions.
- 81 -
2 0 1 7 R E P O R T - B U S I N E S S F R A N C E FOREIGN INVESTMENT IN FRANCE
INVESTMENT TYPES RECORDED IN THE 2017 ANNUAL REPORT
/ Creations1: Jobs created at a new site.
/ Expansions: Jobs created at a site already occupied by the company.
/ Takeovers of ailing French companies2: Jobs maintained following the takeover by a foreign investor of an ailing company resident in France. The company’s difficulties must be proven by either:
- Ongoing bankruptcy or reorganization proceedings brought before the Commercial Court.
- Financial difficulties with the tax and social security collection authorities.
- Short-term risk of site closure (i.e. no successor).
/ Expansions following takeovers: Jobs created or maintained by an expansion following the takeover by a foreign investor of an ailing company resident in France.
/ Expansions following buyouts: Jobs created following the takeover by a foreign investor of a company resident in France with no financial difficulties. The only jobs counted in the Annual Report are those arising from the expansion.
/ Facility upgrades / safeguarding investments: Industrial projects that increase or preserve production capacity at a site and save jobs that might otherwise ultimately have been lost.
1 At regional level, site creations by any firm in any sector are only counted if they do not involve net job destruction.
2 Takeovers of ailing sites may result in regroupings or site transfers. The Annual Report records the jobs maintained by these transfers.
CLASSIFICATIONS USED IN THE ANNUAL REPORT
The classifications used are designed to reflect the characteristics of the international investment market
The classification by business sector is based on a 26-item classification compatible with that used by the French National Institute for Statistics and Economic Studies INSEE (NAF 700, revision 2), but which has been adapted to the specificities of the international investment market.
Projects are categorized according to the type of goods or services that they contribute to designing, producing or distributing. These classifications evolve over time to take new market trends into account.
Classification by business sector/ Aerospace, naval and railway equipment/ Agri-food, agriculture and fishing/ Automotive industry/ Chemicals, plastics/ Commerce and retail/ Construction, building materials/ Consulting, engineering and business services/ Consumer electronics/ Education and training/ Electrical, electronic, IT equipment/ Electronic components/ Energy, recycling, other concessions/ Financial services, banking and insurance/ Furnishings, household goods/ Glass, ceramics, minerals, wood, paper/ Hotels, tourism and restaurants/ Machinery and mechanical equipment/ Media, publishing/ Medical/surgical equipment and devices/ Metals, metalworking/ Other services/ Perfumes, cosmetics/ Pharmaceuticals and biotechnologies/ Software and IT services/ Telecoms, internet service providers/ Textiles, industrial textiles, clothing and accessories/ Transport, storage
Project business activityIn order to operate effectively, companies rely on various types of business activity.
Aside from production/manufacturing are tertiary activities such as business services and consumer services, logistics, retail outlets, headquarters, decision-making centers, and R&D, engineering and design. A specific index is used in the report to categorize projects by the business activity they fulfill.
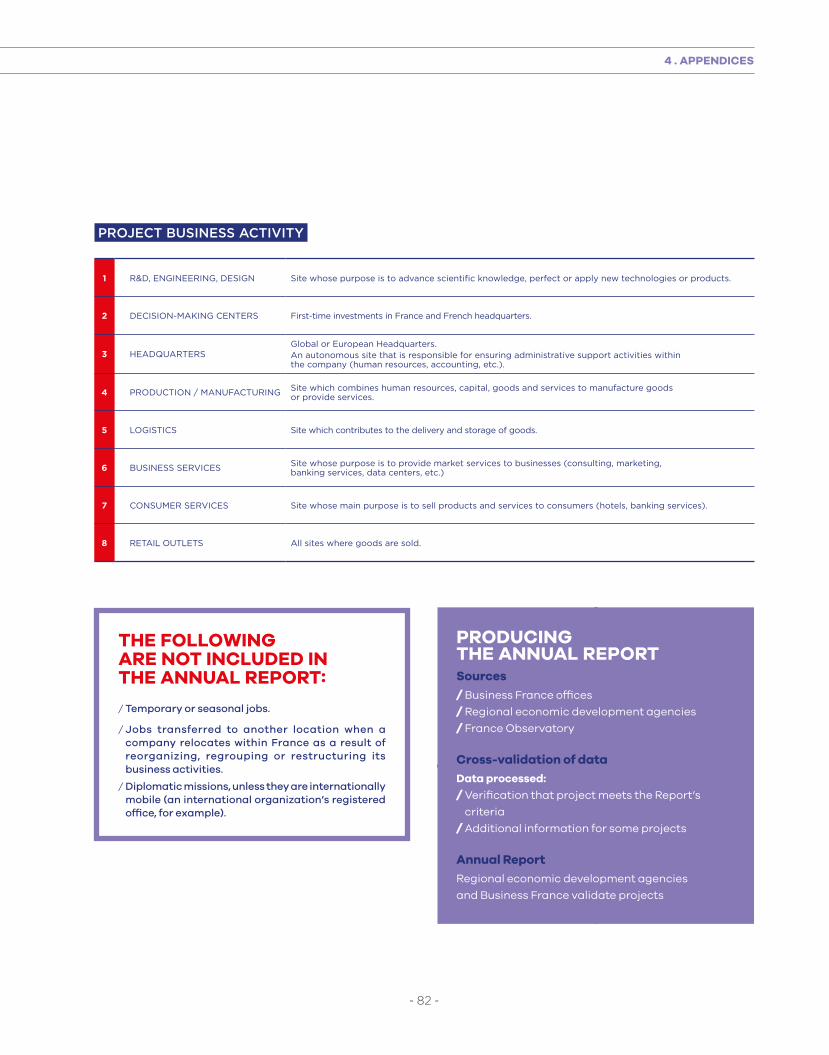
- 82 -
4 . APPENDICES
PRODUCING THE ANNUAL REPORTSources/ Business France offices
/ Regional economic development agencies
/ France Observatory
Cross-validation of dataData processed:
/ Verification that project meets the Report’s
criteria
/ Additional information for some projects
Annual ReportRegional economic development agencies
and Business France validate projects
THE FOLLOWING ARE NOT INCLUDED IN THE ANNUAL REPORT:
/ Temporary or seasonal jobs.
/ Jobs transferred to another location when a company relocates within France as a result of reorganizing, regrouping or restructuring its business activities.
/ Diplomatic missions, unless they are internationally mobile (an international organization’s registered office, for example).
PROJECT BUSINESS ACTIVITY
1 R&D, ENGINEERING, DESIGN Site whose purpose is to advance scientific knowledge, perfect or apply new technologies or products.
2 DECISION-MAKING CENTERS First-time investments in France and French headquarters.
3 HEADQUARTERSGlobal or European Headquarters.An autonomous site that is responsible for ensuring administrative support activities within the company (human resources, accounting, etc.).
4 PRODUCTION / MANUFACTURING Site which combines human resources, capital, goods and services to manufacture goods or provide services.
5 LOGISTICS Site which contributes to the delivery and storage of goods.
6 BUSINESS SERVICES Site whose purpose is to provide market services to businesses (consulting, marketing, banking services, data centers, etc.)
7 CONSUMER SERVICES Site whose main purpose is to sell products and services to consumers (hotels, banking services).
8 RETAIL OUTLETS All sites where goods are sold.
- 83 -
2 0 1 7 R E P O R T - B U S I N E S S F R A N C E FOREIGN INVESTMENT IN FRANCE
BUSINESS FRANCE
Business France supports the international development of the French economy, advancing and promoting business throughout France, and by French companies abroad.
It is a key player in fostering competitiveness, growth and employment in France, offering clear and efficient access to all corporate development stakeholders and services for all companies, irrespective of their size, sector and nationality.
From exports to investments through to multinational partnerships, from identifying contacts and making connections to providing peace of mind, Business France supports French and multinational companies throughout the lifetime of their projects, and is driven by an efficient, result-oriented working culture.
Thanks to its extensive network and dynamic team of 1,500 professionals, both in France and in 70 countries throughout the world, Business France is involved not only in getting projects off the ground but also in following up and ensuring their long-term success.
With specialisms in different areas of expertise and business sectors, Business France personnel are highly committed and passionate about their work, serving not only individual companies but France as a whole.
OUR MISSIONS
/ Supporting the international development of businesses set up in France – mid-size companies and SMEs in particular – and their exports to foreign markets.
/ Promoting and facilitating foreign investment in France.
/ Promoting France’s companies, business image and nationwide attractiveness as an investment location.
/ Running, promoting and developing the VIE international internship program, thereby enhancing the training received by young French professionals through international experience.
Connect – Fast-Track – Succeed
" Founded to serve companies and the nation as a whole, Business France sends out a loud, clear message about the open nature of the French economy. Our agency operates where it counts, pulling out all the stops for businesses to grow and succeed, both in France and abroad.”
- 84 -
4 . APPENDICES
OUR COMMITMENT
Being able to count on the people supporting and guiding you on the ground to bring your plans to fruition is key to the success of any project. This is the role played by Business France, whose personnel will do all they can to help make your ideas reality.
Business France provides end-to-end support and can stand by you every step of the way, offering legal and tax advice, help with administrative formalities, and guidance in choosing a market or investment location.Business France and its partners have a wide array of resources at their disposal. We can provide you with a dedicated team to harness all the necessary expertise and solutions to build your international projects stage by stage and oversee their development in the long term.
Standing firmly by your side, Business France’s comprehensive network, spanning 70 of the world’s largest countries, can get to the heart of your requirements. You can also depend on a focused personal contact among the personnel who staff Business France’s 92 offices worldwide.
OUR PRIORITY
Simplifying and fast-tracking project deliveryBusiness France offers a holistic approach to your international business project, from decision-making and market analysis to successful completion.
We can provide advice in line with your project’s strategic, sector-based and human specificities.
Business France is ready to be your partner of choice, an interface for all the data you need to deliver your project.
From the moment you first make contact, you can ask Business France to serve as your single port of call.
Calling upon Business France gives you access to:/ The number-one provider of customized services for
French and foreign businesses, supporting them and the success of their international projects from start to finish.
/ Objective and detailed market analysis, macroeconomic analysis, benchmarks, observatories, maps, etc. We provide you with all the tools you need to make the best choice.
/ Support and expertise from a partner network of international development experts and a fully-fledged community of stakeholders, including chambers of commerce in France and abroad, Bpifrance, Coface and France’s foreign trade advisors (CCEF), as well as banks, auditing firms, expert consultants, transport companies, lawyers, etc.
OUR VALUES:
/ Proximity/ Efficiency/ Pride
The export overviews were written with assistance from the French Treasury Directorate (DG Trésor), which advises on and oversees French economic policy under the authority of the Minister for the Economy and Finance. It also promotes French policy in Europe and throughout the world.
The Treasury Directorate lends its expertise in matters relating to forecasting and consulting, regulation, international negotiations, developmental aid, export assistance and foreign investment. It oversees the French government’s accounts and debt management through the French Treasury Agency (Agence France Trésor – AFT) and monitors government shareholder interests through the Government Shareholding Agency (Agence des participations de l’État – APE).
For further information, please visit:www.economie.gouv.fr
Export overviews
Publication Director: Christophe Lecourtier (CEO)Chief Editor: Sylvie Montout (Chief Economist)Contributors: Yasmine Galloul, Yann Letessier, Romain Guillard (Economists)Translation: David Williams, Peter Stewart (English Language Editors)Editorial coordination: Mélanie Cornière (Editorial Project Manager); Priscille Troyan-Gulli (Brand & Image Team Leader)Design and layout: Hopscotch – March 2018
Printed in France by IPP Imprimeur
Business France is the national agency supporting the internationaldevelopment of the French economy, responsible for fostering export growth by French businesses, as well as promoting and facilitating international investment in France.
It promotes France’s companies, business image and nationwide attractivenessas an investment location, and also runs the VIE international internship program.
Business France has 1,500 personnel, both in France and in 64 countries throughout the world, who work with a network of public- and private-sector partners.
CONNECT – FAST-TRACK – SUCCEED
For further information, please visit: www.businessfrance.fr
Business France
77, boulevard Saint-Jacques
75680 Paris Cedex 14
Tel.: +33 1 40 73 30 00
Exports
2017
The internationaldevelopment of
the French economy
Exports
2017
4-52017 SUMMARY
Con
ten
ts 1Introduction
8GLOBAL TRADE
2French exports
14
4French
exporters
44OVERVIEW OF FRENCH
EXPORTERS
48FRENCH STARTUPS
GOING GLOBAL
3France’s place
in the world
24GLOBAL VALUE CHAINS
AND VALUE ADDED
28FRANCE’S EXPORT
PERFORMANCES
32SECTOR-SPECIFIC SPECIALIZATION
35FRANCE: A GATEWAY
TO EUROPEAN AND AFRICAN MARKETS
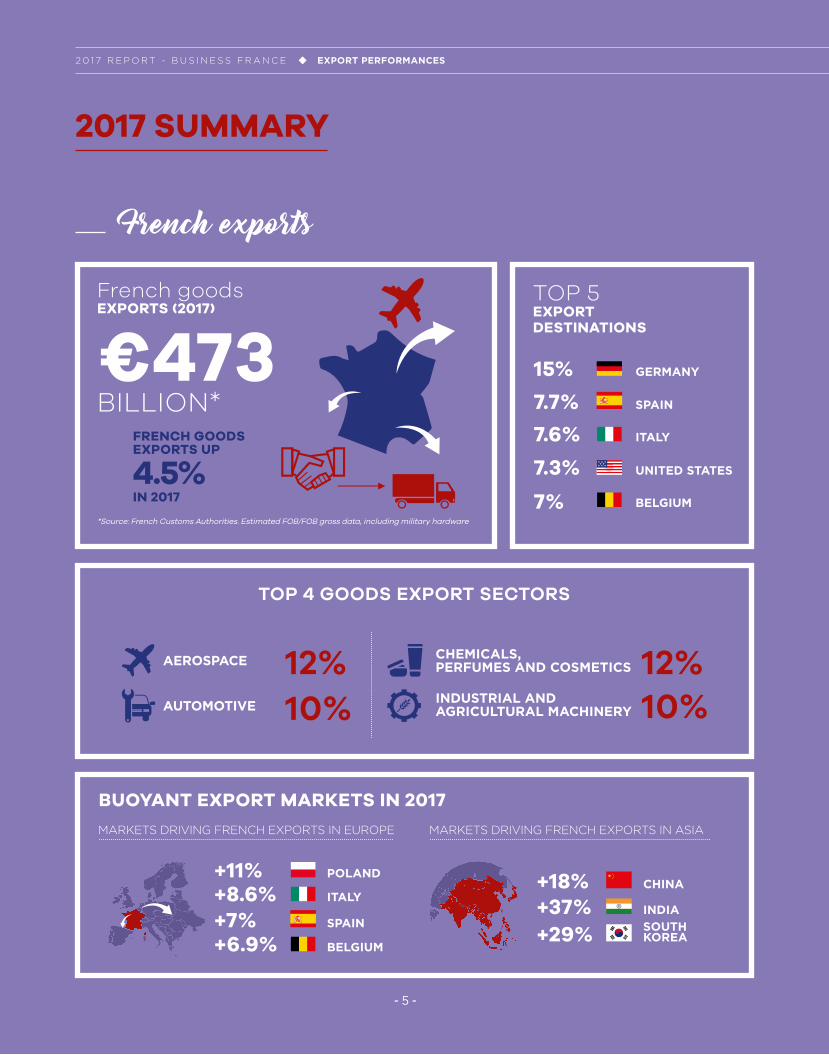
- 5 -
French exports
2017 SUMMARY
TOP 5 EXPORTDESTINATIONS
*Source: French Customs Authorities. Estimated FOB/FOB gross data, including military hardware
BILLION*€473
ITALY
UNITED STATES
SPAIN
SPAIN SOUTH KOREA
POLANDCHINA
+7%+29%
+11%
+37%
BELGIUM
GERMANY
MARKETS DRIVING FRENCH EXPORTS IN EUROPE MARKETS DRIVING FRENCH EXPORTS IN ASIA
7.6%
7.3%
7.7%
7%
15%
French goods EXPORTS (2017)
4.5%FRENCH GOODS EXPORTS UP
IN 2017
BUOYANT EXPORT MARKETS IN 2017
TOP 4 GOODS EXPORT SECTORS
12% 12%10% 10%
AEROSPACE
AUTOMOTIVE
CHEMICALS, PERFUMES AND COSMETICS
INDUSTRIAL AND AGRICULTURAL MACHINERY
BELGIUM+6.9%
+8.6%+18%
ITALYINDIA
- 5 -
2 0 1 7 R E P O R T - B U S I N E S S F R A N C E EXPORT PERFORMANCES
- 5 -
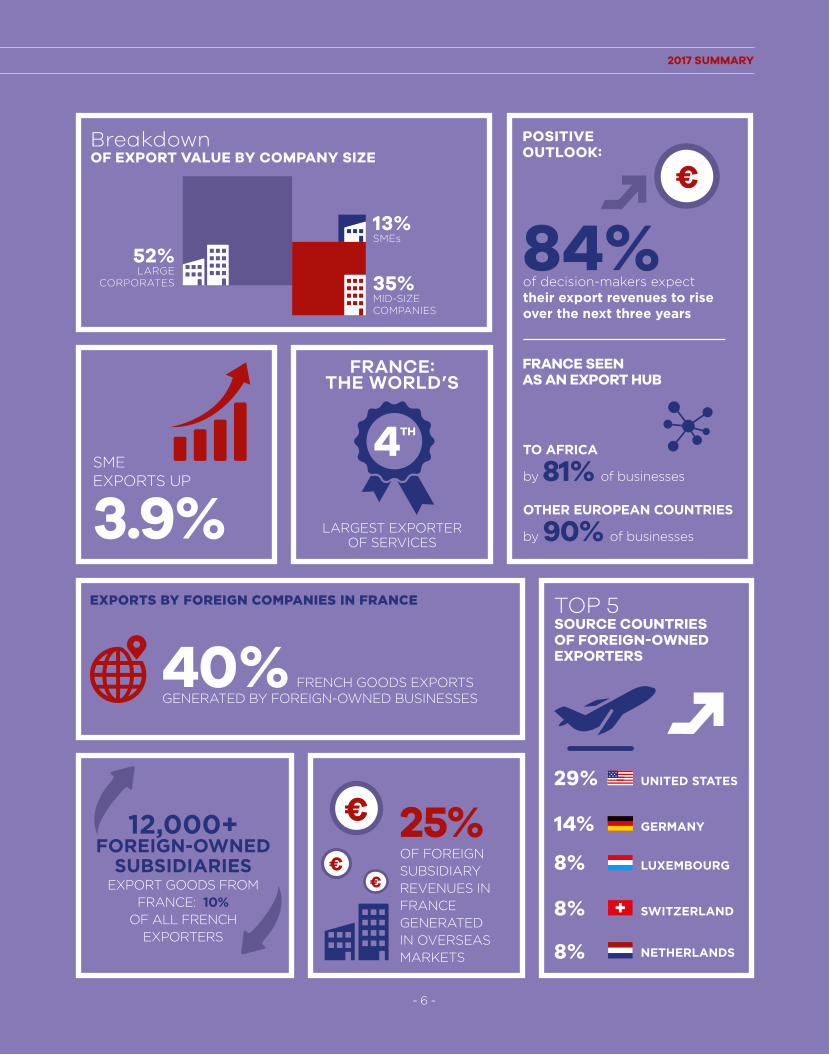
- 6 -
2017 SUMMARY
TOP 5 SOURCE COUNTRIES OF FOREIGN-OWNED EXPORTERS
52% LARGE
CORPORATES
13% SMEs
35% MID-SIZE COMPANIES
EXPORTS BY FOREIGN COMPANIES IN FRANCE
UNITED STATES 29%
GERMANY14%
LUXEMBOURG8%
NETHERLANDS8%
SWITZERLAND 8%
12,000+ FOREIGN-OWNED
SUBSIDIARIES EXPORT GOODS FROM
FRANCE: 10% OF ALL FRENCH
EXPORTERS
Breakdown OF EXPORT VALUE BY COMPANY SIZE
SME EXPORTS UP
3.9%
40 % FRENCH GOODS EXPORTS GENERATED BY FOREIGN-OWNED BUSINESSES
OF FOREIGN SUBSIDIARY REVENUES IN FRANCE GENERATED IN OVERSEAS MARKETS
25%
LARGEST EXPORTER OF SERVICES
FRANCE:THE WORLD’S
POSITIVE OUTLOOK:
€
€
€€
FRANCE SEEN AS AN EXPORT HUB
84% of decision-makers expect their export revenues to rise over the next three years
TO AFRICA
by 81% of businesses
OTHER EUROPEAN COUNTRIES
by 90% of businesses
4TH
- 6 -

1

Introduction 8 GLOBAL TRADE
- 9 -
2 0 1 7 R E P O R T - B U S I N E S S F R A N C E EXPORT PERFORMANCES
GLOBAL TRADE
The aim of this report is to provide insight into the international development of the French economy, looking not only at foreign investment, but also at exports by businesses established in France.
Today, the strategic behavior of firms in a global marketplace no longer boils down to a binary choice between exporting and making investments abroad. The large increase in intra-group trade between parent companies and foreign subsidiaries since the 1980s is symptomatic of a more complex strategic relationship.
The globalization of value chains has intensified cross-border investment and cross-border trading in parts and components, intermediate goods and finished products. In this trading structure, goods produced in one economy and exported to a different end market involve inputs from other economies, which in turn source inputs from yet other economies. The growth of trade is due mainly to this back-and-forth of intermediate goods, which cross borders several times before the finished products and services are sold to end consumers.
The economic turmoil over the past decade has affected the sector-specific composition of French exports, with a rising share of high-tech exports. French exports today are concentrated in mid-range and high-end
products, driven by aviation and pharmaceuticals. Since 2002, these two sectors have seen the largest increases in their share of national exports, rising 4.5 and 1.3 percentage points, respectively.
France is also a global leader in a number of its sectors of excellence. Consequently, French exports are most concentrated in high value-added sectors, such as transport equipment (23.2% of total export value), capital goods (19%), the chemicals industry (12.2%), and food/beverages (10.2%).
GLOBAL GROWTH ON THE RISE
According to the latest estimates from the OECD, global economic growth in 2017 coincided with a 4.8% real increase in trade flows, which continued on their rise since the first half of 2016.
The main explanations advanced for this were economic recovery in Europe – where trade volumes are relatively high – along with a sharply increasing trade in electronic goods in Asia, as well as a switch in the composition of demand towards higher business investment involving more imported goods.
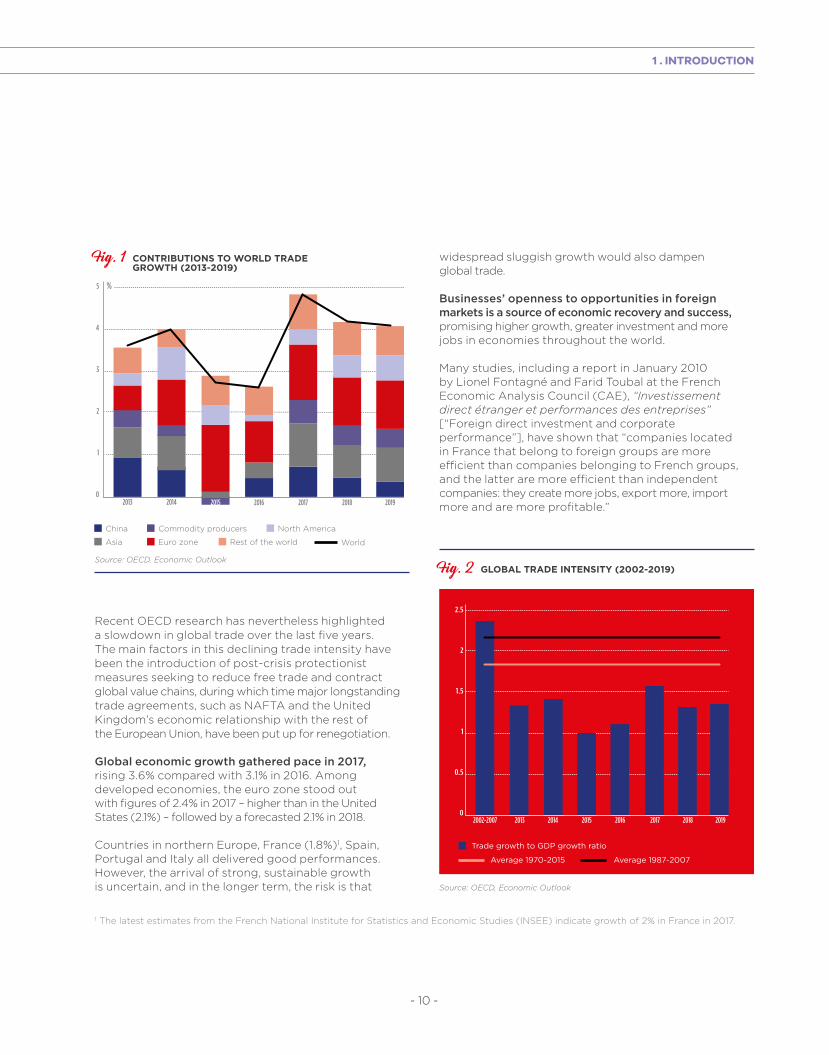
- 10 -
1 . INTRODUCTION
Fig. 1 CONTRIBUTIONS TO WORLD TRADE GROWTH (2013-2019)
Recent OECD research has nevertheless highlighted a slowdown in global trade over the last five years. The main factors in this declining trade intensity have been the introduction of post-crisis protectionist measures seeking to reduce free trade and contract global value chains, during which time major longstanding trade agreements, such as NAFTA and the United Kingdom’s economic relationship with the rest of the European Union, have been put up for renegotiation.
Global economic growth gathered pace in 2017, rising 3.6% compared with 3.1% in 2016. Among developed economies, the euro zone stood out with figures of 2.4% in 2017 – higher than in the United States (2.1%) – followed by a forecasted 2.1% in 2018.
Countries in northern Europe, France (1.8%)1, Spain, Portugal and Italy all delivered good performances. However, the arrival of strong, sustainable growth is uncertain, and in the longer term, the risk is that
0 10
0 20 40 60 80 100
20 30 40 50 60 70 80 90 100
Foreign companies
%
French companies
Exporters
Europe
Africa
Central and South-East Asia
Middle East
Latin America
Oceania
North America
2013 20152014 2018 201920172016
5
4
3
2
1
0
%
2013 2014 2015 2016 2017 2018 20192002-2007
2.5
2
1.5
1
0.5
0
%
0 10
0 20 40 60 80 100
20 30 40 50 60 70 80 90 100
Foreign companies
%
French companies
Exporters
Europe
Africa
Central and South-East Asia
Middle East
Latin America
Oceania
North America
2013 20152014 2018 201920172016
5
4
3
2
1
0
%
2013 2014 2015 2016 2017 2018 20192002-2007
2.5
2
1.5
1
0.5
0
%
Trade growth to GDP growth ratio
Average 1970-2015
Source: OECD, Economic Outlook
Source: OECD, Economic Outlook Fig. 2 GLOBAL TRADE INTENSITY (2002-2019)
widespread sluggish growth would also dampen global trade.
Businesses’ openness to opportunities in foreign markets is a source of economic recovery and success, promising higher growth, greater investment and more jobs in economies throughout the world.
Many studies, including a report in January 2010 by Lionel Fontagné and Farid Toubal at the French Economic Analysis Council (CAE), “Investissement direct étranger et performances des entreprises” [“Foreign direct investment and corporate performance”], have shown that “companies located in France that belong to foreign groups are more efficient than companies belonging to French groups, and the latter are more efficient than independent companies: they create more jobs, export more, import more and are more profitable.”
China
Asia
Commodity producers
Euro zone Rest of the world
North America
World
1 The latest estimates from the French National Institute for Statistics and Economic Studies (INSEE) indicate growth of 2% in France in 2017.
Average 1987-2007
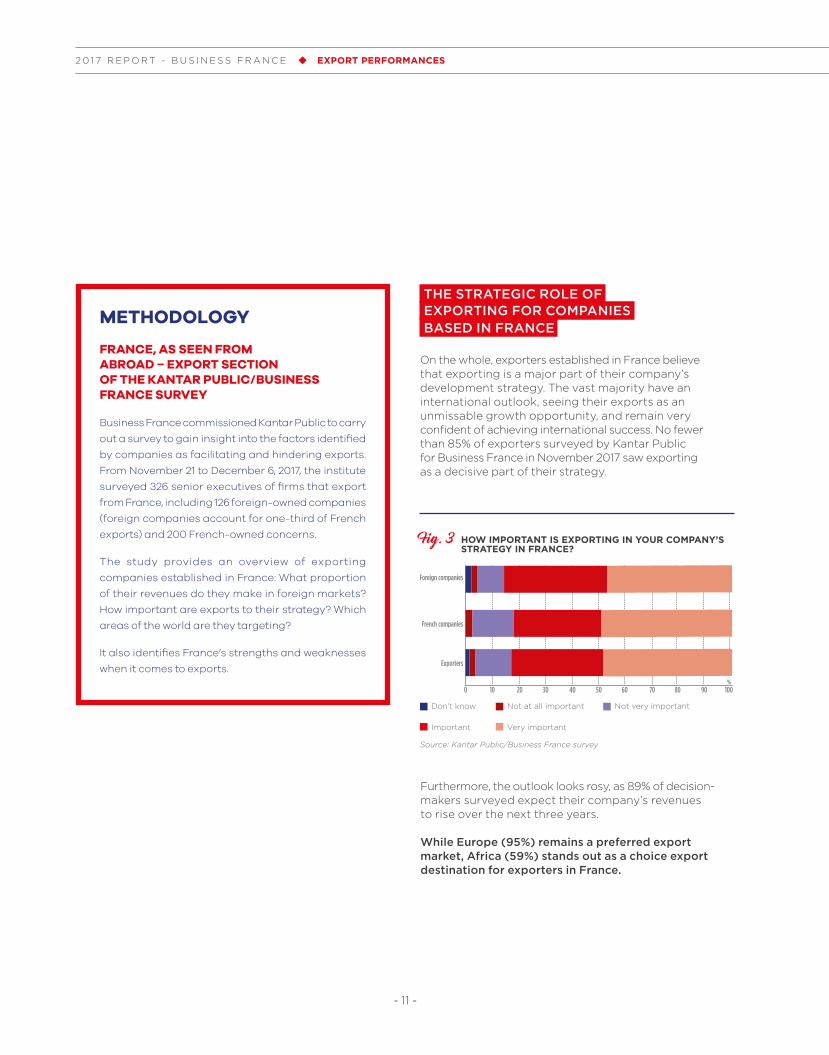
- 11 -
2 0 1 7 R E P O R T - B U S I N E S S F R A N C E EXPORT PERFORMANCES
THE STRATEGIC ROLE OF EXPORTING FOR COMPANIES BASED IN FRANCE
On the whole, exporters established in France believe that exporting is a major part of their company’s development strategy. The vast majority have an international outlook, seeing their exports as an unmissable growth opportunity, and remain very confident of achieving international success. No fewer than 85% of exporters surveyed by Kantar Public for Business France in November 2017 saw exporting as a decisive part of their strategy.
Furthermore, the outlook looks rosy, as 89% of decision-makers surveyed expect their company’s revenues to rise over the next three years.
While Europe (95%) remains a preferred export market, Africa (59%) stands out as a choice export destination for exporters in France.
0 10
0 20 40 60 80 100
20 30 40 50 60 70 80 90 100
Foreign companies
%
French companies
Exporters
Europe
Africa
Central and South-East Asia
Middle East
Latin America
Oceania
North America
2013 20152014 2018 201920172016
5
4
3
2
1
0
%
2013 2014 2015 2016 2017 2018 20192002-2007
2.5
2
1.5
1
0.5
0
%
Source: Kantar Public/Business France survey
Fig. 3 HOW IMPORTANT IS EXPORTING IN YOUR COMPANY’S STRATEGY IN FRANCE?
Don't know
Important
Not at all important
Very important
Not very important
METHODOLOGY
FRANCE, AS SEEN FROM ABROAD – EXPORT SECTION OF THE KANTAR PUBLIC/BUSINESS FRANCE SURVEY
Business France commissioned Kantar Public to carry
out a survey to gain insight into the factors identified
by companies as facilitating and hindering exports.
From November 21 to December 6, 2017, the institute
surveyed 326 senior executives of firms that export
from France, including 126 foreign-owned companies
(foreign companies account for one-third of French
exports) and 200 French-owned concerns.
The study provides an overview of exporting
companies established in France: What proportion
of their revenues do they make in foreign markets?
How important are exports to their strategy? Which
areas of the world are they targeting?
It also identifies France’s strengths and weaknesses
when it comes to exports.
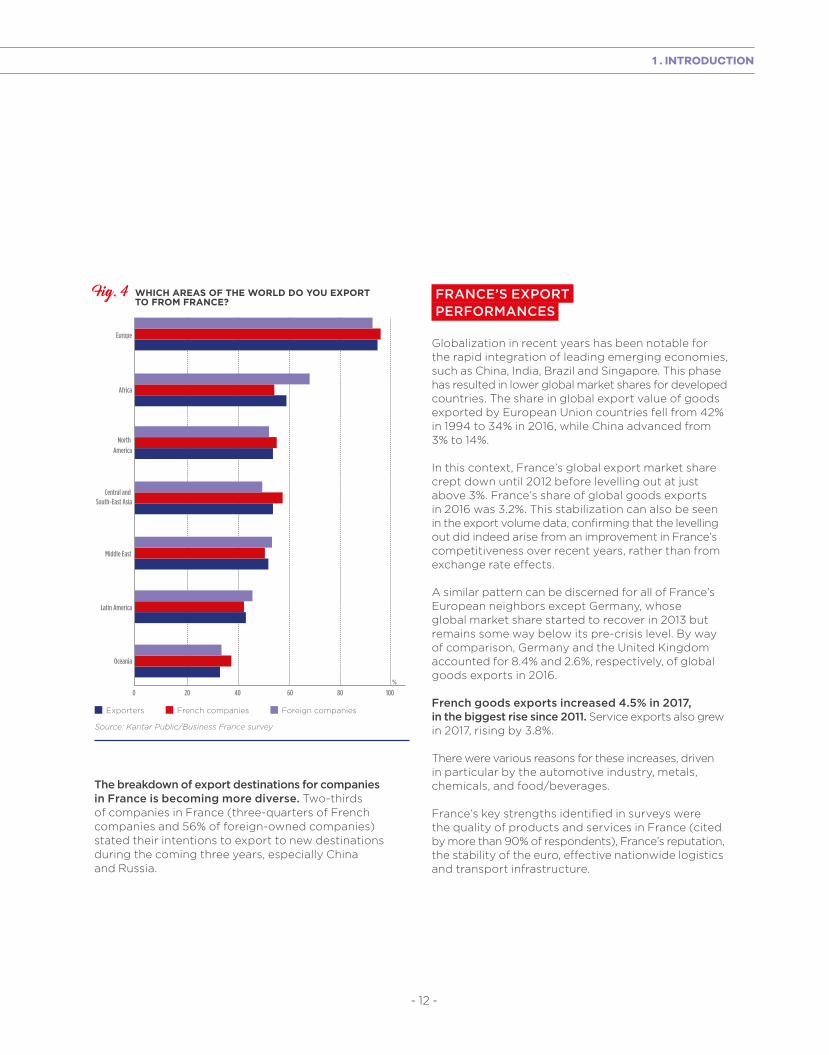
- 12 -
1 . INTRODUCTION
The breakdown of export destinations for companies in France is becoming more diverse. Two-thirds of companies in France (three-quarters of French companies and 56% of foreign-owned companies) stated their intentions to export to new destinations during the coming three years, especially China and Russia.
0 10
0 20 40 60 80 100
20 30 40 50 60 70 80 90 100
Foreign companies
%
French companies
Exporters
Europe
Africa
Central and South-East Asia
Middle East
Latin America
Oceania
North America
2013 20152014 2018 201920172016
5
4
3
2
1
0
%
2013 2014 2015 2016 2017 2018 20192002-2007
2.5
2
1.5
1
0.5
0
%
Source: Kantar Public/Business France survey
Fig. 4 WHICH AREAS OF THE WORLD DO YOU EXPORT TO FROM FRANCE?
Exporters French companies Foreign companies
FRANCE’S EXPORT PERFORMANCES
Globalization in recent years has been notable for the rapid integration of leading emerging economies, such as China, India, Brazil and Singapore. This phase has resulted in lower global market shares for developed countries. The share in global export value of goods exported by European Union countries fell from 42% in 1994 to 34% in 2016, while China advanced from 3% to 14%.
In this context, France’s global export market share crept down until 2012 before levelling out at just above 3%. France’s share of global goods exports in 2016 was 3.2%. This stabilization can also be seen in the export volume data, confirming that the levelling out did indeed arise from an improvement in France’s competitiveness over recent years, rather than from exchange rate effects.
A similar pattern can be discerned for all of France’s European neighbors except Germany, whose global market share started to recover in 2013 but remains some way below its pre-crisis level. By way of comparison, Germany and the United Kingdom accounted for 8.4% and 2.6%, respectively, of global goods exports in 2016.
French goods exports increased 4.5% in 2017, in the biggest rise since 2011. Service exports also grew in 2017, rising by 3.8%.
There were various reasons for these increases, driven in particular by the automotive industry, metals, chemicals, and food/beverages.
France’s key strengths identified in surveys were the quality of products and services in France (cited by more than 90% of respondents), France’s reputation, the stability of the euro, effective nationwide logistics and transport infrastructure.
2
French exports
- 15 -
2 0 1 7 R E P O R T - B U S I N E S S F R A N C E EXPORT PERFORMANCES
FRENCH EXPORTS
French goods exports grew 4.5% in 2017,
the largest rise since 2011
Having fallen slightly in 2016 (-0.6%), French goods exports enjoyed substantial growth in 2017, swelling by 4.5% to €473 billion.1 Imports, however, rose at a faster rate (+6.8%), totaling €535 billion, not least due to a significant hike in the country’s energy costs (+€7.5 billion).
France’s strong goods export performance came primarily in four sectors, which together accounted for nearly two-thirds of French exports: transport equipment (23.2% of exports by value), capital goods (19%), chemicals (12.2%) and food/beverages (10.2%).Service exports also climbed 3.8% in 2017. Though still not back to the €8.9 billion it posted in 2015, France’s services trade surplus increased to €5.4 billion in 2017, a rise largely attributable to sizeable growth in the transport and travel sector (+7.5%).
FRENCH GOODS EXPORTS BUOYANT IN MOST SECTORS
The sources of France’s improved export performance are varied. Most sectors saw the value of their foreign
1 FOB, including military equipment.2 The export figures given in the rest of this chapter will be FOB, excluding military equipment.
sales rise in 2017, with the notable exceptions of aerospace and agricultural products. The sectors that made the largest contributions to boosting exports were the automotive industry, basic metals/metal products, chemicals, and food/beverages.
The automotive industry’s exports increased for the fourth consecutive year, up 9.2% from 2016 to reach a ten-year high.2 The basic metals and metal products sector also saw its foreign sales grow (+12.5%), particularly to the European Union (+€3 billion). The food/beverages industry, too, saw vigorous growth in its exports (+6%), attributable in part to the buoyant drinks sector in the United States and China.
The excellent performance of the perfumes and cosmetics sector is also worthy of note, its exports rising 11% in 2017 and generating a trade surplus of €10.6 billion. The recent improvement in the competitiveness of French production facilities may have been one factor in the strong performance of French manufacturing exports.
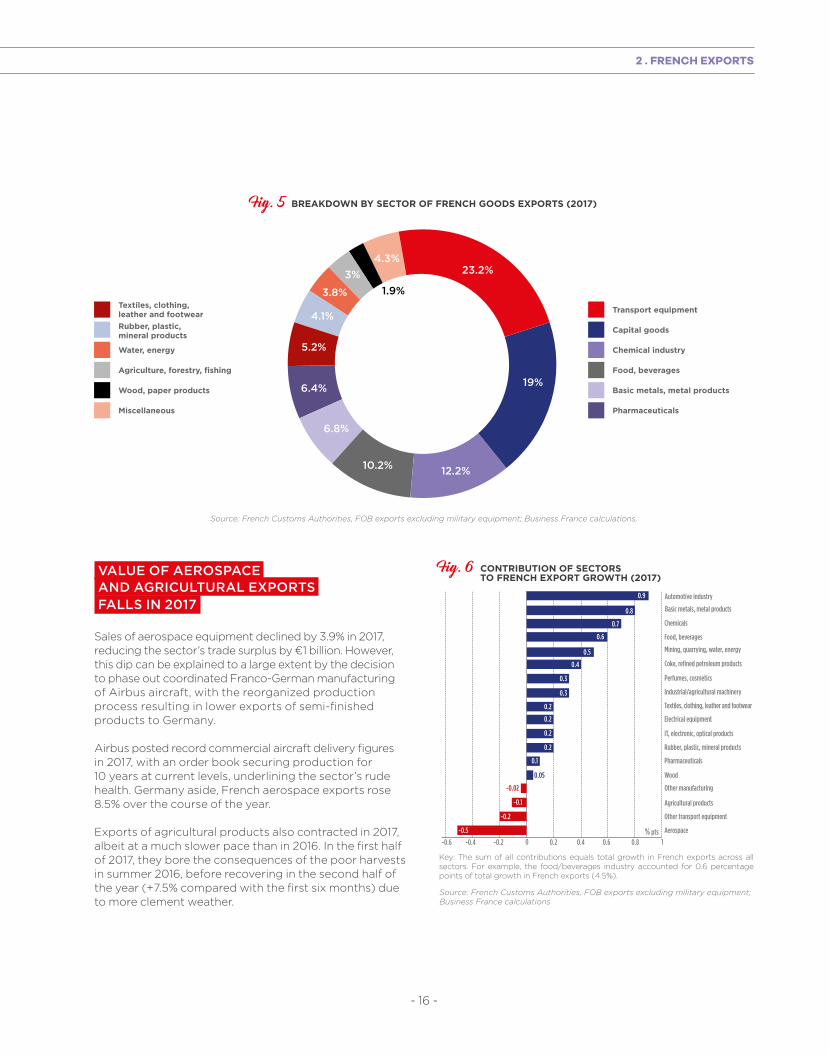
- 16 -
2 . FRENCH EXPORTS
Fig. 6 CONTRIBUTION OF SECTORS TO FRENCH EXPORT GROWTH (2017)
0 1 -0.2 0.2 0.4 0.6 0.8 -0.4 -0.6
Automotive industry
Basic metals, metal products
Chemicals
Food, beverages
Mining, quarrying, water, energy
Coke, refined petroleum products
Perfumes, cosmetics
Industrial/agricultural machinery
Textiles, clothing, leather and footwear
Electrical equipment
IT, electronic, optical products
Rubber, plastic, mineral products
Pharmaceuticals
Wood
Other manufacturing
Agricultural products
Other transport equipment
Aerospace% pts
%
0.9
0.8
0.7
0.6
0.5
0.4
0.3
0.3
0.2
0.2
0.2
0.2
0.1
0.05
14.8%
7.7%
7.6%
7.3%
6.9%
6.7%
4.1%
2%
1,.5%
1.4%
1.4%
1.4%
1.2%
1.2%
1.1%
1.1%
1.1%
1%
-0.5
-0.2
-0.1
-0.02
0 2 4 6 8 10 12 14 16
Germany
Spain
Italy
United States
Belgium
United Kingdom
China
Netherlands
Switzerland
Poland
Singapore
Turkey
Japan
Hong Kong
Russia
India
South Korea
Algeria
Sweden
Portugal
%0 2 4 6 8 10 12 14
Aerospace
Automotive
Chemicals
Industrial/agriculturalmachinery
Basic metals,metal products
Food, beverages
IT, electronic,optical products
Pharmaceuticals
Textiles, clothing,leather and footwear
Electrical equipment
Rubber, plastic,mineral products
Beverages
Perfumes, cosmetics
Agricultural products
Mining, quarrying,water, energy
Wood
Coke, refinedpetroleum products
Other transportequipment
Othermanufacturing
12%
10.4%
8.9%
8.2%
6.8%
6.7%
6.5%
6.4%
4.3%
4.1%
3.4%
3.3%
2 %
1.9%
1.8%
0.7%
4.3%
3.0%
5.2%
3.7%
3.4%
Key: The sum of all contributions equals total growth in French exports across all sectors. For example, the food/beverages industry accounted for 0.6 percentage points of total growth in French exports (4.5%).
Source: French Customs Authorities, FOB exports excluding military equipment; Business France calculations
Fig. 5 BREAKDOWN BY SECTOR OF FRENCH GOODS EXPORTS (2017)
Source: French Customs Authorities, FOB exports excluding military equipment; Business France calculations.
Transport equipment
Capital goods
Chemical industry
Food, beverages
Basic metals, metal products
Pharmaceuticals
Textiles, clothing, leather and footwearRubber, plastic, mineral products
Water, energy
Agriculture, forestry, fishing
Wood, paper products
Miscellaneous
23.2%
19%
12.2%10.2%
6.8%
6.4%
5.2%
4.1%
3.8%
4.3%
1.9%
3%
VALUE OF AEROSPACE AND AGRICULTURAL EXPORTS FALLS IN 2017
Sales of aerospace equipment declined by 3.9% in 2017, reducing the sector’s trade surplus by €1 billion. However, this dip can be explained to a large extent by the decision to phase out coordinated Franco-German manufacturing of Airbus aircraft, with the reorganized production process resulting in lower exports of semi-finished products to Germany.
Airbus posted record commercial aircraft delivery figures in 2017, with an order book securing production for 10 years at current levels, underlining the sector’s rude health. Germany aside, French aerospace exports rose 8.5% over the course of the year.
Exports of agricultural products also contracted in 2017, albeit at a much slower pace than in 2016. In the first half of 2017, they bore the consequences of the poor harvests in summer 2016, before recovering in the second half of the year (+7.5% compared with the first six months) due to more clement weather.
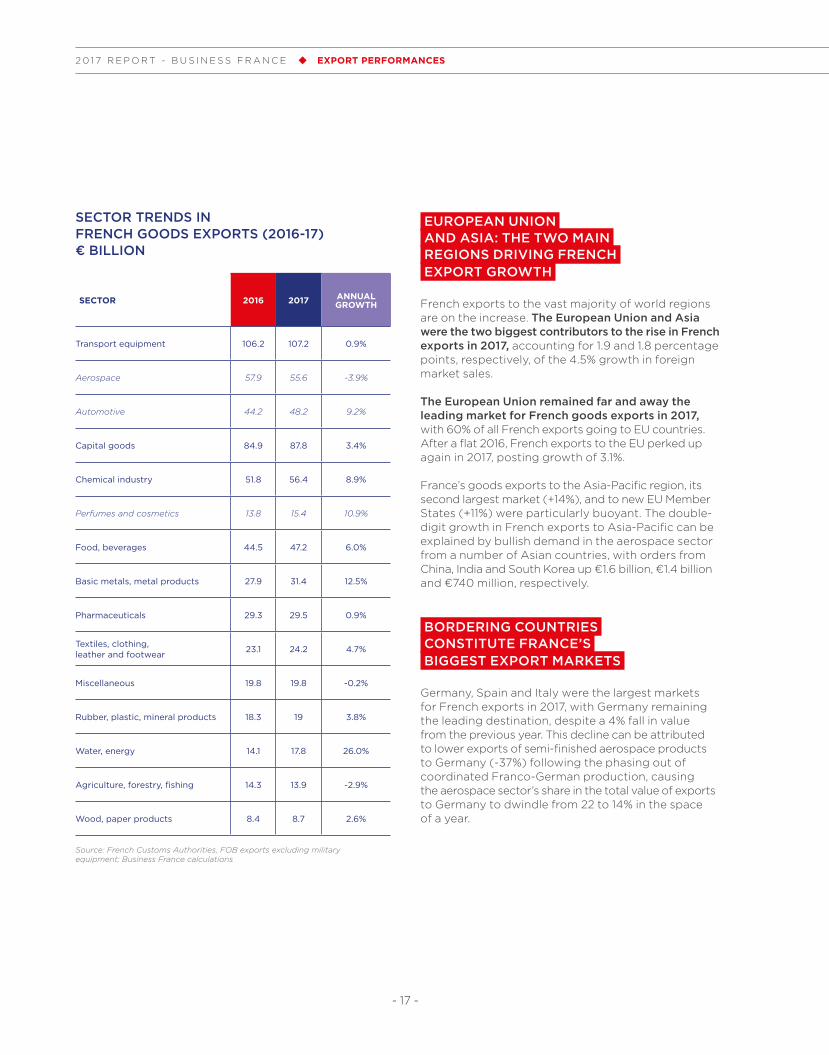
- 17 -
2 0 1 7 R E P O R T - B U S I N E S S F R A N C E EXPORT PERFORMANCES
SECTOR TRENDS IN FRENCH GOODS EXPORTS (2016-17)€ BILLION
SECTOR 2016 2017 ANNUAL GROWTH
Transport equipment 106.2 107.2 0.9%
Aerospace 57.9 55.6 -3.9%
Automotive 44.2 48.2 9.2%
Capital goods 84.9 87.8 3.4%
Chemical industry 51.8 56.4 8.9%
Perfumes and cosmetics 13.8 15.4 10.9%
Food, beverages 44.5 47.2 6.0%
Basic metals, metal products 27.9 31.4 12.5%
Pharmaceuticals 29.3 29.5 0.9%
Textiles, clothing, leather and footwear
23.1 24.2 4.7%
Miscellaneous 19.8 19.8 -0.2%
Rubber, plastic, mineral products 18.3 19 3.8%
Water, energy 14.1 17.8 26.0%
Agriculture, forestry, fishing 14.3 13.9 -2.9%
Wood, paper products 8.4 8.7 2.6%
EUROPEAN UNION AND ASIA: THE TWO MAIN REGIONS DRIVING FRENCH EXPORT GROWTH
French exports to the vast majority of world regions are on the increase. The European Union and Asia were the two biggest contributors to the rise in French exports in 2017, accounting for 1.9 and 1.8 percentage points, respectively, of the 4.5% growth in foreign market sales.
The European Union remained far and away the leading market for French goods exports in 2017, with 60% of all French exports going to EU countries. After a flat 2016, French exports to the EU perked up again in 2017, posting growth of 3.1%.
France’s goods exports to the Asia-Pacific region, its second largest market (+14%), and to new EU Member States (+11%) were particularly buoyant. The double-digit growth in French exports to Asia-Pacific can be explained by bullish demand in the aerospace sector from a number of Asian countries, with orders from China, India and South Korea up €1.6 billion, €1.4 billion and €740 million, respectively.
BORDERING COUNTRIES CONSTITUTE FRANCE’S BIGGEST EXPORT MARKETS
Germany, Spain and Italy were the largest markets for French exports in 2017, with Germany remaining the leading destination, despite a 4% fall in value from the previous year. This decline can be attributed to lower exports of semi-finished aerospace products to Germany (-37%) following the phasing out of coordinated Franco-German production, causing the aerospace sector’s share in the total value of exports to Germany to dwindle from 22 to 14% in the space of a year.
Source: French Customs Authorities, FOB exports excluding military equipment; Business France calculations
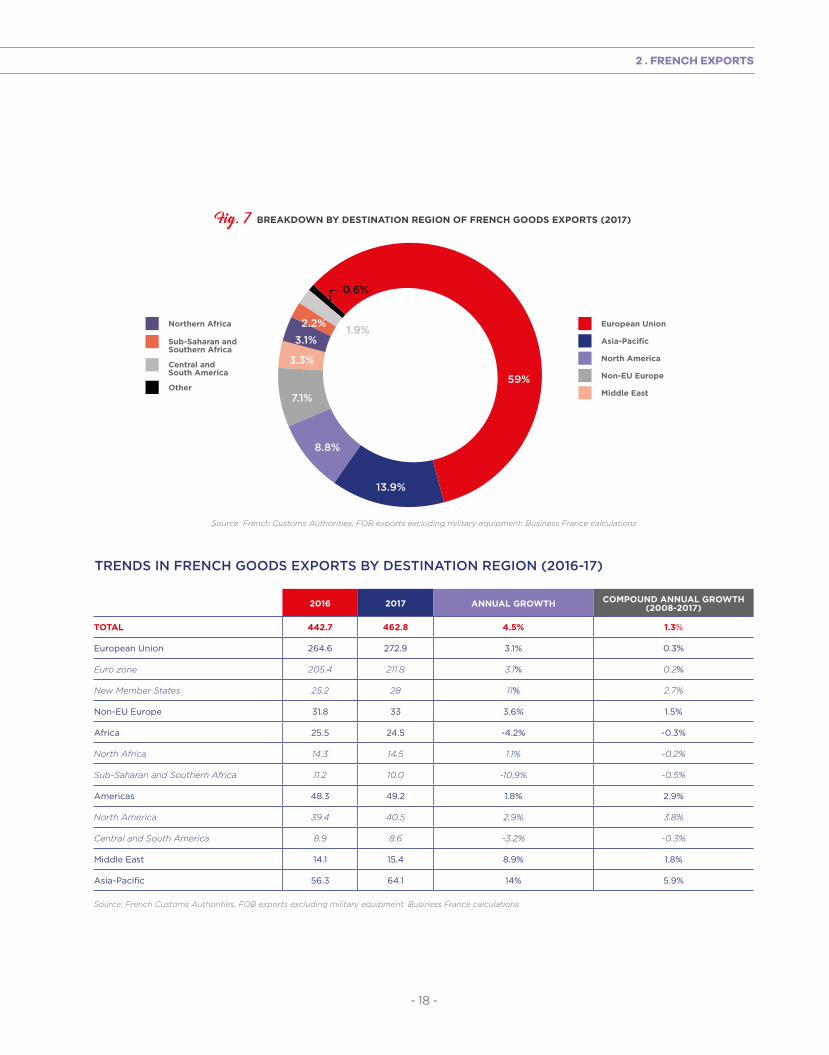
- 18 -
2 . FRENCH EXPORTS
Source: French Customs Authorities, FOB exports excluding military equipment; Business France calculations
TRENDS IN FRENCH GOODS EXPORTS BY DESTINATION REGION (2016-17)
2016 2017 ANNUAL GROWTH COMPOUND ANNUAL GROWTH (2008-2017)
TOTAL 442.7 462.8 4.5% 1.3%
European Union 264.6 272.9 3.1% 0.3%
Euro zone 205.4 211.8 3.1% 0.2%
New Member States 25.2 28 11% 2.7%
Non-EU Europe 31.8 33 3.6% 1.5%
Africa 25.5 24.5 -4.2% -0.3%
North Africa 14.3 14.5 1.1% -0.2%
Sub-Saharan and Southern Africa 11.2 10.0 -10.9% -0.5%
Americas 48.3 49.2 1.8% 2.9%
North America 39.4 40.5 2.9% 3.8%
Central and South America 8.9 8.6 -3.2% -0.3%
Middle East 14.1 15.4 8.9% 1.8%
Asia-Pacific 56.3 64.1 14% 5.9%
59%
13.9%
8.8%
7.1%
3.3%
3.1%
2.2%1.9%
0.6%
European Union
Asia-Pacific
North America
Non-EU Europe
Middle East
Northern Africa
Sub-Saharan and Southern Africa
Central and South America
Other
Fig. 7 BREAKDOWN BY DESTINATION REGION OF FRENCH GOODS EXPORTS (2017)
Source: French Customs Authorities, FOB exports excluding military equipment; Business France calculations
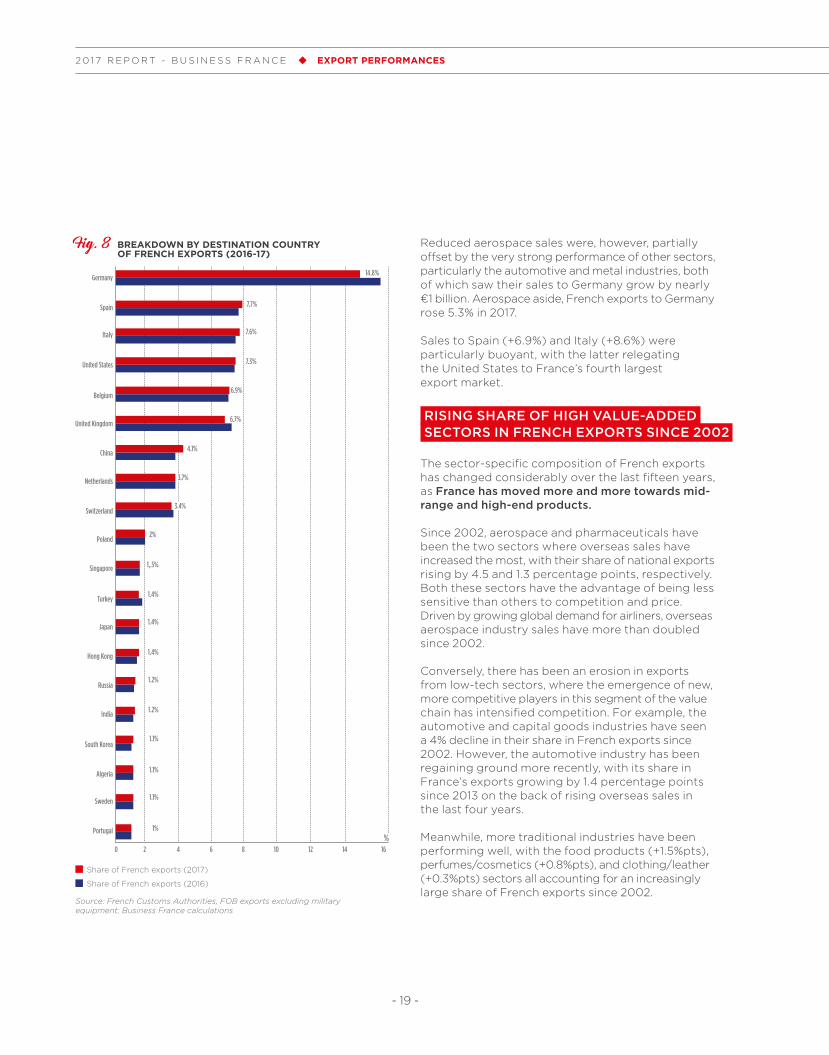
- 19 -
2 0 1 7 R E P O R T - B U S I N E S S F R A N C E EXPORT PERFORMANCES
Fig. 8 BREAKDOWN BY DESTINATION COUNTRY OF FRENCH EXPORTS (2016-17)
0 1 -0.2 0.2 0.4 0.6 0.8 -0.4 -0.6
Automotive industry
Basic metals, metal products
Chemicals
Food, beverages
Mining, quarrying, water, energy
Coke, refined petroleum products
Perfumes, cosmetics
Industrial/agricultural machinery
Textiles, clothing, leather and footwear
Electrical equipment
IT, electronic, optical products
Rubber, plastic, mineral products
Pharmaceuticals
Wood
Other manufacturing
Agricultural products
Other transport equipment
Aerospace% pts
%
0.9
0.8
0.7
0.6
0.5
0.4
0.3
0.3
0.2
0.2
0.2
0.2
0.1
0.05
14.8%
7.7%
7.6%
7.3%
6.9%
6.7%
4.1%
2%
1,.5%
1.4%
1.4%
1.4%
1.2%
1.2%
1.1%
1.1%
1.1%
1%
-0.5
-0.2
-0.1
-0.02
0 2 4 6 8 10 12 14 16
Germany
Spain
Italy
United States
Belgium
United Kingdom
China
Netherlands
Switzerland
Poland
Singapore
Turkey
Japan
Hong Kong
Russia
India
South Korea
Algeria
Sweden
Portugal
%0 2 4 6 8 10 12 14
Aerospace
Automotive
Chemicals
Industrial/agriculturalmachinery
Basic metals,metal products
Food, beverages
IT, electronic,optical products
Pharmaceuticals
Textiles, clothing,leather and footwear
Electrical equipment
Rubber, plastic,mineral products
Beverages
Perfumes, cosmetics
Agricultural products
Mining, quarrying,water, energy
Wood
Coke, refinedpetroleum products
Other transportequipment
Othermanufacturing
12%
10.4%
8.9%
8.2%
6.8%
6.7%
6.5%
6.4%
4.3%
4.1%
3.4%
3.3%
2 %
1.9%
1.8%
0.7%
4.3%
3.0%
5.2%
3.7%
3.4%
Source: French Customs Authorities, FOB exports excluding military equipment; Business France calculations
Share of French exports (2017)
Share of French exports (2016)
Reduced aerospace sales were, however, partially offset by the very strong performance of other sectors, particularly the automotive and metal industries, both of which saw their sales to Germany grow by nearly €1 billion. Aerospace aside, French exports to Germany rose 5.3% in 2017.
Sales to Spain (+6.9%) and Italy (+8.6%) were particularly buoyant, with the latter relegating the United States to France’s fourth largest export market.
RISING SHARE OF HIGH VALUE-ADDEDSECTORS IN FRENCH EXPORTS SINCE 2002
The sector-specific composition of French exports has changed considerably over the last fifteen years, as France has moved more and more towards mid-range and high-end products.
Since 2002, aerospace and pharmaceuticals have been the two sectors where overseas sales have increased the most, with their share of national exports rising by 4.5 and 1.3 percentage points, respectively. Both these sectors have the advantage of being less sensitive than others to competition and price. Driven by growing global demand for airliners, overseas aerospace industry sales have more than doubled since 2002.
Conversely, there has been an erosion in exports from low-tech sectors, where the emergence of new, more competitive players in this segment of the value chain has intensified competition. For example, the automotive and capital goods industries have seen a 4% decline in their share in French exports since 2002. However, the automotive industry has been regaining ground more recently, with its share in France’s exports growing by 1.4 percentage points since 2013 on the back of rising overseas sales in the last four years.
Meanwhile, more traditional industries have been performing well, with the food products (+1.5%pts), perfumes/cosmetics (+0.8%pts), and clothing/leather (+0.3%pts) sectors all accounting for an increasingly large share of French exports since 2002.
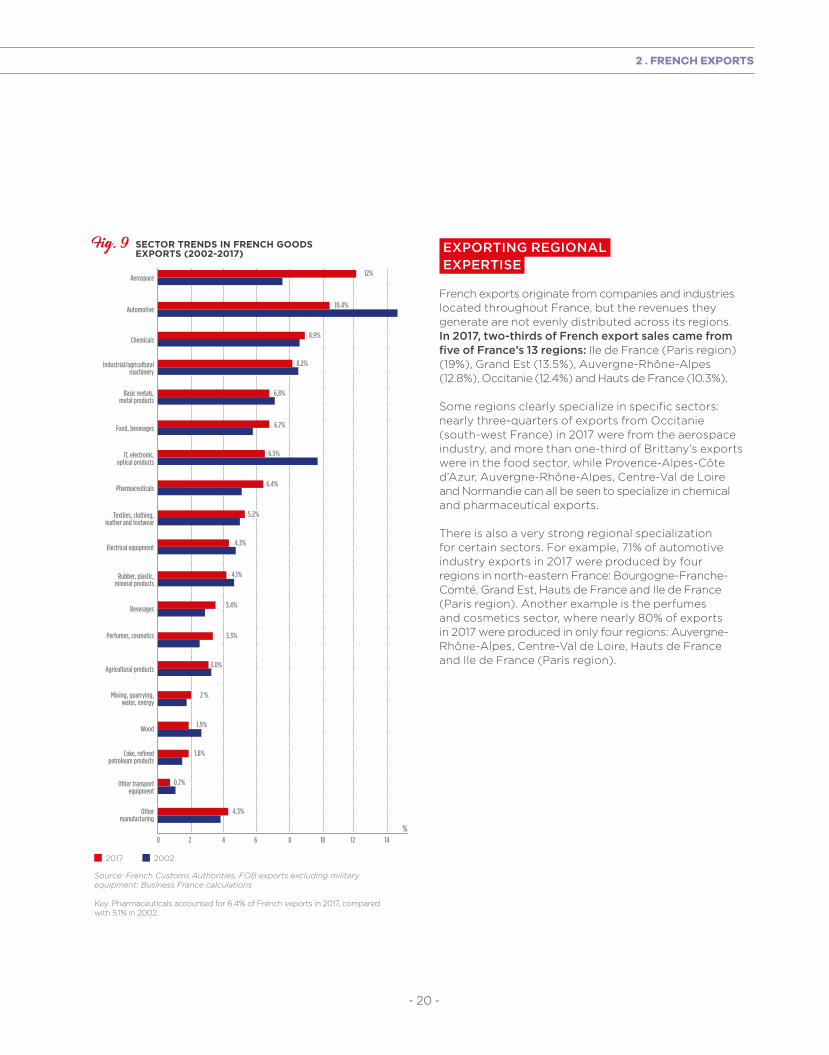
- 20 -
2 . FRENCH EXPORTS
Fig. 9 SECTOR TRENDS IN FRENCH GOODS EXPORTS (2002-2017)
0 1 -0.2 0.2 0.4 0.6 0.8 -0.4 -0.6
Automotive industry
Basic metals, metal products
Chemicals
Food, beverages
Mining, quarrying, water, energy
Coke, refined petroleum products
Perfumes, cosmetics
Industrial/agricultural machinery
Textiles, clothing, leather and footwear
Electrical equipment
IT, electronic, optical products
Rubber, plastic, mineral products
Pharmaceuticals
Wood
Other manufacturing
Agricultural products
Other transport equipment
Aerospace% pts
%
0.9
0.8
0.7
0.6
0.5
0.4
0.3
0.3
0.2
0.2
0.2
0.2
0.1
0.05
14.8%
7.7%
7.6%
7.3%
6.9%
6.7%
4.1%
2%
1,.5%
1.4%
1.4%
1.4%
1.2%
1.2%
1.1%
1.1%
1.1%
1%
-0.5
-0.2
-0.1
-0.02
0 2 4 6 8 10 12 14 16
Germany
Spain
Italy
United States
Belgium
United Kingdom
China
Netherlands
Switzerland
Poland
Singapore
Turkey
Japan
Hong Kong
Russia
India
South Korea
Algeria
Sweden
Portugal
%0 2 4 6 8 10 12 14
Aerospace
Automotive
Chemicals
Industrial/agriculturalmachinery
Basic metals,metal products
Food, beverages
IT, electronic,optical products
Pharmaceuticals
Textiles, clothing,leather and footwear
Electrical equipment
Rubber, plastic,mineral products
Beverages
Perfumes, cosmetics
Agricultural products
Mining, quarrying,water, energy
Wood
Coke, refinedpetroleum products
Other transportequipment
Othermanufacturing
12%
10.4%
8.9%
8.2%
6.8%
6.7%
6.5%
6.4%
4.3%
4.1%
3.4%
3.3%
2 %
1.9%
1.8%
0.7%
4.3%
3.0%
5.2%
3.7%
3.4%
Key: Pharmaceuticals accounted for 6.4% of French exports in 2017, compared with 5.1% in 2002.
Source: French Customs Authorities, FOB exports excluding military equipment; Business France calculations
2017 2002
EXPORTING REGIONAL EXPERTISE
French exports originate from companies and industries located throughout France, but the revenues they generate are not evenly distributed across its regions. In 2017, two-thirds of French export sales came from five of France’s 13 regions: Ile de France (Paris region) (19%), Grand Est (13.5%), Auvergne-Rhône-Alpes (12.8%), Occitanie (12.4%) and Hauts de France (10.3%).
Some regions clearly specialize in specific sectors: nearly three-quarters of exports from Occitanie (south-west France) in 2017 were from the aerospace industry, and more than one-third of Brittany’s exports were in the food sector, while Provence-Alpes-Côte d’Azur, Auvergne-Rhône-Alpes, Centre-Val de Loire and Normandie can all be seen to specialize in chemical and pharmaceutical exports.
There is also a very strong regional specialization for certain sectors. For example, 71% of automotive industry exports in 2017 were produced by four regions in north-eastern France: Bourgogne-Franche-Comté, Grand Est, Hauts de France and Ile de France (Paris region). Another example is the perfumes and cosmetics sector, where nearly 80% of exports in 2017 were produced in only four regions: Auvergne-Rhône-Alpes, Centre-Val de Loire, Hauts de France and Ile de France (Paris region).
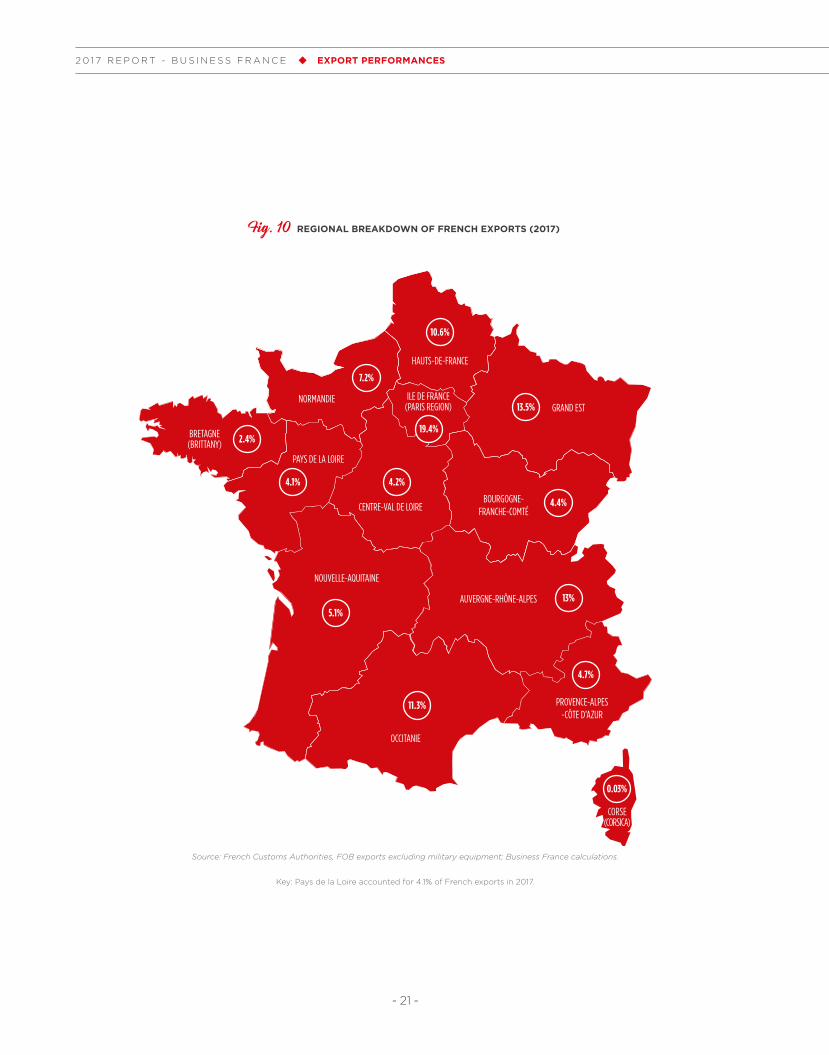
- 21 -
2 0 1 7 R E P O R T - B U S I N E S S F R A N C E EXPORT PERFORMANCES
Fig. 10 REGIONAL BREAKDOWN OF FRENCH EXPORTS (2017)
Source: French Customs Authorities, FOB exports excluding military equipment; Business France calculations.
0.03%
2.4%
4.1% 4.2%
7.2%
10.6%
19.4%
13.5%
13%
11.3%
5.1%
4.4%
4.7%
ILE DE FRANCE(PARIS REGION)
HAUTS-DE-FRANCE
NORMANDIE
BRETAGNE(BRITTANY)
PAYS DE LA LOIRE
CENTRE-VAL DE LOIRE
NOUVELLE-AQUITAINE
OCCITANIE
CORSE(CORSICA)
AUVERGNE-RHÔNE-ALPES
PROVENCE-ALPES-CÔTE D’AZUR
BOURGOGNE-FRANCHE-COMTÉ
GRAND EST
Key: Pays de la Loire accounted for 4.1% of French exports in 2017.
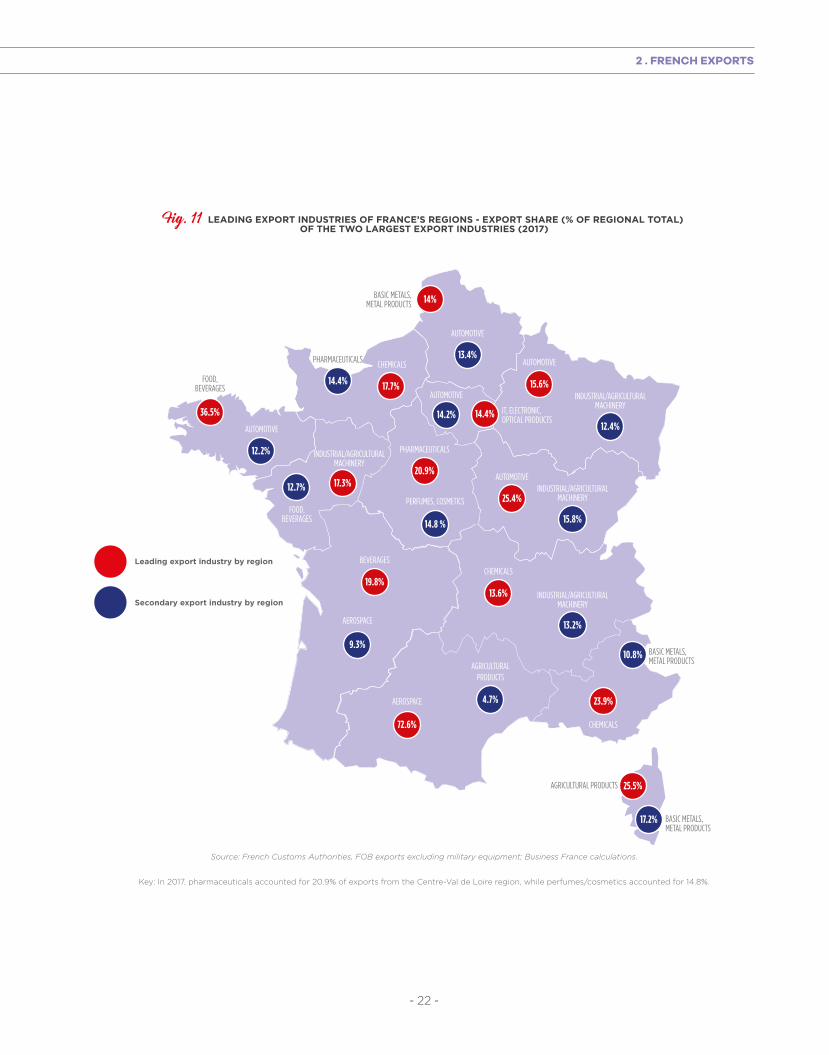
- 22 -
2 . FRENCH EXPORTS
Fig. 11 LEADING EXPORT INDUSTRIES OF FRANCE’S REGIONS - EXPORT SHARE (% OF REGIONAL TOTAL) OF THE TWO LARGEST EXPORT INDUSTRIES (2017)
Source: French Customs Authorities, FOB exports excluding military equipment; Business France calculations.
12.7% 17.3%
12.2%
36.5%
14.4% 17.7%
14%
14.2% 14.4%12.4%
15.8%
25.4%
14.8 %
20.9%
13.2%
13.6%
9.3%
19.8%
10.8%
23.9%
17.2%
25.5%
4.7%
AGRICULTURAL PRODUCTS
CHEMICALS
AUTOMOTIVE
15.6%
AUTOMOTIVE13.4%
AUTOMOTIVE
AUTOMOTIVE
AUTOMOTIVE
INDUSTRIAL/AGRICULTURAL MACHINERY
INDUSTRIAL/AGRICULTURAL MACHINERY
INDUSTRIAL/AGRICULTURAL MACHINERY
INDUSTRIAL/AGRICULTURAL MACHINERY
CHEMICALS
BASIC METALS, METAL PRODUCTS
IT, ELECTRONIC, OPTICAL PRODUCTS
BASIC METALS, METAL PRODUCTS
BASIC METALS, METAL PRODUCTS
AGRICULTURAL PRODUCTS
FOOD, BEVERAGES
PHARMACEUTICALS
PHARMACEUTICALS
PERFUMES, COSMETICSFOOD,
BEVERAGES
CHEMICALS
72.6%
AEROSPACE
AEROSPACE
BEVERAGES
Secondary export industry by region
Leading export industry by region
Key: In 2017, pharmaceuticals accounted for 20.9% of exports from the Centre-Val de Loire region, while perfumes/cosmetics accounted for 14.8%.

3
France’s place in the world 24 GLOBAL VALUE CHAINS AND VALUE ADDED
28 FRANCE’S EXPORT PERFORMANCES
32 SECTOR-SPECIFIC SPECIALIZATION
35 FRANCE: A GATEWAY TO EUROPEAN AND AFRICAN MARKETS
- 25 -
2 0 1 7 R E P O R T - B U S I N E S S F R A N C E EXPORT PERFORMANCES
Increasingly fragmentedproduction processes haveled to greater cross-border
trade and investment
Between 1990 and 2016, international trade grew much faster than global output, despite the eruption of the 2008 financial crisis and subsequent slowdown. The value of exports grew 357% during this time, while output rose by only 232%.
This sustained increase in trade can be traced back to the globalization of production chains during recent decades. Lower transport costs, advances in telecommunications, and continued reductions in trade and investment barriers have all made it easier to fragment the production process. Today, company operations, from product design and component manufacture to assembly and marketing, have spread across the world, creating global value chains (GVCs).
GVCs provide a new model of how countries and companies participate in globalization, encompassing trade in intermediate goods, along with the capital flows, expertise and services required to coordinate dispersed manufacturing facilities.
GLOBAL VALUE CHAINS AND VALUE
ADDED
GLOBAL VALUE CHAINS PROVIDE TRADE OPPORTUNITIES FOR SMEs
The expected primary effects of the fragmentation of value chains include higher economic growth and productivity: each country can specialize in the production stage in which it enjoys a comparative advantage, i.e. where it is most competitive. The positive externalities of globalization also stem from greater international competition and access to knowledge and technology, better distribution and use of resources arising from increased specialization, and economies of scale.
Participation in GVCs leads to improved productivity for businesses. In the first instance, this involves optimizing their production processes by importing higher quality or less costly intermediate goods. Numerous empirical studies have also shown that companies that decide to export experience higher productivity growth than those that do not.
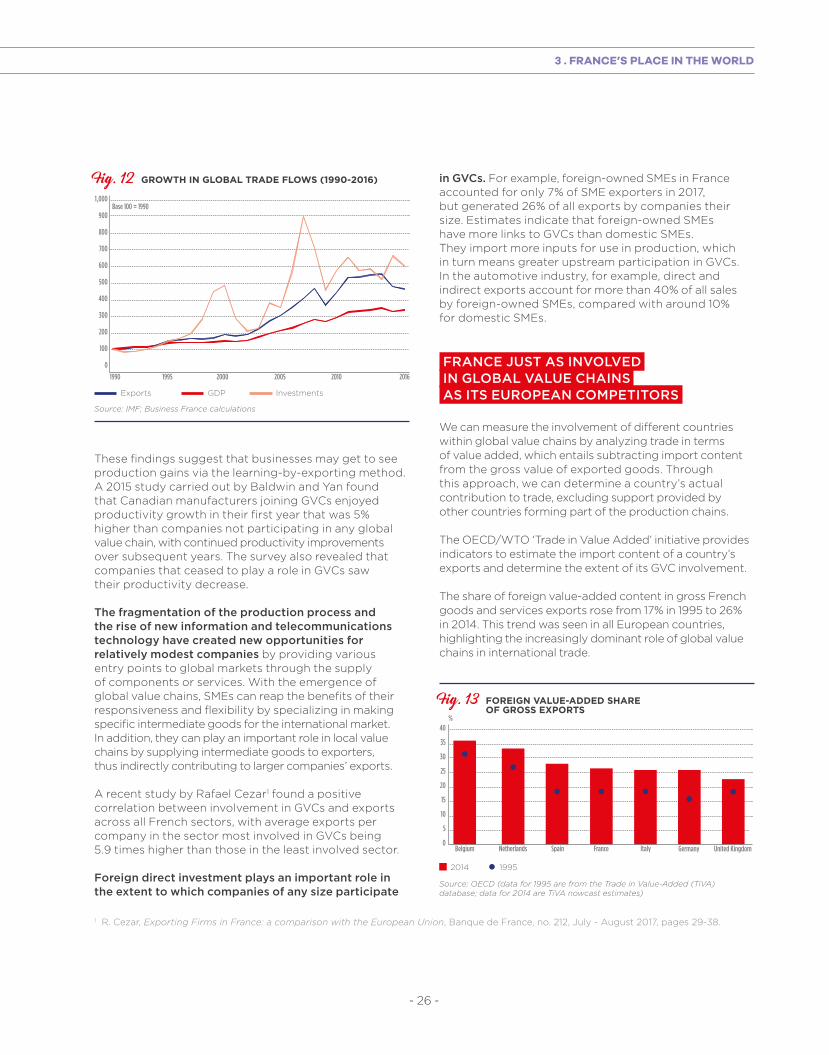
- 26 -
3 . FRANCE’S PLACE IN THE WORLD
These findings suggest that businesses may get to see production gains via the learning-by-exporting method. A 2015 study carried out by Baldwin and Yan found that Canadian manufacturers joining GVCs enjoyed productivity growth in their first year that was 5% higher than companies not participating in any global value chain, with continued productivity improvements over subsequent years. The survey also revealed that companies that ceased to play a role in GVCs saw their productivity decrease.
The fragmentation of the production process and the rise of new information and telecommunications technology have created new opportunities for relatively modest companies by providing various entry points to global markets through the supply of components or services. With the emergence of global value chains, SMEs can reap the benefits of their responsiveness and flexibility by specializing in making specific intermediate goods for the international market. In addition, they can play an important role in local value chains by supplying intermediate goods to exporters, thus indirectly contributing to larger companies’ exports.
A recent study by Rafael Cezar1 found a positive correlation between involvement in GVCs and exports across all French sectors, with average exports per company in the sector most involved in GVCs being 5.9 times higher than those in the least involved sector.
Foreign direct investment plays an important role in the extent to which companies of any size participate
Fig. 12 GROWTH IN GLOBAL TRADE FLOWS (1990-2016)
Belgium Netherlands Spain France Italy Germany United Kingdom
1990 1995 2000 2005 2010 2016
1, 000
900
800
700
600
500
400
300
200
100
0
40
35
30
25
20
15
10
5
0
0 10 20 30 40 50%
Food, beverages and tobacco
Wood and cork products
Machinery and equipment,not elsewhere classified
Fabricated metal products
Other non-metallic mineral products
Other transport equipment
Motor vehicles, trailers/semi-trailers
Textiles, clothing,leather goods and footwear
Chemicals
Base metals
Electronic equipment
Rubber and plastic products
Computer, electronic and optical products
47.2
39.7
33.3
33.1
31.6
31.2
31
30.1
29.8
27.7
24.3
23.6
23.4
2012 2016
9
8
7
6
5
4
3
2
1
0
%
%
2012 2016 2012 2016 2012 2016 2012 2016 2012 2016 2012 2016
Germany
8.4
Belgium
2.5
Spain
France
Italy
Netherlands
United Kingdom
1.8
3.2
2.9
3.6 2.6
World Europe North America Middle East and North Africa
Sub-Saharan Africa
Emerging Asia
20
18
16
14
12
10
8
6
4
2
0
0 5 10 15 20
United Arab Emirates
Czech Republic
Saudi Arabia
Brazil
Spain
Hong Kong
India
Italy
Morocco
Mexico
Poland
Russia
Singapore
Switzerland
Turkey
Germany
Austria
Belgium
United States
JapanRomania
Algeria
China
South Korea
HungaryNetherlands
United Kingdom
Sweden
Tunisia
Portugal
%
112
110
108
106
104
102
100
98
96Germany Belgium Spain France Italy Netherlands United Kingdom EU-28
2005 2006 2007 2008 2009 2010 2011 2012 2013 2014 2015 2016
130
125
120
115
110
105
100
95
90
85
80
Base 100 = 2010
Boilers, machinery, parts
Miscellaneous chemical products
Essential oils, perfumes, cosmetics
Aerospace industry
Beverages, spirits and vinegar
Dairy products, eggs, honey
Leather goods, handbags
Cereals
Pharmaceutical products
Paper, paperboard
Iron and steel
Plastics
Rubber
Vehicles, bicycles, and parts
Organic chemicals
Index France = 100
0 1 2 3 4 5 6
Boilers, machinery, parts
Miscellaneous chemical products
Essential oils, perfumes, cosmetics
Aerospace industry
Beverages, spirits and vinegar
Dairy products, eggs, honey
Leather goods, handbags
Cereals
Pharmaceutical products
Paper, paperboard
Iron and steel
Plastics
Rubber
Vehicles, bicycles, and parts
Organic chemicals
Optical, photo, medical/surgical instruments
Articles of iron or steel
Apparel articles, accessories
Electric machinery, TV/audio equipment
Natural pearls, precious stones/metals
Mineral fuel, oil, wax, bitumen
0 2 4 6 8 10 1612 14%
16
15.8
13.5
9.8
9.3
6.6
6.4
3.9
3.8
3.7
3.4
3.1
3
2.9
2.8
2.7
1.8
1.2
0.9
6
4
Aerospace 17.4
12.3
10.6
3.3
2.8
2.7
2.2
1.3
1.1
1.1
Beverages
Perfumes, cosmetics,cleaning products
Pharmaceuticals
Chemicals (except basic chemicals)
Electronic components and boards
Measuring, testing, navigation instruments; watches/clocks
Animal food
Manufacture of ships/boats
Dairy products
0-2 2 6 10 14 18
1
Belgium Netherlands France Germany UnitedKingdom
Austria Ireland Poland Sweden Italy Spain Finland
200
180
160
140
120
100
80
60
40
20
0
183
166
10096
92
7772
56
49 4844 43
90
80
70
60
50
40
30
20
10
0
100
90
80
70
60
50
40
30
20
10
0
31
9
9
9
7
4
3
2
2
4
1212
12
12
8
15
5
5
5
58
9
18
9
9
9
9
4
3
3
5
27
66
6
1020
6
6
6
6
6
6
6
6
10
16
4
4
26
5
7
7
6
6
8
8
11
8
7
13
4
2
17 17 17 18 19
8
70
5853
23
7
4737
5
16 1621
United States NetherlandsGermany United Kingdom
Switzerland Belgium Japan SwedenItaly Spain
Large corporates Mid-size companies SMEs and micro-enterprises
Large corporates Mid-size companies SMEs and micro-enterprises
100
90
80
70
60
50
40
30
20
10
0
26
4666 48
26
34
54
%
%
%
Base 100 = 1990
%
4.0
3.5
12.5
1.0
1.4
8.7
13.1
1.1
4.3
7.6
3.3
3.1
2.56.6
4.4
7.72.7
9.6
1.9
1.7
1.25.6
11.7
1.3
1.1
3.7
3.5
5.4
19.6
4.3
France in the world’s top five exporters
€ billion
Base 100 = 2010
3.23.6
1.6
4.1 4.0
1.3
3.2%: France’s overall global export market share
33
1
1
2
2
2
1
Source: IMF; Business France calculations
Exports GDP Investments
in GVCs. For example, foreign-owned SMEs in France accounted for only 7% of SME exporters in 2017, but generated 26% of all exports by companies their size. Estimates indicate that foreign-owned SMEs have more links to GVCs than domestic SMEs. They import more inputs for use in production, which in turn means greater upstream participation in GVCs. In the automotive industry, for example, direct and indirect exports account for more than 40% of all sales by foreign-owned SMEs, compared with around 10% for domestic SMEs.
FRANCE JUST AS INVOLVED IN GLOBAL VALUE CHAINS AS ITS EUROPEAN COMPETITORS
We can measure the involvement of different countries within global value chains by analyzing trade in terms of value added, which entails subtracting import content from the gross value of exported goods. Through this approach, we can determine a country’s actual contribution to trade, excluding support provided by other countries forming part of the production chains.
The OECD/WTO ‘Trade in Value Added’ initiative provides indicators to estimate the import content of a country’s exports and determine the extent of its GVC involvement.
The share of foreign value-added content in gross French goods and services exports rose from 17% in 1995 to 26% in 2014. This trend was seen in all European countries, highlighting the increasingly dominant role of global value chains in international trade.
1 R. Cezar, Exporting Firms in France: a comparison with the European Union, Banque de France, no. 212, July - August 2017, pages 29-38.
Fig. 13 FOREIGN VALUE-ADDED SHARE OF GROSS EXPORTS
Belgium Netherlands Spain France Italy Germany United Kingdom
1990 1995 2000 2005 2010 2016
1, 000
900
800
700
600
500
400
300
200
100
0
40
35
30
25
20
15
10
5
0
0 10 20 30 40 50%
Food, beverages and tobacco
Wood and cork products
Machinery and equipment,not elsewhere classified
Fabricated metal products
Other non-metallic mineral products
Other transport equipment
Motor vehicles, trailers/semi-trailers
Textiles, clothing,leather goods and footwear
Chemicals
Base metals
Electronic equipment
Rubber and plastic products
Computer, electronic and optical products
47.2
39.7
33.3
33.1
31.6
31.2
31
30.1
29.8
27.7
24.3
23.6
23.4
2012 2016
9
8
7
6
5
4
3
2
1
0
%
%
2012 2016 2012 2016 2012 2016 2012 2016 2012 2016 2012 2016
Germany
8.4
Belgium
2.5
Spain
France
Italy
Netherlands
United Kingdom
1.8
3.2
2.9
3.6 2.6
World Europe North America Middle East and North Africa
Sub-Saharan Africa
Emerging Asia
20
18
16
14
12
10
8
6
4
2
0
0 5 10 15 20
United Arab Emirates
Czech Republic
Saudi Arabia
Brazil
Spain
Hong Kong
India
Italy
Morocco
Mexico
Poland
Russia
Singapore
Switzerland
Turkey
Germany
Austria
Belgium
United States
JapanRomania
Algeria
China
South Korea
HungaryNetherlands
United Kingdom
Sweden
Tunisia
Portugal
%
112
110
108
106
104
102
100
98
96Germany Belgium Spain France Italy Netherlands United Kingdom EU-28
2005 2006 2007 2008 2009 2010 2011 2012 2013 2014 2015 2016
130
125
120
115
110
105
100
95
90
85
80
Base 100 = 2010
Boilers, machinery, parts
Miscellaneous chemical products
Essential oils, perfumes, cosmetics
Aerospace industry
Beverages, spirits and vinegar
Dairy products, eggs, honey
Leather goods, handbags
Cereals
Pharmaceutical products
Paper, paperboard
Iron and steel
Plastics
Rubber
Vehicles, bicycles, and parts
Organic chemicals
Index France = 100
0 1 2 3 4 5 6
Boilers, machinery, parts
Miscellaneous chemical products
Essential oils, perfumes, cosmetics
Aerospace industry
Beverages, spirits and vinegar
Dairy products, eggs, honey
Leather goods, handbags
Cereals
Pharmaceutical products
Paper, paperboard
Iron and steel
Plastics
Rubber
Vehicles, bicycles, and parts
Organic chemicals
Optical, photo, medical/surgical instruments
Articles of iron or steel
Apparel articles, accessories
Electric machinery, TV/audio equipment
Natural pearls, precious stones/metals
Mineral fuel, oil, wax, bitumen
0 2 4 6 8 10 1612 14%
16
15.8
13.5
9.8
9.3
6.6
6.4
3.9
3.8
3.7
3.4
3.1
3
2.9
2.8
2.7
1.8
1.2
0.9
6
4
Aerospace 17.4
12.3
10.6
3.3
2.8
2.7
2.2
1.3
1.1
1.1
Beverages
Perfumes, cosmetics,cleaning products
Pharmaceuticals
Chemicals (except basic chemicals)
Electronic components and boards
Measuring, testing, navigation instruments; watches/clocks
Animal food
Manufacture of ships/boats
Dairy products
0-2 2 6 10 14 18
1
Belgium Netherlands France Germany UnitedKingdom
Austria Ireland Poland Sweden Italy Spain Finland
200
180
160
140
120
100
80
60
40
20
0
183
166
10096
92
7772
56
49 4844 43
90
80
70
60
50
40
30
20
10
0
100
90
80
70
60
50
40
30
20
10
0
31
9
9
9
7
4
3
2
2
4
1212
12
12
8
15
5
5
5
58
9
18
9
9
9
9
4
3
3
5
27
66
6
1020
6
6
6
6
6
6
6
6
10
16
4
4
26
5
7
7
6
6
8
8
11
8
7
13
4
2
17 17 17 18 19
8
70
5853
23
7
4737
5
16 1621
United States NetherlandsGermany United Kingdom
Switzerland Belgium Japan SwedenItaly Spain
Large corporates Mid-size companies SMEs and micro-enterprises
Large corporates Mid-size companies SMEs and micro-enterprises
100
90
80
70
60
50
40
30
20
10
0
26
4666 48
26
34
54
%
%
%
Base 100 = 1990
%
4.0
3.5
12.5
1.0
1.4
8.7
13.1
1.1
4.3
7.6
3.3
3.1
2.56.6
4.4
7.72.7
9.6
1.9
1.7
1.25.6
11.7
1.3
1.1
3.7
3.5
5.4
19.6
4.3
France in the world’s top five exporters
€ billion
Base 100 = 2010
3.23.6
1.6
4.1 4.0
1.3
3.2%: France’s overall global export market share
33
1
1
2
2
2
1
Source: OECD (data for 1995 are from the Trade in Value-Added (TiVA) database; data for 2014 are TiVA nowcast estimates)
2014 1995
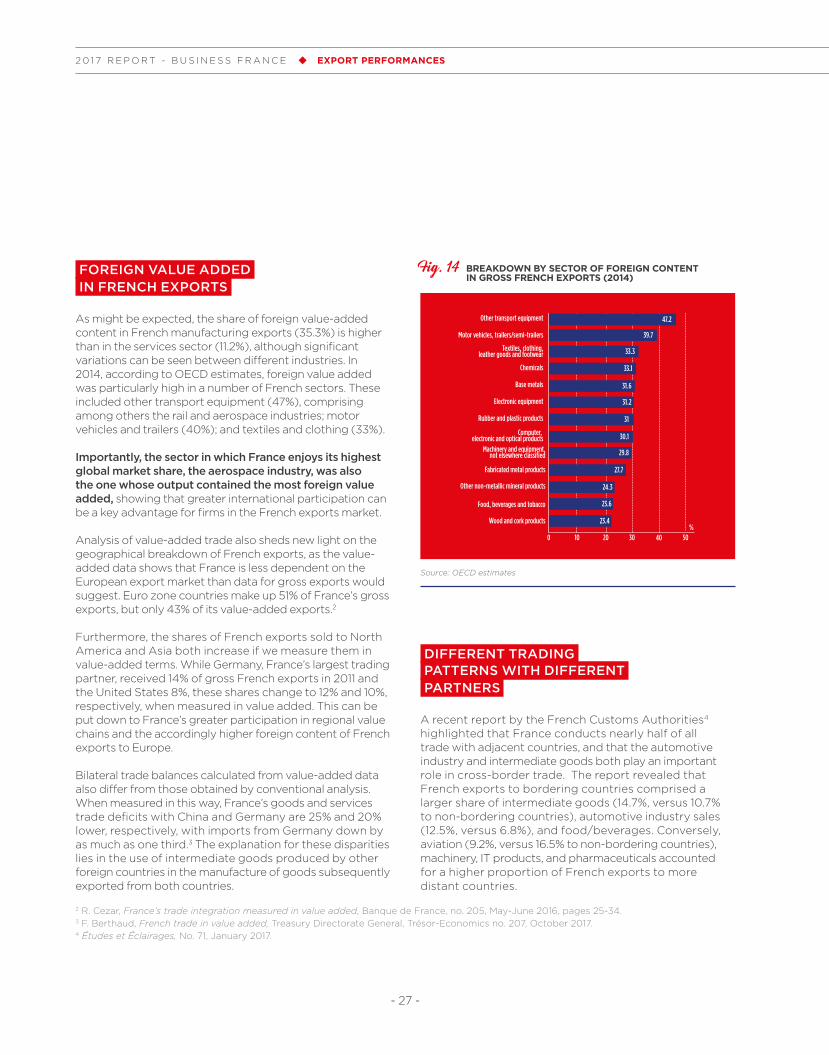
- 27 -
2 0 1 7 R E P O R T - B U S I N E S S F R A N C E EXPORT PERFORMANCES
DIFFERENT TRADING PATTERNS WITH DIFFERENT PARTNERS
A recent report by the French Customs Authorities4 highlighted that France conducts nearly half of all trade with adjacent countries, and that the automotive industry and intermediate goods both play an important role in cross-border trade. The report revealed that French exports to bordering countries comprised a larger share of intermediate goods (14.7%, versus 10.7% to non-bordering countries), automotive industry sales (12.5%, versus 6.8%), and food/beverages. Conversely, aviation (9.2%, versus 16.5% to non-bordering countries), machinery, IT products, and pharmaceuticals accounted for a higher proportion of French exports to more distant countries.
FOREIGN VALUE ADDED IN FRENCH EXPORTS
As might be expected, the share of foreign value-added content in French manufacturing exports (35.3%) is higher than in the services sector (11.2%), although significant variations can be seen between different industries. In 2014, according to OECD estimates, foreign value added was particularly high in a number of French sectors. These included other transport equipment (47%), comprising among others the rail and aerospace industries; motor vehicles and trailers (40%); and textiles and clothing (33%).
Importantly, the sector in which France enjoys its highest global market share, the aerospace industry, was also the one whose output contained the most foreign value added, showing that greater international participation can be a key advantage for firms in the French exports market.
Analysis of value-added trade also sheds new light on the geographical breakdown of French exports, as the value-added data shows that France is less dependent on the European export market than data for gross exports would suggest. Euro zone countries make up 51% of France’s gross exports, but only 43% of its value-added exports.2
Furthermore, the shares of French exports sold to North America and Asia both increase if we measure them in value-added terms. While Germany, France’s largest trading partner, received 14% of gross French exports in 2011 and the United States 8%, these shares change to 12% and 10%, respectively, when measured in value added. This can be put down to France’s greater participation in regional value chains and the accordingly higher foreign content of French exports to Europe.
Bilateral trade balances calculated from value-added data also differ from those obtained by conventional analysis. When measured in this way, France’s goods and services trade deficits with China and Germany are 25% and 20% lower, respectively, with imports from Germany down by as much as one third.3 The explanation for these disparities lies in the use of intermediate goods produced by other foreign countries in the manufacture of goods subsequently exported from both countries.
Fig. 14 BREAKDOWN BY SECTOR OF FOREIGN CONTENT IN GROSS FRENCH EXPORTS (2014)
Source: OECD estimates
Belgium Netherlands Spain France Italy Germany United Kingdom
1990 1995 2000 2005 2010 2016
1, 000
900
800
700
600
500
400
300
200
100
0
40
35
30
25
20
15
10
5
0
0 10 20 30 40 50%
Food, beverages and tobacco
Wood and cork products
Machinery and equipment,not elsewhere classified
Fabricated metal products
Other non-metallic mineral products
Other transport equipment
Motor vehicles, trailers/semi-trailers
Textiles, clothing,leather goods and footwear
Chemicals
Base metals
Electronic equipment
Rubber and plastic products
Computer, electronic and optical products
47.2
39.7
33.3
33.1
31.6
31.2
31
30.1
29.8
27.7
24.3
23.6
23.4
2012 2016
9
8
7
6
5
4
3
2
1
0
%
%
2012 2016 2012 2016 2012 2016 2012 2016 2012 2016 2012 2016
Germany
8.4
Belgium
2.5
Spain
France
Italy
Netherlands
United Kingdom
1.8
3.2
2.9
3.6 2.6
World Europe North America Middle East and North Africa
Sub-Saharan Africa
Emerging Asia
20
18
16
14
12
10
8
6
4
2
0
0 5 10 15 20
United Arab Emirates
Czech Republic
Saudi Arabia
Brazil
Spain
Hong Kong
India
Italy
Morocco
Mexico
Poland
Russia
Singapore
Switzerland
Turkey
Germany
Austria
Belgium
United States
JapanRomania
Algeria
China
South Korea
HungaryNetherlands
United Kingdom
Sweden
Tunisia
Portugal
%
112
110
108
106
104
102
100
98
96Germany Belgium Spain France Italy Netherlands United Kingdom EU-28
2005 2006 2007 2008 2009 2010 2011 2012 2013 2014 2015 2016
130
125
120
115
110
105
100
95
90
85
80
Base 100 = 2010
Boilers, machinery, parts
Miscellaneous chemical products
Essential oils, perfumes, cosmetics
Aerospace industry
Beverages, spirits and vinegar
Dairy products, eggs, honey
Leather goods, handbags
Cereals
Pharmaceutical products
Paper, paperboard
Iron and steel
Plastics
Rubber
Vehicles, bicycles, and parts
Organic chemicals
Index France = 100
0 1 2 3 4 5 6
Boilers, machinery, parts
Miscellaneous chemical products
Essential oils, perfumes, cosmetics
Aerospace industry
Beverages, spirits and vinegar
Dairy products, eggs, honey
Leather goods, handbags
Cereals
Pharmaceutical products
Paper, paperboard
Iron and steel
Plastics
Rubber
Vehicles, bicycles, and parts
Organic chemicals
Optical, photo, medical/surgical instruments
Articles of iron or steel
Apparel articles, accessories
Electric machinery, TV/audio equipment
Natural pearls, precious stones/metals
Mineral fuel, oil, wax, bitumen
0 2 4 6 8 10 1612 14%
16
15.8
13.5
9.8
9.3
6.6
6.4
3.9
3.8
3.7
3.4
3.1
3
2.9
2.8
2.7
1.8
1.2
0.9
6
4
Aerospace 17.4
12.3
10.6
3.3
2.8
2.7
2.2
1.3
1.1
1.1
Beverages
Perfumes, cosmetics,cleaning products
Pharmaceuticals
Chemicals (except basic chemicals)
Electronic components and boards
Measuring, testing, navigation instruments; watches/clocks
Animal food
Manufacture of ships/boats
Dairy products
0-2 2 6 10 14 18
1
Belgium Netherlands France Germany UnitedKingdom
Austria Ireland Poland Sweden Italy Spain Finland
200
180
160
140
120
100
80
60
40
20
0
183
166
10096
92
7772
56
49 4844 43
90
80
70
60
50
40
30
20
10
0
100
90
80
70
60
50
40
30
20
10
0
31
9
9
9
7
4
3
2
2
4
1212
12
12
8
15
5
5
5
58
9
18
9
9
9
9
4
3
3
5
27
66
6
1020
6
6
6
6
6
6
6
6
10
16
4
4
26
5
7
7
6
6
8
8
11
8
7
13
4
2
17 17 17 18 19
8
70
5853
23
7
4737
5
16 1621
United States NetherlandsGermany United Kingdom
Switzerland Belgium Japan SwedenItaly Spain
Large corporates Mid-size companies SMEs and micro-enterprises
Large corporates Mid-size companies SMEs and micro-enterprises
100
90
80
70
60
50
40
30
20
10
0
26
4666 48
26
34
54
%
%
%
Base 100 = 1990
%
4.0
3.5
12.5
1.0
1.4
8.7
13.1
1.1
4.3
7.6
3.3
3.1
2.56.6
4.4
7.72.7
9.6
1.9
1.7
1.25.6
11.7
1.3
1.1
3.7
3.5
5.4
19.6
4.3
France in the world’s top five exporters
€ billion
Base 100 = 2010
3.23.6
1.6
4.1 4.0
1.3
3.2%: France’s overall global export market share
33
1
1
2
2
2
1
2 R. Cezar, France’s trade integration measured in value added, Banque de France, no. 205, May-June 2016, pages 25-34.3 F. Berthaud, French trade in value added, Treasury Directorate General, Trésor-Economics no. 207, October 2017.4 Études et Éclairages, No. 71, January 2017.
- 28 -
3 . FRANCE’S PLACE IN THE WORLD
METHODOLOGY
MEASURING TRADE IN VALUE ADDED
The trade figures presented in this chapter are
obtained from data for gross exports. Calculating
trade in this way does not consider the international
fragmentation of production processes, presenting
only the gross value of transactions between partner
countries without enabling us to determine how
much of the value of the traded good comes from
the exporting country.
However, consumer goods exported from Germany
or France will contain a proportion of value added
imported from other countries, generated by the
production of intermediate goods used to make the
exported good. For a more balanced view of the trade
sector, we should think in terms of value added.
The Trade in Value Added (TiVA) database is a joint
OECD-WTO initiative, with the aim of providing better
tracking of global production networks and supply
chains. The database contains a range of indicators
measuring the value-added content of cross-border
trade flows and final demand that are derived from
the 2016 version of the OECD’s Inter-Country Input-
Output (ICIO) Database.
The ICIO is constructed from various national and
international data sources, all compiled and weighted,
subject to their limitations, based on official (2008
SNA) National Accounts by economic activity and
main National Accounts aggregates.
However, the data produced are predicated on a wide
range of assumptions, and so any conclusions that
may be drawn should be treated with caution.
This situation arises in part from the structure of global production: the aviation industry remains concentrated in developed countries, which have higher levels of technological expertise. For example, 17% of aerospace exports go to Asia and the Middle East, compared with only 9% to neighboring countries, most of which only arises from Germany’s role in the Airbus international production chain. However, in the automotive industry, waves of outsourcing have shifted parts of the production process to leading emerging markets, with the result that vehicles produced in France are exported primarily to its neighbors.
The predominance of intra-industry trade among adjacent nations offers another partial explanation for the importance of intermediate goods in French trade with bordering countries. Intra-industry trade comprises either trade in products within the same industry, but involves different stages of production (vertical integration) or trade in end products within the same industry (horizontal integration).
The report found a greater propensity towards intra-industry trade with bordering countries (87%) than with non-bordering countries (71%), except in the case of the automotive industry, where outsourcing to Eastern Europe and Northern Africa has encouraged intra-sector trade with these countries.
The similarities in commodity composition in France’s trade (imports and exports) with adjacent countries, particularly Germany, Spain and the United Kingdom, reflect the importance of intra-industry trade. For other highly developed countries, the estimates point to horizontal trade, i.e. in identical products. This is especially true in the pharmaceutical sector for Germany, Spain, Italy and Belgium. France’s reputation for producing luxury items can be seen to have an impact on the trade in leather goods with Italy and jewelry with Switzerland, while trade in motor vehicles between France and the United Kingdom is another illustration of horizontal integration.
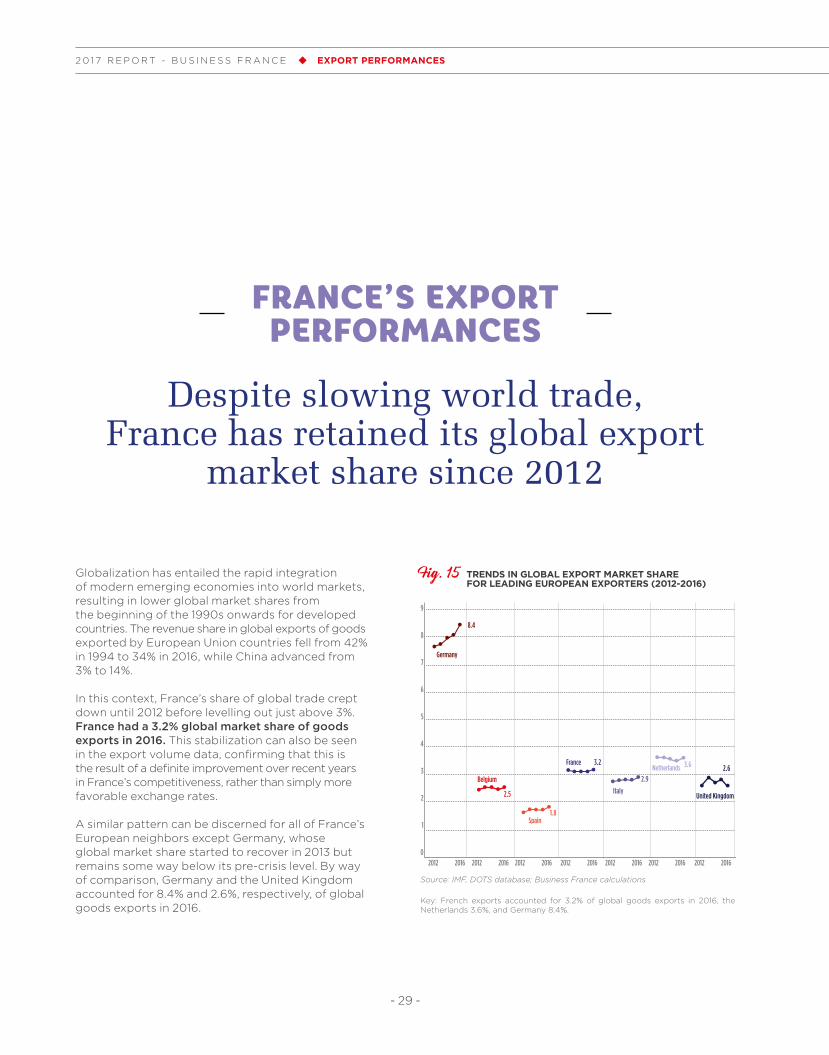
- 29 -
2 0 1 7 R E P O R T - B U S I N E S S F R A N C E EXPORT PERFORMANCES
Despite slowing world trade, France has retained its global export
market share since 2012
Globalization has entailed the rapid integration of modern emerging economies into world markets, resulting in lower global market shares from the beginning of the 1990s onwards for developed countries. The revenue share in global exports of goods exported by European Union countries fell from 42% in 1994 to 34% in 2016, while China advanced from 3% to 14%.
In this context, France’s share of global trade crept down until 2012 before levelling out just above 3%. France had a 3.2% global market share of goods exports in 2016. This stabilization can also be seen in the export volume data, confirming that this is the result of a definite improvement over recent years in France’s competitiveness, rather than simply more favorable exchange rates.
A similar pattern can be discerned for all of France’s European neighbors except Germany, whose global market share started to recover in 2013 but remains some way below its pre-crisis level. By way of comparison, Germany and the United Kingdom accounted for 8.4% and 2.6%, respectively, of global goods exports in 2016.
FRANCE’S EXPORT PERFORMANCES
Belgium Netherlands Spain France Italy Germany United Kingdom
1990 1995 2000 2005 2010 2016
1, 000
900
800
700
600
500
400
300
200
100
0
40
35
30
25
20
15
10
5
0
0 10 20 30 40 50%
Food, beverages and tobacco
Wood and cork products
Machinery and equipment,not elsewhere classified
Fabricated metal products
Other non-metallic mineral products
Other transport equipment
Motor vehicles, trailers/semi-trailers
Textiles, clothing,leather goods and footwear
Chemicals
Base metals
Electronic equipment
Rubber and plastic products
Computer, electronic and optical products
47.2
39.7
33.3
33.1
31.6
31.2
31
30.1
29.8
27.7
24.3
23.6
23.4
2012 2016
9
8
7
6
5
4
3
2
1
0
%
%
2012 2016 2012 2016 2012 2016 2012 2016 2012 2016 2012 2016
Germany
8.4
Belgium
2.5
Spain
France
Italy
Netherlands
United Kingdom
1.8
3.2
2.9
3.6 2.6
World Europe North America Middle East and North Africa
Sub-Saharan Africa
Emerging Asia
20
18
16
14
12
10
8
6
4
2
0
0 5 10 15 20
United Arab Emirates
Czech Republic
Saudi Arabia
Brazil
Spain
Hong Kong
India
Italy
Morocco
Mexico
Poland
Russia
Singapore
Switzerland
Turkey
Germany
Austria
Belgium
United States
JapanRomania
Algeria
China
South Korea
HungaryNetherlands
United Kingdom
Sweden
Tunisia
Portugal
%
112
110
108
106
104
102
100
98
96Germany Belgium Spain France Italy Netherlands United Kingdom EU-28
2005 2006 2007 2008 2009 2010 2011 2012 2013 2014 2015 2016
130
125
120
115
110
105
100
95
90
85
80
Base 100 = 2010
Boilers, machinery, parts
Miscellaneous chemical products
Essential oils, perfumes, cosmetics
Aerospace industry
Beverages, spirits and vinegar
Dairy products, eggs, honey
Leather goods, handbags
Cereals
Pharmaceutical products
Paper, paperboard
Iron and steel
Plastics
Rubber
Vehicles, bicycles, and parts
Organic chemicals
Index France = 100
0 1 2 3 4 5 6
Boilers, machinery, parts
Miscellaneous chemical products
Essential oils, perfumes, cosmetics
Aerospace industry
Beverages, spirits and vinegar
Dairy products, eggs, honey
Leather goods, handbags
Cereals
Pharmaceutical products
Paper, paperboard
Iron and steel
Plastics
Rubber
Vehicles, bicycles, and parts
Organic chemicals
Optical, photo, medical/surgical instruments
Articles of iron or steel
Apparel articles, accessories
Electric machinery, TV/audio equipment
Natural pearls, precious stones/metals
Mineral fuel, oil, wax, bitumen
0 2 4 6 8 10 1612 14%
16
15.8
13.5
9.8
9.3
6.6
6.4
3.9
3.8
3.7
3.4
3.1
3
2.9
2.8
2.7
1.8
1.2
0.9
6
4
Aerospace 17.4
12.3
10.6
3.3
2.8
2.7
2.2
1.3
1.1
1.1
Beverages
Perfumes, cosmetics,cleaning products
Pharmaceuticals
Chemicals (except basic chemicals)
Electronic components and boards
Measuring, testing, navigation instruments; watches/clocks
Animal food
Manufacture of ships/boats
Dairy products
0-2 2 6 10 14 18
1
Belgium Netherlands France Germany UnitedKingdom
Austria Ireland Poland Sweden Italy Spain Finland
200
180
160
140
120
100
80
60
40
20
0
183
166
10096
92
7772
56
49 4844 43
90
80
70
60
50
40
30
20
10
0
100
90
80
70
60
50
40
30
20
10
0
31
9
9
9
7
4
3
2
2
4
1212
12
12
8
15
5
5
5
58
9
18
9
9
9
9
4
3
3
5
27
66
6
1020
6
6
6
6
6
6
6
6
10
16
4
4
26
5
7
7
6
6
8
8
11
8
7
13
4
2
17 17 17 18 19
8
70
5853
23
7
4737
5
16 1621
United States NetherlandsGermany United Kingdom
Switzerland Belgium Japan SwedenItaly Spain
Large corporates Mid-size companies SMEs and micro-enterprises
Large corporates Mid-size companies SMEs and micro-enterprises
100
90
80
70
60
50
40
30
20
10
0
26
4666 48
26
34
54
%
%
%
Base 100 = 1990
%
4.0
3.5
12.5
1.0
1.4
8.7
13.1
1.1
4.3
7.6
3.3
3.1
2.56.6
4.4
7.72.7
9.6
1.9
1.7
1.25.6
11.7
1.3
1.1
3.7
3.5
5.4
19.6
4.3
France in the world’s top five exporters
€ billion
Base 100 = 2010
3.23.6
1.6
4.1 4.0
1.3
3.2%: France’s overall global export market share
33
1
1
2
2
2
1
Source: IMF, DOTS database; Business France calculations
Fig. 15 TRENDS IN GLOBAL EXPORT MARKET SHARE FOR LEADING EUROPEAN EXPORTERS (2012-2016)
Key: French exports accounted for 3.2% of global goods exports in 2016, the Netherlands 3.6%, and Germany 8.4%.
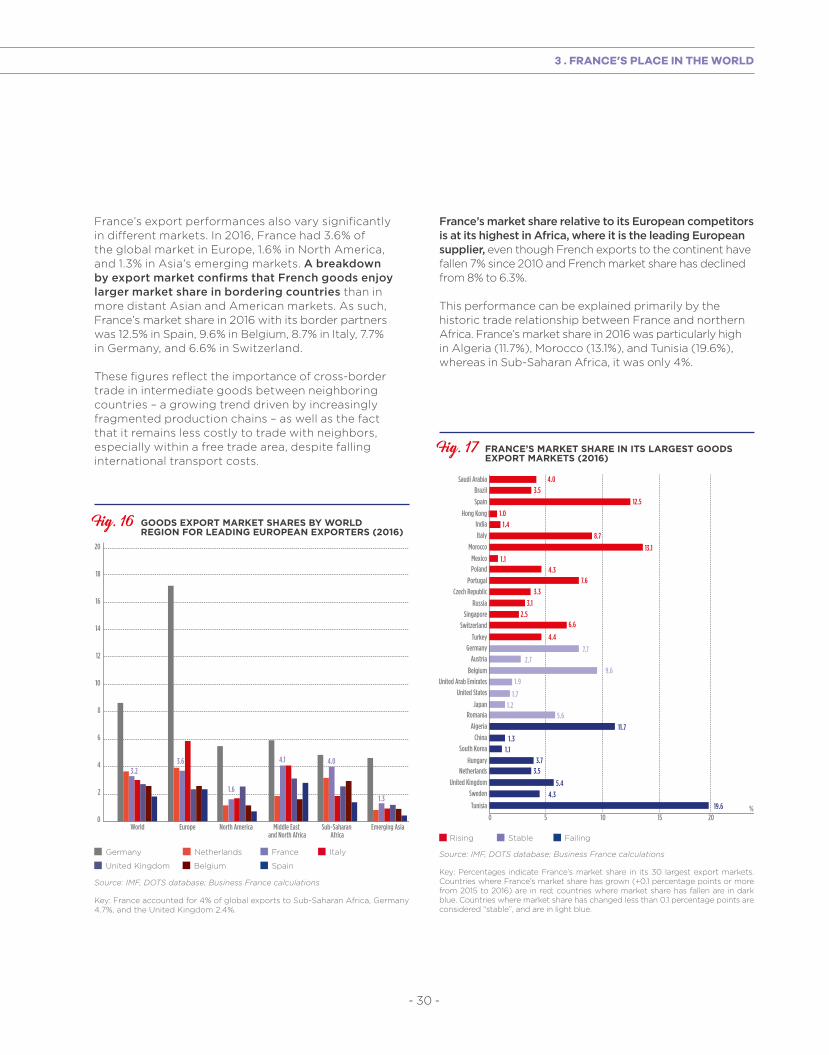
- 30 -
3 . FRANCE’S PLACE IN THE WORLD
France’s export performances also vary significantly in different markets. In 2016, France had 3.6% of the global market in Europe, 1.6% in North America, and 1.3% in Asia’s emerging markets. A breakdown by export market confirms that French goods enjoy larger market share in bordering countries than in more distant Asian and American markets. As such, France’s market share in 2016 with its border partners was 12.5% in Spain, 9.6% in Belgium, 8.7% in Italy, 7.7% in Germany, and 6.6% in Switzerland.
These figures reflect the importance of cross-border trade in intermediate goods between neighboring countries – a growing trend driven by increasingly fragmented production chains – as well as the fact that it remains less costly to trade with neighbors, especially within a free trade area, despite falling international transport costs.
Belgium Netherlands Spain France Italy Germany United Kingdom
1990 1995 2000 2005 2010 2016
1, 000
900
800
700
600
500
400
300
200
100
0
40
35
30
25
20
15
10
5
0
0 10 20 30 40 50%
Food, beverages and tobacco
Wood and cork products
Machinery and equipment,not elsewhere classified
Fabricated metal products
Other non-metallic mineral products
Other transport equipment
Motor vehicles, trailers/semi-trailers
Textiles, clothing,leather goods and footwear
Chemicals
Base metals
Electronic equipment
Rubber and plastic products
Computer, electronic and optical products
47.2
39.7
33.3
33.1
31.6
31.2
31
30.1
29.8
27.7
24.3
23.6
23.4
2012 2016
9
8
7
6
5
4
3
2
1
0
%
%
2012 2016 2012 2016 2012 2016 2012 2016 2012 2016 2012 2016
Germany
8.4
Belgium
2.5
Spain
France
Italy
Netherlands
United Kingdom
1.8
3.2
2.9
3.6 2.6
World Europe North America Middle East and North Africa
Sub-Saharan Africa
Emerging Asia
20
18
16
14
12
10
8
6
4
2
0
0 5 10 15 20
United Arab Emirates
Czech Republic
Saudi Arabia
Brazil
Spain
Hong Kong
India
Italy
Morocco
Mexico
Poland
Russia
Singapore
Switzerland
Turkey
Germany
Austria
Belgium
United States
JapanRomania
Algeria
China
South Korea
HungaryNetherlands
United Kingdom
Sweden
Tunisia
Portugal
%
112
110
108
106
104
102
100
98
96Germany Belgium Spain France Italy Netherlands United Kingdom EU-28
2005 2006 2007 2008 2009 2010 2011 2012 2013 2014 2015 2016
130
125
120
115
110
105
100
95
90
85
80
Base 100 = 2010
Boilers, machinery, parts
Miscellaneous chemical products
Essential oils, perfumes, cosmetics
Aerospace industry
Beverages, spirits and vinegar
Dairy products, eggs, honey
Leather goods, handbags
Cereals
Pharmaceutical products
Paper, paperboard
Iron and steel
Plastics
Rubber
Vehicles, bicycles, and parts
Organic chemicals
Index France = 100
0 1 2 3 4 5 6
Boilers, machinery, parts
Miscellaneous chemical products
Essential oils, perfumes, cosmetics
Aerospace industry
Beverages, spirits and vinegar
Dairy products, eggs, honey
Leather goods, handbags
Cereals
Pharmaceutical products
Paper, paperboard
Iron and steel
Plastics
Rubber
Vehicles, bicycles, and parts
Organic chemicals
Optical, photo, medical/surgical instruments
Articles of iron or steel
Apparel articles, accessories
Electric machinery, TV/audio equipment
Natural pearls, precious stones/metals
Mineral fuel, oil, wax, bitumen
0 2 4 6 8 10 1612 14%
16
15.8
13.5
9.8
9.3
6.6
6.4
3.9
3.8
3.7
3.4
3.1
3
2.9
2.8
2.7
1.8
1.2
0.9
6
4
Aerospace 17.4
12.3
10.6
3.3
2.8
2.7
2.2
1.3
1.1
1.1
Beverages
Perfumes, cosmetics,cleaning products
Pharmaceuticals
Chemicals (except basic chemicals)
Electronic components and boards
Measuring, testing, navigation instruments; watches/clocks
Animal food
Manufacture of ships/boats
Dairy products
0-2 2 6 10 14 18
1
Belgium Netherlands France Germany UnitedKingdom
Austria Ireland Poland Sweden Italy Spain Finland
200
180
160
140
120
100
80
60
40
20
0
183
166
10096
92
7772
56
49 4844 43
90
80
70
60
50
40
30
20
10
0
100
90
80
70
60
50
40
30
20
10
0
31
9
9
9
7
4
3
2
2
4
1212
12
12
8
15
5
5
5
58
9
18
9
9
9
9
4
3
3
5
27
66
6
1020
6
6
6
6
6
6
6
6
10
16
4
4
26
5
7
7
6
6
8
8
11
8
7
13
4
2
17 17 17 18 19
8
70
5853
23
7
4737
5
16 1621
United States NetherlandsGermany United Kingdom
Switzerland Belgium Japan SwedenItaly Spain
Large corporates Mid-size companies SMEs and micro-enterprises
Large corporates Mid-size companies SMEs and micro-enterprises
100
90
80
70
60
50
40
30
20
10
0
26
4666 48
26
34
54
%
%
%
Base 100 = 1990
%
4.0
3.5
12.5
1.0
1.4
8.7
13.1
1.1
4.3
7.6
3.3
3.1
2.56.6
4.4
7.72.7
9.6
1.9
1.7
1.25.6
11.7
1.3
1.1
3.7
3.5
5.4
19.6
4.3
France in the world’s top five exporters
€ billion
Base 100 = 2010
3.23.6
1.6
4.1 4.0
1.3
3.2%: France’s overall global export market share
33
1
1
2
2
2
1
Source: IMF, DOTS database; Business France calculations
Fig. 16 GOODS EXPORT MARKET SHARES BY WORLD REGION FOR LEADING EUROPEAN EXPORTERS (2016)
Fig. 17 FRANCE’S MARKET SHARE IN ITS LARGEST GOODS EXPORT MARKETS (2016)
Key: France accounted for 4% of global exports to Sub-Saharan Africa, Germany 4.7%, and the United Kingdom 2.4%.
France’s market share relative to its European competitors is at its highest in Africa, where it is the leading European supplier, even though French exports to the continent have fallen 7% since 2010 and French market share has declined from 8% to 6.3%.
This performance can be explained primarily by the historic trade relationship between France and northern Africa. France’s market share in 2016 was particularly high in Algeria (11.7%), Morocco (13.1%), and Tunisia (19.6%), whereas in Sub-Saharan Africa, it was only 4%.
Germany Netherlands France Italy
United Kingdom Belgium SpainSource: IMF, DOTS database; Business France calculations
Key: Percentages indicate France’s market share in its 30 largest export markets. Countries where France’s market share has grown (+0.1 percentage points or more from 2015 to 2016) are in red; countries where market share has fallen are in dark blue. Countries where market share has changed less than 0.1 percentage points are considered “stable”, and are in light blue.
Rising Stable Failing
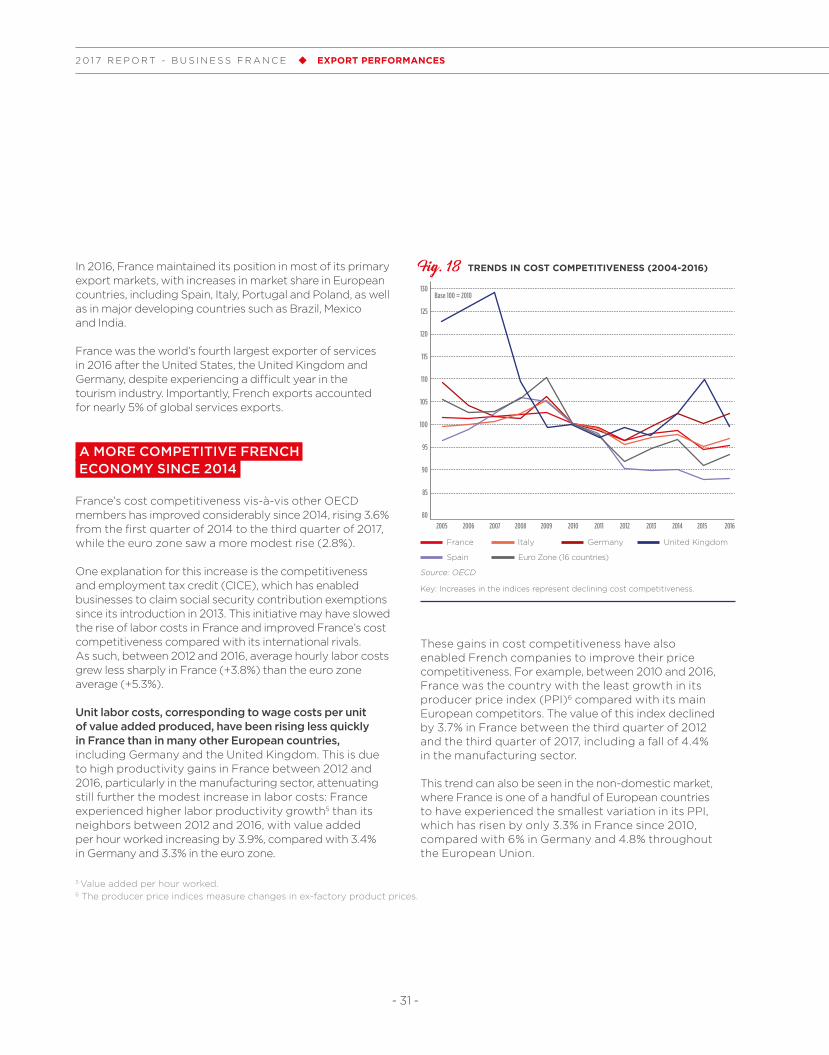
- 31 -
2 0 1 7 R E P O R T - B U S I N E S S F R A N C E EXPORT PERFORMANCES
5 Value added per hour worked.6 The producer price indices measure changes in ex-factory product prices.
These gains in cost competitiveness have also enabled French companies to improve their price competitiveness. For example, between 2010 and 2016, France was the country with the least growth in its producer price index (PPI)6 compared with its main European competitors. The value of this index declined by 3.7% in France between the third quarter of 2012 and the third quarter of 2017, including a fall of 4.4% in the manufacturing sector.
This trend can also be seen in the non-domestic market, where France is one of a handful of European countries to have experienced the smallest variation in its PPI, which has risen by only 3.3% in France since 2010, compared with 6% in Germany and 4.8% throughout the European Union.
In 2016, France maintained its position in most of its primary export markets, with increases in market share in European countries, including Spain, Italy, Portugal and Poland, as well as in major developing countries such as Brazil, Mexico and India.
France was the world’s fourth largest exporter of services in 2016 after the United States, the United Kingdom and Germany, despite experiencing a difficult year in the tourism industry. Importantly, French exports accounted for nearly 5% of global services exports.
A MORE COMPETITIVE FRENCH ECONOMY SINCE 2014
France’s cost competitiveness vis-à-vis other OECD members has improved considerably since 2014, rising 3.6% from the first quarter of 2014 to the third quarter of 2017, while the euro zone saw a more modest rise (2.8%).
One explanation for this increase is the competitiveness and employment tax credit (CICE), which has enabled businesses to claim social security contribution exemptions since its introduction in 2013. This initiative may have slowed the rise of labor costs in France and improved France’s cost competitiveness compared with its international rivals. As such, between 2012 and 2016, average hourly labor costs grew less sharply in France (+3.8%) than the euro zone average (+5.3%).
Unit labor costs, corresponding to wage costs per unit of value added produced, have been rising less quickly in France than in many other European countries, including Germany and the United Kingdom. This is due to high productivity gains in France between 2012 and 2016, particularly in the manufacturing sector, attenuating still further the modest increase in labor costs: France experienced higher labor productivity growth5 than its neighbors between 2012 and 2016, with value added per hour worked increasing by 3.9%, compared with 3.4% in Germany and 3.3% in the euro zone.
Germany United Kingdom
Euro Zone (16 countries)Spain
Fig. 18 TRENDS IN COST COMPETITIVENESS (2004-2016)
Belgium Netherlands Spain France Italy Germany United Kingdom
1990 1995 2000 2005 2010 2016
1, 000
900
800
700
600
500
400
300
200
100
0
40
35
30
25
20
15
10
5
0
0 10 20 30 40 50%
Food, beverages and tobacco
Wood and cork products
Machinery and equipment,not elsewhere classified
Fabricated metal products
Other non-metallic mineral products
Other transport equipment
Motor vehicles, trailers/semi-trailers
Textiles, clothing,leather goods and footwear
Chemicals
Base metals
Electronic equipment
Rubber and plastic products
Computer, electronic and optical products
47.2
39.7
33.3
33.1
31.6
31.2
31
30.1
29.8
27.7
24.3
23.6
23.4
2012 2016
9
8
7
6
5
4
3
2
1
0
%
%
2012 2016 2012 2016 2012 2016 2012 2016 2012 2016 2012 2016
Germany
8.4
Belgium
2.5
Spain
France
Italy
Netherlands
United Kingdom
1.8
3.2
2.9
3.6 2.6
World Europe North America Middle East and North Africa
Sub-Saharan Africa
Emerging Asia
20
18
16
14
12
10
8
6
4
2
0
0 5 10 15 20
United Arab Emirates
Czech Republic
Saudi Arabia
Brazil
Spain
Hong Kong
India
Italy
Morocco
Mexico
Poland
Russia
Singapore
Switzerland
Turkey
Germany
Austria
Belgium
United States
JapanRomania
Algeria
China
South Korea
HungaryNetherlands
United Kingdom
Sweden
Tunisia
Portugal
%
112
110
108
106
104
102
100
98
96Germany Belgium Spain France Italy Netherlands United Kingdom EU-28
2005 2006 2007 2008 2009 2010 2011 2012 2013 2014 2015 2016
130
125
120
115
110
105
100
95
90
85
80
Base 100 = 2010
Boilers, machinery, parts
Miscellaneous chemical products
Essential oils, perfumes, cosmetics
Aerospace industry
Beverages, spirits and vinegar
Dairy products, eggs, honey
Leather goods, handbags
Cereals
Pharmaceutical products
Paper, paperboard
Iron and steel
Plastics
Rubber
Vehicles, bicycles, and parts
Organic chemicals
Index France = 100
0 1 2 3 4 5 6
Boilers, machinery, parts
Miscellaneous chemical products
Essential oils, perfumes, cosmetics
Aerospace industry
Beverages, spirits and vinegar
Dairy products, eggs, honey
Leather goods, handbags
Cereals
Pharmaceutical products
Paper, paperboard
Iron and steel
Plastics
Rubber
Vehicles, bicycles, and parts
Organic chemicals
Optical, photo, medical/surgical instruments
Articles of iron or steel
Apparel articles, accessories
Electric machinery, TV/audio equipment
Natural pearls, precious stones/metals
Mineral fuel, oil, wax, bitumen
0 2 4 6 8 10 1612 14%
16
15.8
13.5
9.8
9.3
6.6
6.4
3.9
3.8
3.7
3.4
3.1
3
2.9
2.8
2.7
1.8
1.2
0.9
6
4
Aerospace 17.4
12.3
10.6
3.3
2.8
2.7
2.2
1.3
1.1
1.1
Beverages
Perfumes, cosmetics,cleaning products
Pharmaceuticals
Chemicals (except basic chemicals)
Electronic components and boards
Measuring, testing, navigation instruments; watches/clocks
Animal food
Manufacture of ships/boats
Dairy products
0-2 2 6 10 14 18
1
Belgium Netherlands France Germany UnitedKingdom
Austria Ireland Poland Sweden Italy Spain Finland
200
180
160
140
120
100
80
60
40
20
0
183
166
10096
92
7772
56
49 4844 43
90
80
70
60
50
40
30
20
10
0
100
90
80
70
60
50
40
30
20
10
0
31
9
9
9
7
4
3
2
2
4
1212
12
12
8
15
5
5
5
58
9
18
9
9
9
9
4
3
3
5
27
66
6
1020
6
6
6
6
6
6
6
6
10
16
4
4
26
5
7
7
6
6
8
8
11
8
7
13
4
2
17 17 17 18 19
8
70
5853
23
7
4737
5
16 1621
United States NetherlandsGermany United Kingdom
Switzerland Belgium Japan SwedenItaly Spain
Large corporates Mid-size companies SMEs and micro-enterprises
Large corporates Mid-size companies SMEs and micro-enterprises
100
90
80
70
60
50
40
30
20
10
0
26
4666 48
26
34
54
%
%
%
Base 100 = 1990
%
4.0
3.5
12.5
1.0
1.4
8.7
13.1
1.1
4.3
7.6
3.3
3.1
2.56.6
4.4
7.72.7
9.6
1.9
1.7
1.25.6
11.7
1.3
1.1
3.7
3.5
5.4
19.6
4.3
France in the world’s top five exporters
€ billion
Base 100 = 2010
3.23.6
1.6
4.1 4.0
1.3
3.2%: France’s overall global export market share
33
1
1
2
2
2
1
ItalyFrance
Source: OECD
Key: Increases in the indices represent declining cost competitiveness.
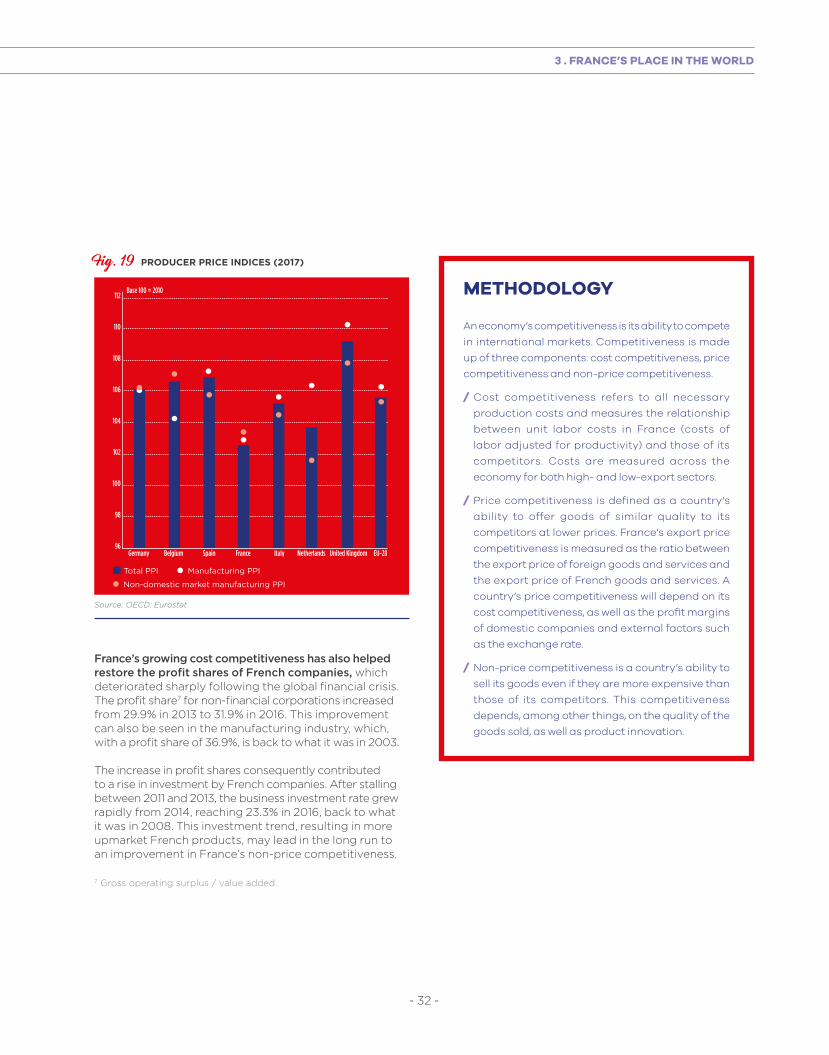
- 32 -
3 . FRANCE’S PLACE IN THE WORLD
7 Gross operating surplus / value added.
METHODOLOGY
An economy’s competitiveness is its ability to compete
in international markets. Competitiveness is made
up of three components: cost competitiveness, price
competitiveness and non-price competitiveness.
/ Cost competitiveness refers to all necessary
production costs and measures the relationship
between unit labor costs in France (costs of
labor adjusted for productivity) and those of its
competitors. Costs are measured across the
economy for both high- and low-export sectors.
/ Price competitiveness is defined as a country’s
ability to offer goods of similar quality to its
competitors at lower prices. France’s export price
competitiveness is measured as the ratio between
the export price of foreign goods and services and
the export price of French goods and services. A
country’s price competitiveness will depend on its
cost competitiveness, as well as the profit margins
of domestic companies and external factors such
as the exchange rate.
/ Non-price competitiveness is a country’s ability to
sell its goods even if they are more expensive than
those of its competitors. This competitiveness
depends, among other things, on the quality of the
goods sold, as well as product innovation.
France’s growing cost competitiveness has also helped restore the profit shares of French companies, which deteriorated sharply following the global financial crisis. The profit share7 for non-financial corporations increased from 29.9% in 2013 to 31.9% in 2016. This improvement can also be seen in the manufacturing industry, which, with a profit share of 36.9%, is back to what it was in 2003.
The increase in profit shares consequently contributed to a rise in investment by French companies. After stalling between 2011 and 2013, the business investment rate grew rapidly from 2014, reaching 23.3% in 2016, back to what it was in 2008. This investment trend, resulting in more upmarket French products, may lead in the long run to an improvement in France’s non-price competitiveness.
Fig. 19 PRODUCER PRICE INDICES (2017)
Belgium Netherlands Spain France Italy Germany United Kingdom
1990 1995 2000 2005 2010 2016
1, 000
900
800
700
600
500
400
300
200
100
0
40
35
30
25
20
15
10
5
0
0 10 20 30 40 50%
Food, beverages and tobacco
Wood and cork products
Machinery and equipment,not elsewhere classified
Fabricated metal products
Other non-metallic mineral products
Other transport equipment
Motor vehicles, trailers/semi-trailers
Textiles, clothing,leather goods and footwear
Chemicals
Base metals
Electronic equipment
Rubber and plastic products
Computer, electronic and optical products
47.2
39.7
33.3
33.1
31.6
31.2
31
30.1
29.8
27.7
24.3
23.6
23.4
2012 2016
9
8
7
6
5
4
3
2
1
0
%
%
2012 2016 2012 2016 2012 2016 2012 2016 2012 2016 2012 2016
Germany
8.4
Belgium
2.5
Spain
France
Italy
Netherlands
United Kingdom
1.8
3.2
2.9
3.6 2.6
World Europe North America Middle East and North Africa
Sub-Saharan Africa
Emerging Asia
20
18
16
14
12
10
8
6
4
2
0
0 5 10 15 20
United Arab Emirates
Czech Republic
Saudi Arabia
Brazil
Spain
Hong Kong
India
Italy
Morocco
Mexico
Poland
Russia
Singapore
Switzerland
Turkey
Germany
Austria
Belgium
United States
JapanRomania
Algeria
China
South Korea
HungaryNetherlands
United Kingdom
Sweden
Tunisia
Portugal
%
112
110
108
106
104
102
100
98
96Germany Belgium Spain France Italy Netherlands United Kingdom EU-28
2005 2006 2007 2008 2009 2010 2011 2012 2013 2014 2015 2016
130
125
120
115
110
105
100
95
90
85
80
Base 100 = 2010
Boilers, machinery, parts
Miscellaneous chemical products
Essential oils, perfumes, cosmetics
Aerospace industry
Beverages, spirits and vinegar
Dairy products, eggs, honey
Leather goods, handbags
Cereals
Pharmaceutical products
Paper, paperboard
Iron and steel
Plastics
Rubber
Vehicles, bicycles, and parts
Organic chemicals
Index France = 100
0 1 2 3 4 5 6
Boilers, machinery, parts
Miscellaneous chemical products
Essential oils, perfumes, cosmetics
Aerospace industry
Beverages, spirits and vinegar
Dairy products, eggs, honey
Leather goods, handbags
Cereals
Pharmaceutical products
Paper, paperboard
Iron and steel
Plastics
Rubber
Vehicles, bicycles, and parts
Organic chemicals
Optical, photo, medical/surgical instruments
Articles of iron or steel
Apparel articles, accessories
Electric machinery, TV/audio equipment
Natural pearls, precious stones/metals
Mineral fuel, oil, wax, bitumen
0 2 4 6 8 10 1612 14%
16
15.8
13.5
9.8
9.3
6.6
6.4
3.9
3.8
3.7
3.4
3.1
3
2.9
2.8
2.7
1.8
1.2
0.9
6
4
Aerospace 17.4
12.3
10.6
3.3
2.8
2.7
2.2
1.3
1.1
1.1
Beverages
Perfumes, cosmetics,cleaning products
Pharmaceuticals
Chemicals (except basic chemicals)
Electronic components and boards
Measuring, testing, navigation instruments; watches/clocks
Animal food
Manufacture of ships/boats
Dairy products
0-2 2 6 10 14 18
1
Belgium Netherlands France Germany UnitedKingdom
Austria Ireland Poland Sweden Italy Spain Finland
200
180
160
140
120
100
80
60
40
20
0
183
166
10096
92
7772
56
49 4844 43
90
80
70
60
50
40
30
20
10
0
100
90
80
70
60
50
40
30
20
10
0
31
9
9
9
7
4
3
2
2
4
1212
12
12
8
15
5
5
5
58
9
18
9
9
9
9
4
3
3
5
27
66
6
1020
6
6
6
6
6
6
6
6
10
16
4
4
26
5
7
7
6
6
8
8
11
8
7
13
4
2
17 17 17 18 19
8
70
5853
23
7
4737
5
16 1621
United States NetherlandsGermany United Kingdom
Switzerland Belgium Japan SwedenItaly Spain
Large corporates Mid-size companies SMEs and micro-enterprises
Large corporates Mid-size companies SMEs and micro-enterprises
100
90
80
70
60
50
40
30
20
10
0
26
4666 48
26
34
54
%
%
%
Base 100 = 1990
%
4.0
3.5
12.5
1.0
1.4
8.7
13.1
1.1
4.3
7.6
3.3
3.1
2.56.6
4.4
7.72.7
9.6
1.9
1.7
1.25.6
11.7
1.3
1.1
3.7
3.5
5.4
19.6
4.3
France in the world’s top five exporters
€ billion
Base 100 = 2010
3.23.6
1.6
4.1 4.0
1.3
3.2%: France’s overall global export market share
33
1
1
2
2
2
1
Source: OECD; Eurostat
Total PPI Manufacturing PPI
Non-domestic market manufacturing PPI
- 33 -
2 0 1 7 R E P O R T - B U S I N E S S F R A N C E EXPORT PERFORMANCES
France is a global leader in various sectors
of excellence
GLOBAL EXPORT MARKET SHARE
French exports accounted for 3.2% of global exports in 2016, making France the world’s seventh largest exporter. However, this percentage is markedly higher in sectors where France is very competitive internationally.
French expertise in cutting-edge and high-tech sectors is acknowledged internationally. France was the second largest aerospace exporter in 2016, accounting for 16% of global exports, and the leading exporter of perfumes and cosmetics, with a global export share of 13.8%. Other sectors standing out internationally included the chemical and pharmaceutical industries.
SECTOR-SPECIFIC SPECIALIZATION
French products from the country’s traditional areas of expertise also performed very well. France was the world’s leading exporter of beverages, making up 28% of global wine exports. With regard to food other than beverages, France was the world’s third largest exporter of cereals and the fourth largest exporter of dairy products.
France also stood out in sectors representing smaller portions of international trade such as watches and clocks, where France was fourth with 5.2% of global exports, and glassware, where it was also fourth, with 4.8% of global exports.
Despite a declining number of sectors in which France is among the world’s leading five exporters, France remained a leading exporter in 25 sectors in 2017, compared with 34 in 2002.
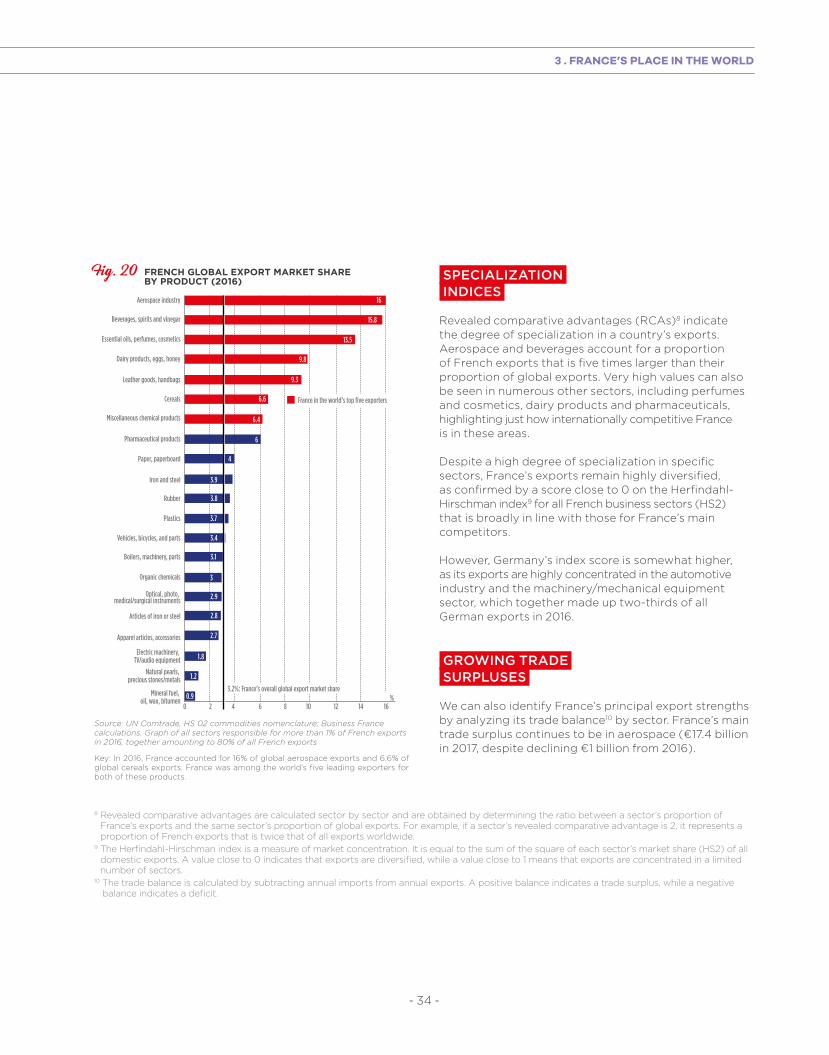
- 34 -
3 . FRANCE’S PLACE IN THE WORLD
8 Revealed comparative advantages are calculated sector by sector and are obtained by determining the ratio between a sector’s proportion of France’s exports and the same sector’s proportion of global exports. For example, if a sector’s revealed comparative advantage is 2, it represents a proportion of French exports that is twice that of all exports worldwide.
9 The Herfindahl-Hirschman index is a measure of market concentration. It is equal to the sum of the square of each sector’s market share (HS2) of all domestic exports. A value close to 0 indicates that exports are diversified, while a value close to 1 means that exports are concentrated in a limited number of sectors.
10 The trade balance is calculated by subtracting annual imports from annual exports. A positive balance indicates a trade surplus, while a negative balance indicates a deficit.
SPECIALIZATION INDICES
Revealed comparative advantages (RCAs)8 indicate the degree of specialization in a country’s exports. Aerospace and beverages account for a proportion of French exports that is five times larger than their proportion of global exports. Very high values can also be seen in numerous other sectors, including perfumes and cosmetics, dairy products and pharmaceuticals, highlighting just how internationally competitive France is in these areas.
Despite a high degree of specialization in specific sectors, France’s exports remain highly diversified, as confirmed by a score close to 0 on the Herfindahl-Hirschman index9 for all French business sectors (HS2) that is broadly in line with those for France’s main competitors.
However, Germany’s index score is somewhat higher, as its exports are highly concentrated in the automotive industry and the machinery/mechanical equipment sector, which together made up two-thirds of all German exports in 2016.
GROWING TRADE SURPLUSES
We can also identify France’s principal export strengths by analyzing its trade balance10 by sector. France’s main trade surplus continues to be in aerospace (€17.4 billion in 2017, despite declining €1 billion from 2016).
Fig. 20 FRENCH GLOBAL EXPORT MARKET SHARE BY PRODUCT (2016)
Belgium Netherlands Spain France Italy Germany United Kingdom
1990 1995 2000 2005 2010 2016
1, 000
900
800
700
600
500
400
300
200
100
0
40
35
30
25
20
15
10
5
0
0 10 20 30 40 50%
Food, beverages and tobacco
Wood and cork products
Machinery and equipment,not elsewhere classified
Fabricated metal products
Other non-metallic mineral products
Other transport equipment
Motor vehicles, trailers/semi-trailers
Textiles, clothing,leather goods and footwear
Chemicals
Base metals
Electronic equipment
Rubber and plastic products
Computer, electronic and optical products
47.2
39.7
33.3
33.1
31.6
31.2
31
30.1
29.8
27.7
24.3
23.6
23.4
2012 2016
9
8
7
6
5
4
3
2
1
0
%
%
2012 2016 2012 2016 2012 2016 2012 2016 2012 2016 2012 2016
Germany
8.4
Belgium
2.5
Spain
France
Italy
Netherlands
United Kingdom
1.8
3.2
2.9
3.6 2.6
World Europe North America Middle East and North Africa
Sub-Saharan Africa
Emerging Asia
20
18
16
14
12
10
8
6
4
2
0
0 5 10 15 20
United Arab Emirates
Czech Republic
Saudi Arabia
Brazil
Spain
Hong Kong
India
Italy
Morocco
Mexico
Poland
Russia
Singapore
Switzerland
Turkey
Germany
Austria
Belgium
United States
JapanRomania
Algeria
China
South Korea
HungaryNetherlands
United Kingdom
Sweden
Tunisia
Portugal
%
112
110
108
106
104
102
100
98
96Germany Belgium Spain France Italy Netherlands United Kingdom EU-28
2005 2006 2007 2008 2009 2010 2011 2012 2013 2014 2015 2016
130
125
120
115
110
105
100
95
90
85
80
Base 100 = 2010
Boilers, machinery, parts
Miscellaneous chemical products
Essential oils, perfumes, cosmetics
Aerospace industry
Beverages, spirits and vinegar
Dairy products, eggs, honey
Leather goods, handbags
Cereals
Pharmaceutical products
Paper, paperboard
Iron and steel
Plastics
Rubber
Vehicles, bicycles, and parts
Organic chemicals
Index France = 100
0 1 2 3 4 5 6
Boilers, machinery, parts
Miscellaneous chemical products
Essential oils, perfumes, cosmetics
Aerospace industry
Beverages, spirits and vinegar
Dairy products, eggs, honey
Leather goods, handbags
Cereals
Pharmaceutical products
Paper, paperboard
Iron and steel
Plastics
Rubber
Vehicles, bicycles, and parts
Organic chemicals
Optical, photo, medical/surgical instruments
Articles of iron or steel
Apparel articles, accessories
Electric machinery, TV/audio equipment
Natural pearls, precious stones/metals
Mineral fuel, oil, wax, bitumen
0 2 4 6 8 10 1612 14%
16
15.8
13.5
9.8
9.3
6.6
6.4
3.9
3.8
3.7
3.4
3.1
3
2.9
2.8
2.7
1.8
1.2
0.9
6
4
Aerospace 17.4
12.3
10.6
3.3
2.8
2.7
2.2
1.3
1.1
1.1
Beverages
Perfumes, cosmetics,cleaning products
Pharmaceuticals
Chemicals (except basic chemicals)
Electronic components and boards
Measuring, testing, navigation instruments; watches/clocks
Animal food
Manufacture of ships/boats
Dairy products
0-2 2 6 10 14 18
1
Belgium Netherlands France Germany UnitedKingdom
Austria Ireland Poland Sweden Italy Spain Finland
200
180
160
140
120
100
80
60
40
20
0
183
166
10096
92
7772
56
49 4844 43
90
80
70
60
50
40
30
20
10
0
100
90
80
70
60
50
40
30
20
10
0
31
9
9
9
7
4
3
2
2
4
1212
12
12
8
15
5
5
5
58
9
18
9
9
9
9
4
3
3
5
27
66
6
1020
6
6
6
6
6
6
6
6
10
16
4
4
26
5
7
7
6
6
8
8
11
8
7
13
4
2
17 17 17 18 19
8
70
5853
23
7
4737
5
16 1621
United States NetherlandsGermany United Kingdom
Switzerland Belgium Japan SwedenItaly Spain
Large corporates Mid-size companies SMEs and micro-enterprises
Large corporates Mid-size companies SMEs and micro-enterprises
100
90
80
70
60
50
40
30
20
10
0
26
4666 48
26
34
54
%
%
%
Base 100 = 1990
%
4.0
3.5
12.5
1.0
1.4
8.7
13.1
1.1
4.3
7.6
3.3
3.1
2.56.6
4.4
7.72.7
9.6
1.9
1.7
1.25.6
11.7
1.3
1.1
3.7
3.5
5.4
19.6
4.3
France in the world’s top five exporters
€ billion
Base 100 = 2010
3.23.6
1.6
4.1 4.0
1.3
3.2%: France’s overall global export market share
33
1
1
2
2
2
1
Source: UN Comtrade, HS 02 commodities nomenclature; Business France calculations. Graph of all sectors responsible for more than 1% of French exports in 2016, together amounting to 80% of all French exports
Key: In 2016, France accounted for 16% of global aerospace exports and 6.6% of global cereals exports. France was among the world’s five leading exporters for both of these products.
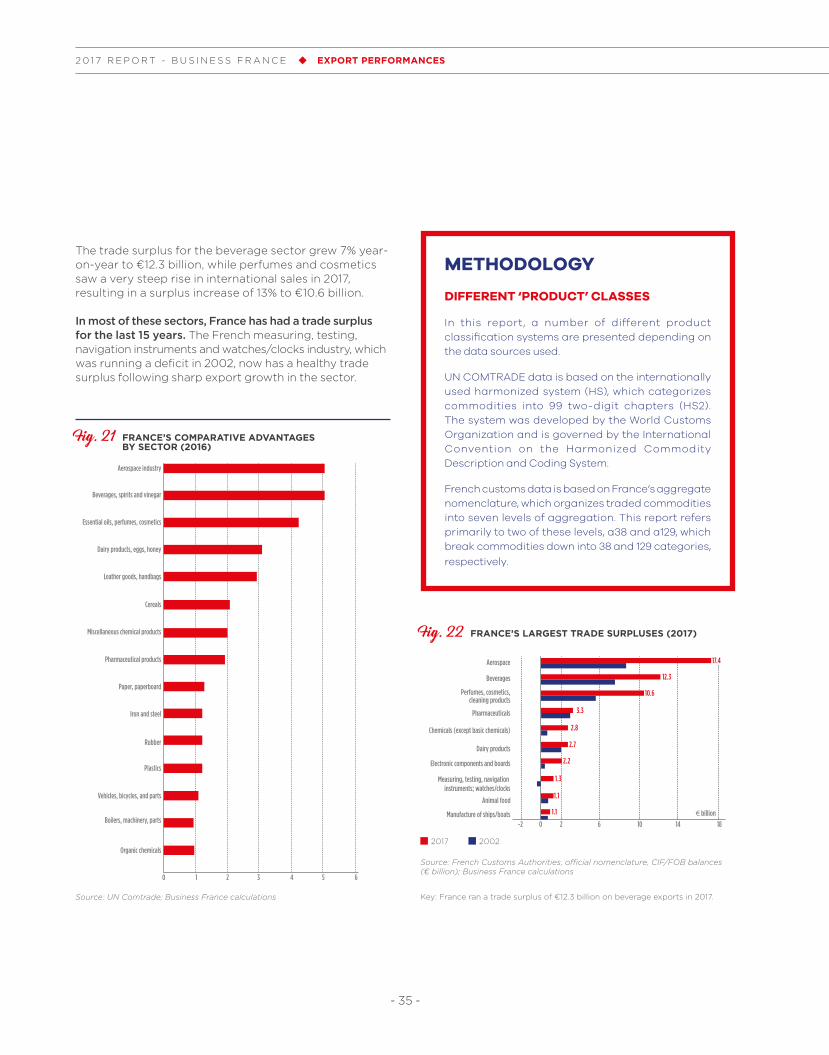
- 35 -
2 0 1 7 R E P O R T - B U S I N E S S F R A N C E EXPORT PERFORMANCES
METHODOLOGY
DIFFERENT ‘PRODUCT’ CLASSES
In this report, a number of different product classification systems are presented depending on the data sources used.
UN COMTRADE data is based on the internationally used harmonized system (HS), which categorizes commodities into 99 two-digit chapters (HS2). The system was developed by the World Customs Organization and is governed by the International Convention on the Harmonized Commodity Description and Coding System.
French customs data is based on France’s aggregate nomenclature, which organizes traded commodities into seven levels of aggregation. This report refers primarily to two of these levels, a38 and a129, which break commodities down into 38 and 129 categories,
respectively.
The trade surplus for the beverage sector grew 7% year-on-year to €12.3 billion, while perfumes and cosmetics saw a very steep rise in international sales in 2017, resulting in a surplus increase of 13% to €10.6 billion.
In most of these sectors, France has had a trade surplus for the last 15 years. The French measuring, testing, navigation instruments and watches/clocks industry, which was running a deficit in 2002, now has a healthy trade surplus following sharp export growth in the sector.
Belgium Netherlands Spain France Italy Germany United Kingdom
1990 1995 2000 2005 2010 2016
1, 000
900
800
700
600
500
400
300
200
100
0
40
35
30
25
20
15
10
5
0
0 10 20 30 40 50%
Food, beverages and tobacco
Wood and cork products
Machinery and equipment,not elsewhere classified
Fabricated metal products
Other non-metallic mineral products
Other transport equipment
Motor vehicles, trailers/semi-trailers
Textiles, clothing,leather goods and footwear
Chemicals
Base metals
Electronic equipment
Rubber and plastic products
Computer, electronic and optical products
47.2
39.7
33.3
33.1
31.6
31.2
31
30.1
29.8
27.7
24.3
23.6
23.4
2012 2016
9
8
7
6
5
4
3
2
1
0
%
%
2012 2016 2012 2016 2012 2016 2012 2016 2012 2016 2012 2016
Germany
8.4
Belgium
2.5
Spain
France
Italy
Netherlands
United Kingdom
1.8
3.2
2.9
3.6 2.6
World Europe North America Middle East and North Africa
Sub-Saharan Africa
Emerging Asia
20
18
16
14
12
10
8
6
4
2
0
0 5 10 15 20
United Arab Emirates
Czech Republic
Saudi Arabia
Brazil
Spain
Hong Kong
India
Italy
Morocco
Mexico
Poland
Russia
Singapore
Switzerland
Turkey
Germany
Austria
Belgium
United States
JapanRomania
Algeria
China
South Korea
HungaryNetherlands
United Kingdom
Sweden
Tunisia
Portugal
%
112
110
108
106
104
102
100
98
96Germany Belgium Spain France Italy Netherlands United Kingdom EU-28
2005 2006 2007 2008 2009 2010 2011 2012 2013 2014 2015 2016
130
125
120
115
110
105
100
95
90
85
80
Base 100 = 2010
Boilers, machinery, parts
Miscellaneous chemical products
Essential oils, perfumes, cosmetics
Aerospace industry
Beverages, spirits and vinegar
Dairy products, eggs, honey
Leather goods, handbags
Cereals
Pharmaceutical products
Paper, paperboard
Iron and steel
Plastics
Rubber
Vehicles, bicycles, and parts
Organic chemicals
Index France = 100
0 1 2 3 4 5 6
Boilers, machinery, parts
Miscellaneous chemical products
Essential oils, perfumes, cosmetics
Aerospace industry
Beverages, spirits and vinegar
Dairy products, eggs, honey
Leather goods, handbags
Cereals
Pharmaceutical products
Paper, paperboard
Iron and steel
Plastics
Rubber
Vehicles, bicycles, and parts
Organic chemicals
Optical, photo, medical/surgical instruments
Articles of iron or steel
Apparel articles, accessories
Electric machinery, TV/audio equipment
Natural pearls, precious stones/metals
Mineral fuel, oil, wax, bitumen
0 2 4 6 8 10 1612 14%
16
15.8
13.5
9.8
9.3
6.6
6.4
3.9
3.8
3.7
3.4
3.1
3
2.9
2.8
2.7
1.8
1.2
0.9
6
4
Aerospace 17.4
12.3
10.6
3.3
2.8
2.7
2.2
1.3
1.1
1.1
Beverages
Perfumes, cosmetics,cleaning products
Pharmaceuticals
Chemicals (except basic chemicals)
Electronic components and boards
Measuring, testing, navigation instruments; watches/clocks
Animal food
Manufacture of ships/boats
Dairy products
0-2 2 6 10 14 18
1
Belgium Netherlands France Germany UnitedKingdom
Austria Ireland Poland Sweden Italy Spain Finland
200
180
160
140
120
100
80
60
40
20
0
183
166
10096
92
7772
56
49 4844 43
90
80
70
60
50
40
30
20
10
0
100
90
80
70
60
50
40
30
20
10
0
31
9
9
9
7
4
3
2
2
4
1212
12
12
8
15
5
5
5
58
9
18
9
9
9
9
4
3
3
5
27
66
6
1020
6
6
6
6
6
6
6
6
10
16
4
4
26
5
7
7
6
6
8
8
11
8
7
13
4
2
17 17 17 18 19
8
70
5853
23
7
4737
5
16 1621
United States NetherlandsGermany United Kingdom
Switzerland Belgium Japan SwedenItaly Spain
Large corporates Mid-size companies SMEs and micro-enterprises
Large corporates Mid-size companies SMEs and micro-enterprises
100
90
80
70
60
50
40
30
20
10
0
26
4666 48
26
34
54
%
%
%
Base 100 = 1990
%
4.0
3.5
12.5
1.0
1.4
8.7
13.1
1.1
4.3
7.6
3.3
3.1
2.56.6
4.4
7.72.7
9.6
1.9
1.7
1.25.6
11.7
1.3
1.1
3.7
3.5
5.4
19.6
4.3
France in the world’s top five exporters
€ billion
Base 100 = 2010
3.23.6
1.6
4.1 4.0
1.3
3.2%: France’s overall global export market share
33
1
1
2
2
2
1
Fig. 21 FRANCE’S COMPARATIVE ADVANTAGES BY SECTOR (2016)
Source: UN Comtrade; Business France calculations
2017 2002
Belgium Netherlands Spain France Italy Germany United Kingdom
1990 1995 2000 2005 2010 2016
1, 000
900
800
700
600
500
400
300
200
100
0
40
35
30
25
20
15
10
5
0
0 10 20 30 40 50%
Food, beverages and tobacco
Wood and cork products
Machinery and equipment,not elsewhere classified
Fabricated metal products
Other non-metallic mineral products
Other transport equipment
Motor vehicles, trailers/semi-trailers
Textiles, clothing,leather goods and footwear
Chemicals
Base metals
Electronic equipment
Rubber and plastic products
Computer, electronic and optical products
47.2
39.7
33.3
33.1
31.6
31.2
31
30.1
29.8
27.7
24.3
23.6
23.4
2012 2016
9
8
7
6
5
4
3
2
1
0
%
%
2012 2016 2012 2016 2012 2016 2012 2016 2012 2016 2012 2016
Germany
8.4
Belgium
2.5
Spain
France
Italy
Netherlands
United Kingdom
1.8
3.2
2.9
3.6 2.6
World Europe North America Middle East and North Africa
Sub-Saharan Africa
Emerging Asia
20
18
16
14
12
10
8
6
4
2
0
0 5 10 15 20
United Arab Emirates
Czech Republic
Saudi Arabia
Brazil
Spain
Hong Kong
India
Italy
Morocco
Mexico
Poland
Russia
Singapore
Switzerland
Turkey
Germany
Austria
Belgium
United States
JapanRomania
Algeria
China
South Korea
HungaryNetherlands
United Kingdom
Sweden
Tunisia
Portugal
%
112
110
108
106
104
102
100
98
96Germany Belgium Spain France Italy Netherlands United Kingdom EU-28
2005 2006 2007 2008 2009 2010 2011 2012 2013 2014 2015 2016
130
125
120
115
110
105
100
95
90
85
80
Base 100 = 2010
Boilers, machinery, parts
Miscellaneous chemical products
Essential oils, perfumes, cosmetics
Aerospace industry
Beverages, spirits and vinegar
Dairy products, eggs, honey
Leather goods, handbags
Cereals
Pharmaceutical products
Paper, paperboard
Iron and steel
Plastics
Rubber
Vehicles, bicycles, and parts
Organic chemicals
Index France = 100
0 1 2 3 4 5 6
Boilers, machinery, parts
Miscellaneous chemical products
Essential oils, perfumes, cosmetics
Aerospace industry
Beverages, spirits and vinegar
Dairy products, eggs, honey
Leather goods, handbags
Cereals
Pharmaceutical products
Paper, paperboard
Iron and steel
Plastics
Rubber
Vehicles, bicycles, and parts
Organic chemicals
Optical, photo, medical/surgical instruments
Articles of iron or steel
Apparel articles, accessories
Electric machinery, TV/audio equipment
Natural pearls, precious stones/metals
Mineral fuel, oil, wax, bitumen
0 2 4 6 8 10 1612 14%
16
15.8
13.5
9.8
9.3
6.6
6.4
3.9
3.8
3.7
3.4
3.1
3
2.9
2.8
2.7
1.8
1.2
0.9
6
4
Aerospace 17.4
12.3
10.6
3.3
2.8
2.7
2.2
1.3
1.1
1.1
Beverages
Perfumes, cosmetics,cleaning products
Pharmaceuticals
Chemicals (except basic chemicals)
Electronic components and boards
Measuring, testing, navigation instruments; watches/clocks
Animal food
Manufacture of ships/boats
Dairy products
0-2 2 6 10 14 18
1
Belgium Netherlands France Germany UnitedKingdom
Austria Ireland Poland Sweden Italy Spain Finland
200
180
160
140
120
100
80
60
40
20
0
183
166
10096
92
7772
56
49 4844 43
90
80
70
60
50
40
30
20
10
0
100
90
80
70
60
50
40
30
20
10
0
31
9
9
9
7
4
3
2
2
4
1212
12
12
8
15
5
5
5
58
9
18
9
9
9
9
4
3
3
5
27
66
6
1020
6
6
6
6
6
6
6
6
10
16
4
4
26
5
7
7
6
6
8
8
11
8
7
13
4
2
17 17 17 18 19
8
70
5853
23
7
4737
5
16 1621
United States NetherlandsGermany United Kingdom
Switzerland Belgium Japan SwedenItaly Spain
Large corporates Mid-size companies SMEs and micro-enterprises
Large corporates Mid-size companies SMEs and micro-enterprises
100
90
80
70
60
50
40
30
20
10
0
26
4666 48
26
34
54
%
%
%
Base 100 = 1990
%
4.0
3.5
12.5
1.0
1.4
8.7
13.1
1.1
4.3
7.6
3.3
3.1
2.56.6
4.4
7.72.7
9.6
1.9
1.7
1.25.6
11.7
1.3
1.1
3.7
3.5
5.4
19.6
4.3
France in the world’s top five exporters
€ billion
Base 100 = 2010
3.23.6
1.6
4.1 4.0
1.3
3.2%: France’s overall global export market share
33
1
1
2
2
2
1
Fig. 22 FRANCE’S LARGEST TRADE SURPLUSES (2017)
Source: French Customs Authorities, official nomenclature, CIF/FOB balances (€ billion); Business France calculations
Key: France ran a trade surplus of €12.3 billion on beverage exports in 2017.
- 36 -
3 . FRANCE’S PLACE IN THE WORLD
While multinationals can have many reasons for establishing themselves in foreign countries, access to new markets remains the primary motivation for international business expansion.
In France as elsewhere, the foreign operations of multinationals focus heavily on manufacturing. When a manufacturer chooses a country in which to locate, it expects to serve not only the local market but also the surrounding markets, to which it will have easy export access. This strategy explains why, on average, French subsidiaries of foreign companies export more than domestic French companies.
FRANCE’S STRATEGIC LOCATION MAKES IT A NATURAL EXPORT HUB
France’s strategic location makes it a natural export hub It is in a foreign company’s interest to set up in a country where domestic demand is high and where it can enjoy easy access to neighboring countries. In terms of proximity to EU-28 markets, France was ranked third on this criterion in 2016, ahead of Germany and the United Kingdom.
FRANCE: A GATEWAY TO EUROPEAN AND AFRICAN MARKETS
France’s location is a major factor in its attractiveness to foreign investors. Importantly, France shares borders with the other four largest European markets – Germany, Spain, Italy and the United Kingdom – and by setting up in France, a company has direct access to more than 315 million consumers.
A recent Kantar Public survey of French and foreign companies established in France underlined the country’s role as an export hub, highlighting the issue of market access as a crucial factor in a company’s decision to set up operations abroad.
No fewer than 80% of executives surveyed declared that “better access to the markets” and “market size” would influence their choice of destination, while more than three in four stated that France’s location is advantageous for exports. Similarly, a clear majority (69%) of foreign company directors in France believe that it is easy to export goods from the country.
The survey results show that foreign business leaders in France see the country as an attractive export hub. Eighty-eight percent of them believe that France can be an effective springboard into other European markets, while 93% of them already export goods to these countries.
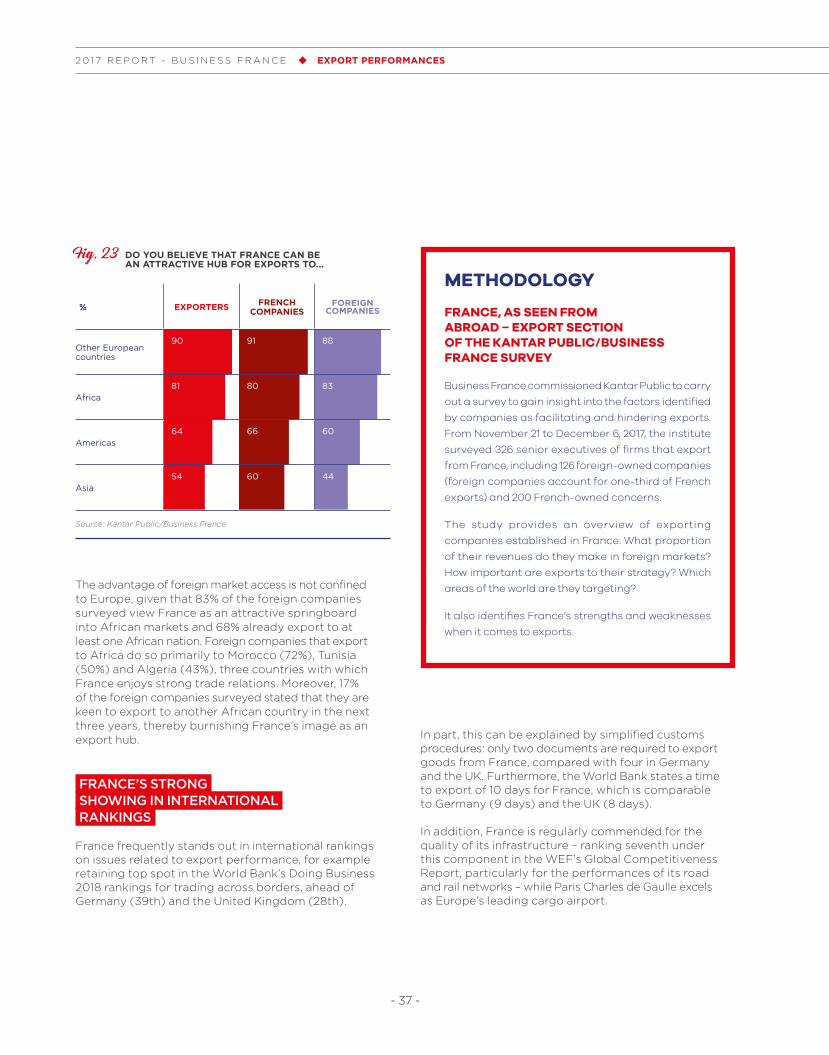
- 37 -
2 0 1 7 R E P O R T - B U S I N E S S F R A N C E EXPORT PERFORMANCES
The advantage of foreign market access is not confined to Europe, given that 83% of the foreign companies surveyed view France as an attractive springboard into African markets and 68% already export to at least one African nation. Foreign companies that export to Africa do so primarily to Morocco (72%), Tunisia (50%) and Algeria (43%), three countries with which France enjoys strong trade relations. Moreover, 17% of the foreign companies surveyed stated that they are keen to export to another African country in the next three years, thereby burnishing France’s image as an export hub.
FRANCE’S STRONG SHOWING IN INTERNATIONAL RANKINGS
France frequently stands out in international rankings on issues related to export performance, for example retaining top spot in the World Bank’s Doing Business 2018 rankings for trading across borders, ahead of Germany (39th) and the United Kingdom (28th).
In part, this can be explained by simplified customs procedures: only two documents are required to export goods from France, compared with four in Germany and the UK. Furthermore, the World Bank states a time to export of 10 days for France, which is comparable to Germany (9 days) and the UK (8 days).
In addition, France is regularly commended for the quality of its infrastructure – ranking seventh under this component in the WEF’s Global Competitiveness Report, particularly for the performances of its road and rail networks – while Paris Charles de Gaulle excels as Europe’s leading cargo airport.
% EXPORTERS FRENCH COMPANIES
FOREIGN COMPANIES
Other European countries
90 91 88
Africa81 80 83
Americas64 66 60
Asia54 60 44
Source: Kantar Public/Business France
Fig. 23 DO YOU BELIEVE THAT FRANCE CAN BE AN ATTRACTIVE HUB FOR EXPORTS TO...
METHODOLOGY
FRANCE, AS SEEN FROM ABROAD – EXPORT SECTION OF THE KANTAR PUBLIC/BUSINESS FRANCE SURVEY
Business France commissioned Kantar Public to carry
out a survey to gain insight into the factors identified
by companies as facilitating and hindering exports.
From November 21 to December 6, 2017, the institute
surveyed 326 senior executives of firms that export
from France, including 126 foreign-owned companies
(foreign companies account for one-third of French
exports) and 200 French-owned concerns.
The study provides an overview of exporting
companies established in France: What proportion
of their revenues do they make in foreign markets?
How important are exports to their strategy? Which
areas of the world are they targeting?
It also identifies France’s strengths and weaknesses
when it comes to exports.
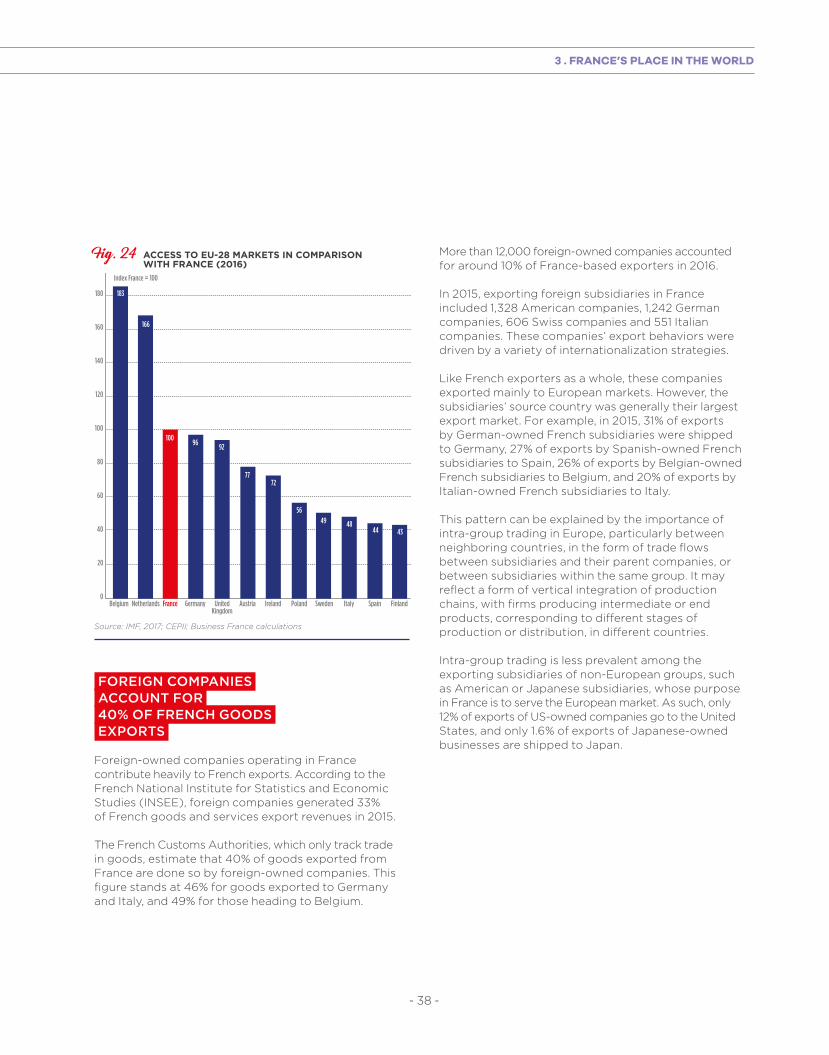
- 38 -
3 . FRANCE’S PLACE IN THE WORLD
Fig. 24 ACCESS TO EU-28 MARKETS IN COMPARISON WITH FRANCE (2016)
Source: IMF, 2017; CEPII; Business France calculations
Belgium Netherlands Spain France Italy Germany United Kingdom
1990 1995 2000 2005 2010 2016
1, 000
900
800
700
600
500
400
300
200
100
0
40
35
30
25
20
15
10
5
0
0 10 20 30 40 50%
Food, beverages and tobacco
Wood and cork products
Machinery and equipment,not elsewhere classified
Fabricated metal products
Other non-metallic mineral products
Other transport equipment
Motor vehicles, trailers/semi-trailers
Textiles, clothing,leather goods and footwear
Chemicals
Base metals
Electronic equipment
Rubber and plastic products
Computer, electronic and optical products
47.2
39.7
33.3
33.1
31.6
31.2
31
30.1
29.8
27.7
24.3
23.6
23.4
2012 2016
9
8
7
6
5
4
3
2
1
0
%
%
2012 2016 2012 2016 2012 2016 2012 2016 2012 2016 2012 2016
Germany
8.4
Belgium
2.5
Spain
France
Italy
Netherlands
United Kingdom
1.8
3.2
2.9
3.6 2.6
World Europe North America Middle East and North Africa
Sub-Saharan Africa
Emerging Asia
20
18
16
14
12
10
8
6
4
2
0
0 5 10 15 20
United Arab Emirates
Czech Republic
Saudi Arabia
Brazil
Spain
Hong Kong
India
Italy
Morocco
Mexico
Poland
Russia
Singapore
Switzerland
Turkey
Germany
Austria
Belgium
United States
JapanRomania
Algeria
China
South Korea
HungaryNetherlands
United Kingdom
Sweden
Tunisia
Portugal
%
112
110
108
106
104
102
100
98
96Germany Belgium Spain France Italy Netherlands United Kingdom EU-28
2005 2006 2007 2008 2009 2010 2011 2012 2013 2014 2015 2016
130
125
120
115
110
105
100
95
90
85
80
Base 100 = 2010
Boilers, machinery, parts
Miscellaneous chemical products
Essential oils, perfumes, cosmetics
Aerospace industry
Beverages, spirits and vinegar
Dairy products, eggs, honey
Leather goods, handbags
Cereals
Pharmaceutical products
Paper, paperboard
Iron and steel
Plastics
Rubber
Vehicles, bicycles, and parts
Organic chemicals
Index France = 100
0 1 2 3 4 5 6
Boilers, machinery, parts
Miscellaneous chemical products
Essential oils, perfumes, cosmetics
Aerospace industry
Beverages, spirits and vinegar
Dairy products, eggs, honey
Leather goods, handbags
Cereals
Pharmaceutical products
Paper, paperboard
Iron and steel
Plastics
Rubber
Vehicles, bicycles, and parts
Organic chemicals
Optical, photo, medical/surgical instruments
Articles of iron or steel
Apparel articles, accessories
Electric machinery, TV/audio equipment
Natural pearls, precious stones/metals
Mineral fuel, oil, wax, bitumen
0 2 4 6 8 10 1612 14%
16
15.8
13.5
9.8
9.3
6.6
6.4
3.9
3.8
3.7
3.4
3.1
3
2.9
2.8
2.7
1.8
1.2
0.9
6
4
Aerospace 17.4
12.3
10.6
3.3
2.8
2.7
2.2
1.3
1.1
1.1
Beverages
Perfumes, cosmetics,cleaning products
Pharmaceuticals
Chemicals (except basic chemicals)
Electronic components and boards
Measuring, testing, navigation instruments; watches/clocks
Animal food
Manufacture of ships/boats
Dairy products
0-2 2 6 10 14 18
1
Belgium Netherlands France Germany UnitedKingdom
Austria Ireland Poland Sweden Italy Spain Finland
200
180
160
140
120
100
80
60
40
20
0
183
166
10096
92
7772
56
49 4844 43
90
80
70
60
50
40
30
20
10
0
100
90
80
70
60
50
40
30
20
10
0
31
9
9
9
7
4
3
2
2
4
1212
12
12
8
15
5
5
5
58
9
18
9
9
9
9
4
3
3
5
27
66
6
1020
6
6
6
6
6
6
6
6
10
16
4
4
26
5
7
7
6
6
8
8
11
8
7
13
4
2
17 17 17 18 19
8
70
5853
23
7
4737
5
16 1621
United States NetherlandsGermany United Kingdom
Switzerland Belgium Japan SwedenItaly Spain
Large corporates Mid-size companies SMEs and micro-enterprises
Large corporates Mid-size companies SMEs and micro-enterprises
100
90
80
70
60
50
40
30
20
10
0
26
4666 48
26
34
54
%
%
%
Base 100 = 1990
%
4.0
3.5
12.5
1.0
1.4
8.7
13.1
1.1
4.3
7.6
3.3
3.1
2.56.6
4.4
7.72.7
9.6
1.9
1.7
1.25.6
11.7
1.3
1.1
3.7
3.5
5.4
19.6
4.3
France in the world’s top five exporters
€ billion
Base 100 = 2010
3.23.6
1.6
4.1 4.0
1.3
3.2%: France’s overall global export market share
33
1
1
2
2
2
1
FOREIGN COMPANIES ACCOUNT FOR 40% OF FRENCH GOODS EXPORTS
Foreign-owned companies operating in France contribute heavily to French exports. According to the French National Institute for Statistics and Economic Studies (INSEE), foreign companies generated 33% of French goods and services export revenues in 2015.
The French Customs Authorities, which only track trade in goods, estimate that 40% of goods exported from France are done so by foreign-owned companies. This figure stands at 46% for goods exported to Germany and Italy, and 49% for those heading to Belgium.
More than 12,000 foreign-owned companies accounted for around 10% of France-based exporters in 2016.
In 2015, exporting foreign subsidiaries in France included 1,328 American companies, 1,242 German companies, 606 Swiss companies and 551 Italian companies. These companies’ export behaviors were driven by a variety of internationalization strategies.
Like French exporters as a whole, these companies exported mainly to European markets. However, the subsidiaries’ source country was generally their largest export market. For example, in 2015, 31% of exports by German-owned French subsidiaries were shipped to Germany, 27% of exports by Spanish-owned French subsidiaries to Spain, 26% of exports by Belgian-owned French subsidiaries to Belgium, and 20% of exports by Italian-owned French subsidiaries to Italy.
This pattern can be explained by the importance of intra-group trading in Europe, particularly between neighboring countries, in the form of trade flows between subsidiaries and their parent companies, or between subsidiaries within the same group. It may reflect a form of vertical integration of production chains, with firms producing intermediate or end products, corresponding to different stages of production or distribution, in different countries.
Intra-group trading is less prevalent among the exporting subsidiaries of non-European groups, such as American or Japanese subsidiaries, whose purpose in France is to serve the European market. As such, only 12% of exports of US-owned companies go to the United States, and only 1.6% of exports of Japanese-owned businesses are shipped to Japan.
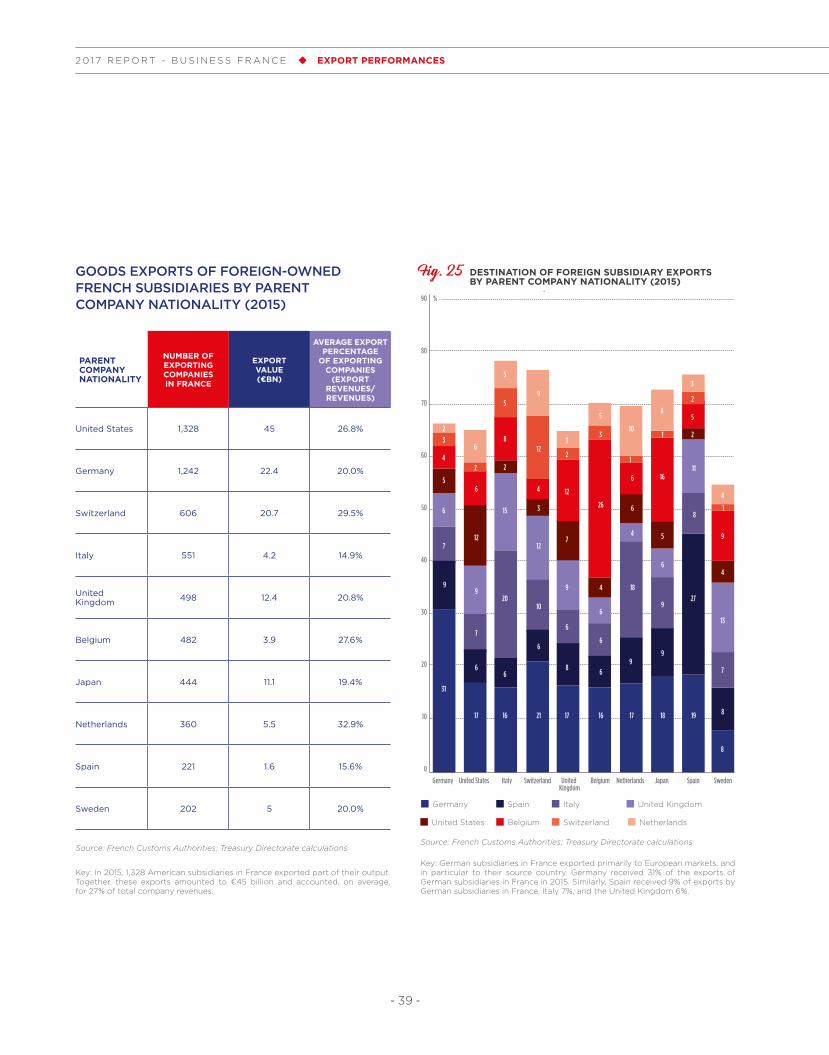
- 39 -
2 0 1 7 R E P O R T - B U S I N E S S F R A N C E EXPORT PERFORMANCES
Fig. 25 DESTINATION OF FOREIGN SUBSIDIARY EXPORTS BY PARENT COMPANY NATIONALITY (2015)
Key: German subsidiaries in France exported primarily to European markets, and in particular to their source country. Germany received 31% of the exports of German subsidiaries in France in 2015. Similarly, Spain received 9% of exports by German subsidiaries in France, Italy 7%, and the United Kingdom 6%.
Source: French Customs Authorities; Treasury Directorate calculations
Spain
Switzerland NetherlandsUnited States Belgium
Germany United Kingdom
Belgium Netherlands Spain France Italy Germany United Kingdom
1990 1995 2000 2005 2010 2016
1, 000
900
800
700
600
500
400
300
200
100
0
40
35
30
25
20
15
10
5
0
0 10 20 30 40 50%
Food, beverages and tobacco
Wood and cork products
Machinery and equipment,not elsewhere classified
Fabricated metal products
Other non-metallic mineral products
Other transport equipment
Motor vehicles, trailers/semi-trailers
Textiles, clothing,leather goods and footwear
Chemicals
Base metals
Electronic equipment
Rubber and plastic products
Computer, electronic and optical products
47.2
39.7
33.3
33.1
31.6
31.2
31
30.1
29.8
27.7
24.3
23.6
23.4
2012 2016
9
8
7
6
5
4
3
2
1
0
%
%
2012 2016 2012 2016 2012 2016 2012 2016 2012 2016 2012 2016
Germany
8.4
Belgium
2.5
Spain
France
Italy
Netherlands
United Kingdom
1.8
3.2
2.9
3.6 2.6
World Europe North America Middle East and North Africa
Sub-Saharan Africa
Emerging Asia
20
18
16
14
12
10
8
6
4
2
0
0 5 10 15 20
United Arab Emirates
Czech Republic
Saudi Arabia
Brazil
Spain
Hong Kong
India
Italy
Morocco
Mexico
Poland
Russia
Singapore
Switzerland
Turkey
Germany
Austria
Belgium
United States
JapanRomania
Algeria
China
South Korea
HungaryNetherlands
United Kingdom
Sweden
Tunisia
Portugal
%
112
110
108
106
104
102
100
98
96Germany Belgium Spain France Italy Netherlands United Kingdom EU-28
2005 2006 2007 2008 2009 2010 2011 2012 2013 2014 2015 2016
130
125
120
115
110
105
100
95
90
85
80
Base 100 = 2010
Boilers, machinery, parts
Miscellaneous chemical products
Essential oils, perfumes, cosmetics
Aerospace industry
Beverages, spirits and vinegar
Dairy products, eggs, honey
Leather goods, handbags
Cereals
Pharmaceutical products
Paper, paperboard
Iron and steel
Plastics
Rubber
Vehicles, bicycles, and parts
Organic chemicals
Index France = 100
0 1 2 3 4 5 6
Boilers, machinery, parts
Miscellaneous chemical products
Essential oils, perfumes, cosmetics
Aerospace industry
Beverages, spirits and vinegar
Dairy products, eggs, honey
Leather goods, handbags
Cereals
Pharmaceutical products
Paper, paperboard
Iron and steel
Plastics
Rubber
Vehicles, bicycles, and parts
Organic chemicals
Optical, photo, medical/surgical instruments
Articles of iron or steel
Apparel articles, accessories
Electric machinery, TV/audio equipment
Natural pearls, precious stones/metals
Mineral fuel, oil, wax, bitumen
0 2 4 6 8 10 1612 14%
16
15.8
13.5
9.8
9.3
6.6
6.4
3.9
3.8
3.7
3.4
3.1
3
2.9
2.8
2.7
1.8
1.2
0.9
6
4
Aerospace 17.4
12.3
10.6
3.3
2.8
2.7
2.2
1.3
1.1
1.1
Beverages
Perfumes, cosmetics,cleaning products
Pharmaceuticals
Chemicals (except basic chemicals)
Electronic components and boards
Measuring, testing, navigation instruments; watches/clocks
Animal food
Manufacture of ships/boats
Dairy products
0-2 2 6 10 14 18
1
Belgium Netherlands France Germany UnitedKingdom
Austria Ireland Poland Sweden Italy Spain Finland
200
180
160
140
120
100
80
60
40
20
0
183
166
10096
92
7772
56
49 4844 43
90
80
70
60
50
40
30
20
10
0
100
90
80
70
60
50
40
30
20
10
0
31
9
9
9
7
4
3
2
2
4
1212
12
12
8
15
5
5
5
58
9
18
9
9
9
9
4
3
3
5
27
66
6
1020
6
6
6
6
6
6
6
6
10
16
4
4
26
5
7
7
6
6
8
8
11
8
7
13
4
2
17 17 17 18 19
8
70
5853
23
7
4737
5
16 1621
United States NetherlandsGermany United Kingdom
Switzerland Belgium Japan SwedenItaly Spain
Large corporates Mid-size companies SMEs and micro-enterprises
Large corporates Mid-size companies SMEs and micro-enterprises
100
90
80
70
60
50
40
30
20
10
0
26
4666 48
26
34
54
%
%
%
Base 100 = 1990
%
4.0
3.5
12.5
1.0
1.4
8.7
13.1
1.1
4.3
7.6
3.3
3.1
2.56.6
4.4
7.72.7
9.6
1.9
1.7
1.25.6
11.7
1.3
1.1
3.7
3.5
5.4
19.6
4.3
France in the world’s top five exporters
€ billion
Base 100 = 2010
3.23.6
1.6
4.1 4.0
1.3
3.2%: France’s overall global export market share
33
1
1
2
2
2
1
GOODS EXPORTS OF FOREIGN-OWNED FRENCH SUBSIDIARIES BY PARENT COMPANY NATIONALITY (2015)
PARENT COMPANY NATIONALITY
NUMBER OF EXPORTING COMPANIES IN FRANCE
EXPORT VALUE (€BN)
AVERAGE EXPORT PERCENTAGE
OF EXPORTING COMPANIES
(EXPORT REVENUES/ REVENUES)
United States 1,328 45 26.8%
Germany 1,242 22.4 20.0%
Switzerland 606 20.7 29.5%
Italy 551 4.2 14.9%
United Kingdom 498 12.4 20.8%
Belgium 482 3.9 27.6%
Japan 444 11.1 19.4%
Netherlands 360 5.5 32.9%
Spain 221 1.6 15.6%
Sweden 202 5 20.0%
Key: In 2015, 1,328 American subsidiaries in France exported part of their output. Together, these exports amounted to €45 billion and accounted, on average, for 27% of total company revenues.
Source: French Customs Authorities; Treasury Directorate calculations
Italy
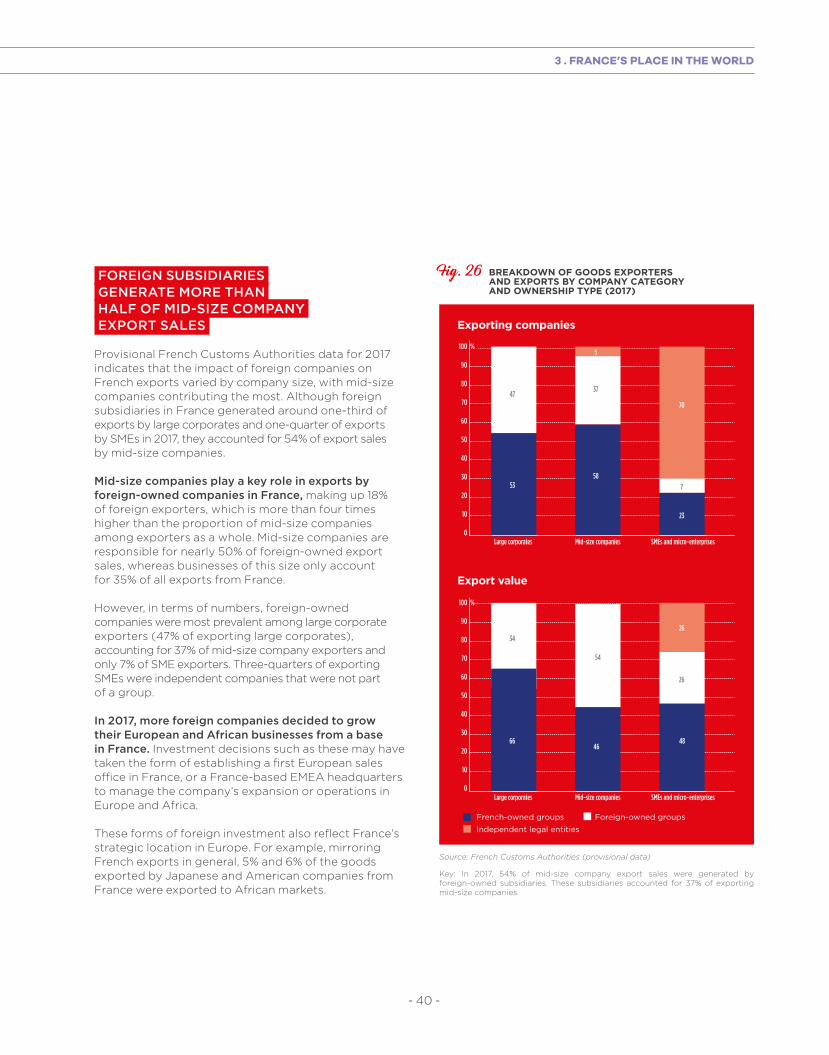
- 40 -
3 . FRANCE’S PLACE IN THE WORLD
FOREIGN SUBSIDIARIES GENERATE MORE THAN HALF OF MID-SIZE COMPANY EXPORT SALES
Provisional French Customs Authorities data for 2017 indicates that the impact of foreign companies on French exports varied by company size, with mid-size companies contributing the most. Although foreign subsidiaries in France generated around one-third of exports by large corporates and one-quarter of exports by SMEs in 2017, they accounted for 54% of export sales by mid-size companies.
Mid-size companies play a key role in exports by foreign-owned companies in France, making up 18% of foreign exporters, which is more than four times higher than the proportion of mid-size companies among exporters as a whole. Mid-size companies are responsible for nearly 50% of foreign-owned export sales, whereas businesses of this size only account for 35% of all exports from France.
However, in terms of numbers, foreign-owned companies were most prevalent among large corporate exporters (47% of exporting large corporates), accounting for 37% of mid-size company exporters and only 7% of SME exporters. Three-quarters of exporting SMEs were independent companies that were not part of a group.
In 2017, more foreign companies decided to grow their European and African businesses from a base in France. Investment decisions such as these may have taken the form of establishing a first European sales office in France, or a France-based EMEA headquarters to manage the company’s expansion or operations in Europe and Africa.
These forms of foreign investment also reflect France’s strategic location in Europe. For example, mirroring French exports in general, 5% and 6% of the goods exported by Japanese and American companies from France were exported to African markets.
Fig. 26 BREAKDOWN OF GOODS EXPORTERS AND EXPORTS BY COMPANY CATEGORY AND OWNERSHIP TYPE (2017)
Exporting companies
Belgium Netherlands Spain France Italy Germany United Kingdom
1990 1995 2000 2005 2010 2016
1, 000
900
800
700
600
500
400
300
200
100
0
40
35
30
25
20
15
10
5
0
0 10 20 30 40 50%
Food, beverages and tobacco
Wood and cork products
Machinery and equipment,not elsewhere classified
Fabricated metal products
Other non-metallic mineral products
Other transport equipment
Motor vehicles, trailers/semi-trailers
Textiles, clothing,leather goods and footwear
Chemicals
Base metals
Electronic equipment
Rubber and plastic products
Computer, electronic and optical products
47.2
39.7
33.3
33.1
31.6
31.2
31
30.1
29.8
27.7
24.3
23.6
23.4
2012 2016
9
8
7
6
5
4
3
2
1
0
%
%
2012 2016 2012 2016 2012 2016 2012 2016 2012 2016 2012 2016
Germany
8.4
Belgium
2.5
Spain
France
Italy
Netherlands
United Kingdom
1.8
3.2
2.9
3.6 2.6
World Europe North America Middle East and North Africa
Sub-Saharan Africa
Emerging Asia
20
18
16
14
12
10
8
6
4
2
0
0 5 10 15 20
United Arab Emirates
Czech Republic
Saudi Arabia
Brazil
Spain
Hong Kong
India
Italy
Morocco
Mexico
Poland
Russia
Singapore
Switzerland
Turkey
Germany
Austria
Belgium
United States
JapanRomania
Algeria
China
South Korea
HungaryNetherlands
United Kingdom
Sweden
Tunisia
Portugal
%
112
110
108
106
104
102
100
98
96Germany Belgium Spain France Italy Netherlands United Kingdom EU-28
2005 2006 2007 2008 2009 2010 2011 2012 2013 2014 2015 2016
130
125
120
115
110
105
100
95
90
85
80
Base 100 = 2010
Boilers, machinery, parts
Miscellaneous chemical products
Essential oils, perfumes, cosmetics
Aerospace industry
Beverages, spirits and vinegar
Dairy products, eggs, honey
Leather goods, handbags
Cereals
Pharmaceutical products
Paper, paperboard
Iron and steel
Plastics
Rubber
Vehicles, bicycles, and parts
Organic chemicals
Index France = 100
0 1 2 3 4 5 6
Boilers, machinery, parts
Miscellaneous chemical products
Essential oils, perfumes, cosmetics
Aerospace industry
Beverages, spirits and vinegar
Dairy products, eggs, honey
Leather goods, handbags
Cereals
Pharmaceutical products
Paper, paperboard
Iron and steel
Plastics
Rubber
Vehicles, bicycles, and parts
Organic chemicals
Optical, photo, medical/surgical instruments
Articles of iron or steel
Apparel articles, accessories
Electric machinery, TV/audio equipment
Natural pearls, precious stones/metals
Mineral fuel, oil, wax, bitumen
0 2 4 6 8 10 1612 14%
16
15.8
13.5
9.8
9.3
6.6
6.4
3.9
3.8
3.7
3.4
3.1
3
2.9
2.8
2.7
1.8
1.2
0.9
6
4
Aerospace 17.4
12.3
10.6
3.3
2.8
2.7
2.2
1.3
1.1
1.1
Beverages
Perfumes, cosmetics,cleaning products
Pharmaceuticals
Chemicals (except basic chemicals)
Electronic components and boards
Measuring, testing, navigation instruments; watches/clocks
Animal food
Manufacture of ships/boats
Dairy products
0-2 2 6 10 14 18
1
Belgium Netherlands France Germany UnitedKingdom
Austria Ireland Poland Sweden Italy Spain Finland
200
180
160
140
120
100
80
60
40
20
0
183
166
10096
92
7772
56
49 4844 43
90
80
70
60
50
40
30
20
10
0
100
90
80
70
60
50
40
30
20
10
0
31
9
9
9
7
4
3
2
2
4
1212
12
12
8
15
5
5
5
58
9
18
9
9
9
9
4
3
3
5
27
66
6
1020
6
6
6
6
6
6
6
6
10
16
4
4
26
5
7
7
6
6
8
8
11
8
7
13
4
2
17 17 17 18 19
8
70
5853
23
7
4737
5
16 1621
United States NetherlandsGermany United Kingdom
Switzerland Belgium Japan SwedenItaly Spain
Large corporates Mid-size companies SMEs and micro-enterprises
Large corporates Mid-size companies SMEs and micro-enterprises
100
90
80
70
60
50
40
30
20
10
0
26
4666 48
26
34
54
%
%
%
Base 100 = 1990
%
4.0
3.5
12.5
1.0
1.4
8.7
13.1
1.1
4.3
7.6
3.3
3.1
2.56.6
4.4
7.72.7
9.6
1.9
1.7
1.25.6
11.7
1.3
1.1
3.7
3.5
5.4
19.6
4.3
France in the world’s top five exporters
€ billion
Base 100 = 2010
3.23.6
1.6
4.1 4.0
1.3
3.2%: France’s overall global export market share
33
1
1
2
2
2
1
Key: In 2017, 54% of mid-size company export sales were generated by foreign-owned subsidiaries. These subsidiaries accounted for 37% of exporting mid-size companies.
Source: French Customs Authorities (provisional data)
Foreign-owned groupsFrench-owned groups
Independent legal entities
Export value
Belgium Netherlands Spain France Italy Germany United Kingdom
1990 1995 2000 2005 2010 2016
1, 000
900
800
700
600
500
400
300
200
100
0
40
35
30
25
20
15
10
5
0
0 10 20 30 40 50%
Food, beverages and tobacco
Wood and cork products
Machinery and equipment,not elsewhere classified
Fabricated metal products
Other non-metallic mineral products
Other transport equipment
Motor vehicles, trailers/semi-trailers
Textiles, clothing,leather goods and footwear
Chemicals
Base metals
Electronic equipment
Rubber and plastic products
Computer, electronic and optical products
47.2
39.7
33.3
33.1
31.6
31.2
31
30.1
29.8
27.7
24.3
23.6
23.4
2012 2016
9
8
7
6
5
4
3
2
1
0
%
%
2012 2016 2012 2016 2012 2016 2012 2016 2012 2016 2012 2016
Germany
8.4
Belgium
2.5
Spain
France
Italy
Netherlands
United Kingdom
1.8
3.2
2.9
3.6 2.6
World Europe North America Middle East and North Africa
Sub-Saharan Africa
Emerging Asia
20
18
16
14
12
10
8
6
4
2
0
0 5 10 15 20
United Arab Emirates
Czech Republic
Saudi Arabia
Brazil
Spain
Hong Kong
India
Italy
Morocco
Mexico
Poland
Russia
Singapore
Switzerland
Turkey
Germany
Austria
Belgium
United States
JapanRomania
Algeria
China
South Korea
HungaryNetherlands
United Kingdom
Sweden
Tunisia
Portugal
%
112
110
108
106
104
102
100
98
96Germany Belgium Spain France Italy Netherlands United Kingdom EU-28
2005 2006 2007 2008 2009 2010 2011 2012 2013 2014 2015 2016
130
125
120
115
110
105
100
95
90
85
80
Base 100 = 2010
Boilers, machinery, parts
Miscellaneous chemical products
Essential oils, perfumes, cosmetics
Aerospace industry
Beverages, spirits and vinegar
Dairy products, eggs, honey
Leather goods, handbags
Cereals
Pharmaceutical products
Paper, paperboard
Iron and steel
Plastics
Rubber
Vehicles, bicycles, and parts
Organic chemicals
Index France = 100
0 1 2 3 4 5 6
Boilers, machinery, parts
Miscellaneous chemical products
Essential oils, perfumes, cosmetics
Aerospace industry
Beverages, spirits and vinegar
Dairy products, eggs, honey
Leather goods, handbags
Cereals
Pharmaceutical products
Paper, paperboard
Iron and steel
Plastics
Rubber
Vehicles, bicycles, and parts
Organic chemicals
Optical, photo, medical/surgical instruments
Articles of iron or steel
Apparel articles, accessories
Electric machinery, TV/audio equipment
Natural pearls, precious stones/metals
Mineral fuel, oil, wax, bitumen
0 2 4 6 8 10 1612 14%
16
15.8
13.5
9.8
9.3
6.6
6.4
3.9
3.8
3.7
3.4
3.1
3
2.9
2.8
2.7
1.8
1.2
0.9
6
4
Aerospace 17.4
12.3
10.6
3.3
2.8
2.7
2.2
1.3
1.1
1.1
Beverages
Perfumes, cosmetics,cleaning products
Pharmaceuticals
Chemicals (except basic chemicals)
Electronic components and boards
Measuring, testing, navigation instruments; watches/clocks
Animal food
Manufacture of ships/boats
Dairy products
0-2 2 6 10 14 18
1
Belgium Netherlands France Germany UnitedKingdom
Austria Ireland Poland Sweden Italy Spain Finland
200
180
160
140
120
100
80
60
40
20
0
183
166
10096
92
7772
56
49 4844 43
90
80
70
60
50
40
30
20
10
0
100
90
80
70
60
50
40
30
20
10
0
31
9
9
9
7
4
3
2
2
4
1212
12
12
8
15
5
5
5
58
9
18
9
9
9
9
4
3
3
5
27
66
6
1020
6
6
6
6
6
6
6
6
10
16
4
4
26
5
7
7
6
6
8
8
11
8
7
13
4
2
17 17 17 18 19
8
70
5853
23
7
4737
5
16 1621
United States NetherlandsGermany United Kingdom
Switzerland Belgium Japan SwedenItaly Spain
Large corporates Mid-size companies SMEs and micro-enterprises
Large corporates Mid-size companies SMEs and micro-enterprises
100
90
80
70
60
50
40
30
20
10
0
26
4666 48
26
34
54
%
%
%
Base 100 = 1990
%
4.0
3.5
12.5
1.0
1.4
8.7
13.1
1.1
4.3
7.6
3.3
3.1
2.56.6
4.4
7.72.7
9.6
1.9
1.7
1.25.6
11.7
1.3
1.1
3.7
3.5
5.4
19.6
4.3
France in the world’s top five exporters
€ billion
Base 100 = 2010
3.23.6
1.6
4.1 4.0
1.3
3.2%: France’s overall global export market share
33
1
1
2
2
2
1
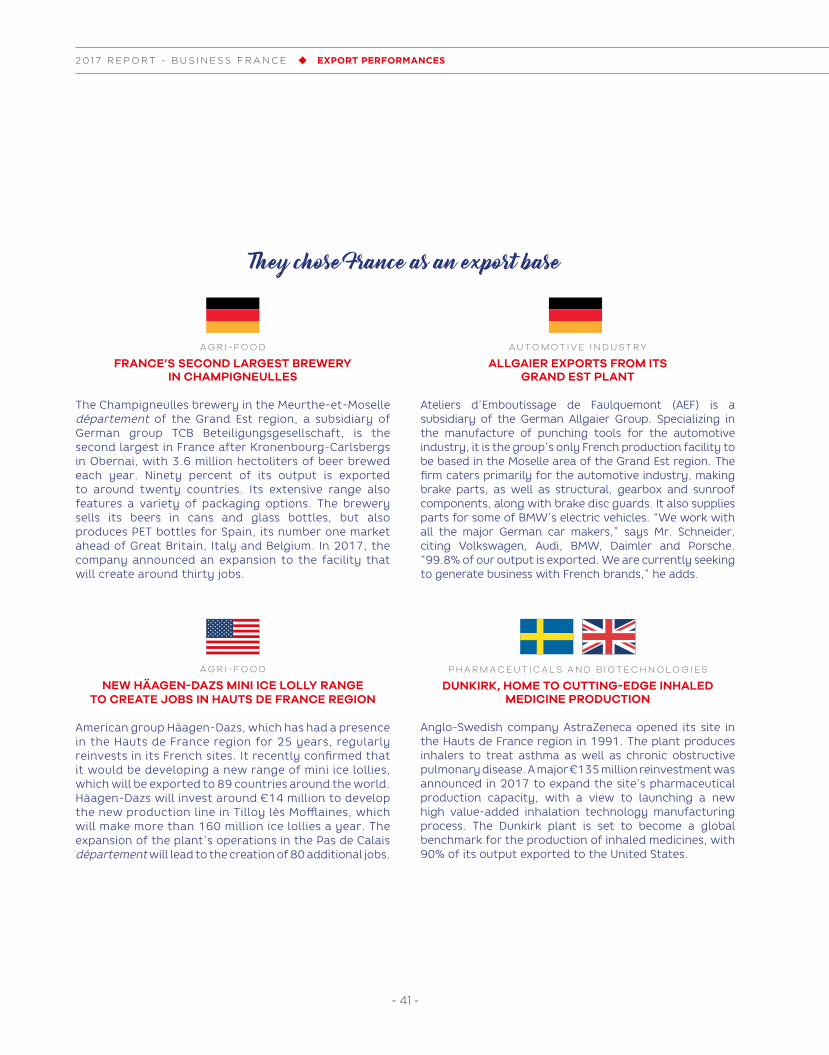
- 41 -
2 0 1 7 R E P O R T - B U S I N E S S F R A N C E EXPORT PERFORMANCES
A U T O M O T I V E I N D U S T R Y
ALLGAIER EXPORTS FROM ITS GRAND EST PLANT
Ateliers d’Emboutissage de Faulquemont (AEF) is a subsidiary of the German Allgaier Group. Specializing in the manufacture of punching tools for the automotive industry, it is the group’s only French production facility to be based in the Moselle area of the Grand Est region. The firm caters primarily for the automotive industry, making brake parts, as well as structural, gearbox and sunroof components, along with brake disc guards. It also supplies parts for some of BMW’s electric vehicles. “We work with all the major German car makers,” says Mr. Schneider, citing Volkswagen, Audi, BMW, Daimler and Porsche. “99.8% of our output is exported. We are currently seeking to generate business with French brands,” he adds.
P H A R M A C E U T I C A L S A N D B I O T E C H N O L O G I E S
DUNKIRK, HOME TO CUTTING-EDGE INHALED MEDICINE PRODUCTION
Anglo-Swedish company AstraZeneca opened its site in the Hauts de France region in 1991. The plant produces inhalers to treat asthma as well as chronic obstructive pulmonary disease. A major €135 million reinvestment was announced in 2017 to expand the site’s pharmaceutical production capacity, with a view to launching a new high value-added inhalation technology manufacturing process. The Dunkirk plant is set to become a global benchmark for the production of inhaled medicines, with 90% of its output exported to the United States.
They chose France as an export base
A G R I - F O O D
NEW HÄAGEN-DAZS MINI ICE LOLLY RANGE TO CREATE JOBS IN HAUTS DE FRANCE REGION
American group Häagen-Dazs, which has had a presence in the Hauts de France region for 25 years, regularly reinvests in its French sites. It recently confirmed that it would be developing a new range of mini ice lollies, which will be exported to 89 countries around the world. Häagen-Dazs will invest around €14 million to develop the new production line in Tilloy lès Mofflaines, which will make more than 160 million ice lollies a year. The expansion of the plant’s operations in the Pas de Calais département will lead to the creation of 80 additional jobs.
A G R I - F O O D
FRANCE’S SECOND LARGEST BREWERY IN CHAMPIGNEULLES
The Champigneulles brewery in the Meurthe-et-Moselle département of the Grand Est region, a subsidiary of German group TCB Beteiligungsgesellschaft, is the second largest in France after Kronenbourg-Carlsbergs in Obernai, with 3.6 million hectoliters of beer brewed each year. Ninety percent of its output is exported to around twenty countries. Its extensive range also features a variety of packaging options. The brewery sells its beers in cans and glass bottles, but also produces PET bottles for Spain, its number one market ahead of Great Britain, Italy and Belgium. In 2017, the company announced an expansion to the facility that will create around thirty jobs.
- 42 -
3 . FRANCE’S PLACE IN THE WORLD
METHODOLOGY
The contribution made by foreign subsidiaries to the
French economy as a whole has been measured using
INSEE data on foreign-owned resident company
employment, revenues, investment in tangible
assets and foreign trade for the year 2015 (latest year
available). Data are taken from the INSEE Financial
Links Between Enterprises Survey (LiFi) and Annual
Business Statistics Program (ESANE).
Data published by the French Customs Authorities,
which only tracks trade in goods, provides further
information on foreign goods exporters, such as
their number by nationality, export sales by market,
and company size. The Customs Authorities’ annual
report on foreign trade operators gives figures for all
trade in declared goods with countries in and outside
the European Union.
The company categories used are based on Article
51 of the French Economic Modernization Act (LME)
of August 4, 2008, which distinguishes between
micro-enterprises (companies with fewer than 10
employees), SMEs (fewer than 250 employees), mid-
size companies (between 250 and 4,999 employees)
and large corporates (at least 5,000 employees).

4
French exporters 44 OVERVIEW OF FRENCH EXPORTERS
48 FRENCH STARTUPS GOING GLOBAL
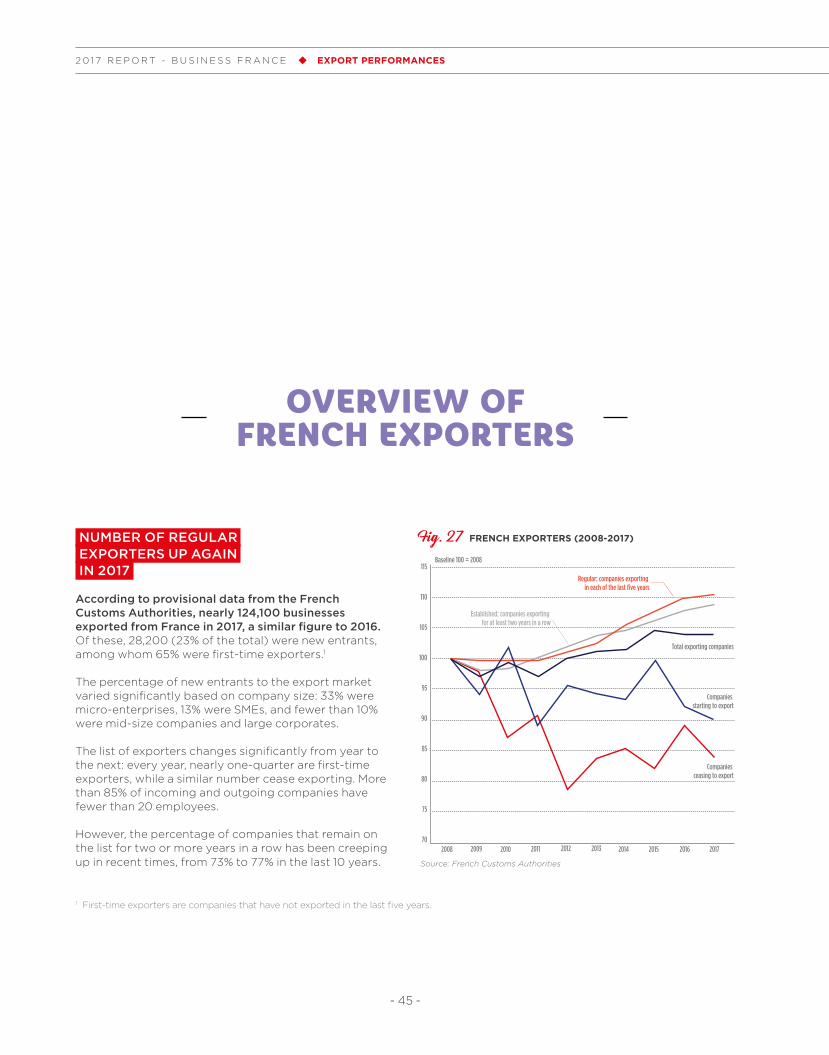
- 45 -
2 0 1 7 R E P O R T - B U S I N E S S F R A N C E EXPORT PERFORMANCES
OVERVIEW OF FRENCH EXPORTERS
NUMBER OF REGULAR EXPORTERS UP AGAININ 2017
According to provisional data from the French Customs Authorities, nearly 124,100 businesses exported from France in 2017, a similar figure to 2016. Of these, 28,200 (23% of the total) were new entrants, among whom 65% were first-time exporters.1
The percentage of new entrants to the export market varied significantly based on company size: 33% were micro-enterprises, 13% were SMEs, and fewer than 10% were mid-size companies and large corporates.
The list of exporters changes significantly from year to the next: every year, nearly one-quarter are first-time exporters, while a similar number cease exporting. More than 85% of incoming and outgoing companies have fewer than 20 employees.
However, the percentage of companies that remain on the list for two or more years in a row has been creeping up in recent times, from 73% to 77% in the last 10 years.
Fig. 27 FRENCH EXPORTERS (2008-2017)
Source: French Customs Authorities
1 First-time exporters are companies that have not exported in the last five years.
%
2008 2009 2010 2011 2012 2013 2014 2015 2016 2017
Companies starting to export
Companies ceasing to export
Total exporting companies
Established: companies exporting for at least two years in a row
Baseline 100 = 2008
Regular: companies exporting in each of the last five years
115
110
105
100
95
90
85
80
75
70
100
90
80
70
60
50
40
30
20
10
0
35
52
0.44
13
Large corporates Mid-size companies SMEs and micro-enterprises
%
95
0 10 20 30 40 50 60 70 80 90 100
39.82017
Top 100 exporters
Top 1,000 exporters
Top 10,000 exporters
71.1 94.8
80,000
70,000
60,000
50,000
40,000
30,000
20,000
10,000
European Union Non-EU Europe Africa Americas Asia Middle East
70,355
46,996
37,87734,475
31,902
16,018
25
20
15
10
5
0
Shar
e of e
xpor
t rev
enue
s
Share of number of exporters
Concentration of exporters
Transport equipment
Chemicals,perfumes
Food, beverages
Machinery
Textiles
Basic metals
Rubber, plastic
Electronic equipment
Petroleumproducts
%
Wood, paper Agriculturalproducts
Petroleum extraction, mining
Pharmaceuticals
Electronic/IT equipment
Diversification of exporters
0 2 4 6 8 10 12 14
%
16 18 20
2013 2014 2015 2016 2017
143
191270
513
743
3,1852,1341,3041,517615
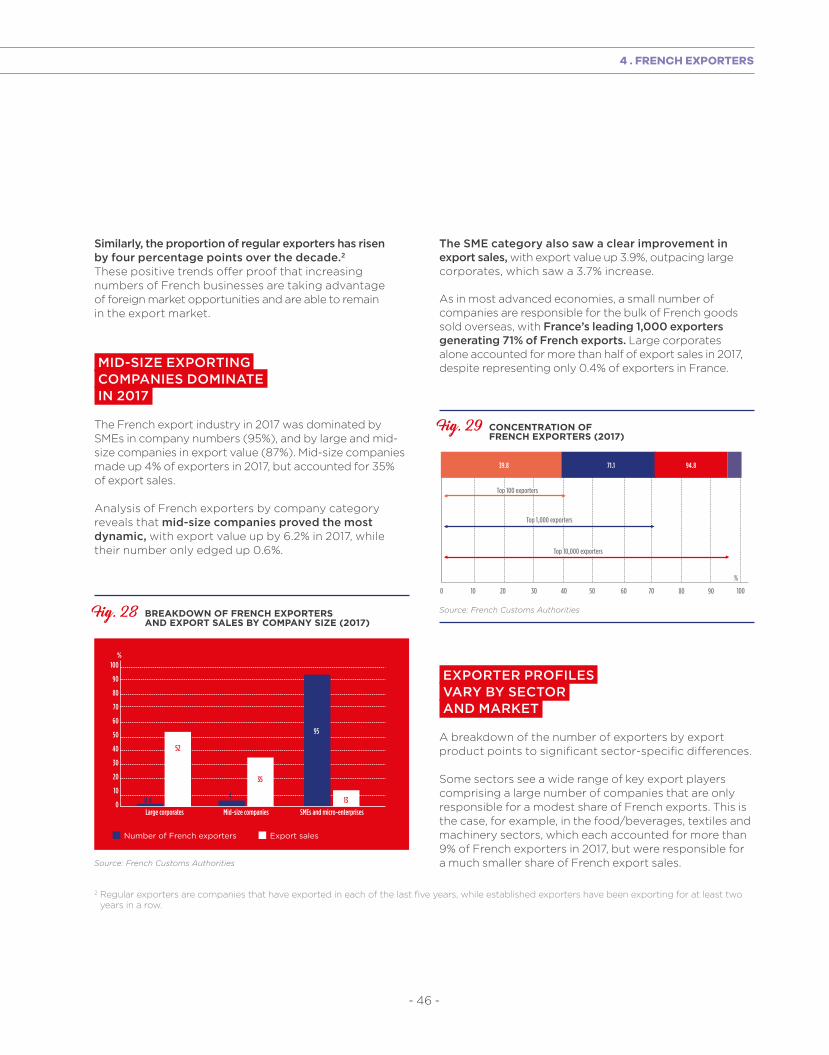
- 46 -
4 . FRENCH EXPORTERS
Fig. 28 BREAKDOWN OF FRENCH EXPORTERS AND EXPORT SALES BY COMPANY SIZE (2017)
Source: French Customs Authorities
2 Regular exporters are companies that have exported in each of the last five years, while established exporters have been exporting for at least two years in a row.
Similarly, the proportion of regular exporters has risen by four percentage points over the decade.2 These positive trends offer proof that increasing numbers of French businesses are taking advantage of foreign market opportunities and are able to remain in the export market.
MID-SIZE EXPORTING COMPANIES DOMINATEIN 2017
The French export industry in 2017 was dominated by SMEs in company numbers (95%), and by large and mid-size companies in export value (87%). Mid-size companies made up 4% of exporters in 2017, but accounted for 35% of export sales.
Analysis of French exporters by company category reveals that mid-size companies proved the most dynamic, with export value up by 6.2% in 2017, while their number only edged up 0.6%.
%
2008 2009 2010 2011 2012 2013 2014 2015 2016 2017
Companies starting to export
Companies ceasing to export
Total exporting companies
Established: companies exporting for at least two years in a row
Baseline 100 = 2008
Regular: companies exporting in each of the last five years
115
110
105
100
95
90
85
80
75
70
100
90
80
70
60
50
40
30
20
10
0
35
52
0.44
13
Large corporates Mid-size companies SMEs and micro-enterprises
%
95
0 10 20 30 40 50 60 70 80 90 100
39.82017
Top 100 exporters
Top 1,000 exporters
Top 10,000 exporters
71.1 94.8
80,000
70,000
60,000
50,000
40,000
30,000
20,000
10,000
European Union Non-EU Europe Africa Americas Asia Middle East
70,355
46,996
37,87734,475
31,902
16,018
25
20
15
10
5
0
Shar
e of e
xpor
t rev
enue
s
Share of number of exporters
Concentration of exporters
Transport equipment
Chemicals,perfumes
Food, beverages
Machinery
Textiles
Basic metals
Rubber, plastic
Electronic equipment
Petroleumproducts
%
Wood, paper Agriculturalproducts
Petroleum extraction, mining
Pharmaceuticals
Electronic/IT equipment
Diversification of exporters
0 2 4 6 8 10 12 14
%
16 18 20
2013 2014 2015 2016 2017
143
191270
513
743
3,1852,1341,3041,517615
Number of French exporters Export sales
The SME category also saw a clear improvement in export sales, with export value up 3.9%, outpacing large corporates, which saw a 3.7% increase.
As in most advanced economies, a small number of companies are responsible for the bulk of French goods sold overseas, with France’s leading 1,000 exporters generating 71% of French exports. Large corporates alone accounted for more than half of export sales in 2017, despite representing only 0.4% of exporters in France.
Fig. 29 CONCENTRATION OF FRENCH EXPORTERS (2017)
Source: French Customs Authorities
%
2008 2009 2010 2011 2012 2013 2014 2015 2016 2017
Companies starting to export
Companies ceasing to export
Total exporting companies
Established: companies exporting for at least two years in a row
Baseline 100 = 2008
Regular: companies exporting in each of the last five years
115
110
105
100
95
90
85
80
75
70
100
90
80
70
60
50
40
30
20
10
0
35
52
0.44
13
Large corporates Mid-size companies SMEs and micro-enterprises
%
95
0 10 20 30 40 50 60 70 80 90 100
39.82017
Top 100 exporters
Top 1,000 exporters
Top 10,000 exporters
71.1 94.8
80,000
70,000
60,000
50,000
40,000
30,000
20,000
10,000
European Union Non-EU Europe Africa Americas Asia Middle East
70,355
46,996
37,87734,475
31,902
16,018
25
20
15
10
5
0
Shar
e of e
xpor
t rev
enue
s
Share of number of exporters
Concentration of exporters
Transport equipment
Chemicals,perfumes
Food, beverages
Machinery
Textiles
Basic metals
Rubber, plastic
Electronic equipment
Petroleumproducts
%
Wood, paper Agriculturalproducts
Petroleum extraction, mining
Pharmaceuticals
Electronic/IT equipment
Diversification of exporters
0 2 4 6 8 10 12 14
%
16 18 20
2013 2014 2015 2016 2017
143
191270
513
743
3,1852,1341,3041,517615
EXPORTER PROFILES VARY BY SECTOR AND MARKET
A breakdown of the number of exporters by export product points to significant sector-specific differences.
Some sectors see a wide range of key export players comprising a large number of companies that are only responsible for a modest share of French exports. This is the case, for example, in the food/beverages, textiles and machinery sectors, which each accounted for more than 9% of French exporters in 2017, but were responsible for a much smaller share of French export sales.
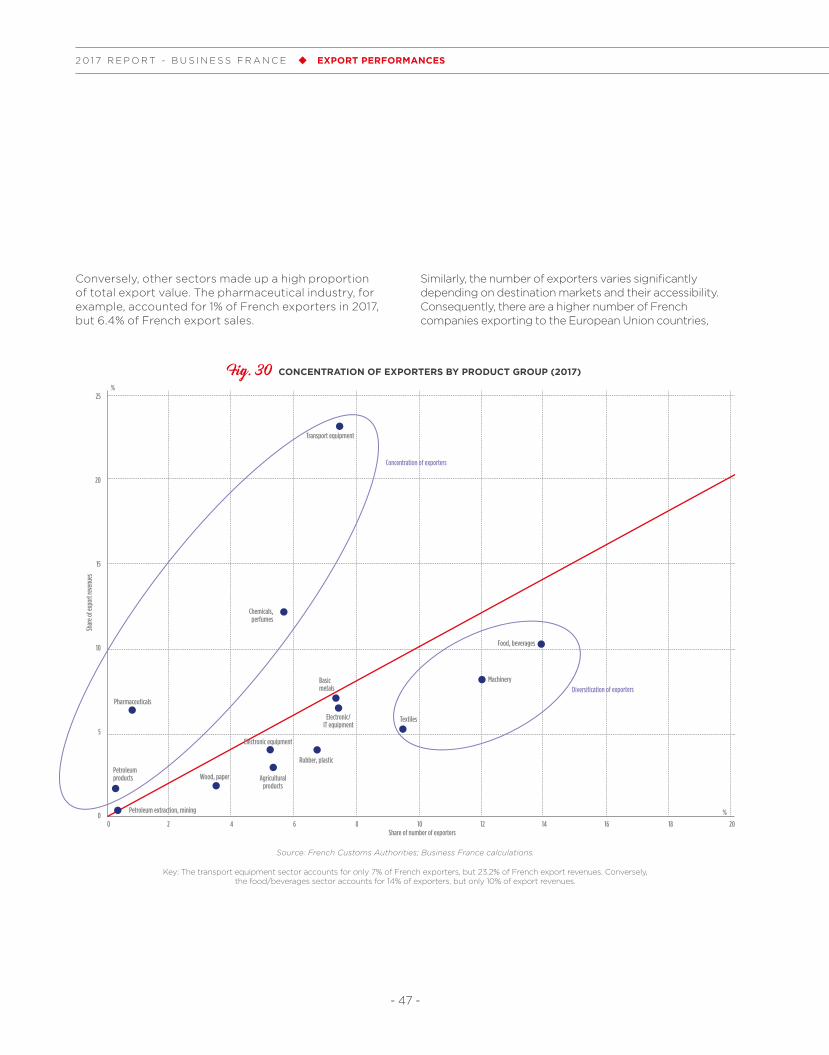
- 47 -
2 0 1 7 R E P O R T - B U S I N E S S F R A N C E EXPORT PERFORMANCES
Conversely, other sectors made up a high proportion of total export value. The pharmaceutical industry, for example, accounted for 1% of French exporters in 2017, but 6.4% of French export sales.
Fig. 30 CONCENTRATION OF EXPORTERS BY PRODUCT GROUP (2017)
Key: The transport equipment sector accounts for only 7% of French exporters, but 23.2% of French export revenues. Conversely, the food/beverages sector accounts for 14% of exporters, but only 10% of export revenues.
Source: French Customs Authorities; Business France calculations.
%
2008 2009 2010 2011 2012 2013 2014 2015 2016 2017
Companies starting to export
Companies ceasing to export
Total exporting companies
Established: companies exporting for at least two years in a row
Baseline 100 = 2008
Regular: companies exporting in each of the last five years
115
110
105
100
95
90
85
80
75
70
100
90
80
70
60
50
40
30
20
10
0
35
52
0.44
13
Large corporates Mid-size companies SMEs and micro-enterprises
%
95
0 10 20 30 40 50 60 70 80 90 100
39.82017
Top 100 exporters
Top 1,000 exporters
Top 10,000 exporters
71.1 94.8
80,000
70,000
60,000
50,000
40,000
30,000
20,000
10,000
European Union Non-EU Europe Africa Americas Asia Middle East
70,355
46,996
37,87734,475
31,902
16,018
25
20
15
10
5
0
Shar
e of e
xpor
t rev
enue
s
Share of number of exporters
Concentration of exporters
Transport equipment
Chemicals,perfumes
Food, beverages
Machinery
Textiles
Basic metals
Rubber, plastic
Electronic equipment
Petroleumproducts
%
Wood, paper Agriculturalproducts
Petroleum extraction, mining
Pharmaceuticals
Electronic/IT equipment
Diversification of exporters
0 2 4 6 8 10 12 14
%
16 18 20
2013 2014 2015 2016 2017
143
191270
513
743
3,1852,1341,3041,517615
Similarly, the number of exporters varies significantly depending on destination markets and their accessibility. Consequently, there are a higher number of French companies exporting to the European Union countries,
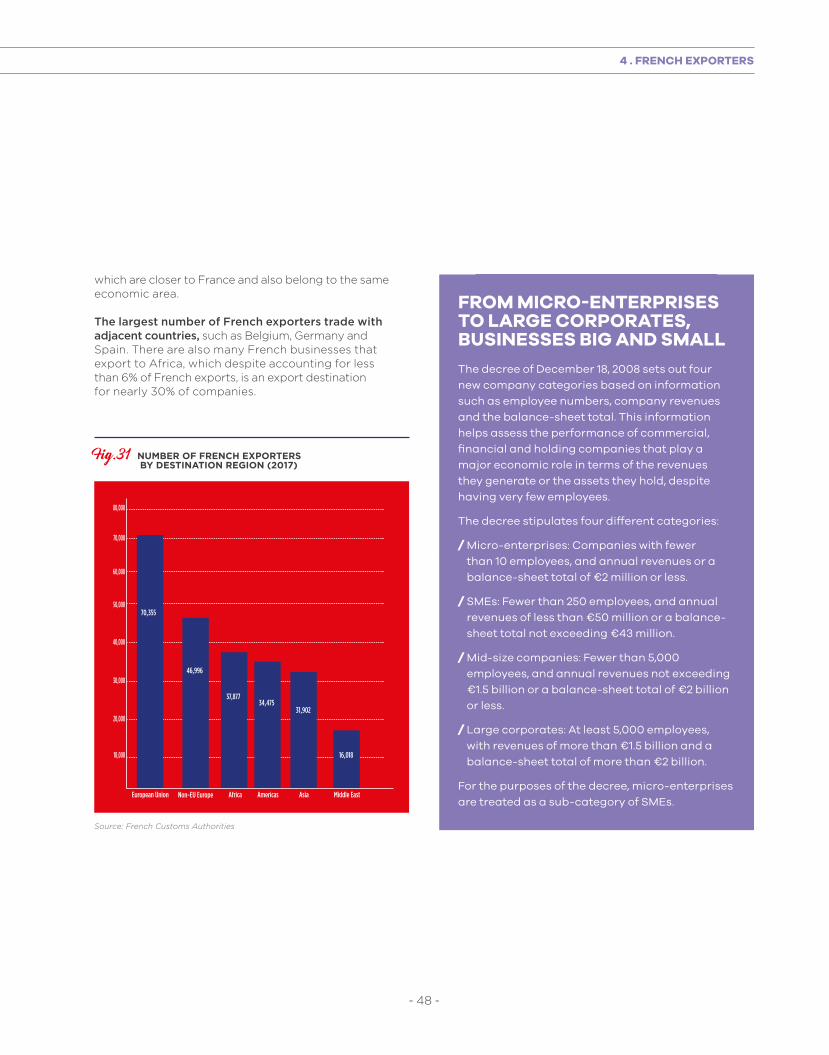
- 48 -
4 . FRENCH EXPORTERS
which are closer to France and also belong to the same economic area.
The largest number of French exporters trade with adjacent countries, such as Belgium, Germany and Spain. There are also many French businesses that export to Africa, which despite accounting for less than 6% of French exports, is an export destination for nearly 30% of companies.
Fig.31 NUMBER OF FRENCH EXPORTERS BY DESTINATION REGION (2017)
Source: French Customs Authorities
FROM MICRO-ENTERPRISES TO LARGE CORPORATES, BUSINESSES BIG AND SMALL The decree of December 18, 2008 sets out four new company categories based on information such as employee numbers, company revenues and the balance-sheet total. This information helps assess the performance of commercial, financial and holding companies that play a major economic role in terms of the revenues they generate or the assets they hold, despite having very few employees.
The decree stipulates four different categories:
/ Micro-enterprises: Companies with fewer than 10 employees, and annual revenues or a balance-sheet total of €2 million or less.
/ SMEs: Fewer than 250 employees, and annual revenues of less than €50 million or a balance-sheet total not exceeding €43 million.
/ Mid-size companies: Fewer than 5,000 employees, and annual revenues not exceeding €1.5 billion or a balance-sheet total of €2 billion or less.
/ Large corporates: At least 5,000 employees, with revenues of more than €1.5 billion and a balance-sheet total of more than €2 billion.
For the purposes of the decree, micro-enterprises are treated as a sub-category of SMEs.
%
2008 2009 2010 2011 2012 2013 2014 2015 2016 2017
Companies starting to export
Companies ceasing to export
Total exporting companies
Established: companies exporting for at least two years in a row
Baseline 100 = 2008
Regular: companies exporting in each of the last five years
115
110
105
100
95
90
85
80
75
70
100
90
80
70
60
50
40
30
20
10
0
35
52
0.44
13
Large corporates Mid-size companies SMEs and micro-enterprises
%
95
0 10 20 30 40 50 60 70 80 90 100
39.82017
Top 100 exporters
Top 1,000 exporters
Top 10,000 exporters
71.1 94.8
80,000
70,000
60,000
50,000
40,000
30,000
20,000
10,000
European Union Non-EU Europe Africa Americas Asia Middle East
70,355
46,996
37,87734,475
31,902
16,018
25
20
15
10
5
0
Shar
e of e
xpor
t rev
enue
s
Share of number of exporters
Concentration of exporters
Transport equipment
Chemicals,perfumes
Food, beverages
Machinery
Textiles
Basic metals
Rubber, plastic
Electronic equipment
Petroleumproducts
%
Wood, paper Agriculturalproducts
Petroleum extraction, mining
Pharmaceuticals
Electronic/IT equipment
Diversification of exporters
0 2 4 6 8 10 12 14
%
16 18 20
2013 2014 2015 2016 2017
143
191270
513
743
3,1852,1341,3041,517615
- 49 -
2 0 1 7 R E P O R T - B U S I N E S S F R A N C E EXPORT PERFORMANCES
French startups are increasingly catching the eyes of international investors and standing out as symbols of France’s innovation prowess, while more of their foreign counterparts are heading to France to build their businesses.
RAPIDINTERNATIONALIZATION
Often defined as innovative newly formed companies with strong growth potential, startups generally cross borders rapidly by exporting or operating abroad, sometimes from the outset, expanding simultaneously at home and in foreign markets. A number of startups – generally those operating in niche markets and high-tech sectors – can even be said to be “born global”; scarcely have they been established before they look abroad with an eye to greater opportunities.
Going global represents a significant investment for these fledgling companies, which do not yet have the financial resources needed to grow. Their success depends on their ability to raise capital and diversify their sources of funding. As such, access to a network of venture capital investors can be decisive for innovative startups in their initial stages of development.
FRANCE: A NATION OF STARTUPS
At the 2018 Las Vegas Consumer Electronics Show (CES), the largest of its kind in the world, 274 French startups displayed their wares at Eureka Park, the specific exhibit area for startups. France had the second largest national delegation, after the United States, highlighting just how much the country has done to foster the development of innovative new companies.
The many business incubators and accelerators throughout France can provide startups with
FRENCH STARTUPS GOING GLOBAL
customized support, including coaching, tailored advice and access to a network of professionals. An excellent example is in Paris, which is home to Station F, the largest startup incubator in the world. The 34,000-sq. m. venue opened in 2017 and can accommodate more than 1,000 startups.
France is among the simplest countries in which to found a company: only 3.5 days are required, compared with 4.5 days in the United Kingdom and 10.5 in Germany. What’s more, the costs of setting up a business are lower in France than in Germany, while France also boasts a very favorable tax system offering reduced rates for SMEs.
There is also a wide range of support for innovative companies. For example, startups working on R&D projects may benefit from the innovative new company status, which comes with tax and social security exemptions and can be combined with France’s research tax credit. According to the EY 2017 survey on the performance of digital startups in France, more than half of them have innovative new company status and are benefiting from France’s research tax credit.
STARTUP FUNDING
Given their liquidity constraints and difficulty in qualifying for bank loans, startups can find it difficult to get off the ground. However, newly founded companies can obtain easy funding through schemes such as the seed capital loans introduced by Bpifrance, France’s public investment bank, in 2005, which is offered to innovative small companies that have received government innovation support.
New companies also need investors to fund their international operations. The most recent CB Insights/La French Tech report on tech funding trends nationwide confirms an increase in the number and value of funding deals with early-stage companies in France in 2017. According to the report, there were
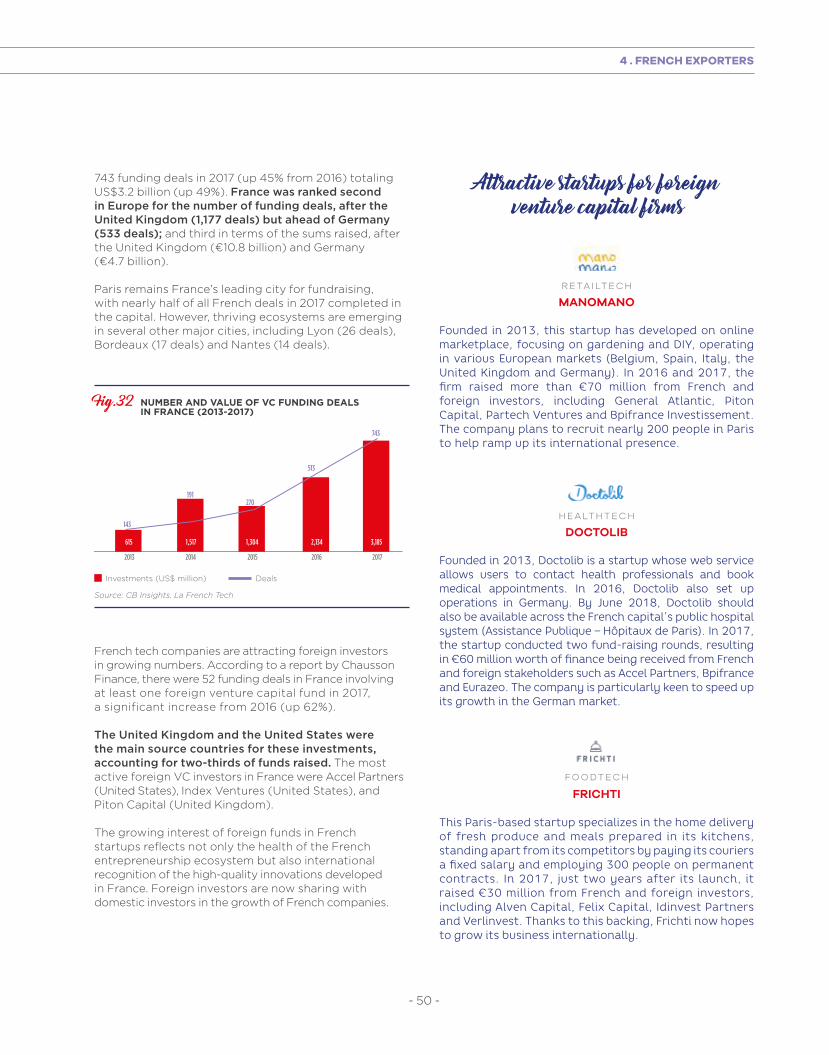
- 50 -
4 . FRENCH EXPORTERS
Attractive startups for foreign venture capital firms
R E TA I LT E C H
MANOMANO
Founded in 2013, this startup has developed on online marketplace, focusing on gardening and DIY, operating in various European markets (Belgium, Spain, Italy, the United Kingdom and Germany). In 2016 and 2017, the firm raised more than €70 million from French and foreign investors, including General Atlantic, Piton Capital, Partech Ventures and Bpifrance Investissement. The company plans to recruit nearly 200 people in Paris to help ramp up its international presence.
743 funding deals in 2017 (up 45% from 2016) totaling US$3.2 billion (up 49%). France was ranked second in Europe for the number of funding deals, after the United Kingdom (1,177 deals) but ahead of Germany (533 deals); and third in terms of the sums raised, after the United Kingdom (€10.8 billion) and Germany (€4.7 billion).
Paris remains France’s leading city for fundraising, with nearly half of all French deals in 2017 completed in the capital. However, thriving ecosystems are emerging in several other major cities, including Lyon (26 deals), Bordeaux (17 deals) and Nantes (14 deals).
French tech companies are attracting foreign investors in growing numbers. According to a report by Chausson Finance, there were 52 funding deals in France involving at least one foreign venture capital fund in 2017, a significant increase from 2016 (up 62%).
The United Kingdom and the United States were the main source countries for these investments, accounting for two-thirds of funds raised. The most active foreign VC investors in France were Accel Partners (United States), Index Ventures (United States), and Piton Capital (United Kingdom).
The growing interest of foreign funds in French startups reflects not only the health of the French entrepreneurship ecosystem but also international recognition of the high-quality innovations developed in France. Foreign investors are now sharing with domestic investors in the growth of French companies.
Fig.32 NUMBER AND VALUE OF VC FUNDING DEALS IN FRANCE (2013-2017)
Source: CB Insights, La French Tech
Investments (US$ million) Deals
%
2008 2009 2010 2011 2012 2013 2014 2015 2016 2017
Companies starting to export
Companies ceasing to export
Total exporting companies
Established: companies exporting for at least two years in a row
Baseline 100 = 2008
Regular: companies exporting in each of the last five years
115
110
105
100
95
90
85
80
75
70
100
90
80
70
60
50
40
30
20
10
0
35
52
0.44
13
Large corporates Mid-size companies SMEs and micro-enterprises
%
95
0 10 20 30 40 50 60 70 80 90 100
39.82017
Top 100 exporters
Top 1,000 exporters
Top 10,000 exporters
71.1 94.8
80,000
70,000
60,000
50,000
40,000
30,000
20,000
10,000
European Union Non-EU Europe Africa Americas Asia Middle East
70,355
46,996
37,87734,475
31,902
16,018
25
20
15
10
5
0
Shar
e of e
xpor
t rev
enue
s
Share of number of exporters
Concentration of exporters
Transport equipment
Chemicals,perfumes
Food, beverages
Machinery
Textiles
Basic metals
Rubber, plastic
Electronic equipment
Petroleumproducts
%
Wood, paper Agriculturalproducts
Petroleum extraction, mining
Pharmaceuticals
Electronic/IT equipment
Diversification of exporters
0 2 4 6 8 10 12 14
%
16 18 20
2013 2014 2015 2016 2017
143
191270
513
743
3,1852,1341,3041,517615
H E A LT H T E C H
DOCTOLIB
Founded in 2013, Doctolib is a startup whose web service allows users to contact health professionals and book medical appointments. In 2016, Doctolib also set up operations in Germany. By June 2018, Doctolib should also be available across the French capital’s public hospital system (Assistance Publique – Hôpitaux de Paris). In 2017, the startup conducted two fund-raising rounds, resulting in €60 million worth of finance being received from French and foreign stakeholders such as Accel Partners, Bpifrance and Eurazeo. The company is particularly keen to speed up its growth in the German market.
F O O D T E C H
FRICHTI
This Paris-based startup specializes in the home delivery of fresh produce and meals prepared in its kitchens, standing apart from its competitors by paying its couriers a fixed salary and employing 300 people on permanent contracts. In 2017, just two years after its launch, it raised €30 million from French and foreign investors, including Alven Capital, Felix Capital, Idinvest Partners and Verlinvest. Thanks to this backing, Frichti now hopes to grow its business internationally.
- 51 -
2 0 1 7 R E P O R T - B U S I N E S S F R A N C E EXPORT PERFORMANCES
They set up in France
FRANCE WELCOMES FOREIGN STARTUPS
France has launched numerous initiatives to consolidate and promote the French ecosystem to foreign startups.
For example, the French Tech Ticket, introduced in 2015, aims to attract international entrepreneurs to France by providing them with a welcome pack to help them start and grow their business in France. It offers winning foreign applicants a grant for each founding member, as well as 12 months’ residency in a business incubator. Since June 2017, the French Tech Visa has also made it easier and quicker for foreign talent to obtain residence permits.
Following the second edition of the French Tech Ticket initiative, 70 foreign startups have established themselves in France. The winners come from 42 different countries and are now based in more than 40 incubators in 13 cities across France.
A G R I - F O O D
ZABBAAN
This Malian startup has developed a range of drinks made from ingredients produced by sustainable fair-trade farms in Africa. To market its products across Europe, the firm’s young CEO decided to set up an international sales subsidiary at Bond’innov in Bondy, just outside Paris, which is set to recruit around 15 people within the next three years. The CEO is also going to set up a small R&D center employing three people in the city of Amiens, where she spent part of her studies.
S O F T WA R E A N D I T S E RV I C E S
MINDMAZE
This Swiss startup, valued at US$1 billion, specializes in developing virtual-reality software to help with the neurological rehabilitation of stroke victims. It established itself in France in 2017, and has an R&D center in Paris, where a dozen researchers have been working on how to interpret brain signals.
S O F T WA R E A N D I T S E RV I C E S
NANORAVEN
This Brazilian startup and 2017 French Tech Ticket winner designs and builds communication systems for nanosatellites. The company has opened a site in Montpellier in the Occitanie region, close to the city’s University Space Center, the only French higher education establishment to offer the European Space Agency’s Fly Your Satellite! program. The startup now plans to create five jobs in the immediate future.
S O F T WA R E A N D I T S E RV I C E S
CARFIT
This Franco-Canadian startup has developed artificial intelligence software that can identify a vehicle’s maintenance needs by analyzing vibrations through a small unit fixed under the steering wheel. Carfit was one of the winners of the second edition of the French Tech Ticket and decided to set up in Lille’s Euratechnologies incubator (Hauts de France region), as well as at the Bpifrance Hub in Paris (Ile de France).
- 52 -
4 . FRENCH EXPORTERS
‘LA FRENCH TECH’: CONNECTING A NETWORK OF STARTUP ECOSYSTEMS
Numerous government and state bodies underpin support for startups in France, including the Ministry for the Economy and Finance (Businesses Directorate, Treasury Directorate), the Ministry of Foreign Affairs and International Development (Businesses and International Economy Directorate), the National Investment Commission, the Caisse des Dépôts, Bpifrance and Business France.
Together, their pro-startup efforts are coordinated under the banner of “La French Tech”, a public/private initiative and accreditation launched in late 2013 to encourage the creation of successful French startups and help innovative entrepreneurs build their businesses.
The three strands of the French Tech international strategy are:
/ Building French Tech Hubs to group French entrepreneurs in foreign countries into ecosystems to accelerate the foreign development of French startups, and promoting France as an attractive business location for entrepreneurs and local investors. In June 2015, 12 new French tech hubs were accredited in New York, Israel, Tokyo, San Francisco, Montreal, Cape Town, Hong Kong, Moscow, Barcelona, London, Abidjan and Seoul. Since then, a further 10 have been set up in Berlin, Dubai, Los Angeles, Milan, Beijing, São Paolo, Shanghai, Shenzhen, Taiwan and Vietnam.
/ Launching a €15 million French Tech international promotion platform, to support various initiatives, particularly by private-sector stakeholders, to highlight and showcase France’s innovation prowess.
/ Introducing the French Tech Ticket, a bespoke support package to attract young entrepreneurs to France by providing a welcome pack (residence permit, individual grant, accommodation, and customized advice) to help them set up and expand their business.
BUSINESS FRANCE SERVICES FOR STARTUPSWithin the scope of its programs to help companies do business in international markets, Business France offers startups a wide range of services, depending on their level of maturity:
/ Assistance at international trade fairs as well as setting up meetings with local businesses and stakeholders catering to startups’ needs.
/ Reconnaissance programs (e.g. French Tech Tours) for mature startups that have one or more foreign target markets in their sights. Business France now offers five tours, ranging from the exploration of ecosystems in Japan and South Korea, to longer three-week immersions in Canada. The program is now available in five countries: Russia, Japan/South Korea, India, Brazil and Canada.
/ Accelerator programs, like Impact in the United States and Acceleratech in China.
/ The opportunity to take part in internationally renowned programs such as MedStartUp, stemming from a partnership between Business France and the Galien Foundation, that rewards innovative transatlantic alliances between startups in the pharmaceutical, biotech, medtech and healthcare industries.
Business France is also responsible for promoting the “La French Tech” brand throughout the world by advocating France’s attractiveness as a startup destination. This operational role sees it provide support to startups and entrepreneurs at global trade fairs (e.g. CES in Las Vegas) and conferences (e.g. World Economic Forum in Davos), as well as assistance for foreign investors and journalists looking to learn more about France’s startup ecosystem.
S O F T WA R E A N D I T S E RV I C E S
NOVADE SOLUTIONS
This Singapore-based tech startup specializes in digitalization for the construction and manufacturing sectors. It chose to set up its European headquarters and R&D center in Aix-en-Provence, in the Provence-Alpes-Côte d’Azur region, where it will now create around 15 jobs.
Publication Director: Christophe Lecourtier (CEO)Chief Editor: Sylvie Montout (Chief Economist)Contributor: Manuel Marcias (Economist)Translation: David Williams, Peter Stewart (English Language Editors)Editorial coordination: Mélanie Cornière (Editorial Project Manager); Priscille Troyan-Gulli (Brand & Image Team Leader)Design and layout: Hopscotch – March 2018
Printed in France by IPP Imprimeur
Business France is the national agency supporting the internationaldevelopment of the French economy, responsible for fostering export growth by French businesses, as well as promoting and facilitating international investment in France.
It promotes France’s companies, business image and nationwide attractivenessas an investment location, and also runs the VIE international internship program.
Business France has 1,500 personnel, both in France and in 64 countries throughout the world, who work with a network of public- and private-sector partners.
CONNECT – FAST-TRACK – SUCCEED
For further information, please visit: www.businessfrance.fr
Business France
77, boulevard Saint-Jacques
75680 Paris Cedex 14
Tel.: +33 1 40 73 30 00
Despite the potential of the South African economy, investments in France remain few in number.
SOUTH AFRICAN COMPANIES IN FRANCE
There are around twenty South African companies operating in France, where they employ more than 12,000 people. Three South African investments have been recorded in France since 2016, creating or maintaining around twenty jobs.
In 2017, South African companies set up two decision-making centers in France in Ile de France (Paris region). These investments involved the agri-food sector and a communication agency. In 2016, a research center for thrombosis was set up in Normandy.
SOUTH AFRICAN INVESTMENTS IN EUROPE
In 2017, South African investments in Europe were made primarily in the United Kingdom (32%), France (16%) and the Netherlands (16%).2
SELECTED INVESTMENT PROJECTS IN 2017
BOS Brands: South Africa’s leading producer of rooibos-based iced tea decided to open a sales and marketing office in Paris (Ile de France region), creating 11 jobs. As France represents the largest European market for consumption of iced tea, BOS Brands is planning to expand its business on French soil.
Hall & Sons Group: This producer and exporter of avocados already has a presence at the Rungis market outside Paris and has now invested in the Provence-Alpes-Côte d’Azur region, buying equipment and saving six jobs at the Logaram distribution center. The investment will enable the company to cover the Mediterranean market from France.
Parent company Main business sector Workforce in France
STEINHOFF INTERNATIONAL HOLDINGS (CONFORAMA)
Wholesale and retail Furnishings, household goods
9,000-10,000
ASPEN HOLDINGS Pharmaceuticals and biotechnologies 800-900
BRAIT SE (NEW LOOK) Financial services Textiles, clothing and accessories 500
IMPERIAL HOLDINGS LTD. Transport, storage 50-100
HANS MERENSKY HOLDINGS Glass, ceramics, minerals, wood, paper 20-100
TOP 5 SOUTH AFRICAN COMPANIES BY EMPLOYMENT IN FRANCE
2016 2017
Business activity Projects Jobs Projects Jobs
Decision-making centers - - 2 14
First-time investments - - 2 14
R&D, engineering, design 1 10 - -
R&D 1 10 - -
Total 1 10 2 14
BREAKDOWN OF PROJECTS BY BUSINESS ACTIVITY
1 FDI stock in France (ultimate investor) as of December 31, 2015. 2 Business France Europe Observatory.
FLOW
2projects (Business France)
14jobs (Business France)
STOCK
More than 20
companies in France (Orbis)
More than12,000
employees (Business France, Johannesburg)
€2.1 billion
FDI stock in France1
(Banque de France)
€1.8 billion
French exports 43rd place(French Customs Authorities)
10 companies in the Forbes 2000
SOUTH AFRICA
INVEST
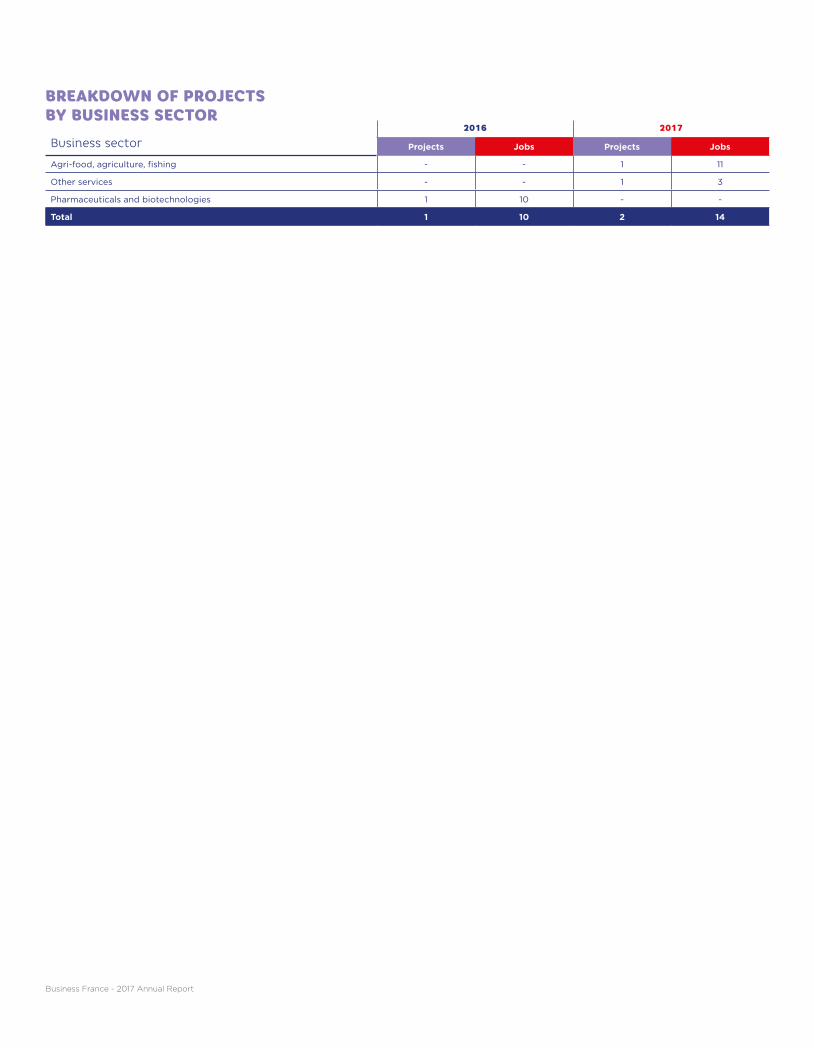
Business sector2016 2017
Projects Jobs Projects Jobs
Agri-food, agriculture, fishing - - 1 11
Other services - - 1 3
Pharmaceuticals and biotechnologies 1 10 - -
Total 1 10 2 14
BREAKDOWN OF PROJECTS BY BUSINESS SECTOR
Business France - 2017 Annual Report
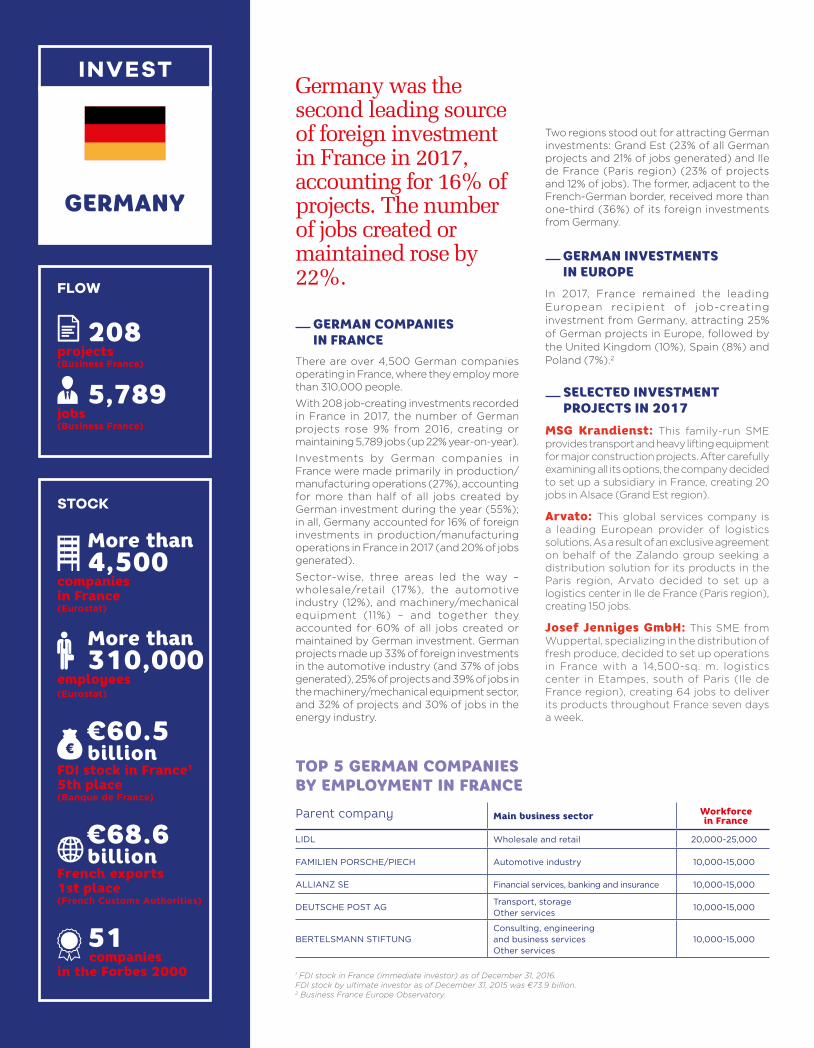
GERMANY
INVEST
1 FDI stock in France (immediate investor) as of December 31, 2016. FDI stock by ultimate investor as of December 31, 2015 was €73.9 billion.2 Business France Europe Observatory.
Germany was the second leading source of foreign investment in France in 2017, accounting for 16% of projects. The number of jobs created or maintained rose by 22%.
GERMAN COMPANIES IN FRANCE
There are over 4,500 German companies operating in France, where they employ more than 310,000 people.
With 208 job-creating investments recorded in France in 2017, the number of German projects rose 9% from 2016, creating or maintaining 5,789 jobs (up 22% year-on-year).
Investments by German companies in France were made primarily in production/manufacturing operations (27%), accounting for more than half of all jobs created by German investment during the year (55%); in all, Germany accounted for 16% of foreign investments in production/manufacturing operations in France in 2017 (and 20% of jobs generated).
Sector-wise, three areas led the way – wholesale/retail (17%), the automotive industry (12%), and machinery/mechanical equipment (11%) – and together they accounted for 60% of all jobs created or maintained by German investment. German projects made up 33% of foreign investments in the automotive industry (and 37% of jobs generated), 25% of projects and 39% of jobs in the machinery/mechanical equipment sector, and 32% of projects and 30% of jobs in the energy industry.
Two regions stood out for attracting German investments: Grand Est (23% of all German projects and 21% of jobs generated) and Ile de France (Paris region) (23% of projects and 12% of jobs). The former, adjacent to the French-German border, received more than one-third (36%) of its foreign investments from Germany.
GERMAN INVESTMENTS IN EUROPE
In 2017, France remained the leading European recipient of job-creating investment from Germany, attracting 25% of German projects in Europe, followed by the United Kingdom (10%), Spain (8%) and Poland (7%).2
SELECTED INVESTMENT PROJECTS IN 2017
MSG Krandienst: This family-run SME provides transport and heavy lifting equipment for major construction projects. After carefully examining all its options, the company decided to set up a subsidiary in France, creating 20 jobs in Alsace (Grand Est region).
Arvato: This global services company is a leading European provider of logistics solutions. As a result of an exclusive agreement on behalf of the Zalando group seeking a distribution solution for its products in the Paris region, Arvato decided to set up a logistics center in Ile de France (Paris region), creating 150 jobs.
Josef Jenniges GmbH: This SME from Wuppertal, specializing in the distribution of fresh produce, decided to set up operations in France with a 14,500-sq. m. logistics center in Etampes, south of Paris (Ile de France region), creating 64 jobs to deliver its products throughout France seven days a week.
Parent company Main business sector Workforce in France
LIDL Wholesale and retail 20,000-25,000
FAMILIEN PORSCHE/PIECH Automotive industry 10,000-15,000
ALLIANZ SE Financial services, banking and insurance 10,000-15,000
DEUTSCHE POST AGTransport, storageOther services
10,000-15,000
BERTELSMANN STIFTUNGConsulting, engineering and business servicesOther services
10,000-15,000
TOP 5 GERMAN COMPANIES BY EMPLOYMENT IN FRANCE
FLOW
208projects (Business France)
5,789jobs (Business France)
STOCK
More than 4,500
companies in France (Eurostat)
More than310,000
employees (Eurostat)
€60.5 billion
FDI stock in France1
5th place(Banque de France)
€68.6 billion
French exports 1st place(French Customs Authorities)
51 companies in the Forbes 2000
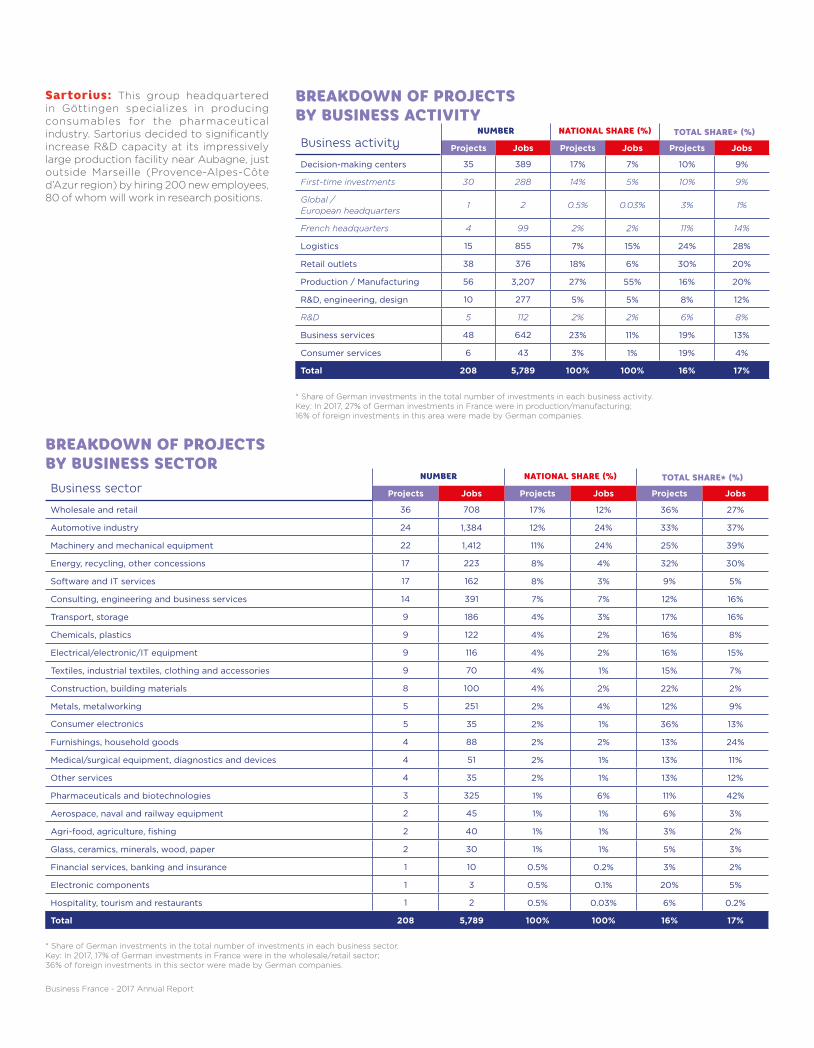
* Share of German investments in the total number of investments in each business activity.Key: In 2017, 27% of German investments in France were in production/manufacturing; 16% of foreign investments in this area were made by German companies.
* Share of German investments in the total number of investments in each business sector.Key: In 2017, 17% of German investments in France were in the wholesale/retail sector; 36% of foreign investments in this sector were made by German companies.
BREAKDOWN OF PROJECTS BY BUSINESS ACTIVITY
BREAKDOWN OF PROJECTS BY BUSINESS SECTOR
Sartorius: This group headquartered in Göttingen specializes in producing consumables for the pharmaceutical industry. Sartorius decided to significantly increase R&D capacity at its impressively large production facility near Aubagne, just outside Marseille (Provence-Alpes-Côte d’Azur region) by hiring 200 new employees, 80 of whom will work in research positions.
Business activityNUMBER NATIONAL SHARE (%) TOTAL SHARE* (%)
Projects Jobs Projects Jobs Projects Jobs
Decision-making centers 35 389 17% 7% 10% 9%
First-time investments 30 288 14% 5% 10% 9%
Global / European headquarters
1 2 0.5% 0.03% 3% 1%
French headquarters 4 99 2% 2% 11% 14%
Logistics 15 855 7% 15% 24% 28%
Retail outlets 38 376 18% 6% 30% 20%
Production / Manufacturing 56 3,207 27% 55% 16% 20%
R&D, engineering, design 10 277 5% 5% 8% 12%
R&D 5 112 2% 2% 6% 8%
Business services 48 642 23% 11% 19% 13%
Consumer services 6 43 3% 1% 19% 4%
Total 208 5,789 100% 100% 16% 17%
Business sectorNUMBER NATIONAL SHARE (%) TOTAL SHARE* (%)
Projects Jobs Projects Jobs Projects Jobs
Wholesale and retail 36 708 17% 12% 36% 27%
Automotive industry 24 1,384 12% 24% 33% 37%
Machinery and mechanical equipment 22 1,412 11% 24% 25% 39%
Energy, recycling, other concessions 17 223 8% 4% 32% 30%
Software and IT services 17 162 8% 3% 9% 5%
Consulting, engineering and business services 14 391 7% 7% 12% 16%
Transport, storage 9 186 4% 3% 17% 16%
Chemicals, plastics 9 122 4% 2% 16% 8%
Electrical/electronic/IT equipment 9 116 4% 2% 16% 15%
Textiles, industrial textiles, clothing and accessories 9 70 4% 1% 15% 7%
Construction, building materials 8 100 4% 2% 22% 2%
Metals, metalworking 5 251 2% 4% 12% 9%
Consumer electronics 5 35 2% 1% 36% 13%
Furnishings, household goods 4 88 2% 2% 13% 24%
Medical/surgical equipment, diagnostics and devices 4 51 2% 1% 13% 11%
Other services 4 35 2% 1% 13% 12%
Pharmaceuticals and biotechnologies 3 325 1% 6% 11% 42%
Aerospace, naval and railway equipment 2 45 1% 1% 6% 3%
Agri-food, agriculture, fishing 2 40 1% 1% 3% 2%
Glass, ceramics, minerals, wood, paper 2 30 1% 1% 5% 3%
Financial services, banking and insurance 1 10 0.5% 0.2% 3% 2%
Electronic components 1 3 0.5% 0.1% 20% 5%
Hospitality, tourism and restaurants 1 2 0.5% 0.03% 6% 0.2%
Total 208 5,789 100% 100% 16% 17%
Business France - 2017 Annual Report

LATIN AMERICA
INVEST
1 FDI stock in France (immediate investor) as of December 31, 2016. FDI stock by ultimate investor as of December 31, 2015 was €1.8 billion.
2 Argentina, Bolivia, Brazil, Chile, Colombia, Costa Rica, Cuba, Ecuador, Guatemala, Guyana, Honduras, Mexico, Nicaragua, Panama, Paraguay, Peru, Uruguay, Venezuela.3 Business France Europe Observatory.
Latin American2 investment in France was very buoyant in 2017, with 22 projects creating or maintaining 136 jobs (+53%).
LATIN AMERICAN COMPANIES IN FRANCE
There are around a hundred Latin American companies operating in France, where they employ around 5,700 people.
Twenty-two new job-creating Latin American investments were recorded in 2017, creating or maintaining 136 jobs, with most projects coming from Brazil (14) and Mexico (7).
These investments were made predominantly in decision-making centers (64% of projects and 70% of jobs generated), which included two new Global or European headquarters.
Sector-wise, they were mainly split between the software/IT services (18% of projects), consulting/engineering/business services (18%), and perfumes/cosmetics (14%) sectors, and were most often located in Ile de France (Paris region) (36% of projects; 58% of jobs).
LATIN AMERICAN INVESTMENTS IN EUROPE
In 2017, Portugal and Spain were the leading European recipients of Latin American investments, attracting 30% and 27%, respectively, of Latin American projects in Europe, while the United Kingdom received 11% and France 8%.3
SELECTED INVESTMENT PROJECTS IN 2017
ZaveApp: This Mexican FinTech startup offers virtual piggy bank services for smartphones. Being named a French Tech Ticket winner in 2017 enabled it to create a subsidiary in France. To continue its expansion, ZaveApp has joined the Station F incubator in Paris (Ile de France region) and intends to create 10 jobs over the next three years.
Sislor: This Brazilian engineering company specializing in designing and developing technologies used in household waste reverse logistics opened its first plant in Rouen (Normandy region), creating 10 jobs initially.
MJV: Brazilian consulting firm MJV specializes in business, technology and digital transformation for innovative solutions, and originally supported its European customers from London. Post-Brexit, the company decided to open an office in Paris (Ile de France region) to reposition its operations, transferring one position and now due to hire around ten new employees.
Opuntia: This Mexican cosmetics company produces prickly pears for cosmetology applications and other finished products (vinegar and juice). It created a subsidiary in France to position itself upstream of the sector, creating three new jobs initially. The French facility packages seeds extracted from fruits grown in Mexico. A second phase of the project will involve R&D.
Parent company Main business sector Workforce in France
CEMEX (Mexico) Construction, building materials 2,000
VALE S.A. (Brazil) Metals, metalworking 1,400-1,500
SIGDO KOPPERS (Chile)Construction, building materialsMetals, metalworking Transport, storage
500-600
NATURA COSMETICOS (Brazil) Perfumes, cosmetics 400
MEXICHEM (WAVIN) (Mexico) Chemicals, plastics 300-400
TOP 5 LATIN AMERICAN COMPANIES BY EMPLOYMENT IN FRANCE
FLOW
22projects (Business France)
136jobs (Business France)
STOCK
100
companies in France (Orbis)
5,700employees(Orbis)
€1.4 billion
FDI stock in France1
(Banque de France)
€11.3 billion
French exports (French Customs Authorities)
56 companies in the Forbes 2000
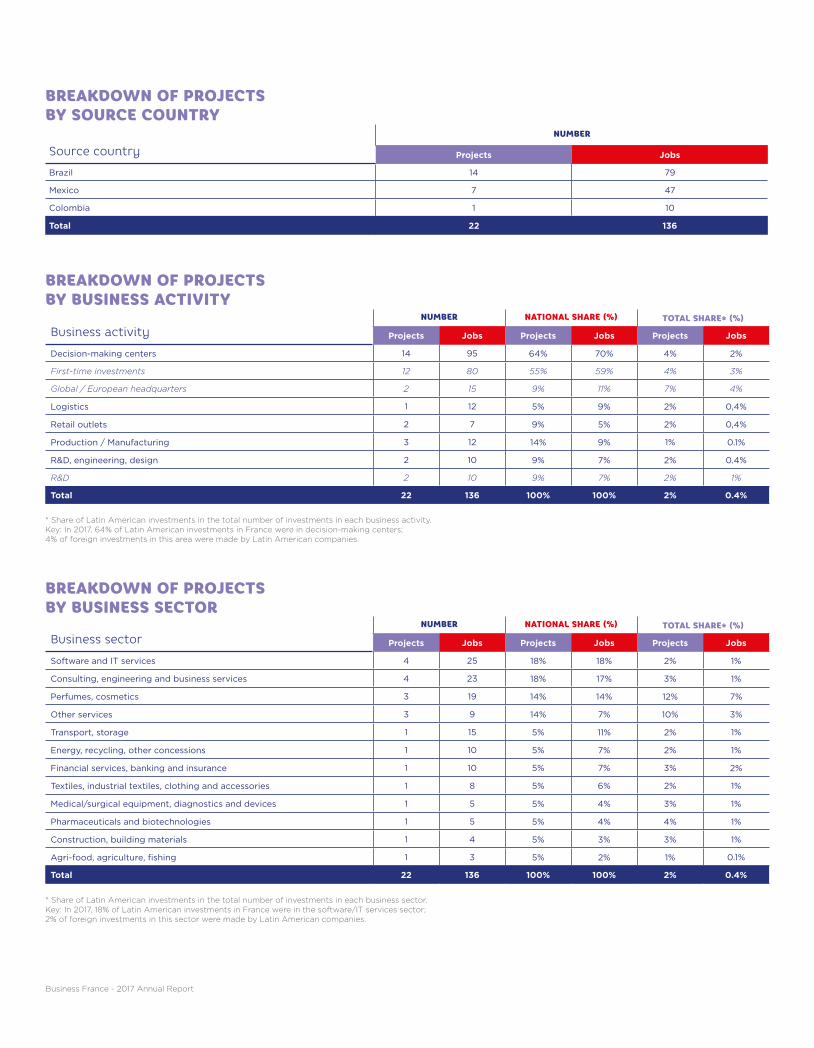
NUMBER
Source country Projects Jobs
Brazil 14 79
Mexico 7 47
Colombia 1 10
Total 22 136
BREAKDOWN OF PROJECTS BY SOURCE COUNTRY
* Share of Latin American investments in the total number of investments in each business activity.Key: In 2017, 64% of Latin American investments in France were in decision-making centers; 4% of foreign investments in this area were made by Latin American companies.
BREAKDOWN OF PROJECTS BY BUSINESS ACTIVITY
Business activityNUMBER NATIONAL SHARE (%) TOTAL SHARE* (%)
Projects Jobs Projects Jobs Projects Jobs
Decision-making centers 14 95 64% 70% 4% 2%
First-time investments 12 80 55% 59% 4% 3%
Global / European headquarters 2 15 9% 11% 7% 4%
Logistics 1 12 5% 9% 2% 0,4%
Retail outlets 2 7 9% 5% 2% 0,4%
Production / Manufacturing 3 12 14% 9% 1% 0.1%
R&D, engineering, design 2 10 9% 7% 2% 0.4%
R&D 2 10 9% 7% 2% 1%
Total 22 136 100% 100% 2% 0.4%
* Share of Latin American investments in the total number of investments in each business sector.Key: In 2017, 18% of Latin American investments in France were in the software/IT services sector; 2% of foreign investments in this sector were made by Latin American companies.
BREAKDOWN OF PROJECTS BY BUSINESS SECTOR
Business sectorNUMBER NATIONAL SHARE (%) TOTAL SHARE* (%)
Projects Jobs Projects Jobs Projects Jobs
Software and IT services 4 25 18% 18% 2% 1%
Consulting, engineering and business services 4 23 18% 17% 3% 1%
Perfumes, cosmetics 3 19 14% 14% 12% 7%
Other services 3 9 14% 7% 10% 3%
Transport, storage 1 15 5% 11% 2% 1%
Energy, recycling, other concessions 1 10 5% 7% 2% 1%
Financial services, banking and insurance 1 10 5% 7% 3% 2%
Textiles, industrial textiles, clothing and accessories 1 8 5% 6% 2% 1%
Medical/surgical equipment, diagnostics and devices 1 5 5% 4% 3% 1%
Pharmaceuticals and biotechnologies 1 5 5% 4% 4% 1%
Construction, building materials 1 4 5% 3% 3% 1%
Agri-food, agriculture, fishing 1 3 5% 2% 1% 0.1%
Total 22 136 100% 100% 2% 0.4%
Business France - 2017 Annual Report

WEST/ CENTRAL AFRICA
INVEST
1 FDI stock in France (immediate investor) as of December 31, 2016. FDI stock by ultimate investor as of December 31, 2015 was €395 million.2 Benin, Burkina Faso, Cameroon, Cape Verde, Central African Republic, Chad, Congo, DR Congo, Equatorial Guinea, Gabon, Gambia, Ghana, Guinea, Guinea-Bissau, Ivory Coast, Liberia, Mali, Niger, Nigeria, São Tome & Principe, Senegal, Sierra Leone, Togo. 3 Business France Europe Observatory.
Eight investment decisions were recorded in France from West/Central African countries2 in 2017, creating or maintaining 101 jobs.
WEST/CENTRAL AFRICAN COMPANIES IN FRANCE
There are more than 70 West/Central African companies operating in France, where they employ around 500 people. Eight investment decisions were recorded in France from West/Central African countries in 2017, creating or maintaining 101 jobs.
These investments were mostly from Ivory Coast (4 projects) and Mali (2 projects), and mainly involved decision-making centers (6 projects; 85 jobs) and R&D operations (2 projects; 16 jobs).
Sector-wise, investments were mostly made by companies in the software/IT services (4 projects; 67 jobs) and agri-food (2 projects; 18 jobs) industries, and were primarily located in Ile de France (Paris region) (4 projects; 38 jobs).
WEST/CENTRAL AFRICAN INVESTMENTS IN EUROPE
Job-creating investments in Europe from West/Central African countries in 2017 remained limited in number; however, France was the leading recipient, ahead of the United Kingdom. 3
SELECTED INVESTMENT PROJECTS IN 2017
Semoa: Semoa (“Service Mobile for Africa”) is a Togolese startup that has designed a payment solution adapted to the needs of sub-Saharan Africa. It is now planning to expand its R&D work in Nantes (Pays de la Loire region) to produce a hardware unit and software module in a project that will create 13 jobs over three years, half of them in R&D.
Zabbaan: This Malian startup has developed a range of drinks containing African-sourced organic ingredients. The company’s young CEO decided to set up an international sales subsidiary in Paris (Ile de France region) which is set to recruit around 15 people within the next three years. The CEO is also going to create a small R&D center employing three people in Amiens (Hauts de France).
Yewou: This Senegalese FinTech startup has developed a mobile application and web-based intermediation service specializing in
Parent company Main business sector Workforce in France
ECOBANK INTERNATIONAL (Togo) Financial services, banking and insurance 80-100
SIFCA (SIPH) (Ivory Coast) Agri-food, agriculture 20-50
MIABOX (Ivory Coast) Software and IT services 20-50
YEWOU (Senegal)Software and IT services Financial services, banking and insurance
20-50
ZABBAAN (Mali) Agri-food, agriculture 10-20
TOP 5 WEST/CENTRAL AFRICAN COMPANIES BY EMPLOYMENT IN FRANCE
FLOW
8projects (Business France)
101jobs (Business France)
STOCK
More than 70
companies in France (Orbis)
More than500
employees (Orbis)
€531 million
FDI stock in France1
(Banque de France)
€5.4 billion
French exports (French Customs Authorities)
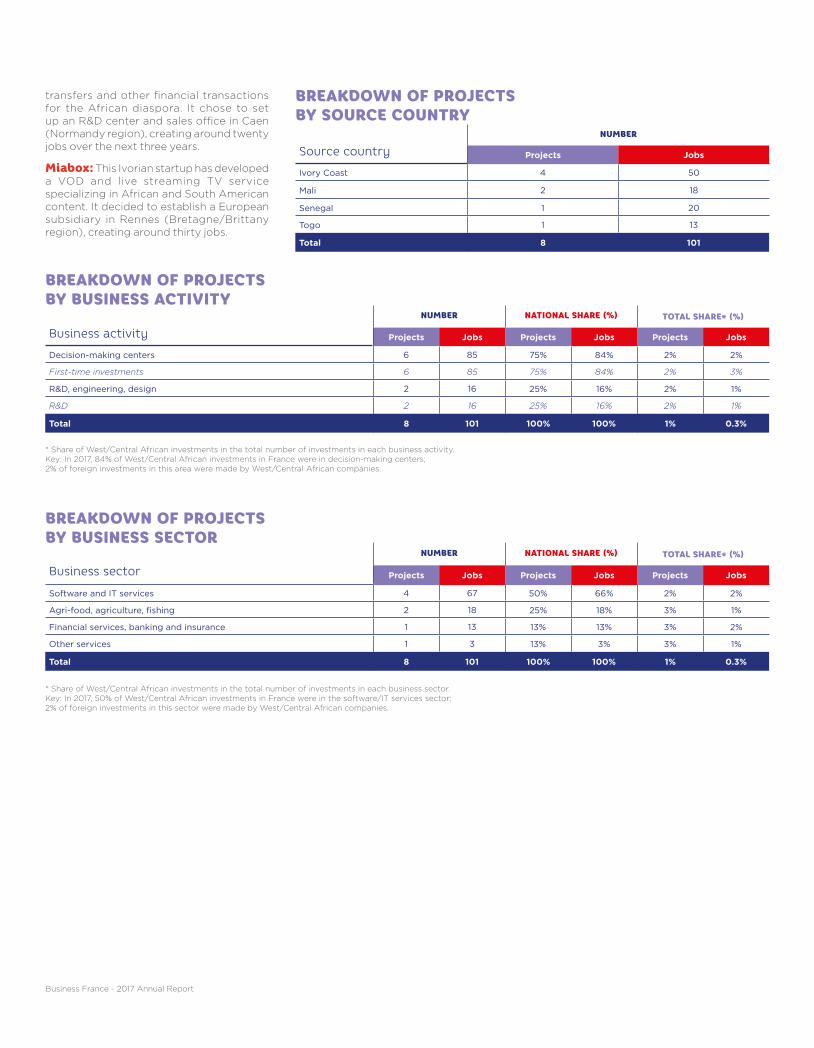
NUMBER NATIONAL SHARE (%) TOTAL SHARE* (%)
Business activity Projects Jobs Projects Jobs Projects Jobs
Decision-making centers 6 85 75% 84% 2% 2%
First-time investments 6 85 75% 84% 2% 3%
R&D, engineering, design 2 16 25% 16% 2% 1%
R&D 2 16 25% 16% 2% 1%
Total 8 101 100% 100% 1% 0.3%
NUMBER
Source country Projects Jobs
Ivory Coast 4 50
Mali 2 18
Senegal 1 20
Togo 1 13
Total 8 101
* Share of West/Central African investments in the total number of investments in each business activity.Key: In 2017, 84% of West/Central African investments in France were in decision-making centers; 2% of foreign investments in this area were made by West/Central African companies.
* Share of West/Central African investments in the total number of investments in each business sector.Key: In 2017, 50% of West/Central African investments in France were in the software/IT services sector; 2% of foreign investments in this sector were made by West/Central African companies.
NUMBER NATIONAL SHARE (%) TOTAL SHARE* (%)
Business sector Projects Jobs Projects Jobs Projects Jobs
Software and IT services 4 67 50% 66% 2% 2%
Agri-food, agriculture, fishing 2 18 25% 18% 3% 1%
Financial services, banking and insurance 1 13 13% 13% 3% 2%
Other services 1 3 13% 3% 3% 1%
Total 8 101 100% 100% 1% 0.3%
BREAKDOWN OF PROJECTS BY BUSINESS ACTIVITY
BREAKDOWN OF PROJECTS BY SOURCE COUNTRY
BREAKDOWN OF PROJECTS BY BUSINESS SECTOR
transfers and other financial transactions for the African diaspora. It chose to set up an R&D center and sales office in Caen (Normandy region), creating around twenty jobs over the next three years.
Miabox: This Ivorian startup has developed a VOD and live streaming TV service specializing in African and South American content. It decided to establish a European subsidiary in Rennes (Bretagne/Brittany region), creating around thirty jobs.
Business France - 2017 Annual Report

1 FDI stock in France (immediate investor) as of December 31, 2016. FDI stock by ultimate investor as of December 31, 2015 was €6 billion.2 ASEAN member countries: Burma, Brunei, Cambodia, Indonesia, Laos, Malaysia, Philippines, Singapore, Thailand, Vietnam.3 Business France Europe Observatory.
Thirteen investment decisions were recorded in France from ASEAN member countries2 and New Zealand in 2017, creating or maintaining 360 jobs.
ASEAN+NZ COMPANIES IN FRANCE
There are around 150 companies from ASEAN member countries and New Zealand operating in France, where they employ more than 3,900 people.
Thirteen investments from Singapore, Thailand and New Zealand were confirmed in 2017, creating or maintaining 360 jobs.
Investments from ASEAN member countries and New Zealand in 2017 involved decision-making centers (7 projects), R&D activities (3 projects) and production/manufacturing operations (2 projects and 67% of jobs generated).
Sector-wise, investments were made primarily in software/IT services (23%), with nearly two-thirds of jobs recorded being saved through a chemicals/plastics sector project by Indorama (Thailand) in the Grand Est region, while others were mostly located in Ile de France (Paris region) (46%) and Provence-Alpes-Côte d’Azur (23%).
ASEAN+NZ INVESTMENTS IN EUROPE
In 2017, the United Kingdom was the leading European recipient of job-creating investment from ASEAN member countries and New Zealand, attracting 27% of ASEAN+NZ projects in Europe, followed by the Netherlands (18%) and Ireland (14%).3
SELECTED INVESTMENT PROJECTS IN 2017
H3 Dynamics: This Singapore-based group specializes in telerobotics and hydrogen cells. H3 Dynamics decided to set up its European headquarters in Paris, together with an R&D center to develop a data analysis platform, creating 35 jobs, including around twenty in R&D.
Upskills: Based in Singapore, Upskills offers expert software consultancy services for the financial sector. In 2017, it decided to open a global R&D center in France, while maintaining its headquarters in Asia. The project is expected to create around thirty jobs, mainly in R&D.
Indorama Ventures: This leading Thai petrochemical leading producer acquired Durafiber Technologies, a producer of durable technical textiles for industrial applications and tire reinforcement. The acquisition of the site in Longlaville (Grand Est region) saved 224 jobs through an immediate €20 million investment plan to make the plant Industry 4.0 ready.
Parent company Main business sector Workforce in France
DORCHESTER COLLECTION (BIA) (PLAZA ATHENEE) (Brunei)
Hospitality, tourism and restaurants 900-1,000
CAPITALAND LTD. (CITADINES) (Singapore) Other services 600-700
PTT GLOBAL CHEMICAL (VENCOREX) (Thailand) Chemicals, plastics 600-700
SINAR MAS GROUP (Indonesia) Glass, ceramics, minerals, wood, paper 600-700
THAI UNION GROUP (Thailand) Agri-food, agriculture, fishing 600-700
TOP 5 ASEAN+NZ COMPANIES BY EMPLOYMENT IN FRANCE
ASEAN+NZ
INVEST
FLOW
13projects (Business France)
360jobs (Business France)
STOCK
150
companies in France (Orbis)
3,900employees (Orbis)
€3.9 billion
FDI stock in France1
(Banque de France)
€16.6 billion
French exports (French Customs Authorities)
63 companies in the Forbes 2000
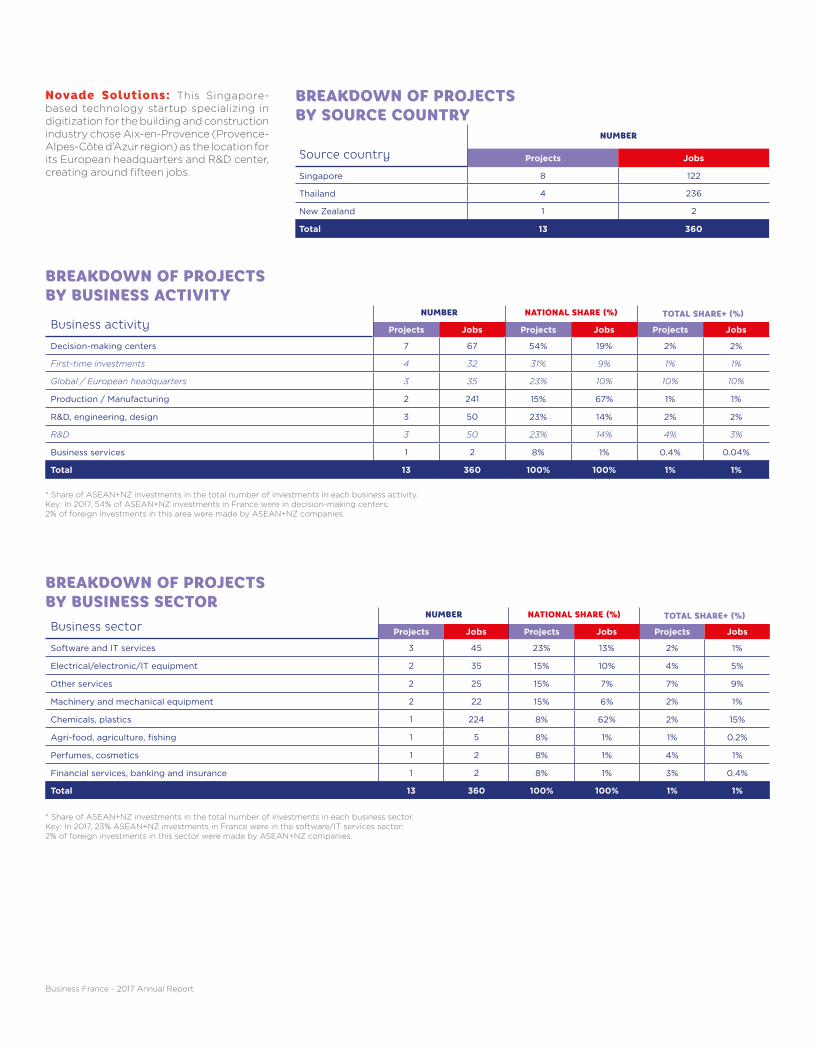
NUMBER
Source country Projects Jobs
Singapore 8 122
Thailand 4 236
New Zealand 1 2
Total 13 360
* Share of ASEAN+NZ investments in the total number of investments in each business activity.Key: In 2017, 54% of ASEAN+NZ investments in France were in decision-making centers; 2% of foreign investments in this area were made by ASEAN+NZ companies.
* Share of ASEAN+NZ investments in the total number of investments in each business sector.Key: In 2017, 23% ASEAN+NZ investments in France were in the software/IT services sector; 2% of foreign investments in this sector were made by ASEAN+NZ companies.
BREAKDOWN OF PROJECTSBY BUSINESS ACTIVITY
BREAKDOWN OF PROJECTS BY SOURCE COUNTRY
BREAKDOWN OF PROJECTS BY BUSINESS SECTOR
Novade Solutions: This Singapore-based technology startup specializing in digitization for the building and construction industry chose Aix-en-Provence (Provence-Alpes-Côte d’Azur region) as the location for its European headquarters and R&D center, creating around fifteen jobs.
Business activityNUMBER NATIONAL SHARE (%) TOTAL SHARE* (%)
Projects Jobs Projects Jobs Projects Jobs
Decision-making centers 7 67 54% 19% 2% 2%
First-time investments 4 32 31% 9% 1% 1%
Global / European headquarters 3 35 23% 10% 10% 10%
Production / Manufacturing 2 241 15% 67% 1% 1%
R&D, engineering, design 3 50 23% 14% 2% 2%
R&D 3 50 23% 14% 4% 3%
Business services 1 2 8% 1% 0.4% 0.04%
Total 13 360 100% 100% 1% 1%
Business sectorNUMBER NATIONAL SHARE (%) TOTAL SHARE* (%)
Projects Jobs Projects Jobs Projects Jobs
Software and IT services 3 45 23% 13% 2% 1%
Electrical/electronic/IT equipment 2 35 15% 10% 4% 5%
Other services 2 25 15% 7% 7% 9%
Machinery and mechanical equipment 2 22 15% 6% 2% 1%
Chemicals, plastics 1 224 8% 62% 2% 15%
Agri-food, agriculture, fishing 1 5 8% 1% 1% 0.2%
Perfumes, cosmetics 1 2 8% 1% 4% 1%
Financial services, banking and insurance 1 2 8% 1% 3% 0.4%
Total 13 360 100% 100% 1% 1%
Business France - 2017 Annual Report

AUSTRALIA
INVEST
1 FDI stock in France (immediate investor) as of December 31, 2016. FDI stock by ultimate investor as of December 31, 2015 was €3.7 billion.2 Business France Europe Observatory.
Seven Australian investments were recorded in France in 2017, creating or maintaining 62 jobs.
AUSTRALIAN COMPANIES IN FRANCE
There are around 300 Australian companies operating in France, where they employ 40,000 people.
Seven Australian investments were recorded in France in 2017, creating or maintaining 62 jobs.
These investment decisions mainly involved decision-making centers (4 projects) and R&D activities (2 projects), while sector-wise the electrical/electronic/IT equipment (2 projects) and software/IT services (2 projects) sectors both stood out.
Investments were made in several regions, particularly Occitanie (3 projects).
AUSTRALIAN INVESTMENTS IN EUROPE
In 2017, the United Kingdom was the leading European recipient of job-creating investment from Australia, attracting 39% of Australian projects in Europe, followed by Ireland (14%), and France (11%).2
SELECTED INVESTMENT PROJECTS IN 2017
AdvanceTC Limited: This smartphone and tablet designer and manufacturer decided to locate its first European decision-making center in France. Based in Paris, the new subsidiary, known as AdvanceTC Cilicon SAS, will have a workforce of around 40 people and focus on industrial design development and technological innovation.
Award Force: With offices already established in Canada and the United Kingdom, this Australian company has developed a SaaS solution for managing programs such as awards, competitions, challenges, calls for projects, etc. In 2017, it chose Lyon (Auvergne-Rhône-Alpes region) as the location for its first French decision-making center, creating around ten jobs.
Signature Orthopaedics: This Australian company, which makes medical prostheses for orthopedic and trauma surgery, decided to set up its first French office in Castres (Occitanie region). The new subsidiary will have two employees. Already present in the United States and Ireland, Signature Orthopaedics now plans to expand its European business from France.
Parent company Main business sector Workforce in France
RAMSAY HEALTH CARE LTD. Other services 22,000
AMCOR LTD.Glass, ceramics, minerals, wood, paperChemicals, plastics
300-500
DOMINO’S PIZZA ENTERPRISES Hospitality, tourism and restaurants 200-500
BRAMBLES LTD. Transport, storage 200-500
NUFARM Chemicals, plastics 100-300
TOP 5 AUSTRALIAN COMPANIES BY EMPLOYMENT IN FRANCE
FLOW
7projects (Business France)
62jobs (Business France)
STOCK
More than300
companies in France (Orbis)
More than30,000
employees (Orbis)
€1.1 billion
FDI stock in France1
24th place(Banque de France)
€2.6 billion
French exports 35th place (French Customs Authorities)
39 companies in the Forbes 2000
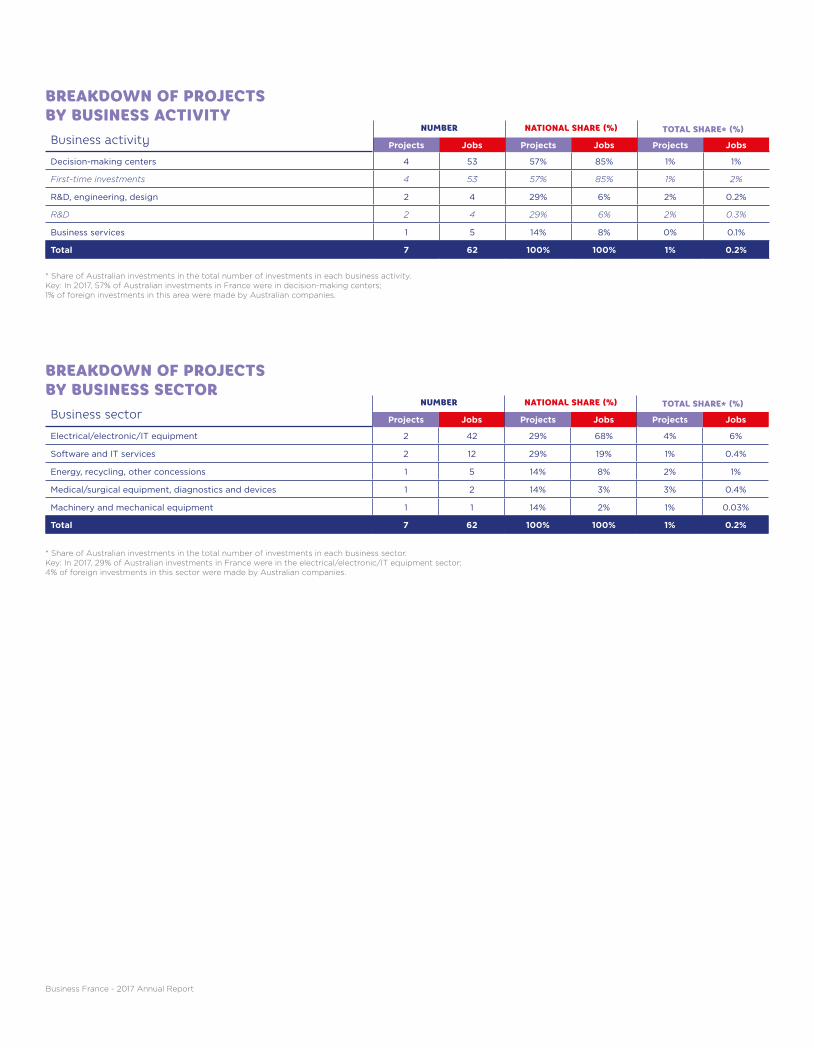
* Share of Australian investments in the total number of investments in each business activity.Key: In 2017, 57% of Australian investments in France were in decision-making centers; 1% of foreign investments in this area were made by Australian companies.
Business activityNUMBER NATIONAL SHARE (%) TOTAL SHARE* (%)
Projects Jobs Projects Jobs Projects Jobs
Decision-making centers 4 53 57% 85% 1% 1%
First-time investments 4 53 57% 85% 1% 2%
R&D, engineering, design 2 4 29% 6% 2% 0.2%
R&D 2 4 29% 6% 2% 0.3%
Business services 1 5 14% 8% 0% 0.1%
Total 7 62 100% 100% 1% 0.2%
* Share of Australian investments in the total number of investments in each business sector.Key: In 2017, 29% of Australian investments in France were in the electrical/electronic/IT equipment sector; 4% of foreign investments in this sector were made by Australian companies.
BREAKDOWN OF PROJECTS BY BUSINESS ACTIVITY
Business sectorNUMBER NATIONAL SHARE (%) TOTAL SHARE* (%)
Projects Jobs Projects Jobs Projects Jobs
Electrical/electronic/IT equipment 2 42 29% 68% 4% 6%
Software and IT services 2 12 29% 19% 1% 0.4%
Energy, recycling, other concessions 1 5 14% 8% 2% 1%
Medical/surgical equipment, diagnostics and devices 1 2 14% 3% 3% 0.4%
Machinery and mechanical equipment 1 1 14% 2% 1% 0.03%
Total 7 62 100% 100% 1% 0.2%
BREAKDOWN OF PROJECTS BY BUSINESS SECTOR
Business France - 2017 Annual Report

1 FDI stock in France (immediate investor) as of December 31, 2016. FDI stock by ultimate investor as of December 31, 2015 was €1.7 billion.2 Business France Europe Observatory.
Twenty Austrian investments were recorded in France in 2017, creating or maintaining 508 jobs (+64%).
AUSTRIAN COMPANIES IN FRANCE
There are around 250 Austrian companies operating in France, where they employ more than 11,100 people.
Twenty investments from Austria were recorded in 2017, creating or maintaining 508 jobs.
Austrian companies invested primarily in production/manufacturing (55% of projects; 82% of jobs) and business services (25% of projects).
Sector-wise, Austrian investments were concentrated in glass/ceramics/minerals/wood/paper (20% of projects; 61% of jobs), machinery/mechanical equipment (20% of projects) and the automotive industry (20%).
These investments were most often located in Ile de France (Paris region) (30% of projects), followed by Hauts de France (20% of projects; 50% of jobs) and Auvergne-Rhône-Alpes (20% of projects).
AUSTRIAN INVESTMENTS IN EUROPE
In 2017, Austrian investments in Europe mostly went to Germany (31%) and Hungary (14%). The Czech Republic and Poland each attracted 7%, while France received 6%, as did the United Kingdom, Slovenia and Romania.2
SELECTED INVESTMENT PROJECTS IN 2017
Fritz Egger: This family-run group operating in the timber industry makes and markets wood-derivative products for furniture and interior fittings. It has two production facilities in France, one in Rambervillers in the Vosges (Grand Est region) and the other in Rion-des-Landes (Aquitaine region). To maintain its position in France, it decided to increase investment in its two plants and hire around fifty new employees.
AVL List: AVL List is the world’s leading producer of development and test solutions for the powertrain systems of internal combustion, hybrid and electric engines, including test benches for batteries and fuel cells. The group has recorded excellent growth in France over the last few years and decided to increase its workforce in 2017, creating around twenty jobs in the Paris region.
Parent company Main business sector Workforce in France
BOREALIS AG Chemicals, plastics 900
WIENERBERGER AG Construction, building materials 800-900
FRITZ EGGER GMBH & CO. Glass, ceramics, minerals, wood, paper 800-900
MAGNA EUROPE AG Automotive industry 700
ANDRITZ AG Machinery and mechanical equipment 600-700
TOP 5 AUSTRIAN COMPANIES BY EMPLOYMENT IN FRANCE
AUSTRIA
INVEST
FLOW
20projects (Business France)
508jobs (Business France)
STOCK
250
companies in France (Eurostat)
More than11,100
employees (Eurostat)
€3.1 billion
FDI stock in France1
18th place (Banque de France)
€3.9 billion
French exports 25th place (French Customs Authorities)
8 companies in the Forbes 2000
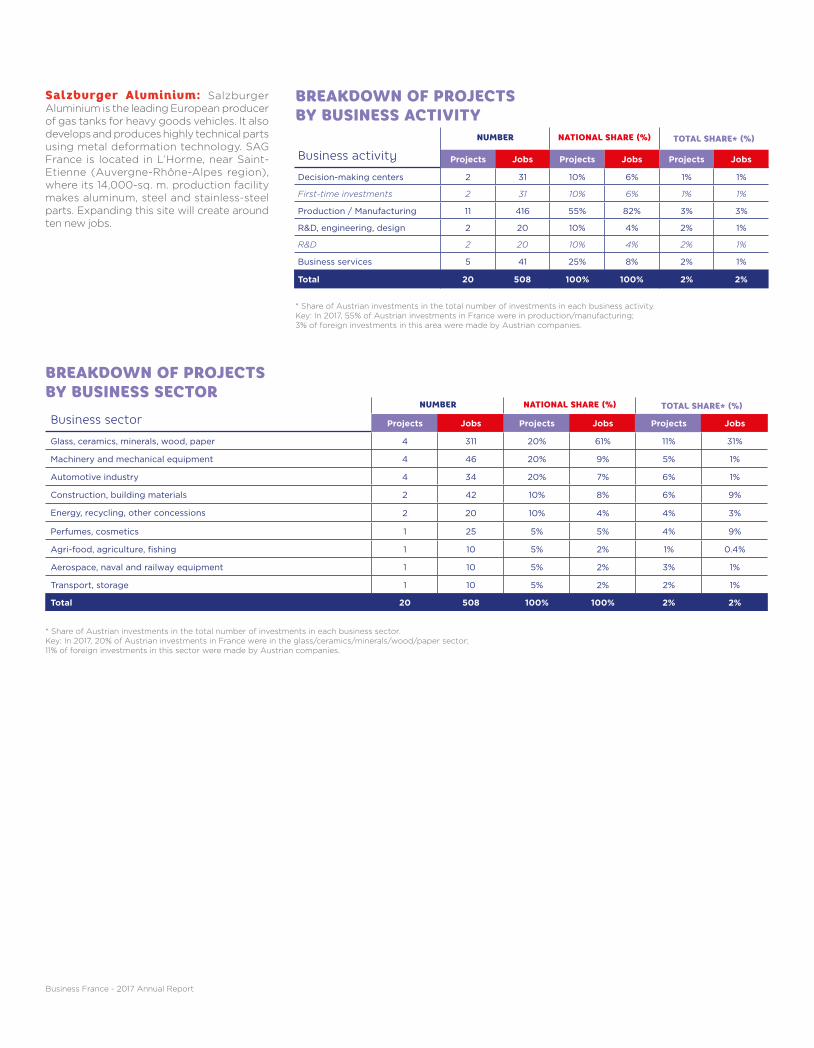
NUMBER NATIONAL SHARE (%) TOTAL SHARE* (%)
Business activity Projects Jobs Projects Jobs Projects Jobs
Decision-making centers 2 31 10% 6% 1% 1%
First-time investments 2 31 10% 6% 1% 1%
Production / Manufacturing 11 416 55% 82% 3% 3%
R&D, engineering, design 2 20 10% 4% 2% 1%
R&D 2 20 10% 4% 2% 1%
Business services 5 41 25% 8% 2% 1%
Total 20 508 100% 100% 2% 2%
* Share of Austrian investments in the total number of investments in each business activity.Key: In 2017, 55% of Austrian investments in France were in production/manufacturing; 3% of foreign investments in this area were made by Austrian companies.
* Share of Austrian investments in the total number of investments in each business sector.Key: In 2017, 20% of Austrian investments in France were in the glass/ceramics/minerals/wood/paper sector; 11% of foreign investments in this sector were made by Austrian companies.
BREAKDOWN OF PROJECTS BY BUSINESS ACTIVITY
BREAKDOWN OF PROJECTS BY BUSINESS SECTOR
Salzburger Aluminium: Salzburger Aluminium is the leading European producer of gas tanks for heavy goods vehicles. It also develops and produces highly technical parts using metal deformation technology. SAG France is located in L’Horme, near Saint-Etienne (Auvergne-Rhône-Alpes region), where its 14,000-sq. m. production facility makes aluminum, steel and stainless-steel parts. Expanding this site will create around ten new jobs.
Business sectorNUMBER NATIONAL SHARE (%) TOTAL SHARE* (%)
Projects Jobs Projects Jobs Projects Jobs
Glass, ceramics, minerals, wood, paper 4 311 20% 61% 11% 31%
Machinery and mechanical equipment 4 46 20% 9% 5% 1%
Automotive industry 4 34 20% 7% 6% 1%
Construction, building materials 2 42 10% 8% 6% 9%
Energy, recycling, other concessions 2 20 10% 4% 4% 3%
Perfumes, cosmetics 1 25 5% 5% 4% 9%
Agri-food, agriculture, fishing 1 10 5% 2% 1% 0.4%
Aerospace, naval and railway equipment 1 10 5% 2% 3% 1%
Transport, storage 1 10 5% 2% 2% 1%
Total 20 508 100% 100% 2% 2%
Business France - 2017 Annual Report
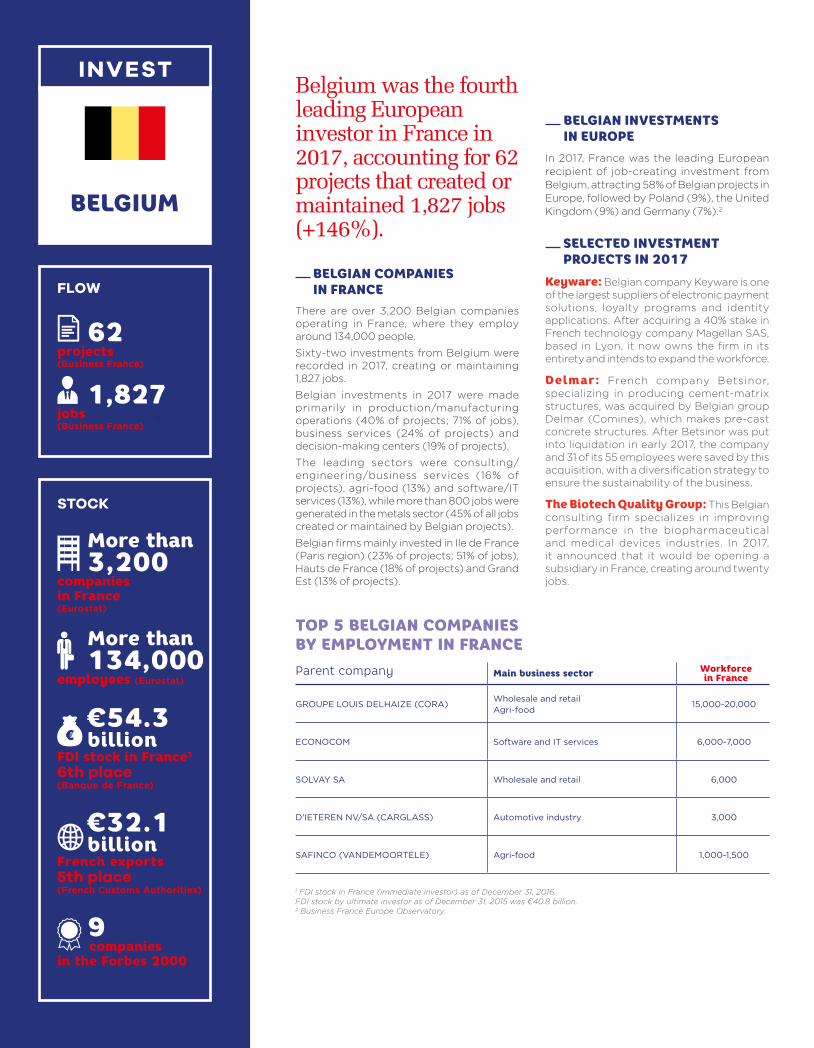
1 FDI stock in France (immediate investor) as of December 31, 2016. FDI stock by ultimate investor as of December 31, 2015 was €40.8 billion.2 Business France Europe Observatory.
Belgium was the fourth leading European investor in France in 2017, accounting for 62 projects that created or maintained 1,827 jobs (+146%).
BELGIAN COMPANIES IN FRANCE
There are over 3,200 Belgian companies operating in France, where they employ around 134,000 people.
Sixty-two investments from Belgium were recorded in 2017, creating or maintaining 1,827 jobs.
Belgian investments in 2017 were made primarily in production/manufacturing operations (40% of projects; 71% of jobs), business services (24% of projects) and decision-making centers (19% of projects).
The leading sectors were consulting/engineering/business services (16% of projects), agri-food (13%) and software/IT services (13%), while more than 800 jobs were generated in the metals sector (45% of all jobs created or maintained by Belgian projects).
Belgian firms mainly invested in Ile de France (Paris region) (23% of projects; 51% of jobs), Hauts de France (18% of projects) and Grand Est (13% of projects).
BELGIAN INVESTMENTS IN EUROPE
In 2017, France was the leading European recipient of job-creating investment from Belgium, attracting 58% of Belgian projects in Europe, followed by Poland (9%), the United Kingdom (9%) and Germany (7%).2
SELECTED INVESTMENT PROJECTS IN 2017
Keyware: Belgian company Keyware is one of the largest suppliers of electronic payment solutions, loyalty programs and identity applications. After acquiring a 40% stake in French technology company Magellan SAS, based in Lyon, it now owns the firm in its entirety and intends to expand the workforce.
Delmar: French company Betsinor, specializing in producing cement-matrix structures, was acquired by Belgian group Delmar (Comines), which makes pre-cast concrete structures. After Betsinor was put into liquidation in early 2017, the company and 31 of its 55 employees were saved by this acquisition, with a diversification strategy to ensure the sustainability of the business.
The Biotech Quality Group: This Belgian consulting firm specializes in improving performance in the biopharmaceutical and medical devices industries. In 2017, it announced that it would be opening a subsidiary in France, creating around twenty jobs.
Parent company Main business sector Workforce in France
GROUPE LOUIS DELHAIZE (CORA)Wholesale and retailAgri-food
15,000-20,000
ECONOCOM Software and IT services 6,000-7,000
SOLVAY SA Wholesale and retail 6,000
D'IETEREN NV/SA (CARGLASS) Automotive industry 3,000
SAFINCO (VANDEMOORTELE) Agri-food 1,000-1,500
TOP 5 BELGIAN COMPANIES BY EMPLOYMENT IN FRANCE
BELGIUM
INVEST
FLOW
62projects (Business France)
1,827jobs (Business France)
STOCK
More than3,200
companies in France (Eurostat)
More than134,000
employees (Eurostat)
€54.3 billion
FDI stock in France1
6th place (Banque de France)
€32.1 billion
French exports5th place (French Customs Authorities)
9 companies in the Forbes 2000
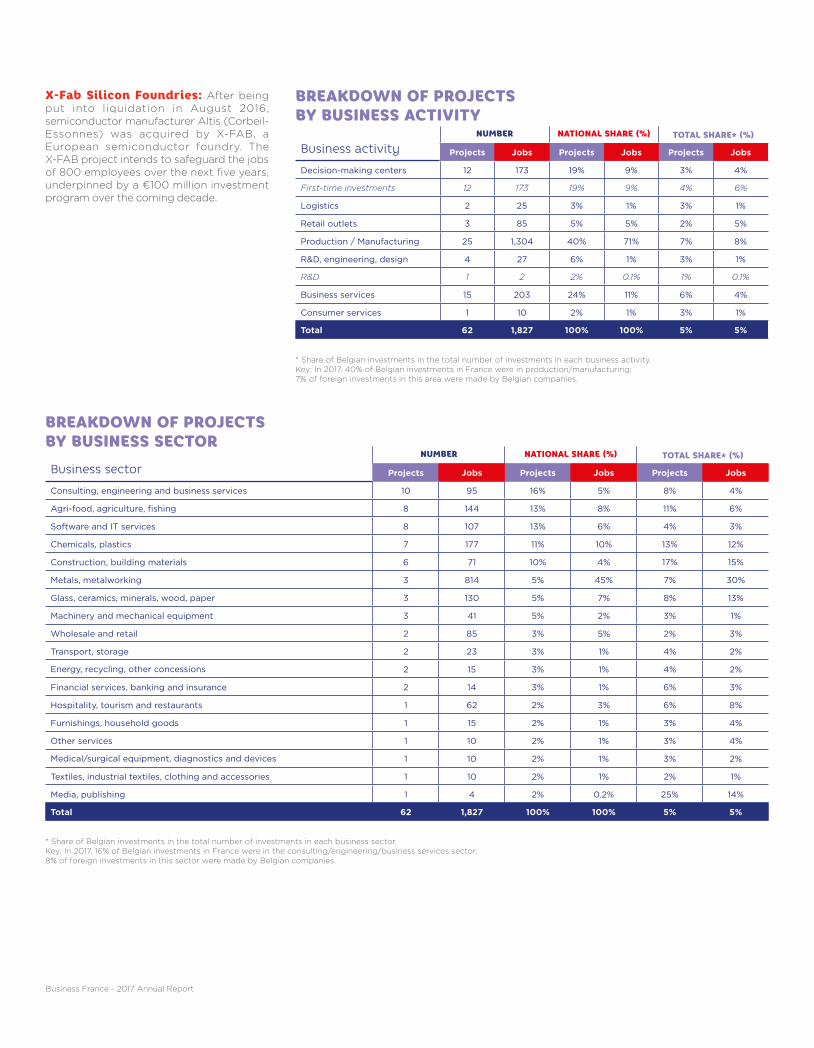
* Share of Belgian investments in the total number of investments in each business activity.Key: In 2017, 40% of Belgian investments in France were in production/manufacturing; 7% of foreign investments in this area were made by Belgian companies.
* Share of Belgian investments in the total number of investments in each business sector.Key: In 2017, 16% of Belgian investments in France were in the consulting/engineering/business services sector; 8% of foreign investments in this sector were made by Belgian companies.
BREAKDOWN OF PROJECTS BY BUSINESS ACTIVITY
BREAKDOWN OF PROJECTS BY BUSINESS SECTOR
X-Fab Silicon Foundries: After being put into liquidation in August 2016, semiconductor manufacturer Altis (Corbeil-Essonnes) was acquired by X-FAB, a European semiconductor foundry. The X-FAB project intends to safeguard the jobs of 800 employees over the next five years, underpinned by a €100 million investment program over the coming decade.
Business activityNUMBER NATIONAL SHARE (%) TOTAL SHARE* (%)
Projects Jobs Projects Jobs Projects Jobs
Decision-making centers 12 173 19% 9% 3% 4%
First-time investments 12 173 19% 9% 4% 6%
Logistics 2 25 3% 1% 3% 1%
Retail outlets 3 85 5% 5% 2% 5%
Production / Manufacturing 25 1,304 40% 71% 7% 8%
R&D, engineering, design 4 27 6% 1% 3% 1%
R&D 1 2 2% 0.1% 1% 0.1%
Business services 15 203 24% 11% 6% 4%
Consumer services 1 10 2% 1% 3% 1%
Total 62 1,827 100% 100% 5% 5%
Business sectorNUMBER NATIONAL SHARE (%) TOTAL SHARE* (%)
Projects Jobs Projects Jobs Projects Jobs
Consulting, engineering and business services 10 95 16% 5% 8% 4%
Agri-food, agriculture, fishing 8 144 13% 8% 11% 6%
Software and IT services 8 107 13% 6% 4% 3%
Chemicals, plastics 7 177 11% 10% 13% 12%
Construction, building materials 6 71 10% 4% 17% 15%
Metals, metalworking 3 814 5% 45% 7% 30%
Glass, ceramics, minerals, wood, paper 3 130 5% 7% 8% 13%
Machinery and mechanical equipment 3 41 5% 2% 3% 1%
Wholesale and retail 2 85 3% 5% 2% 3%
Transport, storage 2 23 3% 1% 4% 2%
Energy, recycling, other concessions 2 15 3% 1% 4% 2%
Financial services, banking and insurance 2 14 3% 1% 6% 3%
Hospitality, tourism and restaurants 1 62 2% 3% 6% 8%
Furnishings, household goods 1 15 2% 1% 3% 4%
Other services 1 10 2% 1% 3% 4%
Medical/surgical equipment, diagnostics and devices 1 10 2% 1% 3% 2%
Textiles, industrial textiles, clothing and accessories 1 10 2% 1% 2% 1%
Media, publishing 1 4 2% 0.2% 25% 14%
Total 62 1,827 100% 100% 5% 5%
Business France - 2017 Annual Report

CANADA
INVEST
* Investment funds.1 FDI stock in France (immediate investor) as of December 31, 2016. FDI stock by ultimate investor as of December 31, 2015 was €5.6 billion.
2 Business France Europe Observatory.
Canadian investments in France were up 23% in 2017, taking in sectors including the digital economy, consulting/engineering/business services, renewable energy, and industry.
CANADIAN COMPANIES IN FRANCE
There are around 200 Canadian firms operating in France, where they employ more than 28,000 people. In 2017, there were 56 investments from Canada, up 23% year-on-year, creating or maintaining 1,616 jobs.
Investments in business services accounted for one-third of all Canadian projects in France, while another 29% were in decision-making centers, of which 75% were first-time investments in the country. A further 20% were in R&D, and another 16% in production/manufacturing.
Sector-wise, software and IT services and consulting/engineering/business services led the way, each accounting for 20% of Canadian projects in France, with a fairly even split in Canadian investment between the manufacturing and services sectors (52% and 48%, respectively).
Auvergne-Rhône-Alpes (23%) and Ile de France (Paris region) (21%) were the main recipients of Canadian investments, followed by Occitanie and Grand Est (11% each).
CANADIAN INVESTMENTS IN EUROPE
In 2017, France was the leading European recipient of job-creating investment from Canada, attracting 29% of Canadian projects in Europe, ahead of the United Kingdom (25%) and Germany (12%).2
SELECTED INVESTMENT PROJECTS IN 2017
CGI (Montréal, Québec): This leading IT and business process services firm, and Canada’s leading investor in France, hired more than 1,000 people across the country in 2017. It also chose Lyon (Auvergne-Rhône-Alpes region) as the location for a global center of excellence for supply chain digitization.
Enbridge (Calgary, Alberta): Enbridge operates oil and gas pipelines and also produces wind energy. In 2017, it agreed to a €191 million investment with EDF Énergies Nouvelles to develop three wind farms in Seine-Maritime, Loire-Atlantique and Calvados (Normandy region). A dedicated project management team will be based in Paris’ La Défense business district.
Premier Tech (Rivière du Loup, Québec): Premier Tech specializes in on-site wastewater treatment, products for the horticulture and agriculture industries, and food packaging equipment, employing 4,100 people around the world, including 350 in France. In 2017, its Water/Environment division announced the creation of 40 jobs in the Auvergne-Rhône-Alpes and Pays de la Loire regions.
Parent company Main business sector Workforce in France
CGI Software and IT services 11,000
ONTARIO TEACHERS PENSION PLAN* Financial services 6,000
POWER CORP – DESMARAIS (SAGARD)* Financial services 2,000
BOMBARDIER INC. Aerospace, naval and railway equipment 1,600
LINAMAR CORPORATION Metals, metalworking 1,400
MCCAIN FOODS GROUP INC. Agri-food, agriculture, fishing 1,100
TOP 6 CANADIAN COMPANIES BY EMPLOYMENT IN FRANCE
FLOW
56projects (Business France)
1,616jobs (Business France)
STOCK
More than200
companies in France (Orbis)
More than28,000
employees (Orbis)
€3.8 billion
FDI stock in France1
17th place (Banque de France)
€3.2 billion
French exports30th place (French Customs Authorities)
58 companies in the Forbes 2000
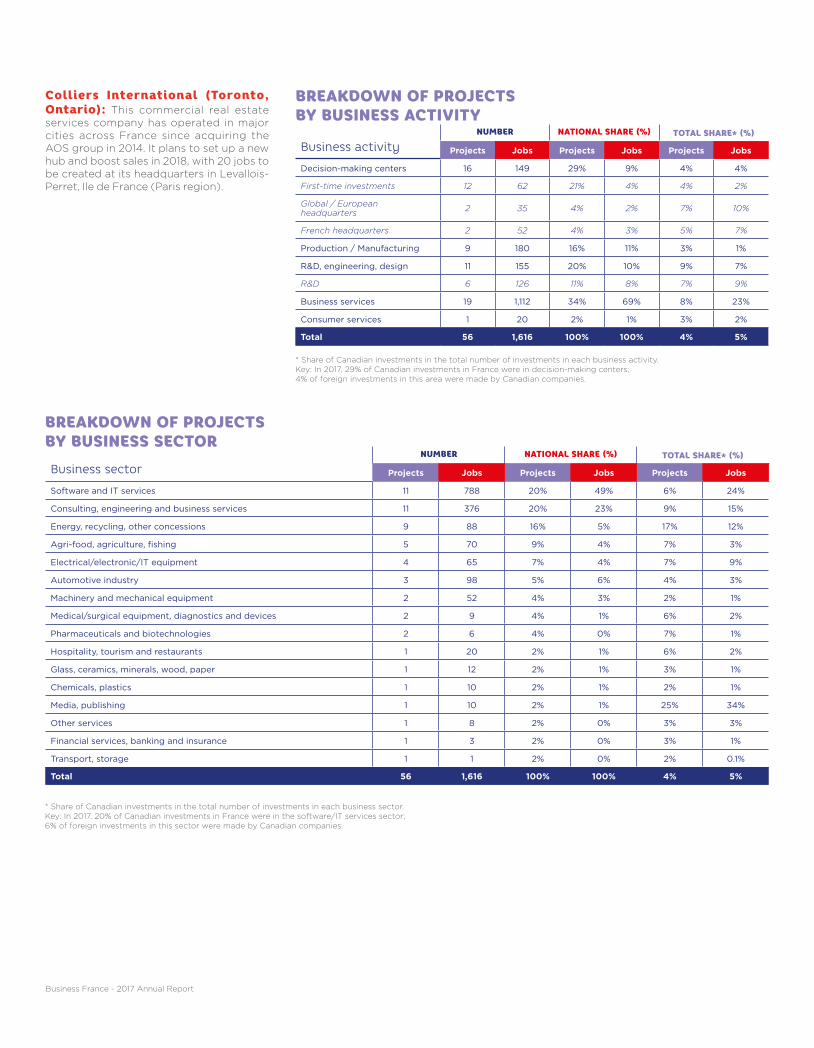
* Share of Canadian investments in the total number of investments in each business activity.Key: In 2017, 29% of Canadian investments in France were in decision-making centers; 4% of foreign investments in this area were made by Canadian companies.
BREAKDOWN OF PROJECTS BY BUSINESS ACTIVITY
Colliers International (Toronto, Ontario): This commercial real estate services company has operated in major cities across France since acquiring the AOS group in 2014. It plans to set up a new hub and boost sales in 2018, with 20 jobs to be created at its headquarters in Levallois-Perret, Ile de France (Paris region).
Business activityNUMBER NATIONAL SHARE (%) TOTAL SHARE* (%)
Projects Jobs Projects Jobs Projects Jobs
Decision-making centers 16 149 29% 9% 4% 4%
First-time investments 12 62 21% 4% 4% 2%
Global / European headquarters 2 35 4% 2% 7% 10%
French headquarters 2 52 4% 3% 5% 7%
Production / Manufacturing 9 180 16% 11% 3% 1%
R&D, engineering, design 11 155 20% 10% 9% 7%
R&D 6 126 11% 8% 7% 9%
Business services 19 1,112 34% 69% 8% 23%
Consumer services 1 20 2% 1% 3% 2%
Total 56 1,616 100% 100% 4% 5%
* Share of Canadian investments in the total number of investments in each business sector. Key: In 2017, 20% of Canadian investments in France were in the software/IT services sector; 6% of foreign investments in this sector were made by Canadian companies.
BREAKDOWN OF PROJECTS BY BUSINESS SECTOR
Business sectorNUMBER NATIONAL SHARE (%) TOTAL SHARE* (%)
Projects Jobs Projects Jobs Projects Jobs
Software and IT services 11 788 20% 49% 6% 24%
Consulting, engineering and business services 11 376 20% 23% 9% 15%
Energy, recycling, other concessions 9 88 16% 5% 17% 12%
Agri-food, agriculture, fishing 5 70 9% 4% 7% 3%
Electrical/electronic/IT equipment 4 65 7% 4% 7% 9%
Automotive industry 3 98 5% 6% 4% 3%
Machinery and mechanical equipment 2 52 4% 3% 2% 1%
Medical/surgical equipment, diagnostics and devices 2 9 4% 1% 6% 2%
Pharmaceuticals and biotechnologies 2 6 4% 0% 7% 1%
Hospitality, tourism and restaurants 1 20 2% 1% 6% 2%
Glass, ceramics, minerals, wood, paper 1 12 2% 1% 3% 1%
Chemicals, plastics 1 10 2% 1% 2% 1%
Media, publishing 1 10 2% 1% 25% 34%
Other services 1 8 2% 0% 3% 3%
Financial services, banking and insurance 1 3 2% 0% 3% 1%
Transport, storage 1 1 2% 0% 2% 0.1%
Total 56 1,616 100% 100% 4% 5%
Business France - 2017 Annual Report
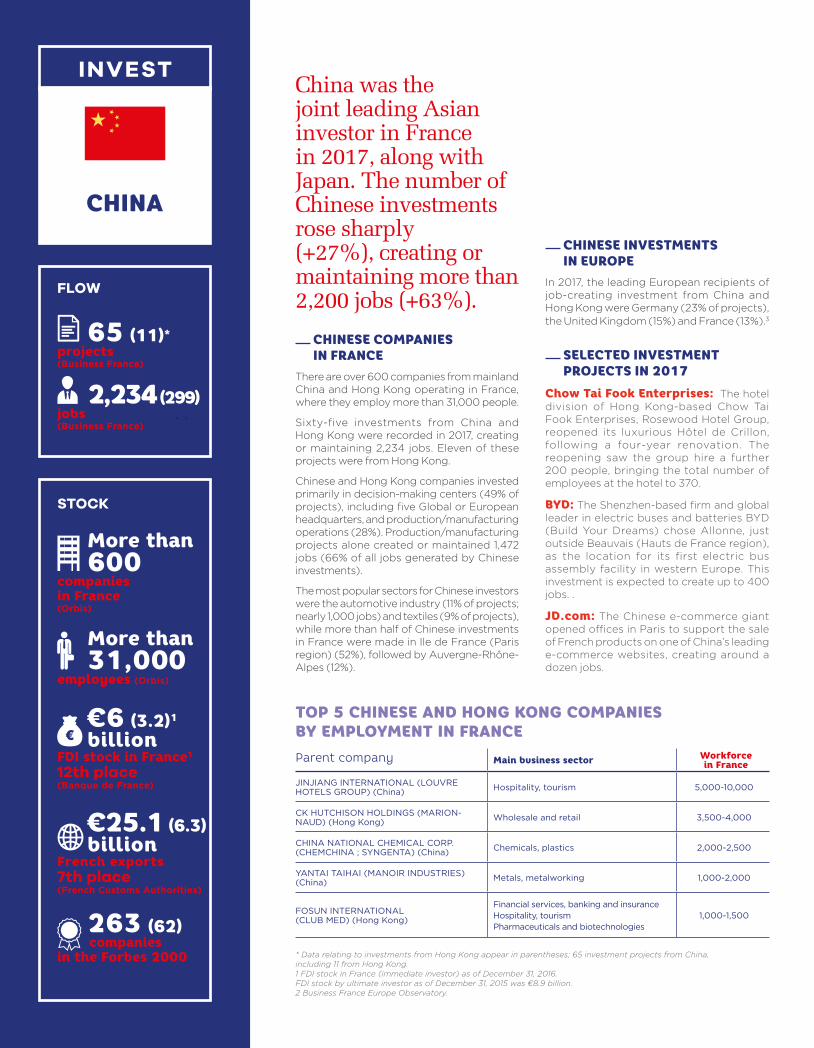
* Data relating to investments from Hong Kong appear in parentheses; 65 investment projects from China, including 11 from Hong Kong.1 FDI stock in France (immediate investor) as of December 31, 2016. FDI stock by ultimate investor as of December 31, 2015 was €8.9 billion. 2 Business France Europe Observatory.
China was the joint leading Asian investor in France in 2017, along with Japan. The number of Chinese investments rose sharply (+27%), creating or maintaining more than 2,200 jobs (+63%).
CHINESE COMPANIES IN FRANCE
There are over 600 companies from mainland China and Hong Kong operating in France, where they employ more than 31,000 people.
Sixty-five investments from China and Hong Kong were recorded in 2017, creating or maintaining 2,234 jobs. Eleven of these projects were from Hong Kong.
Chinese and Hong Kong companies invested primarily in decision-making centers (49% of projects), including five Global or European headquarters, and production/manufacturing operations (28%). Production/manufacturing projects alone created or maintained 1,472 jobs (66% of all jobs generated by Chinese investments).
The most popular sectors for Chinese investors were the automotive industry (11% of projects; nearly 1,000 jobs) and textiles (9% of projects), while more than half of Chinese investments in France were made in Ile de France (Paris region) (52%), followed by Auvergne-Rhône-Alpes (12%).
CHINESE INVESTMENTS IN EUROPE
In 2017, the leading European recipients of job-creating investment from China and Hong Kong were Germany (23% of projects), the United Kingdom (15%) and France (13%).3
SELECTED INVESTMENT PROJECTS IN 2017
Chow Tai Fook Enterprises: The hotel division of Hong Kong-based Chow Tai Fook Enterprises, Rosewood Hotel Group, reopened its luxurious Hôtel de Crillon, following a four-year renovation. The reopening saw the group hire a further 200 people, bringing the total number of employees at the hotel to 370.
BYD: The Shenzhen-based firm and global leader in electric buses and batteries BYD (Build Your Dreams) chose Allonne, just outside Beauvais (Hauts de France region), as the location for its first electric bus assembly facility in western Europe. This investment is expected to create up to 400 jobs. .
JD.com: The Chinese e-commerce giant opened offices in Paris to support the sale of French products on one of China’s leading e-commerce websites, creating around a dozen jobs.
Parent company Main business sector Workforce in France
JINJIANG INTERNATIONAL (LOUVRE HOTELS GROUP) (China) Hospitality, tourism 5,000-10,000
CK HUTCHISON HOLDINGS (MARION-NAUD) (Hong Kong) Wholesale and retail 3,500-4,000
CHINA NATIONAL CHEMICAL CORP. (CHEMCHINA ; SYNGENTA) (China) Chemicals, plastics 2,000-2,500
YANTAI TAIHAI (MANOIR INDUSTRIES) (China) Metals, metalworking 1,000-2,000
FOSUN INTERNATIONAL (CLUB MED) (Hong Kong)
Financial services, banking and insuranceHospitality, tourismPharmaceuticals and biotechnologies
1,000-1,500
TOP 5 CHINESE AND HONG KONG COMPANIES BY EMPLOYMENT IN FRANCE
CHINA
INVEST
FLOW
65 (11)*
projects (Business France)
2,234 (299)jobs (Business France)
STOCK
More than600
companies in France (Orbis)
More than31,000
employees (Orbis)
€6 (3.2)1 billion
FDI stock in France1
12th place (Banque de France)
€25.1 (6.3) billion
French exports7th place (French Customs Authorities)
263 (62) companies in the Forbes 2000
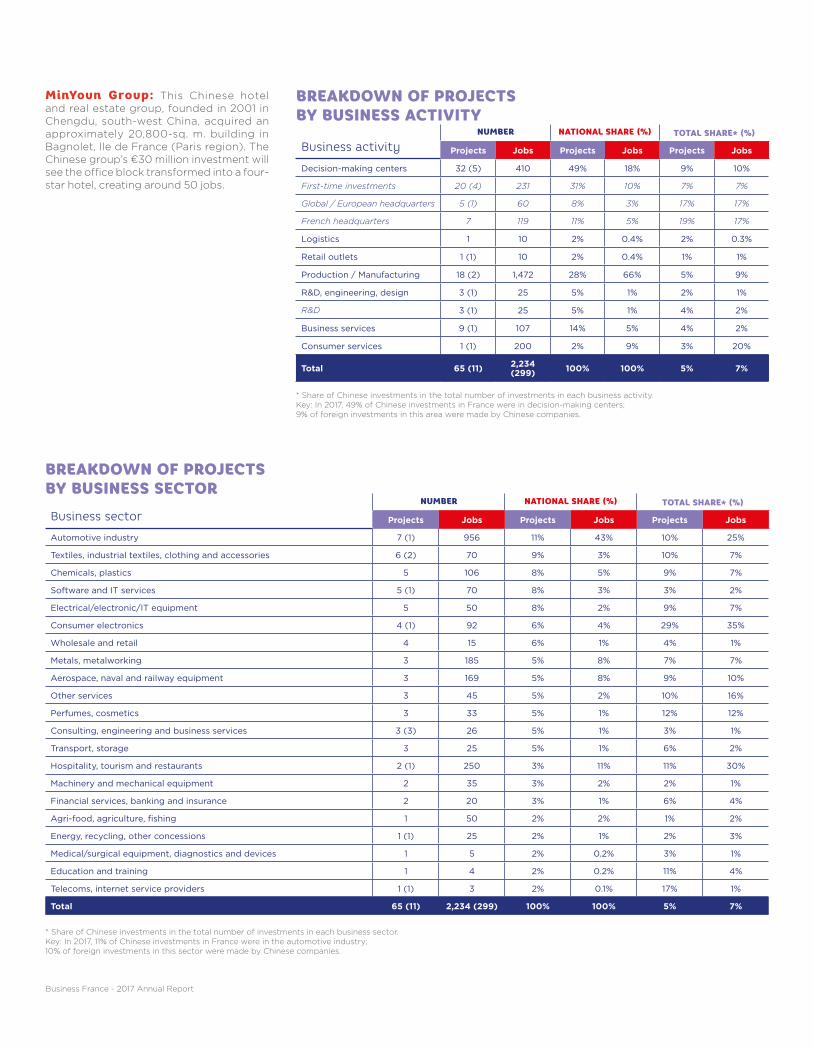
* Share of Chinese investments in the total number of investments in each business activity.Key: In 2017, 49% of Chinese investments in France were in decision-making centers; 9% of foreign investments in this area were made by Chinese companies.
Business activityNUMBER NATIONAL SHARE (%) TOTAL SHARE* (%)
Projects Jobs Projects Jobs Projects Jobs
Decision-making centers 32 (5) 410 49% 18% 9% 10%
First-time investments 20 (4) 231 31% 10% 7% 7%
Global / European headquarters 5 (1) 60 8% 3% 17% 17%
French headquarters 7 119 11% 5% 19% 17%
Logistics 1 10 2% 0.4% 2% 0.3%
Retail outlets 1 (1) 10 2% 0.4% 1% 1%
Production / Manufacturing 18 (2) 1,472 28% 66% 5% 9%
R&D, engineering, design 3 (1) 25 5% 1% 2% 1%
R&D 3 (1) 25 5% 1% 4% 2%
Business services 9 (1) 107 14% 5% 4% 2%
Consumer services 1 (1) 200 2% 9% 3% 20%
Total 65 (11) 2,234 (299) 100% 100% 5% 7%
* Share of Chinese investments in the total number of investments in each business sector.Key: In 2017, 11% of Chinese investments in France were in the automotive industry; 10% of foreign investments in this sector were made by Chinese companies.
BREAKDOWN OF PROJECTS BY BUSINESS ACTIVITY
Business sectorNUMBER NATIONAL SHARE (%) TOTAL SHARE* (%)
Projects Jobs Projects Jobs Projects Jobs
Automotive industry 7 (1) 956 11% 43% 10% 25%
Textiles, industrial textiles, clothing and accessories 6 (2) 70 9% 3% 10% 7%
Chemicals, plastics 5 106 8% 5% 9% 7%
Software and IT services 5 (1) 70 8% 3% 3% 2%
Electrical/electronic/IT equipment 5 50 8% 2% 9% 7%
Consumer electronics 4 (1) 92 6% 4% 29% 35%
Wholesale and retail 4 15 6% 1% 4% 1%
Metals, metalworking 3 185 5% 8% 7% 7%
Aerospace, naval and railway equipment 3 169 5% 8% 9% 10%
Other services 3 45 5% 2% 10% 16%
Perfumes, cosmetics 3 33 5% 1% 12% 12%
Consulting, engineering and business services 3 (3) 26 5% 1% 3% 1%
Transport, storage 3 25 5% 1% 6% 2%
Hospitality, tourism and restaurants 2 (1) 250 3% 11% 11% 30%
Machinery and mechanical equipment 2 35 3% 2% 2% 1%
Financial services, banking and insurance 2 20 3% 1% 6% 4%
Agri-food, agriculture, fishing 1 50 2% 2% 1% 2%
Energy, recycling, other concessions 1 (1) 25 2% 1% 2% 3%
Medical/surgical equipment, diagnostics and devices 1 5 2% 0.2% 3% 1%
Education and training 1 4 2% 0.2% 11% 4%
Telecoms, internet service providers 1 (1) 3 2% 0.1% 17% 1%
Total 65 (11) 2,234 (299) 100% 100% 5% 7%
BREAKDOWN OF PROJECTS BY BUSINESS SECTOR
MinYoun Group: This Chinese hotel and real estate group, founded in 2001 in Chengdu, south-west China, acquired an approximately 20,800-sq. m. building in Bagnolet, Ile de France (Paris region). The Chinese group’s €30 million investment will see the office block transformed into a four-star hotel, creating around 50 jobs.
Business France - 2017 Annual Report

SOUTH KOREAN COMPANIES IN FRANCE
There are 45 South Korean companies operating in France, where they employ around 4,800 people.
Four investments from South Korea created 63 jobs in France in 2017. They involved three first-time investments in the country and a business services project.
Half of these South Korean investments were made in healthcare sectors, with the rest in services sectors, while location-wise they were all in Ile de France (Paris region).
SOUTH KOREAN INVESTMENTS IN EUROPE
In 2017, Germany was the leading European recipient of job-creating investment from South Korea, attracting 23% of all South Korean projects in Europe, ahead of France and Poland (both 13%). 2
There are over forty South Korean companies operating in France, where they employ more than 4,800 people.
SELECTED INVESTMENT PROJECTS IN 2017
Naver: IT software and services specialist Naver Corporation decided to expand in France, acquiring the American firm Xerox’s research center, in Meylan, near Grenoble (Auvergne-Rhône-Alpes region). Renamed Naver Labs Europe, the Korean group’s innovation center will continue to employ the team of 80 researchers and administrative staff. Naver also launched its Space Green incubation program at the Station F incubator in Paris, and with room for 80 workstations, it has the largest premises along with Facebook. The Korean company and its Japanese subsidiary Line have also stepped up their investment in France and Europe by increasing their stake in K-fund 1, a fund managed by former French government minister Fleur Pellerin, to €200 million.
HDX Corporation: This South Korean company specializing in radiotherapy opened its first European subsidiary in France in Arcueil, Ile de France (Paris region). Complete with a showroom, the subsidiary aims to rapidly increase sales of medical imaging systems and dental chairs across France and Europe.
Parent company Main business sector Workforce in France
SAMSUNG ELECTRONICS CO., LTD.Consumer electronics Electrical/electronic/IT equipment
400-500
DOOSAN CORP.Machinery and mechanical equipmentConstruction, building materials
200-300
LG ELECTRONICS INC.Consumer electronics Electrical/electronic/IT equipment
200-300
KIA MOTORS CORPORATION Automotive industry 200-300
AMOREPACIFIC Perfumes, cosmetics 100-200
TOP 5 SOUTH KOREAN COMPANIES BY EMPLOYMENT IN FRANCE
1 FDI stock in France (immediate investor) as of December 31, 2016.FDI stock by ultimate investor as of December 31, 2015 was €1.1 billion.2 Business France Europe Observatory.
SOUTH KOREA
INVEST
FLOW
4projects (Business France)
63jobs (Business France)
STOCK
45companies in France (Orbis)
More than4,800
employees (Orbis)
€796 million
FDI stock in France1
27th place (Banque de France)
€5.0 billion
French exports16th place (French Customs Authorities)
64 companies in the Forbes 2000
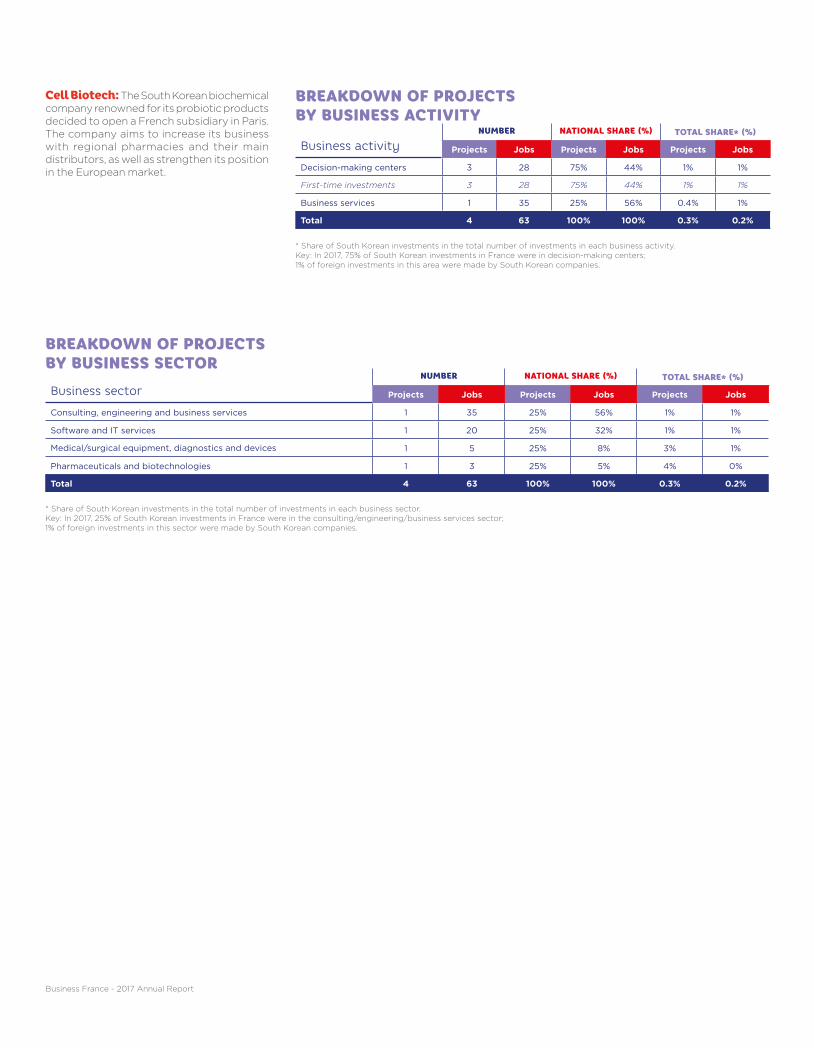
BREAKDOWN OF PROJECTS BY BUSINESS SECTOR
* Share of South Korean investments in the total number of investments in each business activity. Key: In 2017, 75% of South Korean investments in France were in decision-making centers; 1% of foreign investments in this area were made by South Korean companies.
* Share of South Korean investments in the total number of investments in each business sector.Key: In 2017, 25% of South Korean investments in France were in the consulting/engineering/business services sector; 1% of foreign investments in this sector were made by South Korean companies.
BREAKDOWN OF PROJECTS BY BUSINESS ACTIVITY
Business activityNUMBER NATIONAL SHARE (%) TOTAL SHARE* (%)
Projects Jobs Projects Jobs Projects Jobs
Decision-making centers 3 28 75% 44% 1% 1%
First-time investments 3 28 75% 44% 1% 1%
Business services 1 35 25% 56% 0.4% 1%
Total 4 63 100% 100% 0.3% 0.2%
Business sectorNUMBER NATIONAL SHARE (%) TOTAL SHARE* (%)
Projects Jobs Projects Jobs Projects Jobs
Consulting, engineering and business services 1 35 25% 56% 1% 1%
Software and IT services 1 20 25% 32% 1% 1%
Medical/surgical equipment, diagnostics and devices 1 5 25% 8% 3% 1%
Pharmaceuticals and biotechnologies 1 3 25% 5% 4% 0%
Total 4 63 100% 100% 0.3% 0.2%
Cell Biotech: The South Korean biochemical company renowned for its probiotic products decided to open a French subsidiary in Paris. The company aims to increase its business with regional pharmacies and their main distributors, as well as strengthen its position in the European market.
Business France - 2017 Annual Report

DENMARK
INVEST
1 FDI stock in France (immediate investor) as of December 31, 2016. FDI stock by ultimate investor as of December 31, 2015 was €4.5 billion.
2 Business France Europe Observatory3 Project confirmed before it was acquired by General Electric in April 2017.
Fifteen Danish investment decisions were recorded in France in 2017, creating more than 200 jobs.
DANISH COMPANIES IN FRANCE
There are over 350 Danish companies operating in France, where they employ nearly 40,000 people.
Fifteen Danish investment decisions were recorded in France in 2017, creating more than 200 jobs.
Danish companies invested primarily in retail outlets (27%) and decision-making centers (20%), all of which were first-time investments in France.
One-third of these Danish investments were in the furnishings and household goods sector, where they accounted for 17% of all foreign investments in 2017.
Thirty-three percent of all Danish investments in 2017 were located in Ile de France (Paris region), with a further 27% in Grand Est and 20% in Hauts de France.
DANISH INVESTMENTS IN EUROPE
In 2017, the United Kingdom was the leading European recipient of job-creating investment from Denmark, attracting 23% of Danish projects in Europe, followed by France (13%), Poland (11%) and Germany (also 11%). 2
SELECTED INVESTMENT PROJECTS IN 2017
LM Wind Power: This Danish group confirmed that it was investing €120 million in a new blade production facility3 in Cherbourg, Normandy. The plant will be built at a site developed by Ports Normands Associés (PNA), the port authority for Cherbourg and Caen-Ouistreham. The site is due to be open by June 2018, eventually creating 550 jobs.
DSV: These Danish transport and logistics specialists opened their new 3,500-sq. m. head office and 8,000-sq. m warehouse at the port of Gennevilliers, in Ile de France (Paris region). This €20 million investment will bring together the group’s new headquarters in France and a multimodal logistics platform, redeploying 200 existing personnel. DSV, the world’s fifth largest logistics services operator, is consolidating its presence in France, where it already has 175,000 sq. m. of warehouse space and 900 employees. This latest investment is expected to create 35 jobs within three years.
William Demant: Following the acquisition in 2013 of the French company Neurelec, a European specialist in cochlear implants and neurostimulators to treat deafness, Danish hearing aids manufacturer William Demant reported strong business growth in 2017. As a result, the company recruited 50 people and stepped up its production activities at the Vallauris site, part of the Sophia Antipolis business park near Nice (Provence-Alpes-Côte d’Azur region).
Parent company Main business sector Workforce in France
ISS WORLD SERVICES Other services 24,500
NOVO NORDISK Pharmaceuticals and biotechnologies 1,450
CARLSBERG Agri-food, agriculture, fishing 1,210
WILLIAM DEMANT Medical/surgical equipment, diagnostics and devices 1,200
GRUNDFOS Machinery and mechanical equipment 915
TOP 5 DANISH COMPANIES BY EMPLOYMENT IN FRANCE
FLOW
15projects (Business France)
224jobs (Business France)
STOCK
More than350
companies in France (Eurostat)
More than40,000
employees (Eurostat)
€5.6 billion
FDI stock in France1
14th place (Banque de France)
€2.6 billion
French exports34th place (French Customs Authorities)
12 companies in the Forbes 2000
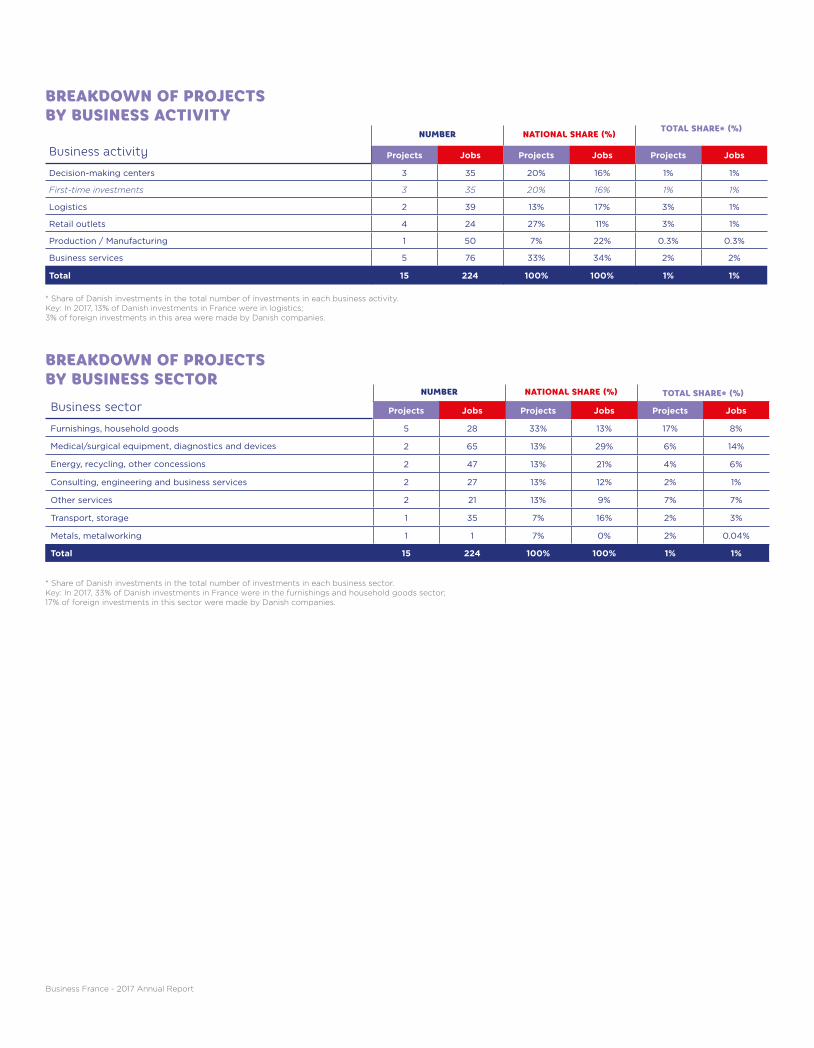
NUMBER NATIONAL SHARE (%)TOTAL SHARE* (%)
Business activity Projects Jobs Projects Jobs Projects Jobs
Decision-making centers 3 35 20% 16% 1% 1%
First-time investments 3 35 20% 16% 1% 1%
Logistics 2 39 13% 17% 3% 1%
Retail outlets 4 24 27% 11% 3% 1%
Production / Manufacturing 1 50 7% 22% 0.3% 0.3%
Business services 5 76 33% 34% 2% 2%
Total 15 224 100% 100% 1% 1%
* Share of Danish investments in the total number of investments in each business activity.Key: In 2017, 13% of Danish investments in France were in logistics; 3% of foreign investments in this area were made by Danish companies.
* Share of Danish investments in the total number of investments in each business sector. Key: In 2017, 33% of Danish investments in France were in the furnishings and household goods sector; 17% of foreign investments in this sector were made by Danish companies.
BREAKDOWN OF PROJECTS BY BUSINESS ACTIVITY
BREAKDOWN OF PROJECTS BY BUSINESS SECTOR
Business sectorNUMBER NATIONAL SHARE (%) TOTAL SHARE* (%)
Projects Jobs Projects Jobs Projects Jobs
Furnishings, household goods 5 28 33% 13% 17% 8%
Medical/surgical equipment, diagnostics and devices 2 65 13% 29% 6% 14%
Energy, recycling, other concessions 2 47 13% 21% 4% 6%
Consulting, engineering and business services 2 27 13% 12% 2% 1%
Other services 2 21 13% 9% 7% 7%
Transport, storage 1 35 7% 16% 2% 3%
Metals, metalworking 1 1 7% 0% 2% 0.04%
Total 15 224 100% 100% 1% 1%
Business France - 2017 Annual Report

France was the leading European recipient of job-creating investment from Spain in 2017.
SPANISH COMPANIES IN FRANCE
There are over 1,200 Spanish companies operating in France, where they employ around 55,000 people.Forty-five investments from Spain were recorded in 2017, creating or maintaining 811 jobs.Investments by Spanish companies were made primarily in production/manufacturing operations (31% of projects), decision-making centers (24%), the vast majority of which were first-time investments in France, and business services (20%).Sixteen percent of Spanish investments were in the software/IT services sector, where they accounted for 4% of all foreign investments, while a further 11% of Spanish projects were in the transport/storage sector. Ile de France (Paris region) (24%) and Occitanie (22%) were the leading regions chosen for Spanish projects, ahead of Nouvelle Aquitaine (18%), where the number of Spanish investments doubled in 2017.
SPANISH INVESTMENTS IN EUROPE
In 2017, France was the leading European recipient of job-creating investment from Spain, attracting 27% of Spanish projects in Europe, ahead of Portugal (21%) and the United Kingdom (19%).2
SELECTED INVESTMENT PROJECTS IN 2017
Garnica: This Spanish manufacturer of plasterboard panels decided to increase production at its Samazan plant in the Nouvelle Aquitaine region to cater for a rise in orders. The firm plans to invest €12 million and recruit some 40 people in 2018 and 2019.
Ironhack: This Spanish startup is a tech school specializing in digital skills such as computer programming and coding. The company opened a campus in Paris in 2017, which is currently run by a team of five, but this is set to grow to ten in the near future.
Hierros Añon: The Galician steel company is investing €30 million to build a stainless-steel plant at the port of Bayonne, in the Nouvelle Aquitaine region. An additional €17 million has been earmarked to cover initial start-up requirements. A total of 140 jobs will be created over the next three years.
SPAIN
INVEST
1 FDI stock in France (immediate investor) as of December 31, 2016. FDI stock by ultimate investor as of December 31, 2015 was €10.4 billion.
2 Business France Europe Observatory.
Parent company Main business sector Workforce in France
INDITEX Textiles, industrial textiles, clothing and accessories 7,500
PROSEGUR COMPANIA DE SEGURIDAD S.A. Other services 6,600
GRUPO AMADEUS Software and IT services 4,000-5,000
ABERTIS INFRAESTRUCTURAS, S.A. Construction, building materials 3,000
MANGO Textiles, industrial textiles, clothing and accessories 1,500
TOP 5 SPANISH COMPANIES BY EMPLOYMENT IN FRANCE
FLOW
45projects (Business France)
811jobs (Business France)
STOCK
More than1,200
companies in France (Eurostat)
More than55,000
employees (Eurostat)
€15 billion
FDI stock in France1
10th place (Banque de France)
€35.5 billion
French exports 2nd place(French Customs Authorities)
23 companies in the Forbes 2000
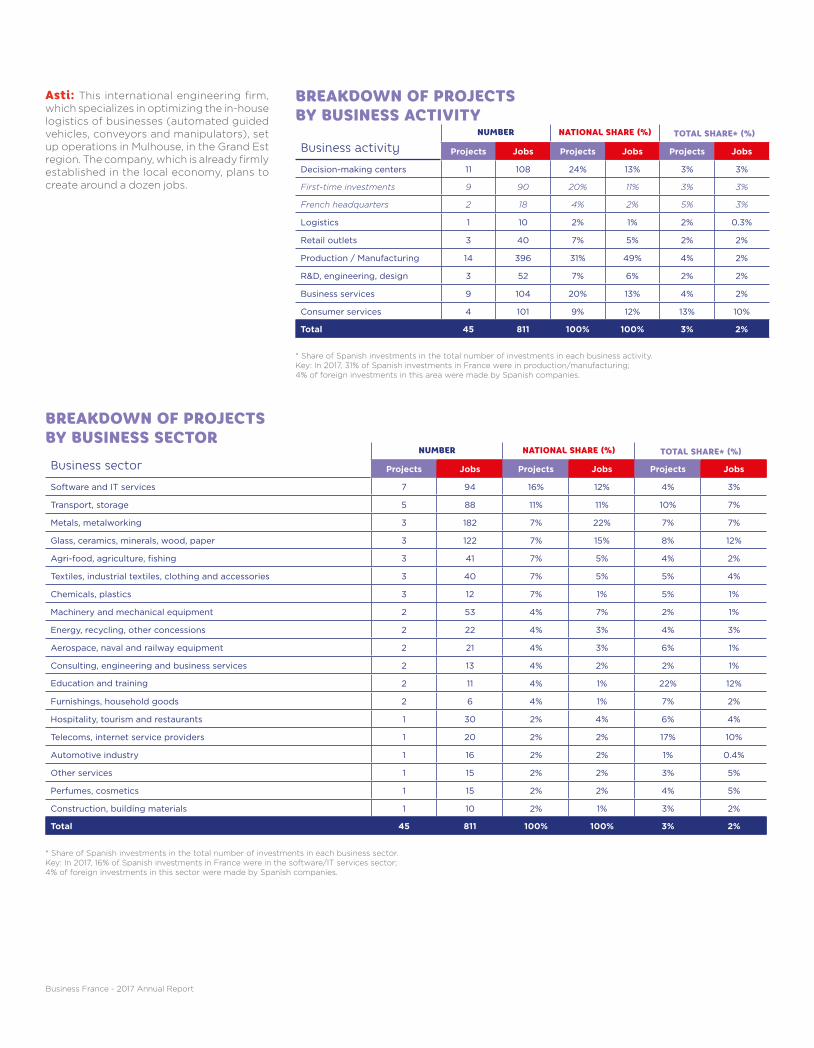
* Share of Spanish investments in the total number of investments in each business activity.Key: In 2017, 31% of Spanish investments in France were in production/manufacturing; 4% of foreign investments in this area were made by Spanish companies.
* Share of Spanish investments in the total number of investments in each business sector.Key: In 2017, 16% of Spanish investments in France were in the software/IT services sector; 4% of foreign investments in this sector were made by Spanish companies.
BREAKDOWN OF PROJECTS BY BUSINESS ACTIVITY
BREAKDOWN OF PROJECTS BY BUSINESS SECTOR
Business activityNUMBER NATIONAL SHARE (%) TOTAL SHARE* (%)
Projects Jobs Projects Jobs Projects Jobs
Decision-making centers 11 108 24% 13% 3% 3%
First-time investments 9 90 20% 11% 3% 3%
French headquarters 2 18 4% 2% 5% 3%
Logistics 1 10 2% 1% 2% 0.3%
Retail outlets 3 40 7% 5% 2% 2%
Production / Manufacturing 14 396 31% 49% 4% 2%
R&D, engineering, design 3 52 7% 6% 2% 2%
Business services 9 104 20% 13% 4% 2%
Consumer services 4 101 9% 12% 13% 10%
Total 45 811 100% 100% 3% 2%
Business sectorNUMBER NATIONAL SHARE (%) TOTAL SHARE* (%)
Projects Jobs Projects Jobs Projects Jobs
Software and IT services 7 94 16% 12% 4% 3%
Transport, storage 5 88 11% 11% 10% 7%
Metals, metalworking 3 182 7% 22% 7% 7%
Glass, ceramics, minerals, wood, paper 3 122 7% 15% 8% 12%
Agri-food, agriculture, fishing 3 41 7% 5% 4% 2%
Textiles, industrial textiles, clothing and accessories 3 40 7% 5% 5% 4%
Chemicals, plastics 3 12 7% 1% 5% 1%
Machinery and mechanical equipment 2 53 4% 7% 2% 1%
Energy, recycling, other concessions 2 22 4% 3% 4% 3%
Aerospace, naval and railway equipment 2 21 4% 3% 6% 1%
Consulting, engineering and business services 2 13 4% 2% 2% 1%
Education and training 2 11 4% 1% 22% 12%
Furnishings, household goods 2 6 4% 1% 7% 2%
Hospitality, tourism and restaurants 1 30 2% 4% 6% 4%
Telecoms, internet service providers 1 20 2% 2% 17% 10%
Automotive industry 1 16 2% 2% 1% 0.4%
Other services 1 15 2% 2% 3% 5%
Perfumes, cosmetics 1 15 2% 2% 4% 5%
Construction, building materials 1 10 2% 1% 3% 2%
Total 45 811 100% 100% 3% 2%
Asti: This international engineering firm, which specializes in optimizing the in-house logistics of businesses (automated guided vehicles, conveyors and manipulators), set up operations in Mulhouse, in the Grand Est region. The company, which is already firmly established in the local economy, plans to create around a dozen jobs.
Business France - 2017 Annual Report

UNITED STATES
INVEST
* Excluding investment funds. 1 FDI stock in France (immediate investor) as of December 31, 2016. FDI stock by ultimate investor as of December 31, 2015 was €119 billion.
2 Business France Europe Observatory.
The United States was the leading source of job-creating foreign investment in France in 2017, with 230 projects creating or maintaining 7,047 jobs.
AMERICAN COMPANIES IN FRANCE
There are over 4,600 American companies operating in France, where they employ more than 460,000 people.A total of 230 investments were recorded from the United States in 2017, up 26% from the previous year, creating or maintaining 7,047 jobs, or 21% of all jobs generated by foreign investment in France.Investments by American firms were made primarily in decision-making centers (27%), the vast majority of which were first-time investments in France, and production/manufacturing operations (24%). A large number of American companies invested in logistics operations and R&D activities, accounting for 32% and 26%, respectively, of all foreign investment in these areas in France.American businesses invested most of all in the French software and IT services sector (28%), where 35% of all foreign investment came from the United States, and made standout contributions in healthcare sectors, accounting for 37% of foreign investment in pharmaceuticals and biotechnologies, and 28% in medical/surgical equipment.
American projects were most often located in Ile de France (Paris region), which attracted 46% of all investments from the United States.
AMERICAN INVESTMENTS IN EUROPE
In 2017, France was the second largest European recipient of job-creating investment from the United States, attracting 16% of American projects in Europe, preceded by the United Kingdom (25%), but ahead of Germany (13%).2
SELECTED INVESTMENT PROJECTS IN 2017
Ipsoft: This New York-based tech firm designs artificial intelligence-based automated and cognitive technologies, including digital virtual assistants for businesses. In April 2017, it announced that it was consolidating its position in Europe by creating offices in Paris and Madrid. The Paris office will be primarily in charge of business activities, as well as R&D, and will generate around twenty jobs.
Symphony: Founded in 2014 in Silicon Valley, Symphony is a secure cloud-based instant-messaging and content sharing platform. The company has more than 300,000 users worldwide, most of whom are financial professionals. In 2017, Symphony decided to set up its first European R&D center in the Sophia Antipolis technology park near Nice (Provence-Alpes-Côte d’Azur region), creating around a hundred new jobs for highly qualified engineers.
Parent company* Main business sector Workforce in France
GENERAL ELECTRIC COMPANY Manufacturing and services conglomerate 15,000-20,000
UNITED TECHNOLOGIES CORPORATION (UTC)
Aerospace, naval and railway equipmentMachinery and mechanical equipment
10,000-15,000
XPO LOGISTICS LLC Transport, storage 10,000-15,000
WALT DISNEY CO. Other services 10,000-15,000
MCDONALD'S CORPORATION Hospitality, tourism and restaurants 10,000-15,000
TOP 5 AMERICAN COMPANIES BY EMPLOYMENT IN FRANCE
FLOW
230projects (Business France)
7,047jobs (Business France)
STOCK
More than4,600
companies in France (Orbis)
More than460,000
employees (Orbis)
€54.2 billion
FDI stock in France1
7th place (Banque de France)
€34.0 billion
French exports 3rd place(French Customs Authorities)
565 companies in the Forbes 2000
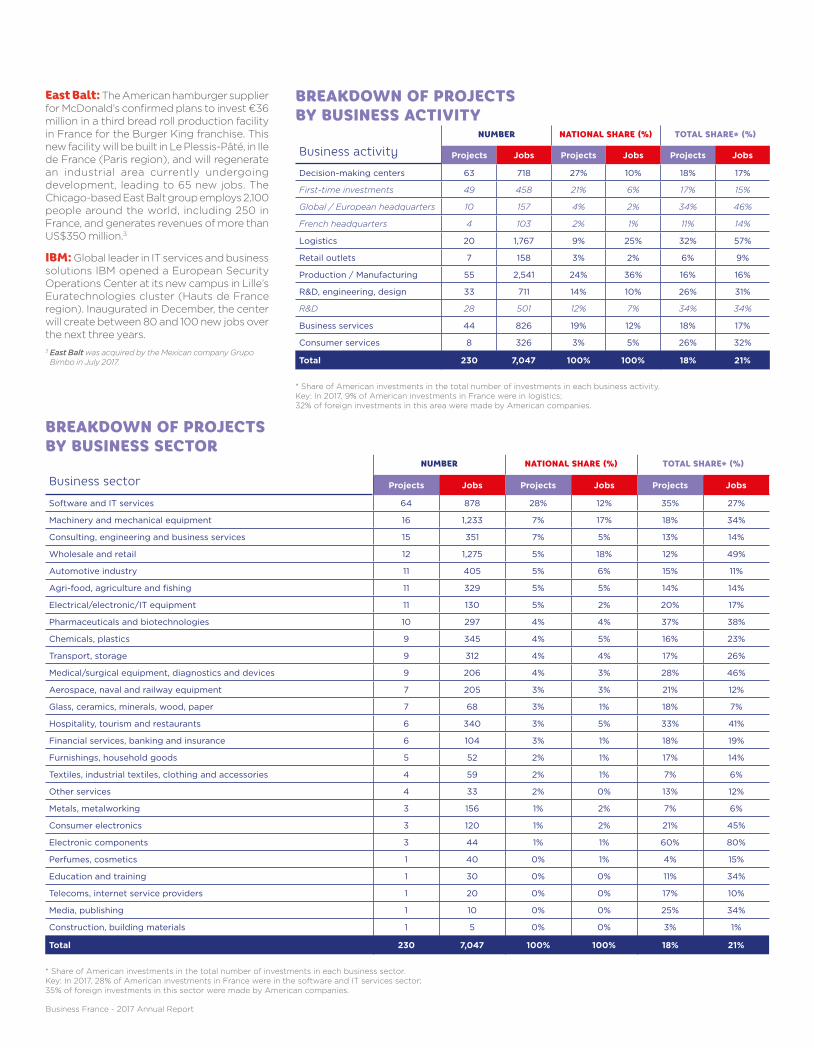
East Balt: The American hamburger supplier for McDonald’s confirmed plans to invest €36 million in a third bread roll production facility in France for the Burger King franchise. This new facility will be built in Le Plessis-Pâté, in Ile de France (Paris region), and will regenerate an industrial area currently undergoing development, leading to 65 new jobs. The Chicago-based East Balt group employs 2,100 people around the world, including 250 in France, and generates revenues of more than US$350 million.3
IBM: Global leader in IT services and business solutions IBM opened a European Security Operations Center at its new campus in Lille’s Euratechnologies cluster (Hauts de France region). Inaugurated in December, the center will create between 80 and 100 new jobs over the next three years.3 East Balt was acquired by the Mexican company Grupo Bimbo in July 2017.
NUMBER NATIONAL SHARE (%) TOTAL SHARE* (%)
Business activity Projects Jobs Projects Jobs Projects Jobs
Decision-making centers 63 718 27% 10% 18% 17%
First-time investments 49 458 21% 6% 17% 15%
Global / European headquarters 10 157 4% 2% 34% 46%
French headquarters 4 103 2% 1% 11% 14%
Logistics 20 1,767 9% 25% 32% 57%
Retail outlets 7 158 3% 2% 6% 9%
Production / Manufacturing 55 2,541 24% 36% 16% 16%
R&D, engineering, design 33 711 14% 10% 26% 31%
R&D 28 501 12% 7% 34% 34%
Business services 44 826 19% 12% 18% 17%
Consumer services 8 326 3% 5% 26% 32%
Total 230 7,047 100% 100% 18% 21%
* Share of American investments in the total number of investments in each business activity.Key: In 2017, 9% of American investments in France were in logistics; 32% of foreign investments in this area were made by American companies.
* Share of American investments in the total number of investments in each business sector. Key: In 2017, 28% of American investments in France were in the software and IT services sector; 35% of foreign investments in this sector were made by American companies.
NUMBER NATIONAL SHARE (%) TOTAL SHARE* (%)
Business sector Projects Jobs Projects Jobs Projects Jobs
Software and IT services 64 878 28% 12% 35% 27%
Machinery and mechanical equipment 16 1,233 7% 17% 18% 34%
Consulting, engineering and business services 15 351 7% 5% 13% 14%
Wholesale and retail 12 1,275 5% 18% 12% 49%
Automotive industry 11 405 5% 6% 15% 11%
Agri-food, agriculture and fishing 11 329 5% 5% 14% 14%
Electrical/electronic/IT equipment 11 130 5% 2% 20% 17%
Pharmaceuticals and biotechnologies 10 297 4% 4% 37% 38%
Chemicals, plastics 9 345 4% 5% 16% 23%
Transport, storage 9 312 4% 4% 17% 26%
Medical/surgical equipment, diagnostics and devices 9 206 4% 3% 28% 46%
Aerospace, naval and railway equipment 7 205 3% 3% 21% 12%
Glass, ceramics, minerals, wood, paper 7 68 3% 1% 18% 7%
Hospitality, tourism and restaurants 6 340 3% 5% 33% 41%
Financial services, banking and insurance 6 104 3% 1% 18% 19%
Furnishings, household goods 5 52 2% 1% 17% 14%
Textiles, industrial textiles, clothing and accessories 4 59 2% 1% 7% 6%
Other services 4 33 2% 0% 13% 12%
Metals, metalworking 3 156 1% 2% 7% 6%
Consumer electronics 3 120 1% 2% 21% 45%
Electronic components 3 44 1% 1% 60% 80%
Perfumes, cosmetics 1 40 0% 1% 4% 15%
Education and training 1 30 0% 0% 11% 34%
Telecoms, internet service providers 1 20 0% 0% 17% 10%
Media, publishing 1 10 0% 0% 25% 34%
Construction, building materials 1 5 0% 0% 3% 1%
Total 230 7,047 100% 100% 18% 21%
BREAKDOWN OF PROJECTS BY BUSINESS ACTIVITY
BREAKDOWN OF PROJECTS BY BUSINESS SECTOR
Business France - 2017 Annual Report

FINLAND
INVEST
1 FDI stock in France (immediate investor) as of December 31, 2016. FDI stock by ultimate investor as of December 31, 2015 was €1.6 billion.
2 Business France Europe Observatory.
Finnish investment in France doubled in 2017.
FINNISH COMPANIES IN FRANCE
There are over 100 Finnish companies operating in France, where they employ nearly 15,000 people.Ten investments from Finland were recorded in 2017, creating or maintaining 284 jobs. These investments mainly involved new decision-making centers (30%), and R&D, engineering and design activities (also 30%), while R&D projects accounted for more than half (55%) of jobs created by Finnish investment. Thirty percent of Finnish projects were in the textiles, industrial textiles, clothing and accessories sector, while 51% of jobs generated by Finnish investment were in the telecoms and internet service providers sector.Forty percent of Finnish projects were located in Ile de France (Paris region).
FINNISH INVESTMENTS IN EUROPE
In 2017, France was the fourth leading European recipient of job-creating investment from Finland, attracting 12% of Finnish projects in Europe, preceded by Poland (19%), the United Kingdom (16%) and Germany (14%).2
SELECTED INVESTMENT PROJECTS IN 2017
Ahlstrom-Munksjö: This g lobal manufacturer of fiber-based materials is set to invest €7 million in the construction of a fourth production line to make baking paper at its Saint-Séverin site in the Nouvelle Aquitaine region. The investment will lead to the creation of 28 jobs.
M-Files: This publisher of software to improve the management of documents and information within companies acquired Paris-based StreamDesign in 2017. M-Files is keen to ramp up its development in France, where it already has close to 150 clients, and now plans to recruit around twenty people over the next three years.
Parent company Main business sector Workforce in France
NOKIA OYJ Consumer electronics 7,500-10,000
KONE OYJ Machinery and mechanical equipment 3,000-3,500
AMER SPORTS OYJ (WILSON, SALOMON, MAVIC)
Furnishings, household goodsTextiles, industrial textiles, clothing and accessories
1,000-1,500
METSO Machinery and mechanical equipment 500-1,000
KONECRANES Machinery and mechanical equipment 500-1,000
TOP 5 FINNISH COMPANIES BY EMPLOYMENT IN FRANCE
FLOW
10projects (Business France)
284jobs (Business France)
STOCK
More than100
companies in France (Eurostat)
15,000employees (Eurostat)
€13.8 billion
FDI stock in France1
11th place (Banque de France)
€2.0 billion
French exports 38th place (French Customs Authorities)
9 companies in the Forbes 2000
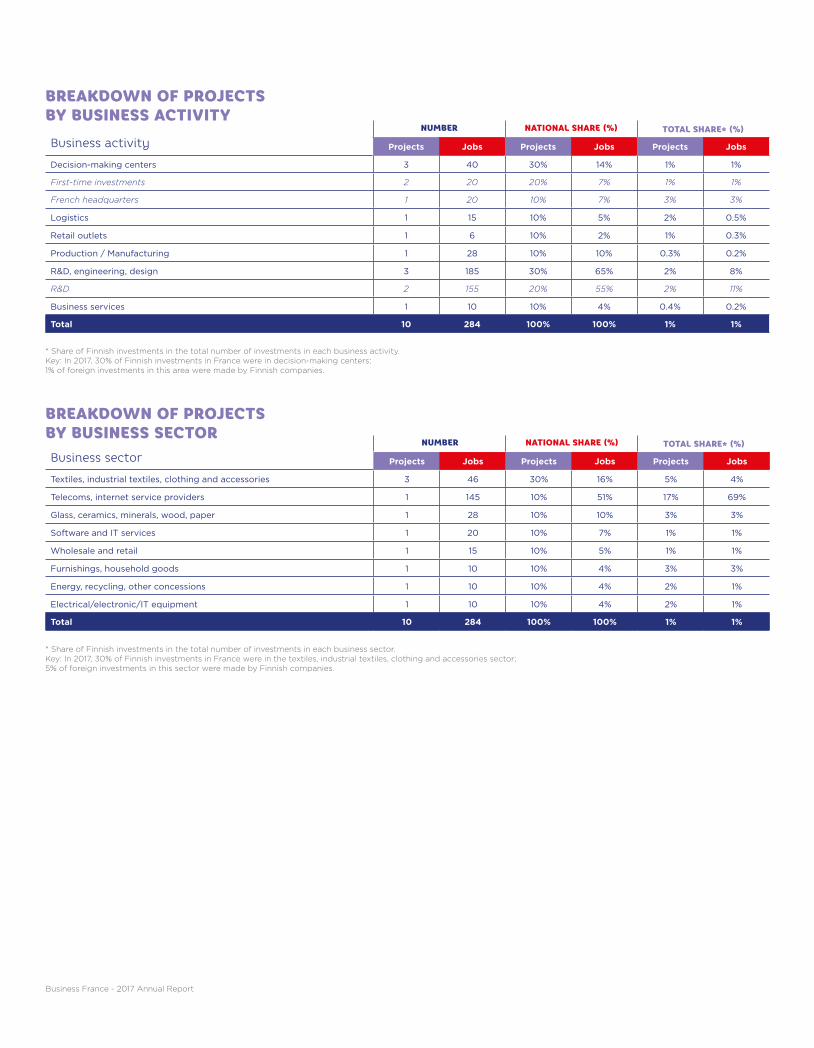
* Share of Finnish investments in the total number of investments in each business activity.Key: In 2017, 30% of Finnish investments in France were in decision-making centers; 1% of foreign investments in this area were made by Finnish companies.
* Share of Finnish investments in the total number of investments in each business sector.Key: In 2017, 30% of Finnish investments in France were in the textiles, industrial textiles, clothing and accessories sector; 5% of foreign investments in this sector were made by Finnish companies.
BREAKDOWN OF PROJECTS BY BUSINESS ACTIVITY
BREAKDOWN OF PROJECTS BY BUSINESS SECTOR
Business activityNUMBER NATIONAL SHARE (%) TOTAL SHARE* (%)
Projects Jobs Projects Jobs Projects Jobs
Decision-making centers 3 40 30% 14% 1% 1%
First-time investments 2 20 20% 7% 1% 1%
French headquarters 1 20 10% 7% 3% 3%
Logistics 1 15 10% 5% 2% 0.5%
Retail outlets 1 6 10% 2% 1% 0.3%
Production / Manufacturing 1 28 10% 10% 0.3% 0.2%
R&D, engineering, design 3 185 30% 65% 2% 8%
R&D 2 155 20% 55% 2% 11%
Business services 1 10 10% 4% 0.4% 0.2%
Total 10 284 100% 100% 1% 1%
Business sectorNUMBER NATIONAL SHARE (%) TOTAL SHARE* (%)
Projects Jobs Projects Jobs Projects Jobs
Textiles, industrial textiles, clothing and accessories 3 46 30% 16% 5% 4%
Telecoms, internet service providers 1 145 10% 51% 17% 69%
Glass, ceramics, minerals, wood, paper 1 28 10% 10% 3% 3%
Software and IT services 1 20 10% 7% 1% 1%
Wholesale and retail 1 15 10% 5% 1% 1%
Furnishings, household goods 1 10 10% 4% 3% 3%
Energy, recycling, other concessions 1 10 10% 4% 2% 1%
Electrical/electronic/IT equipment 1 10 10% 4% 2% 1%
Total 10 284 100% 100% 1% 1%
Business France - 2017 Annual Report

INDIA
INVEST
1 FDI stock in France (ultimate investor) as of December 31, 2015.2 Business France Europe Observatory.
Indian investments in France were buoyant in 2017, with 19 investment decisions recorded (+73%), creating or maintaining 284 jobs (+66%).
INDIAN COMPANIES IN FRANCE
There are over 150 Indian companies operating in France, where they employ around 7,000 people.Nineteen investments from India were recorded in 2017, creating or maintaining 284 jobs. Indian projects often involved decision-making centers (42% of projects), including a Global/European headquarters, and production/manufacturing operations (32%).Investments were mainly made in the software and IT services sector (26% of projects and 52% of jobs generated), and chemicals/plastics industry (21% of projects; 23% of jobs), while location-wise, Indian companies invested primarily in Ile de France (Paris region) (26% of projects), Nouvelle Aquitaine (16%), Bourgogne-Franche-Comté (16%) and Hauts de France (16%).
INDIAN INVESTMENTS IN EUROPE
In 2017, the leading European recipient of job-creating investment from India was the
United Kingdom, attracting 35% of all Indian projects in Europe, followed by France (19%) and the Netherlands (15%).2
SELECTED INVESTMENT PROJECTS IN 2017
Infosys Technology: the Indian IT giant announced plans to move its business forward in France via a strategic partnership with CMA-CGM, the world’s third leading maritime transport company. Infosys will open a center for development and innovation in Marseille (Provence-Alpes-Côte d’Azur region), leading to 80 jobs and setting the standard for Marseille as a hub of expertise. There are also plans to open a training center at some point.
United Phosphorus: Dutch company Cerexagri is a subsidiary of India’s United Phosphorus Ltd., and specializes in crop protection products. In 2017, it decided to invest €15 million in a second production facility in Mourenx, in Nouvelle Aquitaine (south-west France), creating around a dozen jobs. The company is also present in Bassens, in the same region, and in Marseille, in Provence-Alpes-Côte d’Azur.
Zify Tech Solutions: This innovative Indian startup announced plans to set up in Paris, creating 10 jobs. Zify’s flagship product is a dynamic, artificial intelligence-based mobile application for short- and medium-distance urban travel. It aims to help people save on travel costs, thereby reducing congestion and making cities more sustainable.
Parent company Main business sector Workforce in France
TATA GROUP (TATA SONS LTD.)Software and IT servicesMetals, metalworking
1,500
SINTEX INDUSTRIES LTD. Chemicals, plastics 1,000-1,500
MOTHERSON SUMI SYSTEMS (SMR AUTOMOTIVE SYSTEMS) Automotive industry 400-500
CENTUM INDIA (ADETEL GROUP) Electrical/electronic/IT equipment 400-500
MAHINDRA & MAHINDRA LTD. Automotive industry 400-500
FLOW
19projects (Business France)
284jobs (Business France)
STOCK
More than150
companies in France (Orbis)
More than7,000
employees (Orbis)
€267 million
FDI stock in France1 (Banque de France)
€5.3 billion
French exports 15th place(French Customs Authorities)
58 companies in the Forbes 2000
TOP 5 INDIAN COMPANIES BY EMPLOYMENT IN FRANCE
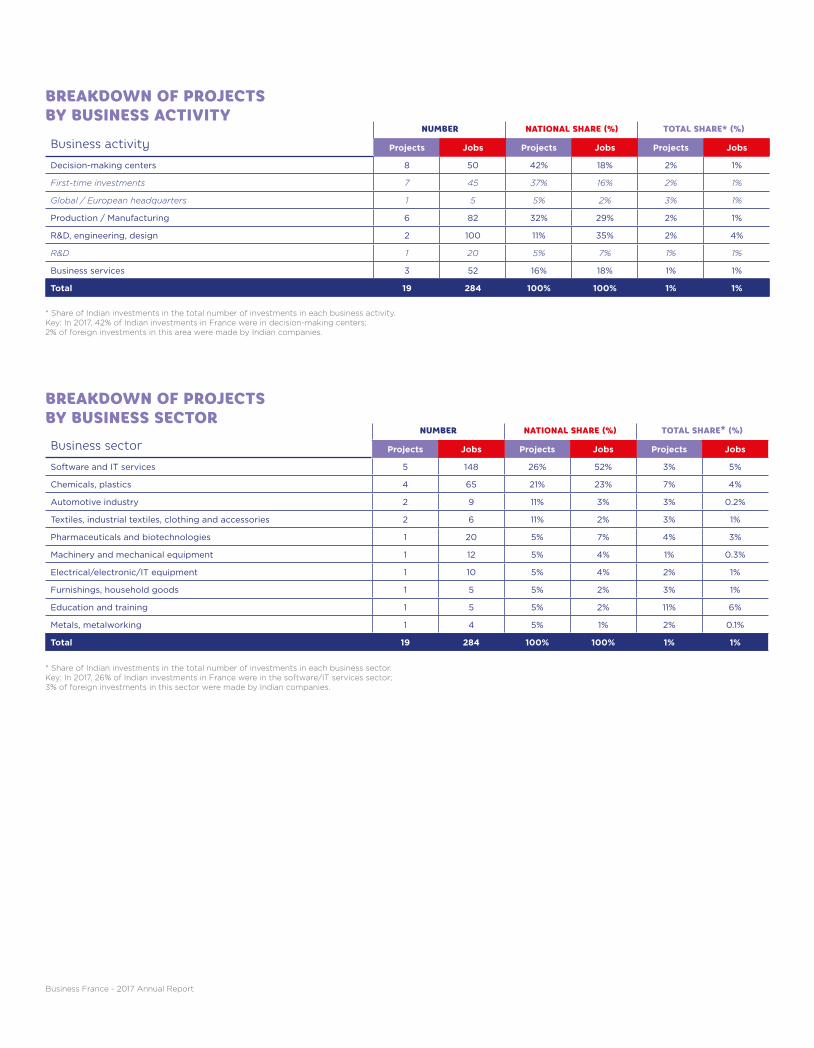
* Share of Indian investments in the total number of investments in each business activity.Key: In 2017, 42% of Indian investments in France were in decision-making centers; 2% of foreign investments in this area were made by Indian companies.
* Share of Indian investments in the total number of investments in each business sector.Key: In 2017, 26% of Indian investments in France were in the software/IT services sector; 3% of foreign investments in this sector were made by Indian companies.
BREAKDOWN OF PROJECTS BY BUSINESS ACTIVITY
BREAKDOWN OF PROJECTS BY BUSINESS SECTOR
Business activityNUMBER NATIONAL SHARE (%) TOTAL SHARE* (%)
Projects Jobs Projects Jobs Projects Jobs
Decision-making centers 8 50 42% 18% 2% 1%
First-time investments 7 45 37% 16% 2% 1%
Global / European headquarters 1 5 5% 2% 3% 1%
Production / Manufacturing 6 82 32% 29% 2% 1%
R&D, engineering, design 2 100 11% 35% 2% 4%
R&D 1 20 5% 7% 1% 1%
Business services 3 52 16% 18% 1% 1%
Total 19 284 100% 100% 1% 1%
Business sectorNUMBER NATIONAL SHARE (%) TOTAL SHARE* (%)
Projects Jobs Projects Jobs Projects Jobs
Software and IT services 5 148 26% 52% 3% 5%
Chemicals, plastics 4 65 21% 23% 7% 4%
Automotive industry 2 9 11% 3% 3% 0.2%
Textiles, industrial textiles, clothing and accessories 2 6 11% 2% 3% 1%
Pharmaceuticals and biotechnologies 1 20 5% 7% 4% 3%
Machinery and mechanical equipment 1 12 5% 4% 1% 0.3%
Electrical/electronic/IT equipment 1 10 5% 4% 2% 1%
Furnishings, household goods 1 5 5% 2% 3% 1%
Education and training 1 5 5% 2% 11% 6%
Metals, metalworking 1 4 5% 1% 2% 0.1%
Total 19 284 100% 100% 1% 1%
Business France - 2017 Annual Report

IRELAND
INVEST France was the second leading European recipient of Irish investment in 2017 after the United Kingdom.
IRISH COMPANIES IN FRANCE
There are nearly 300 Irish companies operating in France, where they employ more than 20,000 people.
Seventeen investments from Ireland were recorded in 2017, creating or maintaining 279 jobs.
More than half of these investments involved production/manufacturing operations (53%), while two sectors – consulting, engineering and business services (24%) and glass, ceramics, minerals, wood, paper (also 24%) – accounted for nearly half of Irish projects.
The Occitanie region (29%) attracted nearly one-third of Irish investments in 2017.
IRISH INVESTMENTS IN EUROPE
In 2017, the United Kingdom was the leading European recipient of job-creating investment from Ireland, attracting 30% of Irish projects in Europe, followed by France (18%) and Germany (15%).²
SELECTED INVESTMENT PROJECTS IN 2017
Abbey International Finance: In 2017, this privately owned company acquired Sovam GSE, which manufactures ground support equipment for airports and is based in Châtillon-sur-Thouet, in the Deux-Sèvres département (Nouvelle Aquitaine region). The investment secured 55 jobs at the site.
Smurfit Kappa: This global manufacturer of corrugated cardboard packaging solutions is investing €2 million in its Lys-Lez-Lannoy plant near Lille (Hauts de France region). It plans to modernize the site and boost production capacity, notably by building a new cutting line. Smurfit Kappa recruited 20 people in Lys-Lez-Lannoy in 2017 and is planning to create another 10 jobs in 2018. The site currently employs nearly 200 people.
Accenture: Avanade, a subsidiary of consulting giant Accenture specializes in digital transformation and the integration of Microsoft software solutions. It recently consolidated its presence in the Auvergne-Rhône-Alpes region, recruiting 20 people in Lyon and 10 in Clermont-Ferrand in 2017.
1 FDI stock in France (immediate investor) as of December 31, 2016. FDI stock by ultimate investor as of December 31, 2015 was €6.6 billion.2 Business France Europe Observatory.
Parent company Main business sector Workforce in France
ACCENTURE PLC Consulting, engineering and business services 6,000
SMURFIT KAPPA GROUP Glass, ceramics, minerals, wood, paper 5,500
CRH PLC Construction, building materials 3,350
WILLIS TOWERS WATSON PLC (GRAS SAVOYE) Financial services, banking and insurance 2,000
INGERSOLL-RAND PLC Machinery and mechanical equipment 500-1,000
FLOW
17projects (Business France)
279jobs (Business France)
STOCK
300companies in France (Eurostat)
More than20,000
employees (Eurostat)
€4.1 billion
FDI stock in France1
15th place (Banque de France)
€2.8 billion
French exports 32nd place(French Customs Authorities)
20 companies in the Forbes 2000
TOP 5 IRISH COMPANIES BY EMPLOYMENT IN FRANCE
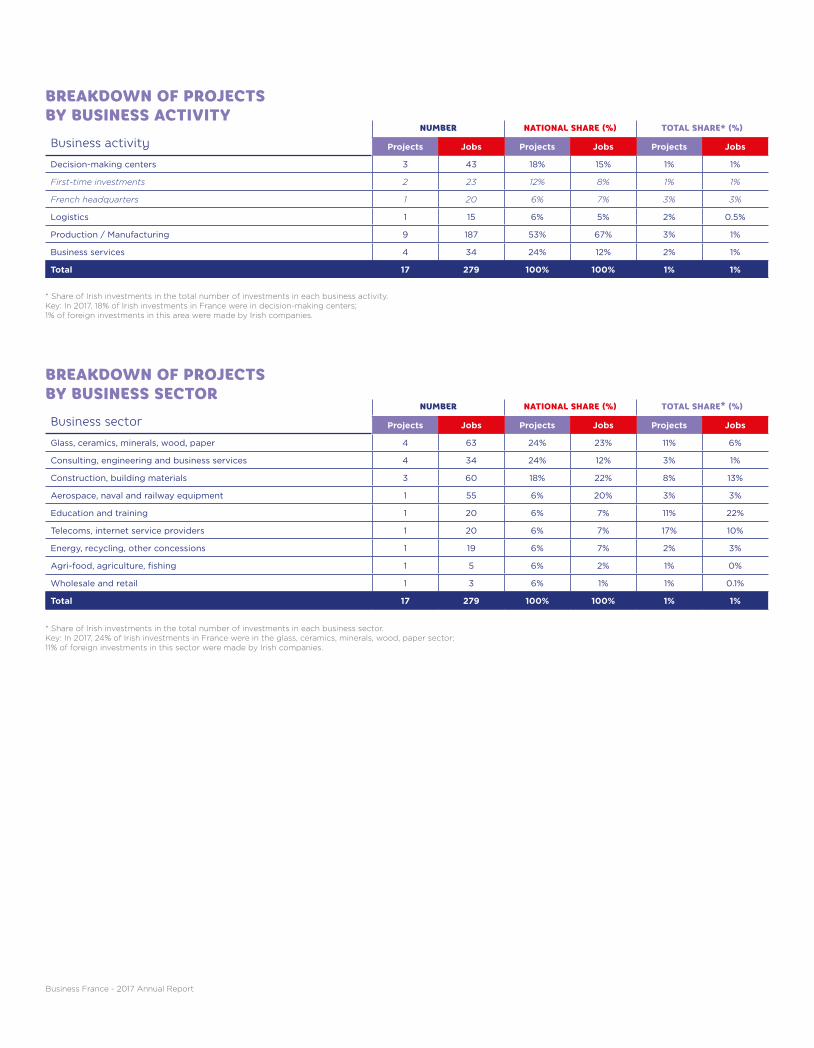
* Share of Irish investments in the total number of investments in each business activity.Key: In 2017, 18% of Irish investments in France were in decision-making centers; 1% of foreign investments in this area were made by Irish companies.
* Share of Irish investments in the total number of investments in each business sector.Key: In 2017, 24% of Irish investments in France were in the glass, ceramics, minerals, wood, paper sector; 11% of foreign investments in this sector were made by Irish companies.
BREAKDOWN OF PROJECTS BY BUSINESS ACTIVITY
BREAKDOWN OF PROJECTS BY BUSINESS SECTOR
Business activityNUMBER NATIONAL SHARE (%) TOTAL SHARE* (%)
Projects Jobs Projects Jobs Projects Jobs
Decision-making centers 3 43 18% 15% 1% 1%
First-time investments 2 23 12% 8% 1% 1%
French headquarters 1 20 6% 7% 3% 3%
Logistics 1 15 6% 5% 2% 0.5%
Production / Manufacturing 9 187 53% 67% 3% 1%
Business services 4 34 24% 12% 2% 1%
Total 17 279 100% 100% 1% 1%
Business sectorNUMBER NATIONAL SHARE (%) TOTAL SHARE* (%)
Projects Jobs Projects Jobs Projects Jobs
Glass, ceramics, minerals, wood, paper 4 63 24% 23% 11% 6%
Consulting, engineering and business services 4 34 24% 12% 3% 1%
Construction, building materials 3 60 18% 22% 8% 13%
Aerospace, naval and railway equipment 1 55 6% 20% 3% 3%
Education and training 1 20 6% 7% 11% 22%
Telecoms, internet service providers 1 20 6% 7% 17% 10%
Energy, recycling, other concessions 1 19 6% 7% 2% 3%
Agri-food, agriculture, fishing 1 5 6% 2% 1% 0%
Wholesale and retail 1 3 6% 1% 1% 0.1%
Total 17 279 100% 100% 1% 1%
Business France - 2017 Annual Report
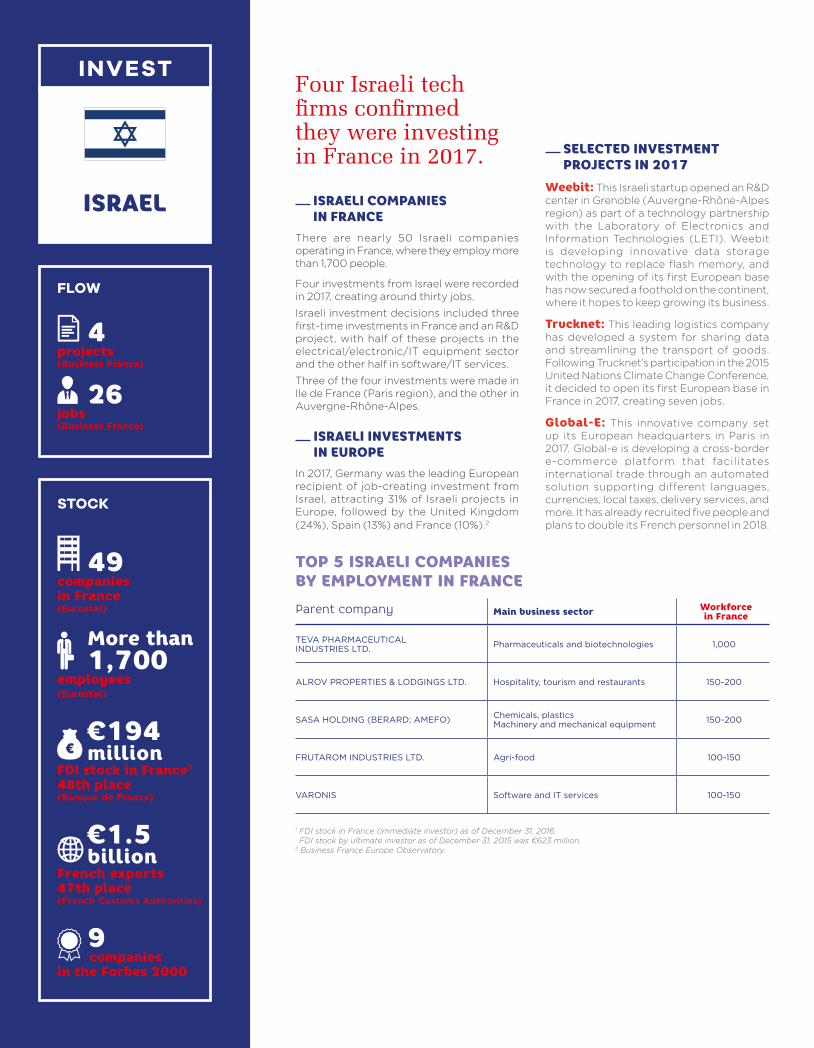
Four Israeli tech firms confirmed they were investing in France in 2017.
ISRAELI COMPANIES IN FRANCE
There are nearly 50 Israeli companies operating in France, where they employ more than 1,700 people.
Four investments from Israel were recorded in 2017, creating around thirty jobs.
Israeli investment decisions included three first-time investments in France and an R&D project, with half of these projects in the electrical/electronic/IT equipment sector and the other half in software/IT services.
Three of the four investments were made in Ile de France (Paris region), and the other in Auvergne-Rhône-Alpes.
ISRAELI INVESTMENTS IN EUROPE
In 2017, Germany was the leading European recipient of job-creating investment from Israel, attracting 31% of Israeli projects in Europe, followed by the United Kingdom (24%), Spain (13%) and France (10%).2
SELECTED INVESTMENT PROJECTS IN 2017
Weebit: This Israeli startup opened an R&D center in Grenoble (Auvergne-Rhône-Alpes region) as part of a technology partnership with the Laboratory of Electronics and Information Technologies (LETI). Weebit is developing innovative data storage technology to replace flash memory, and with the opening of its first European base has now secured a foothold on the continent, where it hopes to keep growing its business.
Trucknet: This leading logistics company has developed a system for sharing data and streamlining the transport of goods. Following Trucknet’s participation in the 2015 United Nations Climate Change Conference, it decided to open its first European base in France in 2017, creating seven jobs.
Global-E: This innovative company set up its European headquarters in Paris in 2017. Global-e is developing a cross-border e-commerce platform that facilitates international trade through an automated solution supporting different languages, currencies, local taxes, delivery services, and more. It has already recruited five people and plans to double its French personnel in 2018.
1 FDI stock in France (immediate investor) as of December 31, 2016. FDI stock by ultimate investor as of December 31, 2015 was €623 million.
2 Business France Europe Observatory.
Parent company Main business sector Workforce in France
TEVA PHARMACEUTICAL INDUSTRIES LTD. Pharmaceuticals and biotechnologies 1,000
ALROV PROPERTIES & LODGINGS LTD. Hospitality, tourism and restaurants 150-200
SASA HOLDING (BERARD; AMEFO) Chemicals, plastics Machinery and mechanical equipment 150-200
FRUTAROM INDUSTRIES LTD. Agri-food 100-150
VARONIS Software and IT services 100-150
TOP 5 ISRAELI COMPANIES BY EMPLOYMENT IN FRANCE
ISRAEL
INVEST
FLOW
4projects (Business France)
26jobs (Business France)
STOCK
49
companies in France (Eurostat)
More than1,700
employees (Eurostat)
€194 million
FDI stock in France1
48th place(Banque de France)
€1.5 billion
French exports 47th place(French Customs Authorities)
9 companies in the Forbes 2000
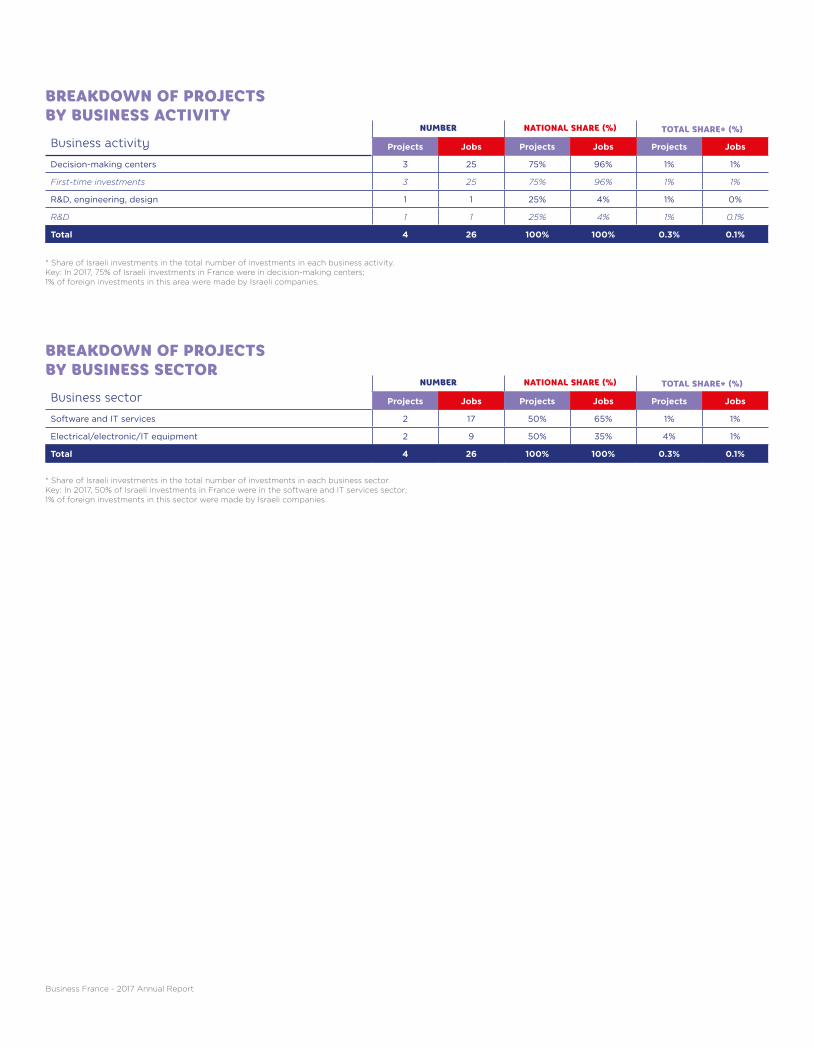
* Share of Israeli investments in the total number of investments in each business activity.Key: In 2017, 75% of Israeli investments in France were in decision-making centers; 1% of foreign investments in this area were made by Israeli companies.
* Share of Israeli investments in the total number of investments in each business sector.Key: In 2017, 50% of Israeli investments in France were in the software and IT services sector; 1% of foreign investments in this sector were made by Israeli companies.
BREAKDOWN OF PROJECTS BY BUSINESS ACTIVITY
BREAKDOWN OF PROJECTS BY BUSINESS SECTOR
Business activityNUMBER NATIONAL SHARE (%) TOTAL SHARE* (%)
Projects Jobs Projects Jobs Projects Jobs
Decision-making centers 3 25 75% 96% 1% 1%
First-time investments 3 25 75% 96% 1% 1%
R&D, engineering, design 1 1 25% 4% 1% 0%
R&D 1 1 25% 4% 1% 0.1%
Total 4 26 100% 100% 0.3% 0.1%
Business sectorNUMBER NATIONAL SHARE (%) TOTAL SHARE* (%)
Projects Jobs Projects Jobs Projects Jobs
Software and IT services 2 17 50% 65% 1% 1%
Electrical/electronic/IT equipment 2 9 50% 35% 4% 1%
Total 4 26 100% 100% 0.3% 0.1%
Business France - 2017 Annual Report
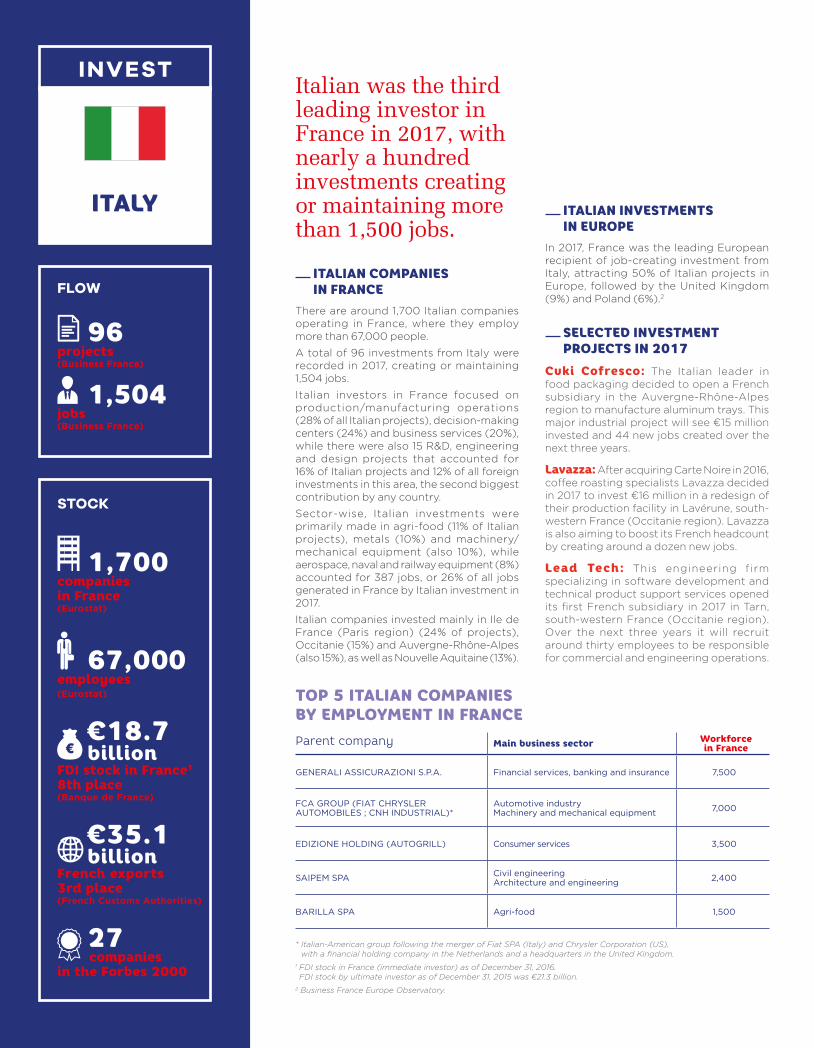
* Italian-American group following the merger of Fiat SPA (Italy) and Chrysler Corporation (US), with a financial holding company in the Netherlands and a headquarters in the United Kingdom.
1 FDI stock in France (immediate investor) as of December 31, 2016. FDI stock by ultimate investor as of December 31, 2015 was €21.3 billion.
2 Business France Europe Observatory.
Italian was the third leading investor in France in 2017, with nearly a hundred investments creating or maintaining more than 1,500 jobs.
ITALIAN COMPANIES IN FRANCE
There are around 1,700 Italian companies operating in France, where they employ more than 67,000 people.
A total of 96 investments from Italy were recorded in 2017, creating or maintaining 1,504 jobs.
Italian investors in France focused on production/manufacturing operations (28% of all Italian projects), decision-making centers (24%) and business services (20%), while there were also 15 R&D, engineering and design projects that accounted for 16% of Italian projects and 12% of all foreign investments in this area, the second biggest contribution by any country.
Sector-wise, Italian investments were primarily made in agri-food (11% of Italian projects), metals (10%) and machinery/mechanical equipment (also 10%), while aerospace, naval and railway equipment (8%) accounted for 387 jobs, or 26% of all jobs generated in France by Italian investment in 2017.
Italian companies invested mainly in Ile de France (Paris region) (24% of projects), Occitanie (15%) and Auvergne-Rhône-Alpes (also 15%), as well as Nouvelle Aquitaine (13%).
ITALIAN INVESTMENTS IN EUROPE
In 2017, France was the leading European recipient of job-creating investment from Italy, attracting 50% of Italian projects in Europe, followed by the United Kingdom (9%) and Poland (6%).2
SELECTED INVESTMENT PROJECTS IN 2017
Cuki Cofresco: The Italian leader in food packaging decided to open a French subsidiary in the Auvergne-Rhône-Alpes region to manufacture aluminum trays. This major industrial project will see €15 million invested and 44 new jobs created over the next three years.
Lavazza: After acquiring Carte Noire in 2016, coffee roasting specialists Lavazza decided in 2017 to invest €16 million in a redesign of their production facility in Lavérune, south-western France (Occitanie region). Lavazza is also aiming to boost its French headcount by creating around a dozen new jobs.
Lead Tech: This engineering firm specializing in software development and technical product support services opened its first French subsidiary in 2017 in Tarn, south-western France (Occitanie region). Over the next three years it will recruit around thirty employees to be responsible for commercial and engineering operations.
Parent company Main business sector Workforce in France
GENERALI ASSICURAZIONI S.P.A. Financial services, banking and insurance 7,500
FCA GROUP (FIAT CHRYSLER AUTOMOBILES ; CNH INDUSTRIAL)*
Automotive industry Machinery and mechanical equipment 7,000
EDIZIONE HOLDING (AUTOGRILL) Consumer services 3,500
SAIPEM SPA Civil engineering Architecture and engineering 2,400
BARILLA SPA Agri-food 1,500
TOP 5 ITALIAN COMPANIES BY EMPLOYMENT IN FRANCE
ITALY
INVEST
FLOW
96projects (Business France)
1,504jobs (Business France)
STOCK
1,700
companies in France (Eurostat)
67,000employees (Eurostat)
€18.7 billion
FDI stock in France1
8th place(Banque de France)
€35.1 billion
French exports 3rd place(French Customs Authorities)
27 companies in the Forbes 2000
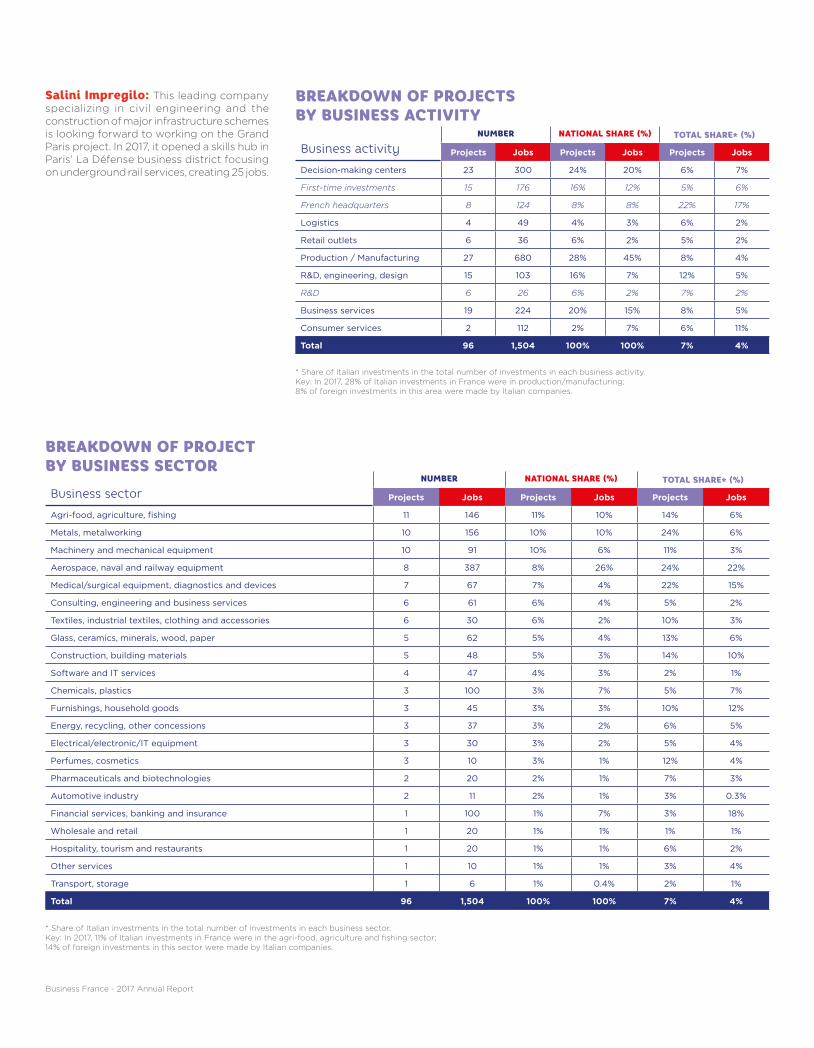
* Share of Italian investments in the total number of investments in each business activity.Key: In 2017, 28% of Italian investments in France were in production/manufacturing; 8% of foreign investments in this area were made by Italian companies.
* Share of Italian investments in the total number of investments in each business sector.Key: In 2017, 11% of Italian investments in France were in the agri-food, agriculture and fishing sector; 14% of foreign investments in this sector were made by Italian companies.
BREAKDOWN OF PROJECTS BY BUSINESS ACTIVITY
BREAKDOWN OF PROJECT BY BUSINESS SECTOR
Salini Impregilo: This leading company specializing in civil engineering and the construction of major infrastructure schemes is looking forward to working on the Grand Paris project. In 2017, it opened a skills hub in Paris’ La Défense business district focusing on underground rail services, creating 25 jobs.
Business activityNUMBER NATIONAL SHARE (%) TOTAL SHARE* (%)
Projects Jobs Projects Jobs Projects Jobs
Decision-making centers 23 300 24% 20% 6% 7%
First-time investments 15 176 16% 12% 5% 6%
French headquarters 8 124 8% 8% 22% 17%
Logistics 4 49 4% 3% 6% 2%
Retail outlets 6 36 6% 2% 5% 2%
Production / Manufacturing 27 680 28% 45% 8% 4%
R&D, engineering, design 15 103 16% 7% 12% 5%
R&D 6 26 6% 2% 7% 2%
Business services 19 224 20% 15% 8% 5%
Consumer services 2 112 2% 7% 6% 11%
Total 96 1,504 100% 100% 7% 4%
Business sectorNUMBER NATIONAL SHARE (%) TOTAL SHARE* (%)
Projects Jobs Projects Jobs Projects Jobs
Agri-food, agriculture, fishing 11 146 11% 10% 14% 6%
Metals, metalworking 10 156 10% 10% 24% 6%
Machinery and mechanical equipment 10 91 10% 6% 11% 3%
Aerospace, naval and railway equipment 8 387 8% 26% 24% 22%
Medical/surgical equipment, diagnostics and devices 7 67 7% 4% 22% 15%
Consulting, engineering and business services 6 61 6% 4% 5% 2%
Textiles, industrial textiles, clothing and accessories 6 30 6% 2% 10% 3%
Glass, ceramics, minerals, wood, paper 5 62 5% 4% 13% 6%
Construction, building materials 5 48 5% 3% 14% 10%
Software and IT services 4 47 4% 3% 2% 1%
Chemicals, plastics 3 100 3% 7% 5% 7%
Furnishings, household goods 3 45 3% 3% 10% 12%
Energy, recycling, other concessions 3 37 3% 2% 6% 5%
Electrical/electronic/IT equipment 3 30 3% 2% 5% 4%
Perfumes, cosmetics 3 10 3% 1% 12% 4%
Pharmaceuticals and biotechnologies 2 20 2% 1% 7% 3%
Automotive industry 2 11 2% 1% 3% 0.3%
Financial services, banking and insurance 1 100 1% 7% 3% 18%
Wholesale and retail 1 20 1% 1% 1% 1%
Hospitality, tourism and restaurants 1 20 1% 1% 6% 2%
Other services 1 10 1% 1% 3% 4%
Transport, storage 1 6 1% 0.4% 2% 1%
Total 96 1,504 100% 100% 7% 4%
Business France - 2017 Annual Report
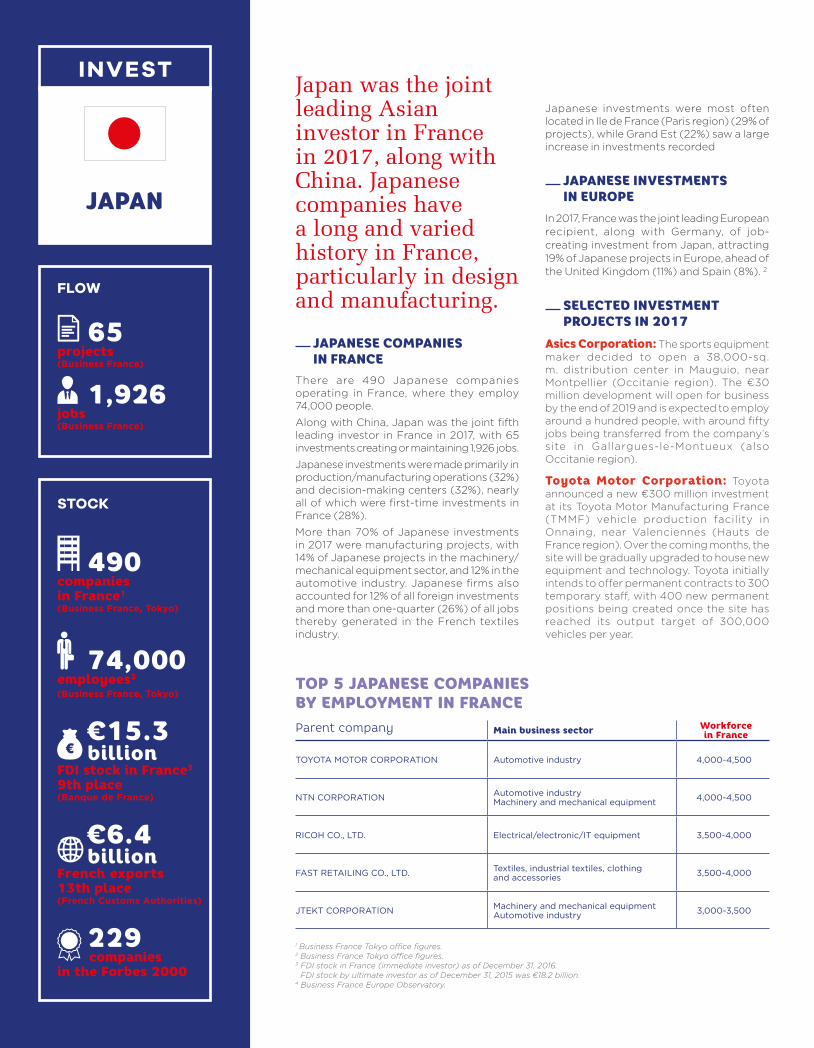
JAPAN
INVEST
1 Business France Tokyo office figures.2 Business France Tokyo office figures.3 FDI stock in France (immediate investor) as of December 31, 2016.
FDI stock by ultimate investor as of December 31, 2015 was €18.2 billion.4 Business France Europe Observatory.
Japan was the joint leading Asian investor in France in 2017, along with China. Japanese companies have a long and varied history in France, particularly in design and manufacturing.
JAPANESE COMPANIES IN FRANCE
There are 490 Japanese companies operating in France, where they employ 74,000 people.
Along with China, Japan was the joint fifth leading investor in France in 2017, with 65 investments creating or maintaining 1,926 jobs.
Japanese investments were made primarily in production/manufacturing operations (32%) and decision-making centers (32%), nearly all of which were first-time investments in France (28%).
More than 70% of Japanese investments in 2017 were manufacturing projects, with 14% of Japanese projects in the machinery/mechanical equipment sector, and 12% in the automotive industry. Japanese firms also accounted for 12% of all foreign investments and more than one-quarter (26%) of all jobs thereby generated in the French textiles industry.
Japanese investments were most often located in Ile de France (Paris region) (29% of projects), while Grand Est (22%) saw a large increase in investments recorded
JAPANESE INVESTMENTS IN EUROPE
In 2017, France was the joint leading European recipient, along with Germany, of job-creating investment from Japan, attracting 19% of Japanese projects in Europe, ahead of the United Kingdom (11%) and Spain (8%). 2
SELECTED INVESTMENT PROJECTS IN 2017
Asics Corporation: The sports equipment maker decided to open a 38,000-sq. m. distribution center in Mauguio, near Montpellier (Occitanie region). The €30 million development will open for business by the end of 2019 and is expected to employ around a hundred people, with around fifty jobs being transferred from the company’s site in Gallargues-le-Montueux (also Occitanie region).
Toyota Motor Corporation: Toyota announced a new €300 million investment at its Toyota Motor Manufacturing France (TMMF) vehicle production facility in Onnaing, near Valenciennes (Hauts de France region). Over the coming months, the site will be gradually upgraded to house new equipment and technology. Toyota initially intends to offer permanent contracts to 300 temporary staff, with 400 new permanent positions being created once the site has reached its output target of 300,000 vehicles per year.
Parent company Main business sector Workforce in France
TOYOTA MOTOR CORPORATION Automotive industry 4,000-4,500
NTN CORPORATION Automotive industry Machinery and mechanical equipment 4,000-4,500
RICOH CO., LTD. Electrical/electronic/IT equipment 3,500-4,000
FAST RETAILING CO., LTD. Textiles, industrial textiles, clothing and accessories 3,500-4,000
JTEKT CORPORATION Machinery and mechanical equipment Automotive industry 3,000-3,500
TOP 5 JAPANESE COMPANIES BY EMPLOYMENT IN FRANCE
FLOW
65projects (Business France)
1,926jobs (Business France)
STOCK
490
companies in France1 (Business France, Tokyo)
74,000employees2 (Business France, Tokyo)
€15.3 billion
FDI stock in France3
9th place(Banque de France)
€6.4 billion
French exports 13th place(French Customs Authorities)
229 companies in the Forbes 2000
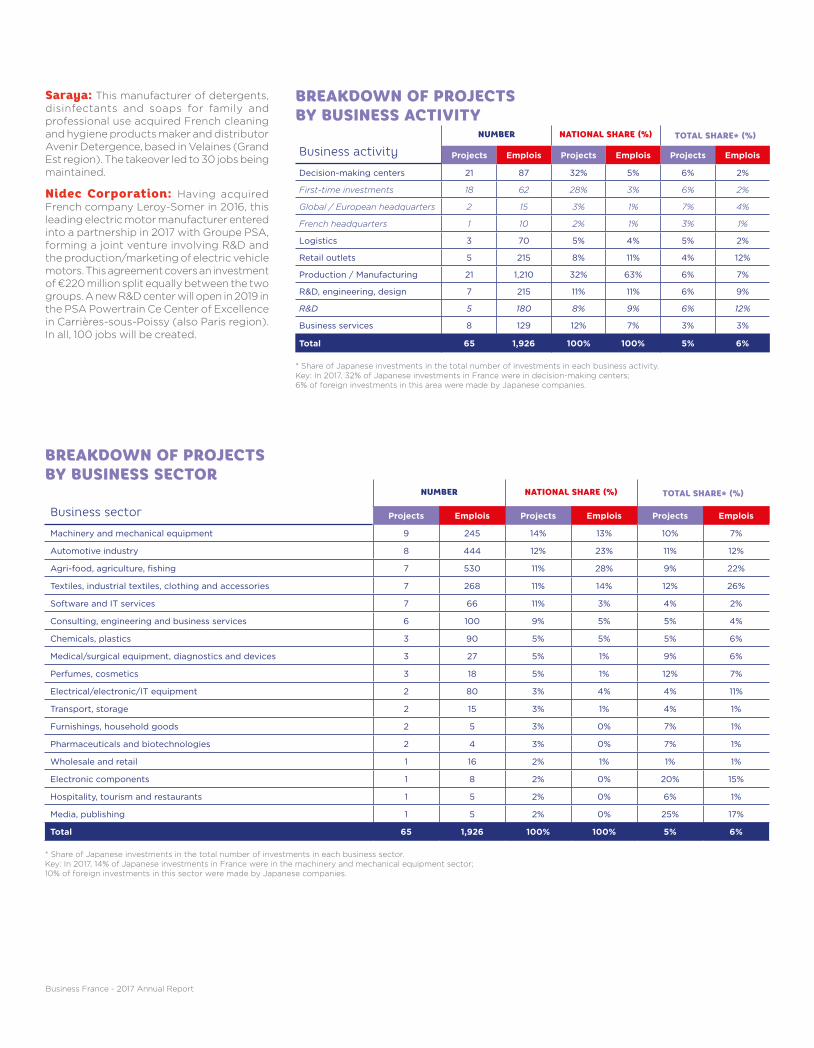
NUMBER NATIONAL SHARE (%) TOTAL SHARE* (%)
Business activity Projects Emplois Projects Emplois Projects Emplois
Decision-making centers 21 87 32% 5% 6% 2%
First-time investments 18 62 28% 3% 6% 2%
Global / European headquarters 2 15 3% 1% 7% 4%
French headquarters 1 10 2% 1% 3% 1%
Logistics 3 70 5% 4% 5% 2%
Retail outlets 5 215 8% 11% 4% 12%
Production / Manufacturing 21 1,210 32% 63% 6% 7%
R&D, engineering, design 7 215 11% 11% 6% 9%
R&D 5 180 8% 9% 6% 12%
Business services 8 129 12% 7% 3% 3%
Total 65 1,926 100% 100% 5% 6%
* Share of Japanese investments in the total number of investments in each business activity.Key: In 2017, 32% of Japanese investments in France were in decision-making centers; 6% of foreign investments in this area were made by Japanese companies.
* Share of Japanese investments in the total number of investments in each business sector.Key: In 2017, 14% of Japanese investments in France were in the machinery and mechanical equipment sector; 10% of foreign investments in this sector were made by Japanese companies.
BREAKDOWN OF PROJECTS BY BUSINESS ACTIVITY
BREAKDOWN OF PROJECTS BY BUSINESS SECTOR
Saraya: This manufacturer of detergents, disinfectants and soaps for family and professional use acquired French cleaning and hygiene products maker and distributor Avenir Detergence, based in Velaines (Grand Est region). The takeover led to 30 jobs being maintained.
Nidec Corporation: Having acquired French company Leroy-Somer in 2016, this leading electric motor manufacturer entered into a partnership in 2017 with Groupe PSA, forming a joint venture involving R&D and the production/marketing of electric vehicle motors. This agreement covers an investment of €220 million split equally between the two groups. A new R&D center will open in 2019 in the PSA Powertrain Ce Center of Excellence in Carrières-sous-Poissy (also Paris region). In all, 100 jobs will be created.
Business sector
NUMBER NATIONAL SHARE (%) TOTAL SHARE* (%)
Projects Emplois Projects Emplois Projects Emplois
Machinery and mechanical equipment 9 245 14% 13% 10% 7%
Automotive industry 8 444 12% 23% 11% 12%
Agri-food, agriculture, fishing 7 530 11% 28% 9% 22%
Textiles, industrial textiles, clothing and accessories 7 268 11% 14% 12% 26%
Software and IT services 7 66 11% 3% 4% 2%
Consulting, engineering and business services 6 100 9% 5% 5% 4%
Chemicals, plastics 3 90 5% 5% 5% 6%
Medical/surgical equipment, diagnostics and devices 3 27 5% 1% 9% 6%
Perfumes, cosmetics 3 18 5% 1% 12% 7%
Electrical/electronic/IT equipment 2 80 3% 4% 4% 11%
Transport, storage 2 15 3% 1% 4% 1%
Furnishings, household goods 2 5 3% 0% 7% 1%
Pharmaceuticals and biotechnologies 2 4 3% 0% 7% 1%
Wholesale and retail 1 16 2% 1% 1% 1%
Electronic components 1 8 2% 0% 20% 15%
Hospitality, tourism and restaurants 1 5 2% 0% 6% 1%
Media, publishing 1 5 2% 0% 25% 17%
Total 65 1,926 100% 100% 5% 6%
Business France - 2017 Annual Report

LUXEMBOURG
INVESTSeventeen investment decisions were recorded in France from Luxembourg in 2017, creating or maintaining 510 jobs.
LUXEMBOURG COMPANIES IN FRANCE
There are around a thousand Luxembourg companies operating in France, where they employ more than 50,000 people. Seventeen investments were recorded from Luxembourg in 2017, creating or maintaining 510 jobs.
Luxembourg projects in 2017 mainly involved production/manufacturing operations (47% of projects; 72% of jobs generated) and decision-making centers (24% of projects), while the leading sector was the metals industry, accounting for 35% of projects and 56% of jobs.
Three regions stood out for Luxembourg investors: Grand Est (24% of projects), Nouvelle-Aquitaine (24%) and Hauts de France (24%).
LUXEMBOURG INVESTMENTS IN EUROPE
In 2017, France was the leading European recipient of job-creating investment from
Luxembourg, receiving 50% of Luxembourg projects in Europe, ahead of Spain, the United Kingdom and Germany (all 9%).2
SELECTED INVESTMENT PROJECTS IN 2017
ITS4U: This Luxembourg-based consulting firm specializes in information systems, technical expertise, solution integration (CRM, ECM, BPM, Middleware Red Hat) and project management. Having grown steadily since it was founded in 2009, the company opened an office in 2017 in Paris where it plans to recruit 10 people over three years.
Vesalius Biocapital: Based in Luxembourg, this venture capital fund invests in European biotech startups and is opening a five-person subsidiary in the Paris suburb of Ivry-sur-Seine (Ile de France) to become part of France’s healthcare and biotech ecosystem.
Aperam: Specializing in stainless steel, Aperam is expanding its business with plans to invest €28 million at its manufacturing site in Gueugnon (Bourgogne-Franche-Comté region). The purpose of the project is to improve the firm’s industrial facilities so as to offer flatter and shinier stainless steels, particularly for use in trim parts. Around 25 jobs are expected to be created.
Parent company Main business sector Workforce in France
ARCELORMITTAL Metals, metalworking 17,000
ALTICE (SFR, NEXTRADIOTV, INTELCIA) Telecoms, internet service providersMedia, publishing
12,000-15,000
EUROFINS SCIENTIFICPharmaceuticals and biotechnologiesConsulting, engineering and business services
5,000-6,000
APERAM Metals, metalworking 1,000-2,000
INTERNATIONAL TECHNOLOGY SOLUTIONS (ITS) (FRANCE LOISIRS) Wholesale and retail 1,000-2,000
TOP 5 LUXEMBOURG COMPANIES BY EMPLOYMENT IN FRANCE
1 FDI stock in France (immediate investor) as of December 31, 2016. FDI stock by ultimate investor as of December 31, 2015 was €28.9 billion.
2 Business France Europe Observatory.
FLOW
17projects (Business France)
510jobs (Business France)
STOCK
More than 1,000
companies in France (Orbis)
More than50,000
employees (Orbis)
€135.8 billion
FDI stock in France1
1st place(Banque de France)
€2.2 billion
French exports 37th place(French Customs Authorities)
5 companies in the Forbes 2000
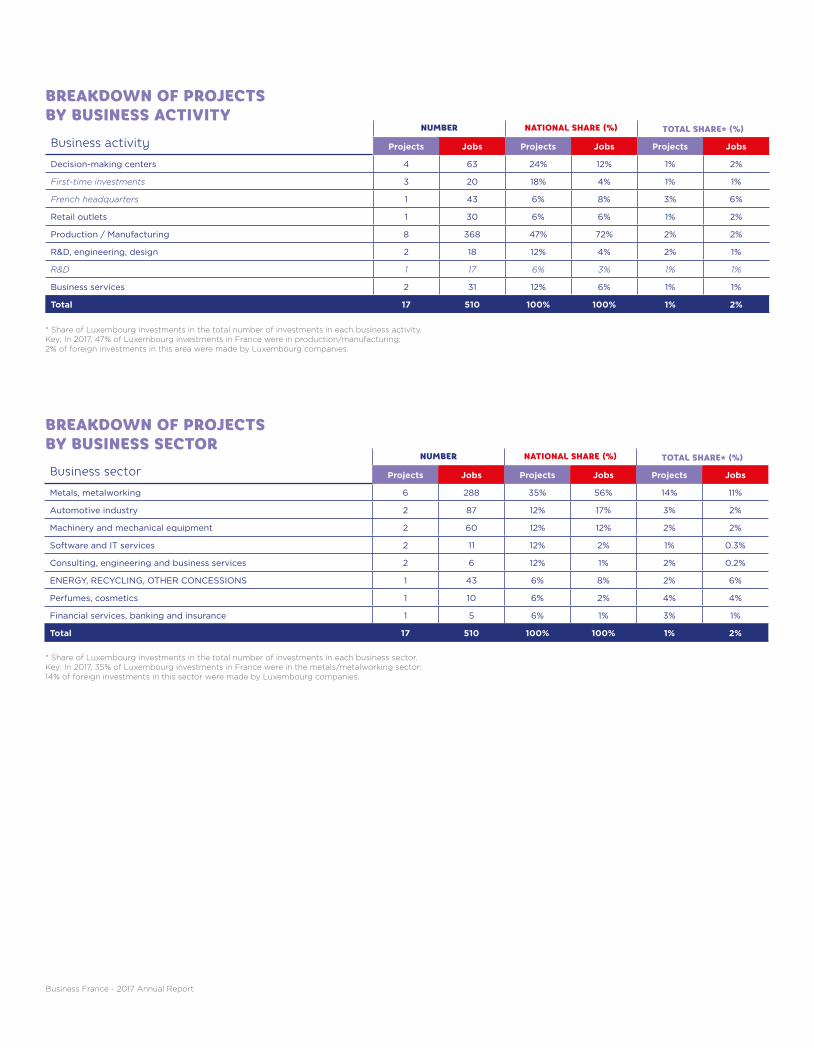
BREAKDOWN OF PROJECTS BY BUSINESS SECTOR
BREAKDOWN OF PROJECTS BY BUSINESS ACTIVITY
* Share of Luxembourg investments in the total number of investments in each business activity.Key: In 2017, 47% of Luxembourg investments in France were in production/manufacturing; 2% of foreign investments in this area were made by Luxembourg companies.
* Share of Luxembourg investments in the total number of investments in each business sector.Key: In 2017, 35% of Luxembourg investments in France were in the metals/metalworking sector; 14% of foreign investments in this sector were made by Luxembourg companies.
Business activityNUMBER NATIONAL SHARE (%) TOTAL SHARE* (%)
Projects Jobs Projects Jobs Projects Jobs
Decision-making centers 4 63 24% 12% 1% 2%
First-time investments 3 20 18% 4% 1% 1%
French headquarters 1 43 6% 8% 3% 6%
Retail outlets 1 30 6% 6% 1% 2%
Production / Manufacturing 8 368 47% 72% 2% 2%
R&D, engineering, design 2 18 12% 4% 2% 1%
R&D 1 17 6% 3% 1% 1%
Business services 2 31 12% 6% 1% 1%
Total 17 510 100% 100% 1% 2%
Business sectorNUMBER NATIONAL SHARE (%) TOTAL SHARE* (%)
Projects Jobs Projects Jobs Projects Jobs
Metals, metalworking 6 288 35% 56% 14% 11%
Automotive industry 2 87 12% 17% 3% 2%
Machinery and mechanical equipment 2 60 12% 12% 2% 2%
Software and IT services 2 11 12% 2% 1% 0.3%
Consulting, engineering and business services 2 6 12% 1% 2% 0.2%
ENERGY, RECYCLING, OTHER CONCESSIONS 1 43 6% 8% 2% 6%
Perfumes, cosmetics 1 10 6% 2% 4% 4%
Financial services, banking and insurance 1 5 6% 1% 3% 1%
Total 17 510 100% 100% 1% 2%
Business France - 2017 Annual Report
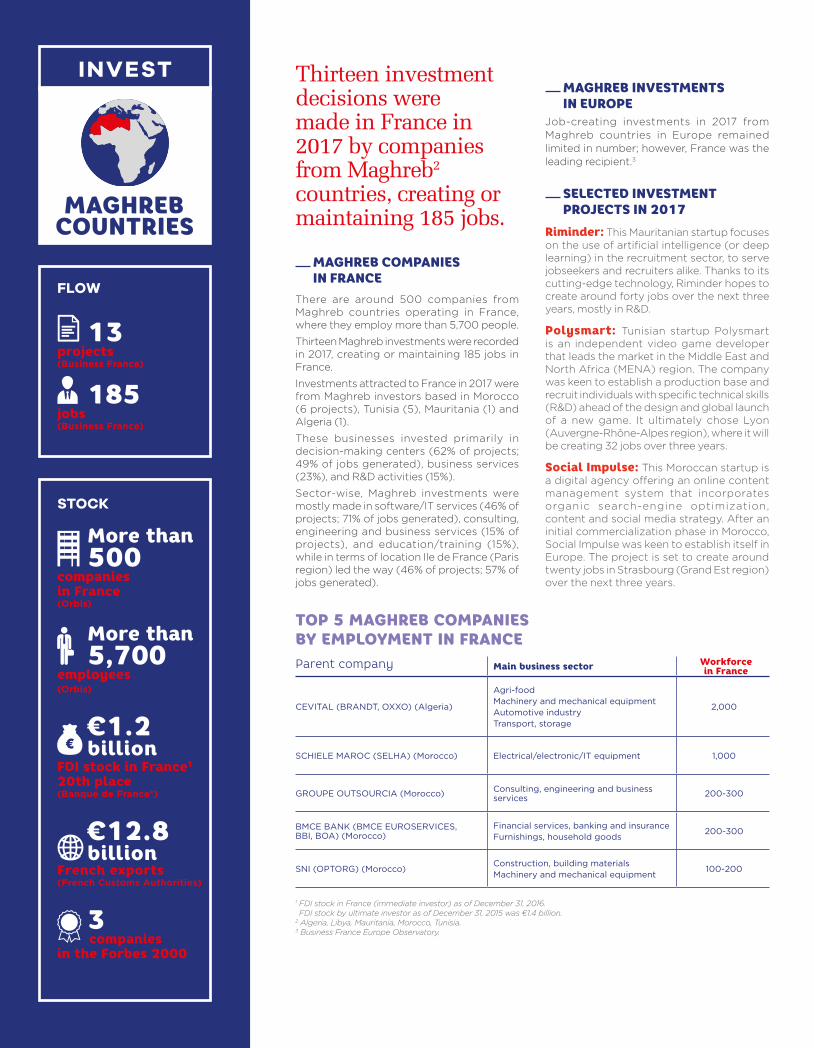
MAGHREB COUNTRIES
INVEST
1 FDI stock in France (immediate investor) as of December 31, 2016. FDI stock by ultimate investor as of December 31, 2015 was €1.4 billion.
2 Algeria, Libya, Mauritania, Morocco, Tunisia.3 Business France Europe Observatory.
Thirteen investment decisions were made in France in 2017 by companies from Maghreb2 countries, creating or maintaining 185 jobs.
MAGHREB COMPANIES IN FRANCE
There are around 500 companies from Maghreb countries operating in France, where they employ more than 5,700 people.
Thirteen Maghreb investments were recorded in 2017, creating or maintaining 185 jobs in France.
Investments attracted to France in 2017 were from Maghreb investors based in Morocco (6 projects), Tunisia (5), Mauritania (1) and Algeria (1).
These businesses invested primarily in decision-making centers (62% of projects; 49% of jobs generated), business services (23%), and R&D activities (15%).
Sector-wise, Maghreb investments were mostly made in software/IT services (46% of projects; 71% of jobs generated), consulting, engineering and business services (15% of projects), and education/training (15%), while in terms of location Ile de France (Paris region) led the way (46% of projects; 57% of jobs generated).
MAGHREB INVESTMENTS IN EUROPE
Job-creating investments in 2017 from Maghreb countries in Europe remained limited in number; however, France was the leading recipient.3
SELECTED INVESTMENT PROJECTS IN 2017
Riminder: This Mauritanian startup focuses on the use of artificial intelligence (or deep learning) in the recruitment sector, to serve jobseekers and recruiters alike. Thanks to its cutting-edge technology, Riminder hopes to create around forty jobs over the next three years, mostly in R&D.
Polysmart: Tunisian startup Polysmart is an independent video game developer that leads the market in the Middle East and North Africa (MENA) region. The company was keen to establish a production base and recruit individuals with specific technical skills (R&D) ahead of the design and global launch of a new game. It ultimately chose Lyon (Auvergne-Rhône-Alpes region), where it will be creating 32 jobs over three years.
Social Impulse: This Moroccan startup is a digital agency offering an online content management system that incorporates organic search-engine optimization, content and social media strategy. After an initial commercialization phase in Morocco, Social Impulse was keen to establish itself in Europe. The project is set to create around twenty jobs in Strasbourg (Grand Est region) over the next three years.
Parent company Main business sector Workforce in France
CEVITAL (BRANDT, OXXO) (Algeria)
Agri-foodMachinery and mechanical equipmentAutomotive industryTransport, storage
2,000
SCHIELE MAROC (SELHA) (Morocco) Electrical/electronic/IT equipment 1,000
GROUPE OUTSOURCIA (Morocco) Consulting, engineering and business services 200-300
BMCE BANK (BMCE EUROSERVICES, BBI, BOA) (Morocco)
Financial services, banking and insuranceFurnishings, household goods
200-300
SNI (OPTORG) (Morocco)Construction, building materialsMachinery and mechanical equipment
100-200
TOP 5 MAGHREB COMPANIES BY EMPLOYMENT IN FRANCE
FLOW
13projects (Business France)
185jobs (Business France)
STOCK
More than 500
companies in France (Orbis)
More than5,700
employees (Orbis)
€1.2 billion
FDI stock in France1
20th place (Banque de France*)
€12.8 billion
French exports (French Customs Authorities)
3 companies in the Forbes 2000
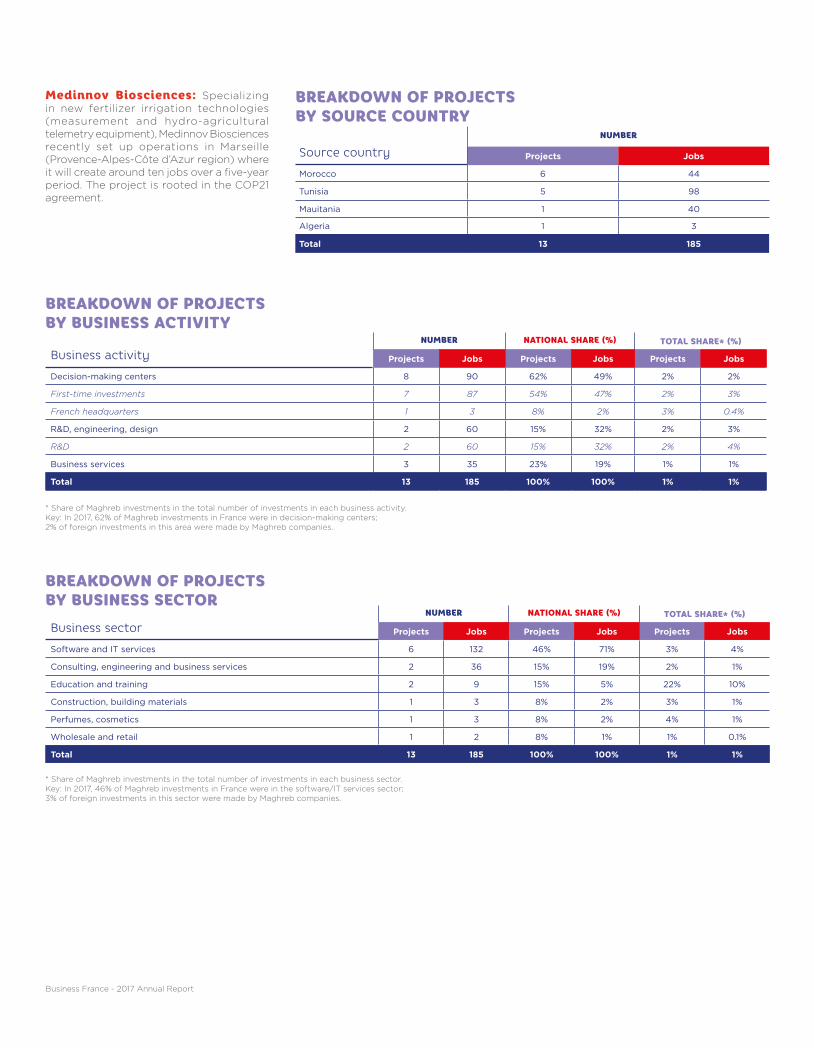
NUMBER
Source country Projects Jobs
Morocco 6 44
Tunisia 5 98
Mauitania 1 40
Algeria 1 3
Total 13 185
* Share of Maghreb investments in the total number of investments in each business activity.Key: In 2017, 62% of Maghreb investments in France were in decision-making centers; 2% of foreign investments in this area were made by Maghreb companies.
* Share of Maghreb investments in the total number of investments in each business sector.Key: In 2017, 46% of Maghreb investments in France were in the software/IT services sector; 3% of foreign investments in this sector were made by Maghreb companies.
BREAKDOWN OF PROJECTS BY BUSINESS ACTIVITY
BREAKDOWN OF PROJECTS BY SOURCE COUNTRY
BREAKDOWN OF PROJECTS BY BUSINESS SECTOR
Medinnov Biosciences: Specializing in new fertilizer irrigation technologies (measurement and hydro-agricultural telemetry equipment), Medinnov Biosciences recently set up operations in Marseille (Provence-Alpes-Côte d’Azur region) where it will create around ten jobs over a five-year period. The project is rooted in the COP21 agreement.
Business activityNUMBER NATIONAL SHARE (%) TOTAL SHARE* (%)
Projects Jobs Projects Jobs Projects Jobs
Decision-making centers 8 90 62% 49% 2% 2%
First-time investments 7 87 54% 47% 2% 3%
French headquarters 1 3 8% 2% 3% 0.4%
R&D, engineering, design 2 60 15% 32% 2% 3%
R&D 2 60 15% 32% 2% 4%
Business services 3 35 23% 19% 1% 1%
Total 13 185 100% 100% 1% 1%
Business sectorNUMBER NATIONAL SHARE (%) TOTAL SHARE* (%)
Projects Jobs Projects Jobs Projects Jobs
Software and IT services 6 132 46% 71% 3% 4%
Consulting, engineering and business services 2 36 15% 19% 2% 1%
Education and training 2 9 15% 5% 22% 10%
Construction, building materials 1 3 8% 2% 3% 1%
Perfumes, cosmetics 1 3 8% 2% 4% 1%
Wholesale and retail 1 2 8% 1% 1% 0.1%
Total 13 185 100% 100% 1% 1%
Business France - 2017 Annual Report
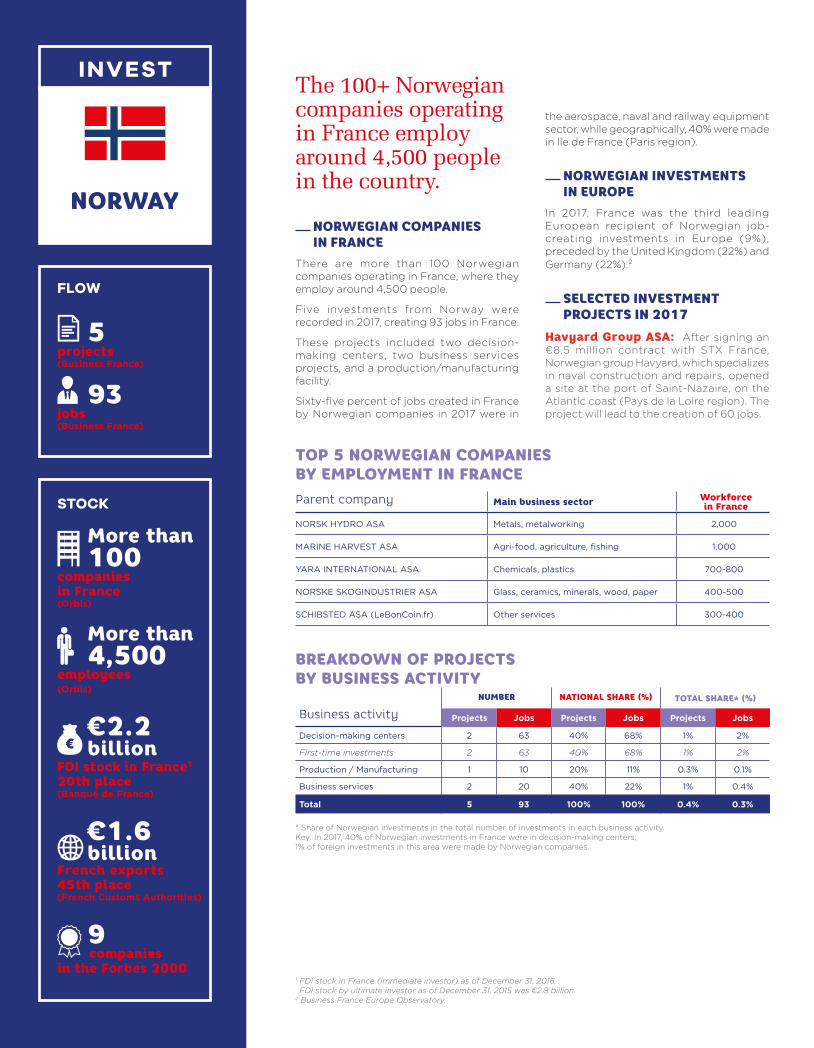
NORWAY
INVESTThe 100+ Norwegian companies operating in France employ around 4,500 people in the country.
NORWEGIAN COMPANIES IN FRANCE
There are more than 100 Norwegian companies operating in France, where they employ around 4,500 people.
Five investments from Norway were recorded in 2017, creating 93 jobs in France.
These projects included two decision-making centers, two business services projects, and a production/manufacturing facility.
Sixty-five percent of jobs created in France by Norwegian companies in 2017 were in
the aerospace, naval and railway equipment sector, while geographically, 40% were made in Ile de France (Paris region).
NORWEGIAN INVESTMENTS IN EUROPE
In 2017, France was the third leading European recipient of Norwegian job-creating investments in Europe (9%), preceded by the United Kingdom (22%) and Germany (22%).²
SELECTED INVESTMENT PROJECTS IN 2017
Havyard Group ASA: After signing an €8.5 million contract with STX France, Norwegian group Havyard, which specializes in naval construction and repairs, opened a site at the port of Saint-Nazaire, on the Atlantic coast (Pays de la Loire region). The project will lead to the creation of 60 jobs.
Parent company Main business sector Workforce in France
NORSK HYDRO ASA Metals, metalworking 2,000
MARINE HARVEST ASA Agri-food, agriculture, fishing 1,000
YARA INTERNATIONAL ASA Chemicals, plastics 700-800
NORSKE SKOGINDUSTRIER ASA Glass, ceramics, minerals, wood, paper 400-500
SCHIBSTED ASA (LeBonCoin.fr) Other services 300-400
TOP 5 NORWEGIAN COMPANIES BY EMPLOYMENT IN FRANCE
NUMBER NATIONAL SHARE (%) TOTAL SHARE* (%)
Business activity Projects Jobs Projects Jobs Projects Jobs
Decision-making centers 2 63 40% 68% 1% 2%
First-time investments 2 63 40% 68% 1% 2%
Production / Manufacturing 1 10 20% 11% 0.3% 0.1%
Business services 2 20 40% 22% 1% 0.4%
Total 5 93 100% 100% 0.4% 0.3%
BREAKDOWN OF PROJECTS BY BUSINESS ACTIVITY
1 FDI stock in France (immediate investor) as of December 31, 2016. FDI stock by ultimate investor as of December 31, 2015 was €2.8 billion.
2 Business France Europe Observatory.
* Share of Norwegian investments in the total number of investments in each business activity.Key: In 2017, 40% of Norwegian investments in France were in decision-making centers; 1% of foreign investments in this area were made by Norwegian companies.
FLOW
5projects (Business France)
93jobs (Business France)
STOCK
More than 100
companies in France (Orbis)
More than4,500
employees (Orbis)
€2.2 billion
FDI stock in France1
20th place (Banque de France)
€1.6 billion
French exports 45th place(French Customs Authorities)
9 companies in the Forbes 2000
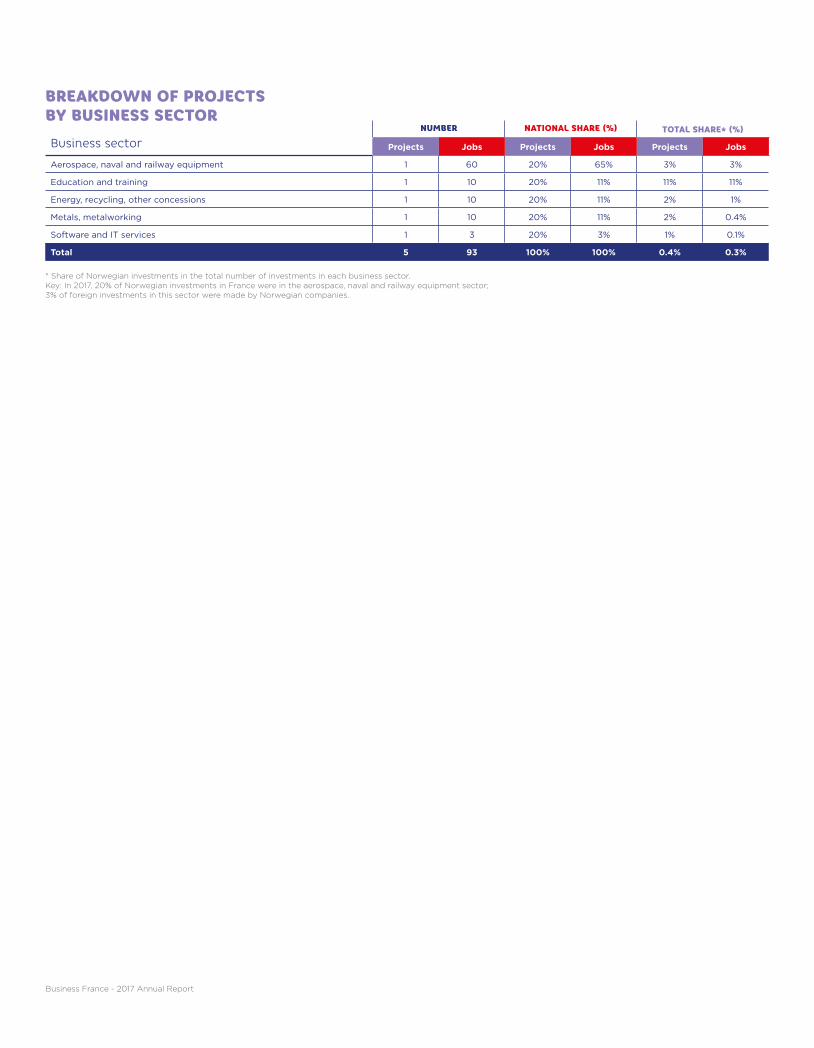
* Share of Norwegian investments in the total number of investments in each business sector.Key: In 2017, 20% of Norwegian investments in France were in the aerospace, naval and railway equipment sector; 3% of foreign investments in this sector were made by Norwegian companies.
Business sectorNUMBER NATIONAL SHARE (%) TOTAL SHARE* (%)
Projects Jobs Projects Jobs Projects Jobs
Aerospace, naval and railway equipment 1 60 20% 65% 3% 3%
Education and training 1 10 20% 11% 11% 11%
Energy, recycling, other concessions 1 10 20% 11% 2% 1%
Metals, metalworking 1 10 20% 11% 2% 0.4%
Software and IT services 1 3 20% 3% 1% 0.1%
Total 5 93 100% 100% 0.4% 0.3%
BREAKDOWN OF PROJECTS BY BUSINESS SECTOR
Business France - 2017 Annual Report

NETHERLANDS
INVEST
1 FDI stock in France (immediate investor) as of December 31, 2016. FDI stock by ultimate investor as of December 31, 2015 was €44.9 billion.
2 Business France Europe Observatory.
There were more than 50 Dutch investments in France in 2017, a rise of 47%. These projects created or maintained nearly 1,500 jobs (+87%).
DUTCH COMPANIES IN FRANCE
There are more than 2,300 Dutch companies operating in France, where they employ more than 200,000 people.
Fifty-three Dutch investments were recorded in 2017, creating or maintaining 1,497 jobs.
Investments by Dutch companies were made primarily in retail outlets (38% of projects) and production/manufacturing operations (26%). The latter created or maintained no fewer than 1,130 jobs (75% of all jobs generated by Dutch investment in France), due mostly to Dutch firm Plukon’s acquisition of French poultry producer Duc.
Dutch investments tended to be found in the wholesale/retail sector (34% of projects), as well as agri-food/agriculture/fishing (21% of projects; 60% of jobs generated). In the latter sector, Dutch projects accounted for 38% of jobs created or maintained by foreign investment in France.
Dutch projects were recorded mainly in Ile de France (Paris region) (30% of projects), followed by Occitanie (11%), while 34% of jobs created or maintained by Dutch investment were in the Bourgogne-Franche-Comté region.
DUTCH INVESTMENTS IN EUROPE
In 2017, France was the leading European recipient of job-creating investment from the Netherlands, attracting 21% of Dutch projects in Europe, ahead of the United Kingdom (16%), Germany (also 16%) and Spain (10%).2
SELECTED INVESTMENT PROJECTS IN 2017
Plukon Food Group: Plukon recently took over French group Duc, whose head office is located in Bourgogne (Burgundy). Duc, the fourth largest poultry company in France, operated a number of poultry slaughter and meat processing sites in the Bretagne (Brittany), Occitanie and Ile de France (Paris) regions, before running into financial difficulties. The acquisition and €20 million investment program to modernize these French production facilities enabled Europe’s leading supplier of poultry meat to save nearly 800 jobs.
Parent company Main business sector Workforce in France
RANDSTAD HOLDING Consulting, engineering and business services 11,000-12,000
HEINEKEN Agri-food 4,000-4,500
FACILICOM GROUP Other services 4,000
UNILEVER Agri-food 2,000-3,000
AKZO NOBEL Chemicals, plastics 1,000-2,000
TOP 5 SOUTH AFRICAN COMPANIES BY EMPLOYMENT IN FRANCE
FLOW
53projects (Business France)
1,497jobs (Business France)
STOCK
More than 2,300
companies in France (Eurostat)
More than200,000
employees (Orbis)
€88.2 billion
FDI stock in France1
2nd place (Banque de France)
€16.9 billion
French exports 8th place(French Customs Authorities)
23 companies in the Forbes 2000
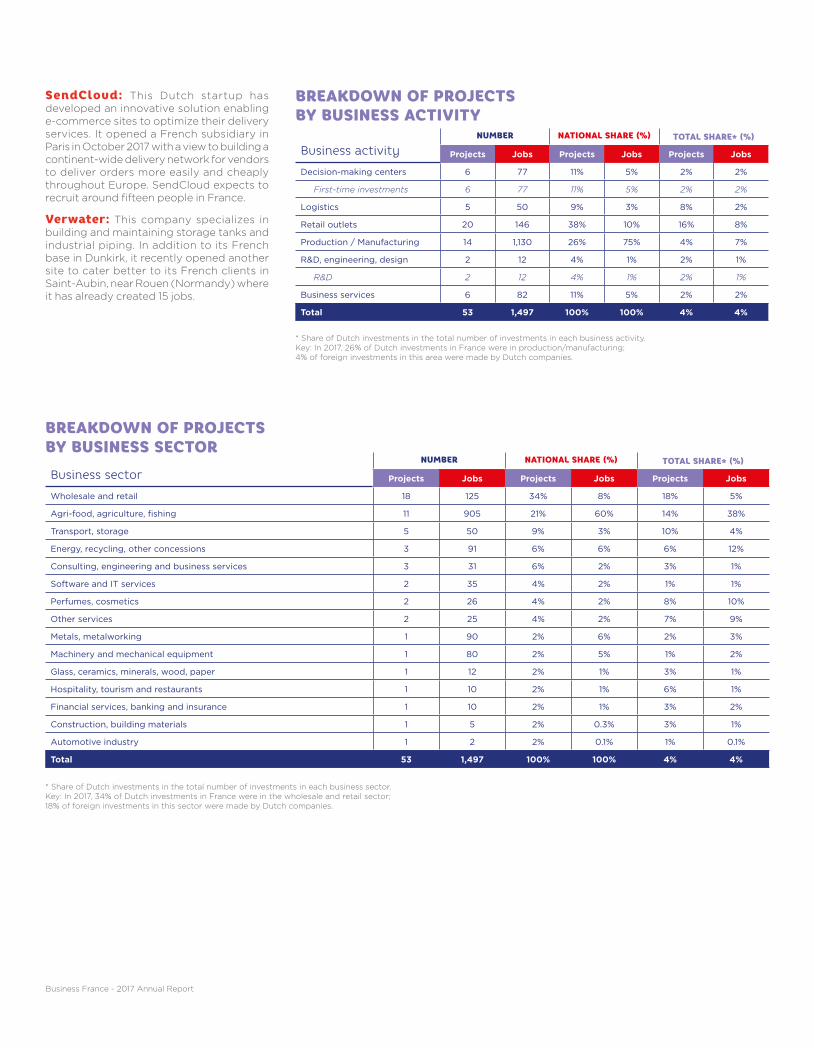
* Share of Dutch investments in the total number of investments in each business activity.Key: In 2017, 26% of Dutch investments in France were in production/manufacturing; 4% of foreign investments in this area were made by Dutch companies.
* Share of Dutch investments in the total number of investments in each business sector.Key: In 2017, 34% of Dutch investments in France were in the wholesale and retail sector; 18% of foreign investments in this sector were made by Dutch companies.
BREAKDOWN OF PROJECTS BY BUSINESS ACTIVITY
BREAKDOWN OF PROJECTS BY BUSINESS SECTOR
SendCloud: This Dutch startup has developed an innovative solution enabling e-commerce sites to optimize their delivery services. It opened a French subsidiary in Paris in October 2017 with a view to building a continent-wide delivery network for vendors to deliver orders more easily and cheaply throughout Europe. SendCloud expects to recruit around fifteen people in France.
Verwater: This company specializes in building and maintaining storage tanks and industrial piping. In addition to its French base in Dunkirk, it recently opened another site to cater better to its French clients in Saint-Aubin, near Rouen (Normandy) where it has already created 15 jobs.
Business activityNUMBER NATIONAL SHARE (%) TOTAL SHARE* (%)
Projects Jobs Projects Jobs Projects Jobs
Decision-making centers 6 77 11% 5% 2% 2%
First-time investments 6 77 11% 5% 2% 2%
Logistics 5 50 9% 3% 8% 2%
Retail outlets 20 146 38% 10% 16% 8%
Production / Manufacturing 14 1,130 26% 75% 4% 7%
R&D, engineering, design 2 12 4% 1% 2% 1%
R&D 2 12 4% 1% 2% 1%
Business services 6 82 11% 5% 2% 2%
Total 53 1,497 100% 100% 4% 4%
Business sectorNUMBER NATIONAL SHARE (%) TOTAL SHARE* (%)
Projects Jobs Projects Jobs Projects Jobs
Wholesale and retail 18 125 34% 8% 18% 5%
Agri-food, agriculture, fishing 11 905 21% 60% 14% 38%
Transport, storage 5 50 9% 3% 10% 4%
Energy, recycling, other concessions 3 91 6% 6% 6% 12%
Consulting, engineering and business services 3 31 6% 2% 3% 1%
Software and IT services 2 35 4% 2% 1% 1%
Perfumes, cosmetics 2 26 4% 2% 8% 10%
Other services 2 25 4% 2% 7% 9%
Metals, metalworking 1 90 2% 6% 2% 3%
Machinery and mechanical equipment 1 80 2% 5% 1% 2%
Glass, ceramics, minerals, wood, paper 1 12 2% 1% 3% 1%
Hospitality, tourism and restaurants 1 10 2% 1% 6% 1%
Financial services, banking and insurance 1 10 2% 1% 3% 2%
Construction, building materials 1 5 2% 0.3% 3% 1%
Automotive industry 1 2 2% 0.1% 1% 0.1%
Total 53 1,497 100% 100% 4% 4%
Business France - 2017 Annual Report

CENTRAL & EASTERN
EUROPE
INVEST
1 FDI stock in France (immediate investor) as of December 31, 2016, excluding Poland.2 Bulgaria, Croatia, Czech Republic, Estonia, Hungary, Latvia, Lithuania, Poland, Romania, Slovakia, Slovenia.3 Business France Europe Observatory.
There were nine investments from CEE2 countries in France in 2017, creating or maintaining 226 jobs.
CENTRAL AND EASTERN EUROPEAN COMPANIES IN FRANCE
There are more than 90 Central and Eastern European companies operating in France, where they employ around 2,700 people.
Nine projects were recorded in France from CEE countries in 2017, creating or maintaining 226 jobs.
Production/manufacturing operations accounted for 33% of investments and 66% of jobs generated by CEE investors, while 78% of all projects were made in manufacturing sectors. Chemicals/plastics made up 22% of projects received and half (49%) of jobs generated.
More than one-third of these projects were located in the Grand Est region (33%).
CENTRAL AND EASTERN EUROPEAN INVESTMENTS IN EUROPE
In 2017, Germany was the leading European recipient of job-creating investment from
Central and Eastern European countries, attracting 19% of their projects in Europe, ahead of France (16%) and Slovakia (also 16%).3
SELECTED INVESTMENT PROJECTS IN 2017
Eco Wipes EWS: This Polish manufacturer of toiletries and home care products acquired the Grand Est-based company Hydra Cosmetics, saving 47 jobs. It now plans to invest to upgrade the facility, with a view to increasing production capacity.
COMARCH SAS: Polish software publisher and IT services provider Comarch SAS invested €8.3 million in Lezennes (Hauts de France region) to build a data center to serve its customers in Western Europe. The investment led to the recruitment of 10 people in 2017, with a further 30 jobs set to be created by the end of 2019.
PLASTIWELL: In June 2017, this Polish plastics processing group specializing in injection molding, thermoforming and thermocompression acquired a French manufacturer of plastic technical components Sotira, based in Meslay-du-Maine (Pays de la Loire region). Plastiwell already has eight factories in France and maintained 90 jobs through this investment.
Parent company Main business sector Workforce in France
PLASTIWELL (Poland) Chemicals, plastics 450-500
MR R. K. KARKOSIK – BORYSZEW (Poland) Chemicals, plastics 150-200
LINET SPOL. S.R.O. (Czech Republic) Medical/surgical equipment, diagnostics and devices 100-120
SYNTHOS SA (Poland) Chemicals, plastics 110
COMARCH SA (Poland) Software and IT services 90
TOP 5 SOUTH AFRICAN COMPANIES BY EMPLOYMENT IN FRANCE
FLOW
9projects (Business France)
226jobs (Business France)
STOCK
More than 90
companies in France (Eurostat)
More than2,700
employees(Eurostat)
€834 million
FDI stock in France1
(Banque de France)
€27.2 billion
French exports (French Customs Authorities)
8 companies in the Forbes 2000
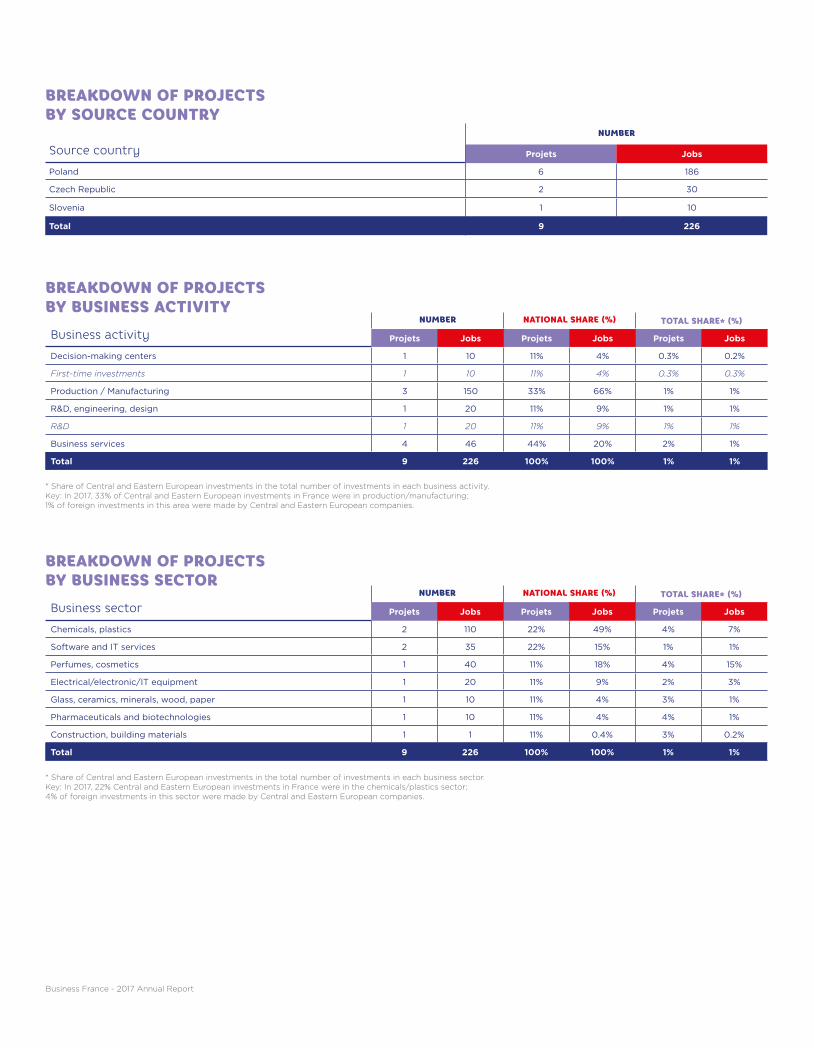
NUMBER
Source country Projets Jobs
Poland 6 186
Czech Republic 2 30
Slovenia 1 10
Total 9 226
* Share of Central and Eastern European investments in the total number of investments in each business activity.Key: In 2017, 33% of Central and Eastern European investments in France were in production/manufacturing; 1% of foreign investments in this area were made by Central and Eastern European companies.
* Share of Central and Eastern European investments in the total number of investments in each business sector.Key: In 2017, 22% Central and Eastern European investments in France were in the chemicals/plastics sector; 4% of foreign investments in this sector were made by Central and Eastern European companies.
BREAKDOWN OF PROJECTS BY BUSINESS ACTIVITY
BREAKDOWN OF PROJECTS BY SOURCE COUNTRY
BREAKDOWN OF PROJECTS BY BUSINESS SECTOR
Business activityNUMBER NATIONAL SHARE (%) TOTAL SHARE* (%)
Projets Jobs Projets Jobs Projets Jobs
Decision-making centers 1 10 11% 4% 0.3% 0.2%
First-time investments 1 10 11% 4% 0.3% 0.3%
Production / Manufacturing 3 150 33% 66% 1% 1%
R&D, engineering, design 1 20 11% 9% 1% 1%
R&D 1 20 11% 9% 1% 1%
Business services 4 46 44% 20% 2% 1%
Total 9 226 100% 100% 1% 1%
Business sectorNUMBER NATIONAL SHARE (%) TOTAL SHARE* (%)
Projets Jobs Projets Jobs Projets Jobs
Chemicals, plastics 2 110 22% 49% 4% 7%
Software and IT services 2 35 22% 15% 1% 1%
Perfumes, cosmetics 1 40 11% 18% 4% 15%
Electrical/electronic/IT equipment 1 20 11% 9% 2% 3%
Glass, ceramics, minerals, wood, paper 1 10 11% 4% 3% 1%
Pharmaceuticals and biotechnologies 1 10 11% 4% 4% 1%
Construction, building materials 1 1 11% 0.4% 3% 0.2%
Total 9 226 100% 100% 1% 1%
Business France - 2017 Annual Report

1 FDI stock in France (immediate investor) as of December 31, 2016. FDI stock by ultimate investor as of December 31, 2015 was €9.2 billion..2 Bahrain, Egypt, Iran, Iraq, Jordan, Kuwait, Lebanon, Oman, Qatar, Saudi Arabia, Syria, United Arab Emirates.3 Business France Europe Observatory.
Eight job-creating investment decisions were made in France in 2017 by companies from countries in the Middle East2, creating or maintaining 91 jobs.
MIDDLE EAST COMPANIES IN FRANCE
There are around 300 companies from Middle East countries operating in France, where they employ more than 24,000 people.
Eight job-creating investment decisions in France from Middle East countries were recorded in 2017, creating or maintaining nearly a hundred jobs.
These investments came from Egypt (3 projects), the United Arab Emirates (3), Qatar (1) and Iran (1).
More than half (63%) of these projects involved decision-making centers (all first-time investments), accounting for 49% of jobs generated by Middle East investment.
Investments by Middle East countries were made in a total of seven sectors, with two projects in agri-food, while they were mostly located in Auvergne-Rhône-Alpes (2 projects), Provence-Alpes-Côte d’Azur (2) and Ile de France (Paris region) (2).
MIDDLE EAST INVESTMENTS IN EUROPE
In 2017, Spain was the largest European recipient of job-creating investment from Middle East countries, attracting 21% of their projects in Europe, followed by the United Kingdom (18%), France (11%), and Germany, the Netherlands and Portugal (all 11%).3
SELECTED INVESTMENT PROJECTS IN 2017
Dubai Port World: DP World subsidiary P&O Ports announced a €30 million investment in partnership with the commercial port of Sète, in southern France (Occitanie region) for the creation of a container terminal, generating 30 jobs. Other plans currently being considered for the port of Sète include running a fruit terminal and expanding the marina in partnership with a leading name in the sector.
BCC Egypt: The Egyptian Best Cheese Company (BCC) is expanding internationally through a franchise agreement. It is currently opening its first European base in the form of a pizza dough and ingredients production laboratory in the greater Lyon area (Auvergne-Rhône-Alpes region). This will be followed by the gradual opening of between six and ten restaurants in the south of France, as part of the American pizza chain Papa John’s. The company’s investment is expected to create 30 jobs initially.
Parent company Main business sector Workforce in France
AL MANNAI CORPORATION (GFI INFORMATIQUE) (Qatar)
Financial services, banking and insuranceSoftware and IT services
9,000-10,000
MERIT CORPORATION (J. SAADE) (CMA CGM) (Lebanon) Transport, storage 4,000-5,000
DIVINE INVESTMENTS (PRINTEMPS) (Qatar)
Financial services, banking and insuranceWholesale and retail
3,000
CONSTELLATION HOTELS (HYATT) (Qatar) Hospitality 1,000-1,500
KATARA HOSPITALITY (PENINSULA) (Qatar) Hospitality 1,000-1,500
INVEST
MIDDLE EAST
FLOW
8projects (Business France)
91jobs (Business France)
STOCK
More than300
companies in France (Orbis)
More than24,000
employees (Orbis)
€8.5 billion
FDI stock in France1 (Banque de France)
€15.6 billion
French exports (French Customs Authorities)
49 companies in the Forbes 2000
TOP 5 MIDDLE EAST COMPANIES BY EMPLOYMENT IN FRANCE
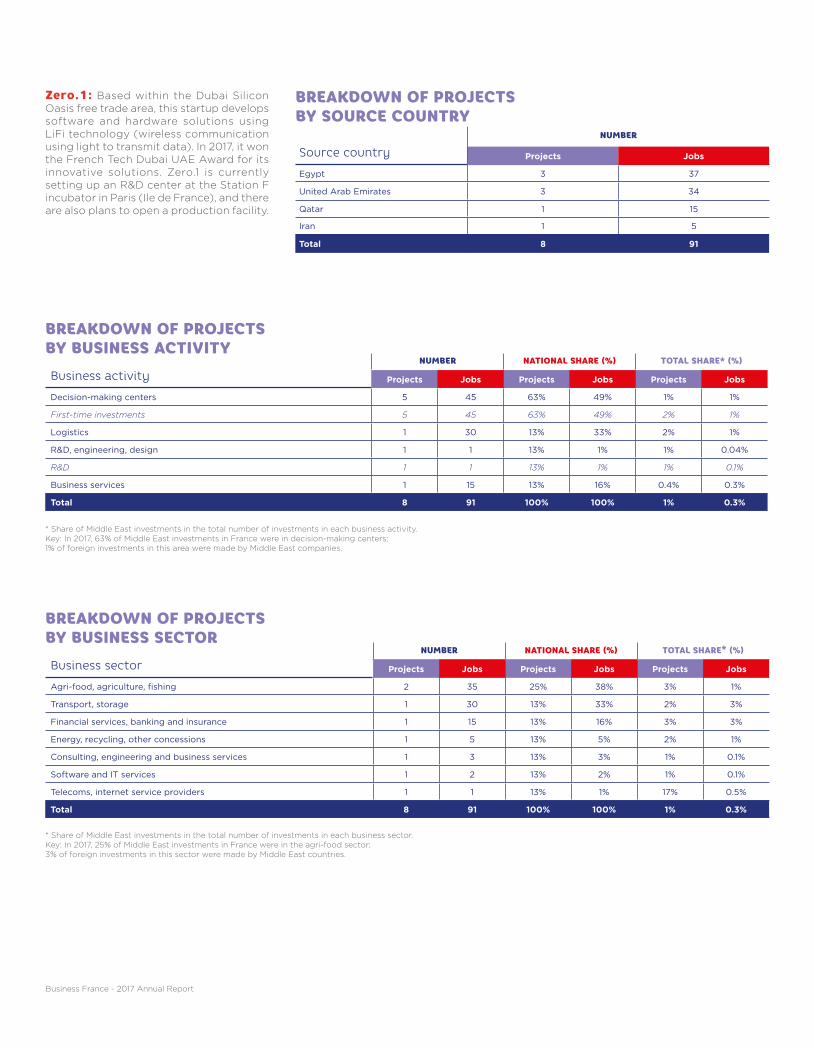
* Share of Middle East investments in the total number of investments in each business activity.Key: In 2017, 63% of Middle East investments in France were in decision-making centers; 1% of foreign investments in this area were made by Middle East companies.
BREAKDOWN OF PROJECTS BY BUSINESS ACTIVITY
Business activityNUMBER NATIONAL SHARE (%) TOTAL SHARE* (%)
Projects Jobs Projects Jobs Projects Jobs
Decision-making centers 5 45 63% 49% 1% 1%
First-time investments 5 45 63% 49% 2% 1%
Logistics 1 30 13% 33% 2% 1%
R&D, engineering, design 1 1 13% 1% 1% 0.04%
R&D 1 1 13% 1% 1% 0.1%
Business services 1 15 13% 16% 0.4% 0.3%
Total 8 91 100% 100% 1% 0.3%
NUMBER
Source country Projects Jobs
Egypt 3 37
United Arab Emirates 3 34
Qatar 1 15
Iran 1 5
Total 8 91
BREAKDOWN OF PROJECTS BY SOURCE COUNTRY
Zero.1: Based within the Dubai Silicon Oasis free trade area, this startup develops software and hardware solutions using LiFi technology (wireless communication using light to transmit data). In 2017, it won the French Tech Dubai UAE Award for its innovative solutions. Zero.1 is currently setting up an R&D center at the Station F incubator in Paris (Ile de France), and there are also plans to open a production facility.
* Share of Middle East investments in the total number of investments in each business sector.Key: In 2017, 25% of Middle East investments in France were in the agri-food sector; 3% of foreign investments in this sector were made by Middle East countries.
BREAKDOWN OF PROJECTS BY BUSINESS SECTOR
Business sectorNUMBER NATIONAL SHARE (%) TOTAL SHARE* (%)
Projects Jobs Projects Jobs Projects Jobs
Agri-food, agriculture, fishing 2 35 25% 38% 3% 1%
Transport, storage 1 30 13% 33% 2% 3%
Financial services, banking and insurance 1 15 13% 16% 3% 3%
Energy, recycling, other concessions 1 5 13% 5% 2% 1%
Consulting, engineering and business services 1 3 13% 3% 1% 0.1%
Software and IT services 1 2 13% 2% 1% 0.1%
Telecoms, internet service providers 1 1 13% 1% 17% 0.5%
Total 8 91 100% 100% 1% 0.3%
Business France - 2017 Annual Report

PORTUGAL
INVESTOver 200 Portuguese companies operate in France, where they employ around 5,600 people.
PORTUGUESE COMPANIES IN FRANCE
There are over 200 Portuguese companies operating in France, where they employ more than 5,600 people.
Eight Portuguese investments were recorded in France in 2017, creating or maintaining 118 jobs.
Half of all Portuguese projects involved production/manufacturing operations, while sector-wise, 25% were in construction/building materials, with another 25% in glass, ceramics, minerals, wood and paper.
Auvergne-Rhône-Alpes and Hauts de France were the leading destinations for Portuguese investments in 2017, each attracting a quarter of all projects.
PORTUGUESE INVESTMENTS IN EUROPE
In 2017, Germany was the leading European recipient of job-creating investment from Portugal, attracting 40% of Portuguese projects in Europe.²
SELECTED INVESTMENT PROJECTS IN 2017
Grupo Proef: This engineering firm, which builds electricity and telecommunications networks, set up operations in Saint-Priest (Auvergne-Rhône-Alpes region). Already well established in Ile de France (Paris region), the company is now expanding in the south of France, with plans to increase French revenues from €11 million to €40 million by 2020. The project will lead to the creation of 40 jobs.
Vigobloco: This Portuguese firm specializes in producing prefabricated concrete structures. VGB France, its French subsidiary, was founded in the Bourgogne-Franche-Comté region in 2015 and recently secured two contracts in France worth a total of €8 million in partnership with its parent company. VGB France currently employs nearly forty people in the country and plans to recruit and train additional personnel over the next two years.
Parent company Main business sector Workforce in France
GRUPO VISABEIRA (CONSTRUCTEL) Telecoms, internet service providers 1,000-1,200
INAPA - INVESTIMENTOS, PARTICIPAÇOES E GESTAO, S.A. Wholesale and retail 200-300
SIMOLDES PLASTICOS Chemicals, plastics 200-250
FUNDO DE RESOLUÇÃO (BANQUE ESPIRITO SANTO) Financial services, banking and insurance 150-200
AMORIM GROUPAgri-food, agriculture, fishingGlass, wood, paper
150
1 FDI stock in France (immediate investor) as of December 31, 2016. FDI stock by ultimate investor as of December 31, 2015 was €947 million.2 Business France Europe Observatory.
FLOW
8projects (Business France)
118jobs (Business France)
STOCK
More than200
companies in France (Eurostat)
More than5,600
employees (Eurostat)
€1.2 billion
FDI stock in France1
23rd place (Banque de France)
€4.8 billion
French exports 19th place(French Customs Authorities)
5 companies in the Forbes 2000
TOP 5 PORTUGUESE COMPANIES BY EMPLOYMENT IN FRANCE
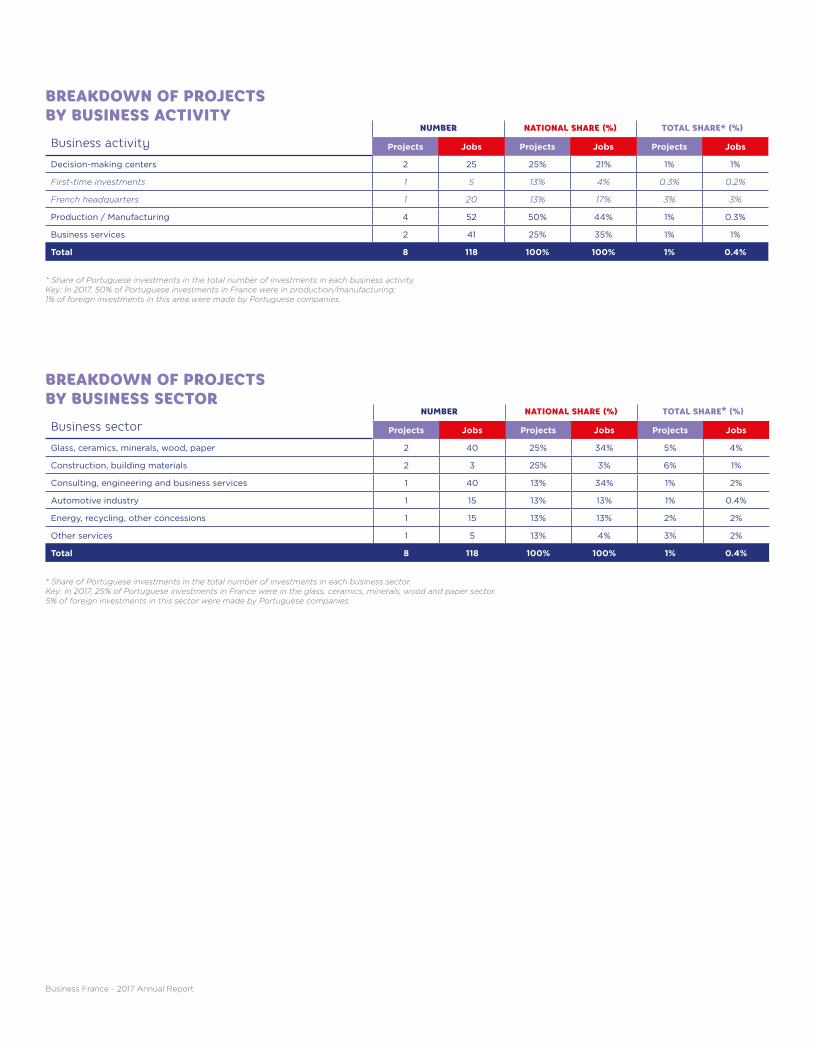
BREAKDOWN OF PROJECTS BY BUSINESS SECTOR
BREAKDOWN OF PROJECTS BY BUSINESS ACTIVITY
* Share of Portuguese investments in the total number of investments in each business activity. Key: In 2017, 50% of Portuguese investments in France were in production/manufacturing; 1% of foreign investments in this area were made by Portuguese companies.
* Share of Portuguese investments in the total number of investments in each business sector.Key: In 2017, 25% of Portuguese investments in France were in the glass, ceramics, minerals, wood and paper sector. 5% of foreign investments in this sector were made by Portuguese companies.
Business activityNUMBER NATIONAL SHARE (%) TOTAL SHARE* (%)
Projects Jobs Projects Jobs Projects Jobs
Decision-making centers 2 25 25% 21% 1% 1%
First-time investments 1 5 13% 4% 0.3% 0.2%
French headquarters 1 20 13% 17% 3% 3%
Production / Manufacturing 4 52 50% 44% 1% 0.3%
Business services 2 41 25% 35% 1% 1%
Total 8 118 100% 100% 1% 0.4%
Business sectorNUMBER NATIONAL SHARE (%) TOTAL SHARE* (%)
Projects Jobs Projects Jobs Projects Jobs
Glass, ceramics, minerals, wood, paper 2 40 25% 34% 5% 4%
Construction, building materials 2 3 25% 3% 6% 1%
Consulting, engineering and business services 1 40 13% 34% 1% 2%
Automotive industry 1 15 13% 13% 1% 0.4%
Energy, recycling, other concessions 1 15 13% 13% 2% 2%
Other services 1 5 13% 4% 3% 2%
Total 8 118 100% 100% 1% 0.4%
Business France - 2017 Annual Report
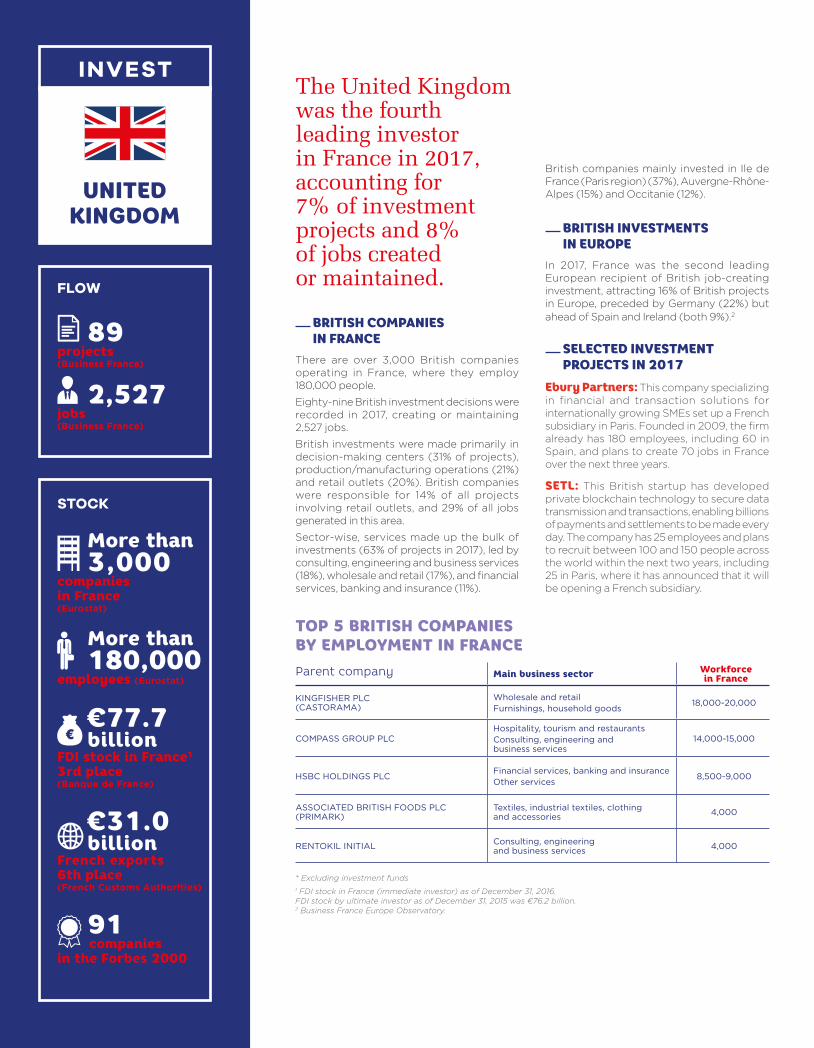
UNITEDKINGDOM
INVEST
* Excluding investment funds 1 FDI stock in France (immediate investor) as of December 31, 2016.FDI stock by ultimate investor as of December 31, 2015 was €76.2 billion.2 Business France Europe Observatory.
The United Kingdom was the fourth leading investor in France in 2017, accounting for 7% of investment projects and 8% of jobs created or maintained.
BRITISH COMPANIES IN FRANCE
There are over 3,000 British companies operating in France, where they employ 180,000 people.
Eighty-nine British investment decisions were recorded in 2017, creating or maintaining 2,527 jobs.
British investments were made primarily in decision-making centers (31% of projects), production/manufacturing operations (21%) and retail outlets (20%). British companies were responsible for 14% of all projects involving retail outlets, and 29% of all jobs generated in this area.
Sector-wise, services made up the bulk of investments (63% of projects in 2017), led by consulting, engineering and business services (18%), wholesale and retail (17%), and financial services, banking and insurance (11%).
British companies mainly invested in Ile de France (Paris region) (37%), Auvergne-Rhône-Alpes (15%) and Occitanie (12%).
BRITISH INVESTMENTS IN EUROPE
In 2017, France was the second leading European recipient of British job-creating investment, attracting 16% of British projects in Europe, preceded by Germany (22%) but ahead of Spain and Ireland (both 9%).2
SELECTED INVESTMENT PROJECTS IN 2017
Ebury Partners: This company specializing in financial and transaction solutions for internationally growing SMEs set up a French subsidiary in Paris. Founded in 2009, the firm already has 180 employees, including 60 in Spain, and plans to create 70 jobs in France over the next three years.
SETL: This British startup has developed private blockchain technology to secure data transmission and transactions, enabling billions of payments and settlements to be made every day. The company has 25 employees and plans to recruit between 100 and 150 people across the world within the next two years, including 25 in Paris, where it has announced that it will be opening a French subsidiary.
Parent company Main business sector Workforce in France
KINGFISHER PLC (CASTORAMA)
Wholesale and retailFurnishings, household goods
18,000-20,000
COMPASS GROUP PLCHospitality, tourism and restaurantsConsulting, engineering and business services
14,000-15,000
HSBC HOLDINGS PLCFinancial services, banking and insuranceOther services
8,500-9,000
ASSOCIATED BRITISH FOODS PLC (PRIMARK)
Textiles, industrial textiles, clothing and accessories 4,000
RENTOKIL INITIAL Consulting, engineering and business services 4,000
FLOW
89projects (Business France)
2,527jobs (Business France)
STOCK
More than3,000
companies in France (Eurostat)
More than180,000
employees (Eurostat)
€77.7 billion
FDI stock in France1
3rd place (Banque de France)
€31.0 billion
French exports 6th place(French Customs Authorities)
91 companies in the Forbes 2000
TOP 5 BRITISH COMPANIES BY EMPLOYMENT IN FRANCE
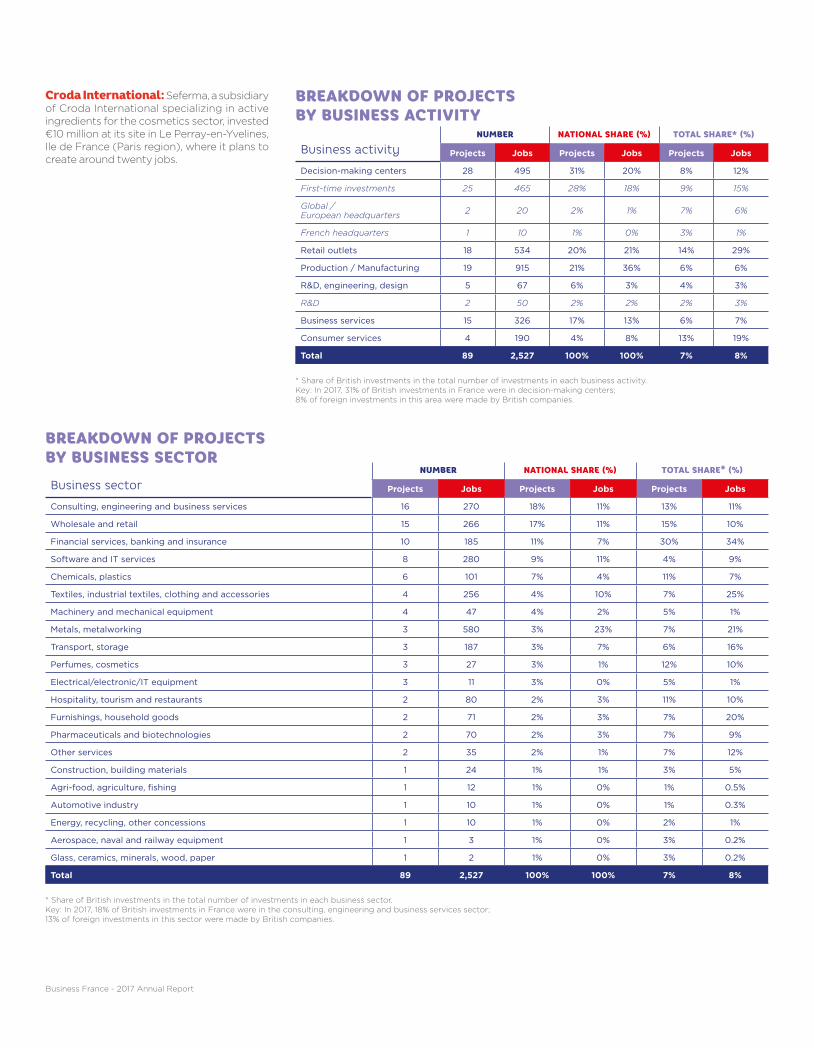
* Share of British investments in the total number of investments in each business activity.Key: In 2017, 31% of British investments in France were in decision-making centers; 8% of foreign investments in this area were made by British companies.
* Share of British investments in the total number of investments in each business sector.Key: In 2017, 18% of British investments in France were in the consulting, engineering and business services sector; 13% of foreign investments in this sector were made by British companies.
BREAKDOWN OF PROJECTS BY BUSINESS ACTIVITY
BREAKDOWN OF PROJECTS BY BUSINESS SECTOR
Croda International: Seferma, a subsidiary of Croda International specializing in active ingredients for the cosmetics sector, invested €10 million at its site in Le Perray-en-Yvelines, Ile de France (Paris region), where it plans to create around twenty jobs.
Business activityNUMBER NATIONAL SHARE (%) TOTAL SHARE* (%)
Projects Jobs Projects Jobs Projects Jobs
Decision-making centers 28 495 31% 20% 8% 12%
First-time investments 25 465 28% 18% 9% 15%
Global / European headquarters 2 20 2% 1% 7% 6%
French headquarters 1 10 1% 0% 3% 1%
Retail outlets 18 534 20% 21% 14% 29%
Production / Manufacturing 19 915 21% 36% 6% 6%
R&D, engineering, design 5 67 6% 3% 4% 3%
R&D 2 50 2% 2% 2% 3%
Business services 15 326 17% 13% 6% 7%
Consumer services 4 190 4% 8% 13% 19%
Total 89 2,527 100% 100% 7% 8%
Business sectorNUMBER NATIONAL SHARE (%) TOTAL SHARE* (%)
Projects Jobs Projects Jobs Projects Jobs
Consulting, engineering and business services 16 270 18% 11% 13% 11%
Wholesale and retail 15 266 17% 11% 15% 10%
Financial services, banking and insurance 10 185 11% 7% 30% 34%
Software and IT services 8 280 9% 11% 4% 9%
Chemicals, plastics 6 101 7% 4% 11% 7%
Textiles, industrial textiles, clothing and accessories 4 256 4% 10% 7% 25%
Machinery and mechanical equipment 4 47 4% 2% 5% 1%
Metals, metalworking 3 580 3% 23% 7% 21%
Transport, storage 3 187 3% 7% 6% 16%
Perfumes, cosmetics 3 27 3% 1% 12% 10%
Electrical/electronic/IT equipment 3 11 3% 0% 5% 1%
Hospitality, tourism and restaurants 2 80 2% 3% 11% 10%
Furnishings, household goods 2 71 2% 3% 7% 20%
Pharmaceuticals and biotechnologies 2 70 2% 3% 7% 9%
Other services 2 35 2% 1% 7% 12%
Construction, building materials 1 24 1% 1% 3% 5%
Agri-food, agriculture, fishing 1 12 1% 0% 1% 0.5%
Automotive industry 1 10 1% 0% 1% 0.3%
Energy, recycling, other concessions 1 10 1% 0% 2% 1%
Aerospace, naval and railway equipment 1 3 1% 0% 3% 0.2%
Glass, ceramics, minerals, wood, paper 1 2 1% 0% 3% 0.2%
Total 89 2,527 100% 100% 7% 8%
Business France - 2017 Annual Report

Five new Russian companies invested in France in 2017.
RUSSIAN COMPANIES IN FRANCE
There are 80 Russian companies operating in France, where they employ more than 4,500 people.
Six investments from Russia were recorded in 2017, creating 35 jobs, including five first-time investments in France and a production/manufacturing project.
Five of these six were in manufacturing sectors, while location-wise, Ile de France (Paris region) and Provence-Alpes-Côte d’Azur both attracted a third of all Russian investments, with the remainder being made in Auvergne-Rhône-Alpes and Nouvelle Aquitaine.
RUSSIAN INVESTMENTS IN EUROPE
In 2017, France was the second leading European recipient of job-creating projects from Russia, attracting 20% of all Russian projects in Europe, preceded by Germany (27%).3
SELECTED INVESTMENT PROJECTS IN 2017
Zaba: This tech startup develops connected sensors for industry that collect information such as temperature, pressure and fluid consumption. In 2017, it decided to set up operations in Nice (Provence-Alpes-Côte d’Azur region) with an investment that will generate around ten jobs over the next three years.
Ilgiz Fazulzyanov: Founded in 1992, luxury jeweler ILGIZ F specializes in working with hot enamel to make art jewelry for collectors. In 2017, the company decided to set up a subsidiary in Paris, marking the first phase of its international development strategy.
Fijie: Founded in 1998, Fijie’s laboratories specialize in searching for innovative solutions in the field of anti-aging and cosmetic medicine. The company has now opened its first European subsidiary in Paris to market its products in Europe, creating five jobs.
Parent company Main business sector Workforce in France
RZD - CHEMINS DE FER RUSSE (GEFCO) Transport, storage 3,500-4,000
KASPERSKY LAB Software and IT services 50-100
MR T. GORYAYEV (SPIRIT FRANCE) Agri-food 50-100
ICC (CHOCOLATERIE DE PROVENCE) Agri-food 50-100
GAZPROM MARKETING & TRADING FRANCE Financial services 20-50
RUSSIA
INVEST
FLOW
6projects (Business France)
35jobs (Business France)
STOCK
80companies in France1
(Business France, Moscow)
More than4,500
employees (Orbis)
€1.8 billion
FDI stock in France2
21st place (Banque de France)
€5.6 billion
French exports 14th place(French Customs Authorities)
27 companies in the Forbes 2000
TOP 5 RUSSIAN COMPANIES BY EMPLOYMENT IN FRANCE
1 Business France Moscow office figures.2 FDI stock in France (immediate investor) as of December 31, 2016.
FDI stock by ultimate investor as of December 31, 2015 was €2.1 billion.3 Business France Europe Observatory.
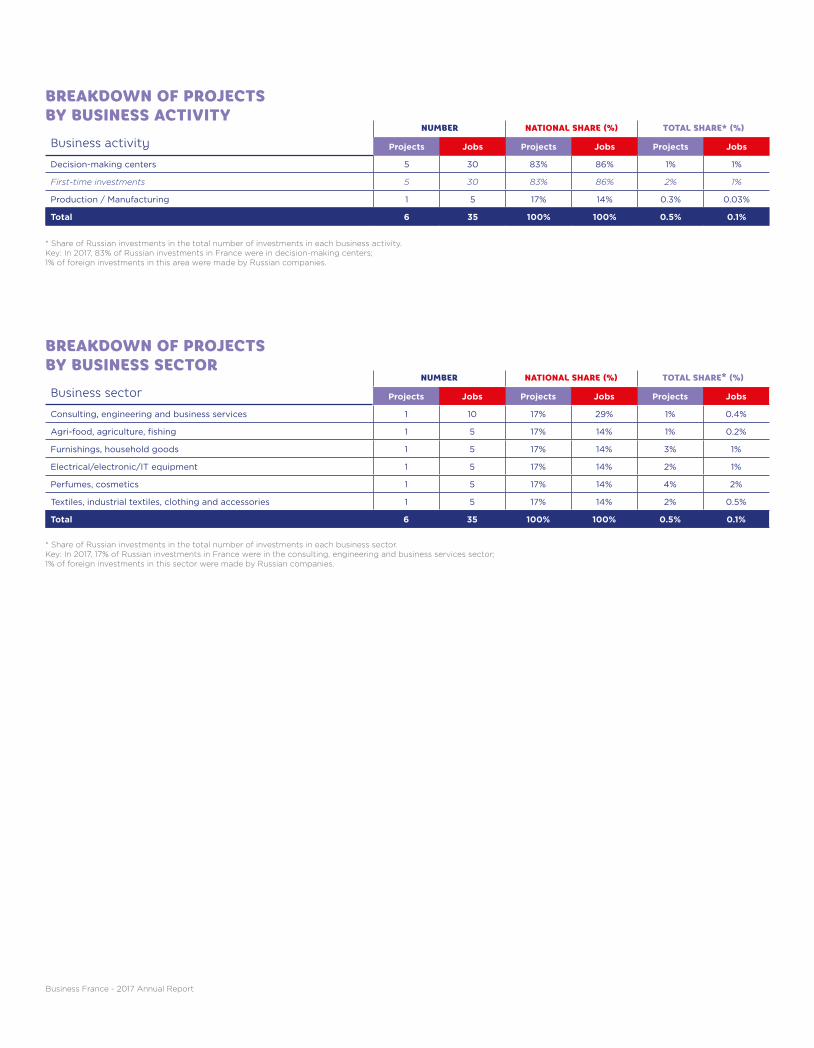
* Share of Russian investments in the total number of investments in each business activity.Key: In 2017, 83% of Russian investments in France were in decision-making centers; 1% of foreign investments in this area were made by Russian companies.
* Share of Russian investments in the total number of investments in each business sector.Key: In 2017, 17% of Russian investments in France were in the consulting, engineering and business services sector; 1% of foreign investments in this sector were made by Russian companies.
BREAKDOWN OF PROJECTS BY BUSINESS ACTIVITY
BREAKDOWN OF PROJECTS BY BUSINESS SECTOR
Business activityNUMBER NATIONAL SHARE (%) TOTAL SHARE* (%)
Projects Jobs Projects Jobs Projects Jobs
Decision-making centers 5 30 83% 86% 1% 1%
First-time investments 5 30 83% 86% 2% 1%
Production / Manufacturing 1 5 17% 14% 0.3% 0.03%
Total 6 35 100% 100% 0.5% 0.1%
Business sectorNUMBER NATIONAL SHARE (%) TOTAL SHARE* (%)
Projects Jobs Projects Jobs Projects Jobs
Consulting, engineering and business services 1 10 17% 29% 1% 0.4%
Agri-food, agriculture, fishing 1 5 17% 14% 1% 0.2%
Furnishings, household goods 1 5 17% 14% 3% 1%
Electrical/electronic/IT equipment 1 5 17% 14% 2% 1%
Perfumes, cosmetics 1 5 17% 14% 4% 2%
Textiles, industrial textiles, clothing and accessories 1 5 17% 14% 2% 0.5%
Total 6 35 100% 100% 0.5% 0.1%
Business France - 2017 Annual Report
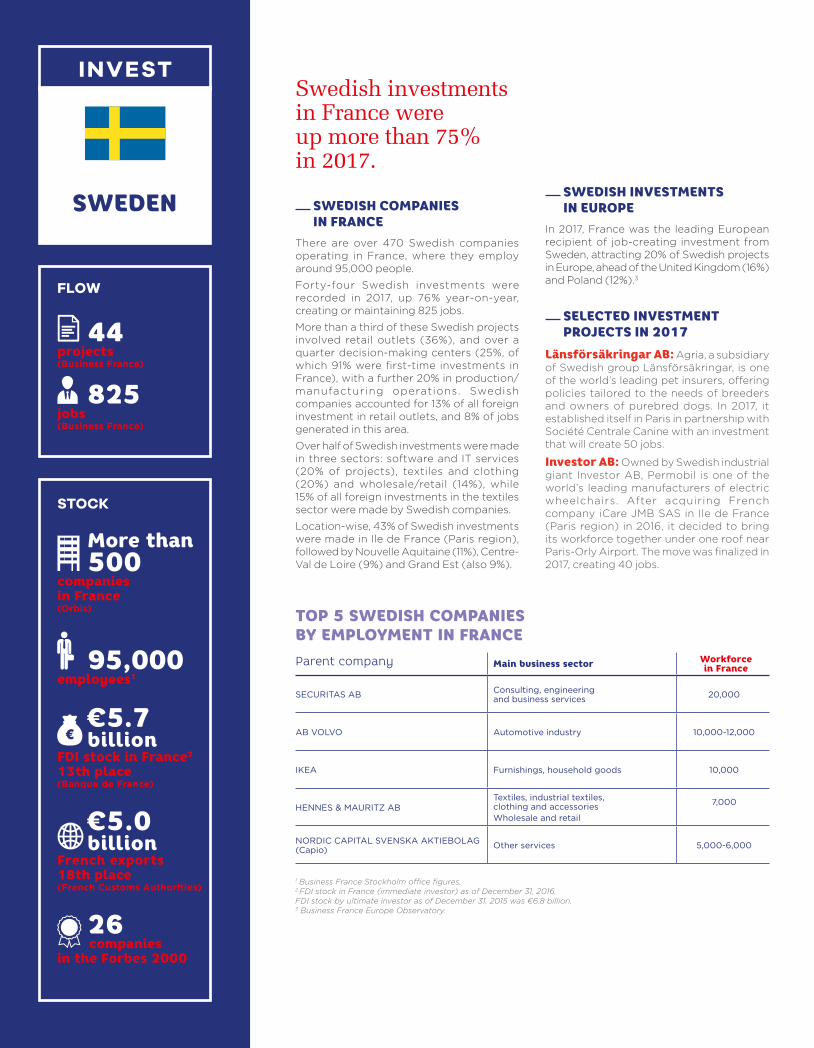
1 Business France Stockholm office figures.2 FDI stock in France (immediate investor) as of December 31, 2016. FDI stock by ultimate investor as of December 31, 2015 was €6.8 billion.3 Business France Europe Observatory.
Swedish investments in France were up more than 75% in 2017.
SWEDISH COMPANIES IN FRANCE
There are over 470 Swedish companies operating in France, where they employ around 95,000 people.
Forty-four Swedish investments were recorded in 2017, up 76% year-on-year, creating or maintaining 825 jobs.
More than a third of these Swedish projects involved retail outlets (36%), and over a quarter decision-making centers (25%, of which 91% were first-time investments in France), with a further 20% in production/manufacturing operations. Swedish companies accounted for 13% of all foreign investment in retail outlets, and 8% of jobs generated in this area.
Over half of Swedish investments were made in three sectors: software and IT services (20% of projects), textiles and clothing (20%) and wholesale/retail (14%), while 15% of all foreign investments in the textiles sector were made by Swedish companies.
Location-wise, 43% of Swedish investments were made in Ile de France (Paris region), followed by Nouvelle Aquitaine (11%), Centre-Val de Loire (9%) and Grand Est (also 9%).
SWEDISH INVESTMENTS IN EUROPE
In 2017, France was the leading European recipient of job-creating investment from Sweden, attracting 20% of Swedish projects in Europe, ahead of the United Kingdom (16%) and Poland (12%).3
SELECTED INVESTMENT PROJECTS IN 2017
Länsförsäkringar AB: Agria, a subsidiary of Swedish group Länsförsäkringar, is one of the world’s leading pet insurers, offering policies tailored to the needs of breeders and owners of purebred dogs. In 2017, it established itself in Paris in partnership with Société Centrale Canine with an investment that will create 50 jobs.
Investor AB: Owned by Swedish industrial giant Investor AB, Permobil is one of the world’s leading manufacturers of electric wheelchairs. After acquiring French company iCare JMB SAS in Ile de France (Paris region) in 2016, it decided to bring its workforce together under one roof near Paris-Orly Airport. The move was finalized in 2017, creating 40 jobs.
Parent company Main business sector Workforce in France
SECURITAS AB Consulting, engineering and business services 20,000
AB VOLVO Automotive industry 10,000-12,000
IKEA Furnishings, household goods 10,000
HENNES & MAURITZ ABTextiles, industrial textiles, clothing and accessoriesWholesale and retail
7,000
NORDIC CAPITAL SVENSKA AKTIEBOLAG (Capio) Other services 5,000-6,000
SWEDEN
INVEST
FLOW
44projects (Business France)
825jobs (Business France)
STOCK
More than500
companies in France (Orbis)
95,000employees1
€5.7 billion
FDI stock in France2
13th place (Banque de France)
€5.0 billion
French exports 18th place(French Customs Authorities)
26 companies in the Forbes 2000
TOP 5 SWEDISH COMPANIES BY EMPLOYMENT IN FRANCE
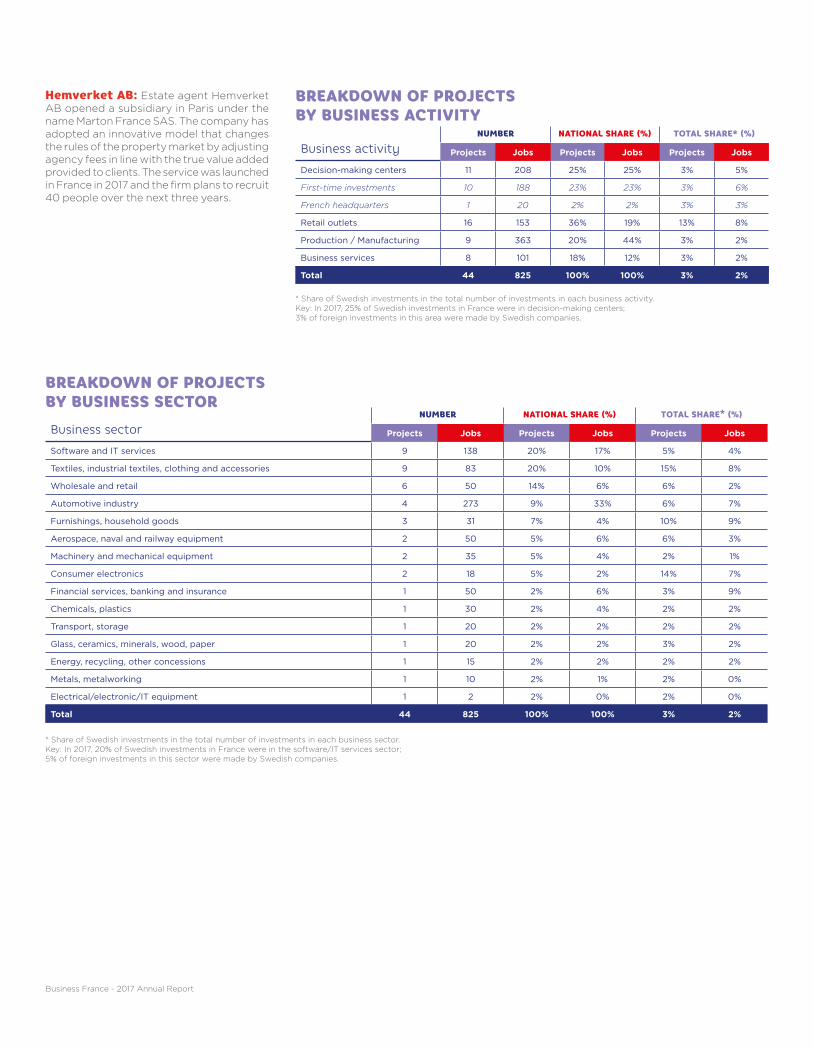
* Share of Swedish investments in the total number of investments in each business activity.Key: In 2017, 25% of Swedish investments in France were in decision-making centers; 3% of foreign investments in this area were made by Swedish companies.
* Share of Swedish investments in the total number of investments in each business sector.Key: In 2017, 20% of Swedish investments in France were in the software/IT services sector; 5% of foreign investments in this sector were made by Swedish companies.
BREAKDOWN OF PROJECTS BY BUSINESS ACTIVITY
BREAKDOWN OF PROJECTS BY BUSINESS SECTOR
Business activityNUMBER NATIONAL SHARE (%) TOTAL SHARE* (%)
Projects Jobs Projects Jobs Projects Jobs
Decision-making centers 11 208 25% 25% 3% 5%
First-time investments 10 188 23% 23% 3% 6%
French headquarters 1 20 2% 2% 3% 3%
Retail outlets 16 153 36% 19% 13% 8%
Production / Manufacturing 9 363 20% 44% 3% 2%
Business services 8 101 18% 12% 3% 2%
Total 44 825 100% 100% 3% 2%
Business sectorNUMBER NATIONAL SHARE (%) TOTAL SHARE* (%)
Projects Jobs Projects Jobs Projects Jobs
Software and IT services 9 138 20% 17% 5% 4%
Textiles, industrial textiles, clothing and accessories 9 83 20% 10% 15% 8%
Wholesale and retail 6 50 14% 6% 6% 2%
Automotive industry 4 273 9% 33% 6% 7%
Furnishings, household goods 3 31 7% 4% 10% 9%
Aerospace, naval and railway equipment 2 50 5% 6% 6% 3%
Machinery and mechanical equipment 2 35 5% 4% 2% 1%
Consumer electronics 2 18 5% 2% 14% 7%
Financial services, banking and insurance 1 50 2% 6% 3% 9%
Chemicals, plastics 1 30 2% 4% 2% 2%
Transport, storage 1 20 2% 2% 2% 2%
Glass, ceramics, minerals, wood, paper 1 20 2% 2% 3% 2%
Energy, recycling, other concessions 1 15 2% 2% 2% 2%
Metals, metalworking 1 10 2% 1% 2% 0%
Electrical/electronic/IT equipment 1 2 2% 0% 2% 0%
Total 44 825 100% 100% 3% 2%
Hemverket AB: Estate agent Hemverket AB opened a subsidiary in Paris under the name Marton France SAS. The company has adopted an innovative model that changes the rules of the property market by adjusting agency fees in line with the true value added provided to clients. The service was launched in France in 2017 and the firm plans to recruit 40 people over the next three years.
Business France - 2017 Annual Report
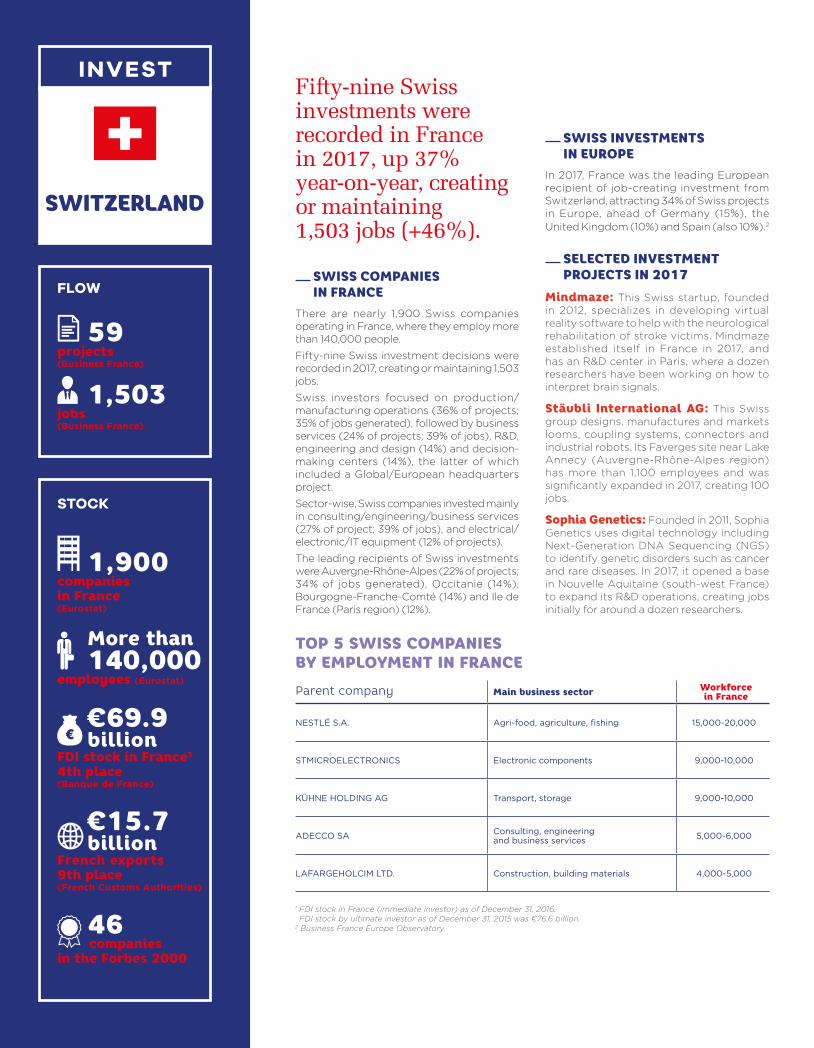
SWITZERLAND
INVEST
1 FDI stock in France (immediate investor) as of December 31, 2016. FDI stock by ultimate investor as of December 31, 2015 was €76.6 billion.
2 Business France Europe Observatory.
Fifty-nine Swiss investments were recorded in France in 2017, up 37% year-on-year, creating or maintaining 1,503 jobs (+46%).
SWISS COMPANIES IN FRANCE
There are nearly 1,900 Swiss companies operating in France, where they employ more than 140,000 people.
Fifty-nine Swiss investment decisions were recorded in 2017, creating or maintaining 1,503 jobs.
Swiss investors focused on production/manufacturing operations (36% of projects; 35% of jobs generated), followed by business services (24% of projects; 39% of jobs), R&D, engineering and design (14%) and decision-making centers (14%), the latter of which included a Global/European headquarters project.
Sector-wise, Swiss companies invested mainly in consulting/engineering/business services (27% of project; 39% of jobs), and electrical/electronic/IT equipment (12% of projects).
The leading recipients of Swiss investments were Auvergne-Rhône-Alpes (22% of projects; 34% of jobs generated), Occitanie (14%), Bourgogne-Franche-Comté (14%) and Ile de France (Paris region) (12%).
SWISS INVESTMENTS IN EUROPE
In 2017, France was the leading European recipient of job-creating investment from Switzerland, attracting 34% of Swiss projects in Europe, ahead of Germany (15%), the United Kingdom (10%) and Spain (also 10%).2
SELECTED INVESTMENT PROJECTS IN 2017
Mindmaze: This Swiss startup, founded in 2012, specializes in developing virtual reality software to help with the neurological rehabilitation of stroke victims. Mindmaze established itself in France in 2017, and has an R&D center in Paris, where a dozen researchers have been working on how to interpret brain signals.
Stäubli International AG: This Swiss group designs, manufactures and markets looms, coupling systems, connectors and industrial robots. Its Faverges site near Lake Annecy (Auvergne-Rhône-Alpes region) has more than 1,100 employees and was significantly expanded in 2017, creating 100 jobs.
Sophia Genetics: Founded in 2011, Sophia Genetics uses digital technology including Next-Generation DNA Sequencing (NGS) to identify genetic disorders such as cancer and rare diseases. In 2017, it opened a base in Nouvelle Aquitaine (south-west France) to expand its R&D operations, creating jobs initially for around a dozen researchers.
Parent company Main business sector Workforce in France
NESTLÉ S.A. Agri-food, agriculture, fishing 15,000-20,000
STMICROELECTRONICS Electronic components 9,000-10,000
KÜHNE HOLDING AG Transport, storage 9,000-10,000
ADECCO SA Consulting, engineering and business services 5,000-6,000
LAFARGEHOLCIM LTD. Construction, building materials 4,000-5,000
FLOW
59projects (Business France)
1,503jobs (Business France)
STOCK
1,900companies in France (Eurostat)
More than140,000
employees (Eurostat)
€69.9 billion
FDI stock in France1
4th place (Banque de France)
€15.7 billion
French exports 9th place(French Customs Authorities)
46 companies in the Forbes 2000
TOP 5 SWISS COMPANIES BY EMPLOYMENT IN FRANCE
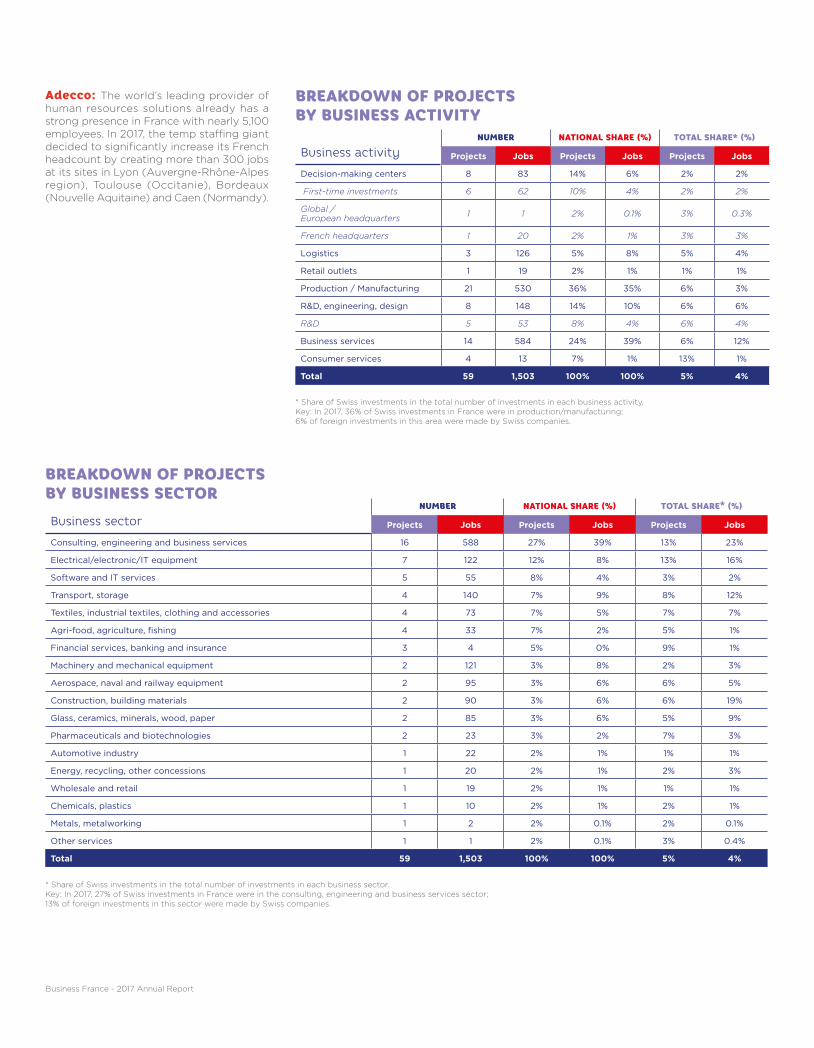
* Share of Swiss investments in the total number of investments in each business activity.Key: In 2017, 36% of Swiss investments in France were in production/manufacturing; 6% of foreign investments in this area were made by Swiss companies.
* Share of Swiss investments in the total number of investments in each business sector.Key: In 2017, 27% of Swiss investments in France were in the consulting, engineering and business services sector; 13% of foreign investments in this sector were made by Swiss companies.
BREAKDOWN OF PROJECTS BY BUSINESS ACTIVITY
BREAKDOWN OF PROJECTS BY BUSINESS SECTOR
Adecco: The world’s leading provider of human resources solutions already has a strong presence in France with nearly 5,100 employees. In 2017, the temp staffing giant decided to significantly increase its French headcount by creating more than 300 jobs at its sites in Lyon (Auvergne-Rhône-Alpes region), Toulouse (Occitanie), Bordeaux (Nouvelle Aquitaine) and Caen (Normandy).
Business activityNUMBER NATIONAL SHARE (%) TOTAL SHARE* (%)
Projects Jobs Projects Jobs Projects Jobs
Decision-making centers 8 83 14% 6% 2% 2%
First-time investments 6 62 10% 4% 2% 2%
Global / European headquarters 1 1 2% 0.1% 3% 0.3%
French headquarters 1 20 2% 1% 3% 3%
Logistics 3 126 5% 8% 5% 4%
Retail outlets 1 19 2% 1% 1% 1%
Production / Manufacturing 21 530 36% 35% 6% 3%
R&D, engineering, design 8 148 14% 10% 6% 6%
R&D 5 53 8% 4% 6% 4%
Business services 14 584 24% 39% 6% 12%
Consumer services 4 13 7% 1% 13% 1%
Total 59 1,503 100% 100% 5% 4%
Business sectorNUMBER NATIONAL SHARE (%) TOTAL SHARE* (%)
Projects Jobs Projects Jobs Projects Jobs
Consulting, engineering and business services 16 588 27% 39% 13% 23%
Electrical/electronic/IT equipment 7 122 12% 8% 13% 16%
Software and IT services 5 55 8% 4% 3% 2%
Transport, storage 4 140 7% 9% 8% 12%
Textiles, industrial textiles, clothing and accessories 4 73 7% 5% 7% 7%
Agri-food, agriculture, fishing 4 33 7% 2% 5% 1%
Financial services, banking and insurance 3 4 5% 0% 9% 1%
Machinery and mechanical equipment 2 121 3% 8% 2% 3%
Aerospace, naval and railway equipment 2 95 3% 6% 6% 5%
Construction, building materials 2 90 3% 6% 6% 19%
Glass, ceramics, minerals, wood, paper 2 85 3% 6% 5% 9%
Pharmaceuticals and biotechnologies 2 23 3% 2% 7% 3%
Automotive industry 1 22 2% 1% 1% 1%
Energy, recycling, other concessions 1 20 2% 1% 2% 3%
Wholesale and retail 1 19 2% 1% 1% 1%
Chemicals, plastics 1 10 2% 1% 2% 1%
Metals, metalworking 1 2 2% 0.1% 2% 0.1%
Other services 1 1 2% 0.1% 3% 0.4%
Total 59 1,503 100% 100% 5% 4%
Business France - 2017 Annual Report
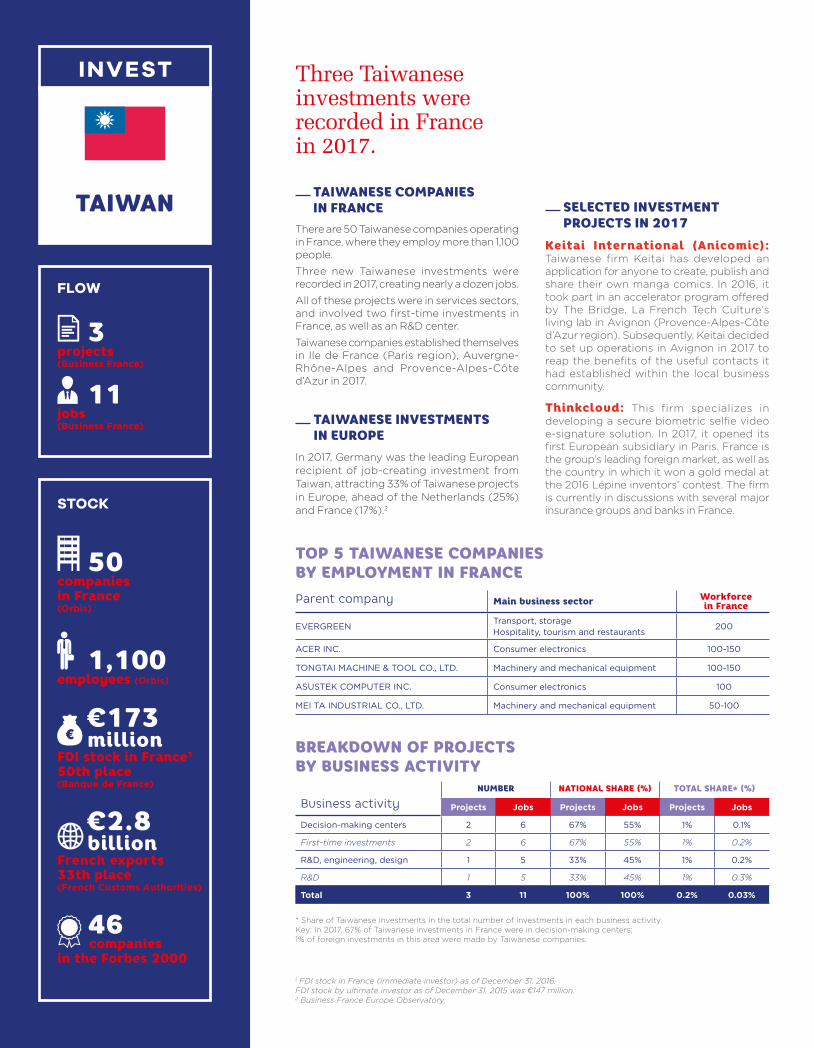
1 FDI stock in France (immediate investor) as of December 31, 2016.FDI stock by ultimate investor as of December 31, 2015 was €147 million.2 Business France Europe Observatory.
Three Taiwanese investments were recorded in France in 2017.
TAIWANESE COMPANIES IN FRANCE
There are 50 Taiwanese companies operating in France, where they employ more than 1,100 people.
Three new Taiwanese investments were recorded in 2017, creating nearly a dozen jobs.
All of these projects were in services sectors, and involved two first-time investments in France, as well as an R&D center.
Taiwanese companies established themselves in Ile de France (Paris region), Auvergne-Rhône-Alpes and Provence-Alpes-Côte d’Azur in 2017.
TAIWANESE INVESTMENTS IN EUROPE
In 2017, Germany was the leading European recipient of job-creating investment from Taiwan, attracting 33% of Taiwanese projects in Europe, ahead of the Netherlands (25%) and France (17%).2
SELECTED INVESTMENT PROJECTS IN 2017
Keitai International (Anicomic): Taiwanese firm Keitai has developed an application for anyone to create, publish and share their own manga comics. In 2016, it took part in an accelerator program offered by The Bridge, La French Tech Culture’s living lab in Avignon (Provence-Alpes-Côte d’Azur region). Subsequently, Keitai decided to set up operations in Avignon in 2017 to reap the benefits of the useful contacts it had established within the local business community.
Thinkcloud: This firm specializes in developing a secure biometric selfie video e-signature solution. In 2017, it opened its first European subsidiary in Paris. France is the group’s leading foreign market, as well as the country in which it won a gold medal at the 2016 Lépine inventors’ contest. The firm is currently in discussions with several major insurance groups and banks in France.
Parent company Main business sector Workforce in France
EVERGREENTransport, storageHospitality, tourism and restaurants
200
ACER INC. Consumer electronics 100-150
TONGTAI MACHINE & TOOL CO., LTD. Machinery and mechanical equipment 100-150
ASUSTEK COMPUTER INC. Consumer electronics 100
MEI TA INDUSTRIAL CO., LTD. Machinery and mechanical equipment 50-100
* Share of Taiwanese investments in the total number of investments in each business activity. Key: In 2017, 67% of Taiwanese investments in France were in decision-making centers; 1% of foreign investments in this area were made by Taiwanese companies.
BREAKDOWN OF PROJECTS BY BUSINESS ACTIVITY
Business activityNUMBER NATIONAL SHARE (%) TOTAL SHARE* (%)
Projects Jobs Projects Jobs Projects Jobs
Decision-making centers 2 6 67% 55% 1% 0.1%
First-time investments 2 6 67% 55% 1% 0.2%
R&D, engineering, design 1 5 33% 45% 1% 0.2%
R&D 1 5 33% 45% 1% 0.3%
Total 3 11 100% 100% 0.2% 0.03%
TAIWAN
INVEST
FLOW
3projects (Business France)
11jobs (Business France)
STOCK
50companies in France (Orbis)
1,100employees (Orbis)
€173 million
FDI stock in France1
50th place (Banque de France)
€2.8 billion
French exports 33th place(French Customs Authorities)
46 companies in the Forbes 2000
TOP 5 TAIWANESE COMPANIES BY EMPLOYMENT IN FRANCE
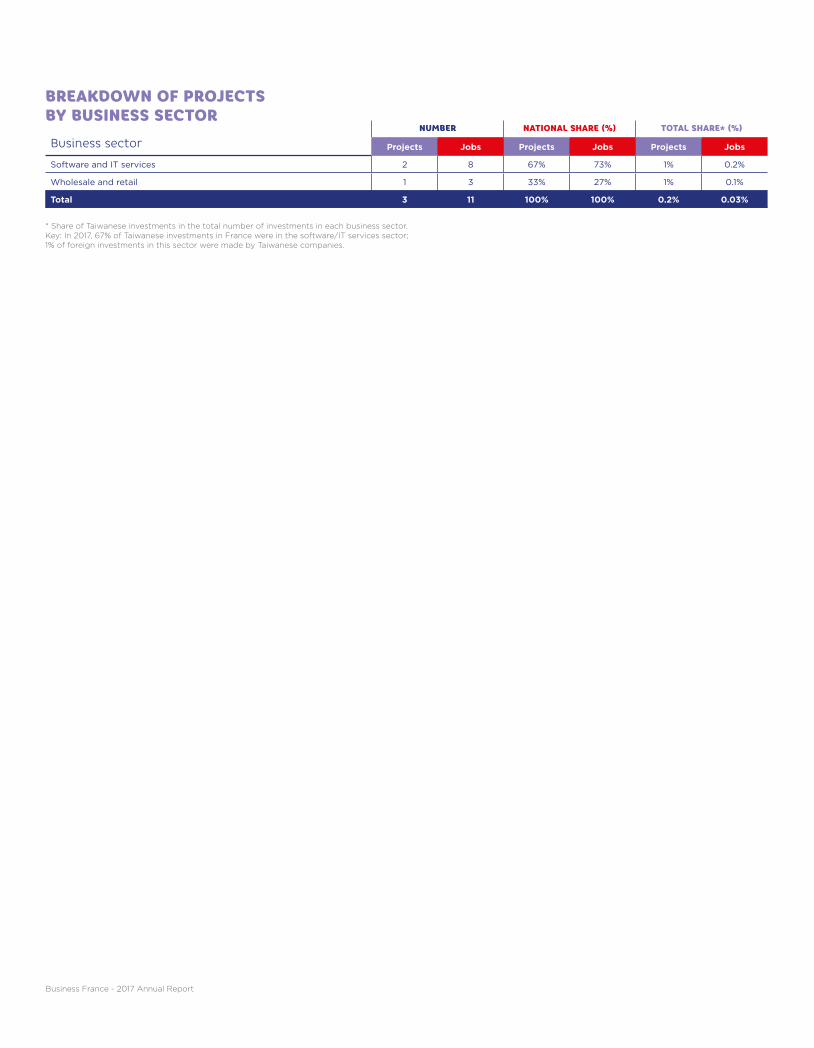
* Share of Taiwanese investments in the total number of investments in each business sector.Key: In 2017, 67% of Taiwanese investments in France were in the software/IT services sector; 1% of foreign investments in this sector were made by Taiwanese companies.
BREAKDOWN OF PROJECTS BY BUSINESS SECTOR
Business sectorNUMBER NATIONAL SHARE (%) TOTAL SHARE* (%)
Projects Jobs Projects Jobs Projects Jobs
Software and IT services 2 8 67% 73% 1% 0.2%
Wholesale and retail 1 3 33% 27% 1% 0.1%
Total 3 11 100% 100% 0.2% 0.03%
Business France - 2017 Annual Report

TURKEY
INVESTSeven Turkish investments were recorded in France in 2017, creating 78 jobs.
TURKISH COMPANIES IN FRANCE
There are nearly a hundred Turkish companies operating in France, where they employ more than 1,500 people.
Seven new Turkish investment decisions were recorded in 2017, creating 78 jobs.
These investments mainly involved setting up decision-making centers (43% of projects; 64% of jobs generated) and logistics operations (29% of projects), while sector-wise, transport and storage stood out (43% of projects; 50% of jobs).
Geographically, Turkish companies invested mainly in Ile de France (Paris region) and Auvergne-Rhône-Alpes.
TURKISH INVESTMENTS IN EUROPE
In 2017, Germany was the leading European recipient of job-creating investment from Turkey, attracting 35% of Turkish projects in Europe, ahead of France, the United Kingdom and Romania (all 10%).2
SELECTED INVESTMENT PROJECTS IN 2017
Ekol Logistics: Turkish carrier Ekol currently operates a weekly sea freight service between Izmir, in Turkey, and the southern French port of Sète, with a second crossing in the pipeline. In Sète, Ekol has already expanded its distribution center from 6,500 to 10,000 sq. m. With this expansion in mind, Ekol opened two further distribution centers in November 2017, each measuring 2,000 sq. m., in Feyzin, near Lyon (Auvergne-Rhône-Alpes region), and Villeparisis (Ile de France / Paris region). These investments have created a total of 40 jobs to date, with more hires planned.
Sentio Sports Analytics: Sentio Sports Analytics is the first foreign startup to have taken part in the French Tech Ticket program through the Tarmac incubator in Grenoble (Auvergne-Rhône-Alpes region). It has successfully developed real-time tracking technology for sports players and teams, without them needing to wear sensors. After a successful test season with the Turkish football league, and a number of Italian teams, Sentio is considering recruiting up to ten people in France to roll out its cutting-edge technology across European football leagues and other sports, such as rugby and handball, as well as to investigate new business models.
Parent company Main business sector Workforce in France
KÖKLER YATIRIM HOLDING (UNITED BISCUITS) Agri-food 400-500
ORHAN HOLDING A.S. (NOBEL PLASTIQUES) Automotive industry 300-400
DOGUS HOLDING (MB 92) Shipyards 200
ECZACIBASI (VILLEROY & BOCH) Ceramics 135
ARÇELIK A.S.H (BEKO FRANCE) Furnishings, household goods 70
FLOW
7projects (Business France)
78jobs (Business France)
STOCK
100companies in France (Orbis)
More than1,500
employees (Orbis)
€241 million
FDI stock in France1
45th place (Banque de France)
€6.7 billion
French exports 12th place(French Customs Authorities)
10 companies in the Forbes 2000
TOP 5 TURKISH COMPANIES BY EMPLOYMENT IN FRANCE
1 FDI stock in France (immediate investor) as of December 31, 2016. FDI stock by ultimate investor as of December 31, 2015 was €301 million.
2 Business France Europe Observatory.
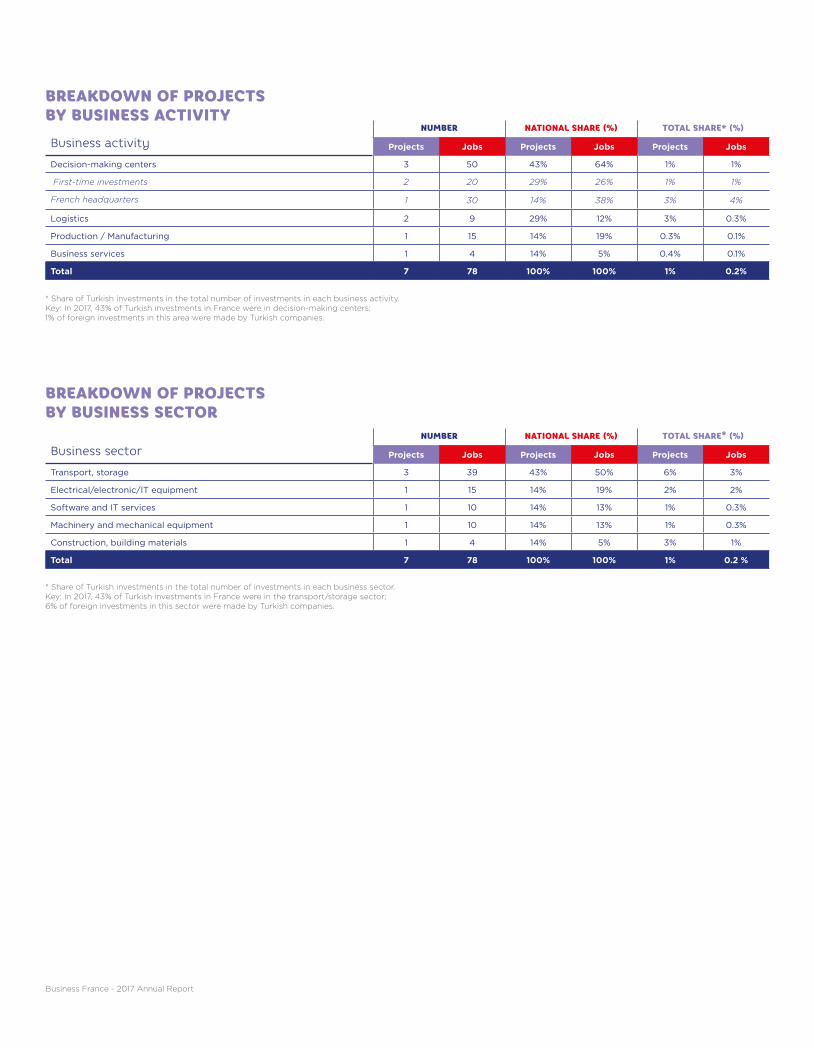
* Share of Turkish investments in the total number of investments in each business activity.Key: In 2017, 43% of Turkish investments in France were in decision-making centers; 1% of foreign investments in this area were made by Turkish companies.
* Share of Turkish investments in the total number of investments in each business sector.Key: In 2017, 43% of Turkish investments in France were in the transport/storage sector; 6% of foreign investments in this sector were made by Turkish companies.
BREAKDOWN OF PROJECTS BY BUSINESS ACTIVITY
BREAKDOWN OF PROJECTS BY BUSINESS SECTOR
Business activityNUMBER NATIONAL SHARE (%) TOTAL SHARE* (%)
Projects Jobs Projects Jobs Projects Jobs
Decision-making centers 3 50 43% 64% 1% 1%
First-time investments 2 20 29% 26% 1% 1%
French headquarters 1 30 14% 38% 3% 4%
Logistics 2 9 29% 12% 3% 0.3%
Production / Manufacturing 1 15 14% 19% 0.3% 0.1%
Business services 1 4 14% 5% 0.4% 0.1%
Total 7 78 100% 100% 1% 0.2%
Business sectorNUMBER NATIONAL SHARE (%) TOTAL SHARE* (%)
Projects Jobs Projects Jobs Projects Jobs
Transport, storage 3 39 43% 50% 6% 3%
Electrical/electronic/IT equipment 1 15 14% 19% 2% 2%
Software and IT services 1 10 14% 13% 1% 0.3%
Machinery and mechanical equipment 1 10 14% 13% 1% 0.3%
Construction, building materials 1 4 14% 5% 3% 1%
Total 7 78 100% 100% 1% 0.2 %
Business France - 2017 Annual Report

EXPORT
BELGIUM
FRENCH EXPORTS (2017)
46,560 French establishments exported to Belgium
€32.1 billion
in French goods exports to Belgium
+6.9% growth in French exports to Belgium
6.9% of all French exports
#5 customer
for French exports
FRENCH EXPORTS TO BELGIUM
In 2017, 46,560 establishments exported to Belgium from France. The value of their exports was €32.1 billion (6.9% of all French exports).
Though Belgium enjoyed only moderate economic growth in 2017 (+1.7%), French exports to the Belgian market rose sharply (+6.9%), having declined in the three previous years. This increase made Belgium France’s fifth largest trading partner in 2017, ahead of the United Kingdom. It was also the country to which the most French companies exported, receiving 11.8% of French exports to European Union countries.
France accounted for 9.6% of global exports to Belgium in 2016, comparable to the previous year’s figure and much higher than its share in global goods exports (3.2%). Provisional statistics from the Belgian Foreign Trade Agency ranked France as Belgium’s third largest supplier in 2017, after the Netherlands and Germany.
BREAKDOWN BY SECTOR OF FRENCH EXPORTS TO BELGIUM
The three sectors accounting for the greatest proportions of French exports to Belgium were transport equipment (17.5%), food/beverages (15.4%) and chemicals, perfumes and cosmetics (11.6%).
Nearly all sectors benefited from France’s improved export performance to Belgium. Sales of metal products were particularly buoyant (+18.3%). The main exporting sectors also saw a sharp upturn in their sales:
+5.2% for transport equipment, +4.9% for food/beverages, and +8.7% for chemicals, perfumes and cosmetics. Only in the textiles and clothing sector did exports fall slightly (-0.6%).
Belgium remained a major trading partner in 2017, accounting for a significant share of French exports in the agricultural products (11.9%), mining, water and energy (13%) and petroleum products sectors (13.8%).
Export
belgqiue
2008 2009 2010 2011 2012 2013 2014 2015 2016 2017
34
32
30
28
26
24
22
20
31.2
29.330.3
31.932.9
31.230.4 30.1
32.1
25.7
%20181614121086420
Trans
port
equip
ment
Mach
inery
and e
quipm
ent
Food
, bev
erage
s
Chem
icals,
perfu
mes,
cosm
etics
Pharm
aceu
tical
prod
ucts
Misce
llane
ous
Texti
les, c
lothin
g,lea
ther
good
s
Metal
prod
ucts
Minin
g, wa
ter an
d ene
rgy
Rubb
er an
d plas
tic pr
oduc
ts
Petro
leum
prod
ucts
Wood
and p
aper
prod
ucts
Agric
ultur
al pr
oduc
ts
17.5% 15.4%
11.6% 11.3% 8.2%
7.7%
5.1% 4.7%
4.6% 3,7% 3.7% 3.6% 3.0% 5.2%
10.5%
6.6%4.1%
8.9%7.9%
11.9%
6.2%
7.7%
13.0%13.8%
5.8%
11.2%
Sector’s share of all French exports to Belgium
Belgium’s share of total French exports in the sector
Fig. 2 BREAKDOWN BY SECTOR OF FRENCH EXPORTS TO BELGIUM (2017)
Source: French Customs Authorities, gross figures, FOB, excluding military equipment
Export
belgqiue
2008 2009 2010 2011 2012 2013 2014 2015 2016 2017
34
32
30
28
26
24
22
20
31.2
29.330.3
31.932.9
31.230.4 30.1
32.1
25.7
%20181614121086420
Trans
port
equip
ment
Mach
inery
and e
quipm
ent
Food
, bev
erage
s
Chem
icals,
perfu
mes,
cosm
etics
Pharm
aceu
tical
prod
ucts
Misce
llane
ous
Texti
les, c
lothin
g,lea
ther
good
s
Metal
prod
ucts
Minin
g, wa
ter an
d ene
rgy
Rubb
er an
d plas
tic pr
oduc
ts
Petro
leum
prod
ucts
Wood
and p
aper
prod
ucts
Agric
ultur
al pr
oduc
ts
17.5% 15.4%
11.6% 11.3% 8.2%
7.7%
5.1% 4.7%
4.6% 3,7% 3.7% 3.6% 3.0% 5.2%
10.5%
6.6%4.1%
8.9%7.9%
11.9%
6.2%
7.7%
13.0%13.8%
5.8%
11.2%
Source: French Customs Authorities, gross figures, FOB, excluding military equipment
Fig. 1 FRENCH EXPORTS TO BELGIUM (€ BILLION)
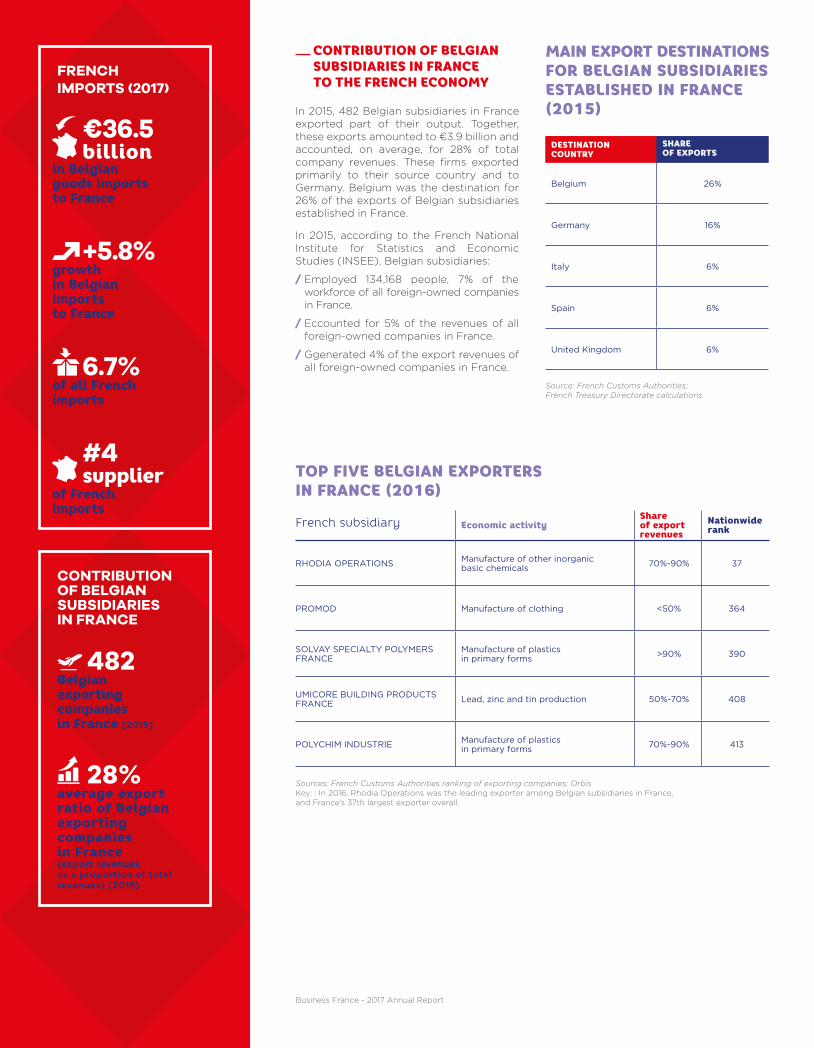
CONTRIBUTION OF BELGIAN SUBSIDIARIES IN FRANCE TO THE FRENCH ECONOMY
In 2015, 482 Belgian subsidiaries in France exported part of their output. Together, these exports amounted to €3.9 billion and accounted, on average, for 28% of total company revenues. These firms exported primarily to their source country and to Germany. Belgium was the destination for 26% of the exports of Belgian subsidiaries established in France.
In 2015, according to the French National Institute for Statistics and Economic Studies (INSEE), Belgian subsidiaries:
/ Employed 134,168 people, 7% of the workforce of all foreign-owned companies in France.
/ Eccounted for 5% of the revenues of all foreign-owned companies in France.
/ Ggenerated 4% of the export revenues of all foreign-owned companies in France.
DESTINATION COUNTRY
SHARE OF EXPORTS
Belgium 26%
Germany 16%
Italy 6%
Spain 6%
United Kingdom 6%
MAIN EXPORT DESTINATIONS FOR BELGIAN SUBSIDIARIES ESTABLISHED IN FRANCE (2015)
French subsidiary Economic activityShare of export revenues
Nationwide rank
RHODIA OPERATIONS Manufacture of other inorganic basic chemicals 70%-90% 37
PROMOD Manufacture of clothing <50% 364
SOLVAY SPECIALTY POLYMERS FRANCE
Manufacture of plastics in primary forms >90% 390
UMICORE BUILDING PRODUCTS FRANCE Lead, zinc and tin production 50%-70% 408
POLYCHIM INDUSTRIE Manufacture of plastics in primary forms 70%-90% 413
TOP FIVE BELGIAN EXPORTERS IN FRANCE (2016)
CONTRIBUTION OF BELGIAN SUBSIDIARIES IN FRANCE
482 Belgian exporting companies in France (2015)
28% average export ratio of Belgian exporting companies in France (export revenues as a proportion of total revenues) (2015)
FRENCH IMPORTS (2017)
€36.5 billion
in Belgian goods imports to France
+5.8% growth in Belgian imports to France
6.7% of all French imports
#4 supplier
of French imports
Source: French Customs Authorities; French Treasury Directorate calculations
Sources: French Customs Authorities ranking of exporting companies; OrbisKey: : In 2016, Rhodia Operations was the leading exporter among Belgian subsidiaries in France, and France’s 37th largest exporter overall.
Business France - 2017 Annual Report
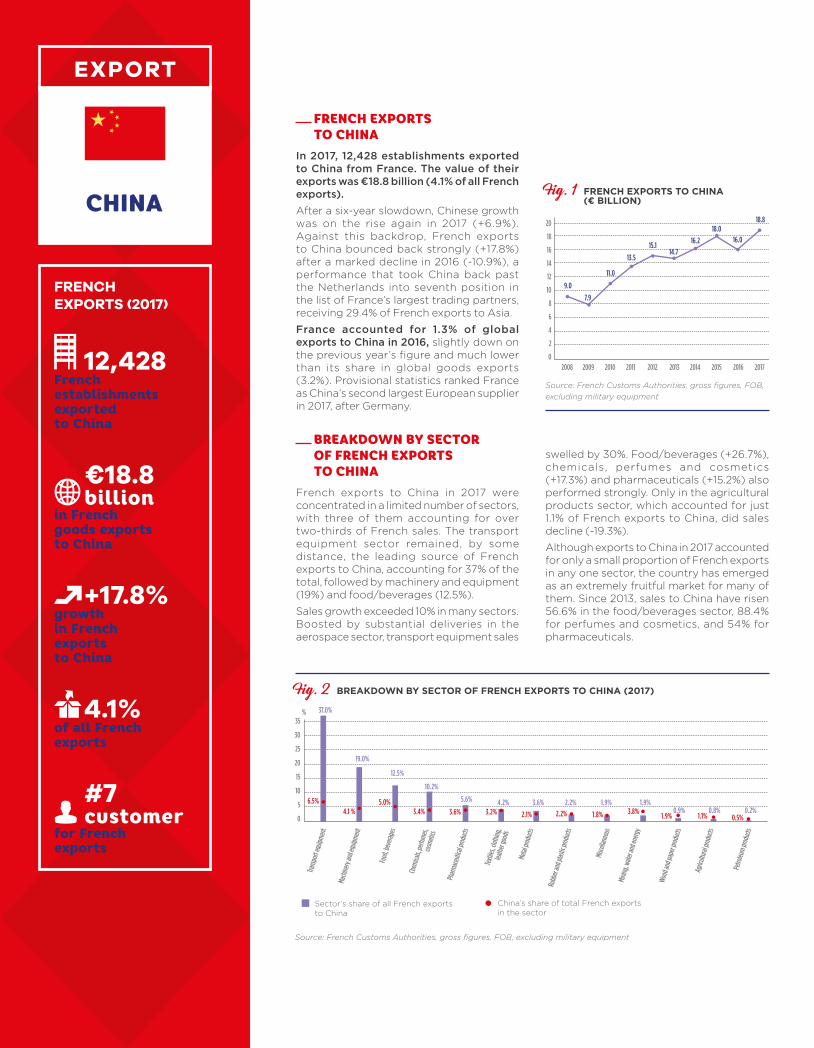
CHINA
EXPORT
FRENCH EXPORTS (2017)
12,428 French establishments exported to China
€18.8 billion
in French goods exports to China
+17.8% growth in French exports to China
4.1% of all French exports
#7 customer
for French exports
FRENCH EXPORTS TO CHINA
In 2017, 12,428 establishments exported to China from France. The value of their exports was €18.8 billion (4.1% of all French exports).
After a six-year slowdown, Chinese growth was on the rise again in 2017 (+6.9%). Against this backdrop, French exports to China bounced back strongly (+17.8%) after a marked decline in 2016 (-10.9%), a performance that took China back past the Netherlands into seventh position in the list of France’s largest trading partners, receiving 29.4% of French exports to Asia.
France accounted for 1.3% of global exports to China in 2016, slightly down on the previous year’s figure and much lower than its share in global goods exports (3.2%). Provisional statistics ranked France as China’s second largest European supplier in 2017, after Germany.
BREAKDOWN BY SECTOR OF FRENCH EXPORTS TO CHINA
French exports to China in 2017 were concentrated in a limited number of sectors, with three of them accounting for over two-thirds of French sales. The transport equipment sector remained, by some distance, the leading source of French exports to China, accounting for 37% of the total, followed by machinery and equipment (19%) and food/beverages (12.5%).
Sales growth exceeded 10% in many sectors. Boosted by substantial deliveries in the aerospace sector, transport equipment sales
Export Chine
9.0
7.9
11.0
13.5
15.1
2008 2009 2010 2011 2012 2013 2014 2015 2016 2017
20
18
16
14
12
10
8
6
4
2
0
%35
30
25
20
15
10
5
0
14.7
16.2 16.0
18.018.8
Trans
port
equip
ment
Mach
inery
and e
quipm
ent
Food
, bev
erage
s
Chem
icals,
perfu
mes,
cosm
etics
Metal
prod
ucts
Pharm
aceu
tical
prod
ucts
Misce
llane
ous
Texti
les, c
lothin
g,lea
ther
good
s
Minin
g, wa
ter an
d ene
rgy
Rubb
er an
d plas
tic pr
oduc
ts
Petro
leum
prod
ucts
Wood
and p
aper
prod
ucts
Agric
ultur
al pr
oduc
ts37.0%
19.0%
12.5%
10.2%
5.6% 4.2% 3.6% 2.2% 1.9% 1.9% 0.9% 0.8% 0.2%
6.5%4.1 %
5.0%3.4% 3.6% 3.2% 2.1% 2.2% 1.8% 3.8%
1.9% 1.1% 0.5%
Sector’s share of all French exports to China
China’s share of total French exports in the sector
Fig. 2 BREAKDOWN BY SECTOR OF FRENCH EXPORTS TO CHINA (2017)
swelled by 30%. Food/beverages (+26.7%), chemicals, perfumes and cosmetics (+17.3%) and pharmaceuticals (+15.2%) also performed strongly. Only in the agricultural products sector, which accounted for just 1.1% of French exports to China, did sales decline (-19.3%).
Although exports to China in 2017 accounted for only a small proportion of French exports in any one sector, the country has emerged as an extremely fruitful market for many of them. Since 2013, sales to China have risen 56.6% in the food/beverages sector, 88.4% for perfumes and cosmetics, and 54% for pharmaceuticals.
Source: French Customs Authorities, gross figures, FOB, excluding military equipment
Export Chine
9.0
7.9
11.0
13.5
15.1
2008 2009 2010 2011 2012 2013 2014 2015 2016 2017
20
18
16
14
12
10
8
6
4
2
0
%35
30
25
20
15
10
5
0
14.7
16.2 16.0
18.018.8
Trans
port
equip
ment
Mach
inery
and e
quipm
ent
Food
, bev
erage
s
Chem
icals,
perfu
mes,
cosm
etics
Metal
prod
ucts
Pharm
aceu
tical
prod
ucts
Misce
llane
ous
Texti
les, c
lothin
g,lea
ther
good
s
Minin
g, wa
ter an
d ene
rgy
Rubb
er an
d plas
tic pr
oduc
ts
Petro
leum
prod
ucts
Wood
and p
aper
prod
ucts
Agric
ultur
al pr
oduc
ts
37.0%
19.0%
12.5%
10.2%
5.6% 4.2% 3.6% 2.2% 1.9% 1.9% 0.9% 0.8% 0.2%
6.5%4.1 %
5.0%3.4% 3.6% 3.2% 2.1% 2.2% 1.8% 3.8%
1.9% 1.1% 0.5%
Source: French Customs Authorities, gross figures, FOB, excluding military equipment
Fig. 1 FRENCH EXPORTS TO CHINA (€ BILLION)
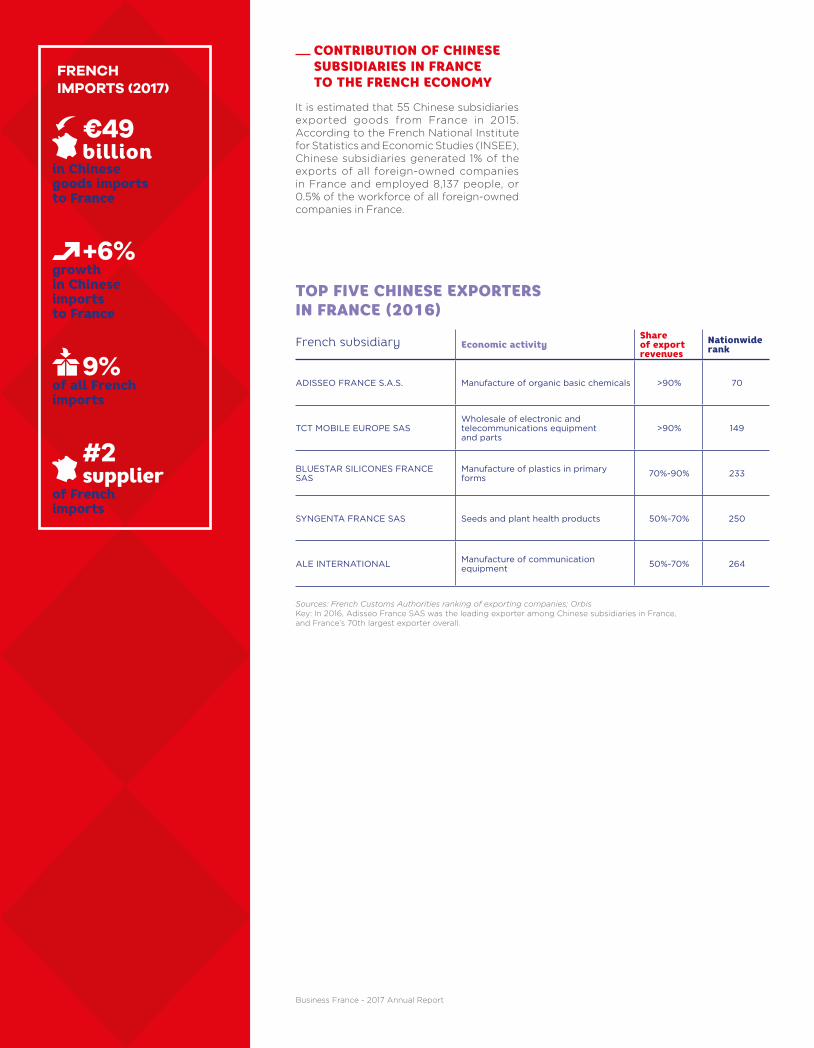
CONTRIBUTION OF CHINESE SUBSIDIARIES IN FRANCE TO THE FRENCH ECONOMY
It is estimated that 55 Chinese subsidiaries exported goods from France in 2015. According to the French National Institute for Statistics and Economic Studies (INSEE), Chinese subsidiaries generated 1% of the exports of all foreign-owned companies in France and employed 8,137 people, or 0.5% of the workforce of all foreign-owned companies in France.
Sources: French Customs Authorities ranking of exporting companies; OrbisKey: In 2016, Adisseo France SAS was the leading exporter among Chinese subsidiaries in France, and France’s 70th largest exporter overall.
French subsidiary Economic activityShare of export revenues
Nationwide rank
ADISSEO FRANCE S.A.S. Manufacture of organic basic chemicals >90% 70
TCT MOBILE EUROPE SASWholesale of electronic and telecommunications equipment and parts
>90% 149
BLUESTAR SILICONES FRANCE SAS
Manufacture of plastics in primary forms 70%-90% 233
SYNGENTA FRANCE SAS Seeds and plant health products 50%-70% 250
ALE INTERNATIONAL Manufacture of communication equipment 50%-70% 264
TOP FIVE CHINESE EXPORTERS IN FRANCE (2016)
FRENCH IMPORTS (2017)
€49 billion
in Chinese goods imports to France
+6% growth in Chinese imports to France
9% of all French imports
#2 supplier
of French imports
Business France - 2017 Annual Report
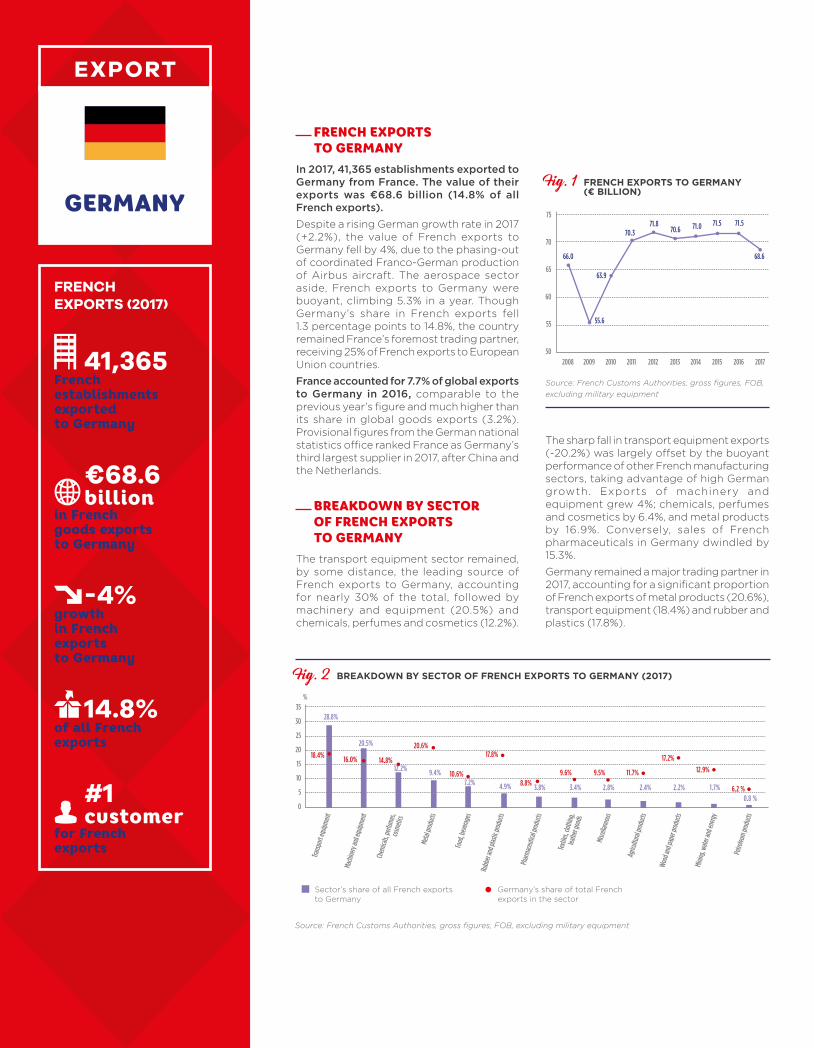
FRENCH EXPORTS (2017)
41,365 French establishments exported to Germany
€68.6 billion
in French goods exports to Germany
-4% growth in French exports to Germany
14.8% of all French exports
#1 customer
for French exports
EXPORT
GERMANY
The sharp fall in transport equipment exports (-20.2%) was largely offset by the buoyant performance of other French manufacturing sectors, taking advantage of high German growth. Exports of machinery and equipment grew 4%; chemicals, perfumes and cosmetics by 6.4%, and metal products by 16.9%. Conversely, sales of French pharmaceuticals in Germany dwindled by 15.3%.
Germany remained a major trading partner in 2017, accounting for a significant proportion of French exports of metal products (20.6%), transport equipment (18.4%) and rubber and plastics (17.8%).
Fig. 1 FRENCH EXPORTS TO GERMANY (€ BILLION)
Export Allemand
2008 2009 2010 2011 2012 2013 2014 2015 2016 2017
66.0
63.9
55.6
70.371.8
70.6 71.0 71.5 71.5
68.6
75
70
65
60
55
50
%35
30
25
20
15
10
5
0
28.8%
20.5%
12.2% 9.4%
7.2% 4.9% 3.8% 3.4% 2.8% 2.4% 2.2% 1.7%
0.8 %
18.4%16.0% 14.8%
20.6%
10.6%
17.8%
8.8%9.6% 9.5% 11.7%
17.2%
12.9%
6.2 %
Trans
port
equip
ment
Mach
inery
and e
quipm
ent
Food
, bev
erage
s
Chem
icals,
perfu
mes,
cosm
etics
Metal
prod
ucts
Pharm
aceu
tical
prod
ucts
Misce
llane
ous
Texti
les, c
lothin
g,lea
ther
good
s
Minin
g, wa
ter an
d ene
rgy
Rubb
er an
d plas
tic pr
oduc
ts
Petro
leum
prod
ucts
Wood
and p
aper
prod
ucts
Agric
ultur
al pr
oduc
ts
Source: French Customs Authorities, gross figures, FOB, excluding military equipment
FRENCH EXPORTS TO GERMANY
In 2017, 41,365 establishments exported to Germany from France. The value of their exports was €68.6 billion (14.8% of all French exports).
Despite a rising German growth rate in 2017 (+2.2%), the value of French exports to Germany fell by 4%, due to the phasing-out of coordinated Franco-German production of Airbus aircraft. The aerospace sector aside, French exports to Germany were buoyant, climbing 5.3% in a year. Though Germany’s share in French exports fell 1.3 percentage points to 14.8%, the country remained France’s foremost trading partner, receiving 25% of French exports to European Union countries.
France accounted for 7.7% of global exports to Germany in 2016, comparable to the previous year’s figure and much higher than its share in global goods exports (3.2%). Provisional figures from the German national statistics office ranked France as Germany’s third largest supplier in 2017, after China and the Netherlands.
BREAKDOWN BY SECTOR OF FRENCH EXPORTS TO GERMANY
The transport equipment sector remained, by some distance, the leading source of French exports to Germany, accounting for nearly 30% of the total, followed by machinery and equipment (20.5%) and chemicals, perfumes and cosmetics (12.2%).
Germany’s share of total French exports in the sector
Export Allemand
2008 2009 2010 2011 2012 2013 2014 2015 2016 2017
66.0
63.9
55.6
70.371.8
70.6 71.0 71.5 71.5
68.6
75
70
65
60
55
50
%35
30
25
20
15
10
5
0
28.8%
20.5%
12.2% 9.4%
7.2% 4.9% 3.8% 3.4% 2.8% 2.4% 2.2% 1.7%
0.8 %
18.4%16.0% 14.8%
20.6%
10.6%
17.8%
8.8%9.6% 9.5% 11.7%
17.2%
12.9%
6.2 %
Trans
port
equip
ment
Mach
inery
and e
quipm
ent
Food
, bev
erage
s
Chem
icals,
perfu
mes,
cosm
etics
Metal
prod
ucts
Pharm
aceu
tical
prod
ucts
Misce
llane
ous
Texti
les, c
lothin
g,lea
ther
good
s
Minin
g, wa
ter an
d ene
rgy
Rubb
er an
d plas
tic pr
oduc
ts
Petro
leum
prod
ucts
Wood
and p
aper
prod
ucts
Agric
ultur
al pr
oduc
ts
Sector’s share of all French exports to Germany
Fig. 2 BREAKDOWN BY SECTOR OF FRENCH EXPORTS TO GERMANY (2017)
Source: French Customs Authorities, gross figures, FOB, excluding military equipment

CONTRIBUTION OF GERMAN SUBSIDIARIES IN FRANCE TO THE FRENCH ECONOMY
In 2015, 1,242 German subsidiaries in France exported part of their output. Together, these exports amounted to €22.4 billion and accounted, on average, for 20% of total company revenues. These firms exported primarily to European markets, and in particular to their source country, Germany, which received one-third of the exports of German subsidiaries established in France.
In 2015, according to the French National Institute for Statistics and Economic Studies (INSEE), German subsidiaries:
/ Employed 311,993 people, 17% of the workforce of all foreign-owned companies in France.
/ Accounted for 17% of the revenues of all foreign-owned companies in France.
/ Generated 14% of the export revenues of all foreign-owned companies in France.
DESTINATION COUNTRY
SHARE OF EXPORTS
Germany 31%
Spain 9%
Italy 7%
United Kingdom 6%
United States 5%
Source: French Customs Authorities; French Treasury Directorate calculations
MAIN EXPORT DESTINATIONS FOR GERMAN SUBSIDIARIES ESTABLISHED IN FRANCE (2015)
Sources: French Customs Authorities ranking of exporting companies; OrbisKey: In 2016, Millipore was the leading exporter among German subsidiaries in France, and France’s 56th largest exporter overall.
French subsidiary Economic activityShare of export revenues
Nationwide rank
MILLIPORE (MERCK KGAA) Manufacture of pharmaceutical preparations 70%-90% 56
BAYER S.A.S. Manufacture of pesticides and other agrochemical products 50%-70% 66
MERIAL Manufacture of pharmaceutical preparations N/A 75
THYSSENKRUPP PRESTA FRANCE SAS
Manufacture of other parts and accessories for motor vehicles >90% 92
CONTINENTAL AUTOMOTIVE FRANCE
Manufacture of scientific and technical instruments 70%-90% 98
TOP FIVE GERMAN EXPORTERS IN FRANCE (2016)
CONTRIBUTION OF GERMAN SUBSIDIARIES IN FRANCE
1,242 German exporting companies in France (2015)
20% average export ratio of German exporting companies in France (export revenues as a proportion of total revenues) (2015)
FRENCH IMPORTS (2017)
€85.8 billion
in German goods imports to France
+0.1% growth in German imports to France
15.8% of all French imports
#1 supplier
of French imports
Business France - 2017 Annual Report

ITALY
EXPORT
FRENCH EXPORTS (2017)
35,094 French establishments exported to Italy
€35.1 billion
in French goods exports to Italy
+8.6% growth in French exports to Italy
7.6% of all French exports
#3 customer
for French exports
FRENCH EXPORTS TO ITALY
In 2017, 35,094 establishments exported to Italy from France. The value of their exports was €35.1 billion (7.6% of all French exports).
Against a backdrop of moderate Italian growth (+1.4% in 2017), French exports to Italy rose substantially (+8.6%). With a 7.6% share in French exports, Italy displaced the United States as France’s third largest trading partner, receiving 12.9% of French exports to European Union countries.
France accounted for 8.7% of global exports to Italy in 2016, up on the previous year’s figure and much higher than its share in global goods exports (3.2%). Provisional Italian statistics ranked France as Italy’s second largest supplier in 2017, after Germany.
BREAKDOWN BY SECTOR OF FRENCH EXPORTS TO ITALY
The three leading sectors for exports to Italy were machinery and equipment (15.4% of the total), transport equipment (15%) and chemicals, perfumes and cosmetics (14.1%).
The vast majority of sectors saw their sales to Italy increase. Aerospace sales doubled in 2017, generating a 12.6% rise in transport equipment exports. Exports of chemicals,
Italy’s share of total French exports in the sector
perfumes and cosmetics enjoyed substantial growth (+11.6%), while food/beverages (+5.9%) and metal products (+9.1%) also thrived.
Italy remained a major trading partner in 2017, accounting for a significant proportion of French exports of textiles, clothing and leather goods (11.9%), agricultural products (15.5%) and mining, water and energy products (18.2%).
Export Italie
2008 2009 2010 2011 2012 2013 2014 2015 2016 2017
36.0
34.2
31.6
28.5
15.4%14.1%
10.0% 8.6%
6.1%5.9%
32.1
30.431.0
32.032.3
35.1
37
35
33
31
29
27
25
%20181614121086420
6.2%4.9%
8.8%7.4%
9.6%
11.9%
15.5%
7.1%
18.2%
8.3% 7.4%
10.1%
3.0%
15.0%
8.2%
4.8 % 4.5% 4.2%2.5%
0.7%
Trans
port
equip
ment
Mach
inery
and e
quipm
ent
Food
, bev
erage
s
Chem
icals,
perfu
mes,
cosm
etics
Metal
prod
ucts
Pharm
aceu
tical
prod
ucts
Misce
llane
ous
Texti
les, c
lothin
g,lea
ther
good
s
Minin
g, wa
ter an
d ene
rgy
Rubb
er an
d plas
tic pr
oduc
ts
Petro
leum
prod
ucts
Wood
and p
aper
prod
ucts
Agric
ultur
al pr
oduc
ts
Sector’s share of all French exports to Italy
Fig. 2 BREAKDOWN BY SECTOR OF FRENCH EXPORTS TO ITALY (2017)
Source: French Customs Authorities, gross figures, FOB, excluding military equipment
Export Italie
2008 2009 2010 2011 2012 2013 2014 2015 2016 2017
36.0
34.2
31.6
28.5
15.4%14.1%
10.0% 8.6%
6.1%5.9%
32.1
30.431.0
32.032.3
35.1
37
35
33
31
29
27
25
%20181614121086420
6.2%4.9%
8.8%7.4%
9.6%
11.9%
15.5%
7.1%
18.2%
8.3% 7.4%
10.1%
3.0%
15.0%
8.2%
4.8 % 4.5% 4.2%2.5%
0.7%
Trans
port
equip
ment
Mach
inery
and e
quipm
ent
Food
, bev
erage
s
Chem
icals,
perfu
mes,
cosm
etics
Metal
prod
ucts
Pharm
aceu
tical
prod
ucts
Misce
llane
ous
Texti
les, c
lothin
g,lea
ther
good
s
Minin
g, wa
ter an
d ene
rgy
Rubb
er an
d plas
tic pr
oduc
ts
Petro
leum
prod
ucts
Wood
and p
aper
prod
ucts
Agric
ultur
al pr
oduc
ts
Fig. 1 FRENCH EXPORTS TO ITALY (€ BILLION)
Source: French Customs Authorities, gross figures, FOB, excluding military equipment
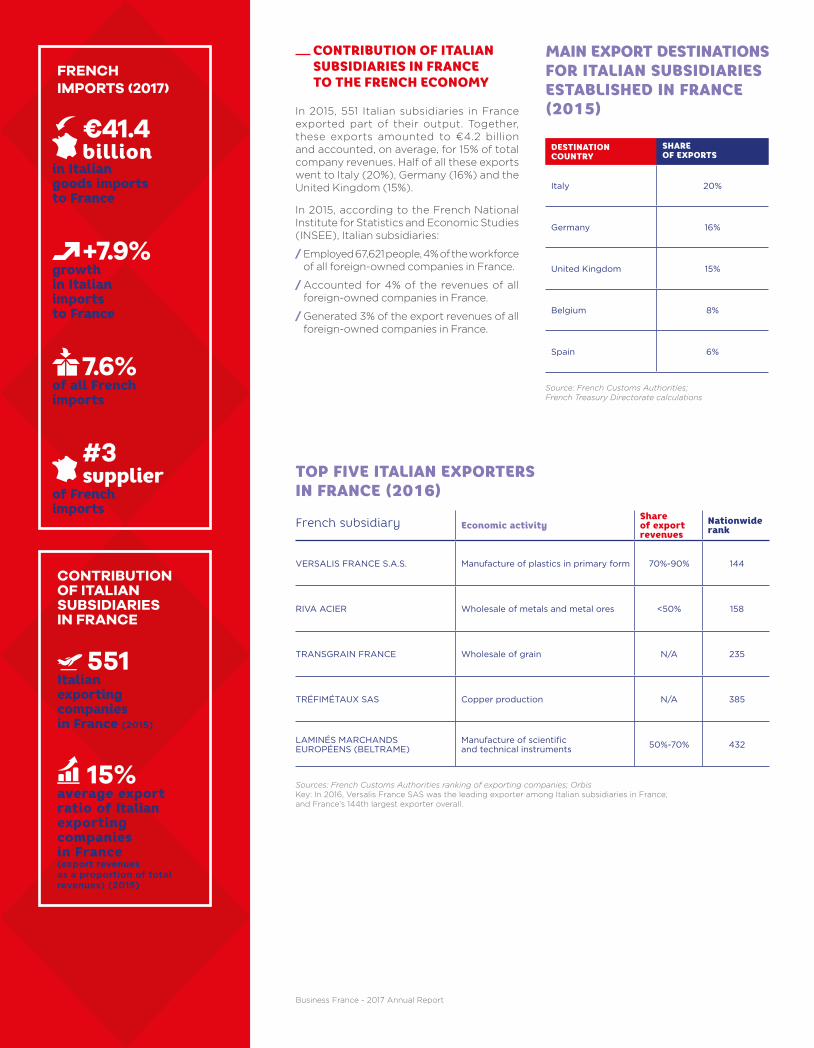
CONTRIBUTION OF ITALIAN SUBSIDIARIES IN FRANCE TO THE FRENCH ECONOMY
In 2015, 551 Italian subsidiaries in France exported part of their output. Together, these exports amounted to €4.2 billion and accounted, on average, for 15% of total company revenues. Half of all these exports went to Italy (20%), Germany (16%) and the United Kingdom (15%).
In 2015, according to the French National Institute for Statistics and Economic Studies (INSEE), Italian subsidiaries:
/ Employed 67,621 people, 4% of the workforce of all foreign-owned companies in France.
/ Accounted for 4% of the revenues of all foreign-owned companies in France.
/ Generated 3% of the export revenues of all foreign-owned companies in France.
DESTINATION COUNTRY
SHARE OF EXPORTS
Italy 20%
Germany 16%
United Kingdom 15%
Belgium 8%
Spain 6%
MAIN EXPORT DESTINATIONS FOR ITALIAN SUBSIDIARIES ESTABLISHED IN FRANCE (2015)
Sources: French Customs Authorities ranking of exporting companies; OrbisKey: In 2016, Versalis France SAS was the leading exporter among Italian subsidiaries in France, and France’s 144th largest exporter overall.
French subsidiary Economic activityShare of export revenues
Nationwide rank
VERSALIS FRANCE S.A.S. Manufacture of plastics in primary form 70%-90% 144
RIVA ACIER Wholesale of metals and metal ores <50% 158
TRANSGRAIN FRANCE Wholesale of grain N/A 235
TRÉFIMÉTAUX SAS Copper production N/A 385
LAMINÉS MARCHANDS EUROPÉENS (BELTRAME)
Manufacture of scientific and technical instruments 50%-70% 432
TOP FIVE ITALIAN EXPORTERS IN FRANCE (2016)
CONTRIBUTION OF ITALIAN SUBSIDIARIES IN FRANCE
551 Italian exporting companies in France (2015)
15% average export ratio of Italian exporting companies in France (export revenues as a proportion of total revenues) (2015)
FRENCH IMPORTS (2017)
€41.4 billion
in Italian goods imports to France
+7.9% growth in Italian imports to France
7.6% of all French imports
#3 supplier
of French imports
Source: French Customs Authorities; French Treasury Directorate calculations
Business France - 2017 Annual Report

JAPAN
EXPORT
FRENCH EXPORTS (2017)
11,411 French establishments exported to Japan
€6.4 billion
in French goods exports to Japan
+1.8% growth in French exports to Japan
1.4% of all French exports
#13 customer
for French exports
FRENCH EXPORTS TO JAPAN
In 2017, 11,411 establishments exported to Japan from France. The value of their exports was €6.4 billion (1.4% of all French exports).
Japanese economic growth accelerated in 2017 (+1.6%, compared with +0.9% in 2016), with eight consecutive quarters of positive growth constituting the country’s most prolonged upturn for 30 years. Against this backdrop, French exports to Japan rose for the first time in five years (+1.8%). With its share in French exports remaining stable at 1.4%, Japan was France’s thirteenth largest customer in 2017, receiving 9.9% of French exports to Asia.
France accounted for 1.2% of global exports to Japan in 2016, comparable to the previous year’s figure and lower than its share in global goods exports (3.2%). Provisional statistics ranked France as Japan’s second largest European supplier in 2017, after Germany.
BREAKDOWN BY SECTOR OF FRENCH EXPORTS TO JAPAN
The leading sectors for French exports to Japan in 2017 were food/beverages (17.9% of the total), machinery and equipment (17.2%) and pharmaceuticals (16.6%).
Most sectors were able to take advantage of improved export performance on the Japanese market, with some even seeing their sales soar by more than 10%. Exports of chemicals, perfumes and cosmetics were
Export Japon
2008 2009 2010 2011 2012 2013 2014 2015 2016 2017
5.6
4.8
5.9
6.5
6.9 6.8
6.3 6.2 6.4
7.48
7,5
7
6,5
6
5,5
5
4,5
4
%
20181614121086420
Trans
port
equip
ment
Mach
inery
and e
quipm
ent
Food
, bev
erage
s
Chem
icals,
perfu
mes,
cosm
etics
Metal
prod
ucts
Pharm
aceu
tical
prod
ucts
Misce
llane
ous
Texti
les, c
lothin
g,lea
ther
good
s
Minin
g, wa
ter an
d ene
rgy
Rubb
er an
d plas
tic pr
oduc
ts
Petro
leum
prod
ucts
Wood
and p
aper
prod
ucts
Agric
ultur
al pr
oduc
ts
17.9%
2.4%1.2%
3.6%
0.7% 1.4%2.4%
1.7% 0.7% 1.1% 0.4% 0.3% 0.3% 0.1%
17.2% 16.6%
12.6% 12.5%
9.3%
5.5%3,5% 3.2%
0.6% 0.6% 0.4% 0.2%
Fig. 2 BREAKDOWN BY SECTOR OF FRENCH EXPORTS TO JAPAN (2017)
up 15.1%, while machinery and equipment exports grew 11.3%. Food/beverages exports climbed 3.8%, while pharmaceutical sales rose 7.2%. Transport equipment exports, in contrast, dwindled significantly (-9.7%) due to reduced aerospace sales.
Though French exports to Japan were lower than they had been in 2013, some sectors have seen their sales swell substantially over the period. Exports of food/beverages increased 8.7%, cosmetics and perfumes by 12.1%, and pharmaceuticals by 5.3%.
Export Japon
2008 2009 2010 2011 2012 2013 2014 2015 2016 2017
5.6
4.8
5.9
6.5
6.9 6.8
6.3 6.2 6.4
7.48
7,5
7
6,5
6
5,5
5
4,5
4
%
20181614121086420
Trans
port
equip
ment
Mach
inery
and e
quipm
ent
Food
, bev
erage
s
Chem
icals,
perfu
mes,
cosm
etics
Metal
prod
ucts
Pharm
aceu
tical
prod
ucts
Misce
llane
ous
Texti
les, c
lothin
g,lea
ther
good
s
Minin
g, wa
ter an
d ene
rgy
Rubb
er an
d plas
tic pr
oduc
ts
Petro
leum
prod
ucts
Wood
and p
aper
prod
ucts
Agric
ultur
al pr
oduc
ts
17.9%
2.4%1.2%
3.6%
0.7% 1.4%2.4%
1.7% 0.7% 1.1% 0.4% 0.3% 0.3% 0.1%
17.2% 16.6%
12.6% 12.5%
9.3%
5.5%3,5% 3.2%
0.6% 0.6% 0.4% 0.2%
Fig. 1 FRENCH EXPORTS TO JAPAN (€ BILLION)
Source: French Customs Authorities, gross figures, FOB, excluding military equipment
Japan’s share of total French exports in the sector
Sector’s share of all French exports to Japan
Source: French Customs Authorities, gross figures, FOB, excluding military equipment
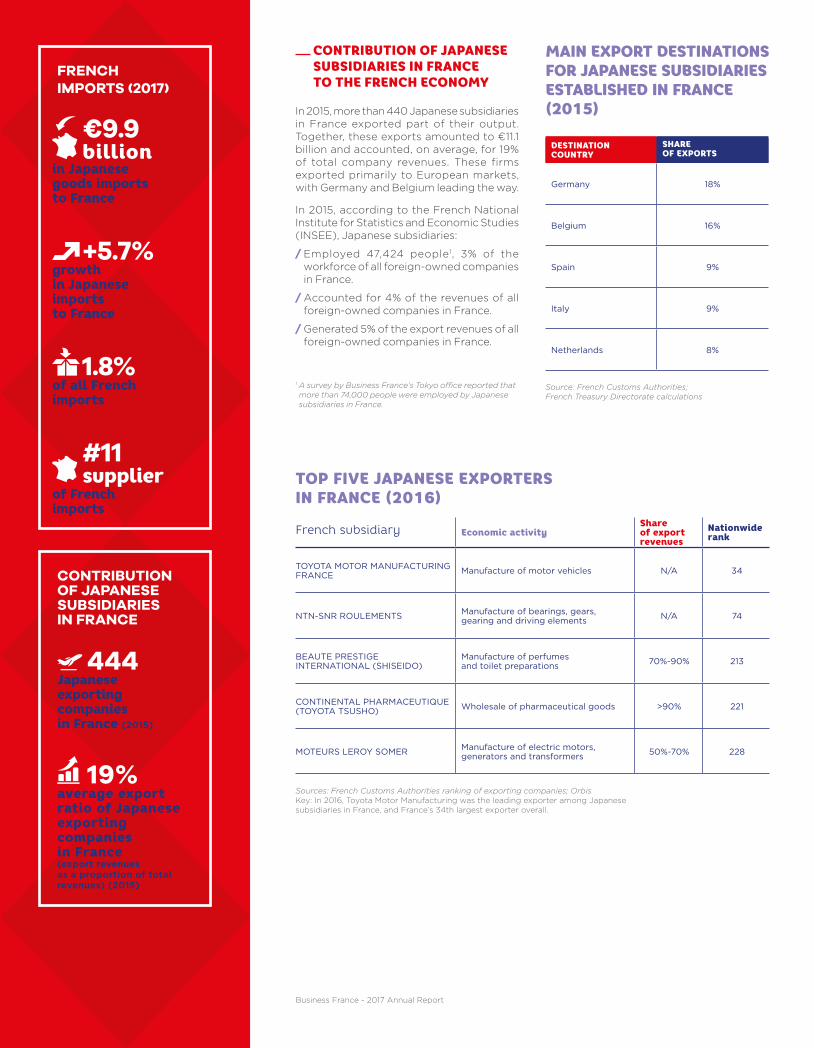
CONTRIBUTION OF JAPANESE SUBSIDIARIES IN FRANCE TO THE FRENCH ECONOMY
In 2015, more than 440 Japanese subsidiaries in France exported part of their output. Together, these exports amounted to €11.1 billion and accounted, on average, for 19% of total company revenues. These firms exported primarily to European markets, with Germany and Belgium leading the way.
In 2015, according to the French National Institute for Statistics and Economic Studies (INSEE), Japanese subsidiaries:
/ Employed 47,424 people1, 3% of the workforce of all foreign-owned companies in France.
/ Accounted for 4% of the revenues of all foreign-owned companies in France.
/ Generated 5% of the export revenues of all foreign-owned companies in France.
1 A survey by Business France’s Tokyo office reported that more than 74,000 people were employed by Japanese subsidiaries in France.
DESTINATION COUNTRY
SHARE OF EXPORTS
Germany 18%
Belgium 16%
Spain 9%
Italy 9%
Netherlands 8%
French subsidiary Economic activityShare of export revenues
Nationwide rank
TOYOTA MOTOR MANUFACTURING FRANCE Manufacture of motor vehicles N/A 34
NTN-SNR ROULEMENTS Manufacture of bearings, gears, gearing and driving elements N/A 74
BEAUTE PRESTIGE INTERNATIONAL (SHISEIDO)
Manufacture of perfumes and toilet preparations 70%-90% 213
CONTINENTAL PHARMACEUTIQUE (TOYOTA TSUSHO) Wholesale of pharmaceutical goods >90% 221
MOTEURS LEROY SOMER Manufacture of electric motors, generators and transformers 50%-70% 228
CONTRIBUTION OF JAPANESE SUBSIDIARIES IN FRANCE
444 Japanese exporting companies in France (2015)
19% average export ratio of Japanese exporting companies in France (export revenues as a proportion of total revenues) (2015)
FRENCH IMPORTS (2017)
€9.9 billion
in Japanese goods imports to France
+5.7% growth in Japanese imports to France
1.8% of all French imports
#11 supplier
of French imports
Source: French Customs Authorities; French Treasury Directorate calculations
MAIN EXPORT DESTINATIONS FOR JAPANESE SUBSIDIARIES ESTABLISHED IN FRANCE (2015)
Sources: French Customs Authorities ranking of exporting companies; OrbisKey: In 2016, Toyota Motor Manufacturing was the leading exporter among Japanese subsidiaries in France, and France’s 34th largest exporter overall.
TOP FIVE JAPANESE EXPORTERS IN FRANCE (2016)
Business France - 2017 Annual Report
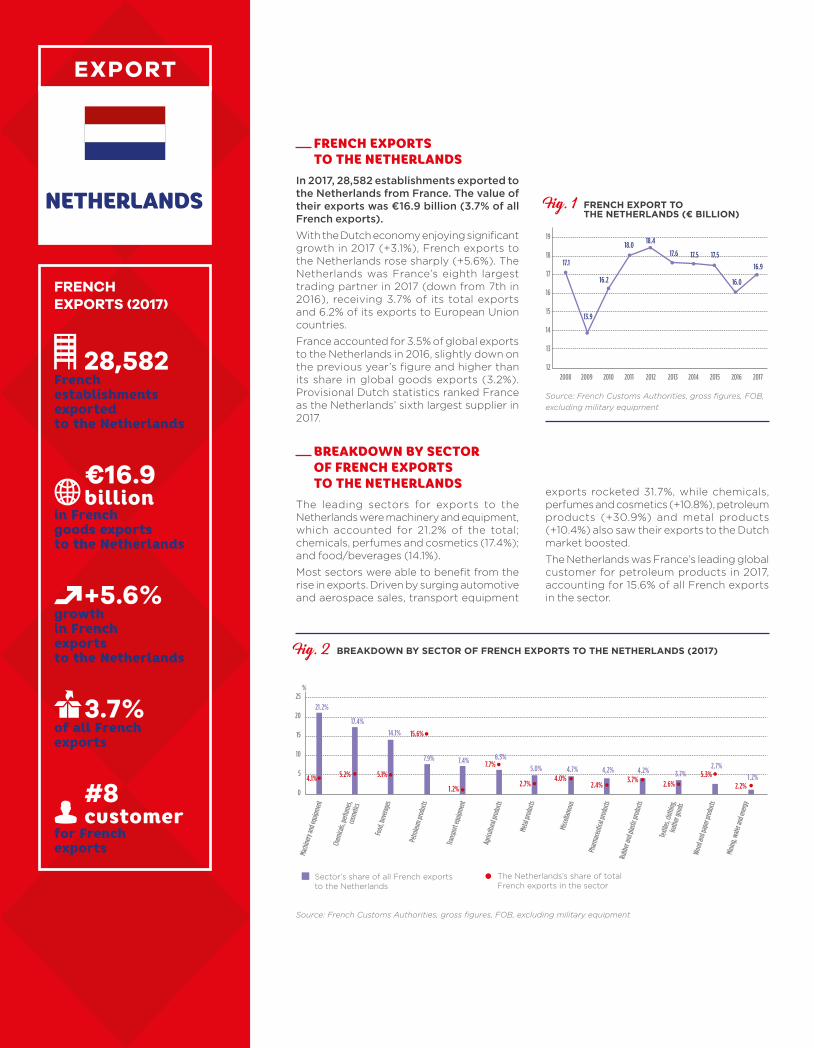
NETHERLANDS
EXPORT
FRENCH EXPORTS (2017)
28,582 French establishments exported to the Netherlands
€16.9 billion
in French goods exports to the Netherlands
+5.6% growth in French exports to the Netherlands
3.7% of all French exports
#8 customer
for French exports
FRENCH EXPORTS TO THE NETHERLANDS
In 2017, 28,582 establishments exported to the Netherlands from France. The value of their exports was €16.9 billion (3.7% of all French exports).
With the Dutch economy enjoying significant growth in 2017 (+3.1%), French exports to the Netherlands rose sharply (+5.6%). The Netherlands was France’s eighth largest trading partner in 2017 (down from 7th in 2016), receiving 3.7% of its total exports and 6.2% of its exports to European Union countries.
France accounted for 3.5% of global exports to the Netherlands in 2016, slightly down on the previous year’s figure and higher than its share in global goods exports (3.2%). Provisional Dutch statistics ranked France as the Netherlands’ sixth largest supplier in 2017.
BREAKDOWN BY SECTOR OF FRENCH EXPORTS TO THE NETHERLANDS
The leading sectors for exports to the Netherlands were machinery and equipment, which accounted for 21.2% of the total; chemicals, perfumes and cosmetics (17.4%); and food/beverages (14.1%).
Most sectors were able to benefit from the rise in exports. Driven by surging automotive and aerospace sales, transport equipment
exports rocketed 31.7%, while chemicals, perfumes and cosmetics (+10.8%), petroleum products (+30.9%) and metal products (+10.4%) also saw their exports to the Dutch market boosted.
The Netherlands was France’s leading global customer for petroleum products in 2017, accounting for 15.6% of all French exports in the sector.
Export Pays-Bas
2008 2009 2010 2011 2012 2013 2014 2015 2016 2017
17.1
13.9
16.2
18.018.4
17.6 17.5 17.5
16.0
16.9
19
18
17
16
15
14
13
12
%25
20
15
10
5
0
Trans
port
equip
ment
Mach
inery
and e
quipm
ent
Food
, bev
erage
s
Chem
icals,
perfu
mes,
cosm
etics
Metal
prod
ucts
Pharm
aceu
tical
prod
ucts
Misce
llane
ous
Texti
les, c
lothin
g,lea
ther
good
s
Minin
g, wa
ter an
d ene
rgy
Rubb
er an
d plas
tic pr
oduc
ts
Petro
leum
prod
ucts
Wood
and p
aper
prod
ucts
Agric
ultur
al pr
oduc
ts
21.2%
17.4%
14.1%
7.9% 7.4% 6.3%
5.0% 4.7% 4,2% 4.2% 3.7%2.7%
1.2%4.1% 5.2% 5.1%
15.6%
1.2%
7.7%
2.7%4.0%
2.4%3.7%
2.6%5.3%
2.2%
Sector’s share of all French exports to the Netherlands
The Netherlands’s share of total French exports in the sector
Fig. 2 BREAKDOWN BY SECTOR OF FRENCH EXPORTS TO THE NETHERLANDS (2017)
Source: French Customs Authorities, gross figures, FOB, excluding military equipment
Export Pays-Bas
2008 2009 2010 2011 2012 2013 2014 2015 2016 2017
17.1
13.9
16.2
18.018.4
17.6 17.5 17.5
16.0
16.9
19
18
17
16
15
14
13
12
%25
20
15
10
5
0
Trans
port
equip
ment
Mach
inery
and e
quipm
ent
Food
, bev
erage
s
Chem
icals,
perfu
mes,
cosm
etics
Metal
prod
ucts
Pharm
aceu
tical
prod
ucts
Misce
llane
ous
Texti
les, c
lothin
g,lea
ther
good
s
Minin
g, wa
ter an
d ene
rgy
Rubb
er an
d plas
tic pr
oduc
ts
Petro
leum
prod
ucts
Wood
and p
aper
prod
ucts
Agric
ultur
al pr
oduc
ts
21.2%
17.4%
14.1%
7.9% 7.4% 6.3%
5.0% 4.7% 4,2% 4.2% 3.7%2.7%
1.2%4.1% 5.2% 5.1%
15.6%
1.2%
7.7%
2.7%4.0%
2.4%3.7%
2.6%5.3%
2.2%
Fig. 1 FRENCH EXPORT TO THE NETHERLANDS (€ BILLION)
Source: French Customs Authorities, gross figures, FOB, excluding military equipment
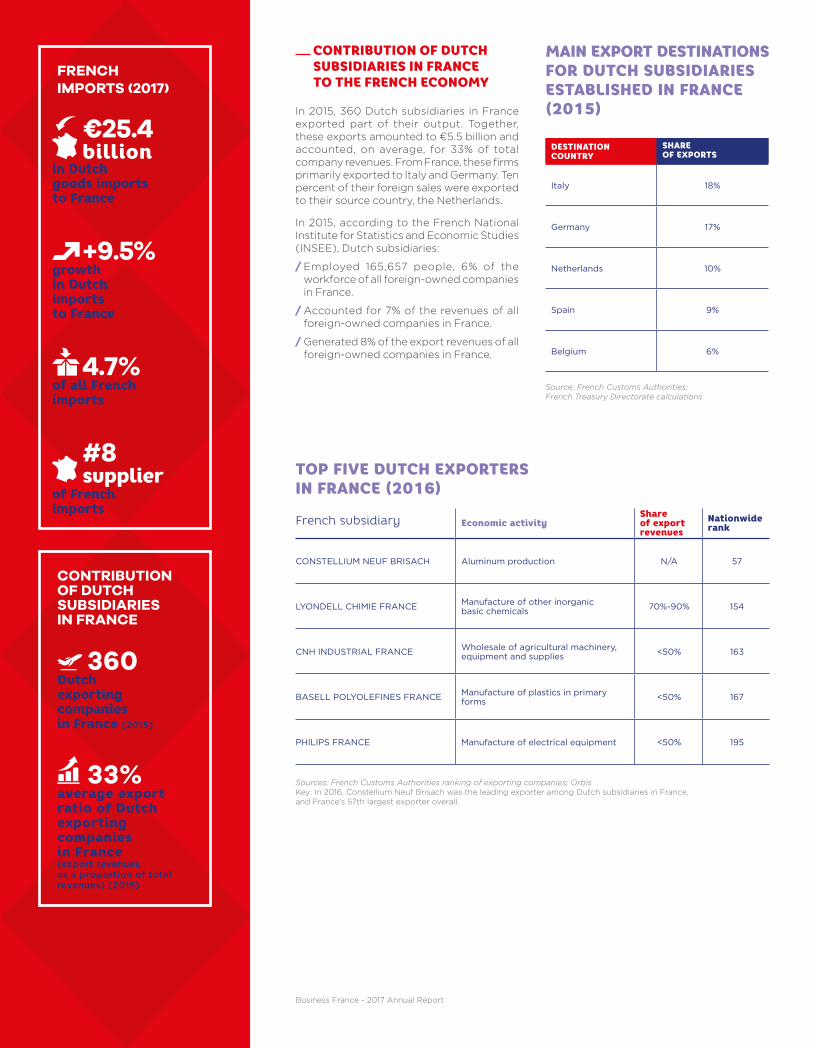
CONTRIBUTION OF DUTCH SUBSIDIARIES IN FRANCE TO THE FRENCH ECONOMY
In 2015, 360 Dutch subsidiaries in France exported part of their output. Together, these exports amounted to €5.5 billion and accounted, on average, for 33% of total company revenues. From France, these firms primarily exported to Italy and Germany. Ten percent of their foreign sales were exported to their source country, the Netherlands.
In 2015, according to the French National Institute for Statistics and Economic Studies (INSEE), Dutch subsidiaries:
/ Employed 165,657 people, 6% of the workforce of all foreign-owned companies in France.
/ Accounted for 7% of the revenues of all foreign-owned companies in France.
/ Generated 8% of the export revenues of all foreign-owned companies in France.
DESTINATION COUNTRY
SHARE OF EXPORTS
Italy 18%
Germany 17%
Netherlands 10%
Spain 9%
Belgium 6%
MAIN EXPORT DESTINATIONS FOR DUTCH SUBSIDIARIES ESTABLISHED IN FRANCE (2015)
French subsidiary Economic activityShare of export revenues
Nationwide rank
CONSTELLIUM NEUF BRISACH Aluminum production N/A 57
LYONDELL CHIMIE FRANCE Manufacture of other inorganic basic chemicals 70%-90% 154
CNH INDUSTRIAL FRANCE Wholesale of agricultural machinery, equipment and supplies <50% 163
BASELL POLYOLEFINES FRANCE Manufacture of plastics in primary forms <50% 167
PHILIPS FRANCE Manufacture of electrical equipment <50% 195
TOP FIVE DUTCH EXPORTERS IN FRANCE (2016)
CONTRIBUTION OF DUTCH SUBSIDIARIES IN FRANCE
360 Dutch exporting companies in France (2015)
33% average export ratio of Dutch exporting companies in France (export revenues as a proportion of total revenues) (2015)
FRENCH IMPORTS (2017)
€25.4 billion
in Dutch goods imports to France
+9.5% growth in Dutch imports to France
4.7% of all French imports
#8 supplier
of French imports
Source: French Customs Authorities; French Treasury Directorate calculations
Sources: French Customs Authorities ranking of exporting companies; OrbisKey: In 2016, Constellium Neuf Brisach was the leading exporter among Dutch subsidiaries in France, and France’s 57th largest exporter overall.
Business France - 2017 Annual Report
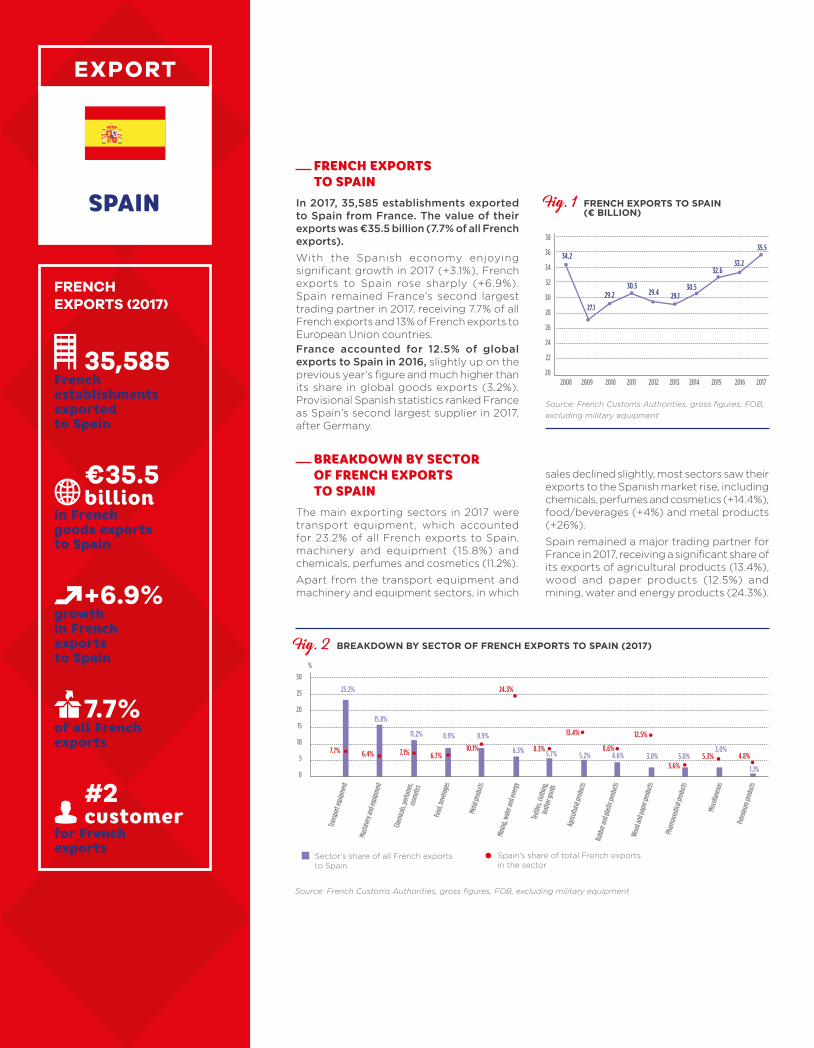
SPAIN
EXPORT
FRENCH EXPORTS (2017)
35,585 French establishments exported to Spain
€35.5 billion
in French goods exports to Spain
+6.9% growth in French exports to Spain
7.7% of all French exports
#2 customer
for French exports
FRENCH EXPORTS TO SPAIN
In 2017, 35,585 establishments exported to Spain from France. The value of their exports was €35.5 billion (7.7% of all French exports).
With the Spanish economy enjoying significant growth in 2017 (+3.1%), French exports to Spain rose sharply (+6.9%). Spain remained France’s second largest trading partner in 2017, receiving 7.7% of all French exports and 13% of French exports to European Union countries.
France accounted for 12.5% of global exports to Spain in 2016, slightly up on the previous year’s figure and much higher than its share in global goods exports (3.2%). Provisional Spanish statistics ranked France as Spain’s second largest supplier in 2017, after Germany.
BREAKDOWN BY SECTOR OF FRENCH EXPORTS TO SPAIN
The main exporting sectors in 2017 were transport equipment, which accounted for 23.2% of all French exports to Spain, machinery and equipment (15.8%) and chemicals, perfumes and cosmetics (11.2%).
Apart from the transport equipment and machinery and equipment sectors, in which
Export
espagne
2008 2009 2010 2011 2012 2013 2014 2015 2016 2017
38
36
34
32
30
28
26
24
22
20
34.2
27.1
29.2 29.4 29.130.5
32.633.2
35.5
30.5
30
25
20
15
10
5
0
%
Trans
port
equip
ment
Mach
inery
and e
quipm
ent
Food
, bev
erage
s
Chem
icals,
perfu
mes,
cosm
etics
Pharm
aceu
tical
prod
ucts
Misce
llane
ous
Texti
les, c
lothin
g,lea
ther
good
s
Metal
prod
ucts
Minin
g, wa
ter an
d ene
rgy
Rubb
er an
d plas
tic pr
oduc
ts
Petro
leum
prod
ucts
Wood
and p
aper
prod
ucts
Agric
ultur
al pr
oduc
ts
23.2%
15.8%
11.2% 8.9% 8.9%
6.3% 5.7% 5.2% 4.6% 3.0% 3.0% 3.0%
1.1%
7.7% 6.4% 7.1% 6.7%10.1%
24.3%
8.3%
13.4%
8.6%
12.5%
3.6%5.3% 4.8%
Sector’s share of all French exports to Spain
Spain’s share of total French exports in the sector
Fig. 2 BREAKDOWN BY SECTOR OF FRENCH EXPORTS TO SPAIN (2017)
sales declined slightly, most sectors saw their exports to the Spanish market rise, including chemicals, perfumes and cosmetics (+14.4%), food/beverages (+4%) and metal products (+26%).
Spain remained a major trading partner for France in 2017, receiving a significant share of its exports of agricultural products (13.4%), wood and paper products (12.5%) and mining, water and energy products (24.3%).
Source: French Customs Authorities, gross figures, FOB, excluding military equipment
Export
espagne
2008 2009 2010 2011 2012 2013 2014 2015 2016 2017
38
36
34
32
30
28
26
24
22
20
34.2
27.1
29.2 29.4 29.130.5
32.633.2
35.5
30.5
30
25
20
15
10
5
0
%
Trans
port
equip
ment
Mach
inery
and e
quipm
ent
Food
, bev
erage
s
Chem
icals,
perfu
mes,
cosm
etics
Pharm
aceu
tical
prod
ucts
Misce
llane
ous
Texti
les, c
lothin
g,lea
ther
good
s
Metal
prod
ucts
Minin
g, wa
ter an
d ene
rgy
Rubb
er an
d plas
tic pr
oduc
ts
Petro
leum
prod
ucts
Wood
and p
aper
prod
ucts
Agric
ultur
al pr
oduc
ts
23.2%
15.8%
11.2% 8.9% 8.9%
6.3% 5.7% 5.2% 4.6% 3.0% 3.0% 3.0%
1.1%
7.7% 6.4% 7.1% 6.7%10.1%
24.3%
8.3%
13.4%
8.6%
12.5%
3.6%5.3% 4.8%
Source: French Customs Authorities, gross figures, FOB, excluding military equipment
Fig. 1 FRENCH EXPORTS TO SPAIN (€ BILLION)
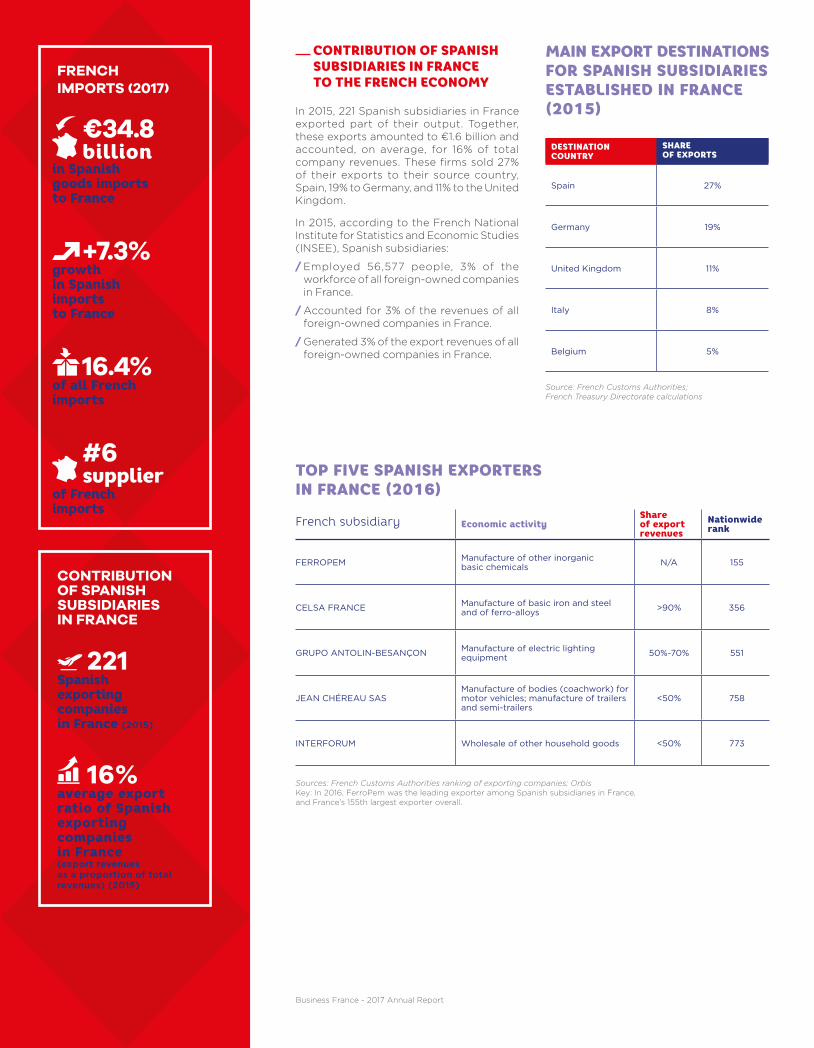
CONTRIBUTION OF SPANISH SUBSIDIARIES IN FRANCE TO THE FRENCH ECONOMY
In 2015, 221 Spanish subsidiaries in France exported part of their output. Together, these exports amounted to €1.6 billion and accounted, on average, for 16% of total company revenues. These firms sold 27% of their exports to their source country, Spain, 19% to Germany, and 11% to the United Kingdom.
In 2015, according to the French National Institute for Statistics and Economic Studies (INSEE), Spanish subsidiaries:
/ Employed 56,577 people, 3% of the workforce of all foreign-owned companies in France.
/ Accounted for 3% of the revenues of all foreign-owned companies in France.
/ Generated 3% of the export revenues of all foreign-owned companies in France.
DESTINATION COUNTRY
SHARE OF EXPORTS
Spain 27%
Germany 19%
United Kingdom 11%
Italy 8%
Belgium 5%
MAIN EXPORT DESTINATIONS FOR SPANISH SUBSIDIARIES ESTABLISHED IN FRANCE (2015)
French subsidiary Economic activityShare of export revenues
Nationwide rank
FERROPEM Manufacture of other inorganic basic chemicals N/A 155
CELSA FRANCE Manufacture of basic iron and steel and of ferro-alloys >90% 356
GRUPO ANTOLIN-BESANÇON Manufacture of electric lighting equipment 50%-70% 551
JEAN CHÉREAU SASManufacture of bodies (coachwork) for motor vehicles; manufacture of trailers and semi-trailers
<50% 758
INTERFORUM Wholesale of other household goods <50% 773
TOP FIVE SPANISH EXPORTERS IN FRANCE (2016)
CONTRIBUTION OF SPANISH SUBSIDIARIES IN FRANCE
221 Spanish exporting companies in France (2015)
16% average export ratio of Spanish exporting companies in France (export revenues as a proportion of total revenues) (2015)
FRENCH IMPORTS (2017)
€34.8 billion
in Spanish goods imports to France
+7.3% growth in Spanish imports to France
16.4% of all French imports
#6 supplier
of French imports
Source: French Customs Authorities; French Treasury Directorate calculations
Sources: French Customs Authorities ranking of exporting companies; OrbisKey: In 2016, FerroPem was the leading exporter among Spanish subsidiaries in France, and France’s 155th largest exporter overall.
Business France - 2017 Annual Report
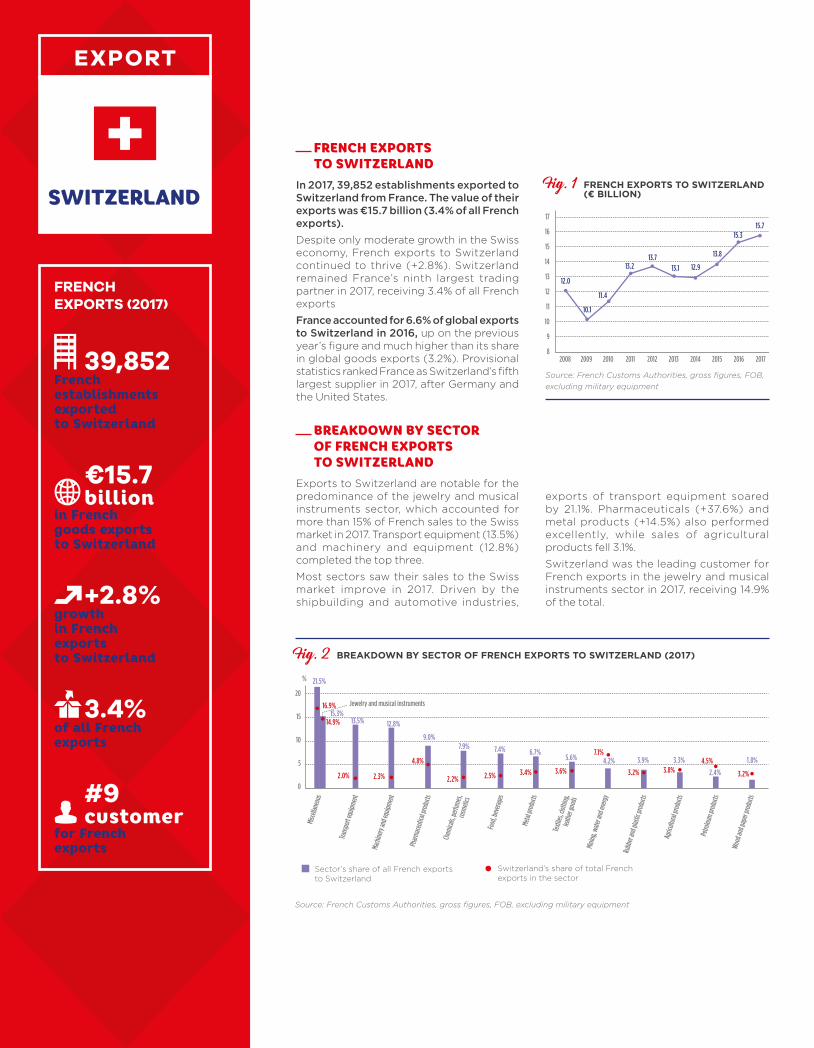
SWITZERLAND
EXPORT
FRENCH EXPORTS (2017)
39,852 French establishments exported to Switzerland
€15.7 billion
in French goods exports to Switzerland
+2.8% growth in French exports to Switzerland
3.4% of all French exports
#9 customer
for French exports
FRENCH EXPORTS TO SWITZERLAND
In 2017, 39,852 establishments exported to Switzerland from France. The value of their exports was €15.7 billion (3.4% of all French exports).
Despite only moderate growth in the Swiss economy, French exports to Switzerland continued to thrive (+2.8%). Switzerland remained France’s ninth largest trading partner in 2017, receiving 3.4% of all French exports
France accounted for 6.6% of global exports to Switzerland in 2016, up on the previous year’s figure and much higher than its share in global goods exports (3.2%). Provisional statistics ranked France as Switzerland’s fifth largest supplier in 2017, after Germany and the United States.
BREAKDOWN BY SECTOR OF FRENCH EXPORTS TO SWITZERLAND
Exports to Switzerland are notable for the predominance of the jewelry and musical instruments sector, which accounted for more than 15% of French sales to the Swiss market in 2017. Transport equipment (13.5%) and machinery and equipment (12.8%) completed the top three.
Most sectors saw their sales to the Swiss market improve in 2017. Driven by the shipbuilding and automotive industries,
exports of transport equipment soared by 21.1%. Pharmaceuticals (+37.6%) and metal products (+14.5%) also performed excellently, while sales of agricultural products fell 3.1%.
Switzerland was the leading customer for French exports in the jewelry and musical instruments sector in 2017, receiving 14.9% of the total.
Export Suisse
2008 2009 2010 2011 2012 2013 2014 2015 2016 2017
Jewelry and musical instruments
12.0
10.1
11.4
13.213.7
13.1 12.9
13.8
15.315.7
17
16
15
14
13
12
11
10
9
8
%
20
15
10
5
0
Trans
port
equip
ment
Mach
inery
and e
quipm
ent
Food
, bev
erage
s
Chem
icals,
perfu
mes,
cosm
etics
Metal
prod
ucts
Pharm
aceu
tical
prod
ucts
Misce
llane
ous
Texti
les, c
lothin
g,lea
ther
good
s
Minin
g, wa
ter an
d ene
rgy
Rubb
er an
d plas
tic pr
oduc
ts
Petro
leum
prod
ucts
Wood
and p
aper
prod
ucts
Agric
ultur
al pr
oduc
ts21.5%
15.3% 13.5% 12.8%
9.0% 7.9% 7.4% 6.7%
5.6% 4.2% 3.9% 3.3%
2.4%
1.8%
16.9%
14.9%
2.0% 2.3%
4.8%
2.2% 2.5% 3.4% 3.6%
7.1%
3.2% 3.8%4.5%
3.2%
Sector’s share of all French exports to Switzerland
Switzerland’s share of total French exports in the sector
Fig. 2 BREAKDOWN BY SECTOR OF FRENCH EXPORTS TO SWITZERLAND (2017)
Source: French Customs Authorities, gross figures, FOB, excluding military equipment
Export Suisse
2008 2009 2010 2011 2012 2013 2014 2015 2016 2017
Jewelry and musical instruments
12.0
10.1
11.4
13.213.7
13.1 12.9
13.8
15.315.7
17
16
15
14
13
12
11
10
9
8
%
20
15
10
5
0
Trans
port
equip
ment
Mach
inery
and e
quipm
ent
Food
, bev
erage
s
Chem
icals,
perfu
mes,
cosm
etics
Metal
prod
ucts
Pharm
aceu
tical
prod
ucts
Misce
llane
ous
Texti
les, c
lothin
g,lea
ther
good
s
Minin
g, wa
ter an
d ene
rgy
Rubb
er an
d plas
tic pr
oduc
ts
Petro
leum
prod
ucts
Wood
and p
aper
prod
ucts
Agric
ultur
al pr
oduc
ts
21.5%
15.3% 13.5% 12.8%
9.0% 7.9% 7.4% 6.7%
5.6% 4.2% 3.9% 3.3%
2.4%
1.8%
16.9%
14.9%
2.0% 2.3%
4.8%
2.2% 2.5% 3.4% 3.6%
7.1%
3.2% 3.8%4.5%
3.2%
Fig. 1 FRENCH EXPORTS TO SWITZERLAND (€ BILLION)
Source: French Customs Authorities, gross figures, FOB, excluding military equipment

CONTRIBUTION OF SWISS SUBSIDIARIES IN FRANCE TO THE FRENCH ECONOMY
In 2015, 606 Swiss subsidiaries in France exported part of their output. Together, these exports amounted to €20.7 billion and accounted, on average, for 30% of total company revenues. Germany, Switzerland and the United Kingdom were the main export destinations for these firms.
In 2015, according to the French National Institute for Statistics and Economic Studies (INSEE), Swiss subsidiaries:
/ Employed 140,051 people, 8% of the workforce of all foreign-owned companies in France.
/ Accounted for 8% of the revenues of all foreign-owned companies in France.
/ Generated 8% of the export revenues of all foreign-owned companies in France.
DESTINATION COUNTRY
SHARE OF EXPORTS
Germany 21%
Switzerland 12%
United Kingdom 12%
Italy 10%
Netherlands 9%
French subsidiary Economic activityShare of export revenues
Nationwide rank
SOCIETE D'AFFRETEMENT ET DE TRANSIT
Chartering and transportation organization N/A 23
CARTIER JOAILLERIE INTERNATIONAL SAS (RICHEMOND S.A.)
Manufacture of jewelry and related articles >90% 79
UGITECH Manufacture of basic iron and steel of ferro-alloys 70%-90% 125
STAUBLI FAVERGES Manufacture of machinery for textile, apparel and leather production 70%-90% 129
NESTLE / NESPRESSO Processing of tea and coffee <50% 150
CONTRIBUTION OF SWISS SUBSIDIARIES IN FRANCE
606 Swiss exporting companies in France (2015)
30% average export ratio of Swiss exporting companies in France (export revenues as a proportion of total revenues) (2015)
FRENCH IMPORTS (2017)
€14.6 billion
in Swiss goods imports to France
+4.3% growth in Swiss imports to France
2.7% of all French imports
#9 supplier
of French imports
Source: French Customs Authorities; French Treasury Directorate calculations
MAIN EXPORT DESTINATIONS FOR SWISS SUBSIDIARIES ESTABLISHED IN FRANCE (2015)
Sources: French Customs Authorities ranking of exporting companies; OrbisKey: In 2016, Société d’Affrètement et de Transit was the leading exporter among Swiss subsidiaries in France, and France’s 23rd largest exporter overall.
TOP FIVE SWISS EXPORTERS IN FRANCE (2016)
Business France - 2017 Annual Report
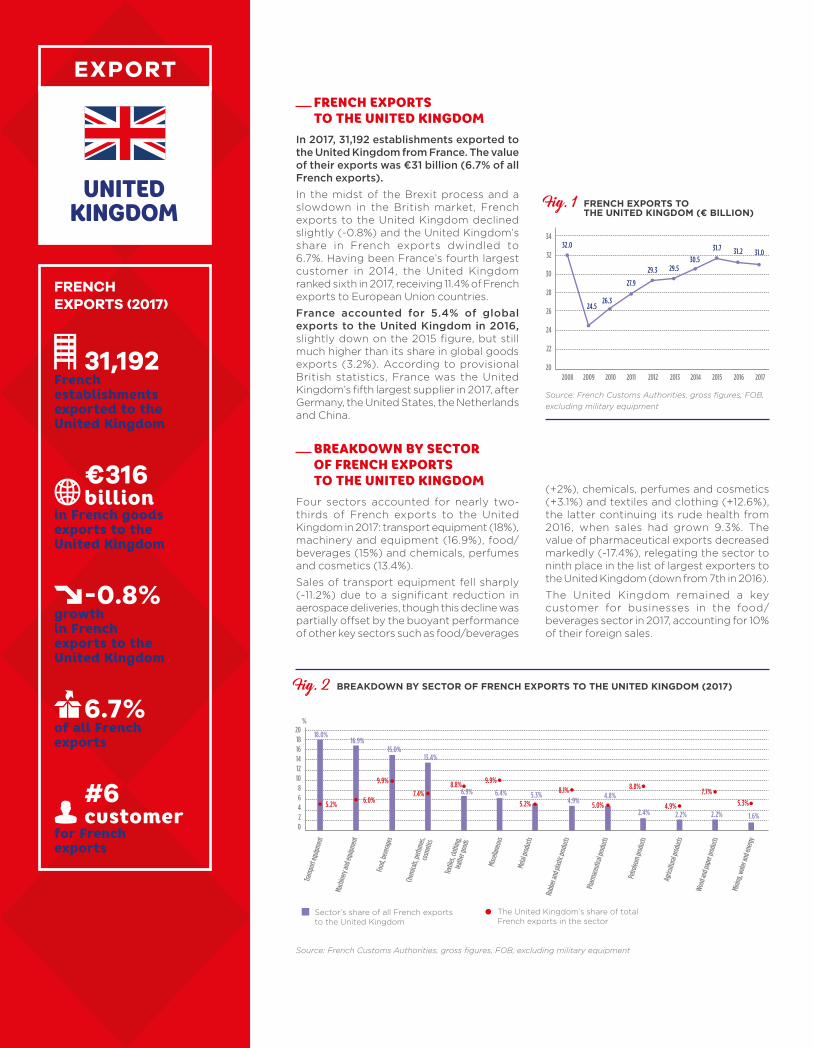
UNITED KINGDOM
EXPORT
FRENCH EXPORTS (2017)
31,192 French establishments exported to the United Kingdom
€316 billion
in French goods exports to the United Kingdom
-0.8% growth in French exports to the United Kingdom
6.7% of all French exports
#6 customer
for French exports
FRENCH EXPORTS TO THE UNITED KINGDOM
In 2017, 31,192 establishments exported to the United Kingdom from France. The value of their exports was €31 billion (6.7% of all French exports).
In the midst of the Brexit process and a slowdown in the British market, French exports to the United Kingdom declined slightly (-0.8%) and the United Kingdom’s share in French exports dwindled to 6.7%. Having been France’s fourth largest customer in 2014, the United Kingdom ranked sixth in 2017, receiving 11.4% of French exports to European Union countries.
France accounted for 5.4% of global exports to the United Kingdom in 2016, slightly down on the 2015 figure, but still much higher than its share in global goods exports (3.2%). According to provisional British statistics, France was the United Kingdom’s fifth largest supplier in 2017, after Germany, the United States, the Netherlands and China.
BREAKDOWN BY SECTOR OF FRENCH EXPORTS TO THE UNITED KINGDOM
Four sectors accounted for nearly two-thirds of French exports to the United Kingdom in 2017: transport equipment (18%), machinery and equipment (16.9%), food/beverages (15%) and chemicals, perfumes and cosmetics (13.4%).
Sales of transport equipment fell sharply (-11.2%) due to a significant reduction in aerospace deliveries, though this decline was partially offset by the buoyant performance of other key sectors such as food/beverages
(+2%), chemicals, perfumes and cosmetics (+3.1%) and textiles and clothing (+12.6%), the latter continuing its rude health from 2016, when sales had grown 9.3%. The value of pharmaceutical exports decreased markedly (-17.4%), relegating the sector to ninth place in the list of largest exporters to the United Kingdom (down from 7th in 2016).
The United Kingdom remained a key customer for businesses in the food/beverages sector in 2017, accounting for 10% of their foreign sales.
Export UK
2008 2009 2010 2011 2012 2013 2014 2015 2016 2017
32.0
24.526.3
27.9
29.3 29.530.5
31.7 31.2 31.0
34
32
30
28
26
24
22
20
%20181614121086420
Trans
port
equip
ment
Mach
inery
and e
quipm
ent
Food
, bev
erage
s
Chem
icals,
perfu
mes,
cosm
etics
Metal
prod
ucts
Pharm
aceu
tical
prod
ucts
Misce
llane
ous
Texti
les, c
lothin
g,lea
ther
good
s
Minin
g, wa
ter an
d ene
rgy
Rubb
er an
d plas
tic pr
oduc
ts
Petro
leum
prod
ucts
Wood
and p
aper
prod
ucts
Agric
ultur
al pr
oduc
ts
18.0%16.9%
15.0%13.4%
6.9% 6.4% 5.3%4.9%
4.8%
2.4% 2.2% 2.2% 1.6%
5.2%6.0%
9.9%
7.4%8.8%
9.9%
5.2%
8.1%
5.0%
8.8%
4.9%
7.7%
5.3%
Sector’s share of all French exports to the United Kingdom
The United Kingdom’s share of total French exports in the sector
Fig. 2 BREAKDOWN BY SECTOR OF FRENCH EXPORTS TO THE UNITED KINGDOM (2017)
Source: French Customs Authorities, gross figures, FOB, excluding military equipment
Export UK
2008 2009 2010 2011 2012 2013 2014 2015 2016 2017
32.0
24.526.3
27.9
29.3 29.530.5
31.7 31.2 31.0
34
32
30
28
26
24
22
20
%20181614121086420
Trans
port
equip
ment
Mach
inery
and e
quipm
ent
Food
, bev
erage
s
Chem
icals,
perfu
mes,
cosm
etics
Metal
prod
ucts
Pharm
aceu
tical
prod
ucts
Misce
llane
ous
Texti
les, c
lothin
g,lea
ther
good
s
Minin
g, wa
ter an
d ene
rgy
Rubb
er an
d plas
tic pr
oduc
ts
Petro
leum
prod
ucts
Wood
and p
aper
prod
ucts
Agric
ultur
al pr
oduc
ts
18.0%16.9%
15.0%13.4%
6.9% 6.4% 5.3%4.9%
4.8%
2.4% 2.2% 2.2% 1.6%
5.2%6.0%
9.9%
7.4%8.8%
9.9%
5.2%
8.1%
5.0%
8.8%
4.9%
7.7%
5.3%
Fig. 1 FRENCH EXPORTS TO THE UNITED KINGDOM (€ BILLION)
Source: French Customs Authorities, gross figures, FOB, excluding military equipment
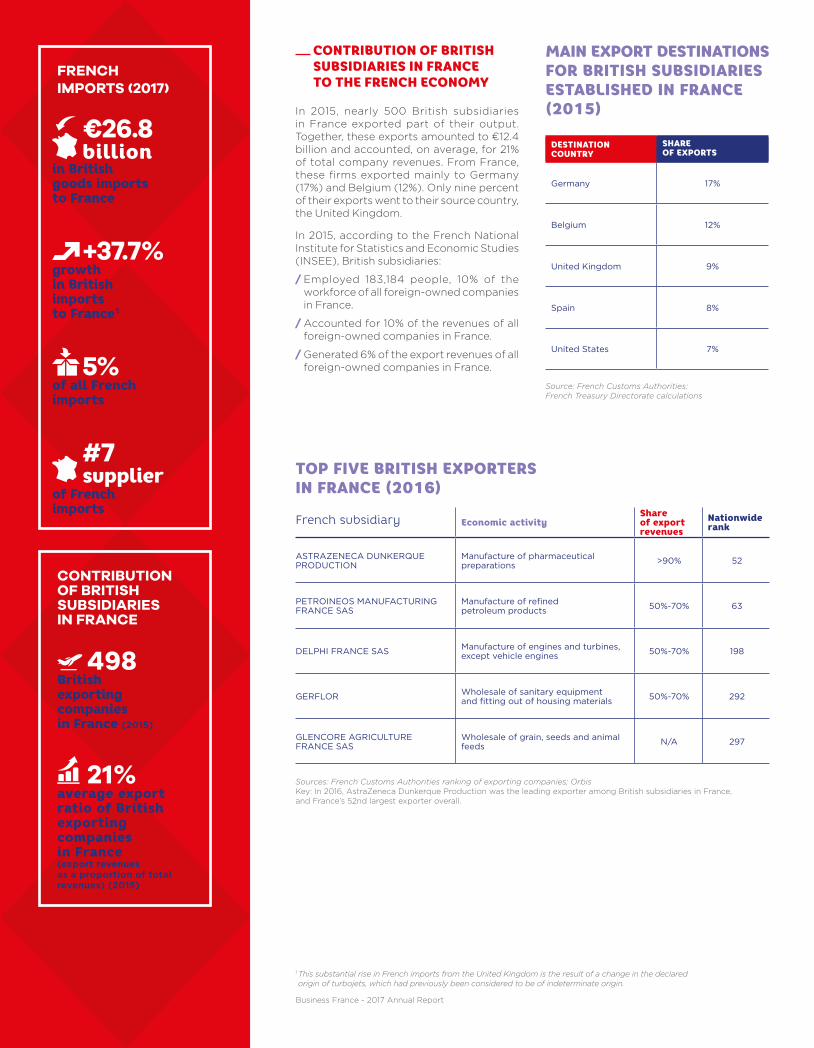
CONTRIBUTION OF BRITISH SUBSIDIARIES IN FRANCE TO THE FRENCH ECONOMY
In 2015, nearly 500 British subsidiaries in France exported part of their output. Together, these exports amounted to €12.4 billion and accounted, on average, for 21% of total company revenues. From France, these firms exported mainly to Germany (17%) and Belgium (12%). Only nine percent of their exports went to their source country, the United Kingdom.
In 2015, according to the French National Institute for Statistics and Economic Studies (INSEE), British subsidiaries:
/ Employed 183,184 people, 10% of the workforce of all foreign-owned companies in France.
/ Accounted for 10% of the revenues of all foreign-owned companies in France.
/ Generated 6% of the export revenues of all foreign-owned companies in France.
DESTINATION COUNTRY
SHARE OF EXPORTS
Germany 17%
Belgium 12%
United Kingdom 9%
Spain 8%
United States 7%
MAIN EXPORT DESTINATIONS FOR BRITISH SUBSIDIARIES ESTABLISHED IN FRANCE (2015)
French subsidiary Economic activityShare of export revenues
Nationwide rank
ASTRAZENECA DUNKERQUE PRODUCTION
Manufacture of pharmaceutical preparations >90% 52
PETROINEOS MANUFACTURING FRANCE SAS
Manufacture of refined petroleum products 50%-70% 63
DELPHI FRANCE SAS Manufacture of engines and turbines, except vehicle engines 50%-70% 198
GERFLOR Wholesale of sanitary equipment and fitting out of housing materials 50%-70% 292
GLENCORE AGRICULTURE FRANCE SAS
Wholesale of grain, seeds and animal feeds N/A 297
TOP FIVE BRITISH EXPORTERS IN FRANCE (2016)
1 This substantial rise in French imports from the United Kingdom is the result of a change in the declared origin of turbojets, which had previously been considered to be of indeterminate origin.
CONTRIBUTION OF BRITISH SUBSIDIARIES IN FRANCE
498 British exporting companies in France (2015)
21% average export ratio of British exporting companies in France (export revenues as a proportion of total revenues) (2015)
FRENCH IMPORTS (2017)
€26.8 billion
in British goods imports to France
+37.7% growth in British imports to France1
5% of all French imports
#7 supplier
of French imports
Source: French Customs Authorities; French Treasury Directorate calculations
Sources: French Customs Authorities ranking of exporting companies; OrbisKey: In 2016, AstraZeneca Dunkerque Production was the leading exporter among British subsidiaries in France, and France’s 52nd largest exporter overall.
Business France - 2017 Annual Report
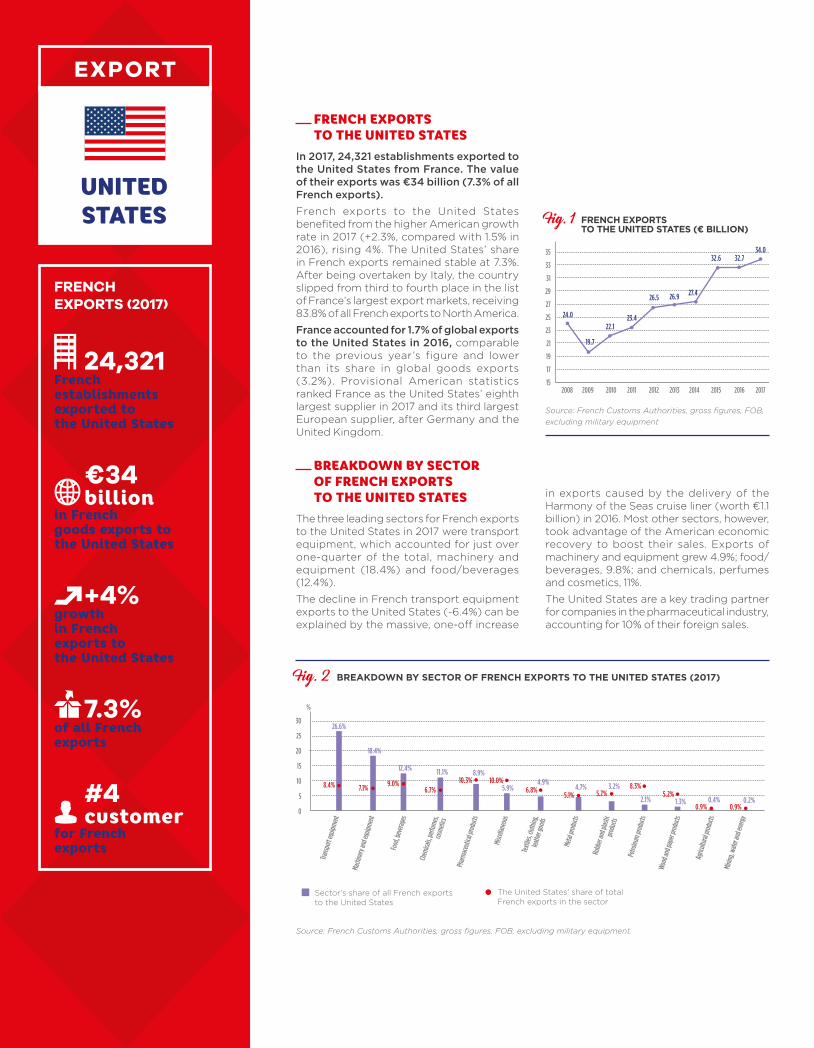
UNITEDSTATES
EXPORT
FRENCH EXPORTS (2017)
24,321 French establishments exported to the United States
€34 billion
in French goods exports to the United States
+4% growth in French exports to the United States
7.3% of all French exports
#4 customer
for French exports
FRENCH EXPORTS TO THE UNITED STATES
In 2017, 24,321 establishments exported to the United States from France. The value of their exports was €34 billion (7.3% of all French exports).
French exports to the United States benefited from the higher American growth rate in 2017 (+2.3%, compared with 1.5% in 2016), rising 4%. The United States’ share in French exports remained stable at 7.3%. After being overtaken by Italy, the country slipped from third to fourth place in the list of France’s largest export markets, receiving 83.8% of all French exports to North America.
France accounted for 1.7% of global exports to the United States in 2016, comparable to the previous year’s figure and lower than its share in global goods exports (3.2%). Provisional American statistics ranked France as the United States’ eighth largest supplier in 2017 and its third largest European supplier, after Germany and the United Kingdom.
BREAKDOWN BY SECTOR OF FRENCH EXPORTS TO THE UNITED STATES
The three leading sectors for French exports to the United States in 2017 were transport equipment, which accounted for just over one-quarter of the total, machinery and equipment (18.4%) and food/beverages (12.4%).
The decline in French transport equipment exports to the United States (-6.4%) can be explained by the massive, one-off increase
in exports caused by the delivery of the Harmony of the Seas cruise liner (worth €1.1 billion) in 2016. Most other sectors, however, took advantage of the American economic recovery to boost their sales. Exports of machinery and equipment grew 4.9%; food/beverages, 9.8%; and chemicals, perfumes and cosmetics, 11%.
The United States are a key trading partner for companies in the pharmaceutical industry, accounting for 10% of their foreign sales.
The United States’ share of total French exports in the sector
Export USA
2008 2009 2010 2011 2012 2013 2014 2015 2016 2017
35
33
31
29
27
25
23
21
19
17
15
24.0
19.7
22.123.4
26.5 26.9 27.4
32.6 32.734.0
30
25
20
15
10
5
0
%
Trans
port
equip
ment
Mach
inery
and e
quipm
ent
Food
, bev
erage
s
Chem
icals,
perfu
mes,
cosm
etics
Pharm
aceu
tical
prod
ucts
Misce
llane
ous
Texti
les, c
lothin
g,lea
ther
good
s
Metal
prod
ucts
Rubb
er an
d plas
ticpr
oduc
ts
Petro
leum
prod
ucts
Wood
and p
aper
prod
ucts
Agric
ultur
al pr
oduc
ts
Minin
g, wa
ter an
d ene
rgy
26.6%
18.4%
12.4% 11.1% 8.9%
5.9%4.9%
4.7% 3.2%
2.1% 1.3% 0.4% 0.2%
8.4% 7.1%9.0%
6.7%10.3% 10.0%
6.8%5.1% 5.7%
8.3%5.2%
0.9% 0.9%
Sector’s share of all French exports to the United States
Fig. 2 BREAKDOWN BY SECTOR OF FRENCH EXPORTS TO THE UNITED STATES (2017)
Source: French Customs Authorities, gross figures, FOB, excluding military equipment
Export USA
2008 2009 2010 2011 2012 2013 2014 2015 2016 2017
35
33
31
29
27
25
23
21
19
17
15
24.0
19.7
22.123.4
26.5 26.9 27.4
32.6 32.734.0
30
25
20
15
10
5
0
%
Trans
port
equip
ment
Mach
inery
and e
quipm
ent
Food
, bev
erage
s
Chem
icals,
perfu
mes,
cosm
etics
Pharm
aceu
tical
prod
ucts
Misce
llane
ous
Texti
les, c
lothin
g,lea
ther
good
s
Metal
prod
ucts
Rubb
er an
d plas
ticpr
oduc
ts
Petro
leum
prod
ucts
Wood
and p
aper
prod
ucts
Agric
ultur
al pr
oduc
ts
Minin
g, wa
ter an
d ene
rgy
26.6%
18.4%
12.4% 11.1% 8.9%
5.9%4.9%
4.7% 3.2%
2.1% 1.3% 0.4% 0.2%
8.4% 7.1%9.0%
6.7%10.3% 10.0%
6.8%5.1% 5.7%
8.3%5.2%
0.9% 0.9%
Fig. 1 FRENCH EXPORTS TO THE UNITED STATES (€ BILLION)
Source: French Customs Authorities, gross figures, FOB, excluding military equipment
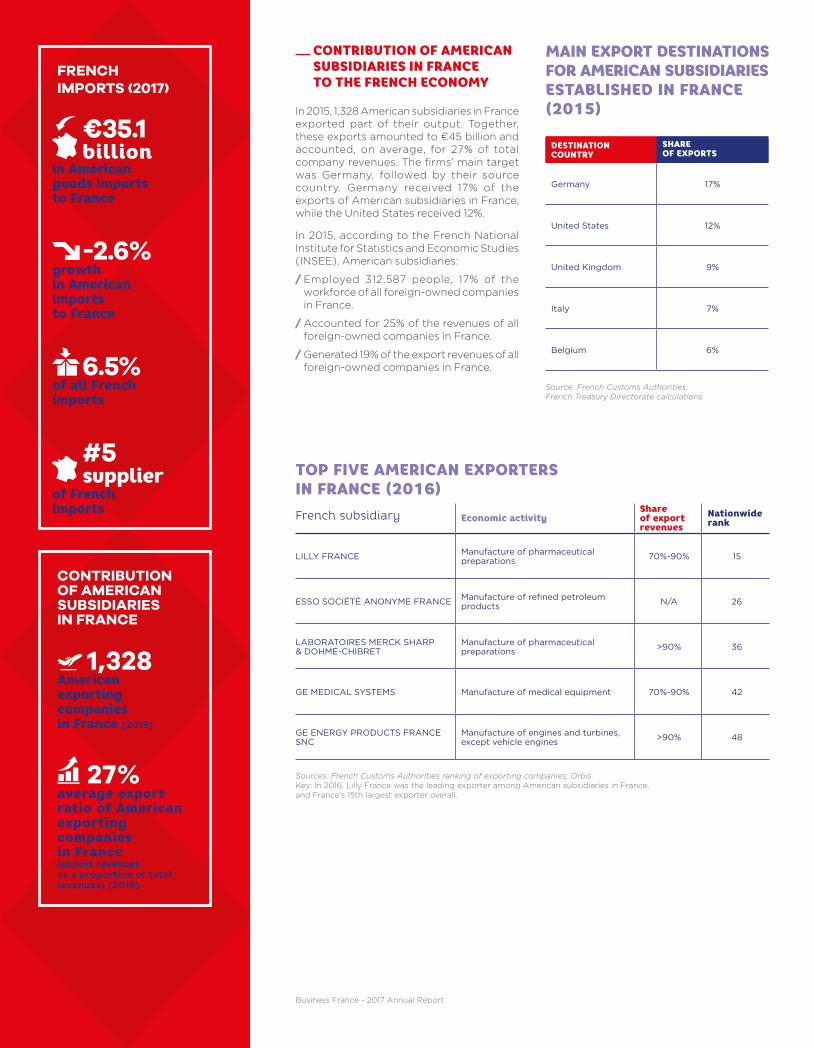
CONTRIBUTION OF AMERICAN SUBSIDIARIES IN FRANCE TO THE FRENCH ECONOMY
In 2015, 1,328 American subsidiaries in France exported part of their output. Together, these exports amounted to €45 billion and accounted, on average, for 27% of total company revenues. The firms’ main target was Germany, followed by their source country. Germany received 17% of the exports of American subsidiaries in France, while the United States received 12%.
In 2015, according to the French National Institute for Statistics and Economic Studies (INSEE), American subsidiaries:
/ Employed 312,587 people, 17% of the workforce of all foreign-owned companies in France.
/ Accounted for 25% of the revenues of all foreign-owned companies in France.
/ Generated 19% of the export revenues of all foreign-owned companies in France.
DESTINATION COUNTRY
SHARE OF EXPORTS
Germany 17%
United States 12%
United Kingdom 9%
Italy 7%
Belgium 6%
French subsidiary Economic activityShare of export revenues
Nationwide rank
LILLY FRANCE Manufacture of pharmaceutical preparations 70%-90% 15
ESSO SOCIÉTÉ ANONYME FRANCE Manufacture of refined petroleum products N/A 26
LABORATOIRES MERCK SHARP & DOHME-CHIBRET
Manufacture of pharmaceutical preparations >90% 36
GE MEDICAL SYSTEMS Manufacture of medical equipment 70%-90% 42
GE ENERGY PRODUCTS FRANCE SNC
Manufacture of engines and turbines, except vehicle engines >90% 48
CONTRIBUTION OF AMERICAN SUBSIDIARIES IN FRANCE
1,328 American exporting companies in France (2015)
27% average export ratio of American exporting companies in France (export revenues as a proportion of total revenues) (2015)
FRENCH IMPORTS (2017)
€35.1 billion
in American goods imports to France
-2.6% growth in American imports to France
6.5% of all French imports
#5 supplier
of French imports
Source: French Customs Authorities; French Treasury Directorate calculations
MAIN EXPORT DESTINATIONS FOR AMERICAN SUBSIDIARIES ESTABLISHED IN FRANCE (2015)
Sources: French Customs Authorities ranking of exporting companies; OrbisKey: In 2016, Lilly France was the leading exporter among American subsidiaries in France, and France’s 15th largest exporter overall.
TOP FIVE AMERICAN EXPORTERS IN FRANCE (2016)
Business France - 2017 Annual Report