Embed Size (px)
Citation preview

The Internal Dynamics of Mini c TAR DNA Probed by ElectronParamagnetic Resonance of Nitroxide Spin-Labels at the Lower Stem,the Loop, and the BulgeYan Sun,† Ziwei Zhang,‡,∥ Vladimir M. Grigoryants,† William K. Myers,†,⊥ Fei Liu,† Keith A. Earle,§
Jack H. Freed,‡ and Charles P. Scholes*,†
†Department of Chemistry, University at Albany, 1400 Washington Avenue, Albany, New York 12222, United States‡Department of Chemistry and Chemical Biology and ACERT, Cornell University, Ithaca, New York 14853, United States§Department of Physics, University at Albany, 1400 Washington Avenue, Albany, New York 12222, United States
*S Supporting Information
ABSTRACT: Electron paramagnetic resonance (EPR) at 236.6 and 9.5GHz probed the tumbling of nitroxide spin probes in the lower stem, inthe upper loop, and near the bulge of mini c TAR DNA. High-frequency236.6 GHz EPR, not previously applied to spin-labeled oligonucleotides,was notably sensitive to fast, anisotropic, hindered local rotational motionof the spin probe, occurring approximately about the NO nitroxide axis.Labels attached to the 2′-aminocytidine sugar in the mini c TAR DNAshowed such anisotropic motion, which was faster in the lower stem, aregion previously thought to be partially melted. More flexible labels attached to phosphorothioates at the end of the lower stemtumbled isotropically in mini c TAR DNA, mini TAR RNA, and ψ3 RNA, but at 5 °C, the motion became more anisotropic forthe labeled RNAs, implying more order within the RNA lower stems. As observed by 9.5 GHz EPR, the slowing of nanosecondmotions of large segments of the oligonucleotide was enhanced by increasing the ratio of the nucleocapsid protein NCp7 to minic TAR DNA from 0 to 2. The slowing was most significant at labels in the loop and near the bulge. At a 4:1 ratio of NCp7 tomini c TAR DNA, all labels reported tumbling times of >5 ns, indicating a condensation of NCp7 and TAR DNA. At the 4:1ratio, pulse dipolar EPR spectroscopy of bilabels attached near the 3′ and 5′ termini showed evidence of an NCp7-inducedincrease in the 3′−5′ end-to-end distance distribution and a partially melted stem.
The purpose of this study is to understand the internaldynamics of a model stem−loop oligonucleotide from
HIV-1 and the change in these dynamics upon its interactionwith HIV-1 nucleocapsid protein NCp7. The stem−loopstructure is found in the TAR (transactivation response)region of c TAR DNA and TAR RNA. As shown both in vivo1,2
and in vitro,3,4 the binding of NCp7 inhibits self-priming withinsuch a stem−loop structure and promotes annealing for theformation of duplexes between complementary TAR RNA andTAR DNA. In vitro annealing has been conducted inquantitative kinetic detail3,4 using “mini c TAR DNA” (Figure1A). As we have previously shown with the simpler ψ3 RNAstem−loop structure,5 stem−loop oligonucleotide complexeswith NCp7 undergo structural rearrangements, whose dynam-ics are amenable to EPR spin-label methods. NCp7 (Figure 1B)is adapted for specific binding to a diversity of oligonucleotidesin base-unpaired regions by hydrophobic and hydrogenbonding, and electrostatic interactions between cationicNCp7 and anionic oligonucleotides enhance both specific andnonspecific binding.Mini c TAR DNA (Figure 1A) has an apical loop and an
internal bulge, both containing unpaired bases and potentialcenters for dynamic structural modulation and NCp7 binding.Imino hydrogen exchange has provided evidence of an
intrinsically destabilized double-strand region below thebulge.6 Nuclear magnetic resonance (NMR) techniques thatresolve residual dipolar couplings have pointed to the internalbulge of TAR RNA as a locus for large bending motions and forexchange between conformations adapted to the recognition ofsmall molecule inhibitors and TAR binding proteins like NCp7and TAT.7−10 NMR structures of mini c TAR DNA arelikewise consistent with several coexisting conformations,6,11
and the TAR DNA structure, as opposed to the TAR RNAstructure, is a less stable, more dynamic structure and is moreopen to NCp7 perturbation.In our previous EPR work, only the 5′ terminus of the ψ3
RNA stem was labeled.5 In contrast, we now extend our studyto a comparison of dynamic EPR signatures in the stem (SLA,SLB, and SL2), loop (SL1), and bulge (SL3) of the morecomplex TAR, and we additionally use high-sensitivity, high-field EPR for this purpose.12 A previous spin-label study ofoligonucleotides used only low-field 0.35 T, 9.5 GHz X-bandEPR to monitor site-specific spin probes.13−20 High-field, high-frequency 8.4 T, 236.6 GHz EPR12,21−24 is now a mature
Received: August 5, 2012Revised: September 21, 2012Published: September 25, 2012
Article
pubs.acs.org/biochemistry
© 2012 American Chemical Society 8530 dx.doi.org/10.1021/bi301058q | Biochemistry 2012, 51, 8530−8541

technique that is sufficiently sensitive that it provides spectrafrom ∼100 μM solutions of oligonucleotides in aqueoussolution. High-frequency, high-field EPR provides much betterdefinition of the fast (subnanosecond) components of probemotion because the high field markedly increases theimportance of the nitroxide g tensor in determining spectralline shape. The slowly relaxing local structure (SRLS)model12,25−27 has become available for fitting spin-label spectrathat result from fast internal motion of a spin-label restrainedon a more slowly tumbling macromolecule, and it can be usedto reduce spectral ambiguity by simultaneous analysis of spectraat, e.g., 236.6 and 9.5 GHz. Through a combination of 236.6and 9.5 GHz EPR, supplemented by spectra from intermediatefrequencies in the future, one will even more readily be able tospectroscopically separate the global tumbling and large-scalenanosecond bending motions from fast internal subnanosecondfluctuations at the probe.27
The spin-label attached at the 5′ terminus of ψ3 RNAthrough a thio−amido linkage5 had its tumbling as reported inprior 9.5 GHz experiments progressively impeded by addedNCp. In this work, we have extended spin-label monitoringsites to the stem, loop, and bulge structures of mini c TARDNA using less mobile ureido−2′-amino linkages at SL2, SL1,and SL3, respectively, and for the 3′ and 5′ ends, using thethio−amido linkages as described previously with ψ3 RNA.Loop, bulge, and destabilized stem regions have all beenproposed and frequently found to be specific targets for NCp7in its interaction with TAR RNA and TAR DNA stem−loopoligonucleotides,7−10,28−30 and thus, we monitor them. Arecent NMR-monitored study of mini c TAR DNA bound to11−55 NCp7 (which lacks the highly basic, cationic tail ofresidues 1−10 of 1−55 NCp7) showed tryptophan inter-calation and hydrogen bonding to unpaired bases in the lowerstem below the bulge, but that study also reported gelretardation evidence for another weaker binding elsewhere.11
Although a previous 9.5 GHz EPR study by Sigurdsson and co-workers, using a form of TAR RNA lacking the apical loop,reported perturbation to the label EPR signal from binding ofTAR inhibitors and peptides, there was no study of theinteraction of TAR forms with NCp7.14−16,18
At low ionic strengths when the ratio of NCp7 to ψ3 RNAbases was 6−7, a marked decrease in the rate of probe tumblingoccurred.5 Such a decrease indicated large, slowly tumbling ψ3RNA−NCp7 complexes. The decreased rate of probe tumblingdepended not only on ionic strength-dependent electrostaticattraction between cationic NCp7 and anionic RNA but also onthe presence of intact Zn fingers of NCp7. Motivated by the invitro annealing of mini c DNA and mini TAR RNA,3,31 wefollow now the change in dynamics of our mini c TAR DNA ata coverage of approximately six to seven bases per NCp7. At acoverage of six to seven bases per NCp7, NCp7 performs as achaperoning agent that will recognize secondary structureswithin individual nucleotide strands, destabilize these secondarystructures, and enhance subsequent annealing of complemen-tary oligonucleotides into duplexes.Previous fluorescence resonance energy transfer (FRET)
studies have provided evidence of the existence of destabilizedsecondary structure in the c TAR DNA when it is covered withNCp7.32−34 Here pulse dipolar spectroscopy (PDS) is used toprobe the distances and distance distributions between bilabelsconnected to 3′ (SLB) and 5′ (SLA) ends of mini c TAR DNAat a coverage of approximately six to seven bases per NCp7 as amonitor of the unwinding and destabilization of the stemstructure. Because of the smaller nitroxide probes, their shortertethers, and mathematically reliable method for extracting pairdistributions,35,36 the pulsed EPR technique provides not onlyprecise distances (whereas FRET provides distance estimates)but also explicit quantitative information about the distributionof end-to-end distances in NCp7-destabilized mini c TARDNA. This study is thus primarily a dynamic study, but pulsedipolar spectroscopy yields relevant structural informationabout the destabilization of the DNA double strand within theNCp7-destabilized c TAR DNA structure.
■ MATERIALS AND METHODSPreparation and Characterization of Spin-Labeled
Mini c TAR Derivatives. Spin-labels were attached atpositions SLA, SLB, SL1, SL2, and SL3 shown in Figure 2.The thio-amido phosphorothioate method of label attach-
ment used for SLA and SLB is similar in its chemistry and itsoligonucleotide end location to that used to label the ψ3 RNAin our previous efforts5 because study of end-labeled mini cTAR DNA followed shortly upon the ψ3 RNA work. A 3-iodomethyl compound with a shorter tether to the nitroxidehas more recently been used for making thio-ether end-labeledTAR RNA and will be used in the future for bilabel studies ofboth mini TAR RNA and mini c TAR DNA. Mini c TAR DNAwith phosphorothioate modification was purchased fromTrilink (TriLink Bio Technologies, San Diego, CA) or IDT(Integrated DNA Technologies, Inc., Skokie, IL). Spin-labelsSLA and SLB, at the 5′ and 3′ termini, respectively, wereattached by reacting iodo-spin-label precursors to phosphor-othioate.37 3-(2-Iodoacetamide) proxyl (IPSL) and 3-iodo-methyl-(1-oxy-2,2,5,5-tetramethylpyrroline) were purchasedfrom Toronto Research Chemicals (North York, ON). Scheme1 shows the thio-phosphorothioate methods of attaching spin-labels.Labels SL1−SL3 in the loop, in the stem, and near the bulge
of mini c TAR DNA, respectively, were attached by the reactionof a 4-isocyanoto TEMPO (Toronto Research Chemicals)spin-label precursor to a 2′-amino group on a cytidine sugar14
to form a 2′-ureido−2′-amino linkage as shown in Scheme 2.Mini c TAR DNAs with specific 2′-amino groups in the loop
Figure 1. (A) Secondary structure of mini c TAR DNA and mini TARRNA and the position of spin-labels used in this study primarily ofmini c TAR DNA. (B) Primary structure of 1−55 NCp7.
Biochemistry Article
dx.doi.org/10.1021/bi301058q | Biochemistry 2012, 51, 8530−85418531

(SL1), stem (SL2), or bulge (SL3) were obtained from TriLinkBio Technologies. The ureido linkage to the 2′-amino waschosen rather than a phosphorothioate linkage for our initialstudy of stem, loop, and bulge regions, because it was expectedthat the 2′-amino linkage would have less intrinsic mobility andwould better report motion of the oligonucleotide to which itwas tethered. For both the phosphorothioate and the 2′-aminomethods of attachment, the detailed protocols for labelattachment, for gel and HPLC purification, and for analysisof labeled product are provided in the Supporting Information(Figures 1S−3S). (Possible Rp and Sp diastereomers ofphosphorothioate linkages38 were not separated.)
Preparation of Nucleocapsid Protein NCp7. NCp7 wasprepared by solid phase peptide synthesis and with analysismethods similar to those described previously.5,39−41 The finalNCp7 concentration was determined by using an extinctioncoefficient (ε280) of 6050 M−1 cm−1.42
Nondenaturing Gel Shift Assays. The interaction ofNCp7 and mini c TAR DNA was monitored by nondenaturinggel assays as described previously for ψ3 RNA,
5 and these areshown in Figure 4S of the Supporting Information to provide atvarious NCp7:c TAR DNA ratios a comparison of NCp7binding to spin-labeled mini c DNA and NCp7 binding tounlabeled mini c TAR DNA. The spin-labeled and nonlabeledforms of mini c TAR DNA showed extremely similar NCp7binding. The mini c TAR DNA by itself, either labeled orunlabeled, traveled fastest with unlabeled traveling slightlyfaster. At a ≥1:1 NCp7:mini c TAR DNA ratio, a low-molecular weight complex appeared, traveling slightly slowerthan the 30 bp marker that, in analogy with the findings on ψ3RNA, indicated a 1:1 complex. At higher ratios, more diffuse,more slowly moving, higher-molecular weight complexesappeared.
Melting of Labeled and Unlabeled Mini c TAR DNA.UV absorbance profiles at 260 nm, reflecting the hyperchromicincrease caused by duplex melting, were obtained as a functionof temperature in the range of 20−95 °C for both labeled andunlabeled mini c TAR DNA at a concentration of 2 μM. Themelting profile was obtained by taking the first derivative of the
Figure 2. Positions of SLA, SLB, SL1, SL2, and SL3 that were thelabeling sites on mini c TAR DNA. SLA and SLB, which are at the 5′and 3′ termini, respectively, were attached by phosphorothioatelinkages using iodo precursors. SL1−SL3, which are at cytidines of theloop, lower stem, and bulge region, respectively, were attached at a 2′-amino group on cytidine sugars via a ureido−2′-amino linkage.
Scheme 1. Reaction (a) of a Phosphorothioate Sulfur with 3-Iodomethyl-(1-oxy-2,2,5,5-tetramethylpyrroline) (blue) To Form aPhosphorothioate linkage and a Similar Reaction (b) with a 3-(2-Iodoacetamino) Proxyl Spin-Label (red)
Scheme 2. Reaction of the 4-Isocyanato TEMPO Spin-Labelwith 2′-Aminocytidine To Form a Ureido−2′-AminoLinkage
Biochemistry Article
dx.doi.org/10.1021/bi301058q | Biochemistry 2012, 51, 8530−85418532
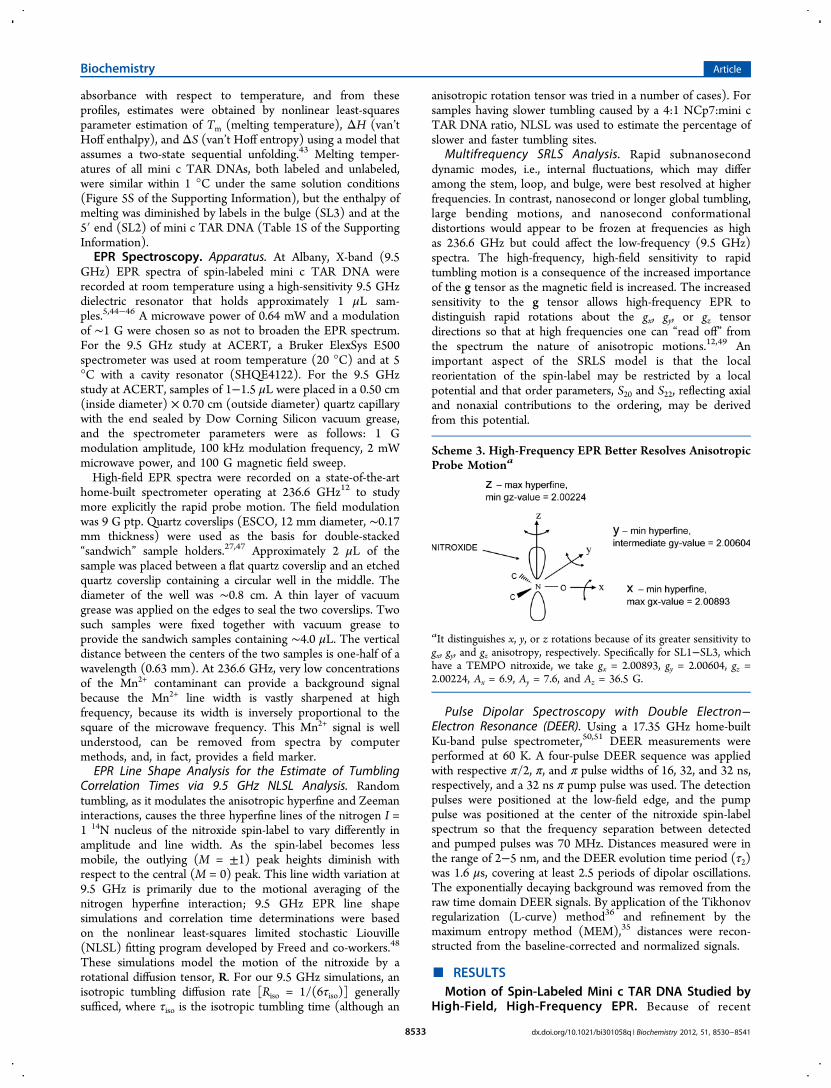
absorbance with respect to temperature, and from theseprofiles, estimates were obtained by nonlinear least-squaresparameter estimation of Tm (melting temperature), ΔH (van’tHoff enthalpy), and ΔS (van’t Hoff entropy) using a model thatassumes a two-state sequential unfolding.43 Melting temper-atures of all mini c TAR DNAs, both labeled and unlabeled,were similar within 1 °C under the same solution conditions(Figure 5S of the Supporting Information), but the enthalpy ofmelting was diminished by labels in the bulge (SL3) and at the5′ end (SL2) of mini c TAR DNA (Table 1S of the SupportingInformation).EPR Spectroscopy. Apparatus. At Albany, X-band (9.5
GHz) EPR spectra of spin-labeled mini c TAR DNA wererecorded at room temperature using a high-sensitivity 9.5 GHzdielectric resonator that holds approximately 1 μL sam-ples.5,44−46 A microwave power of 0.64 mW and a modulationof ∼1 G were chosen so as not to broaden the EPR spectrum.For the 9.5 GHz study at ACERT, a Bruker ElexSys E500spectrometer was used at room temperature (20 °C) and at 5°C with a cavity resonator (SHQE4122). For the 9.5 GHzstudy at ACERT, samples of 1−1.5 μL were placed in a 0.50 cm(inside diameter) × 0.70 cm (outside diameter) quartz capillarywith the end sealed by Dow Corning Silicon vacuum grease,and the spectrometer parameters were as follows: 1 Gmodulation amplitude, 100 kHz modulation frequency, 2 mWmicrowave power, and 100 G magnetic field sweep.High-field EPR spectra were recorded on a state-of-the-art
home-built spectrometer operating at 236.6 GHz12 to studymore explicitly the rapid probe motion. The field modulationwas 9 G ptp. Quartz coverslips (ESCO, 12 mm diameter, ∼0.17mm thickness) were used as the basis for double-stacked“sandwich” sample holders.27,47 Approximately 2 μL of thesample was placed between a flat quartz coverslip and an etchedquartz coverslip containing a circular well in the middle. Thediameter of the well was ∼0.8 cm. A thin layer of vacuumgrease was applied on the edges to seal the two coverslips. Twosuch samples were fixed together with vacuum grease toprovide the sandwich samples containing ∼4.0 μL. The verticaldistance between the centers of the two samples is one-half of awavelength (0.63 mm). At 236.6 GHz, very low concentrationsof the Mn2+ contaminant can provide a background signalbecause the Mn2+ line width is vastly sharpened at highfrequency, because its width is inversely proportional to thesquare of the microwave frequency. This Mn2+ signal is wellunderstood, can be removed from spectra by computermethods, and, in fact, provides a field marker.EPR Line Shape Analysis for the Estimate of Tumbling
Correlation Times via 9.5 GHz NLSL Analysis. Randomtumbling, as it modulates the anisotropic hyperfine and Zeemaninteractions, causes the three hyperfine lines of the nitrogen I =1 14N nucleus of the nitroxide spin-label to vary differently inamplitude and line width. As the spin-label becomes lessmobile, the outlying (M = ±1) peak heights diminish withrespect to the central (M = 0) peak. This line width variation at9.5 GHz is primarily due to the motional averaging of thenitrogen hyperfine interaction; 9.5 GHz EPR line shapesimulations and correlation time determinations were basedon the nonlinear least-squares limited stochastic Liouville(NLSL) fitting program developed by Freed and co-workers.48
These simulations model the motion of the nitroxide by arotational diffusion tensor, R. For our 9.5 GHz simulations, anisotropic tumbling diffusion rate [Riso = 1/(6τiso)] generallysufficed, where τiso is the isotropic tumbling time (although an
anisotropic rotation tensor was tried in a number of cases). Forsamples having slower tumbling caused by a 4:1 NCp7:mini cTAR DNA ratio, NLSL was used to estimate the percentage ofslower and faster tumbling sites.
Multifrequency SRLS Analysis. Rapid subnanoseconddynamic modes, i.e., internal fluctuations, which may differamong the stem, loop, and bulge, were best resolved at higherfrequencies. In contrast, nanosecond or longer global tumbling,large bending motions, and nanosecond conformationaldistortions would appear to be frozen at frequencies as highas 236.6 GHz but could affect the low-frequency (9.5 GHz)spectra. The high-frequency, high-field sensitivity to rapidtumbling motion is a consequence of the increased importanceof the g tensor as the magnetic field is increased. The increasedsensitivity to the g tensor allows high-frequency EPR todistinguish rapid rotations about the gx, gy, or gz tensordirections so that at high frequencies one can “read off” fromthe spectrum the nature of anisotropic motions.12,49 Animportant aspect of the SRLS model is that the localreorientation of the spin-label may be restricted by a localpotential and that order parameters, S20 and S22, reflecting axialand nonaxial contributions to the ordering, may be derivedfrom this potential.
Pulse Dipolar Spectroscopy with Double Electron−Electron Resonance (DEER). Using a 17.35 GHz home-builtKu-band pulse spectrometer,50,51 DEER measurements wereperformed at 60 K. A four-pulse DEER sequence was appliedwith respective π/2, π, and π pulse widths of 16, 32, and 32 ns,respectively, and a 32 ns π pump pulse was used. The detectionpulses were positioned at the low-field edge, and the pumppulse was positioned at the center of the nitroxide spin-labelspectrum so that the frequency separation between detectedand pumped pulses was 70 MHz. Distances measured were inthe range of 2−5 nm, and the DEER evolution time period (τ2)was 1.6 μs, covering at least 2.5 periods of dipolar oscillations.The exponentially decaying background was removed from theraw time domain DEER signals. By application of the Tikhonovregularization (L-curve) method36 and refinement by themaximum entropy method (MEM),35 distances were recon-structed from the baseline-corrected and normalized signals.
■ RESULTSMotion of Spin-Labeled Mini c TAR DNA Studied by
High-Field, High-Frequency EPR. Because of recent
Scheme 3. High-Frequency EPR Better Resolves AnisotropicProbe Motiona
aIt distinguishes x, y, or z rotations because of its greater sensitivity togx, gy, and gz anisotropy, respectively. Specifically for SL1−SL3, whichhave a TEMPO nitroxide, we take gx = 2.00893, gy = 2.00604, gz =2.00224, Ax = 6.9, Ay = 7.6, and Az = 36.5 G.
Biochemistry Article
dx.doi.org/10.1021/bi301058q | Biochemistry 2012, 51, 8530−85418533

sensitivity advances 27 in high-frequency, high-field EPR, fasterinternal probe motion can be better understood. The spectra inFigure 3 provide a comparison of 9.5 and 236.6 GHz EPR
spectra from mini c TAR DNA labeled at SL1, SL2, SL3, SLB,mini TAR RNA 3′ end labeled at SLB, and ψ3 RNA labeled atits 5′ end.a The 9.5 GHz spectra, all having three fairly narrowlines, indicated an ostensibly isotropic tumbling with acorrelation time on the order of 1 ns, like that of previouslyreported spin-labeled ψ3 RNA.5 However, there was aspectroscopic contrast at 236.6 GHz among the samples ofmini c TAR DNA, mini TAR RNA, and ψ3 RNA that werephosphorothioate end-labeled and the samples that werelabeled by ureido−2′-amino linkages at SL1−SL3.a Thecontrast is due to differences in fast subnanosecond tumblingthat is well sensed at 236.6 GHz, but not at 9.5 GHz. SL1−SL3performed rapid, subnanosecond anisotropic motion about apreferential axis, which was at or near their nitroxide gxmagnetic axis (see Scheme 3 for the definition of axes). Thereorientation of the gx axis itself, with respect to the overallmacromolecule, was considerably slower. The details of such
anisotropic motions, in terms of a local rotation tensor and anordering potential, are provided in Discussion. The end-labeledspecies of SLB mini c TAR DNA, SLB mini TAR RNA, and ψ3RNA all showed rapid isotropic tumbling that interchanged x, y,and z axes in <1 ns.There was a difference in the 236.6 GHz EPR line shape
between the mini c TAR DNA and the two RNA derivatives, alllabeled at or near the end of their stem. This difference,although marginally evident in the 20 °C spectra of Figure 3,was noteworthy at 5 °C as shown in Figure 4. The motion of
the label on the mini TAR RNA slowed more than that of thecorresponding label on the mini c TAR DNA and, by betterresolution of its low-field gx shoulder, gave evidence of anincreased anisotropy to its label motion at 5 °C. The label atthe 5′ end of the ψ3 RNA similarly slowed and showed evidenceof anisotropic motion at lower temperatures. The thio-amidolabel was used for labeling the mini c TAR DNA and the ψ3RNA, and this label has potentially more flexible bondsbetween its phosphorothioate point of attachment and thenitroxide than does the thio-ether bond used for labeling themini TAR RNA. However, see footnote b. Nevertheless, thelabel on the ψ3 RNA, even though it is attached to the very endof the ψ3 RNA oligonucleotide rather than between the finaland penultimate nucleotides as in SLB mini c TAR DNA,showed less mobility and more anisotropy at 5 °C than did thesame label on the mini c TAR DNA.
Motion of Spin-Labeled Mini c TAR DNA in thePresence of NCp7. This section focuses on the dynamicchanges due to added NCp7 as reported by spin-labels on minic TAR DNA. Because 9.5 GHz EPR is sensitive to slowernanosecond tumbling times, these studies with NCp7 bindingat a number of mini c TAR DNA:NCp7 ratios were undertakenwith 9.5 GHz EPR.c The changes in the spin-label spectra uponaddition of the first NCp7 and then the second NCp7 areshown in Figure 5A. In all cases, the tumbling of the spin-labels
Figure 3. ESR spectra of mini c TAR DNA labeled at positions SL1,SL2, SL3, and SLB, mini TAR RNA labeled at its 3′ (SLB) terminus,and ψ3 RNA labeled at its 5′ terminus. Concentrations of labels wereapproximately 100 μM (except that of SL3, which was 250 μM) in 20mM Hepes (pH 7.5), 20 mM NaCl, and 0.2 mM Mg2+ at 20 °C. Thespectra are compared at EPR frequencies of 9.5 and 236.6 GHz toshow the resolving power of high-frequency EPR for differences inmotion. EPR conditions are given in Materials and Methods. Thefeatures labeled Mn2+ are due to low-level Mn2+ impurities whose lineshapes are vastly sharpened at high frequencies and provide effectiveinternal field markers.
Figure 4. 236.6 GHz EPR spectra at 20 and 5 °C showingtemperature-dependent differences in line shape that were observedfor end-labeled SLB mini c TAR DNA, SLB mini TAR RNA, and ψ3RNA. The difference in the enclosed low-field region is largest at 5 °C.Besides the temperature, conditions for obtaining these spectra are asdescribed in the legend of Figure 3.
Biochemistry Article
dx.doi.org/10.1021/bi301058q | Biochemistry 2012, 51, 8530−85418534

was slowed by the NCp7, and different spin-label sites reporteddifferent sensitivities to NCp7. The probes at the loop (SL1)and bulge (SL3) were the slowest at the beginning and weremost slowed by binding of NCp7. SL2 in the stem was fasterand was less slowed by binding of NCp7. The simplified lineshape analysis by a single isotropic correlation time, τiso,
48,52
provided a semiempirical parameter for comparing differencesin probe motion. Thus, a bar graph of τiso values is provided inFigure 5B, to show which probes were most impeded byaddition of NCp7. Representative simulations used to obtainτiso from 9.5 GHz data are provided in Figure 6S of theSupporting Information.When the NCp7:mini c TAR DNA ratio was increased to
4:1, there was a considerable slowing (tumbling time increasedfrom ∼1.0 to >5 ns) in the motion of the spin-label, where thebroadening of the signals due to slowing of the tumbling isshown best by the integrated absorption EPR presentation inFigure 6. This phenomenon occurred for all the spin-labelsstudied and at a coverage of approximately seven nucleotidesper NCp7, corresponding to four NCp7 molecules per mini cTAR DNA (noting that mini c TAR DNA is a 27-mer). Theline shape broadening occurred at approximately the sameNCp7 coverage where the previous study of ψ3 RNA stem−loop structures5 also showed considerable slowing. Interest-ingly, Figure 7 in the first-derivative mode indicates twodifferently mobile species for spin labeling site SLB under thecondition where the NCp7:mini c TAR DNA molecular ratio is≥4:1. As in the case of ψ3 RNA, the immobilization in the
presence of NCp7 coverage could be largely eliminated byincreasing the ionic strength. We show representative 9.5 GHzEPR spectra in the presence of a 4:1 NCp7:mini c TAR DNAmolecular ratio in Figure 7S of the Supporting Information,where there is progressive line shape narrowing as the NaClconcentration is increased from 20 mM to 150 mM to 400 mM.
Changes to Mini c TAR DNA at a 4:1 NCp7:Mini c TARDNA Molar Ratio. The structure of the mini c TAR DNAwithin the slowly moving multi-NCp7 complexes provided auseful complement to the dynamic studies described above,especially because such complexes are not amenable tostandard structural NMR and X-ray methods. For this reason,
Figure 5. (A) 9.5 GHz EPR signals from mini c TAR DNA single spin-labels titrated with 0, 1, and 2 equiv of NCp7. The temperature was 20°C, with a field modulation of 1.3 G. Spectra were normalized to thesame number of spins by double integration. (B) Simplified isotropiccorrelation times (τiso) of spin-labeled c TAR DNA species derivedfrom the spectra in panel A by fitting spectra by the NLSL routine.48,52
Figure 6. Comparison of the absorption 9.5 GHz EPR line shapes ofthe spin-labeled mini c TAR DNAs at low ionic strengths. TheNCp7:mini c TAR DNA ratio was increased to ≥4, where a slowlytumbling complex forms. Spectra were normalized on the secondintegral. Sample conditions: 20 mM HEPES, 20 mM NaCl, 0.2 mMMgCl2, pH 7.5, 20 °C. The mini c TAR DNA concentration was 100μM.
Figure 7. First-derivative 9.5 GHz EPR spectra obtained at roomtemperature from SLB-labeled mini c TAR DNA in the presence of a4:1 NCp7:mini c TAR DNA molar ratio. The spectra show evidenceof two differently immobilized species, one with a τiso of ∼2.3 ns andthe other with a τiso of ∼6.8 ns.
Biochemistry Article
dx.doi.org/10.1021/bi301058q | Biochemistry 2012, 51, 8530−85418535

pulse dipolar spectroscopy (DEER) was performed on mini cTAR DNA that had been bilabeled at the SLA and SLB endpositions by thio-amido labels. DEER spectra were taken bothin the absence of NCp7 and in the presence of a 4:1NCp7:mini c TAR DNA ratio. Figure 8 indicates the increasedinterprobe distance and the broadening of the distancedistribution between bilabels SLA and SLB in the presence ofa 4:1 NCp7:mini c TAR DNA ratio. There was still a largefraction of the mini c TAR DNA that approximately maintainedthe original SLA−SLB distance, while the remainder adopted alonger interprobe distance with greater breadth overall to itsinterprobe distribution.
■ DISCUSSION
Detailed Motion Inferred from Simultaneous SRLSSimulations of 9.5 and 236.6 GHz EPR Spectra. In Figure3, the effects of the motion of the probe, notably for SL1, SL2,and SL3 that have ureido−2′-amino spin-label linkages, arebetter resolved at high frequency. The spin-labels on mini cTAR DNA, mini TAR RNA, and ψ3 RNA coupled by the moreflexible phosphorothioate linkages at the end of the stem−loopstructure showed isotropic tumbling at 236.6 GHz and 20 °C,but at 5 °C, the tumbling reported by the RNA samples showedincipient anisotropic motion about the gx axis, as indicated inFigure 4.Because of the anisotropy of motion observed from their
236.6 GHz spectra, SL1, SL2, and SL3 were chosen for acomprehensive SRLS fit that included the local rapid diffusiontensor of the spin probe, a potential that in coupling the localrapid diffusion tensor to the global macromolecular tumblingled to an order tensor, and the global diffusion tensor of theentire mini c TAR DNA molecule. Such multiparameter,multifrequency simulations have been used to good effect toelucidate label motion for site-directed labels on proteins,notably in the study of T4 lysozyme.27 This work is the first
application of high-sensitivity, high-frequency EPR to spin-labeled oligonucleotides.The combined 9.5 and 236.6 GHz spectra of SL1, SL2, and
SL3 were simulated using the SRLS model program, in whichRx, Ry, Rz, c20, and Rc were varied as fitting parameters. Rx, Ry,and Rz are the components of the anisotropic rotationaldiffusion tensor localized on the probe. The molecularrotational axis labels x, y, and z are the same as those of thegx, gy, and gz axes, respectively (Scheme 3). Rc is the diffusioncoefficient for global tumbling. The dimensionless parameterc20 refers to the axial restraining potential that couples localprobe motion to overall global tumbling. S20 is the orderparameter associated with the potential parameter c20; S20 variesfrom zero, meaning no potential and hence no local ordering,to unity, meaning perfect alignment, i.e., zero flexibility. The S20value of ≈ 0.4 in Table 1 indicates behavior intermediatebetween these limits. The resultant parameters are listed inTable 1, and the spectra are overlaid with the resultingsimulations in Figure 9. As shown in Table 1, Rx ∼ 3.3Ry ≫ Rz.This means that the x-axis and, to a lesser extent, the y-axis arethe fast axes for the local motion of the probe. These local fastsubnanosecond motions of Rx and Ry appear to be influencedby the local nucleotide environment, where SL2, located in aregion of possible lower-stem duplex fraying, has the fastestlocal motion and where SL3, located near the bulge and nearthe upper duplex region, has the slowest local motion. SL1, in anonduplex loop region, has local motion nearly as fast as that ofSL2. The global tumbling rate, Rc, which is more than 1 orderof magnitude slower than Rx and Ry should be affected by thetumbling of large, multinucleotide segments. Approximately,the probe performs rapid, but restricted (by the axial localpotential), subnanosecond rotation about its gx axis, which isthe axis pointing along the nitroxide NO bond, a direction thatwould also be the direction along bonds from the 2′-aminogroup to the nitroxide. The rapid restricted motion about thisdirection partially averages the hyperfine and magnetic Zeeman
Figure 8. Doubly labeled mini c TAR DNA (blue) with NCp7 (red) at a 4:1 ratio. Structural evidence of fraying of ends of the stem−loop structureis obvious from PDS conducted at a 4:1 NCp7:bi-end-labeled mini c TAR DNA ratio and a low ionic strength. (A) Normalized PDS signals. (B)Comparison of the interprobe SLA−SLB distance distribution in the absence and presence of a 4:1 NCp7:bilabeled mini c TAR DNA ratio. Theexperimental spectrometer conditions are provided in Materials and Methods. Sample conditions: 20 mM HEPES, 20 mM NaCl, 0.2 mM MgCl2,and pH 7.5. Samples were frozen in 10% glycerol to prevent tube breakage.
Biochemistry Article
dx.doi.org/10.1021/bi301058q | Biochemistry 2012, 51, 8530−85418536

interactions corresponding to the y- and z-axes (Scheme 3).The slower restricted motion about the y-axis similarly partiallyaverages x and z components, but less effectively especiallygiven the much larger difference [(gx − gz) × 104 ∼ 67 vs (gx −gy) × 104 ∼ 29] to be averaged by the motion. This ultimatelymeans that the motion about the z-axis (which is not restrictedby the axial potential) is very slow. On the other hand, the gx
axis itself only slowly reorients so that low-field, gx featuresremain in the 236.6 GHz spectra of SL1, SL2, and SL3.First, one notes that Rc values are comparable for all three
labels as they should be for the overall tumbling rate, but slowlocal effects could lead to small differences. Also, SL3 exhibits aslower Rx but a faster Rz than the other two. They all have acomparable local ordering, S20. In general, one finds thatW240 >W9.5, where W240 and W9 are the residual (Lorentzian) widthsat 240 and 9.5 GHz, respectively, that supplement the widthsdue to partial averaging of the magnetic tensors by themotions.27 This could be due to local differences in solventpolarity and H-bonding,27 differences in local conformations,and/or some aggregation from undissolved labeled TAR DNA.Because the SL3 concentration was 250 μM, whereas the SL1and SL2 concentrations were 100 μM, this could be theexplanation for the large W240 for the former.A second SRLS approach is provided in the Supporting
Information (see Table 2S and Figure 8S), in which an axiallocal diffusion tensor was assumed, as opposed to the rhombictensor used above, but a rhombic restraining potential wasassumed for the second SRLS approach, as opposed to the axialrestraining potential used above. The total number of fittingparameters was the same in these two methods of simulation,but the one in the Supporting Information was less stable,requiring fixing some of the parameters. For either method, themotion of the probe was faster for SL2 than for SL1 or SL3,and the fastest local tumbling motion was about the gx axis.In Figure 4, a low-field 236.6 GHz EPR feature emerged at 5
°C from the mini TAR RNA labeled at the 3′ terminus and to alesser extent from ψ3 RNA labeled at the 5′ terminus. Theemergence of this feature implied preferential slowing of theprobe motion along the gx direction in the two RNA samples.Both the label with thio-ether attachment for the mini TARRNA and that with the thio-amido attachment for ψ3 RNAshowed slower, anisotropic motion at 5 °C. The featureimplying anisotropic motion was absent from the 3′ probesignal from mini c TAR DNA, for which the probe tumblingmotion remained more isotropic and faster. The mini c TARDNA versus TAR RNA difference would be consistent withpreferential melting of the lower stem of mini c TAR DNA,which has been inferred from the absence of imino base pairproton features from the lower stem of mini c TAR DNA.6 Thethermodynamic information in Table 1S of the SupportingInformation shows that the spin-label at position SLB of mini cTAR DNA had, in comparison with that of the unlabeled mini cTAR DNA, no perturbation to the melting temperature or thethermodynamic stability (ΔG) at 37 or 20 °C, so it is not thelabel perturbation that is causing melting. The dynamicdifference shown in Figure 4 between mini c TAR DNA andmini TAR RNA suggests future comprehensive dynamiccomparisons of mini c TAR DNA and mini TAR RNA labelmotion at numerous corresponding positions, conceivably withpure Rp and Sp diastereomers38 of the phosphorothioatelinkages.c
9.5 GHz Study of the NCp7-Related Change in ProbeMobility. The spectroscopic differences between labels SL1,SL2, and SL3 (Figure 5A), with SL2 showing the most mobilityand SL3 showing less mobility, imply less dynamic motion onthe 1 ns time scale near the loop (SL1) and the bulge (SL3)than in the stem (SL2).b,c Although the time scale of motionwas different, the high-frequency 236.6 GHz EPR findings weresimilar in that there was less rapid dynamic motion in the bulge(SL3). We recognize that the ureido−2′-amino attachment of
Table 1. Simultaneous Fitting to the 9.5−236.6 GHz EPRSpectra of SL1, SL2, and SL3a
SL1 SL2 SL3
Rc (×107 s−1) 2.6 ± 0.1 3.2 ± 0.1 3.3 ± 0.1
Rx (×107 s−1) 72.4 ± 6.5 75.3 ± 6.6 54.7 ± 4.9
Ry (×107 s−1) 19.2 ± 0.8 22.0 ± 0.9 19.5 ± 0.8
(Rx + Ry)/2 (×107 s−1) 45.8 ± 3.3 48.9 ± 3.3 35.0 ± 2.5Rz (×10
7 s−1) 0.6 ± 0.2 0.6 ± 0.2 1.5 ± 0.2c20 1.86 ± 0.02 1.70 ± 0.02 1.67 ± 0.02S20 0.41 0.38 0.37W9.5 (G) 0.94 0.89 0.90W240 (G) 1.3 4.4 7.8
aRx, Ry, Rz, c20, and Rc are major fitting parameters. The parametersused are those listed here and in Table 2S of the SupportingInformation. All parameters were varied in the fitting process exceptfor the ones labeled “fixed” in Table 2S. No additional parameters wereincluded to produce the values listed here or in Table 2S. βd, the anglebetween the nitroxide magnetic tensor and the fast diffusion tensor,was not included; in fact, a βd of 30° was tried, and the fit was poorer.Errors in parameters were estimated by randomly starting the fittingprocess within ±10% of the parameter values in Table 1 (or Table 2S)and then recording the resultant variation in the fitted parameters.
Figure 9. Combined simulations of 9.5 and 236.6 GHz spectra toprovide evidence of the anisotropic diffusion tensor of the probeprovided through the parameters for SL1, SL2, and SL3 in Table 1. Rx,Ry, Rz, c20, and Rc are the fitting parameters.
Biochemistry Article
dx.doi.org/10.1021/bi301058q | Biochemistry 2012, 51, 8530−85418537
the label decreased the enthalpy of melting for SL2 and SL3,where the labeling sites are in regions of base pairing. Anexplanation for this enthalpy change is that the ureido−2′-amino linkage, although not in the immediate vicinity of DNAbases, could disrupt sugar puckers and rotations so as tointerfere with base pairing and stacking. The correlation times,τiso (Figure 5B), are lower than expected for the overall globaltumbling time of mini c TAR DNA (taken as an approximatecylinder with a 20 Å diameter and a 40 Å length, leading to τ⊥ =5.8 ns and τ∥ = 2.6 ns53), but still considerably slower thansubnanosecond fast local probe motion observed via 236.6 GHzEPR. The nanosecond time scale of the motion would be thetime for dynamic motion of a many-base segment of the mini cTAR DNA, but not of the entire molecule. The faster tumblingmotion occurs in the lower stem (Figure 5B), suggested to bepartially and dynamically melted even in the absence of NCp7.6
The labels in the loop and bulge show more sensitivity thanthe ones in the lower stem to the binding of NCp7, at 1:1 and2:1 NCp7:mini c TAR DNA ratios. A previous NMR study ofmini c TAR DNA complexed to 11−55 NCp7, lacking the basictail of residues 1−1011 and conducted at an ionic strengthlower than that in our study, indicated a specific interaction of11−55 NCp7 with unpaired bases in the guanidine region atthe bottom of the mini c TAR DNA stem. The NCp7 that weuse is 1−55 NCp7, containing both the zinc fingers thatspecifically recognize unpaired bases and a positively charged,basic tail of residues 1−10 that is thought to nonspecificallybind oligonucleotides. It seems less likely that binding of 1−55NCp7 to the lower stem would perturb labels above the bulge(SL1 and SL3) than below (SL2). However, binding of NCp7to the lower stem could in principle still diminish theconformational flexibility centered at the bulge and therebyindirectly diminish motion sensed by labels at the loop andbulge in the upper part of mini c TAR DNA. The implication ofthe slower NCp7-induced tumbling of SL1 and SL3 comparedto that of SL2 is either that the position of binding for the 1−55NCp7 complex is on the loop, bulge, and upper stem or that ifthere NCp7 binds to the lower stem, then immobilization andloss of conformational flexibility extend to the upper stem andloop.The slower tumbling at a 2:1 NCp7:mini c TAR DNA ratio
suggests that a second binding site for NCp7 impeded themotion, especially that of SL1 and SL3. Two binding sites havebeen implied by isothermal titration and gel binding studies.11
It is possible that one or both of the NCp7 molecules that dobind are exchanging rapidly on the NMR time scale11 but notthe EPR time scale. Such exchange would impede motion onthe EPR time scale but would not contribute well-definedstructural features needed for NMR structural studies of TAR−NCp7 complexes.Properties of NCp7−Mini c TAR DNA Complexes
Created at a 4:1 NCp7:Mini c TAR DNA Ratio. Significantline shape broadening shown in Figure 6 occurred at a 4:1NCp7:mini c DNA ratio, which is approximately one NCp7 perseven bases. This is the coverage at which annealing alsooccurs3,4,31 and destabilization of the stem−loop structure hasbeen proposed from FRET study.32,33,54 The 9.5 GHz EPRspectra indicated considerable immobilization of the spin-labelfor all the locations studied. Similar behavior with a coverage ofat least one NCp7 per seven oligonucleotide bases was noted inthe previously reported study of ψ3 RNA with NCp7.Complexes with a coverage of one NCp7 per seven bases
have been described as being “fuzzy” or molten globule-like
complexes,55 not amenable to NMR structural methods. Amethod for obtaining the underlying structure for suchdisordered systems is pulse dipolar EPR spectroscopy (PDS)of bilabels. The bilabels themselves are considerably smallerthan FRET probes; they do not require potentially perturbinglong tethers that remove them from the site of interest orseparate donor and acceptor forms. In Figure 8, the evidence ofNCp7-induced melting of the ends of c mini DNA is shownwhere both the 3′ and 5′ end have a spin-label. The ∼25 Åinterprobe distance in the absence of NCp7 is due to thediameter of the duplex structure and the length of each tether.That distance is consistent with previously determinedinterprobe distances between two spin-labels attached tocomplementary, diametrically opposed phosphorothioates inthe middle of a nonfrayed duplex DNA.37,56,57 The implicationis that in the absence of NCp7, the duplex structure in mini cTAR DNA below the bulge is not grossly frayed, even thoughits bases may undergo dynamic exchange of imino protons.6
The presence of NCp7 at a 4:1 NCp7:mini c TAR DNA ratioclearly causes a sizable fraction of the mini c TAR DNA tocome apart; the interprobe distance nearly doubles for thatsubstantial fraction. Quantitative details of the interprobedistribution, not simply semiquantitative evidence of destabi-lization and fraying, are provided by the Tikhonovreconstruction of the interprobe distance distribution.35,36 Inthe ambient-temperature 9.5 GHz EPR data of Figure 7 from a4:1 NCp7:mini c DNA ratio, there was evidence of a fraction ofspecies having slow >5 ns tumbling and another fraction havinga tumbling time of ∼2 ns. The interlabel distance distribution ofFigure 8 shows a fraction of more thoroughly frayed specieshaving interprobe distances of >40 Å, and another less frayedfraction having interprobe distances closer to the unperturbeddistance of 25 Å. It is unlikely that the fraction of bilabeled minic TAR DNA in Figure 8, having an interprobe distance of ∼25Å, is from mini c TAR DNA not at all bound to NCp7 becausethe typical constant for dissociation of NCp7 fromoligonucleotides is less than micromolar,11,58 because theambient-temperature EPR of spin-labeled mini c TAR DNAin the presence of a 4-fold excess of NCp7 showed no evidenceof rapidly moving, unbound mini c TAR DNA (Figure 7), andbecause the DEER feature with peak at 25 Å in the presence ofNCp7 is broadened from destabilization by NCp7. Thesefindings provide explicit physical evidence of the simultaneousexistence of both the closed conformation and the partiallyopen “Y” conformation of mini c TAR DNA. It is tempting tosuggest that within the condensate having a 4:1 NCp7:mini cTAR DNA ratio the fraction of species with the slower spindynamics (τiso > 5 ns) in Figure 7 is the thoroughly frayedfraction of mini c TAR DNA, while the species with more rapidspin dynamics (τiso ∼ 2 ns) is the less frayed.
■ SUMMARYIn summary, ambient-temperature spin-label studies with 240GHz EPR provided information about rapid subnanosecond,hindered, local anisotropic motions and showed differences inthese motions, where the most rapid motion was in the lowerstem. High-frequency EPR showed a dynamic differencebetween the end-labeled mini c TAR DNA and the miniTAR RNA and the ψ3 RNA, implying a more orderingenvironment of the label at 5 °C in the two RNAs. Thesedynamic differences among stem, loop, and bulge and betweenmini c TAR DNA and mini TAR RNA provide insight intooligonucleotide dynamics, and they point to future comparative
Biochemistry Article
dx.doi.org/10.1021/bi301058q | Biochemistry 2012, 51, 8530−85418538

RNA−DNA studies.c The slowing of nanosecond tumblingmotions of large segments of the oligonucletide, which are bestobserved by 9.5 GHz EPR, was enhanced by increasing thenucleocapsid protein NCp7:mini c TAR DNA ratio from zeroto one to two. A greater slowing was observed from the labelsin the loop and near the bulge of mini c TAR DNA. Thisdifferential dynamic sensitivity to the binding of NCp7, asprobed by EPR, is thus a functional aspect of mini c TAR. At a4:1 NCp7:mini c TAR DNA ratio, there was significantlyslowed tumbling of all labels, indicating, as seen previously withψ3 RNA,
5 the condensation of NCp7 with mini c TAR DNA.At a 4:1 NCp7:mini c TAR DNA ratio, concomitant structuralevidence of partial melting and a broadened 3′−5′ end-to-enddistance distribution of the mini c TAR DNA were obtained bypulse dipolar EPR spectroscopy (DEER) of bilabels attachednear the 3′ and 5′ termini of the mini c TAR DNA.
■ ASSOCIATED CONTENT*S Supporting InformationProtocols for labeling phosphorothioate linkages, includingFigure 1S that shows the HPLC purification trace for labeledmini c TAR DNA and Figure 2S that shows analytical gel tracesfor labeled mini c TAR DNA. Protocols for the preparation ofspin-labeled mini c TAR DNA via the reaction of 2′-amino-2′-deoxycytidine and 4-isocyanato-2,2,6,6-tetramethylpiperidine 1-oxyl, including Figure 3S that shows analytical gel traces formini c TAR DNA labeled by this method. Nondenaturing gelshift assays showing the similarity of labeled and unlabeled minic TAR DNA binding to NCp7, including Figure 4S that showsthe gel scans. Melting of labeled and unlabeled mini c TARDNA as monitored by UV−vis temperature melts at 260 nm,including Figure 5S that shows the melting profiles (δA/δT at260 nm) for wild-type and labeled mini c TAR DNA and Table1S that provides thermodynamic parameters ΔH, ΔS, ΔG, andTm. Figure 6S comparing simulated 9.5 GHz EPR spectra fromSL1, SL2, SL3, SLA, and SLB to experimental spectra obtainedin the presence of a 2-fold excess of NCp7. Figure 7S showingthe effect of changing the ionic strength on the breadth of the9.5 GHz EPR spectrum of spin-labeled mini c TAR DNA in thepresence of a 4:1 NCp7:mini c TAR DNA ratio. Simulations ofthe motion of spin-labeled mini c TAR DNA as studied byhigh-field, high-frequency EPR, where axial symmetry isassumed for the local probe diffusion tensor, including Figure8S that shows SRLS simulations and Table 2S that lists theresultant EPR fitting parameters. This material is available freeof charge via the Internet at http://pubs.acs.org.
■ AUTHOR INFORMATIONCorresponding Author*Telephone: (518) 442-4551. Fax: (518) 442-3462. E-mail:[email protected] Addresses∥State Key Laboratory of Magnetic Resonance and Atomic andMolecular Physics, Wuhan Institute of Physics and Mathe-matics, Chinese Academy of Sciences, Wuhan, Hubei 430071,China.⊥Department of Chemistry, University of California, OneShields Avenue, Davis, CA 95616.FundingThis work was supported by the National Institutes of Health(GM066253-01A1 and 3RO1GM06625304S1 to C.P.S., Na-tional Center for Research Resources Grant P41RR016292, and
National Institute of General Medical Sciences GrantP41GM103521 to J.H.F.) and an RNA Institute Interdiscipli-nary Pilot Research Program 2010 Award, UAlbany, to K.A.E.NotesThe authors declare no competing financial interest.
■ ACKNOWLEDGMENTSWe are grateful to Prof. Carla Theimer (Department ofChemistry, University at Albany) for providing lab space andtechnical advice for the preparation and characterization ofoligonucleotides. We thank Dr. Peter P. Borbat (Department ofChemistry and Chemical Biology and ACERT, CornellUniversity) for taking and analyzing the pulse dipolar EPRspectra.
■ ABBREVIATIONSEPR, electron paramagnetic resonance; SRLS, slowly relaxinglocal structure; NLSL, nonlinear least-squares limited; DEER,double electron−electron resonance; PDS, pulse dipolarspectroscopy.
■ ADDITIONAL NOTESaLabeling of a phosphorothioate group by an iodo spin-labelprecursor was done on SLB mini TAR DNA, SLB mini TARRNA, and ψ3 RNA. For the SLB mini c TAR DNA, aphosphorothioate between the 3′ G and its neighboring G waslabeled with an iodoacetamide spin-label precursor. For theSLB mini TAR RNA, a phosphorothioate between the 3′ G andits neighboring G was labeled with an iodomethyl spin-labelprecursor. For the ψ3 RNA, a phosphorothioate at the terminal5′ G was labeled with an iodoacetamide spin-label precursor.bWork in progress at X-band with thio-ether label linkages inthe corresponding loop, stem, and bulge near the positions ofprevious ureido−2′-amino labeling sites SL1, SL2, and SL3 hasshown the same order of mobility as SL1, SL2, and SL3 did,although the motion of the thio-ether labels is overall fasterthan that of the ureido labels. A related study with thio-etherlinkages at corresponding loop, stem, and bulge positions isunderway to compare motions of mini c TAR DNA and miniTAR RNA. For our future experimental design, we are gratefulto a reviewer for suggesting looking for Rp versus Spdiastereomeric differences in the phosphorothioate labelingsite between mini c TAR DNA and mini TAR RNA.cTo assess the utility of high-field EPR to studies ofoligonucleotides, our initial high-field study was limited tospin-labeled mini c TAR DNA and mini TAR RNAoligonucleotides by themselves in the absence of NCp7. Insynchrony with technical improvements to high-field EPR foraqueous samples, additional high-frequency EPR directed atNCp7 complexes of mini TAR is underway.
■ REFERENCES(1) Johnson, P. E., Turner, R. B., Wu, Z. R., Hairston, L., Guo, J.,Levin, J. G., and Summers, M. F. (2000) A mechanism for plus-strandtransfer enhancement by the HIV-1 nucleocapsid protein duringreverse transcription. Biochemistry 39, 9084−9091.(2) Guo, J., Henderson, L. E., Bess, J., Kane, B., and Levin, J. G.(1997) Human immunodeficiency virus type 1 nucleocapsid proteinpromotes efficient strand transfer and specific viral DNA synthesis byinhibiting TAR-dependent self-priming from minus-strand strong-stopDNA. J. Virol. 71, 5178−5188.(3) Vo, M. N., Barany, G., Rouzina, I., and Musier-Forsyth, K. (2009)HIV-1 nucleocapsid protein switches the pathway of transactivation
Biochemistry Article
dx.doi.org/10.1021/bi301058q | Biochemistry 2012, 51, 8530−85418539

response element RNA/DNA annealing from loop-loop “kissing” to“zipper”. J. Mol. Biol. 386, 789−801.(4) Vo, M. N., Barany, G., Rouzina, I., and Musier-Forsyth, K. (2006)Mechanistic studies of mini-TAR RNA/DNA annealing in the absenceand presence of HIV-1 nucleocapsid protein. J. Mol. Biol. 363, 244−261.(5) Xi, X., Sun, Y., Karim, C. B., Grigoryants, V. M., and Scholes, C.P. (2008) HIV-1 nucleocapsid protein NCp7 and its RNA stem loop 3partner: Rotational dynamics of spin-labeled RNA stem loop 3.Biochemistry 47, 10099−10110.(6) Zargarian, L., Kanevsky, I., Bazzi, A., Boynard, J., Chaminade, F.,Fosse, P., and Mauffret, O. (2009) Structural and dynamiccharacterization of the upper part of the HIV-1 cTAR DNA hairpin.Nucleic Acids Res. 37, 4043−4054.(7) Zhang, Q., Sun, X., Watt, E. D., and Al-Hashimi, H. M. (2006)Resolving the motional modes that code for RNA adaptation. Science311, 653−656.(8) Zhang, Q., Stelzer, A. C., Fisher, C. K., and Al-Hashimi, H. M.(2007) Visualizing spatially correlated dynamics that directs RNAconformational transitions. Nature 450, 1263−1267.(9) Getz, M., Sun, X., Casiano-Negroni, A., Zhang, Q., and Al-Hashimi, H. M. (2007) NMR studies of RNA dynamics and structuralplasticity using NMR residual dipolar couplings. Biopolymers 86, 384−402.(10) Sun, X., Zhang, Q., and Al-Hashimi, H. M. (2007) Resolving fastand slow motions in the internal loop containing stem-loop 1 of HIV-1that are modulated by Mg2+ binding: Role in the kissing-duplexstructural transition. Nucleic Acids Res. 35, 1698−1713.(11) Bazzi, A., Zargarian, L., Chaminade, F., Boudier, C., DeRocquigny, H., Rene, B., Mely, Y., Fosse, P., and Mauffret, O. (2011)Structural insights into the cTAR DNA recognition by the HIV-1nucleocapsid protein: Role of sugar deoxyriboses in the bindingpolarity of NC. Nucleic Acids Res. 39, 3903−3916.(12) Earle, K. A., Dzikovski, B., Hofbauer, W., Moscicki, J. K., andFreed, J. H. (2005) High-frequency ESR at ACERT. Magn. Reson.Chem. 43 (Spec no.), S256−S266.(13) Qin, P. Z., Butcher, S. E., Feigon, J., and Hubbell, W. L. (2001)Quantitative analysis of the isolated GAAA tetraloop/receptorinteraction in solution: A site-directed spin labeling study. Biochemistry40, 6929−6936.(14) Edwards, T. E., Okonogi, T. M., Robinson, B. H., andSigurdsson, S. T. (2001) Site-specific incorporation of nitroxide spin-labels into internal sites of the TAR RNA; structure-dependentdynamics of RNA by EPR spectroscopy. J. Am. Chem. Soc. 123, 1527−1528.(15) Edwards, T. E., Okonogi, T. M., and Sigurdsson, S. T. (2002)Investigation of RNA-protein and RNA-metal ion interactions byelectron paramagnetic resonance spectroscopy. The HIV TAR-Tatmotif. Chem. Biol. 9, 699−706.(16) Edwards, T. E., and Sigurdsson, S. T. (2002) Electronparamagnetic resonance dynamic signatures of TAR RNA-smallmolecule complexes provide insight into RNA structure andrecognition. Biochemistry 41, 14843−14847.(17) Qin, P. Z., Hideg, K., Feigon, J., and Hubbell, W. L. (2003)Monitoring RNA base structure and dynamics using site-directed spinlabeling. Biochemistry 42, 6772−6783.(18) Edwards, T. E., Robinson, B. H., and Sigurdsson, S. T. (2005)Identification of amino acids that promote specific and rigid TARRNA-tat protein complex formation. Chem. Biol. 12, 329−337.(19) Popova, A. M., Kalai, T., Hideg, K., and Qin, P. Z. (2009) Site-specific DNA structural and dynamic features revealed by nucleotide-independent nitroxide probes. Biochemistry 48, 8540−8550.(20) Grant, G. P., Boyd, N., Herschlag, D., and Qin, P. Z. (2009)Motions of the substrate recognition duplex in a group I intronassessed by site-directed spin labeling. J. Am. Chem. Soc. 131, 3136−3137.(21) Earle, K. A., and Freed, J. H. (1999) Quasioptical hardware for aflexible FIR-EPR spectrometer. Appl. Magn. Reson. 16, 247−272.
(22) Freed, J. H. (2000) New technologies in electron spinresonance. Annu. Rev. Phys. Chem. 51, 655−689.(23) Borbat, P. P., Costa-Filho, A. J., Earle, K. A., Moscicki, J. K., andFreed, J. H. (2001) Electron spin resonance in studies of membranesand proteins. Science 291, 266−269.(24) Bennati, M., and Prisner, T. F. (2005) New Developments inHigh Field Electron Paramagnetic Resonance with Applications inStructural Biology. Rep. Prog. Phys. 68, 411.(25) Liang, Z., and Freed, J. H. (1999) An assessment of theapplicability of multifrequency ESR to study the complex dynamics ofbiomolecules. J. Phys. Chem. B 103, 6384−6396.(26) Polimeno, A., and Freed, J. H. (1995) Slow motional ESR incomplex fluids: The slowly relaxing local structure model of solventcage effects. J. Phys. Chem. 99, 10995−11006.(27) Zhang, Z., Fleissner, M. R., Tipikin, D. S., Liang, Z., Moscicki, J.K., Earle, K. A., Hubbell, W. L., and Freed, J. H. (2010)Multifrequency electron spin resonance study of the dynamics ofspin labeled T4 lysozyme. J. Phys. Chem. B 114, 5503−5521.(28) Pitt, S. W., Zhang, Q., Patel, D. J., and Al-Hashimi, H. M. (2005)Evidence that electrostatic interactions dictate the ligand-inducedarrest of RNA global flexibility. Angew. Chem., Int. Ed. 44, 3412−3415.(29) Fisher, C. K., Zhang, Q., Stelzer, A., and Al-Hashimi, H. M.(2008) Ultrahigh resolution characterization of domain motions andcorrelations by multialignment and multireference residual dipolarcoupling NMR. J. Phys. Chem. B 112, 16815−16822.(30) Zhang, Q., and Al-Hashimi, H. M. (2009) Domain-elongationNMR spectroscopy yields new insights into RNA dynamics andadaptive recognition. RNA 15, 1941−1948.(31) Vo, M. N., Barany, G., Rouzina, I., and Musier-Forsyth, K.(2009) Effect of Mg2+ and Na+ on the nucleic acid chaperone activityof HIV-1 nucleocapsid protein: Implications for reverse transcription.J. Mol. Biol. 386, 773−788.(32) Hong, M. K., Harbron, E. J., O’Connor, D. B., Guo, J., Barbara,P. F., Levin, J. G., and Musier-Forsyth, K. (2003) Nucleic acidconformational changes essential for HIV-1 nucleocapsid protein-mediated inhibition of self-priming in minus-strand transfer. J. Mol.Biol. 325, 1−10.(33) Cosa, G., Harbron, E. J., Zeng, Y., Liu, H. W., O’Connor, D. B.,Eta-Hosokawa, C., Musier-Forsyth, K., and Barbara, P. F. (2004)Secondary structure and secondary structure dynamics of DNAhairpins complexed with HIV-1 NC protein. Biophys. J. 87, 2759−2767.(34) Cosa, G., Zeng, Y., Liu, H. W., Landes, C. F., Makarov, D. E.,Musier-Forsyth, K., and Barbara, P. F. (2006) Evidence for non-two-state kinetics in the nucleocapsid protein chaperoned opening of DNAhairpins. J. Phys. Chem. B 110, 2419−2426.(35) Chiang, Y. W., Borbat, P. P., and Freed, J. H. (2005) Maximumentropy: A complement to Tikhonov regularization for determinationof pair distance distributions by pulsed ESR. J. Magn. Reson. 177, 184−196.(36) Chiang, Y. W., Borbat, P. P., and Freed, J. H. (2005) Thedetermination of pair distance distributions by pulsed ESR usingTikhonov regularization. J. Magn. Reson. 172, 279−295.(37) Cai, Q., Kusnetzow, A. K., Hubbell, W. L., Haworth, I. S.,Gacho, G. P., Van Eps, N., Hideg, K., Chambers, E. J., and Qin, P. Z.(2006) Site-directed spin labeling measurements of nanometerdistances in nucleic acids using a sequence-independent nitroxideprobe. Nucleic Acids Res. 34, 4722−4730.(38) Grant, G. P., Popova, A., and Qin, P. Z. (2008) Diastereomercharacterizations of nitroxide-labeled nucleic acids. Biochem. Biophys.Res. Commun. 371, 451−455.(39) Zhang, Z., Xi, X., Scholes, C. P., and Karim, C. B. (2008)Rotational dynamics of HIV-1 nucleocapsid protein NCp7 as probedby a spin label attached by peptide synthesis. Biopolymers 89, 1125−1135.(40) Karim, C. B., Kirby, T. L., Zhang, Z., Nesmelov, Y., and Thomas,D. D. (2004) Phospholamban structural dynamics in lipid bilayersprobed by a spin label rigidly coupled to the peptide backbone. Proc.Natl. Acad. Sci. U.S.A. 101, 14437−14442.
Biochemistry Article
dx.doi.org/10.1021/bi301058q | Biochemistry 2012, 51, 8530−85418540
(41) Karim, C. B., Zhang, Z., and Thomas, D. D. (2007) Synthesis ofTOAC spin-labeled proteins and reconstitution in lipid membranes.Nat. Protoc. 2, 42−49.(42) Tummino, P. J., Scholten, J. D., Harvey, P. J., Holler, T. P.,Maloney, L., Gogliotti, R., Domagala, J., and Hupe, D. (1996) The invitro ejection of zinc from human immunodeficiency virus (HIV) type1 nucleocapsid protein by disulfide benzamides with cellular anti-HIVactivity. Proc. Natl. Acad. Sci. U.S.A. 93, 969−973.(43) Theimer, C. A., Wang, Y., Hoffman, D. W., Krisch, H. M., andGiedroc, D. P. (1998) Non-nearest neighbor effects on thethermodynamics of unfolding of a model mRNA pseudoknot. J. Mol.Biol. 279, 545−564.(44) DeWeerd, K., Grigoryants, V., Sun, Y., Fetrow, J. S., and Scholes,C. P. (2001) EPR-detected folding kinetics of externally locatedcysteine-directed spin-labeled mutants of iso-1-cytochrome c. Bio-chemistry 40, 15846−15855.(45) Grigoryants, V. M., and Scholes, C. P. (2006) Variable VelocityLiquid Flow EPR and Submillisecond Protein Folding (Chapter 5.3).In Protein Structures: Methods in Protein Structure and Stability Analysis(Uversky, V. N., and Permyakov, E. A., Eds.) pp 47−71, Nova SciencePublishers, Inc., New York.(46) Grigoryants, V. M., Veselov, A. V., and Scholes, C. P. (2000)Variable velocity liquid flow EPR applied to submillisecond proteinfolding. Biophys. J. 78, 2702−2708.(47) Barnes, J. P., and Freed, J. H. (1997) Aqueous Sample Holdersfor High Frequency Electron Spin Resonance. Rev. Sci. Instrum. 68,2838−2846.(48) Budil, D. E., Lee, S., Saxena, S., and Freed, J. H. (1996)Nonlinear-Least-Squares Analysis of Slow-Motion EPR Spectra in Oneand Two Dimensions Using a Modified Levenberg-MarquardtAlgorithm. J. Magn. Reson., Ser. A 120, 155−189.(49) Dzikovski, B., Earle, K., Pachtchenko, S., and Freed, J. (2006)High-field ESR on aligned membranes: A simple method to recordspectra from different membrane orientations in the magnetic field. J.Magn. Reson. 179, 273−279.(50) Borbat, P. P., Crepeau, R. H., and Freed, J. H. (1997)Multifrequency two-dimensional Fourier transform ESR: An X/Ku-band spectrometer. J. Magn. Reson. 127, 155−167.(51) Borbat, P. P., and Freed, J. H. (2007) Measuring distances bypulsed dipolar ESR spectroscopy: Spin-labeled histidine kinases.Methods Enzymol. 423, 52−116.(52) Earle, K. A., and Budil, D. E. (2006) Calculating Slow-motionESR Spectra of Spin-Labeled Polymers. In Advanced ESR Methods inPolymer Research (Schlick, S., Ed.) Chapter 3, John Wiley and Sons,New York.(53) Tirado, M. M., and de la Torre, J. G. (1980) Rotationaldynamics of rigid symmetric top macromolecules. Application tocircular cylinders. J. Chem. Phys. 73, 1986−1993.(54) Liu, H. W., Zeng, Y., Landes, C. F., Kim, Y. J., Zhu, Y., Ma, X.,Vo, M. N., Musier-Forsyth, K., and Barbara, P. F. (2007) Insights onthe role of nucleic acid/protein interactions in chaperoned nucleic acidrearrangements of HIV-1 reverse transcription. Proc. Natl. Acad. Sci.U.S.A. 104, 5261−5267.(55) Darlix, J. L., Godet, J., Ivanyi-Nagy, R., Fosse, P., Mauffret, O.,and Mely, Y. (2011) Flexible nature and specific functions of the HIV-1 nucleocapsid protein. J. Mol. Biol. 410, 565−581.(56) Cai, Q., Kusnetzow, A. K., Hideg, K., Price, E., Haworth, I. S.,and Qin, P. Z. (2007) Nanometer distance measurements in RNAusing site-directed spin labeling. Biophys. J. 93, 2110−2117.(57) Price, E. A., Sutch, B. T., Cai, Q., Qin, P. Z., and Haworth, I. S.(2007) Computation of nitroxide-nitroxide distances in spin-labeledDNA duplexes. Biopolymers 87, 40−50.(58) Avilov, S. V., Godet, J., Piemont, E., and Mely, Y. (2009) Site-specific characterization of HIV-1 nucleocapsid protein binding tooligonucleotides with two binding sites. Biochemistry 48, 2422−2430.
Biochemistry Article
dx.doi.org/10.1021/bi301058q | Biochemistry 2012, 51, 8530−85418541