Embed Size (px)
Citation preview
The interaction of blood proteins and platelets on
surface-attached poly (alkylacrylamide) networks
Dissertation zur Erlangung des Dokotorgrades
der Technischen Fakultät
der Albert-Ludwigs-Universität Freiburg im Breisgau
vorgelegt von
Chinnayan Kannan Pandiyarajan (M.Sc Chemistry)
Freiburg im Breisgau, Februar 2013

II
This research was carried out between January 2010 and January 2013 under the
extreme supervison of Prof. Dr. Jürgen Rühe in the laboratory of Chemistry and
Physics of Interfaces (CPI), Department of Microsystems and Engineerings (IMTEK),
University of Freiburg, Freiburg-79110, Germany.
Date of Submission: 12-03-2013
Date of Disputation: 11-04-2013
First referee: Prof. Dr. Jürgen Rühe
Second referee: Prof. Dr. Gerald Urban

III
Man needs his difficulties because they are necessary to enjoy success
- Dr. A.P.J. Abdul Kalam

IV
To my brother & mother
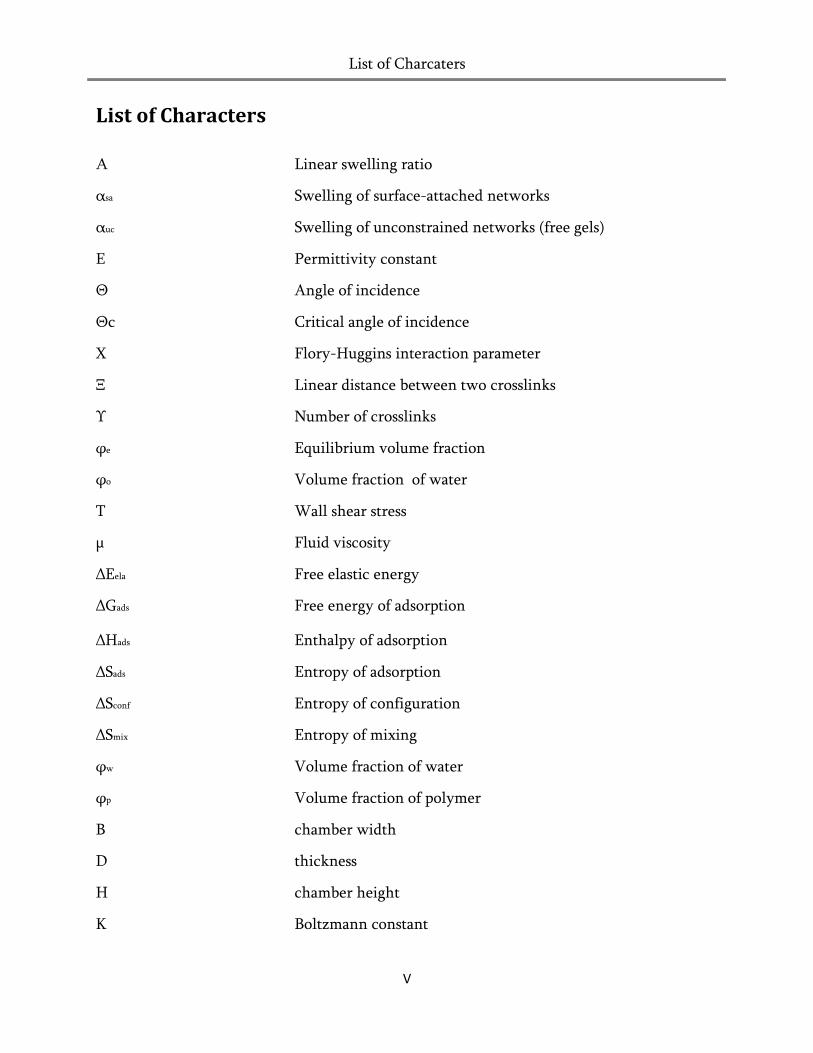
List of Charcaters
V
List of Characters
Α Linear swelling ratio
αsa Swelling of surface-attached networks
αuc Swelling of unconstrained networks (free gels)
Ε Permittivity constant
Θ Angle of incidence
Θc Critical angle of incidence
Φ Flory-Huggins interaction parameter
Ξ Linear distance between two crosslinks
Υ Number of crosslinks
φe Equilibrium volume fraction
φo Volume fraction of water
Τ Wall shear stress
µ Fluid viscosity
ΔEela Free elastic energy
ΔGads Free energy of adsorption
ΔHads Enthalpy of adsorption
ΔSads Entropy of adsorption
ΔSconf Entropy of configuration
ΔSmix Entropy of mixing
φw Volume fraction of water
φp Volume fraction of polymer
B chamber width
D thickness
H chamber height
K Boltzmann constant
List of Charcaters
VI
Mc Number average molecular mass between two crosslinks
Mn Number average molecular mass
n Refractive index
n1 Ratio of solvent molecule
n2 Ratio of polymer repeat unit
Nc Number of segments
Q Fluid flow rate
R Gas constant
Ra Roughness
Rg Radius of gyration
S Volumetric swelling
T Temperature
t Time
Z Number of carbon atom at N-substitution
List of Abbreviations
VII
List of abbreviations
AFM Atomic force microscopy
AIBN 4,4‟-Azobis(isobutyronitrile)
atm Atmosphere
ATR Attenuated total reflection
Au Gold
BAAm Butylacrylamide
BSA Bovine adult serum
CA Contact angle
Coll Collagen
Cr Chromium
DEAAm Diethyl acrylamide
DMAAm Dimethyl acrylamide
DOP Di-octylphthalate
EAAm Ethylacrylamide
EDTA Ethylenediaminetetraacetic acid
Fg Fibrinogen
Fn Fibronectin
FT-IR Fourier transform infrared (spectroscopy)
GPC Gel permeation chromatography
HUVEC Human umbilical vein endothelial cells
L929 Mouse fibroblasts
MAAm Methylacrylamide
MABP Methacryloyl-4-oxy-benzophenone
MB Microbubbles
NHDF Normal human dermal fibroblasts
NMR Nuclear Magnetic resonance (spectroscopy)
List of Abbreviations
VIII
OWS Optical waveguide spectroscopy
PAAm Propylacrylamide
PBS Phosphate buffered saline
PS Poly styrene
PU Polyurethane
PVC Polyvinylchloride
RPM Rotation per minutes
SEM Scanning electron spectroscopy
SPR Surface plasmon resonance spectroscopy
SSAz Styrenesufonylazide
Table of contents
IX
Table of Contents
1. Introduction ................................................................................................................. 1
1.1. Blood-contacting devices - Materials consideration ....................................................................... 1
1.2. Biomaterials and their limitations .................................................................................................... 6
1.3. Blood compatibility / Hemocompatibility ....................................................................................... 8
1.4. Thrombus formation ......................................................................................................................... 8
1.5. Coating methods for blood contacting devices ............................................................................... 9
1.5.1. Inorganic coatings .................................................................................................................... 11
1.5.2. Organic Coatings ...................................................................................................................... 11
1.6. Hydrogels ........................................................................................................................................ 14
1.6.1. Hydrogels from synthetic polymers ........................................................................................ 16
1.6.2. Responsive hydrogels ............................................................................................................... 17
1.7. Hydrogels in medical applications ................................................................................................. 21
1.8. Challenges in Biomedical applications .......................................................................................... 26
2. Goal and Strategy of the work ................................................................................ 27
2.1 Goal ................................................................................................................................................... 27
2.2. Strategy of the work ....................................................................................................................... 27
3. Synthesis and characterizations ............................................................................. 30
3.1. Synthesis of crosslinker (MABP) and anchor (Bp-Si) ................................................................... 30
3.2. Synthesis of alkylacrylamide copolymers ...................................................................................... 31
3.3. Surface-attached networks ............................................................................................................. 36
3.4. Contact angle and Topography ...................................................................................................... 41
3.5. Conclusion ....................................................................................................................................... 44
4. Swelling of the surface-attached poly (alkylacrylamide) networks ................ 45
4.1. Theory of swelling .......................................................................................................................... 45
4.1.1. Isotropic swelling ..................................................................................................................... 45
4.1.2. Anisotropic swelling ................................................................................................................ 47
4.2. Surface Plasmon resonance spectroscopy (SPR) ........................................................................... 48
Table of contents
X
4.3. Swelling in water ............................................................................................................................ 51
4.4. Swelling in humid air ..................................................................................................................... 60
4.5. Heat of hydration ............................................................................................................................ 82
4.6. Conclusion ....................................................................................................................................... 84
5. Adsorption of proteins on poly (alkylacrylamide) surfaces .............................. 87
5.1. Theory and mechanism of protein adsorption .............................................................................. 87
5.2. Competitive adsorption of proteins (Vroman effect) .................................................................... 89
5.3. Protein resistant surfaces ................................................................................................................ 90
5.4. Protein adsorption on surface-attached poly (alkylacrylamides) networks ................................ 93
5.4.1. Determination of mesh size and the size exclusion effect ................................................... 101
5.4.2. Entropic shielding .................................................................................................................. 104
5.5. Protein adsorption on terpolymer layers ..................................................................................... 106
5.6. Protein repellency of PDMAAm gels .......................................................................................... 108
5.7. Adsorption of lipids ...................................................................................................................... 110
5.8. Conclusion ..................................................................................................................................... 114
6. Platelet adhesion .................................................................................................... 116
6.1. Molecular mechanism of platelet adhesion ................................................................................. 116
6.2. Static platelet adhesion on surface-attached poly (alkylacrlamide) networks .......................... 118
6.3 Platelets adhesion on 2D structured surfaces ............................................................................... 122
6.4. Ultrasound contrast agent to detect platelets at shear flow condition ....................................... 124
6.5. Platelet adhesion under arterial flow condition .......................................................................... 131
6.6. Conclusion ..................................................................................................................................... 131
7. Cell adhesion on surface-attached poly (alkylacrylamide) networks .......... 133
7.1. Mechanism of cell adhesion ......................................................................................................... 133
7.2. Cell adhesion on surface-attached poly (alkylacrylamide) networks ........................................ 137
7.3. Cell adhesion of patterned substrates .......................................................................................... 142
7.4. Cell adhesion of copolymers ........................................................................................................ 145
7.5. Conclusion ..................................................................................................................................... 147

Table of contents
XI
8. Blood tube modification ....................................................................................... 149
8.1. Attenated Total Reflection spectroscopy (ATR) ......................................................................... 149
8.2. Modification process ..................................................................................................................... 150
8.3. Characterization of PDMAAm-SSAz coatings ............................................................................ 152
8.4. Conclusion ..................................................................................................................................... 155
9. Summary .................................................................................................................. 157
10. Zusammenfassung................................................................................................ 164
11. Experimental section ........................................................................................... 168
11.1. Materials ...................................................................................................................................... 168
11.2. Instrumentations ......................................................................................................................... 172
11.3. Synthesis and characterization of monomers and polymers .................................................... 176
11.4. Deposition of surface-attached networks .................................................................................. 182
11.5. Preparation of Protein solution for SPR .................................................................................... 184
11.6. Cell culture .................................................................................................................................. 184
11.7. Platelet extraction ....................................................................................................................... 185
12. Appendix ............................................................................................................... 187
Journal Publications ................................................................................................... 196
Referred conference proceedings ............................................................................ 196
References .................................................................................................................... 197
Acknowledgements.................................................................................................... 210
Abstract
IX
This thesis investigated the adsorption of blood proteins and platelets onto the
surface-attached poly (alkylacrylamide) networks that exhibit small, systematic variations of
the chemical composition. The polymer coatings were generated by depositing a thin layer of
benzophenone group containing copolymer onto a solid substrate, followed by photo
crosslinking and simultaneous surface-attachment. These surface-attached networks showed
anisotropic swelling that strongly depended on length of the alkyl substituent. A strong
correlation between swelling and protein adsorption was observed. The swollen surface-
attached layers were found to repel proteins both through entropic shielding or size
exclusion and as a consequence repel blood platelets and cells. Our results suggest that the
protein repellent coated materials were promising candidates for the generation of
hemocompatible surfaces.
In der vorliegenden Arbeit wurde der Einfluss der chemischen Zusammensetzung auf
die Adsorption von Blutproteinen und die Adhesion von Thrombozyten auf
oberflächengebundenen Poly(alkylacrylamid)-Netzwerken untersucht. Die
Polymerbeschichtungen wurden durch Abscheidung dünner, benzophenonhaltiger
Copolymerfilme auf festen Substraten erzeugt. Durch anschließende Belichtung mit UV-
Strahlung wurden die Polymerschichten vernetzt und an die Substratoberfläche gebunden.
Diese so erzeugten, oberflächen-gebundenen Polymernetzwerke zeigen ein anisotropies
Quellverhalten, welches sehr stark mit der Länge der Alkylsubstituenten korreliert. Die
Quellung der Netzwerke beinflusst dabei die Proteinadhesion an der Oberfläche der
Polymerschichten. Durch entropische Abschirmung und Größenausschluss wirken die
gequollenen, oberflächen-gebundenen Polymernetzwerke protein- und zellabweisend. Die
Ergebnisse zeigen, dass sich diese proteinabweisenden Polymerschichten zur Erzeugung
hämokompatibler Oberflächen eignen.
1.1.Blood-contacting devices
1
1. Introduction
1.1. Blood-contacting devices - Materials consideration
In the medical device industry, the choice of biomaterials employed in most devices
that come into direct contact with blood flow are based on stability, permeability, cost, ease
of sterilization, non-toxicity, and with a acceptable hemocompatibility.1-5 Table 1 lists some
of the commercially available blood-contacting devices that have been in frequent use.
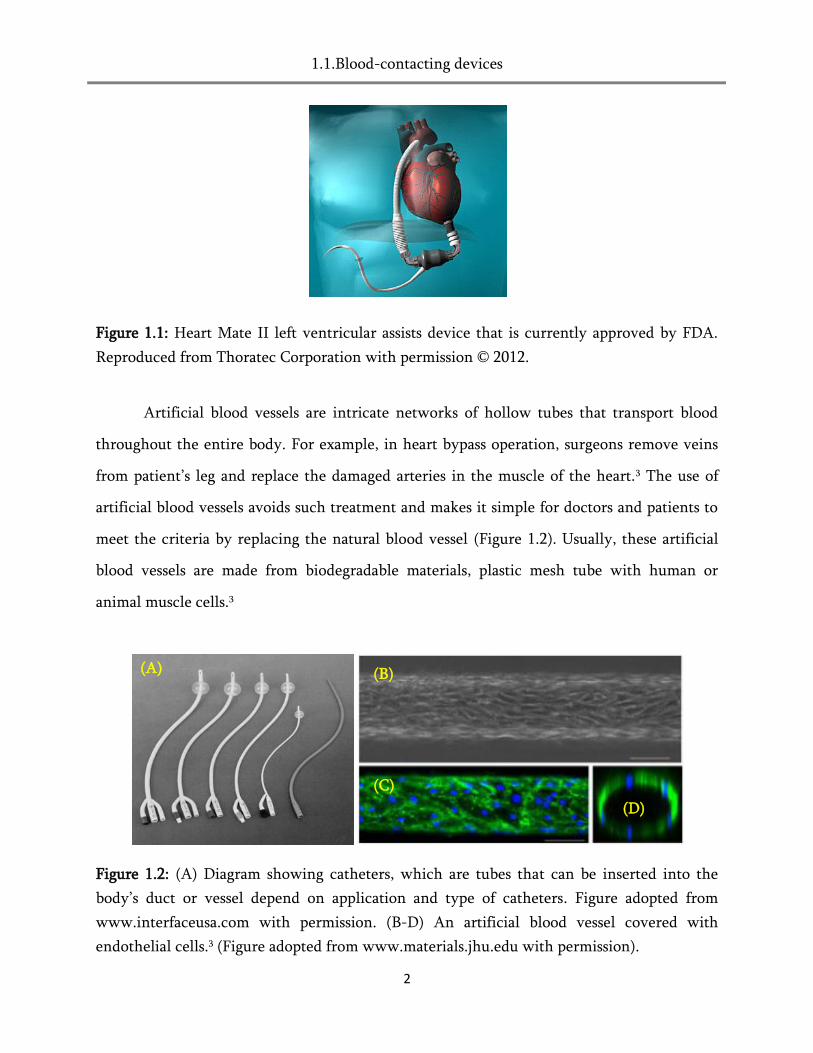
Figures 1.1- 1.4 depicts the medical devices are listed in Table 1. Important examples for such
devices are ventricular assist devices (VADs), artificial blood vessels, vascular stents, and
artificial heart valves.6,7
A VAD is a mechanical pump that aids the function of damaged heart ventricles and
restores normal blood flow. Used as a bridge for transplantation, they also have applications
in treating patients with terminal heart failure.8 VADs are categorized by their mechanical
function as pulsatile, or continuous flow.9 Pulsatile assist devices are often reffered as first
generation pumps that are used clinically. They have large and multiple moving parts, which
help to pump the blood in a pulsatile fashion. The second-generation pumps are small and
posses a single moving part with a continuous flow. Third generation pumps are designed for
long-term applications, which uses the magnectic levitation (e.g. magnetically suspended
axial rotor or centrifugal rotor) for the non-pulsatile flow.8
A second way to catagerize VADs is based on their purpose, Left ventricular assist
devices (LVAD) are used when the left ventricles are damaged, and it helps left ventricles to
pump blood to aorta, which carries the oxygen rich blood from heart to the body. Right
ventricular assist devices (RVAD) are used when the right ventricle are not functioning.
RVAD‟s used to pump blood to the pulmonary artery from which the blood carries to lungs
for oxygen. Bi-ventricular devices (BVAD) are used when both ventricles are not
functioning.9-10
1.1.Blood-contacting devices
2
Figure 1.1: Heart Mate II left ventricular assists device that is currently approved by FDA.
Reproduced from Thoratec Corporation with permission © 2012.
Artificial blood vessels are intricate networks of hollow tubes that transport blood
throughout the entire body. For example, in heart bypass operation, surgeons remove veins
from patient‟s leg and replace the damaged arteries in the muscle of the heart.3 The use of
artificial blood vessels avoids such treatment and makes it simple for doctors and patients to
meet the criteria by replacing the natural blood vessel (Figure 1.2). Usually, these artificial
blood vessels are made from biodegradable materials, plastic mesh tube with human or
animal muscle cells.3
Figure 1.2: (A) Diagram showing catheters, which are tubes that can be inserted into the
body‟s duct or vessel depend on application and type of catheters. Figure adopted from
www.interfaceusa.com with permission. (B-D) An artificial blood vessel covered with
endothelial cells.3 (Figure adopted from www.materials.jhu.edu with permission).
(B)
(D)
(C)
(A)
1.1.Blood-contacting devices
3
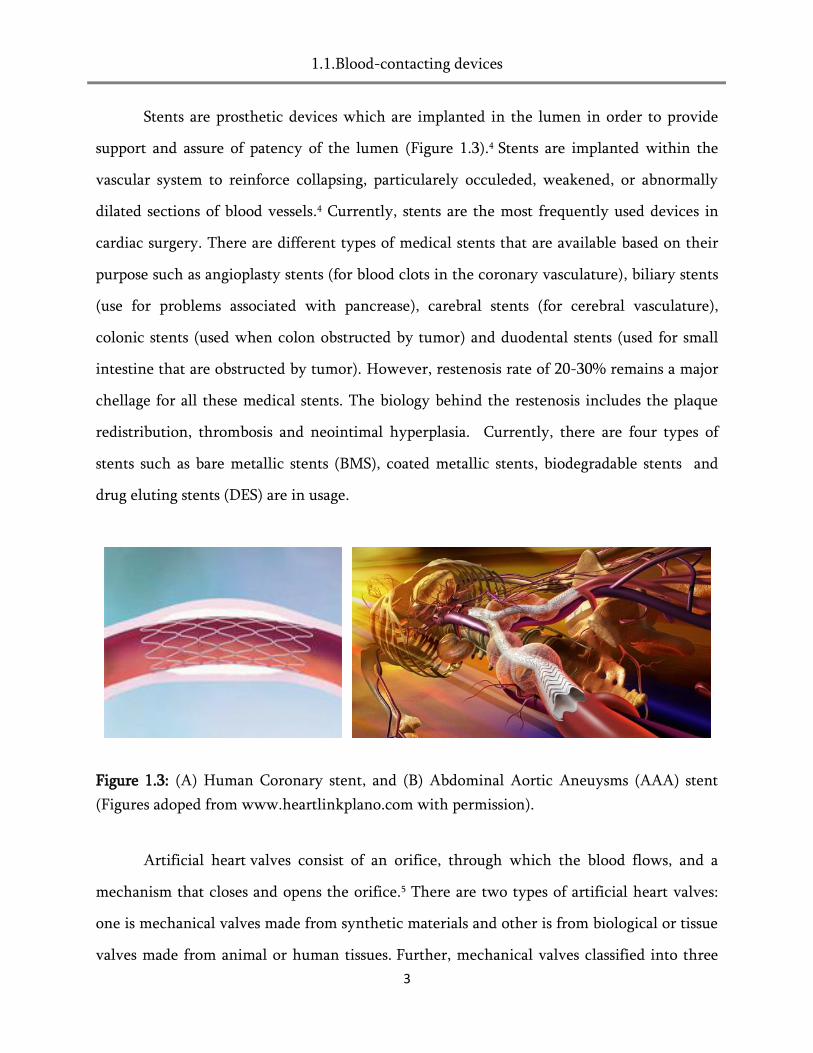
Stents are prosthetic devices which are implanted in the lumen in order to provide
support and assure of patency of the lumen (Figure 1.3).4 Stents are implanted within the
vascular system to reinforce collapsing, particularely occuleded, weakened, or abnormally
dilated sections of blood vessels.4 Currently, stents are the most frequently used devices in
cardiac surgery. There are different types of medical stents that are available based on their
purpose such as angioplasty stents (for blood clots in the coronary vasculature), biliary stents
(use for problems associated with pancrease), carebral stents (for cerebral vasculature),
colonic stents (used when colon obstructed by tumor) and duodental stents (used for small
intestine that are obstructed by tumor). However, restenosis rate of 20-30% remains a major
chellage for all these medical stents. The biology behind the restenosis includes the plaque
redistribution, thrombosis and neointimal hyperplasia. Currently, there are four types of
stents such as bare metallic stents (BMS), coated metallic stents, biodegradable stents and
drug eluting stents (DES) are in usage.
Figure 1.3: (A) Human Coronary stent, and (B) Abdominal Aortic Aneuysms (AAA) stent
(Figures adoped from www.heartlinkplano.com with permission).
Artificial heart valves consist of an orifice, through which the blood flows, and a
mechanism that closes and opens the orifice.5 There are two types of artificial heart valves:
one is mechanical valves made from synthetic materials and other is from biological or tissue
valves made from animal or human tissues. Further, mechanical valves classified into three

1.1.Blood-contacting devices
4
types based on the opening and closing mechanism. These mechanisms are a reciprocating
ball, a tilting disk, or two semicircular-hinged leaflets. Similarly, tissue valves can be divided
into homografts and xenografts or heterografts. Homografts signify the transport from the
same species (from human to human or from animal to animal) and xenografts denote the
transport from one species to another (from pig to human).7
Figure 1.4: (Left) Picture of a mechanical heart valve made from diamond like carbon with
flaps that can open and close with the pumping of blood, and (Right) A collapsible valve, first
introduced in 2007. It can be stretched-down to the width of a pencil in order to thread from
a blood vessel in the leg to the heart‟s failing valve and replace it. (Figures adopted from
www.scientificamerican.com with permission).
1.1.Blood-contacting devices
5
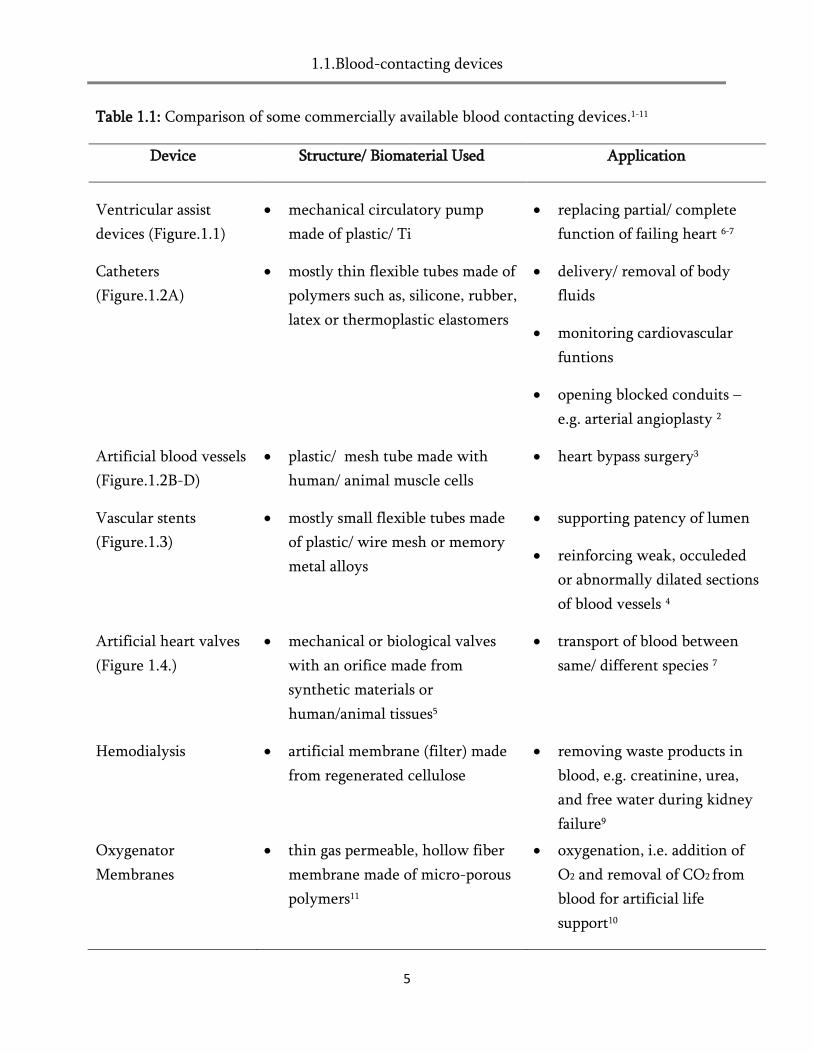
Table 1.1: Comparison of some commercially available blood contacting devices.1-11
Device Structure/ Biomaterial Used Application
Ventricular assist
devices (Figure.1.1)
mechanical circulatory pump
made of plastic/ Ti
replacing partial/ complete
function of failing heart 6-7
Catheters
(Figure.1.2A)
mostly thin flexible tubes made of
polymers such as, silicone, rubber,
latex or thermoplastic elastomers
delivery/ removal of body
fluids
monitoring cardiovascular
funtions
opening blocked conduits –
e.g. arterial angioplasty 2
Artificial blood vessels
(Figure.1.2B-D)
plastic/ mesh tube made with
human/ animal muscle cells
heart bypass surgery3
Vascular stents
(Figure.1.3)
mostly small flexible tubes made
of plastic/ wire mesh or memory
metal alloys
supporting patency of lumen
reinforcing weak, occuleded
or abnormally dilated sections
of blood vessels 4
Artificial heart valves
(Figure 1.4.)
mechanical or biological valves
with an orifice made from
synthetic materials or
human/animal tissues5
transport of blood between
same/ different species 7
Hemodialysis artificial membrane (filter) made
from regenerated cellulose
removing waste products in
blood, e.g. creatinine, urea,
and free water during kidney
failure9
Oxygenator
Membranes
thin gas permeable, hollow fiber
membrane made of micro-porous
polymers11
oxygenation, i.e. addition of
O2 and removal of CO2 from
blood for artificial life
support10

1.2.Biomaterials and their limitations
6
1.2. Biomaterials and their limitations
In general, biomaterials are materials that are used in medical devices or implants.
These can be polymers, metals, ceramics or composites of these materials. Table 1.2 lists a
few such examples.12-13 In 1982, the National Institute of Health (NIH) development on
clinical applications, first introduced biomaterials as, "any substance other than a drug or a
combination of substances, synthetic or natural in origin, which can be used for any period
of time wholly or as part of a system which treats, augments, or replaces any tissue, organ or
function of the body". Williams later modified this concept stating that, a biomaterial is a
synthetic or a modified natural material that interacts with parts of the body.14
Also in the early 1980‟s, biocompatibility, the most important among the
characteristics of biomaterials was equated to inertia15 although the idea was ambiguous since
there is no ideal inert material, which does not interact with body fluids or tissues.
Eventually by early 1990‟s Williams14-15 and Ratner 16 introduced definitions that were more
precise. According to Williams, biocompatibility is "the ability of the materials to perform
with an appropriate host response in a specific application”. Whereas according to Ratner,
biocompatibility is “the exploitation by materials of the proteins and cells of the body to
meet a specific performance goal”. In other words, the ability of an implant surface to: (a)
interact with liquids and cells of the biological system, and (b) cause exactly the same
reaction, which an analogue body tissue would bring about, i.e., the body‟s acceptance of
materials.16
Chemical and physical characteristics, such as, hydrophilicity, hydrophobicity, ionic
group, crystallinity, and surface topography have been used to describe a biocompatibility.17
However, these results remained unsatisfying and were often not understood. Hence, the
searches for physical properties that can be used to predict the biocompatibility of a material
are in the center of many research activities.
1.2.Biomaterials and their limitations
7
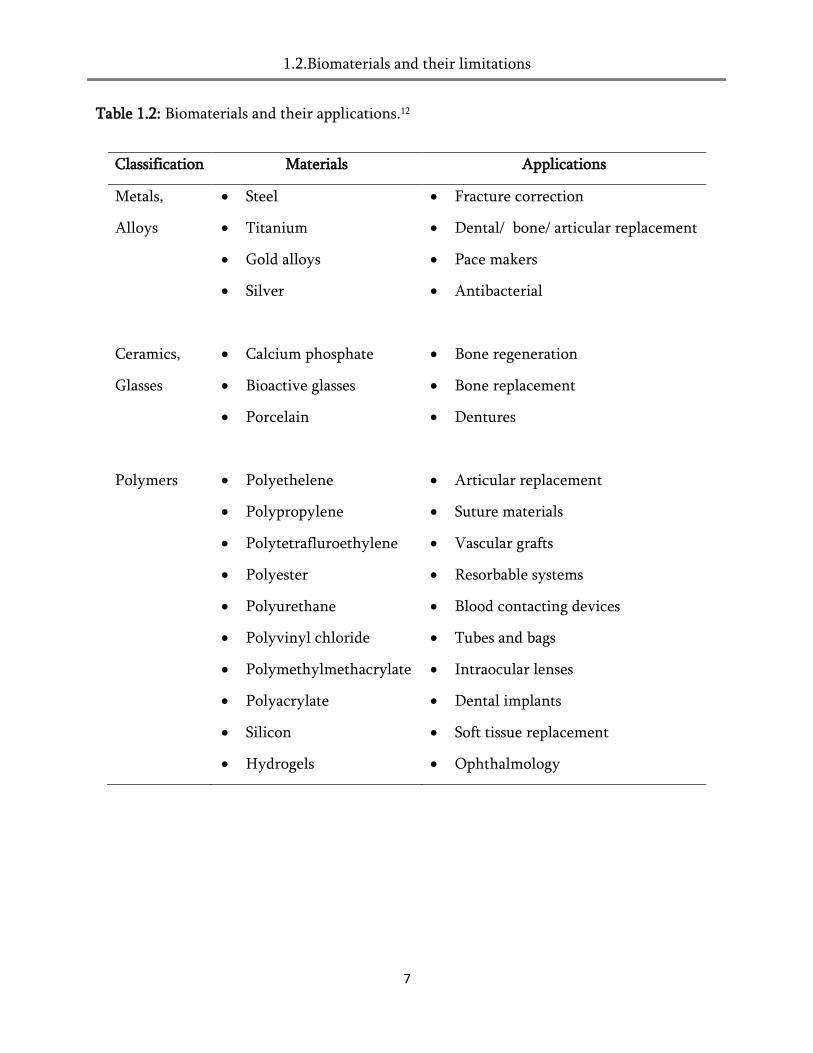
Table 1.2: Biomaterials and their applications.12
Classification Materials Applications
Metals,
Alloys
Steel
Titanium
Gold alloys
Silver
Fracture correction
Dental/ bone/ articular replacement
Pace makers
Antibacterial
Ceramics,
Glasses
Calcium phosphate
Bioactive glasses
Porcelain
Bone regeneration
Bone replacement
Dentures
Polymers Polyethelene
Polypropylene
Polytetrafluroethylene
Polyester
Polyurethane
Polyvinyl chloride
Polymethylmethacrylate
Polyacrylate
Silicon
Hydrogels
Articular replacement
Suture materials
Vascular grafts
Resorbable systems
Blood contacting devices
Tubes and bags
Intraocular lenses
Dental implants
Soft tissue replacement
Ophthalmology

1.3. Blood compatibility / Hemocompatibility
8
1.3. Blood compatibility / Hemocompatibility
A biomaterial is called as blood compatible or hemocompatible, provided its
interaction with blood does not instigate any damage to blood components, such as blood
cells and plasma proteins.18 Adsorption of proteins and other molecules initially occurs upon
exposure of the implant material to blood. Proteins typically adsorb onto the surface via non-
specific interactions.19 In general, hydrophobic surfaces will adsorb large amounts of protein
than hydrophilic surfaces. The abundant small plasma proteins in the blood are adsorbed fast
and sequentially displaced by larger proteins (more details provided in chapter 5.2) also
known as the Vroman-effect, governs the temporal pattern of protein adsorption.1,20 This can
affect the conformation of adsorbed proteins based on chemical and surface properties of the
biomaterials.
Additionally, the adsorbed protein layers will control the biological process such as,
cell adhesion, activation of enzyme cascades of coagulation and inflammation. These
inflammatory reactions end in an encapsulation of the biomaterial, i.e. the development of
scar tissue around the implants.21 This results in the formation of a thrombus, one of the
major complications in many medical devices, especially in the case of cardiovascular
application, where it affects the long-term stability of devices. Therefore, it is crucial to
understand the formation of thrombus to pave a new bioengineering path for
hemocompatible surfaces.
1.4. Thrombus formation
As mentioned earlier, the first event to occur after exposure of a foreign material to
mammalian blood stream is the quick adsorption of plasma proteins onto the material
surface, after which it triggers a cascade of complex reaction as shown in Figure 1.5.
1.4. Thrombus formation
9
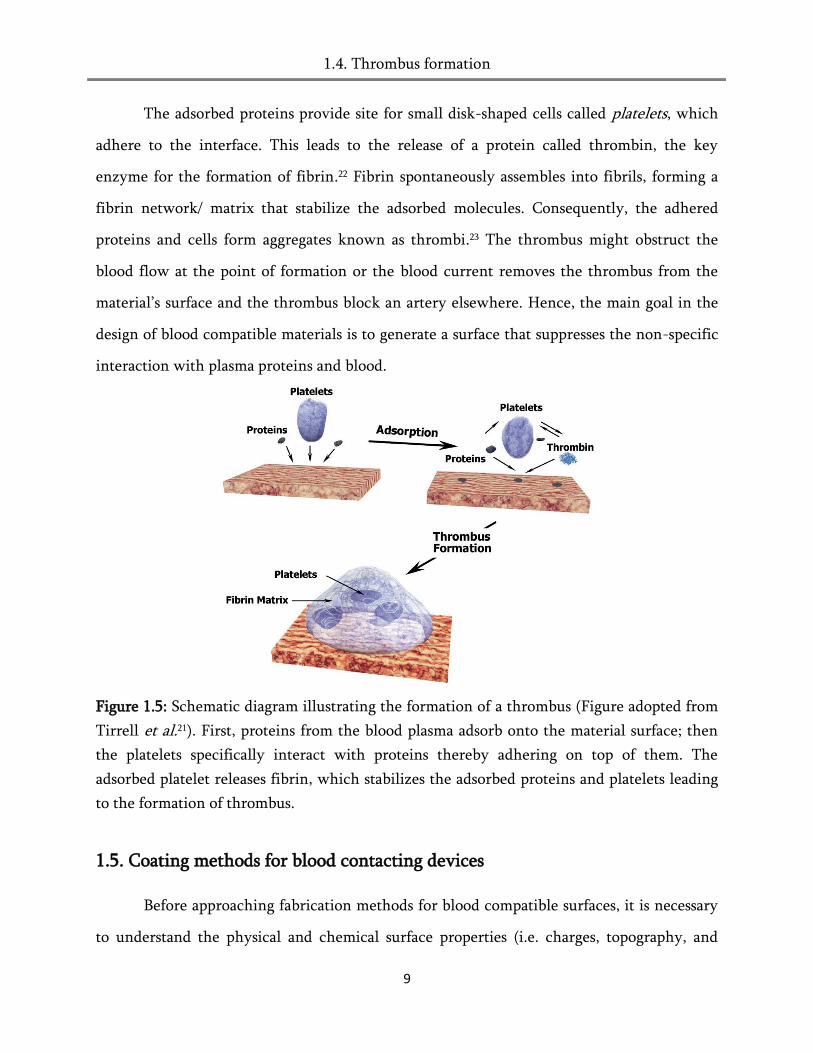
The adsorbed proteins provide site for small disk-shaped cells called platelets, which
adhere to the interface. This leads to the release of a protein called thrombin, the key
enzyme for the formation of fibrin.22 Fibrin spontaneously assembles into fibrils, forming a
fibrin network/ matrix that stabilize the adsorbed molecules. Consequently, the adhered
proteins and cells form aggregates known as thrombi.23 The thrombus might obstruct the
blood flow at the point of formation or the blood current removes the thrombus from the
material‟s surface and the thrombus block an artery elsewhere. Hence, the main goal in the
design of blood compatible materials is to generate a surface that suppresses the non-specific
interaction with plasma proteins and blood.
Figure 1.5: Schematic diagram illustrating the formation of a thrombus (Figure adopted from
Tirrell et al.21). First, proteins from the blood plasma adsorb onto the material surface; then
the platelets specifically interact with proteins thereby adhering on top of them. The
adsorbed platelet releases fibrin, which stabilizes the adsorbed proteins and platelets leading
to the formation of thrombus.
1.5. Coating methods for blood contacting devices
Before approaching fabrication methods for blood compatible surfaces, it is necessary
to understand the physical and chemical surface properties (i.e. charges, topography, and

1.5. Coating methods for blood contacting devices
10
surface energy) influence hemocompatibility.24 Generally, hydrophobic surfaces adsorb more
plasma proteins than hydrophilic surfaces.25 However, this is not universal. The plasma
oxidation of hydrophobic surfaces, for example on polypropylene/polyurethane can cause an
increase in the wettability and proteins adsorption but reduces platelet adhesion.26 In
addition, negatively charged surfaces activate plasmatic coagulation,27 and positively charged
surfaces - enhance adhesion and activation of blood platelets.28-29
Textured surfaces show less thrombus formation. It has been hypothesized that the
cavities in such texturing entrap blood components to form a biological neointimal1 layer is
formed, which controls the thromboembolytic events.8,30 Excimer laser micromachining is
used to prepare a master negative mold of patterned cavities for the generation of a
polyurethane textured surface by a solvent casting. Figure 1.6 shows scanning electron
microscopic images of textured surfaces consisting regularly spaced and tapered with
polyurethane microfiberes of 25, 50 and 100 µm in length, and the spacing of approx. 100µm.
The textured surfaces showed a strong deposition of white cells than the non-textured
surfaces. However, one out of ten samples showed a thrombus formation and the origin of
this behavior is not well understood.30
Figure 1.6: Scanning electron micrographs of polyurethane textured surfaces with fiber
length of 25µm (left), 50µm (middle) and 100µm (right) were obtained using excimer laser
micromachining techniques.30 Figure adopted from Fujisawa et al.30
1neointimal – a new or thickened layer of arterial intima formed especially on a prosthesis or
in atherosclerosis by migration and proliferation of cells from the media (www.m-w.com).8,30
1.5. Coating methods for blood contacting devices
11
1.5.1. Inorganic coatings
Inorganic coatings especially metal nitrides, metal oxides and diamond like carbon
(DLC) are widely used in medical devices such as mechanical pumps and stents. In general,
these materials show excellent mechanical and chemical stability and comparatively high
inertness with body fluids and tissues. Titanium (Ti) and titanium alloy (TiN) are suitable
materials for bone implantations due to their excellent integration with bone, and for the last
two decades, it is one of the most successful coatings for heart valves and ventricular assist
devices.31 In addition, Ti oxides show improved hemocompatibility for many medical
devices.32 DLC also has an advantage of having high mechanical strength, low frictional
coefficient, chemical inertness, high thermal conductivity and excellent biocompatibility.
DLC is a meta-stable form of amorphous carbon that contains a combination of sp3 (diamond
like) and sp2 (graphite like) hybridization with some of the bonds terminated with hydrogen
(amorphous carbon and amorphous hydrogenated carbon).33 Cathodic arcs, pulsed laser,
direct ion beam can be used to deposit DLC film, as well as plasma enhanced chemical vapor
deposition and sputtering techniques are also being used. Among inorganic coatings, DLC
coated surface shows the least platelet adherence compared to metal oxides and nitrides.10
1.5.2. Organic Coatings
The use of organic compounds and several polymers as biomaterials has been
successful in medical devices for the last five decades. The advantage of organic coatings over
inorganic coatings is that they offer a wide range of chemical surface modification and an
abundance in the materials selection for desired applications.34 However, they are prone to
hydrolytic degradation in biological situations with time. The surface coatings include
Endothelial lining, Bioactive coatings, and Surface passivation. The following sections discuss
each of them in detail.

1.5. Coating methods for blood contacting devices
12
Endothelial lining:
This method mimicks the natural blood vessels of the human body with a layer lining
of endothelial cells (EC‟s) on the material surface of blood contacting device.35 The process
first includes depositing with biological molecules such as fibronectin, fibrinogen, peptides,
and growth factors at the devices. Then, endothelial progenitor is seeded and allowed to
differentiate into endothelial cells to form a monolayer of EC‟s (See Figure 1.7) However, the
application of EC coatings for blood devices is still in its infancy. Although less
thrombogenic, the generation of a uniform monolayer on the surface is difficult to achieve.36
Besides, EC‟s lining becomes less viable or loses its function of endothelial-dependent
relaxation and biological factor production.
Figure 1.7: Schematic drawing of a human blood vessel illustrating the Endothelial lining
which is a crucial characteristic of human blood vessel functions.Figure adopted from Tirrell
et al. 21
Bioactive coatings:
Heparin is one of the materials widely used in bioactive coating for blood contacting
devices. Its anticoagulant activity in plasma inactivates the formation of fibrin clots
1.5. Coating methods for blood contacting devices
13
inhibiting two principle procoagulant proteases, factor Xa and thrombin.[37 A heparin coating
is generated, first by preparing an intermediate layer of polyamine, and then the heparin
composed with antithrombin (which is a binding site for thrombin) is covalently attached to
the polyamine surface (which is already coated on the device surface, as shown in Figure
1.8.). Recent developments along these lines, employ polymeric coatings constituted of nitric
oxide (NO) chemistry and immobilized active heparin.38 A lipophilic N-diazeniumdiolate
(diazeniumdiolated dibutylhexanediamine (DBHD/ N2O2)), is doped into an underlying
polymeric layer of the coating and continuous release of NO was initiated upon exposure of
the layer to water. Consequently, the uptake of water molecules releases NO from the
polymeric surface. The top layer or the outer most layers also contain heparin attached with
the help of suitable spacers, as shown in Figure 1.8. This dual approach is very much similar
to that of natural EC lining of human blood vessels, where it meets the two principle
thrombotic mechanism of potent antiplatelet activity of NO and inhibition of two
procoagulant proteases as mentioned earlier.
Surface Passivation:
Surface passivation is a promising method to minimize non-specific interaction of
blood proteins and cells.39-41 Hydrophilic polymers such as poly ethylene glycol or PEG
related hydrogels and brushes have shown good protein repellency and biocompatibility.42-43
They have enhanced hemocompatibility and methods that can be used for surface
modification of these molecules are physisorption, covalent binding of functionalized
molecule are revieved elsewhere.44 Surface passivation was extensively used in the
application such as microencapsulation of cells, coatings on dialysis membrane, stents and
stents graft. Figure 1.8 shows an example for surface passivation of metal stents using
heparin-based coatings.

1.6. Hydrogels
14
Figure 1.8: Schematic showing prominent features of a heparin-coated stent. A, The stent is
coated with a polymer made of multiple layers of polyamine and dextran sulphate; B,
depolymerized molecules of heparin are covalently bound to this polymer and the –NH-CH2
(covalent) bond is described; C, pentasaccharide constituting the binding site for
antithrombin of each heparin molecule is shown; and D, continuous neutralization cycle of
thrombin is illustrated.38
1.6. Hydrogels
Hydrogels are three-dimensional polymeric networks, which has the ability to swell
in water without dissolving in it.45 Polymeric chains are the constitutents of the hydrogels
that are crosslinked either chemically or physically. If the polymer chains are not crosslinked
then the hydrophilic polymer can dissolve in water due to the theromodynamic
compatibility of the polymer and water. The presence of crosslinking points, the solubility of
the polymer is counter balanced by the retractive force of elasticity, induced by the

1.6. Hydrogels
15
crosslinking point of the network. In addition, the crosslinking in the network maintains the
three-dimentional intergrity of the hydrogels in a swollen state.
In physically crosslinked hydrogels, the chains of the polymer are connected through
the weak van der Waals interactions, ionic interactions, hydrogen bonding, or hydrophobic
interactions.46 These forces are comparatively weak so that the system can reversibly go from
soluble (sol) to a crosslinked state (gel) and vice-versa. For example, sodium alginate becomes
a gel in the presence of calcium ions (Ca+2) and turns into a sol in the absence of divalent
cations.47 Also these hydrogels are not homogenous in nature due to the clusters of molecular
entanglement or hydrophobically or ionically-associated domain formation.47
In chemically crosslinked hydrogels, the linear polymer chains are covalently bonded
with each other through a crosslinking agent (thermal or photocrosslinker). The swelling of
the hydrogels depend on the crosslink density of the network, which intern depends on the
molecular weight (MW) between two adjuscent crosslinks.45 The hydrogels also show non-
homogenicity due to the presence of regions that are poorly swelling in water caused by high
crosslinking density also known as clusters, which are dispersed within the regions of low
and high crosslink density.48-49 This is due to the aggregation of crosslinking agents, which
leads to the high crosslinking density clusters. Furthermore, the swelling of the chemical
hydrogels also depends on solvent, temperature, pH, salt concentration during the gel
formation. This may phase separate and lead to the formation of water filled „voids‟ or or
macropores.45
The physical characteristics of hydrogels resemble natural living tissues more than
any other synthetic material, due to their capability to hold large amounts of water and their
soft, rubbery tissue like consistency.50-54 Hydrogels can be classified into, homo/copolymeric
networks based on their method of preparation. The side groups of the hydrogels define the
polymer as neutral, acidic/anionic and basic/cationic networks.55-59 The following sections

1.6.1. Hydrogels from synthetic polymers
16
discusses the different classes hydrogels and their application in their utilities in the
medicinal field as biocompatible materials.
1.6.1. Hydrogels from synthetic polymers
Neutral hydrogels are generated using methacrylates, acrylamides, vinyl pyrrolidone,
and vinyl alcohols or ethylene glycol.60 Polymers synthesized from such monomers carry less
charge (or zero charge) in their structure. Among them polyethylene glycol (PEG) or
polyethylene oxide (PEO) is one of the most widely investigated and frequently employed
biomaterial in medical applications.60
PEG is a non-toxic, non-immunogenic and FDA approved polymer employed in
variety of medical applications. It also has application as a “stealth material” due to its inert
behavior against blood proteins and cells.61 It has been reported that the protein repellency of
PEG depends on their molecular weight or the length of their polymeric chains. For
example, PEG with shorter chains is prone to fouling, whereas longer chains show good anti-
fouling properties. PEG hydrogel can be generated through photo polymerization or using
photo or thermal crosslinkers. For example, PEG monomers terminated with acrylate or
methacrylate forms a network upon photo polymerization at appropriate conditions.62
The incorporation of hydrolytically degradable poly lactic acid (PLA) into the PEG
can generate biodegradable PEG gels. Further, block copolymers of PEG such as tri block
copolymers of polyethylene glycol (PEG), and polypropylene oxide (PPO - abbreviated as
PEG-b-PPO-b-PEG), and similar molecules were synthesized for specific applications.63 The
network structure of PEG related hydrogels and their applications in the medical field were
investigated in detail.
1.6.2. Responsive hydrogels
17
Another extensively investigated hydrogel is poly (2-Hydroxy ethyl methacrylate),
PHEMA because of its good mechanical and optical properties. PHEMA is widely used for
contact lenses64 and in drug delivery.65 Actually, the landmark paper from Wichterle and Lim
on poly (2-hydroxyethyl methacrylate) opened the door for hydrogels applications in
medicinal field.66 Since then the research on PHEMA and other hydrogels steadily increased.
Hydrated PHEMA can hold up to 50% water, and currently more than 10% of newly fitted
contact lenses are from PHEMA related compositions. Other polymers used in contact lenses
are methacrylic acids67 and N-vinyl pyrolidone.68
Poly (vinyl alcohol) (PVA) is another frequently used biomaterial having properties
very much similar to that of PEG polymers. The PVA must be cross-linked in order to be
used in biomedical applications. Therefore, both physical and chemical crosslinking is
employed to generate PVA hydrogels. One common way to crosslink PVA is to use
difunctional crosslinking agents such as glutaraldehyde, acetaldehyde, formaldehyde, and
other monoaldehydes.69
1.6.2. Responsive hydrogels
Responsive hydrogels have the ability to swell and de-swell as a response to changes
in the surrounding environment (e.g. pH or temperature). Accordingly, they are sometimes
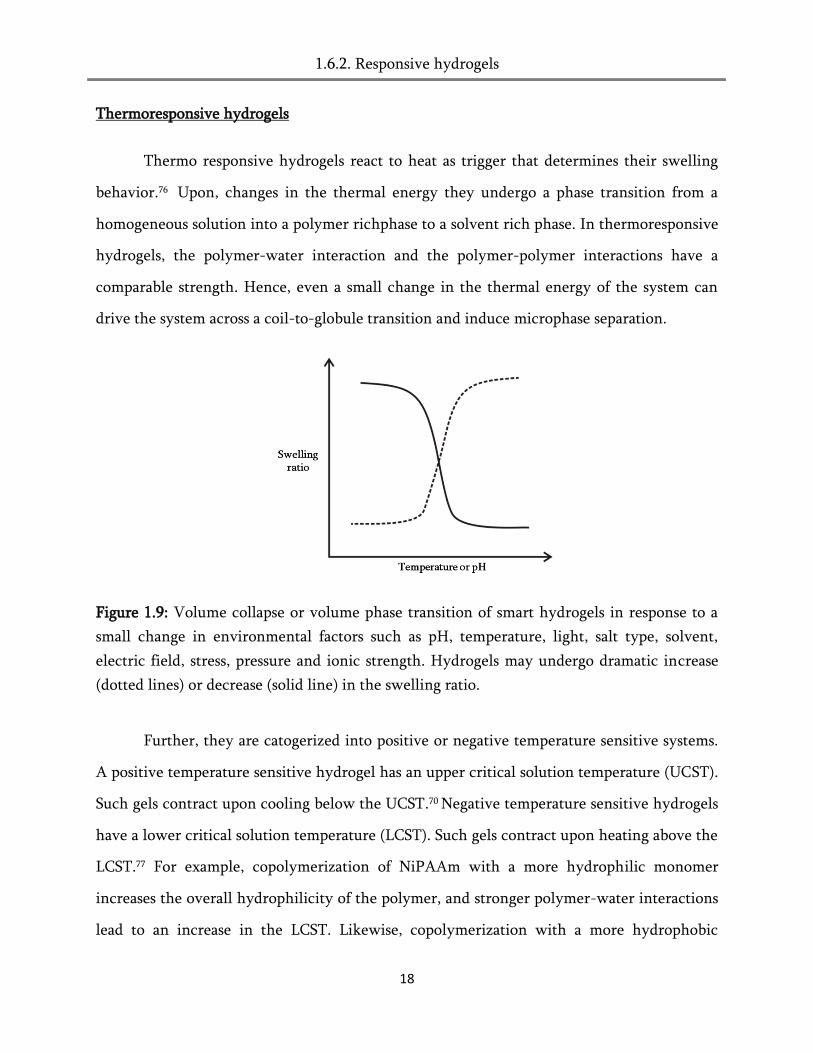
called as „intelligent‟ or „smart‟ materials.70 Figure 1.9 describes the swelling and de-swelling
of the stimuli responsive gels with respect to environmental factors, which influences the
swelling of the hydrogels, for example pH or temperature.71 The responsive hydrogels could
be further classified as physical responsive hydrogels (pressure, temperature, ultrasound,
magnetic field, electric field and ligh), chemical responsive hydro gels (pH and glucose ) and
biochemical responsive hydro gels (antigen, enzyme and ligand). Among these, the most
widely investigated smart materials are those that are responsive to temperature72-73 and
pH.74-75
1.6.2. Responsive hydrogels
18
Thermoresponsive hydrogels
Thermo responsive hydrogels react to heat as trigger that determines their swelling
behavior.76 Upon, changes in the thermal energy they undergo a phase transition from a
homogeneous solution into a polymer richphase to a solvent rich phase. In thermoresponsive
hydrogels, the polymer-water interaction and the polymer-polymer interactions have a
comparable strength. Hence, even a small change in the thermal energy of the system can
drive the system across a coil-to-globule transition and induce microphase separation.
Figure 1.9: Volume collapse or volume phase transition of smart hydrogels in response to a
small change in environmental factors such as pH, temperature, light, salt type, solvent,
electric field, stress, pressure and ionic strength. Hydrogels may undergo dramatic increase
(dotted lines) or decrease (solid line) in the swelling ratio.
Further, they are catogerized into positive or negative temperature sensitive systems.
A positive temperature sensitive hydrogel has an upper critical solution temperature (UCST).
Such gels contract upon cooling below the UCST.70 Negative temperature sensitive hydrogels
have a lower critical solution temperature (LCST). Such gels contract upon heating above the
LCST.77 For example, copolymerization of NiPAAm with a more hydrophilic monomer
increases the overall hydrophilicity of the polymer, and stronger polymer-water interactions
lead to an increase in the LCST. Likewise, copolymerization with a more hydrophobic
1.6.2. Responsive hydrogels
19
monomer results in a lower LCST than PNiPPAm.78 In the crosskinked hydrogels, usually the
network chains undergoes phase separation above the LCST or below UCST, which makes
the system to collapse and thus the de-swelling.77-78
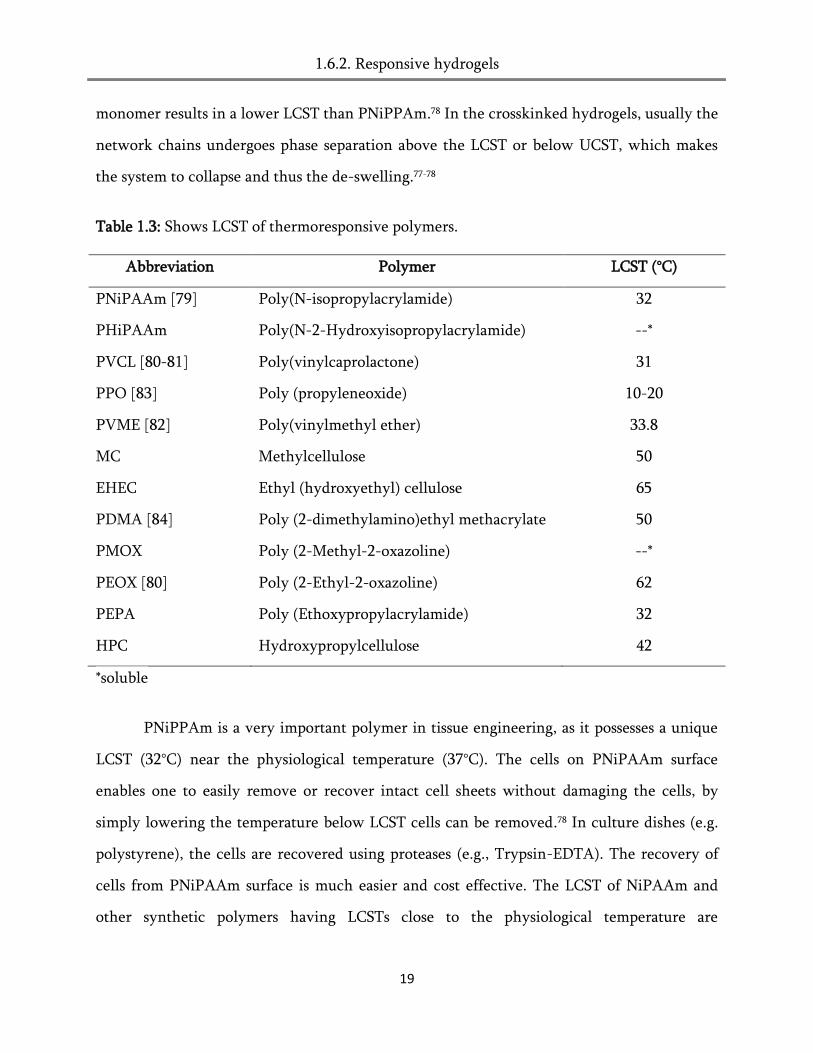
Table 1.3: Shows LCST of thermoresponsive polymers.
Abbreviation Polymer LCST (°C)
PNiPAAm [79]
PHiPAAm
PVCL [80-81]
PPO [83]
PVME [82]
MC
EHEC
PDMA [84]
PMOX
PEOX [80]
PEPA
HPC
Poly(N-isopropylacrylamide)
Poly(N-2-Hydroxyisopropylacrylamide)
Poly(vinylcaprolactone)
Poly (propyleneoxide)
Poly(vinylmethyl ether)
Methylcellulose
Ethyl (hydroxyethyl) cellulose
Poly (2-dimethylamino)ethyl methacrylate
Poly (2-Methyl-2-oxazoline)
Poly (2-Ethyl-2-oxazoline)
Poly (Ethoxypropylacrylamide)
Hydroxypropylcellulose
32
--*
31
10-20
33.8
50
65
50
--*
62
32
42
*soluble
PNiPPAm is a very important polymer in tissue engineering, as it possesses a unique
LCST (32°C) near the physiological temperature (37°C). The cells on PNiPAAm surface
enables one to easily remove or recover intact cell sheets without damaging the cells, by
simply lowering the temperature below LCST cells can be removed.78 In culture dishes (e.g.
polystyrene), the cells are recovered using proteases (e.g., Trypsin-EDTA). The recovery of
cells from PNiPAAm surface is much easier and cost effective. The LCST of NiPAAm and
other synthetic polymers having LCSTs close to the physiological temperature are
1.6.2. Responsive hydrogels
20
summarized in Table 1.3. However, it has been demonstrated that the presence of salts and
pH can also influences the phase transition temperature of these systems to a certain extent.79
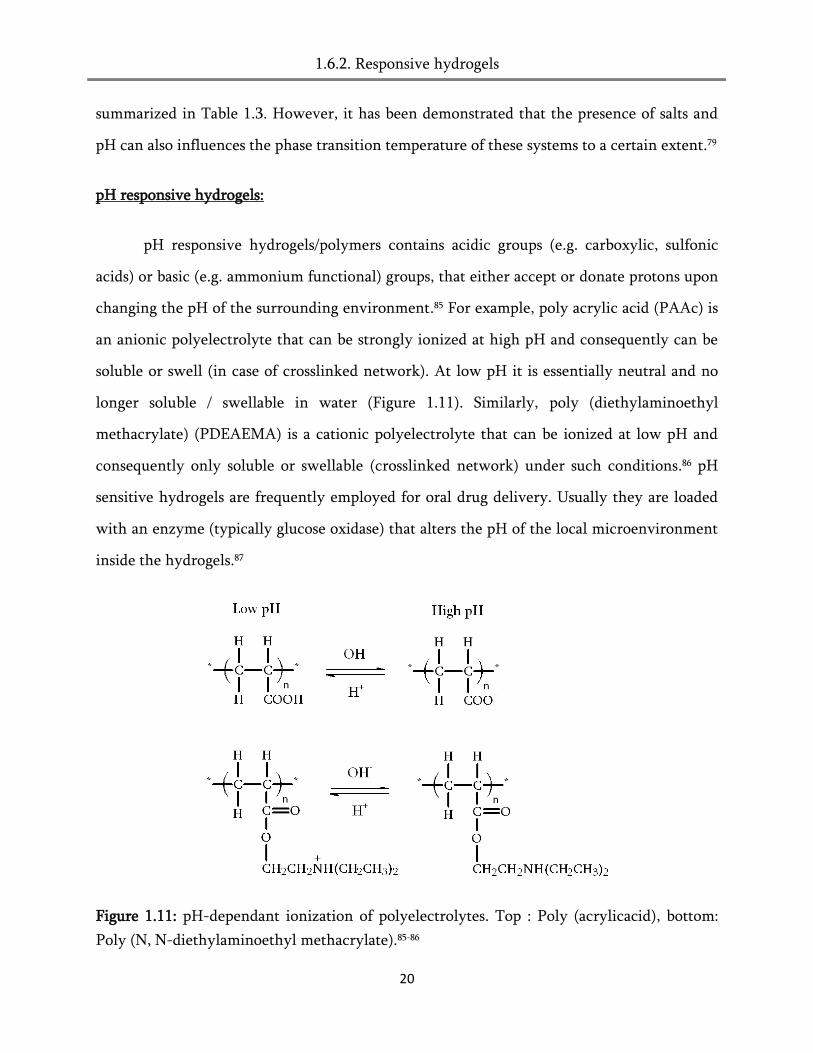
pH responsive hydrogels:
pH responsive hydrogels/polymers contains acidic groups (e.g. carboxylic, sulfonic
acids) or basic (e.g. ammonium functional) groups, that either accept or donate protons upon
changing the pH of the surrounding environment.85 For example, poly acrylic acid (PAAc) is
an anionic polyelectrolyte that can be strongly ionized at high pH and consequently can be
soluble or swell (in case of crosslinked network). At low pH it is essentially neutral and no
longer soluble / swellable in water (Figure 1.11). Similarly, poly (diethylaminoethyl
methacrylate) (PDEAEMA) is a cationic polyelectrolyte that can be ionized at low pH and
consequently only soluble or swellable (crosslinked network) under such conditions.86 pH
sensitive hydrogels are frequently employed for oral drug delivery. Usually they are loaded
with an enzyme (typically glucose oxidase) that alters the pH of the local microenvironment
inside the hydrogels.87
Figure 1.11: pH-dependant ionization of polyelectrolytes. Top : Poly (acrylicacid), bottom:
Poly (N, N-diethylaminoethyl methacrylate).85-86
1.7.1. Drug delivery
21
1.7. Hydrogels in medical applications
Hydrogels are one of the fundamental materials employed in therapeutics such as
drug delivery, tissue engineering and medical devices.88 The popularity of hydrogels in
therapeutics is due to their satisfactory performance upon in vivo implantation in blood
contacting or tissue-contacting applications.89-90 The following section will discuss three
major uses of hydrogels, i.e. drug delivery, tissue engineering, and medical devices.
1.7.1. Drug delivery
The change in the swelling behavior of hydrogels is an efficient tool to trigger drug
release.88 They provide promising properties for drug delivery systems because they allow
zero-order drug release, which is mandatory if drugs need to be delivered in a pulsatile
fashion.91 The oral drug delivery route is one of the most common methods in
pharmaceutical applications involving hydrogels. For example, in peroral administration,
hydrogels can deliver drugs to four major specific sites such as mouth, stomach, small
intestine and colon.92 By controlling their swelling properties or bioadhesive characteristics
in presence of biological fluid, hydrogels can be useful for releasing drugs in a controlled
manner at these desired sites.93 Additionally, they can also adhere to certain specific regions
in the oral pathway, leading to a locally increased drug concentration, and thus enhancing
the drug absorption at the release site.94 Other than oral delivery, rectal, transdermal,
subcutaneous deliveries are also of importance.95-97 Details are described elsewhere.92 The
release characteristics can be tuned by controlling factors like polymer composition,
molecular weight, crosslink density and network structure.
Environmentaly sensitive hydrogels have been the best candidates for drug delivery
and release due to their stimuli response against pH, temperature, light and other factors as
mentioned earlier.78-87 These gels swell or shrink upon changing surrounding environmental
1.7.1. Drug delivery
22
conditions and can efficiently trigger drug release at specific sites in pulsatile fashion.
Another usual approach is to create micelles with the stimuli responsive gels as the outer
shell encapsulating the drug. For example, block copolymer comprised of PNiPAAm and
poly (methyl methacrylate) (PMMA) at 20°C forms micelles due to the amphiphilic nature of
the copolymer. These micelles can be loaded with the anti-inflammatory drug prednisone
acetate for the maximum drug release is obtained in 24h.98
Despite the vast number of in vitro investigations of PNiPAAm and other thermo-
responsive materials on advanced drug delivery, they are less promising in application of
regenerative medicine because they are not biodegradable.92-98 Another similar biodegradable
thermo-responsive polymer is poly [α/β-(DL-asparateisopropylamide)-co-(succinimide)]
(IPA-PSI) which contains the isopropylamide side groups, found in pNIPAM, as the source
of the thermo-responsive properties. 98, 99 However, these polymers have not been tested in
vivo for drug or cell loading/ release, and applications remain a challenge in biodegradable
thermo-responsive polymers for medical and biological technologies.100
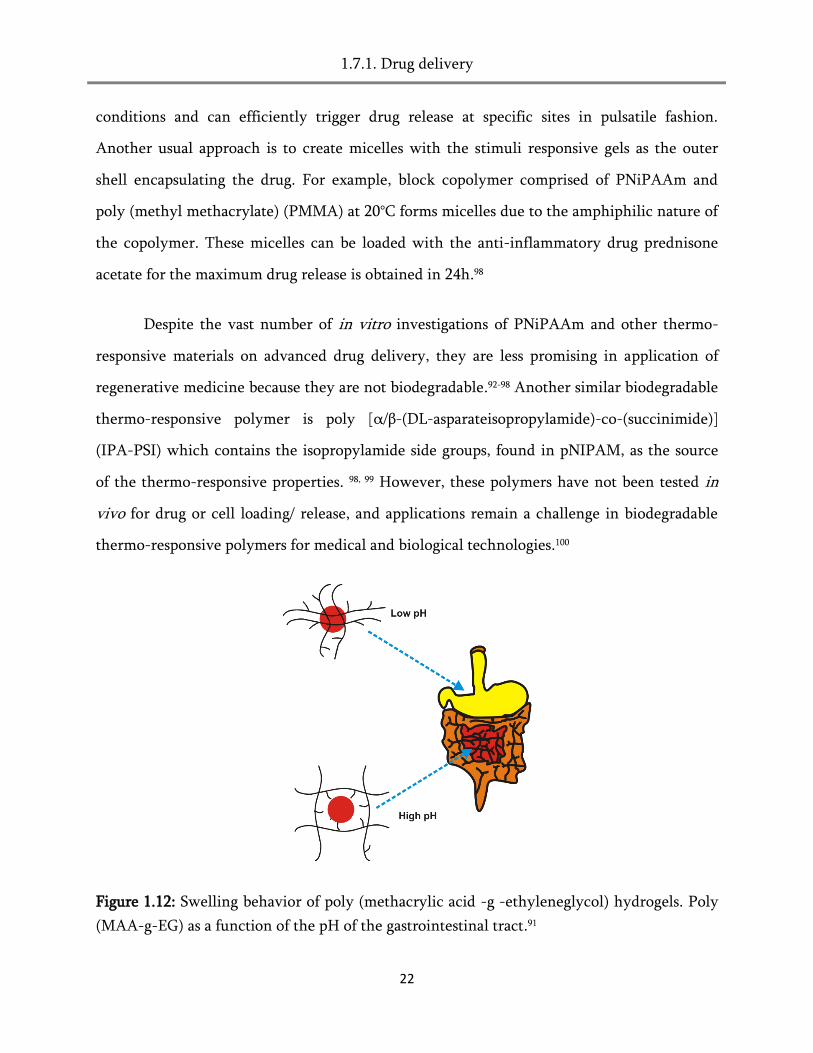
Figure 1.12: Swelling behavior of poly (methacrylic acid -g -ethyleneglycol) hydrogels. Poly
(MAA-g-EG) as a function of the pH of the gastrointestinal tract.91
1.7.2. Tissue engineerings and medical devices
23
Figures 1.12 illustrate the hydrogel that responds to a pH change, protects protein
drugs such as insulin and calcitonin from the acidic pH of the stomach, and then release it
into the more alkaline pH of the intestine. Further, these bioadhesive polymers can protect
the proteins from degradation in the small intestine and temporarily open connections
between intestinal cells to allow proteins to penetrate into the intestine.100 However, one of
the major problems associated with these pH sensitive hydrogels is that they are not
biodegradable under physiological conditions and which limits their use in drug delivery
systems and related applications.46
1.7.2. Tissue engineering and medical devices
Tissue engineering aims to repair, replace, or regenerate its original tissue or organ
function to create artificial tissues or organs for transplantation.91 The earliest clinical
applications of tissue engineering revolved around the use of essentially flat materials
designed to stimulate wound healing.101 Later in the 1990s, a powerful cell-sheet technology
produced thin sheets of cells in cell culture. In both the applications, engineered tissue
equivalent is relatively easy to culture in vitro because oxygen and nutrient delivery to a
thin, essentially two-dimensional material is not challenging. The construct cultured ex vivo,
integration into the body is not a barrier for thin materials.102 Listed below are some pre-
requirement that need to be fulfilled for a material to be useful as scaffold in tissue
engineering:
Biocompatibility of the polymer: it should not cause any sorts of unwanted immune
response or cytotoxicity
It should have enhanced properties to mimic the natural extra cellular matrix (ECM)
and attribute cell adhesion, proliferation, migration and cell-cell interaction
Biodegradable
Easily to sterilize
1.7.2. Tissue engineerings and medical devices
24
Hydrogels are interesting candidates for successful scaffolds that possess excellent
biocompatibility because they fulfill most or all of the above criteria.103 Hydrogels are
designed in such way that, they have large pores to accommodate living tissues or dissolve or
degrade away, while releasing growth factors such as cytokines and hormones.104 That
generates pores in which cells can penetrate and proliferate comfortably.105 In summary
hydrogels have different functions in tissue engineering. They are scaffolds, deliver bioactive
molecules, and provide 3D structures that organize cells and present stimuli to direct the
formation of a desired tissue.90
Space filling scaffold
Space filling agents encompass scaffolds that function as bioadhesives also known as
biological glue.106 The basic requirement for a hydrogel is the ability to maintain a desired
volume and structural integrity for the required time.107 As a bulking material, these implants
are used to treat conditions such as urinary incontinence, vesicoureteral reflux, and are
needed for both plastic and reconstructive surgery.108
Scaffolds composed from natural polymers (see section 1.6.1) such as collagen,
alginate and chitosan are potential candidates employed as bulking agents. Implants of
porous scaffolds of RGD modified alginate and porous chitosan showed minimal immune
response in mice.109 However, the most common problem associated with bulking agents is
the successive injections to maintain the functionality. In addition, these scaffolds remain
relatively isolated from the surrounding tissue. Therefore, synthetic hydrogels are often
appropriate materials for use as anti-adhesives because cells lack adhesion receptors to them
and proteins often do not readily adsorb to them if designed appropriately.106 PEG and PVA
based hydrogels copolymerized or grafted with poly (L-lysine), (PLL) that would adhere to
the tissue on one side and provide non-adhesive brush like structure on the other side. Here,
the polymer liquid is dripped on the site of interest but not gelled.110
1.7.2. Tissue engineerings and medical devices
25
Scaffold for cell delivery
Hydrogel scaffolds are highly hydrated, three-dimensional networks that can provide
sites for cells to adhere, proliferate, differentiate, and provide chemical signals through
manipulation of the mechanical properties of the material. Hydrogel scaffolds currently help
to engineer a wide range of tissues, including cartilage, bone, muscle, fat, liver, and
neurons.106 Hydrogels have a macromolecular structure similar to the cartilage, which is a
highly hydrated tissue composed of chondrocytes and embedded in type II collagen and
glycosaminoglycans (GAG‟s). Photocrosslinked PEO and freeze dried chitosan scaffolds
posses high moduli and enhance the proliferation of cells. Both collagen and peptide
modified hydrogels have been used in the scaffolds for skeletal muscle engineering.111
Collagen has been widely used for engineering large blood vessels. Alginate hydrogels also
show potential as Schwann cell matrices in the area of nerve grafting and as scaffold to
promote hepatocyte function and liver specific proteins.91
The advantage of using hydrogels in tissue engineering is that, their tendency to hold
large amounts of water molecules in an aqueous environment, protect cells and fragile drugs
(like proteins, peptides, oligonucleotides and DNA). Hydrogels are good for transport of
nutrients to cells.90 Modified with cell adhesion ligands and injected in vivo as a liquid they
become gel at body temperature. However, poor mechanical strength, sterilization and
handling are common problems involved with hydrogels in tissue engineering.51
Medical devices
In the implantation of medical devices often requires complex surgery followed by
device implantation.112 However, with the development of minimally invasive surgery, it is
possible to place small devices inside the body using laparoscopes. These types of surgical
1.8. Challenges in biomedical applications
26
advances may create new opportunities to enable implantation of a bulky device into the
human body in a convenient way.113
1.8. Challenges in Biomedical applications
Numerous challenges remain in biomaterials development. These challenges include
targeting materials (containing drugs), to specific cells; designing materials that can sense
biochemical signals in the body; and in general developing materials with improved
biocompatibility.113
Biology and materials science need to address these challenges in an interdisciplinary
fashion. Investigation of the extracellular matrix biology, cell receptors, and immunology
will help to understand how the body responds to specific materials.114
Analogously, advances in biomaterials will create new opportunities to mimic entities
in the body (such as cells), and advances in materials characterization will aid in
understanding how materials interact with cells and tissues.1
A particular challenge in addressing material issues for biomedical engineering is that
the biological processes are not yet understood well enough to provide a clear set of design
parameters for advance specifications. Indeed, evolution of materials/ devices and knowledge
of biological processes occur simultaneously.

2. Goal and Strategy of the work
27
2. Goal and Strategy of the work
2.1 Goal
‘In biomaterials engineering we are missing a piece in the logical train’
Buddy.D.Ratner
One of the major complications that arise in blood-contacting medical devices is the
formation of a thrombus.1 The quick and non-specific adsorption of plasma protein is the
initial event of such a process.113-115 Consequently, the adsorbed proteins are ample enough to
trigger the necessary subsequent reactions that lead to thrombus accumulation at the surface
of the biomaterial.116 Therefore, the aim of this research was:
I. Generate a surface coating that suppresses the non-specific adsorption of plasma
proteins and their subsequent event such as blood platelet adhesion, activation, and
cellular adhesion.
II. Deduce a plausible mechanism for the protein adsorption and repellency of the
polymeric surfaces. More precisely, interrogate the previously developed models such
as size exclusion and entropic shielding to explain the protein repellency of the
surfaces.
III. Provide a detailed insight on the swelling of the surface-attached networks in water
and humidity. Draw a correlation between the swelling and the interactions of
biomacromolecules.
2.2. Strategy of the work
In view of the above, the ultimate strategy of the work was to understand and
develop the mechanisms that make surfaces or coatings bioinert and blood compatible in the
2. Goal and Strategy of the work
28
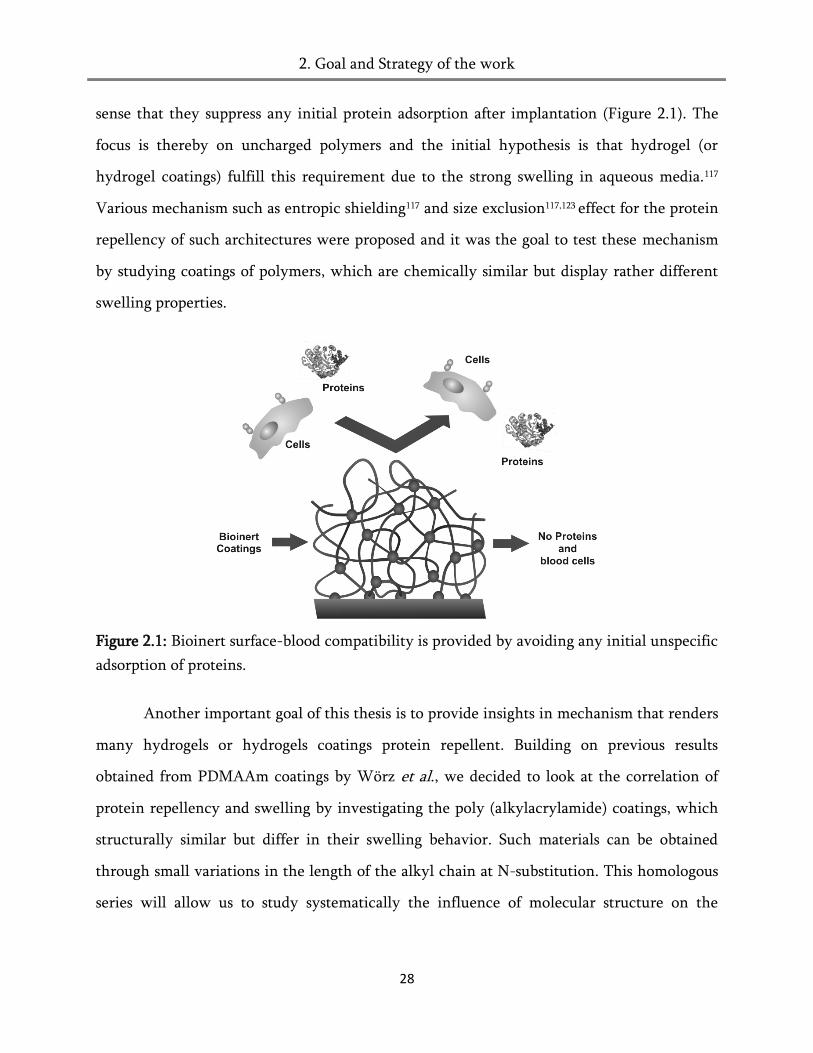
sense that they suppress any initial protein adsorption after implantation (Figure 2.1). The
focus is thereby on uncharged polymers and the initial hypothesis is that hydrogel (or
hydrogel coatings) fulfill this requirement due to the strong swelling in aqueous media.117
Various mechanism such as entropic shielding117 and size exclusion117,123 effect for the protein
repellency of such architectures were proposed and it was the goal to test these mechanism
by studying coatings of polymers, which are chemically similar but display rather different
swelling properties.
Figure 2.1: Bioinert surface-blood compatibility is provided by avoiding any initial unspecific
adsorption of proteins.
Another important goal of this thesis is to provide insights in mechanism that renders
many hydrogels or hydrogels coatings protein repellent. Building on previous results
obtained from PDMAAm coatings by Wörz et al., we decided to look at the correlation of
protein repellency and swelling by investigating the poly (alkylacrylamide) coatings, which
structurally similar but differ in their swelling behavior. Such materials can be obtained
through small variations in the length of the alkyl chain at N-substitution. This homologous
series will allow us to study systematically the influence of molecular structure on the
2. Goal and Strategy of the work
29
penetration of protein and the subsequent cell adhesion. The key parameters in the selected
materials are:
Monomers with different alkyl substituents are easy to synthesize and most of them
are commercially available.118-120
Readily prepared by free-radical polymerization along with crosslinking agent.121
Neutral with controlled hydrophilicity and water solubility.122
The hydrophilicity of the acrylamides can be modulated through length of the alkyl
chains at N-substitution. Hence, coatings of a homologous series of poly (alkylacrylamides)
namely methyl, ethyl, dimethyl, propyl, butyl and diethylacrylamides were chosen for these
studies. The coatings were prepared via an established photochemical technique, which
involves prepolymers of the desired alkylacrylamide containing few percent of a
photoreactive co-monomer.119

3.1. Synthesis of crosslinker (MABP) and anchor (Bp-Si)
30
3. Synthesis and characterizations
This chapter is organized in a way first, it discusses the synthesis of the crosslinking
agent 4-Methacryloyl-oxy-benzophenone (MABP) and the anchor silane that is used for
surface-attachment 4-[3-(Triethoxy silyl) propyloxy] benzophenone (Bp-Si). Then it
discusses the synthesis of copolymers and tricopolymers composed of alklyacrylamides with
the crosslinker MABP. The description of the surface-attachment procedure of synthesized
polymers is then followed by a section surface characterization with regard to water stability,
gel fraction, water contact angle and topography of the homologous series.
3.1. Synthesis of crosslinker (MABP) and anchor (Bp-Si)
Synthesis of 4-Methacryloyl-oxy-benzophenone (MABP)
MABP is readily available from methacryloyl chloride and 4-hydroxy benzophenone
via standard Schotten-Baumann esterification using triethylamine as an acid scavenger
(Figure 3.1). The raw product can be recrystallized from a mixture of ethylacetate and n-
hexane mixture. The final yields are typically between 80-85%.119,121 It has been
demonstrated previously that MABP was used to crosslink various polymers with an
excellent yield. 119, 123, 124
Figure 3.1: The reaction scheme of the synthesis of 4-Methacryloyl-oxy-benzophenone
(MABP).

3.1. Synthesis of crosslinker (MABB) and anchor (Bp-Si)
31
Figure 3.2: The reaction scheme of the synthesis of 4-[3(Triethoxy silyl) propyloxy]
benzophenone.
Synthesis 4-[3-(Triethoxy silyl)propyloxy]benzophenone (Bp-Si)
Bp-Si was employed in the preparation of surface-attached films. It has been
demonstrated that Si-(OEt)3 or Si-(Me)2Cl functionalities show increased affinity with silica
or glass substrates.117,123 Tri-ethoxysilane was allowed to react with alloyloxy benzophenone
in the presence of Pt-C, which was used as a catalyst in a nitrogen atmosphere. After
completion of the reaction, the catalyst was removed by filtration and the excess tri-ethoxy
silane was removed by vacuum distillation (Figure 3.2). Similarly, the reaction of dimethyl
chlorsilane and alloyloxy benzophenone resulted in 4-[3(Chlorodimethyl silyl) propyloxy]
benzophenone.124
3.2. Synthesis of alkylacrylamide copolymers
The series of alkylacrylamides: acrylamide (AAm), methyl acrylamide (MAAm),
ethylacrylamide (EAAm), dimethyl acrylamide (DMAAm), propyl acrylamide (PAAm),
3.2. Synthesis of alkylacrylamide copolymers
32
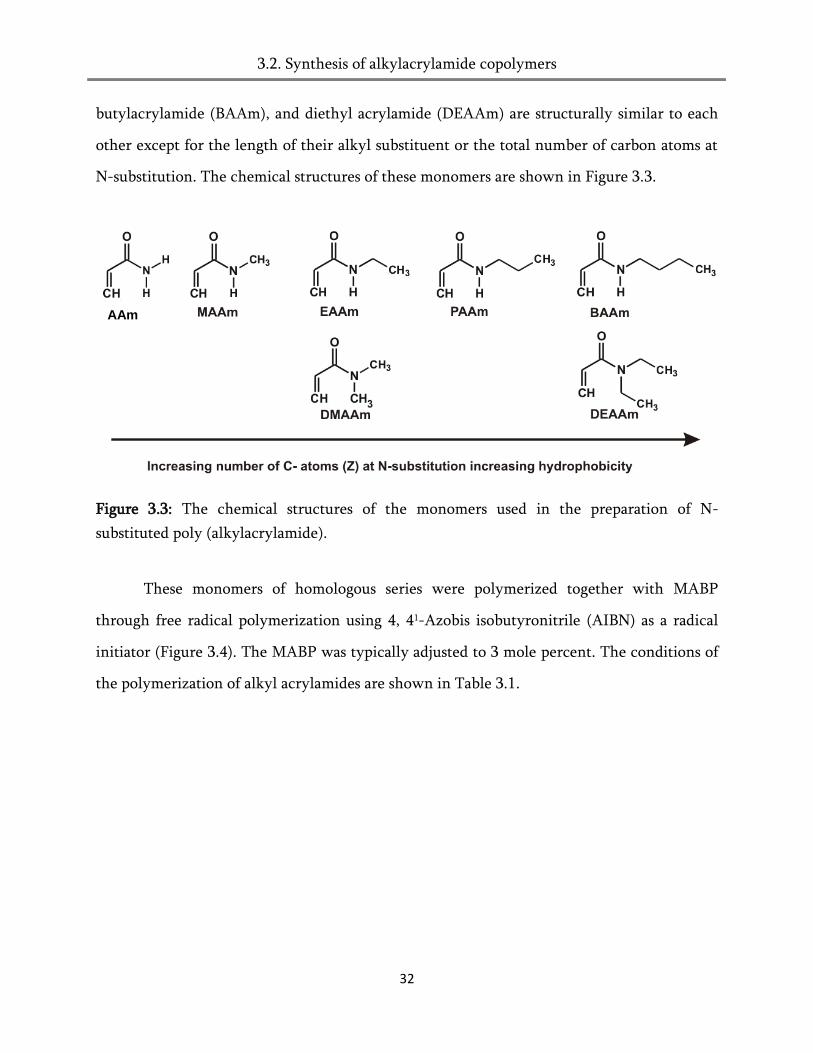
butylacrylamide (BAAm), and diethyl acrylamide (DEAAm) are structurally similar to each
other except for the length of their alkyl substituent or the total number of carbon atoms at
N-substitution. The chemical structures of these monomers are shown in Figure 3.3.
Figure 3.3: The chemical structures of the monomers used in the preparation of N-
substituted poly (alkylacrylamide).
These monomers of homologous series were polymerized together with MABP
through free radical polymerization using 4, 41-Azobis isobutyronitrile (AIBN) as a radical
initiator (Figure 3.4). The MABP was typically adjusted to 3 mole percent. The conditions of
the polymerization of alkyl acrylamides are shown in Table 3.1.
AAm

3.2. Synthesis of alkylacrylamide copolymers
33
PAAm (Z) Z = 1 Z = 2a Z = 2b Z = 3 Z = 4a Z = 4b
R1 Methyl Ethyl Methyl Propyl Ethyl Butyl
R2 H H Methyl H Ethyl H
Figure 3.4: The reaction scheme of the synthesis of poly (alkylacrylamides). Where, Z is the
combined number of carbon atoms at N-substitution or the length of the alkyl chains at N-
substitution.
Table 3.1: Summary of the polymerization conditions used to prepare polymers.
Polymer Monomer *Cross
linker
Initiator Solvent for
Polymerization
Solvent for
Precipitation
P(MAAm-co-MABP) MAAm MABP AIBN Methanol Diethyl ether
P(EAAm-co-MABP) EAAm MABP AIBN Methanol Diethyl ether
P(PAAm-co-MABP) PAAm MABP AIBN Methanol Diethyl ether
P(BAAm-co-MABP) BAAm MABP AIBN THF water
P(DMAAm-co-MABP) DMAAm MABP AIBN Methanol Diethyl ether
P(DEAAm-co-MABP) DEAAm MABP AIBN THF n-Hexane
*With 3 mole percent of MABP.
3.2. Synthesis of alkylacrylamide copolymers
34
The copolymerization of AAm‟s with the higher content of MABP may leads to the
poor polymerization (also poor yield) and therefore the MABP content is kept relatively low
between 2-3 mole percent. In addition, higher amount of MABP (> 2.5 %) increases the
hydrophobicity and lowers the solubility of the respective copolymer.125-126 The spectroscopic
details of the synthesized copolymers are presented in the experimental section of the thesis
along with the synthetic procedures.
In an effort to fine-tune the hydrophilicity of the polymer, a number of tri-
copolymers were made from a mixture of a hydrophilic and a hydrophobic alkylacrylamides
along with MABP were synthesized. The two hydrophilic monomers EAAm and DMAAm,
and the two hydrophobic monomers BAAm and DEAAm were selected from the
homologous series (Figure 3.5). The hydrophobic and hydrophilic monomers were mixed in
the ratio of 75:25, 50:50, and 25:75 as shown in the Table 3.2. The detailed synthetic
procedure and spectroscopic details of the tri-copolymers can be found in the experimental
section of the thesis Table 10.3. The monomers that are employed in the synthesis of tri-
copolymers have the reactivity ratio closer to each other e.g. DMAAm r = 0.86 and DEAAm r
= 1.15.7 As outlined previously, the propagation step is depends on the reactivity (r ≈
DMAAm ≈ DEAAm ≈ 1±0.15) and structural properties of the monomers used in the
copolymerization
3.2. Synthesis of alkylacrylamide copolymers
35
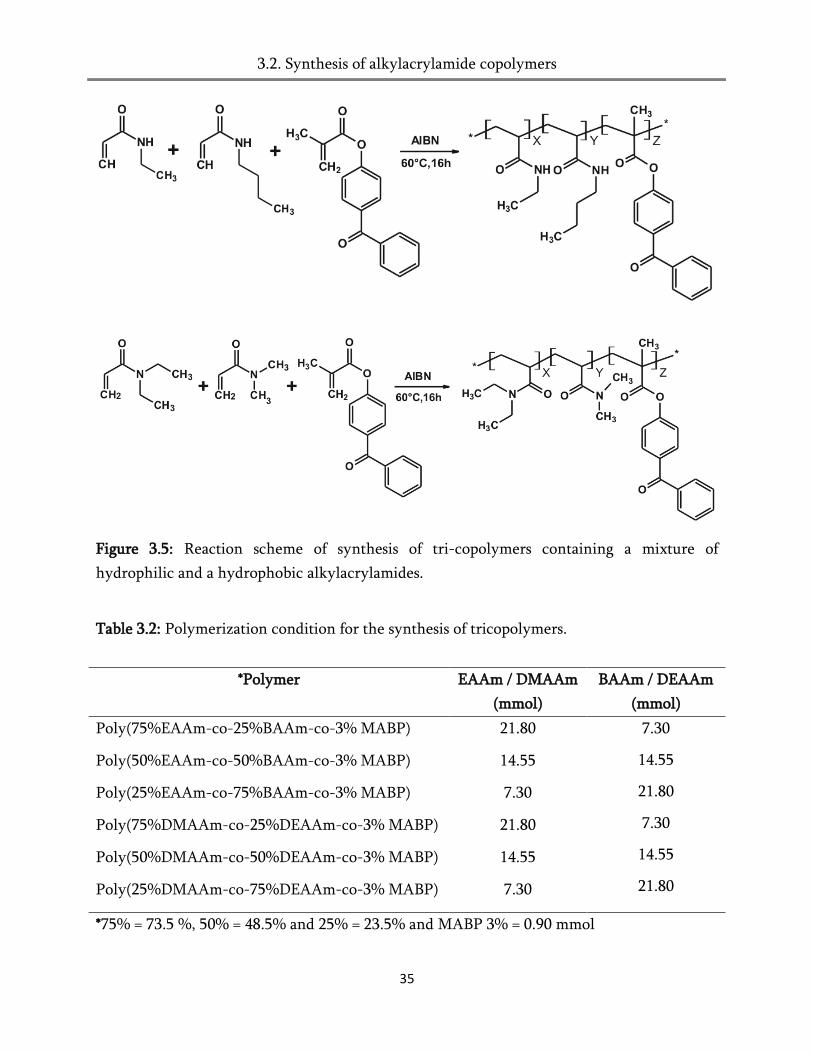
Figure 3.5: Reaction scheme of synthesis of tri-copolymers containing a mixture of
hydrophilic and a hydrophobic alkylacrylamides.
Table 3.2: Polymerization condition for the synthesis of tricopolymers.
*Polymer EAAm / DMAAm
(mmol)
BAAm / DEAAm
(mmol)
Poly(75%EAAm-co-25%BAAm-co-3% MABP) 21.80 7.30
14.55
21.80
7.30
14.55
21.80
Poly(50%EAAm-co-50%BAAm-co-3% MABP) 14.55
Poly(25%EAAm-co-75%BAAm-co-3% MABP) 7.30
Poly(75%DMAAm-co-25%DEAAm-co-3% MABP) 21.80
Poly(50%DMAAm-co-50%DEAAm-co-3% MABP) 14.55
Poly(25%DMAAm-co-75%DEAAm-co-3% MABP) 7.30
*75% = 73.5 %, 50% = 48.5% and 25% = 23.5% and MABP 3% = 0.90 mmol
3.3. Surface-attached networks
36
3.3. Surface-attached networks
Polymer networks are macromolecular systems in which all polymer chains are
interconnected with each other, which make them insoluble in solvents.127 One of the
widely employed methods is to use a crosslinker, which upon irradiation119 or heating leads
to the generation of networks.128 It is also essential to have stable coatings to the surfaces that
are applicable in medicine, especially when they are in contact with blood flow (e.g.,
ventricular assist devices). Hence, one plausible way to generate such coatings is to tailor
them through covalent binding.117 In this study, the photoactive MABP was used as a
crosslinker to prepare networks and for the covalent attachment to the surface.129-132
Accordingly, all the monomers that are shown in Figure 3.3 were copolymerized with 2-3
mole percent of MABP in order to achieve the sufficient crosslinking. It was demonstrated
that even a 2.5 mole percent of MABP was ample to achieve efficient crosslinking, which led
to the formation of stable surface-attached networks.129
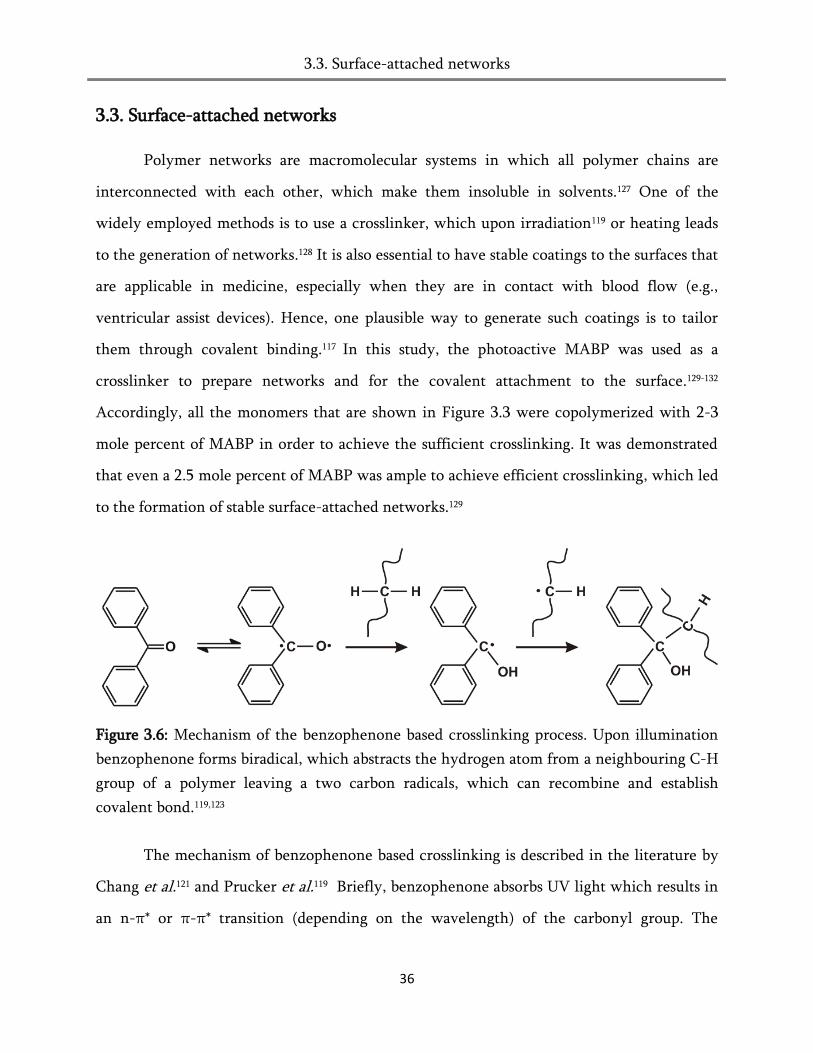
Figure 3.6: Mechanism of the benzophenone based crosslinking process. Upon illumination
benzophenone forms biradical, which abstracts the hydrogen atom from a neighbouring C-H
group of a polymer leaving a two carbon radicals, which can recombine and establish
covalent bond.119,123
The mechanism of benzophenone based crosslinking is described in the literature by
Chang et al.121 and Prucker et al.119 Briefly, benzophenone absorbs UV light which results in
an n-π* or π-π* transition (depending on the wavelength) of the carbonyl group. The
3.3.1. Preparation of surface-attached poly(alkylacrylamide) networks
37
resulting biradicaloid triplet abstracts a hydrogen atom from a neighboring C-H group,
leaving behind two carbon-based radicals, which upon recombination generate a covalent
bond between the two involved molecules. When the recombination occurs with a surface-
group, surface attachment results and when the reaction occurs with another polymer chain,
the two chains become covalently linked to each other (Figure 3.6). Similarly, several groups
on a polymer chain reacts in this fashion and such a process leads to the crosslinking of
surface coating.119
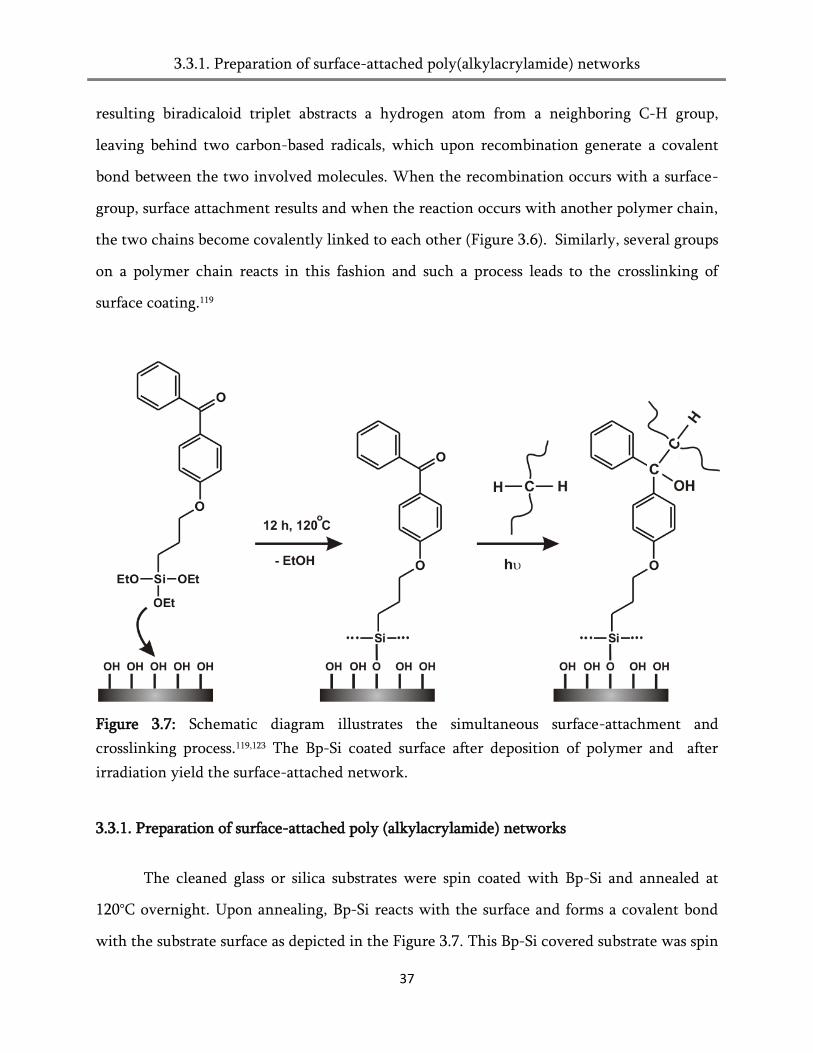
Figure 3.7: Schematic diagram illustrates the simultaneous surface-attachment and
crosslinking process.119,123 The Bp-Si coated surface after deposition of polymer and after
irradiation yield the surface-attached network.
3.3.1. Preparation of surface-attached poly (alkylacrylamide) networks
The cleaned glass or silica substrates were spin coated with Bp-Si and annealed at
120°C overnight. Upon annealing, Bp-Si reacts with the surface and forms a covalent bond
with the substrate surface as depicted in the Figure 3.7. This Bp-Si covered substrate was spin

3.3.1. Preparation of surface-attached poly (alkylacrylamide) networks
38
coated with poly (alklyacrylamide-co-MABP) solution and after evaporation of the solvent;
the layers were illuminated with a total dosage of 4 J/cm2 from a UV-C-light source (254
nm). Upon irradiation, the benzophenone present in the precursor polymer formed a bi-
radical, abstracting the neighboring protons; thereby leading to simultaneous crosslinking
and surface attachment of the deposited polymer film.119 The uncrosslinked polymer
molecules were removed by solvent extraction. The condition that was employed in the
process of making networks for different polymers of the homologous series is summarized
in Table 3.3.
As mentioned in Table 3.3, polymers with shorter alkyl substituent such as PMAAm,
PEAAm and PDMAAm were found to have high solubility in methanol or ethanol. Polymers
such as PPAAm, PBAAm and PDEAAm were well soluble in propanol / isopropanol and
butanol. The used condition was sufficient to generate homogenous network and the film
thickness was controlled by the concentration of the polymer solution used (e.g. 10 mg/ml
and the film thickness was found to be between 70-90 nm) for the spin coatings.
Table 3.3: Conditions for preparation of surface-attached poly (alkylacrylamide) networks.
Polymer Solvent Concentration (mg/ml) Speed (rpm) Time (s)
P(MAAm-co-MABP) Ethanol 10 2500 60
P(EAAm-co-MABP) Ethanol 10 2500 60
P(PAAm-co-MABP) Butanol 10 2500 60
P(BAAm-co-MABP) Butanol 10 2500 60
P(DMAAm-co-MABP) Ethanol 10 2500 60
P(DEAAm-co-MABP) Ethanol 10 2500 60
3.3.2. Gel fraction of the poly (alkylacrylamide) networks
39
3.3.2. Gel fraction of the poly (alkylacrylamide) networks
As it was mentioned in the previous section, MABP showed absorptions at 365 nm
and 254 nm due to the carbonyl group of benzophenone. Schuh128, Bunte132 and Chang124
have extensively studied the kinetics of the photochemical crosslinking of MABP containing
polymers. They found that the rate of benzophenone crosslinking process followed the first
order reaction kinetics.124,132 The crosslinking was faster at 254 nm (UV-C light) than at 360
nm (UV-A light) due to the higher extinction coefficient of the π-π* than the n-π* transition
in the carbonyl functionality.132 Based on their results the films generated in this study
irradiated with UV-C light at 254 nm for four minutes. The films were then rigorously
extracted in solvent and the thickness before and after the extraction (gel content) were
compared to evaluate the conversion. The calculated gel contents are shown in Table 3.4.
Table 3.4: Gel fraction of the surface-attached poly (alkylacrylamide) networks.
Polymer Thickness before
crosslinking (nm)
Thickness after
crosslinking (nm)
Gel content
(%)
P(MAAm-co-MABP) 82 75 91
P(EAAm-co-MABP) 86 77 90
P(DMAAm-co-MABP) 72 68 95
P(DEAAm-co-MABP) 95 82 86
P(PAAm-co-MABP) 67 65 97
P(BAAm-co-MABP) 61 58 95
The calculated gel fractions demonstrate that the irradiation conditions were
sufficient to achieve high gel contents. Even, after 30 seconds of irradiation a gel content of
around 60% was found, which increased to 80% after 60 seconds of irradiation. A maximum
gel content of 90% was typically reached after four minutes. Further illumination of UV light
damages the film as demonstrated by Bunte et al.132 Thus, the deposited polymer layers were
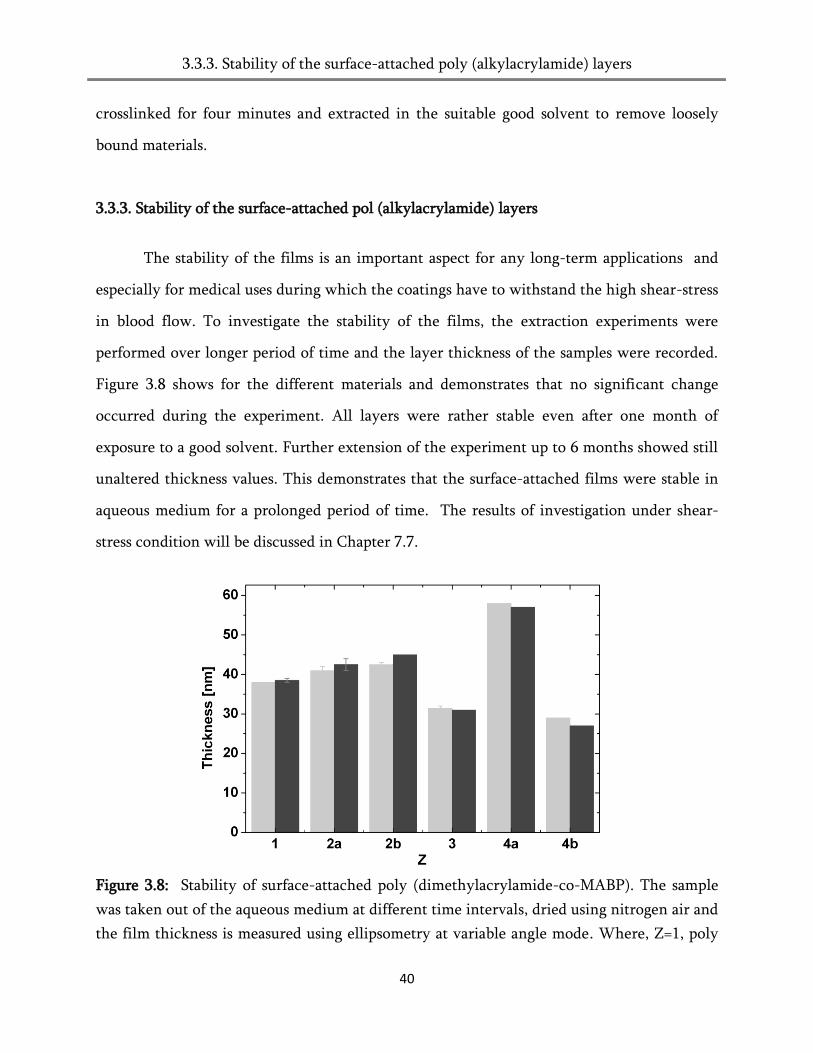
3.3.3. Stability of the surface-attached poly (alkylacrylamide) layers
40
crosslinked for four minutes and extracted in the suitable good solvent to remove loosely
bound materials.
3.3.3. Stability of the surface-attached pol (alkylacrylamide) layers
The stability of the films is an important aspect for any long-term applications and
especially for medical uses during which the coatings have to withstand the high shear-stress
in blood flow. To investigate the stability of the films, the extraction experiments were
performed over longer period of time and the layer thickness of the samples were recorded.
Figure 3.8 shows for the different materials and demonstrates that no significant change
occurred during the experiment. All layers were rather stable even after one month of
exposure to a good solvent. Further extension of the experiment up to 6 months showed still
unaltered thickness values. This demonstrates that the surface-attached films were stable in
aqueous medium for a prolonged period of time. The results of investigation under shear-
stress condition will be discussed in Chapter 7.7.
Figure 3.8: Stability of surface-attached poly (dimethylacrylamide-co-MABP). The sample
was taken out of the aqueous medium at different time intervals, dried using nitrogen air and
the film thickness is measured using ellipsometry at variable angle mode. Where, Z=1, poly
3.4. Contact angle and Topography
41
(MAAm-co-MABP); Z= 2a, poly (EAAm-co-MABP), Z=2b, poly (DMAAm-co-MABP); Z= 3,
poly (PAAm-co-MABP); Z=4a, poly (BAAm-co-MABP), Z=4b, poly (DEAAm-co-MABP).
Light gray indicates the original film thickness and dark gray indicates the thickness after a
month.
3.4. Contact angle and Topography
In medical applications, an implantable biomaterial interacts with the surrounding
tissue (cells) critically through their interfaces. Such interactions largely depend on the
surface properties of the materials such as wettability, topography or roughness and charge
distribution on the surface.132 Understanding this phenomenon is crucial to the
comprehension of several fundamental queries related to protein-material (also cell-
materials) interaction for the development of biomaterials in the field of medicine.
Consequently, in this work, surface properties such as wettability and topography of the
surface-attached poly (alkylacrylamides) networks are investigated using contact angle
measurements and atomic force microscope, respectively.
3.4.1. Contact angle measurements
The wettability of the surface-attached poly (alklyacrylamide) networks was
characterized by contact angle measurements. Static contact angles were measured using the
sessile drop method though an Optical Contact Angle Meter (OCA 20) setup (Dataphysics,
Filderstadt, Germany), with a liquid dispenser and an image processing program which
provided an automatic determination of the contact angles. Two samples of each surface type
were measured at different points of the same sample and the average value was taken into
account as the static contact angle. All the measurements were performed at ambient
temperature and at 37°C using Milli-Q water. 1µl volume of water was dispersed onto the
surface at the rate of 0.5µl/s and contact angles were measured.

3.4. Contact angle and Topography
42
Figure 3.9 shows the static water contact angles values obtained on the various poly
(alkylacrylamide) coatings. As a reference, medical grade polyurethane was also used. It is
evident from the graph that most of these gels are moderately wettable surfaces having a
contact angle from 55-75°. The coatings made from poly (PAAm-co-3%MABP) and poly
(BAAm-co-3%MABP) are very hydrophobic with a advancing contact angle of 90-92°. The
important factor determining water wettability is the chemical structure of the polymeric
network at the interface.
Consequently, the water contact angles increases with length of the alkyl chain at N-
substitution or combined number of carbon atoms at N-substitution. However, the
differences between the coatings made from 4a (BAAm) and 4b (DEAAm) indicate that
further factors may also important. The longer butyl substituent of 4a may segregate to the
surface more efficiently than the two ethyl substituent of 4b. This might explain the
outstanding hydrophobic nature of the material of the series.
Figure 3.9: The water contact angles as a function of the combined number of carbon atoms
(Z). Where, Z=1, poly (MAAm-co-MABP); Z= 2a, poly (EAAm-co-MABP), Z=2b, poly
(DMAAm-co-MABP); Z= 3, poly (PAAm-co-MABP); Z=4a, poly (BAAm-co-MABP), Z=4b,
poly (DEAAm-co-MABP) and PU is polyurethane.

3.4. Contact angle and Topography
43
3.4.2. Topography
The topography or roughness may also influence the interaction of surface with
biomolecules. In this work, AFM (Nanoscope IIIa, Digital Instrument) was used to examine
the topography of the surface-attached alkylacrylamide coatings on silica substrate (see
section 3.3.1 of this chapter). The microscope was operated in tapping mode, using
commercial tips with a resonance frequency of ≈330kHz, and a spring constant of ≈42 N/m.
The AFM micrographs were recorded in air at room temperature.134
Table 3.5: Thickness and roughness of the surface-attached poly (alkylacrylamides).
Polymer Thickness (d) Roughness (Ra)
P(MAAm-co-MABP) 49 nm 0.5 nm
P(EAAm-co-MABP) 38 nm 6 nm*
P(PAAm-co-MABP) 60 nm 0.98 (≈1 nm)
P(BAAm-co-MABP) 59 nm 0.78 nm (≈1 nm)
P(DMAAm-co-MaABP) 42 nm 1.4 nm
P(DEAAm-co-MABP) 41 nm 1.68 (≈2 nm)
†PU --† 27 nm
*Sample quality was bad, †reference samples (medical grade polyurethane used in VAD)
The AFM results of surface-attached poly (alkylacrylamide-co-MABP) networks are
shown in Table 3.5. The thickness of the deposited films ranged from 40 nm to 60nm and the
roughness of the films was found always less than 2 nm, which indicates that there was no
significant difference in the topography among the homologous series (AFM micrographs are
presented in the appendix). In addition, the results of the poly (alkylacrylamides) were
----------------------------------
AFM experiments were performed by Mr. Xiaoqiang Hou, CPI-IMTEK, University of Freiburg, Germany.
3.5. Conclusion
44
compared with that of the reference polyurethane (medical grade polyurethane) used in
ventricular assist devices, showing that it is rougher (around 27 nm) than the homologous
series being investigated in this study.
3.5. Conclusion
A series of alkylacrylamide copolymers containing 2-3 % of photo crosslinker
(MABP) were successfully synthesized through a free radical polymerization. These
polymers were then deposited onto substrates and irradiated using UV-C-light (λ = 254 nm
or 4 J/cm2) for four minutes. This led to a simultaneous crosslinking and surface-attachment
of the films. The stability of the layers in water was investigated and it was found that these
layers were stable under these conditions for a prolonged period of time. Finally, water
contact angle experiments reveal that all alkylacrylamide coatings showed a moderate
wettability between 50-75°. Interestingly, BAAm was more hydrophobic with a contact
angle of 112° because the longer butyl substituent was segregated more efficiently than other
alkyl substituent of the homologous series. The roughnesses of the poly (alkylacrylamide)
coatings were examined using AFM and it was found that all coatings were rather small.
4.1.Theory of swelling
45
4. Swelling of the surface-attached poly (alkylacrylamide) networks
One of the most important properties of the hydrogels is their swelling behavior in
appropriate solvent.135 Several theoretical models were proposed to describe the swelling of
hydrogels. This chapter is organized in the following way; Firstly, it provides the background
of isotropic and anisotropic swelling of the polymeric coatings followed by a descripsion of
Surface Plasmon Resonance spectroscopy (SPR). SPR was used to measure the swelling of the
surface-attached poly (alkylacrylamide) networks in water and in humid air and the lastly
the results of these measurements were described and discussed. Finally, the swelling in
water and in humid air compared.
4.1. Theory of swelling
4.1.1. Isotropic swelling
Flory and Rehner developed a model to explain the swelling behavior of cross-linked
networks or hydrogels.136 A crosslinked polymer gel whilst immersed in water is allowed to
reach equilibrium with its surrounding is governed by two opposing forces: the
thermodynamic force of mixing, and the retractive force of polymer chains.
∆𝐺𝑡𝑜𝑡𝑎𝑙 = ∆𝐺𝑚𝑖𝑥𝑖𝑛𝑔 + ∆𝐺𝑒𝑙𝑎𝑠𝑡𝑖𝑐 (Eq.4.1)
At equilibrium, these two forces are equal, therefore the Gibbs free energy is written
as follows137
∆𝐺𝑚𝑖𝑥𝑖𝑛𝑔 = − ∆𝐺𝑒𝑙𝑎𝑠𝑡𝑖𝑐 (Eq.4.2)
Where ∆Gelastic is the contribution due to elastic retractive forces developed inside the
gel, and ∆Gmixing is the result of spontaneous mixing of water molecules with polymer
chains.125
∆𝐺𝑚𝑖𝑥𝑖𝑛𝑔 = 𝑘𝑇 𝑛1 ln𝜑1 + 𝜒 𝑛2𝜑2 (Eq.4.3)
4.1.1. Isotropic swelling
46
In the above equation 𝑛1 , is the ratio of solvent molecules, 𝜑1 is the volume fraction
of the solvent, 𝑛2 is ratio of the polymer repeat units, φ2 is the volume fraction of the
polymer, k is the Boltzmann constant and T is the temperature. χ represents the Flory-
Huggins interaction parameter.
The elastic free energy is represented purely by the entropic components. Therefore,
the expression for ∆Gelastic is equal to the change in the entropy, ∆Selastic due to the elastic
stretching of the polymer chains in the network and could be written as,
∆𝐺𝑒𝑙𝑎𝑠𝑡𝑖𝑐 = −𝑇∆𝑆𝑒𝑙𝑎𝑠𝑡𝑖𝑐 (Eq.4.4)
∆S𝑒𝑙𝑎𝑠𝑡𝑖𝑐 = − 𝑘𝜐
2 (3𝛼𝑠
2 − 3 − ln𝛼𝑠 3 ) (Eq.4.5)
Where k is the Boltzmann constant, T is the absolute temperature; υ is the number of
crosslinks in the network, and α is the elongation ratio, e.g. the linear deformation of the
network for isotropic stretching. Upon several rearrangements Eq.4.1-4.5 2-4, one obtains the
well known Flory-Rehner model:
ln 1 − φe + φe + χφe2 =
υ
Nav
V1
V0 φe
2 − φe
1/3 (Eq.4.6)
Here, the volume fraction of the polymer, φ2 is represented as, φe to emphasize the
equilibrium swelling and the prefactor on the right hand side of the equation, represents the
number of strands per unit volume in the original network. Now, the number of average
molecular weight between two adjacent crosslinks, Mc can be evaluated using the following
equation:138
𝑀𝑐 =2
𝑀𝑟−
𝜐
𝑉1 ln 1− 𝜑2 + 𝜑2+ 𝜒𝜑2
2
𝜑21/3
− 𝜑22
(Eq.4.7)
Where Mr is the molecular weight of the repeating unit and by using the Flory
polymer solvent interaction parameter, χ one can calculate the Mc. χ usually lies between 0
4.1.2. Anisotropic swelling
47
and 1. For a good solvent, χ is smaller than 0.5 whereas for a bad solvent it is greater than
0.5.139
4.1.2. Anisotropic swelling
When a hydrogel is attached to a surface, the chemical linkage of the network to the
surface prevents the swelling parallel to the substrate, effectively confining the volume
change to one dimension.122 This influences many important properties of the hydrogels such
as mechanical strength, dynamics and permeability of the network. Toomey et al. described
the differences in the swelling of unconstrained hydrogels and surface attached hydrogels
using Flory-Rehner model.136-137 Therefore, the free energy of mixing for anisotropic (one-
dimensional) swelling can be written as,
∆𝐺𝑚𝑖𝑥𝑖𝑛𝑔
𝑘𝑇 = 𝑛1 ln(1 − 𝜑2) + 𝜒 𝑛1𝜑2 (Eq.4.8)
Where k is the Boltzmann constant, T is the absolute temperature, n1 is the number
of solvent molecules, φ2 is the volume fraction of the polymer in swollen gel, and χ is the
Flory polymer-solvent interaction parameter. Moreover, the elastic free energy can written
as,
∆S𝑒𝑙𝑎𝑠𝑡𝑖𝑐
𝑘𝑇= 𝜐
𝑑
2 (𝛼𝑠
2 − 1 − ln𝛼𝑠 ) (Eq.4.9)
Here, υ is the number of cross-links in the network, and d is the number of
dimensions in which the network can swell. Therefore, the relationship between the linear
deformation at equilibrium and the degree of freedom of the network is given as,
𝛼 ≈ 1
(1
2 –𝜒)𝜑0𝑁𝑐
− 1
(𝑑+2)
(Eq.4.10)
4.1.2. Anisotropic swelling
48
The equation 4.10 reveals that the swelling is confined to fewer dimensions, α
depends strongly on the crosslink density (1/Nc). Here Nc is the number of segments
between two crosslinks. The volumetric swelling (S) is equal to the linear deformation α to
the power of the dimensions in which it can swell. The relation can be derived as follows
𝛼𝑢𝑐 ≈ 1
𝜑0𝑁𝑐 −
1
5 ; 𝑆𝑢𝑐 ≈
1
𝜑0𝑁𝑐 −
3
5 (Eq.4.11)
𝛼𝑠𝑎 ≈ 1
𝜑0𝑁𝑐 −
1
3 ; 𝑆𝑠𝑎 ≈
1
𝜑0𝑁𝑐 −
1
3 (Eq.4.12)
As mentioned earlier, surface attachment limits the swelling to one dimension. The
network experiences a higher osmotic pressure, which is partially relieved by further
stretching in its swelling direction perpendicular to the surface, thus leading to a higher
linear swelling than unconstrained network.
Therefore,
𝑆𝑠𝑎 = 𝑆𝑢𝑐 5/9
(Eq.4.13)
From the above equation, the volumetric degree of swelling in the surface-attached
network is approximately equal to the square root of the degree of swelling in the non-
attached network.122
4.2. Surface Plasmon resonance spectroscopy (SPR)
Surface Plasmon resonance spectroscopy is an optical method used for measuring
thickness and refractive indices of thin film on a metal surface.140 This technique is based on
the fact that at certain conditions, surface plasmon polaritons (i.e. propagating
electromagnetic waves at the interface of the metal dielectric layer) on a metallic film can be
excited at specific resonance frequency.141 The instrumentation and used configuration of the

4.2. Surface Plasmon resonance Spectroscopy (SPR)
49
SPR setup is given in chapter 10.2.8 of this thesis. There are two methods employed to excite
plasmons at the interface. They are the Kretschmann (Figure 4.1A) and Otto
configuration.142-143 The Kretschmann configuration is the most widely used geometry in SPR
and the following discusses briefly about the principle of this configuration.
The Kretschmann configuration143 is an extensively used geometry in many SPR
instruments. It excites the surface plasmon based on attenuated total reflection (ATR). Here,
a beam of p-polarized light (transversal magnetic, TM) is reflected from gold (approx. 50 nm)
through a prism or glass and the front side is in contact with air or solution (Figure 4.1A). If
the angular scans of reflectivity is measured (Figure 4.1B), when a incident angle (θ) is
greater than critical angle (θc) i.e. θ > θc, most of the incoming light is reflected, while a
small part of the light penetrates outside of the glass, which is called as the evanescent wave.
The surface plasmons are observed as a minimum in the reflectivity at the angle of θsp. The
critical angle (θc) is the critical angle at which the total internal reflection begins to occur.
By using such surface plassmon spectrum one can determine the optical components of the
dielectric layer (in this case polymer film) with the help of Fresnel formalism.144
If the thickness of the dielectric layer (e.g. polymer film) is larger than 300 nm,
optical waveguide modes are observed in addition to the surface plasmon resonance.147
Usually these waveguides are observed as a narrow dips measured at p-(TM) and s-(TE)
polarizations and the number of modes that are excited is purely depends on the film
thickness. The typical optical waveguide spectrum (OWS) is shown in Figure 4.2. By
simulating these waveguide spectra using Fresnel equation one can derive the film thickness
and refractive index of the dielectric layer.148
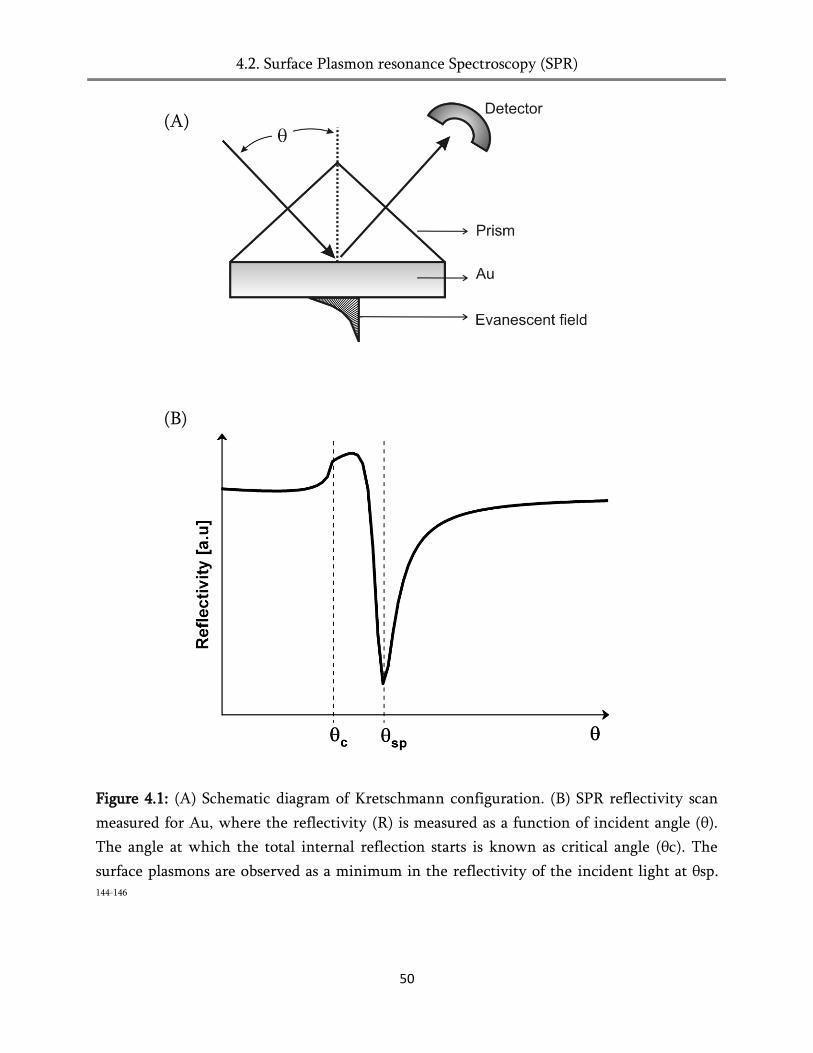
4.2. Surface Plasmon resonance Spectroscopy (SPR)
50
Figure 4.1: (A) Schematic diagram of Kretschmann configuration. (B) SPR reflectivity scan
measured for Au, where the reflectivity (R) is measured as a function of incident angle (θ).
The angle at which the total internal reflection starts is known as critical angle (θc). The
surface plasmons are observed as a minimum in the reflectivity of the incident light at θsp. 144-146
(B)
(A)
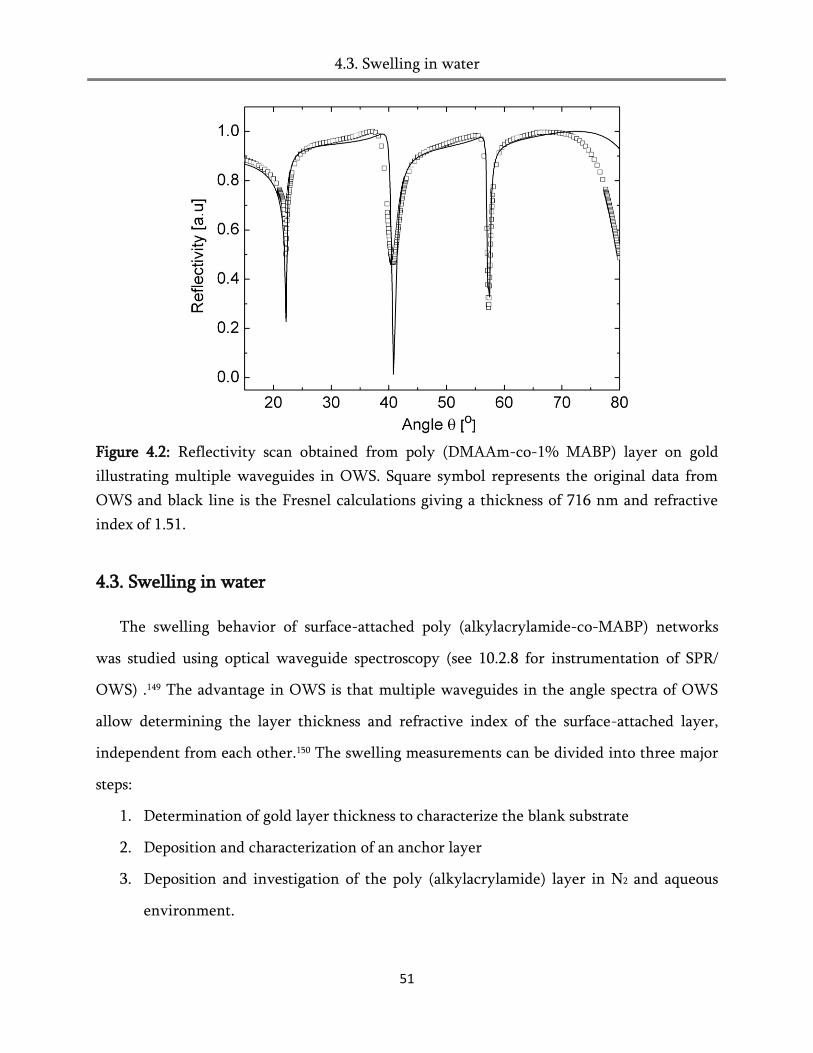
4.3. Swelling in water
51
Figure 4.2: Reflectivity scan obtained from poly (DMAAm-co-1% MABP) layer on gold
illustrating multiple waveguides in OWS. Square symbol represents the original data from
OWS and black line is the Fresnel calculations giving a thickness of 716 nm and refractive
index of 1.51.
4.3. Swelling in water
The swelling behavior of surface-attached poly (alkylacrylamide-co-MABP) networks
was studied using optical waveguide spectroscopy (see 10.2.8 for instrumentation of SPR/
OWS) .149 The advantage in OWS is that multiple waveguides in the angle spectra of OWS
allow determining the layer thickness and refractive index of the surface-attached layer,
independent from each other.150 The swelling measurements can be divided into three major
steps:
1. Determination of gold layer thickness to characterize the blank substrate
2. Deposition and characterization of an anchor layer
3. Deposition and investigation of the poly (alkylacrylamide) layer in N2 and aqueous
environment.
4.3. Swelling in water
52
Determination of Gold layer thickness
A LaSFN9 glass slides were used to which 1-3 nm of chromium was evaporated. This
layer serves as an adhesion layer for a 50 nm gold layer, which was also deposited through
evaporation.145 These slides are standard substrates for SPR and OWS and are reusable for a
minimum of three to four times. The optical properties of the gold layer were measured
using SPR in a nitrogen atmosphere. Typical resonance angle for this setup was found around
25°.The film thickness and refractive indices were computed according to Knoll et al.145 using
the software Winspall 3.1.0, which is based on Fresnel formalism. Typical gold layer
thickness of 50-51 nm were detected and (Figure 4.3 and Table 4.1).
Deposition and characterization of an anchor layer
A film of a water insoluble polymer such as polyurethane or polystyrene was
deposited to serve as an anchor layer to which the poly (alkylacrylamide) layers are later
linked. Typically, 10-15 nm of film were dip-coated on top of the gold (Table 4.1). Then the
polymer with photo crosslinker (MABP) deposited crosslinked and anchored to the
underlying polymer coated substrates as described in Chapter 3.
Investigation of the surface-attached poly (alkylacrylamide) layers
Finally, the thickness of the deposited films or surface-attached networks was
measured in nitrogen and water to determine the swelling. Figures 4.4 and 4.5 depict the
reflectivity scans of surface-attached poly (DMAAm-co-3%MABP), poly (DEAAm-co-
3%MABP) and poly (BAAm-co-3%MABP), respectively. The calculated film thickness (d)
and the refractive index (n) of the polymer films are shown in Table 4.2. These two are
selectively shown to represent the hydrophilic and hydrophobic polymers of the homologous

4.3. Swelling in water
53
series. The reflectivity scans of other surface-attached networks are given in appendix of the
thesis (See Figures 11.1-11.4).
Figure 4.3: Reflectivity scan of a gold substrate before and after deposition of PU layer.
Where, the reflectivity is recorded as a function of angle of incident (θ). The minimum in the
reflectivity indicates the excitation of a surface plasmon. The solid lines are Fresnel
calculations both the samples. The calculated optical components are summarized in Table
4.1.
Table 4.1: Optical components obtained from SPR measurements of gold and PU.
Material *Film thickness,
d (nm)
Permeability constant
(real), 1
Permeability constant
(imaginary), 11
Glass 0 3.4036 0
Chromium 1.12 -6.3 18
Gold 50.91 -12.25 1.29
PU 13.7 2.2712 0
N2 0 1 0
*All the measurements were performed at room temperature (≈25°C) in N2 atm.

4.3. Swelling in water
54
Table 4.2: Optical components derived from the reflectivity scans of poly (DMAAm-co-
3%MABP) and poly (BAAm-co-3%MABP) networks using a Fresnel formalism.
Medium Poly (DMAAm-co-3%MABP) Poly (BAAm-co-3%MABP)
d (nm) N *SF d (nm) n *SF
N2 334 1.52 3.50 411 1.49 1.18
H2O 1169 1.41 485 1.47
*Swelling factor, d is the film thickness and n is the refractive index.
Figure 4.4: Reflectivity scan of poly (DMAAm-co-3%MABP) abbreviated as PDMAAm.
Squares and circles symbol represent the measurement in N2 and in water, respectively. Solid
lines are the results of Fresnel calculations used to describe the measured data and to derive
the layer thickness and refractive index.
The optical components of the film were obtained by modelling the spectra using a
Fresnel equation.151 As noticed in the Figures 4.4 and 4.5, there are significant differences
between the measurement in nitrogen atmosphere and in water. For example, in nitrogen
atmosphere, one waveguide was observed for poly (DMAAm-co-3% MABP).
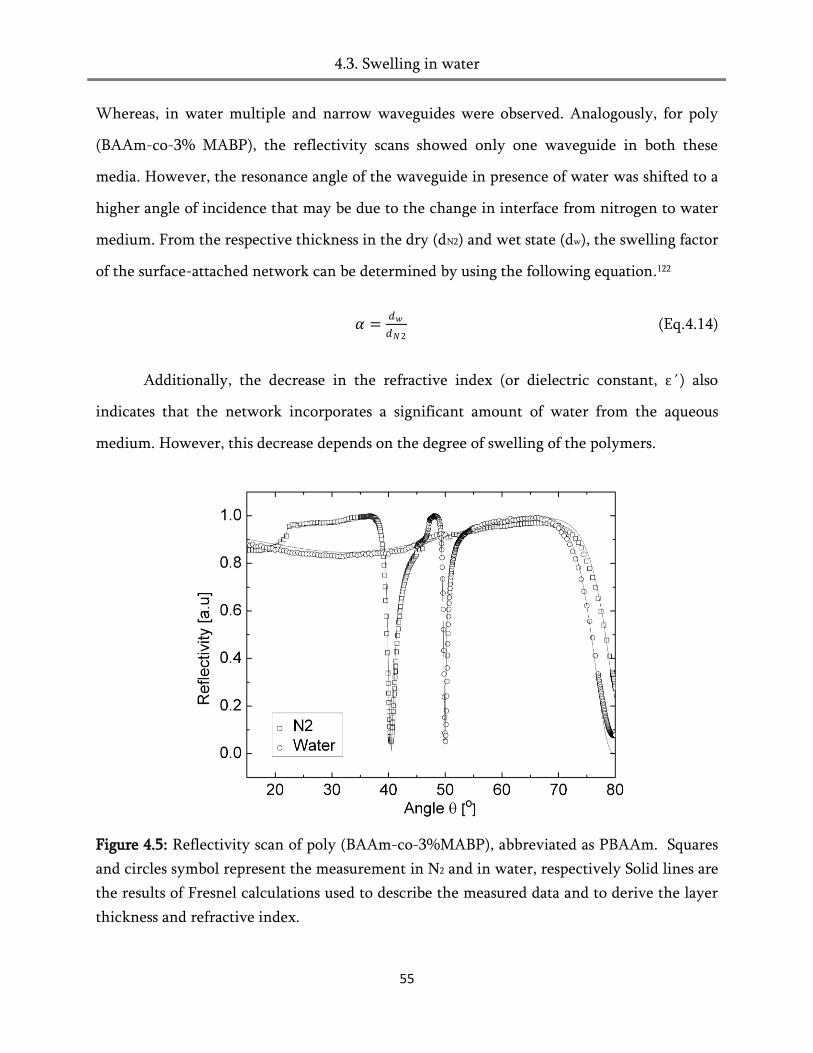
4.3. Swelling in water
55
Whereas, in water multiple and narrow waveguides were observed. Analogously, for poly
(BAAm-co-3% MABP), the reflectivity scans showed only one waveguide in both these
media. However, the resonance angle of the waveguide in presence of water was shifted to a
higher angle of incidence that may be due to the change in interface from nitrogen to water
medium. From the respective thickness in the dry (dN2) and wet state (dw), the swelling factor
of the surface-attached network can be determined by using the following equation.122
𝛼 =𝑑𝑤
𝑑𝑁2 (Eq.4.14)
Additionally, the decrease in the refractive index (or dielectric constant, ε´) also
indicates that the network incorporates a significant amount of water from the aqueous
medium. However, this decrease depends on the degree of swelling of the polymers.
Figure 4.5: Reflectivity scan of poly (BAAm-co-3%MABP), abbreviated as PBAAm. Squares
and circles symbol represent the measurement in N2 and in water, respectively Solid lines are
the results of Fresnel calculations used to describe the measured data and to derive the layer
thickness and refractive index.
4.3. Swelling in water
56
Figure 4.6 illustrates the results obtained from surface-attached poly (alkyl
acrylamide) layers. The linear swelling ratio (α) is plotted as a function of the length of the
alkyl substituent in the acrylamides. The results demonstrate that the polymers with shorter
alkyl substituent, PMAAm, PEAAm and PDMAAm, i.e. a combined number of carbon atoms
at N-substitution of one or two (Z = 1, 2a and 2b), swell to the factor of three to five
(PMAAm = 5.32, PEAAm = 4.6 and PDMAAm = 3.5). In contrast, the polymers with longer
alkyl substituent, PPAAm and PBAAm do not swell appreciably in water.
The volume fractions of polymer (φ2) and solvent (φ1) in the network can be derived
from the swelling factor α by using equations 4.15 and 4.16, respectively.
𝜑2 =1
𝛼=
𝑑𝑑𝑟𝑦
𝑑𝑤𝑒𝑡 (Eq.4.15)
𝜑1 = 1 −1
𝛼 = 1 − 𝜑2 (Eq.4.16)
Figure 4.7 shows the calculated volume fraction of the polymer and water of the
swollen network at room temperature (25°C) and physiological temperature (37°C). The
results show that the volume fraction of water in the swollen network, decreases as we go
along the homologous series from methyl (0.80) to butyl (0.20) and the volume fraction of
polymer increases accordingly in that direction. This means, that polymers with a lower
number of carbon units at N-substitution or shorter alkyl chains at N-substitution can retain
more water in the swollen state due to strong interaction or coordination with water
molecules and vice-versa.
The difference in the swelling behavior of the poly (alkylacrylamides) is a clear
consequence of the increasing hydrophobicity with increasing number of carbon atoms on
the alkyl substituent or with the number of alkyl groups present. When the N-alkyl-
substituted group is longer than an ethyl, attractive inter- segment interactions i.e.
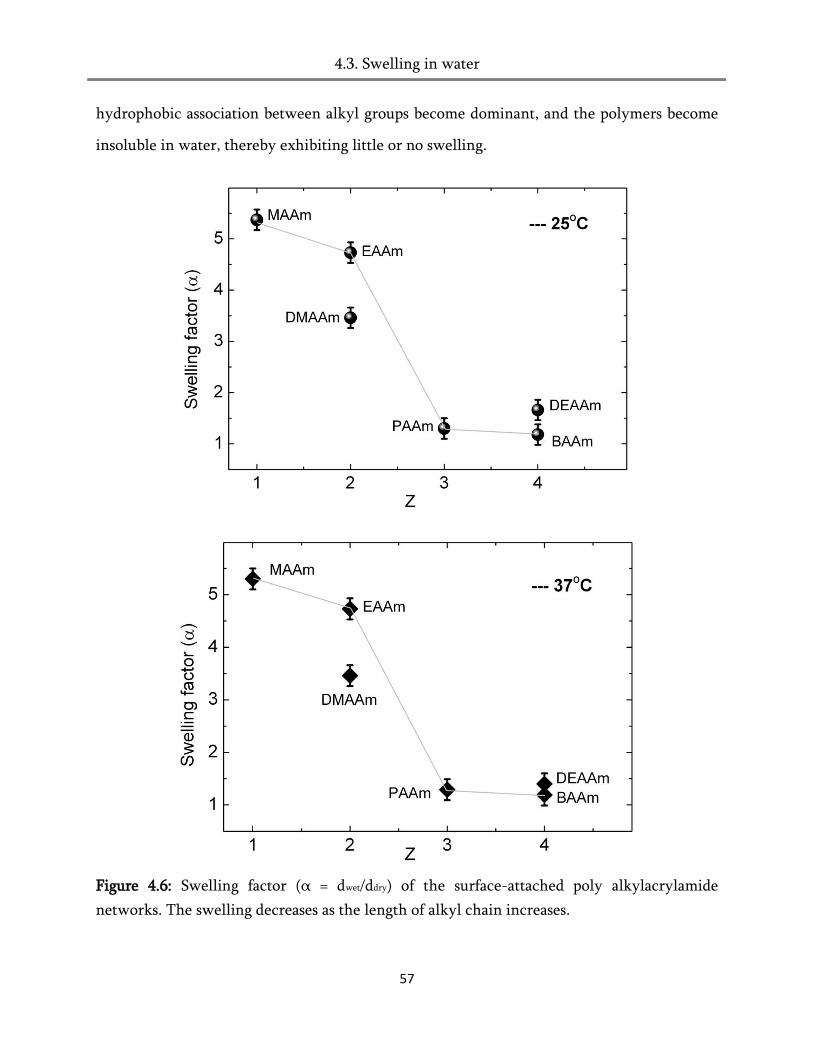
4.3. Swelling in water
57
hydrophobic association between alkyl groups become dominant, and the polymers become
insoluble in water, thereby exhibiting little or no swelling.
Figure 4.6: Swelling factor (α = dwet/ddry) of the surface-attached poly alkylacrylamide
networks. The swelling decreases as the length of alkyl chain increases.
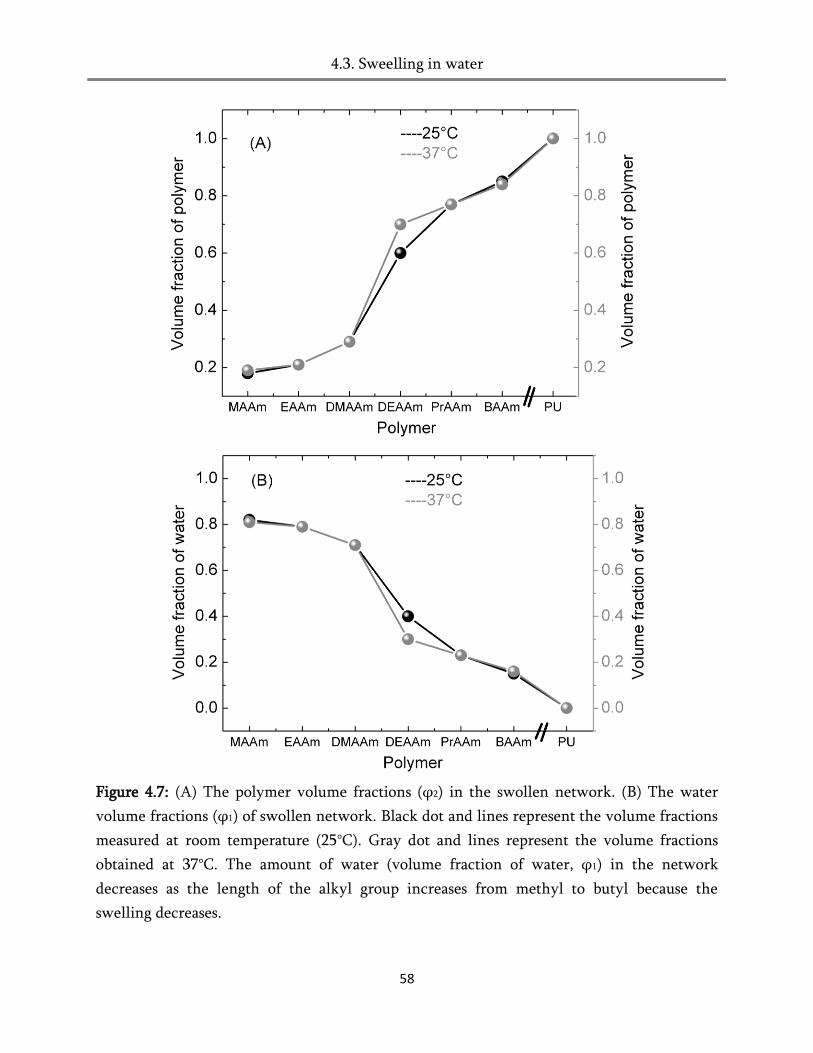
4.3. Sweelling in water
58
Figure 4.7: (A) The polymer volume fractions (φ2) in the swollen network. (B) The water
volume fractions (φ1) of swollen network. Black dot and lines represent the volume fractions
measured at room temperature (25°C). Gray dot and lines represent the volume fractions
obtained at 37°C. The amount of water (volume fraction of water, φ1) in the network
decreases as the length of the alkyl group increases from methyl to butyl because the
swelling decreases.

4.3. Sweelling in water
59
Another interesting aspect is the difference in the swelling of mono-substituted
alkylacrylamides and di-substituted alkylacrylamides. PEAAm and PDMAAm have an equal
number of carbon atoms at N-substitution. The swelling of PEAAm was found to be ≈4.6, but
the swelling of PDMAAm was 3.35, because, in PEAAm both NH and C=O can participate in
the hydrogen bonding. This is not possible for PDMAAm and therefore binds less water than
PEAAm.
In addition, the swelling of the surface-attached poly (alkylacrylamide) networks
were measured at various temperature ranged from 15-55°C. The results are shown in Figure
4.8. Among the homologous series of poly (alkylacrylamides), PDEAAm showed a significant
difference in the swelling behavior with respect to the temperature than other polymers of
the series.
Figure 4.8: Swelling factor (α = dwet/ddry) of the surface-attached poly (alkylacrylamide)
networks as a function of temperature (15°C to 50°C). Figure A and B demonstrate that
swelling with respect to temperature remains more or less same for all the polymers except
for PDEAAm in which the hydrogel shrinks at around 30°C (B).
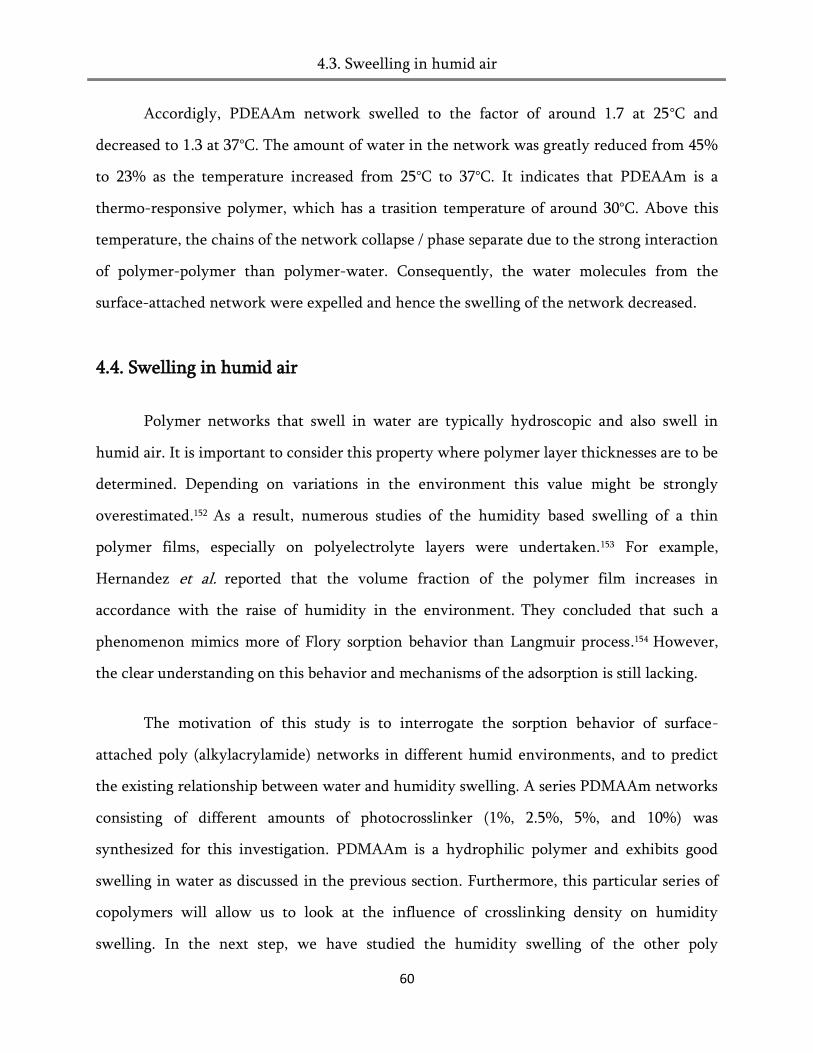
4.3. Sweelling in humid air
60
Accordigly, PDEAAm network swelled to the factor of around 1.7 at 25°C and
decreased to 1.3 at 37°C. The amount of water in the network was greatly reduced from 45%
to 23% as the temperature increased from 25°C to 37°C. It indicates that PDEAAm is a
thermo-responsive polymer, which has a trasition temperature of around 30°C. Above this
temperature, the chains of the network collapse / phase separate due to the strong interaction
of polymer-polymer than polymer-water. Consequently, the water molecules from the
surface-attached network were expelled and hence the swelling of the network decreased.
4.4. Swelling in humid air
Polymer networks that swell in water are typically hydroscopic and also swell in
humid air. It is important to consider this property where polymer layer thicknesses are to be
determined. Depending on variations in the environment this value might be strongly
overestimated.152 As a result, numerous studies of the humidity based swelling of a thin
polymer films, especially on polyelectrolyte layers were undertaken.153 For example,
Hernandez et al. reported that the volume fraction of the polymer film increases in
accordance with the raise of humidity in the environment. They concluded that such a
phenomenon mimics more of Flory sorption behavior than Langmuir process.154 However,
the clear understanding on this behavior and mechanisms of the adsorption is still lacking.
The motivation of this study is to interrogate the sorption behavior of surface-
attached poly (alkylacrylamide) networks in different humid environments, and to predict
the existing relationship between water and humidity swelling. A series PDMAAm networks
consisting of different amounts of photocrosslinker (1%, 2.5%, 5%, and 10%) was
synthesized for this investigation. PDMAAm is a hydrophilic polymer and exhibits good
swelling in water as discussed in the previous section. Furthermore, this particular series of
copolymers will allow us to look at the influence of crosslinking density on humidity
swelling. In the next step, we have studied the humidity swelling of the other poly
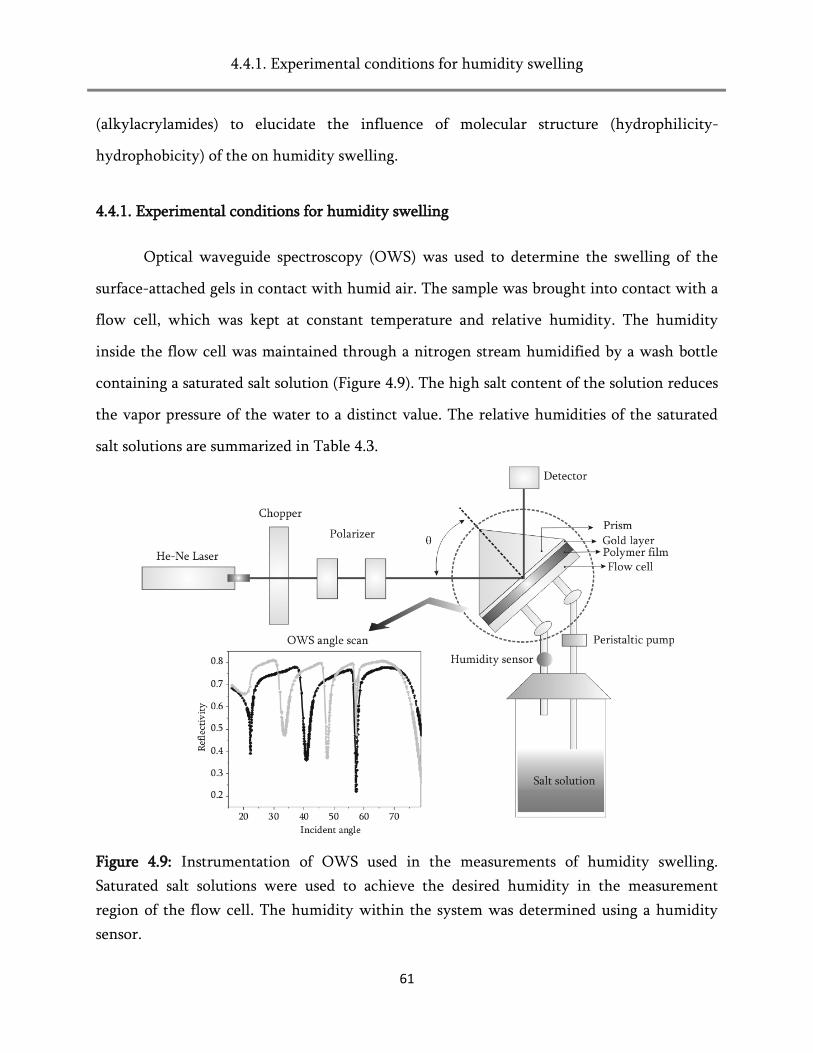
4.4.1. Experimental conditions for humidity swelling
61
(alkylacrylamides) to elucidate the influence of molecular structure (hydrophilicity-
hydrophobicity) of the on humidity swelling.
4.4.1. Experimental conditions for humidity swelling
Optical waveguide spectroscopy (OWS) was used to determine the swelling of the
surface-attached gels in contact with humid air. The sample was brought into contact with a
flow cell, which was kept at constant temperature and relative humidity. The humidity
inside the flow cell was maintained through a nitrogen stream humidified by a wash bottle
containing a saturated salt solution (Figure 4.9). The high salt content of the solution reduces
the vapor pressure of the water to a distinct value. The relative humidities of the saturated
salt solutions are summarized in Table 4.3.
Figure 4.9: Instrumentation of OWS used in the measurements of humidity swelling.
Saturated salt solutions were used to achieve the desired humidity in the measurement
region of the flow cell. The humidity within the system was determined using a humidity
sensor.
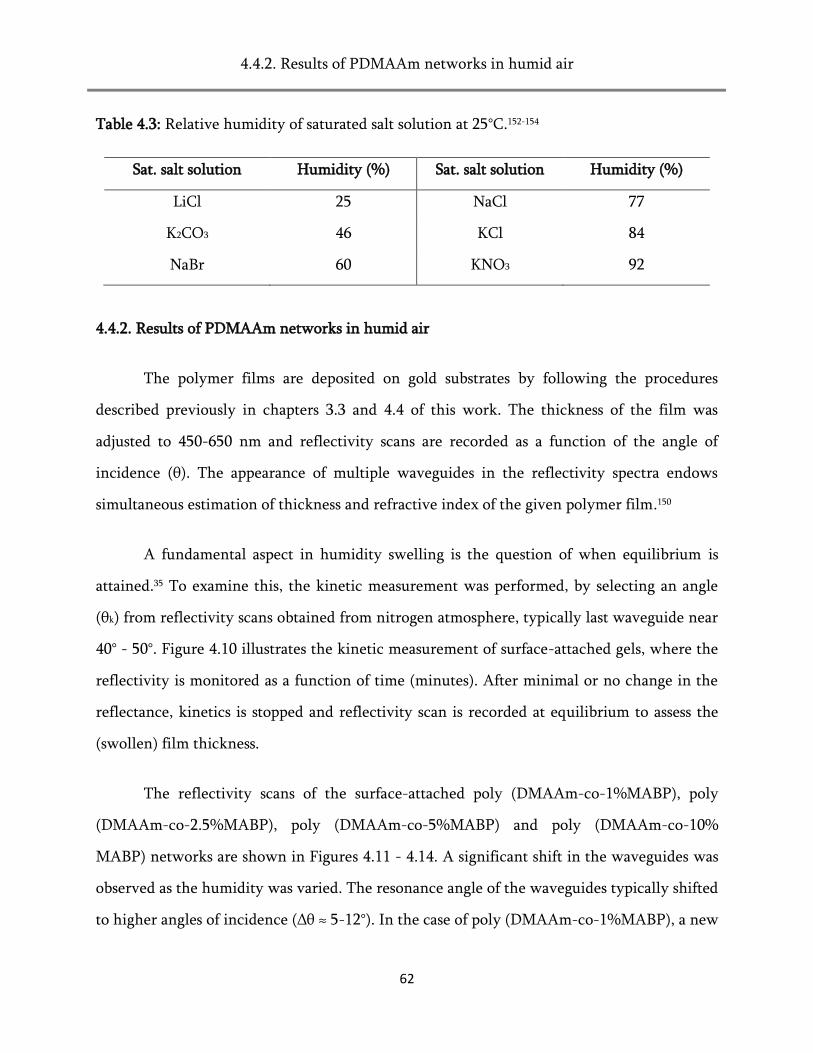
4.4.2. Results of PDMAAm networks in humid air
62
Table 4.3: Relative humidity of saturated salt solution at 25°C.152-154
Sat. salt solution Humidity (%) Sat. salt solution Humidity (%)
LiCl 25 NaCl 77
K2CO3 46 KCl 84
NaBr 60 KNO3 92
4.4.2. Results of PDMAAm networks in humid air
The polymer films are deposited on gold substrates by following the procedures
described previously in chapters 3.3 and 4.4 of this work. The thickness of the film was
adjusted to 450-650 nm and reflectivity scans are recorded as a function of the angle of
incidence (θ). The appearance of multiple waveguides in the reflectivity spectra endows
simultaneous estimation of thickness and refractive index of the given polymer film.150
A fundamental aspect in humidity swelling is the question of when equilibrium is
attained.35 To examine this, the kinetic measurement was performed, by selecting an angle
(θk) from reflectivity scans obtained from nitrogen atmosphere, typically last waveguide near
40° - 50°. Figure 4.10 illustrates the kinetic measurement of surface-attached gels, where the
reflectivity is monitored as a function of time (minutes). After minimal or no change in the
reflectance, kinetics is stopped and reflectivity scan is recorded at equilibrium to assess the
(swollen) film thickness.
The reflectivity scans of the surface-attached poly (DMAAm-co-1%MABP), poly
(DMAAm-co-2.5%MABP), poly (DMAAm-co-5%MABP) and poly (DMAAm-co-10%
MABP) networks are shown in Figures 4.11 - 4.14. A significant shift in the waveguides was
observed as the humidity was varied. The resonance angle of the waveguides typically shifted
to higher angles of incidence (Δθ ≈ 5-12°). In the case of poly (DMAAm-co-1%MABP), a new

4.4.2. Results of PDMAAm networks ín humid air
63
waveguide appeared which indicates that there is a strong change in the optical thickness of
the film.
Figure 4.10: Kinetics measurement of surface-attached poly (DMAAm-co-1%MABP) at
various relative humidity, where the reflectivity is measured as a function of time. In most
cases, it takes 30-35 minutes to reach equilibrium.
The change in the film thicknesses and refractive index of the surface-attached
PDMAAm networks were determined by modelling the data using Fresnel formalism.145
Accordingly, the swelling factor of the PDMAAm networks at different humidity was
determined by comparing the swollen layer thickness to the dry thickness.
The calculated swelling factors of the PDMAAm networks are summarized in Tables
4.4 - 4.7. In general, the thickness of the films has increased as the humidity of the system is
raised indicating that the gel undergo swelling. On the same token, the refractive index is of
the swollen layer decreased due to the water uptake. The refractive indices of water and
PDMAAm networks are 1.33 and 1.5, respectively. Hence, the refractive index of the
swollen layer depends directly on the water uptake.
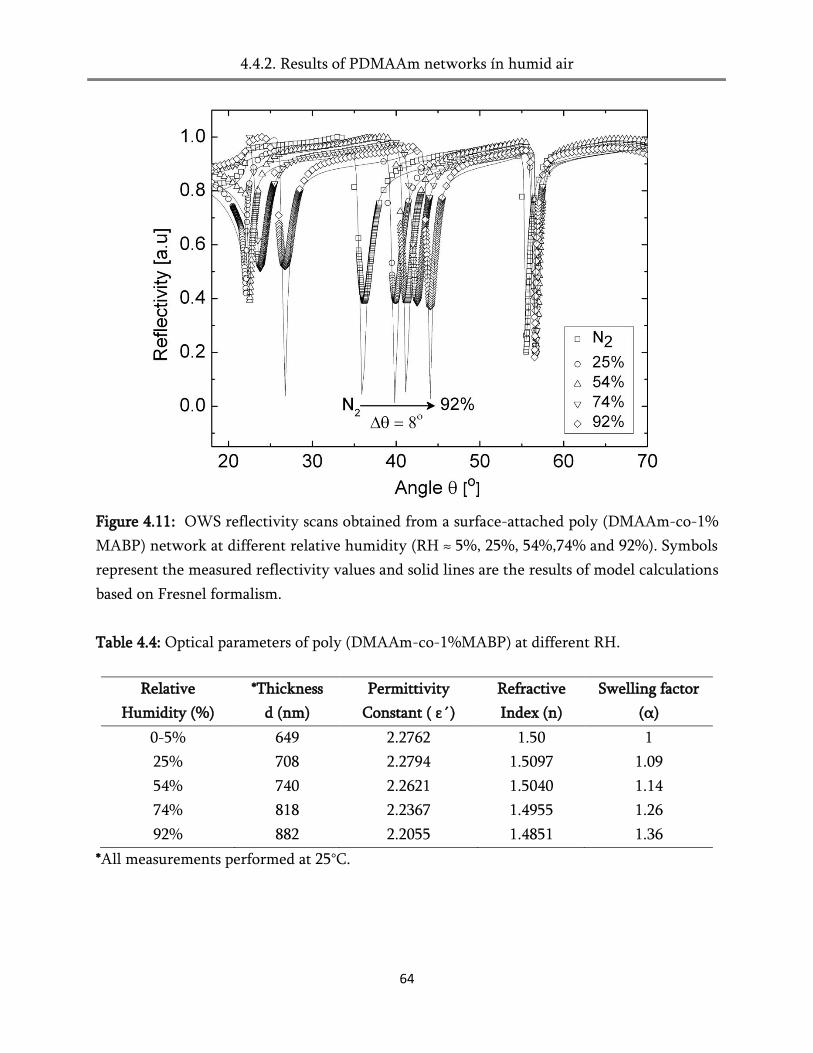
4.4.2. Results of PDMAAm networks ín humid air
64
Figure 4.11: OWS reflectivity scans obtained from a surface-attached poly (DMAAm-co-1%
MABP) network at different relative humidity (RH ≈ 5%, 25%, 54%,74% and 92%). Symbols
represent the measured reflectivity values and solid lines are the results of model calculations
based on Fresnel formalism.
Table 4.4: Optical parameters of poly (DMAAm-co-1%MABP) at different RH.
Relative
Humidity (%)
*Thickness
d (nm)
Permittivity
Constant ( ε´)
Refractive
Index (n)
Swelling factor
(α)
0-5% 649 2.2762 1.50 1
25% 708 2.2794 1.5097 1.09
54% 740 2.2621 1.5040 1.14
74% 818 2.2367 1.4955 1.26
92% 882 2.2055 1.4851 1.36
*All measurements performed at 25°C.
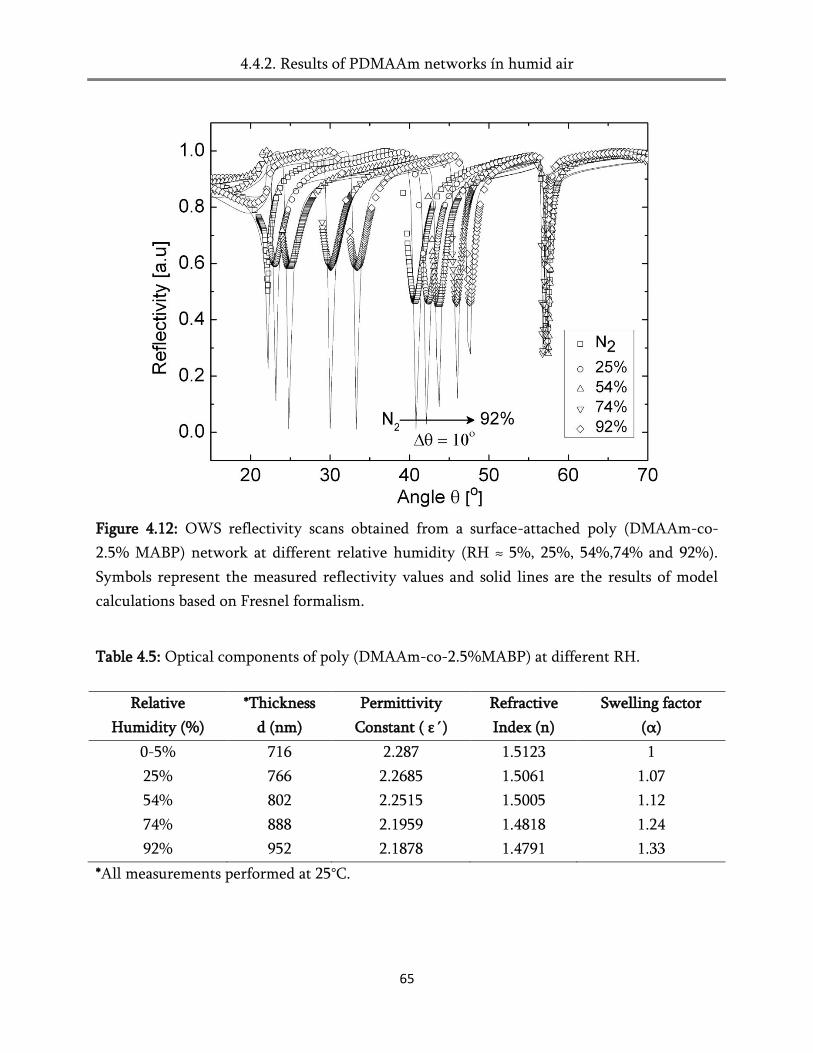
4.4.2. Results of PDMAAm networks ín humid air
65
Figure 4.12: OWS reflectivity scans obtained from a surface-attached poly (DMAAm-co-
2.5% MABP) network at different relative humidity (RH ≈ 5%, 25%, 54%,74% and 92%).
Symbols represent the measured reflectivity values and solid lines are the results of model
calculations based on Fresnel formalism.
Table 4.5: Optical components of poly (DMAAm-co-2.5%MABP) at different RH.
Relative
Humidity (%)
*Thickness
d (nm)
Permittivity
Constant ( ε´)
Refractive
Index (n)
Swelling factor
(α)
0-5% 716 2.287 1.5123 1
25% 766 2.2685 1.5061 1.07
54% 802 2.2515 1.5005 1.12
74% 888 2.1959 1.4818 1.24
92% 952 2.1878 1.4791 1.33
*All measurements performed at 25°C.
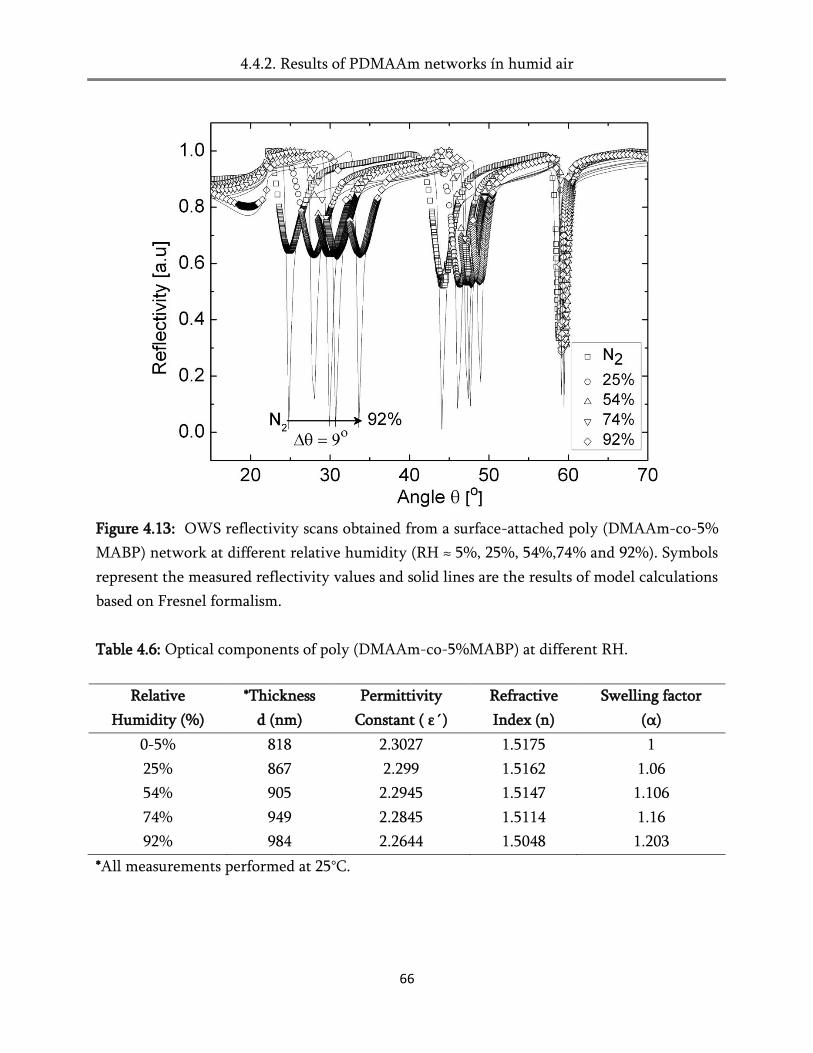
4.4.2. Results of PDMAAm networks ín humid air
66
Figure 4.13: OWS reflectivity scans obtained from a surface-attached poly (DMAAm-co-5%
MABP) network at different relative humidity (RH ≈ 5%, 25%, 54%,74% and 92%). Symbols
represent the measured reflectivity values and solid lines are the results of model calculations
based on Fresnel formalism.
Table 4.6: Optical components of poly (DMAAm-co-5%MABP) at different RH.
Relative
Humidity (%)
*Thickness
d (nm)
Permittivity
Constant ( ε´)
Refractive
Index (n)
Swelling factor
(α)
0-5% 818 2.3027 1.5175 1
25% 867 2.299 1.5162 1.06
54% 905 2.2945 1.5147 1.106
74% 949 2.2845 1.5114 1.16
92% 984 2.2644 1.5048 1.203
*All measurements performed at 25°C.
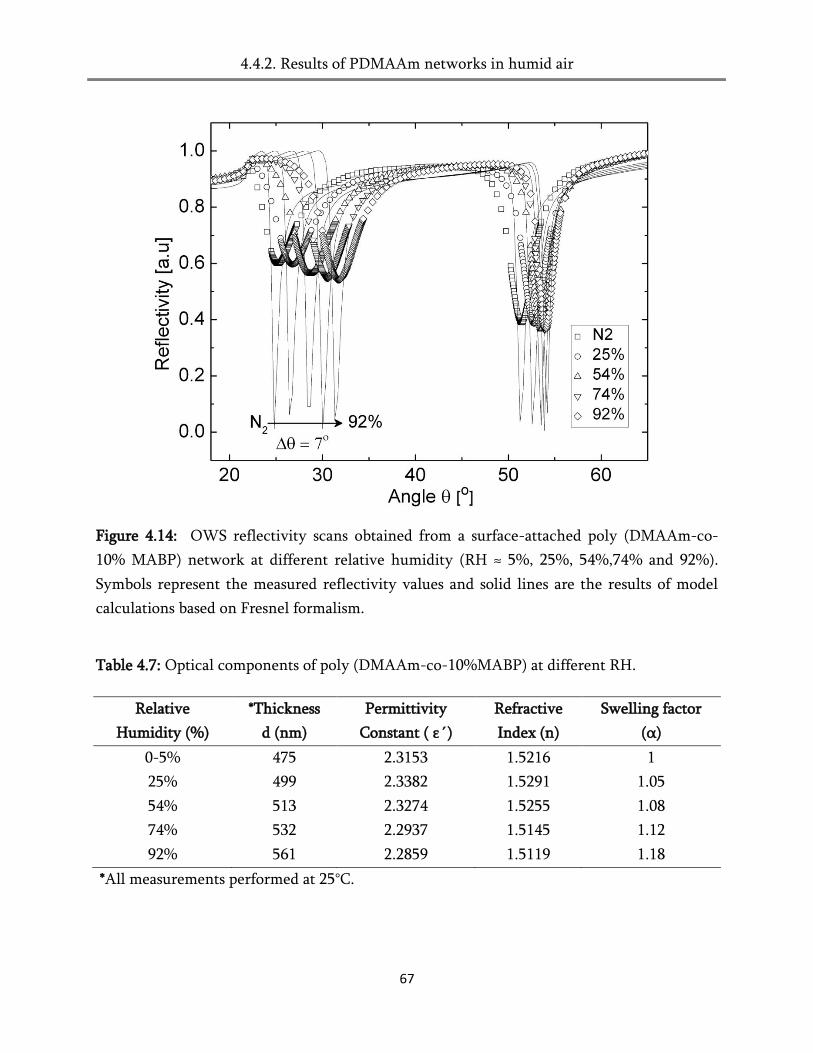
4.4.2. Results of PDMAAm networks in humid air
67
Figure 4.14: OWS reflectivity scans obtained from a surface-attached poly (DMAAm-co-
10% MABP) network at different relative humidity (RH ≈ 5%, 25%, 54%,74% and 92%).
Symbols represent the measured reflectivity values and solid lines are the results of model
calculations based on Fresnel formalism.
Table 4.7: Optical components of poly (DMAAm-co-10%MABP) at different RH.
Relative
Humidity (%)
*Thickness
d (nm)
Permittivity
Constant ( ε´)
Refractive
Index (n)
Swelling factor
(α)
0-5% 475 2.3153 1.5216 1
25% 499 2.3382 1.5291 1.05
54% 513 2.3274 1.5255 1.08
74% 532 2.2937 1.5145 1.12
92% 561 2.2859 1.5119 1.18
*All measurements performed at 25°C.

4.4.3. Influence of layer thickness in humidity swelling
68
4.4.3. Influence of layer thickness in humidity swelling
The motivation here is to address the influence of film thickness in swelling behavior
of a surface-attached network.The poly (DMAAm-co-2.5% MABP) was chosen for the
investigation due to the reason that it is hydrophilic and show strong swelling in water. The
deposited film thicknesses of 49 nm (thinner film) and 716 nm (thicker film) were prepared
on gold substrates by appropriate coating procedure. Such a large difference in thickness is
sufficient to study the influence of film thickness.
The reflectivity measurements of thin (49 nm) and thick (700 nm) films at different
humidity are shown in Figures 4.15 and 4.16 along with the Fresnel calculations. In both
graphs, significant changes in the angle θ are observed as the relative humidity of the
surrounding is increased. This demonstrates that both films (thin and thick) absorb water
molecules from the air and it increases with the increase in the humidity.
The calculated optical parameters of the films are summarized in Tables 4.8 and 4.9.
For the thinner film, the thickness was raised from 49 nm to 65 nm, which yields to the
swelling factor of around 1.33. Similarly, for the thicker film, the thickness was increased
from 716 nm to 974 nm indicating a swelling factor of 1.36. The variation in the swelling of
these two films are depicted in Figure 4.17, where the change in the film thickness and
relative swelling was plotted against the relative humidity in order to elucidate the influence
of layer thickness in swelling.
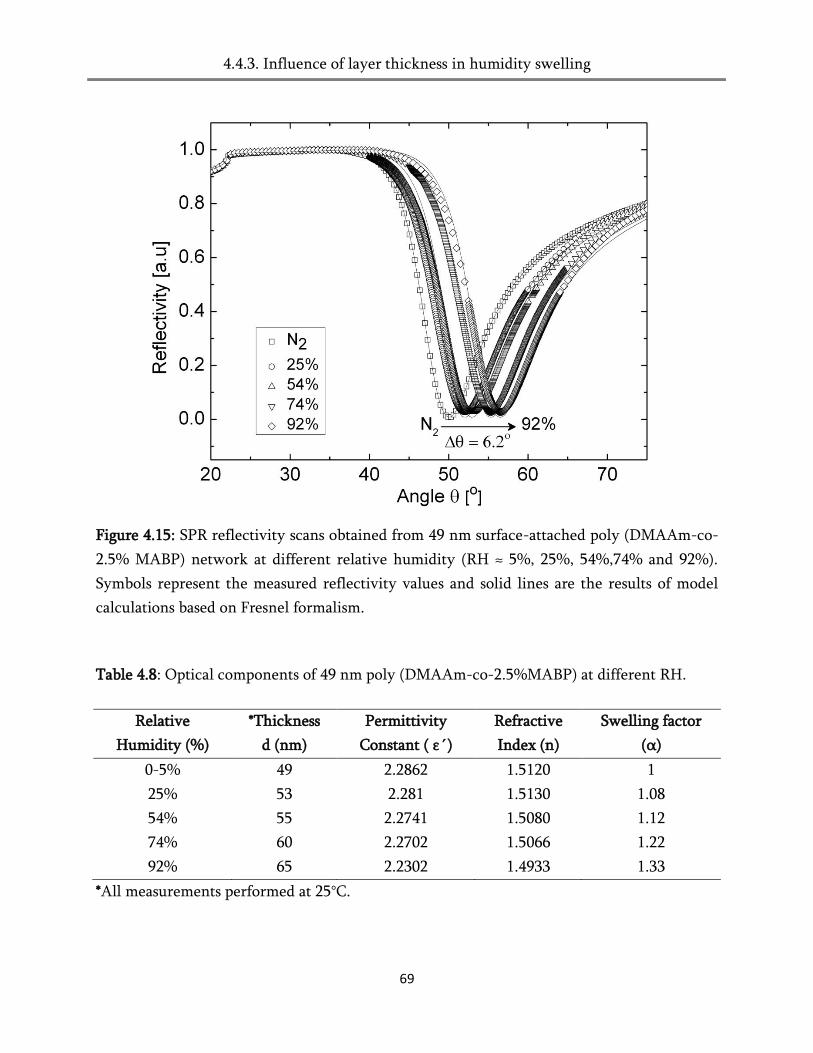
4.4.3. Influence of layer thickness in humidity swelling
69
Figure 4.15: SPR reflectivity scans obtained from 49 nm surface-attached poly (DMAAm-co-
2.5% MABP) network at different relative humidity (RH ≈ 5%, 25%, 54%,74% and 92%).
Symbols represent the measured reflectivity values and solid lines are the results of model
calculations based on Fresnel formalism.
Table 4.8: Optical components of 49 nm poly (DMAAm-co-2.5%MABP) at different RH.
Relative
Humidity (%)
*Thickness
d (nm)
Permittivity
Constant ( ε´)
Refractive
Index (n)
Swelling factor
(α)
0-5% 49 2.2862 1.5120 1
25% 53 2.281 1.5130 1.08
54% 55 2.2741 1.5080 1.12
74% 60 2.2702 1.5066 1.22
92% 65 2.2302 1.4933 1.33
*All measurements performed at 25°C.
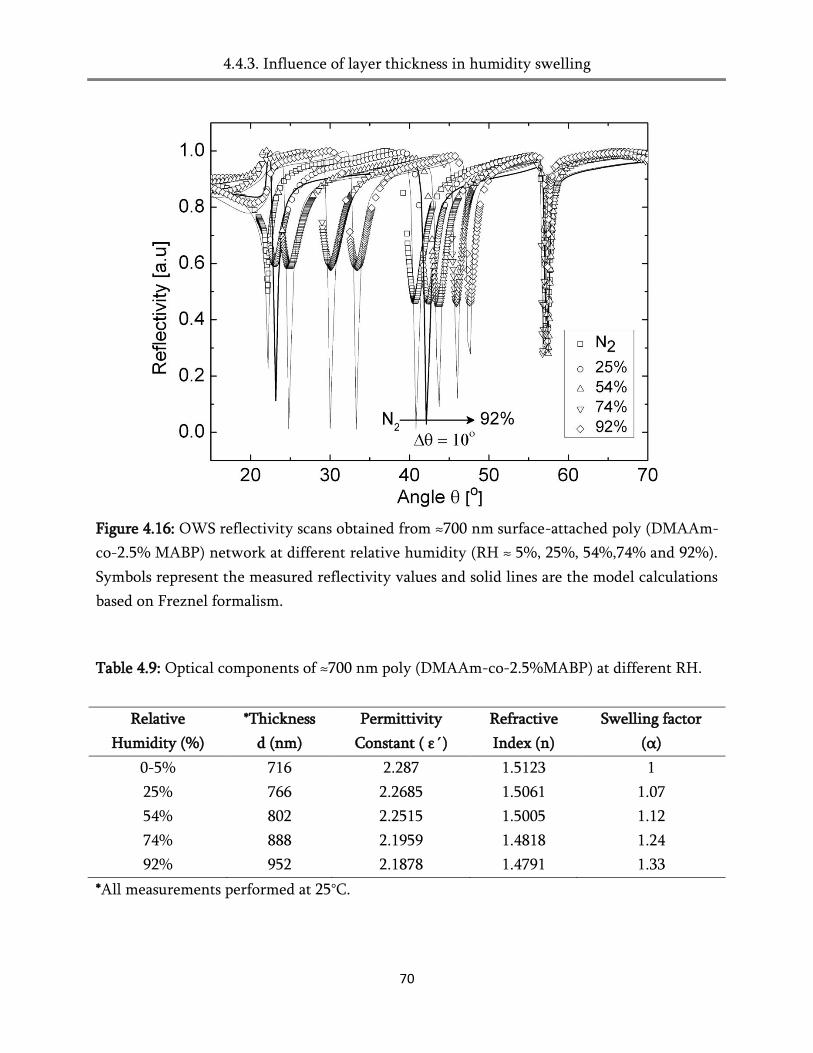
4.4.3. Influence of layer thickness in humidity swelling
70
Figure 4.16: OWS reflectivity scans obtained from ≈700 nm surface-attached poly (DMAAm-
co-2.5% MABP) network at different relative humidity (RH ≈ 5%, 25%, 54%,74% and 92%).
Symbols represent the measured reflectivity values and solid lines are the model calculations
based on Freznel formalism.
Table 4.9: Optical components of ≈700 nm poly (DMAAm-co-2.5%MABP) at different RH.
Relative
Humidity (%)
*Thickness
d (nm)
Permittivity
Constant ( ε´)
Refractive
Index (n)
Swelling factor
(α)
0-5% 716 2.287 1.5123 1
25% 766 2.2685 1.5061 1.07
54% 802 2.2515 1.5005 1.12
74% 888 2.1959 1.4818 1.24
92% 952 2.1878 1.4791 1.33
*All measurements performed at 25°C.

4.4.3. Influence of layer thickness in humidity swelling
71
Figure 4.17: Swelling factor of thin and thick films as a function of relative humidity.
The similarity in the shape of thickness or swelling curves in Figure 4.14 strongly
indicate that the gels are very sensitive and absorb a lot of water molecules from the
moisture. Howeveer, the slight variation between thin and thick layer occurs, may be due to
the difference in the film process and subsequent crosslink density. The estimated difference
in the swelling of these two films was α ≈ 0.03-0.04 and it is within experimental error of the
SPR and OWS measurements. Such a small variation is less pronounced when compared to
the net swelling of the gels. Therefore, the influence of layer thickness is neglected in the
case of humidity swelling.
Similar results were obtained for surface-attached poly (MAAm-co-3%MABP)
network using the film thickness of approx. 150 nm and 550 nm (results are summarized in
appendix) and the results are in agreement with the above statement that layer thickness is
less pronounced in the case of swelling in humid air.

4.4.4. Flory-Huggins sorption behavior
72
4.4.4. Flory-Huggins sorption behavior
The swelling behavior can be explained by considering the modified Flory-Huggins
theory, where the water-polymer interaction becomes more favorable as the films swells
than between water molecules. Such observation is precedent in the swelling of hydrophilic
polymer gels in water and humid air, which suggests that it is energetically favorable for the
polymer structure to reorganize in response to the penetrant.155 According to the model, the
relative swelling of the surface-attached gels is described as
ln(𝜌
𝜌°) = ln𝜑1 + 1 − 𝜑1 + 𝜒(1 − 𝜑1)² (Eq.4.19)
Where ρ° is the saturation vapor pressure, ρ is the actual vapor pressure, φ1 is the
volume fraction of the small molecule in the polymer network and χ is the Flory-Huggins
solvent interaction parameter, which describes the free energy of mixing between water
vapor and polymer network. For a given volume fraction of a polymer (φ2), the smaller the
value of χ, the greater the rate at which the free energy of mixing of the solution decreases
with the addition of solvent molecules.
The volume fraction of solvent (φ1 = 𝑙/𝑙0)) and polymer (φ2 = 1- 𝑙/𝑙0)) is obtained
from the relative swelling ( 𝑙/𝑙0) of the surface-attached network.
ln ρ
ρ° = ln
𝑙
𝑙0 −
𝑙
𝑙0 + χ
𝑙
𝑙0 ² (Eq.4.20)
From equation 4.20, the relative thickness is exponentially increasing with increasing
relative humidity (Figure 4.18).156-158 The Flory-Huggins parameter (χ) for these gels is closer
to one (χ = 0.8-0.9) at the highest relative humidity of 90%, which indicates that the
interaction between the water molecules is stronger than between polymer and water.
Furthermore, even at high saturation (≈99 % relative humidity), the water vapor pressure at
25°C is 23 mbar and, the total amount of water in the air is less than 2.5%. Regardless of few
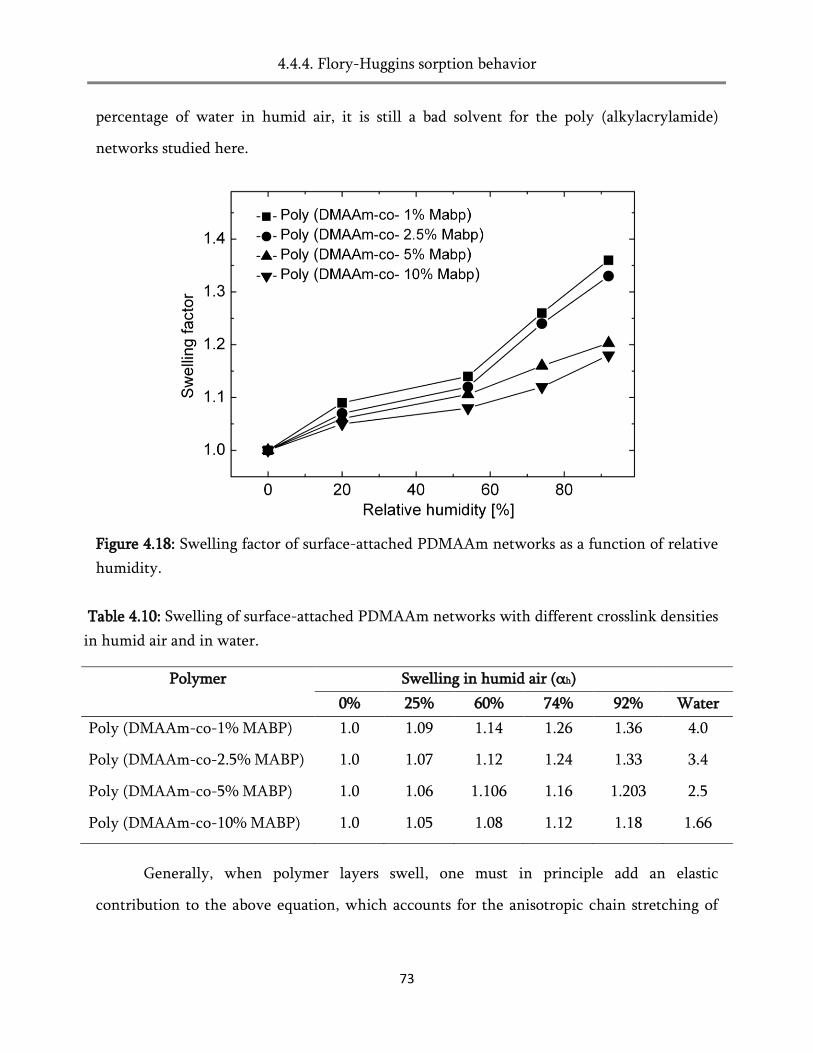
4.4.4. Flory-Huggins sorption behavior
73
percentage of water in humid air, it is still a bad solvent for the poly (alkylacrylamide)
networks studied here.
Figure 4.18: Swelling factor of surface-attached PDMAAm networks as a function of relative
humidity.
Table 4.10: Swelling of surface-attached PDMAAm networks with different crosslink densities
in humid air and in water.
Polymer Swelling in humid air (αh)
0% 25% 60% 74% 92% Water
Poly (DMAAm-co-1% MABP) 1.0 1.09 1.14 1.26 1.36 4.0
Poly (DMAAm-co-2.5% MABP) 1.0 1.07 1.12 1.24 1.33 3.4
Poly (DMAAm-co-5% MABP) 1.0 1.06 1.106 1.16 1.203 2.5
Poly (DMAAm-co-10% MABP) 1.0 1.05 1.08 1.12 1.18 1.66
Generally, when polymer layers swell, one must in principle add an elastic
contribution to the above equation, which accounts for the anisotropic chain stretching of
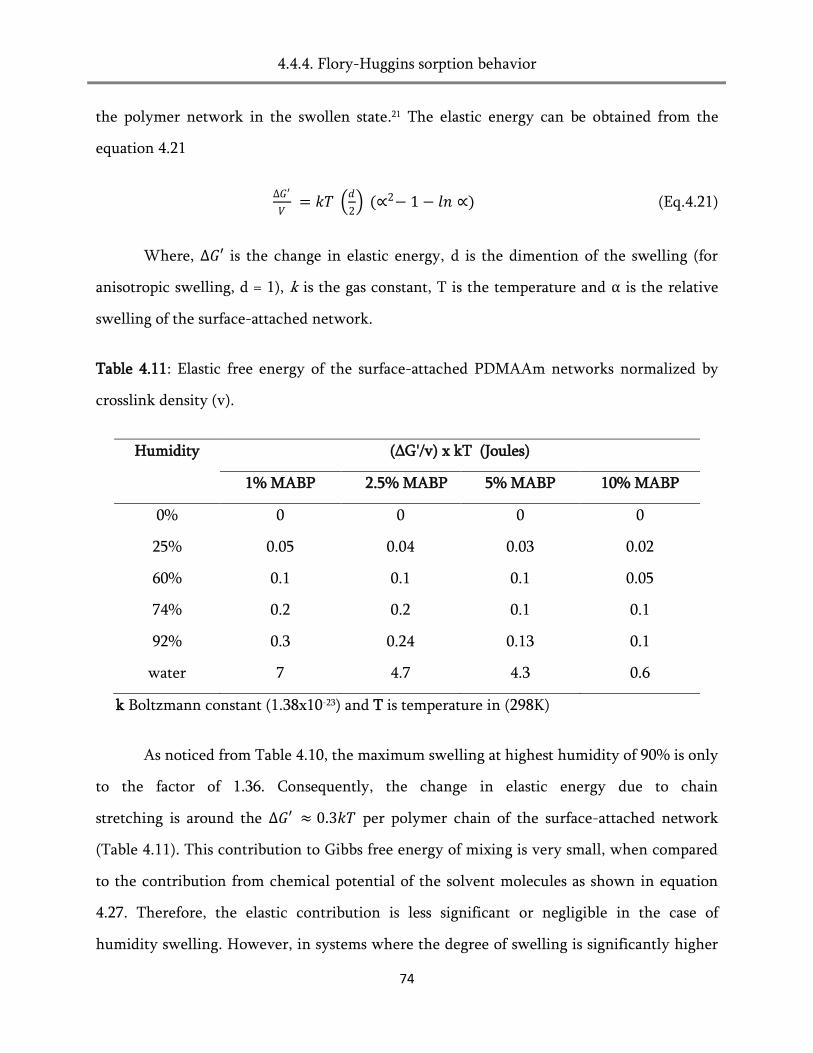
4.4.4. Flory-Huggins sorption behavior
74
the polymer network in the swollen state.21 The elastic energy can be obtained from the
equation 4.21
∆𝐺′
𝑉 = 𝑘𝑇
𝑑
2 (∝2− 1 − 𝑙𝑛 ∝) (Eq.4.21)
Where, ∆𝐺′ is the change in elastic energy, d is the dimention of the swelling (for
anisotropic swelling, d = 1), k is the gas constant, T is the temperature and α is the relative
swelling of the surface-attached network.
Table 4.11: Elastic free energy of the surface-attached PDMAAm networks normalized by
crosslink density (v).
Humidity (∆G'/v) x kT (Joules)
1% MABP 2.5% MABP 5% MABP 10% MABP
0% 0 0 0 0
25% 0.05 0.04 0.03 0.02
60% 0.1 0.1 0.1 0.05
74% 0.2 0.2 0.1 0.1
92% 0.3 0.24 0.13 0.1
water 7 4.7 4.3 0.6
k Boltzmann constant (1.38x10⁻²³) and T is temperature in (298K)
As noticed from Table 4.10, the maximum swelling at highest humidity of 90% is only
to the factor of 1.36. Consequently, the change in elastic energy due to chain
stretching is around the ∆𝐺′ ≈ 0.3𝑘𝑇 per polymer chain of the surface-attached network
(Table 4.11). This contribution to Gibbs free energy of mixing is very small, when compared
to the contribution from chemical potential of the solvent molecules as shown in equation
4.27. Therefore, the elastic contribution is less significant or negligible in the case of
humidity swelling. However, in systems where the degree of swelling is significantly higher

4.4.5. Selective adsorption of water
75
like in the case of water, then the contribution from elastic energy will be utmost
important.150,152
4.4.5. Selective adsorption of water
As outlined previously, very similar results were reported for the swelling of
polyelectrolytes159 and surface grafted polystyrene160 in a mixtures of a solvent and a non-
solvent. Bunjes et al.161 have shown that toluene (good solvent) preferentially adsorbs in
polystyrene brushes over methanol for the reason that it has a better affinity to polystyrene
than the methanol (poor solvent). In addition, different compositions of toluene/methanol
mixtures were studied and under all circumstances, the volume fraction of toluene within
the swollen layer was considerably larger than in the solvent mixture. Hence, we have
plotted the volume fraction of water (φ1) in the network as a function of water in the air at
different relative humidity (Figure 4.19). As outlined previously, at maximum humidity of
≈100% the air contains ≈2.5% of water.152
From a principle point of view, when the surface is covered with water at a given
temperature (25°C), all the water molecules tend to evaporate until the maximum relative
humidity is reached. Subsequently, at low relative humidity (< 50%) or low water content
(<1.35%) in humid air, a comparable strong uptake of water is observed. This indicates that
water vapor is selectively extracted from air.159-161 The driving force for such selective
adsorption of water vapor is the polar amide groups present in the acrylamide gels.
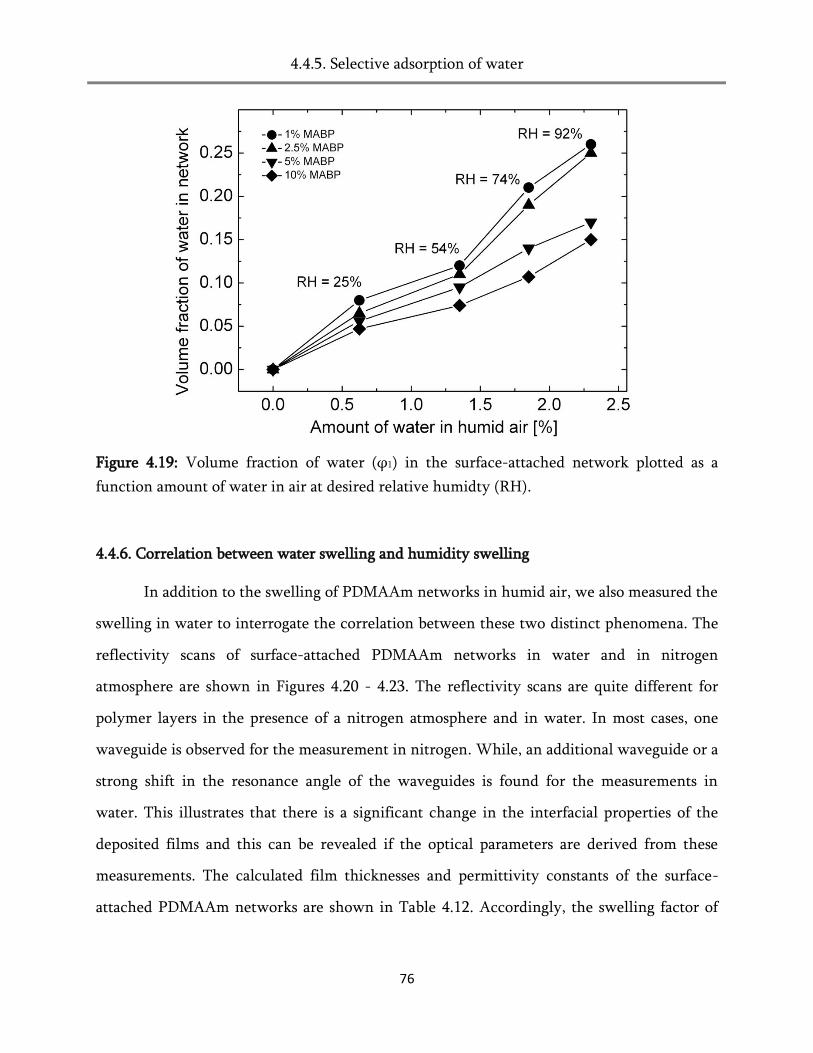
4.4.5. Selective adsorption of water
76
Figure 4.19: Volume fraction of water (φ1) in the surface-attached network plotted as a
function amount of water in air at desired relative humidty (RH).
4.4.6. Correlation between water swelling and humidity swelling
In addition to the swelling of PDMAAm networks in humid air, we also measured the
swelling in water to interrogate the correlation between these two distinct phenomena. The
reflectivity scans of surface-attached PDMAAm networks in water and in nitrogen
atmosphere are shown in Figures 4.20 - 4.23. The reflectivity scans are quite different for
polymer layers in the presence of a nitrogen atmosphere and in water. In most cases, one
waveguide is observed for the measurement in nitrogen. While, an additional waveguide or a
strong shift in the resonance angle of the waveguides is found for the measurements in
water. This illustrates that there is a significant change in the interfacial properties of the
deposited films and this can be revealed if the optical parameters are derived from these
measurements. The calculated film thicknesses and permittivity constants of the surface-
attached PDMAAm networks are shown in Table 4.12. Accordingly, the swelling factor of
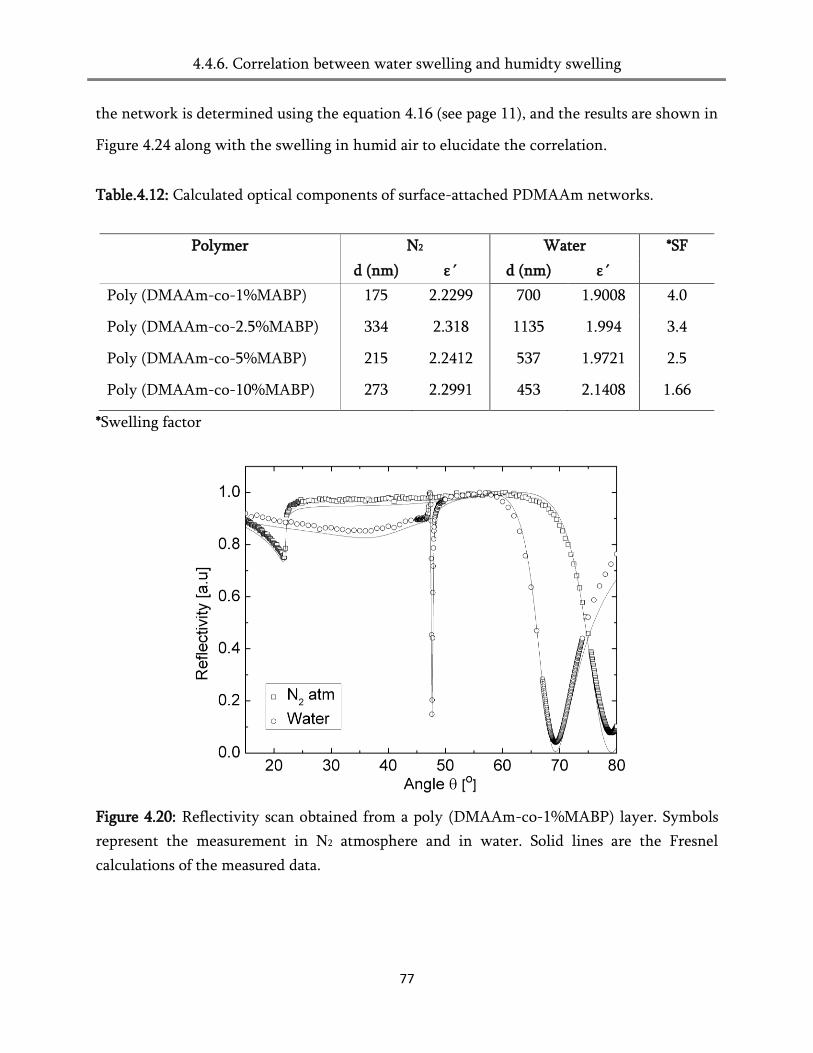
4.4.6. Correlation between water swelling and humidty swelling
77
the network is determined using the equation 4.16 (see page 11), and the results are shown in
Figure 4.24 along with the swelling in humid air to elucidate the correlation.
Table.4.12: Calculated optical components of surface-attached PDMAAm networks.
Polymer N2 Water *SF
d (nm) ε´ d (nm) ε´
Poly (DMAAm-co-1%MABP) 175 2.2299 700 1.9008 4.0
Poly (DMAAm-co-2.5%MABP) 334 2.318 1135 1.994 3.4
Poly (DMAAm-co-5%MABP) 215 2.2412 537 1.9721 2.5
Poly (DMAAm-co-10%MABP) 273 2.2991 453 2.1408 1.66
*Swelling factor
Figure 4.20: Reflectivity scan obtained from a poly (DMAAm-co-1%MABP) layer. Symbols
represent the measurement in N2 atmosphere and in water. Solid lines are the Fresnel
calculations of the measured data.

4.4.6. Correlation between water swelling and humidty swelling
78
Figure 4.21: Reflectivity scan obtained from a poly (DMAAm-co-2.5%MABP). Symbols
represent the measurement in N2 atmosphere and in water. Solid lines are the Fresnel
calculations of the measured data.
Figure 4.22: Reflectivity scan obtained from a poly (DMAAm-co-5%MABP). Symbols
represent the measurement in N2 atmosphere and in water. Solid lines are the Fresnel
calculations of the measured data.
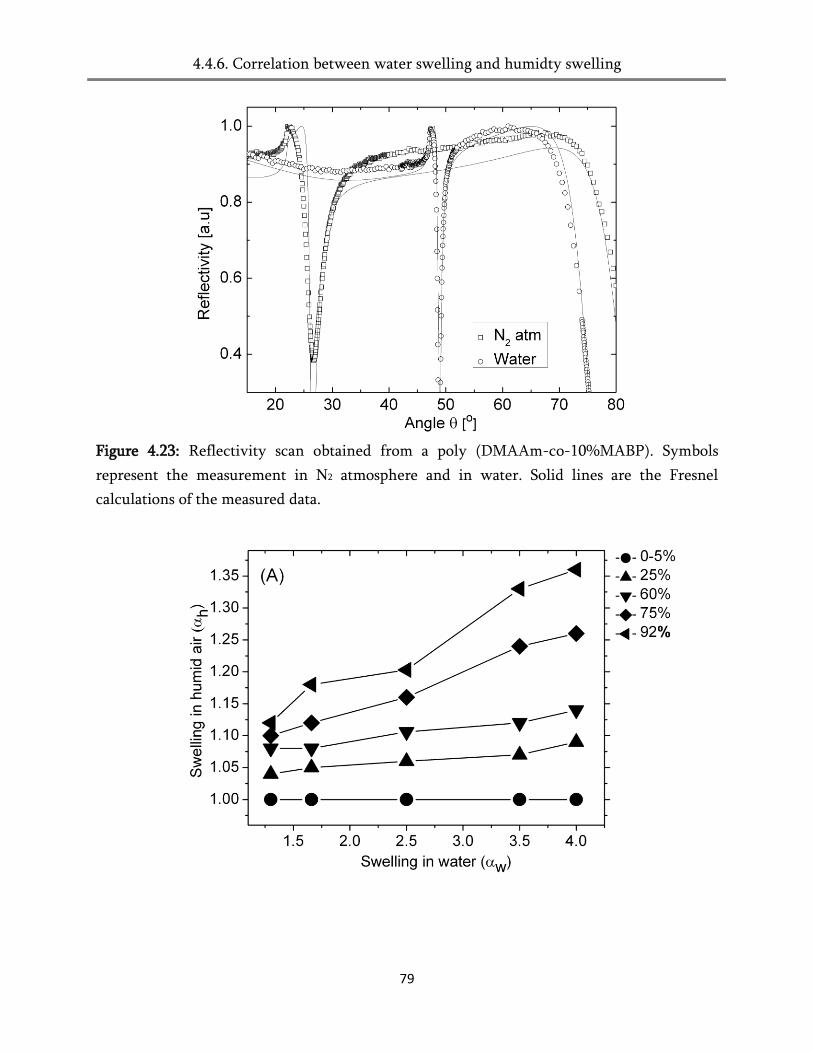
4.4.6. Correlation between water swelling and humidty swelling
79
Figure 4.23: Reflectivity scan obtained from a poly (DMAAm-co-10%MABP). Symbols
represent the measurement in N2 atmosphere and in water. Solid lines are the Fresnel
calculations of the measured data.
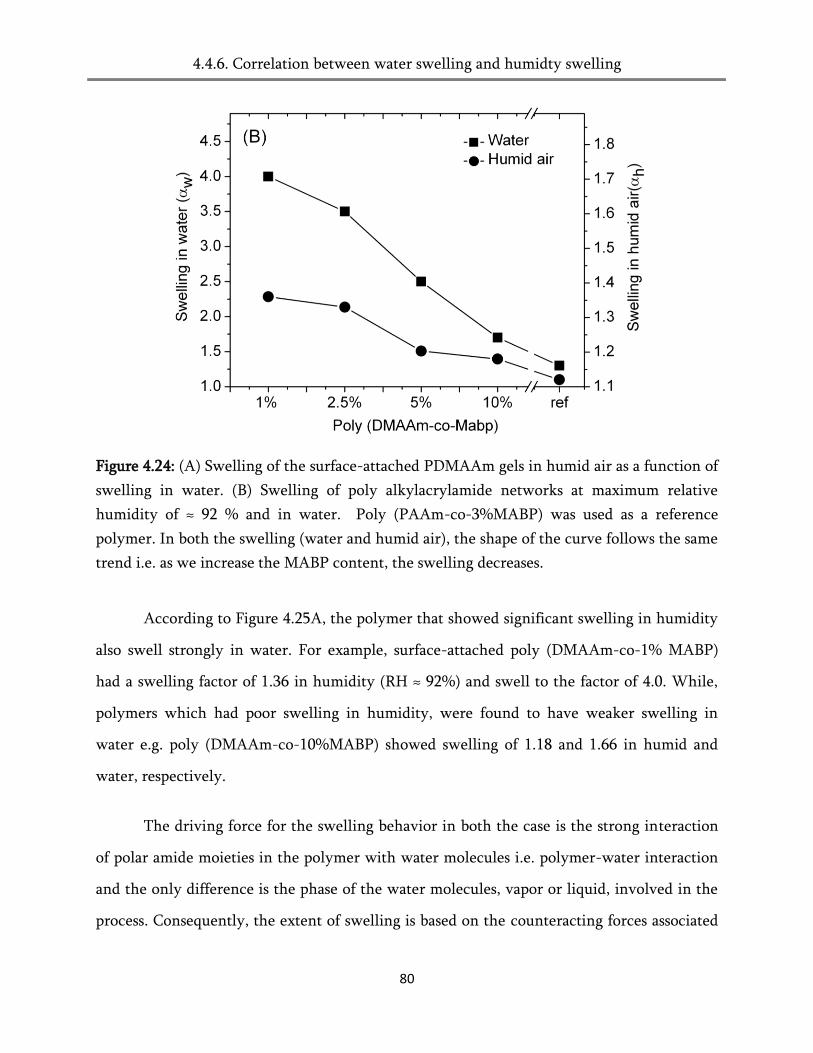
4.4.6. Correlation between water swelling and humidty swelling
80
Figure 4.24: (A) Swelling of the surface-attached PDMAAm gels in humid air as a function of
swelling in water. (B) Swelling of poly alkylacrylamide networks at maximum relative
humidity of ≈ 92 % and in water. Poly (PAAm-co-3%MABP) was used as a reference
polymer. In both the swelling (water and humid air), the shape of the curve follows the same
trend i.e. as we increase the MABP content, the swelling decreases.
According to Figure 4.25A, the polymer that showed significant swelling in humidity
also swell strongly in water. For example, surface-attached poly (DMAAm-co-1% MABP)
had a swelling factor of 1.36 in humidity (RH ≈ 92%) and swell to the factor of 4.0. While,
polymers which had poor swelling in humidity, were found to have weaker swelling in
water e.g. poly (DMAAm-co-10%MABP) showed swelling of 1.18 and 1.66 in humid and
water, respectively.
The driving force for the swelling behavior in both the case is the strong interaction
of polar amide moieties in the polymer with water molecules i.e. polymer-water interaction
and the only difference is the phase of the water molecules, vapor or liquid, involved in the
process. Consequently, the extent of swelling is based on the counteracting forces associated
4.4.7. Swelling of poly (alkylacrylamide) coatings in humid air
81
with the given condition, namely the heat of condensation for humidity and elastic
contribution. The heat of evaporation for water is ≈40 kJmol-1, which is quite larger than the
energy caused by the stretching of a polymer chain in solvent. Thus, the swelling in
humidity is weaker than in water. For example, swelling of poly (DMAAm-co-1%MABP) in
water, αw = 4.0 (≈4 times) and humid air (≈92% of relative humidity), αh = 1.36 (≈1.4 times).
However, for a qualitative understanding of the relationship between humidity and water
swelling requires thermodynamic parameter e.g. heat of hydration, which is measured using
solution calorimetry and discussed in the next section.
4.4.7. Swelling of poly (alkylacrylamide) coatings in humid air
Similar to the previous investigation, we have explored the humidity swelling of
surface-attached poly (alkylacrylamide-co-MABP) networks. From a principle point of view,
these homologous series should imbibe water molecules from the moisture in a similar
fashion to that of PDMAAm gels. In addition, this investigation, allows us to interrogate the
influence of molecular structure or hydrophobicity of the gels upon contact with moisture.
The results are summarized in Table 4.13162 and the optical components of the layers at
different humidity can be found in the appendix of the thesis.
The polymers with shorter alkyl substituent such as MAAm and EAAm show
significant amount of swelling in presence of moisture. In contrast, polymers consisting
larger alkyl substituent such as PAAm, BAAm and DEAAm show weak or poor swelling
under such conditions. Furthermore, MAAm was found to extract the maximum amount of
water into the network (approx 30%) and BAAm and DEAAm were found retain less than
10% of water.
These gels also exhibit selective absorption of the water vapor upon contact with
moisture. The extent of this adsorption depends on the length of the alkyl chain at N-----------------------------------
Humidity swelling of poly (alkylacrylamide) coatings was performed by Mr.Fan Wu, CPI-IMTEK, University of
Freiburg, Freiburg, Germany.
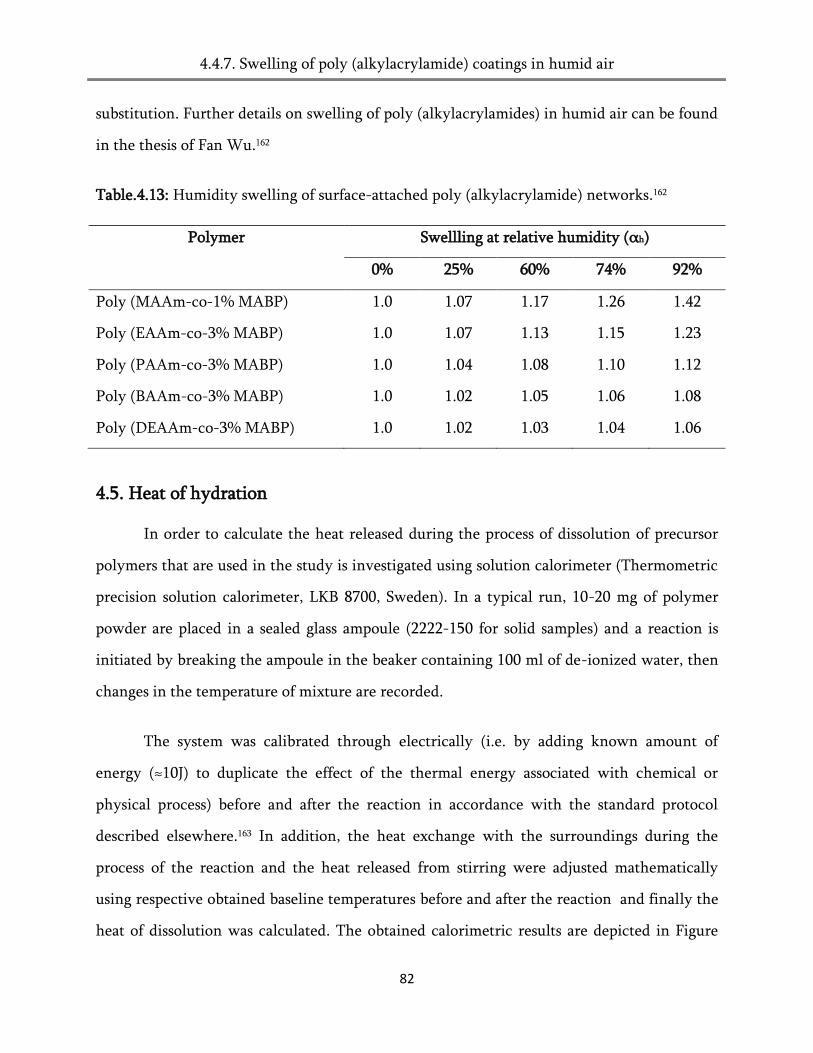
4.4.7. Swelling of poly (alkylacrylamide) coatings in humid air
82
substitution. Further details on swelling of poly (alkylacrylamides) in humid air can be found
in the thesis of Fan Wu.162
Table.4.13: Humidity swelling of surface-attached poly (alkylacrylamide) networks.162
Polymer Swellling at relative humidity (αh)
0% 25% 60% 74% 92%
Poly (MAAm-co-1% MABP) 1.0 1.07 1.17 1.26 1.42
Poly (EAAm-co-3% MABP) 1.0 1.07 1.13 1.15 1.23
Poly (PAAm-co-3% MABP) 1.0 1.04 1.08 1.10 1.12
Poly (BAAm-co-3% MABP) 1.0 1.02 1.05 1.06 1.08
Poly (DEAAm-co-3% MABP) 1.0 1.02 1.03 1.04 1.06
4.5. Heat of hydration
In order to calculate the heat released during the process of dissolution of precursor
polymers that are used in the study is investigated using solution calorimeter (Thermometric
precision solution calorimeter, LKB 8700, Sweden). In a typical run, 10-20 mg of polymer
powder are placed in a sealed glass ampoule (2222-150 for solid samples) and a reaction is
initiated by breaking the ampoule in the beaker containing 100 ml of de-ionized water, then
changes in the temperature of mixture are recorded.
The system was calibrated through electrically (i.e. by adding known amount of
energy (≈10J) to duplicate the effect of the thermal energy associated with chemical or
physical process) before and after the reaction in accordance with the standard protocol
described elsewhere.163 In addition, the heat exchange with the surroundings during the
process of the reaction and the heat released from stirring were adjusted mathematically
using respective obtained baseline temperatures before and after the reaction and finally the
heat of dissolution was calculated. The obtained calorimetric results are depicted in Figure
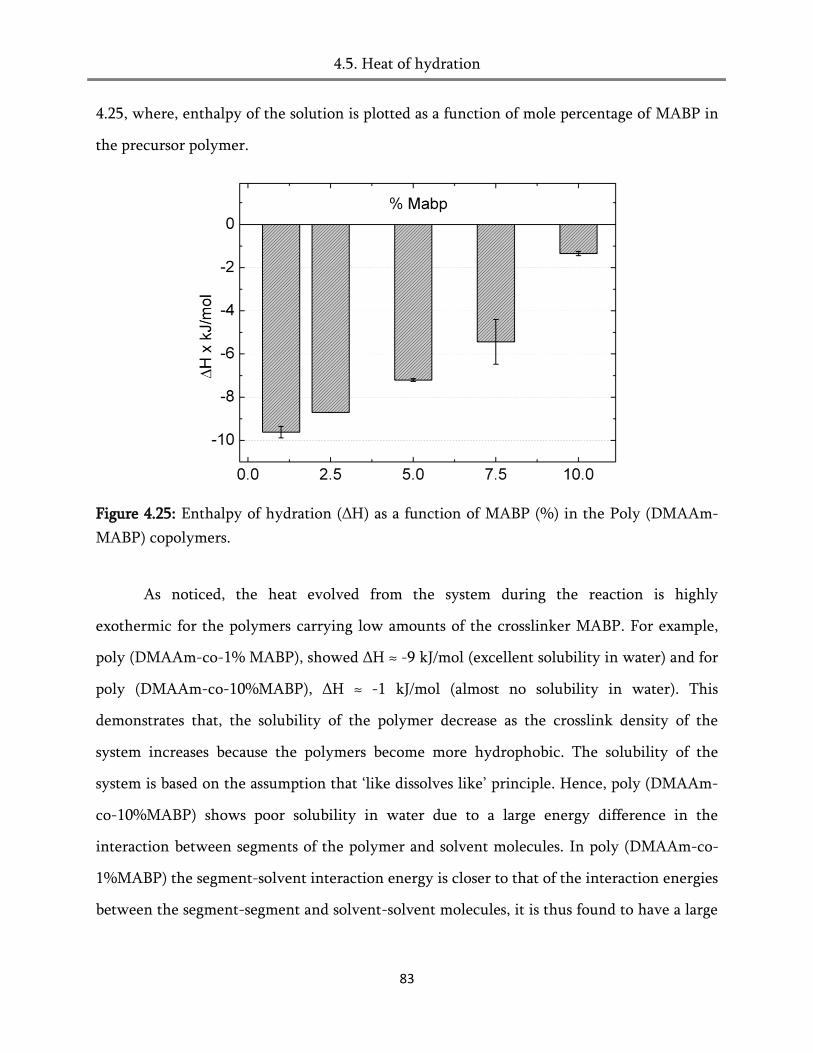
4.5. Heat of hydration
83
4.25, where, enthalpy of the solution is plotted as a function of mole percentage of MABP in
the precursor polymer.
Figure 4.25: Enthalpy of hydration (ΔH) as a function of MABP (%) in the Poly (DMAAm-
MABP) copolymers.
As noticed, the heat evolved from the system during the reaction is highly
exothermic for the polymers carrying low amounts of the crosslinker MABP. For example,
poly (DMAAm-co-1% MABP), showed ΔH ≈ -9 kJ/mol (excellent solubility in water) and for
poly (DMAAm-co-10%MABP), ΔH ≈ -1 kJ/mol (almost no solubility in water). This
demonstrates that, the solubility of the polymer decrease as the crosslink density of the
system increases because the polymers become more hydrophobic. The solubility of the
system is based on the assumption that „like dissolves like‟ principle. Hence, poly (DMAAm-
co-10%MABP) shows poor solubility in water due to a large energy difference in the
interaction between segments of the polymer and solvent molecules. In poly (DMAAm-co-
1%MABP) the segment-solvent interaction energy is closer to that of the interaction energies
between the segment-segment and solvent-solvent molecules, it is thus found to have a large

4.6. Conclusion
84
heat of hydration. To sum up the discussion, simply the hydrophobic polymers do not
dissolve appreciable in water.
The results of the heat of hydrations are in excellent agreement with the swelling of
polymers. The gel that showed strong hydration exhibits strong swelling in water and
consequently in humid air. Therefore, we conclude that the gels, which swell to the factor of
1.36 in humid air (RH ≈ 92%), can swell 4.0 times in water.
4.6. Conclusion
The swelling of the surface-attached poly (alkylacrylamide) networks was studied
using optical waveguide spectroscopy. The results demonstrated that these gels swell
anisotropically perpendicular to the surface as described by Toomey et al. 122 The swelling
was greatly affected by the hydrophobicity of the polymer, i.e., PMAAm (αw ≈ 5.4) > PEAAm
(αw ≈ 4) > PDMAAm (αw ≈ 3.5) > PDEAAm (αw ≈ 1.7) > PPAAm (αw ≈ 1.3) >PBAAm (αw ≈
1.17). An increase of the carbon units at N-substitution increases the hydrophobicity of the
polymer and thereby decreases the swelling of the surface-attached network. When the
length of the alkyl substituent is larger than ethyl (CH3-CH2-) group then the attractive
inter-segment interactions or hydrophobic association between alkyl groups become
dominant, the polymer becomes insoluble in water, and thus exibits little or no swelling in
aqeuous medium. Evidently, before crosslinking hydrophobic polymers such as PDEAAm,
PPAAm and PBAAm were also insoluble in water.
The thermo-responsibility of the surface-attached poly (alkylacrylamides) was
investigated by measuring the swelling at different temperatures varying from 15°C to 50°C.
Poly (DEAAm-co-3%MABP), was found to be the only thermo-responsive polymer in this
series of poly (alkylacrylamides). It showed a transition in the swelling behavior of between
25°C and 37°C and the transition temperature of the polymer was found to be ≈ 30°C. At this
4.6. Conclusion
85
temperature, the interaction of polymer-polymer dominates over polymer-water
interactions. Consequently, the chains of the polymer network tend to collapse and therefore
the water molecules are expelled from the network that results for the poor swelling of the
network.
Humidity swelling of the surface-attached poly (alkylacrylamide) networks was
studied using optical waveguide spectroscopy. Saturated salt solutions were employed to
control the moisture in the air.152 The temperature of all measurements were maintained as
25°C and the relative humidity was measured using a humidity sensor near the measurement.
The results suggest that the polymers have the tendency to swell in humid air upto the factor
of 1.4. More precisely, they can retain up to 30% of water in the networks. The crosslink
density and the hydrophobicity of the networks are the two dominating factors that affect
the swelling behavior in humid air. A weakly crosslinked poly (DMAAm-co-1%MABP)
showed significant swelling in humid air to the factor of 1.36 (RH≈92%) and strongly
crosslinked poly (DMAAm-co-10%MABP) swells 1.18 times (RH≈92%). Similarly,
hydrophilic poly (MAAm-co-3% MABP) swells upto 1.4 times and hydrophobic poly
(BAAm-co-3%MABP) barely swells (1.08, RH≈92%).
More significantly, the water volume fraction of the swollen network and volume
fraction of water in the moisture reveal that hydrophilic and weakly crosslinked polymers
selectively adsorb water vapor from the air at all humidy levels. The driving force behind
such phenomena are the strong interactions of the polar amide groups present in the
polymers that tend to extract water vapor from the air and binds rather strongly.
The correlation of water and humidity swelling suggests that the swelling in humidity
is much smaller than in water. Usually, hydrophilic polymer coatings swell four or five times
stronger in water than in humid air. In contrast, hydrophobic polymers show unappreciable
4.6. Conclusion
86
swelling in both cases. The extent of swelling in humid air depends on the enthalpy of
vaporization from the film and the volume fraction of water in the air. The enthalpic
components contain enthalpy of hydration (obtained from calorimetric measurements), the
enthalpy of segment-segment and water-water interactions and the entropy contains the
entropy of mixing and the entropy of stretching (elastic energy). Thus, the numerical
correlation between swelling in water and humid air is not straightforward. However, the
general trend is that, if the polymer swell appreciably in humid air (e.g. Poly (DMAAm-co-
1%MABP)) then they swell strongly in water and vice-versa. However, the quantitative
prediction is still a problem and requires more thermodynamic parameters.

5.1. Theory and mechanism of protein adsorption
87
5. Adsorption of proteins on poly (alkylacrylamide) surfaces
The biocompatibility of synthetic materials that are utilized in medical applications is
determined by the adsorption of blood plasma proteins.163 As outlined in chapter 1, it is a
widely held view that the adsorbed protein catalyses, mediates, or moderates subsequent
biochemical reactions that ultimately control biocompatibility.164 Hence, it is apparent that a
quantitative understanding of how proteins arrive at and adsorb to biomaterial surfaces is
essential for the design of biomaterials for advanced medical devices.165
As a consequence, the aim of the investigation described in the following was to gain
a fundamental understanding of protein adsorption on biomaterial surfaces with the goal to
develop blood compatible coatings. This chapter first provides a summary of the theory and
molecular mechanism of protein adsorption on organic and inorganic surfaces, followed by
the description of competitive adsorption of proteins. Then, protein resistant surfaces are
discussed. Finally, the protein adsorption on coatings of a homologous series of poly
(alkylacrylamides) is presented.
5.1. Theory and mechanism of protein adsorption
Proteins are biological heteropolymers comprised of twenty naturally occurring L-α-
amino acids that are joined together by amide bonds.166 Most of the proteins contain both
ionizable hydrophilic and non-ionizable hydrophobic functional groups. These
functionalities are randomly distributed in aqueous medium, which renders amphiphilicity
to the proteins in solution.167 Thus, a protein has the unique ability to exhibit patches and
domains that have a good solubility in water as well as patches and domains that have a poor
solubility in water (Figure 5.1). Those hydrophobic patches of proteins are expelled from
water and thus amphiphilicity is ultimately responsible for the adsorption of proteins from
solution onto the surface of any material.167
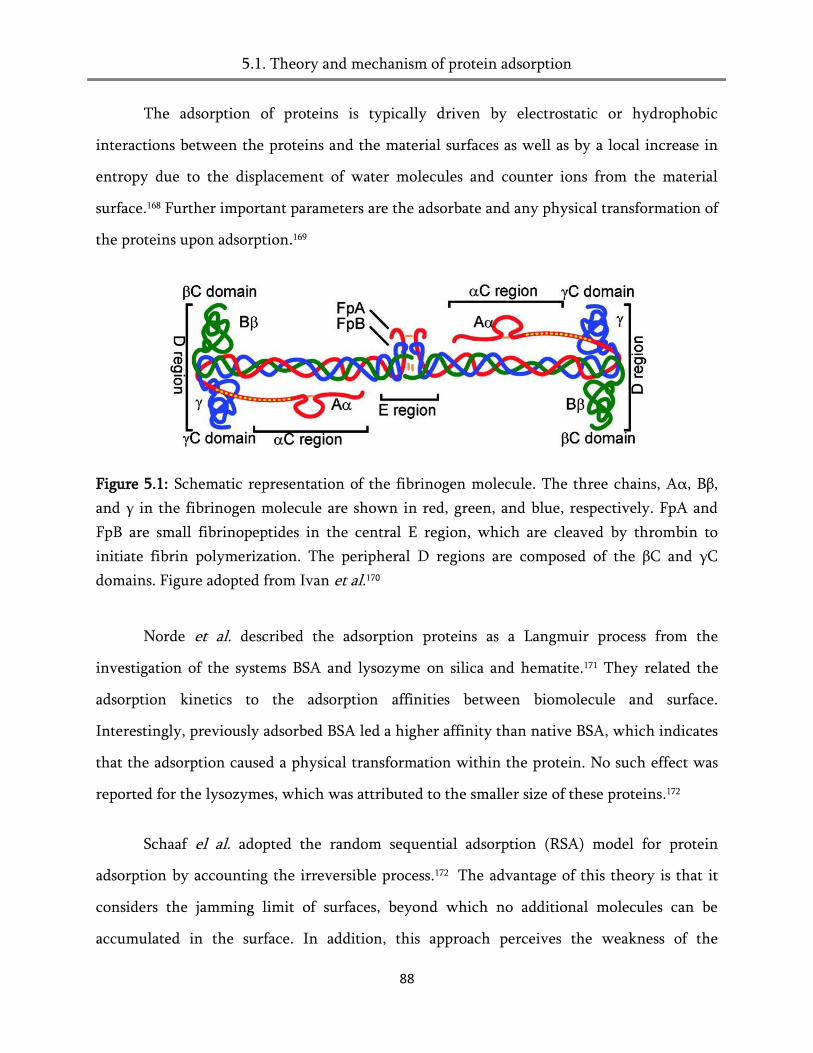
5.1. Theory and mechanism of protein adsorption
88
The adsorption of proteins is typically driven by electrostatic or hydrophobic
interactions between the proteins and the material surfaces as well as by a local increase in
entropy due to the displacement of water molecules and counter ions from the material
surface.168 Further important parameters are the adsorbate and any physical transformation of
the proteins upon adsorption.169
Figure 5.1: Schematic representation of the fibrinogen molecule. The three chains, Aα, Bβ,
and γ in the fibrinogen molecule are shown in red, green, and blue, respectively. FpA and
FpB are small fibrinopeptides in the central E region, which are cleaved by thrombin to
initiate fibrin polymerization. The peripheral D regions are composed of the βC and γC
domains. Figure adopted from Ivan et al.170
Norde et al. described the adsorption proteins as a Langmuir process from the
investigation of the systems BSA and lysozyme on silica and hematite.171 They related the
adsorption kinetics to the adsorption affinities between biomolecule and surface.
Interestingly, previously adsorbed BSA led a higher affinity than native BSA, which indicates
that the adsorption caused a physical transformation within the protein. No such effect was
reported for the lysozymes, which was attributed to the smaller size of these proteins.172
Schaaf el al. adopted the random sequential adsorption (RSA) model for protein
adsorption by accounting the irreversible process.172 The advantage of this theory is that it
considers the jamming limit of surfaces, beyond which no additional molecules can be
accumulated in the surface. In addition, this approach perceives the weakness of the

5.2. Competitive adsorption of ptoteins (Vroman effect)
89
Langmuir model, i.e. only one molecule can occupy one site of the adsorbate.
However, this is not appropriate for large protein molecules and this model failed to consider
the diffusion of protein molecules to the surface. Also, the work from Rebe et al. 173 showed
the adsorption of BSA diffuses over the acrylic polymers at the rate of 10-8cm2s-1. More details
on this topic can be found in recent reviews.174-176
Similarly, the distribution of protein molecules over the surface of the materials plays
a significant role in the adsorption kinetics of proteins.175 The adsorption of several systems
show an initial lag phase followed by auto acceleration and finally a phase of logarithmically
decreasing growth rate. This behavior is described as a fractal kinetics due to the non-
random distribution of the components in the surface region. The initial nucleation and
acceleration phases produce surface clusters of proteins on the surface, while in the later
phase leads to re-randomization.177
5.2. Competitive adsorption of proteins (Vroman effect)
Nearly three decades ago, Leo Vroman observed the preferential adsorption of
fibrinogen to silica and tantalum from blood plasma, ultimately called the „Vroman effect‟.178-
179 Figure 5.2 briefly describes the Vroman effect. A low molecular weight (LMW) protein
initially coveres the polymer surface, which is later displaced by a high molecular weight
(HMW) protein. This effect occur as it is more thermodynamically stable in nature when an
HMW protein replaces LMW proteins.180 However, the reverse sequence does not
occur, when HMW proteins covers the surface first, LMW proteins arriving later do not
displace the former (Figure 5.2).
Occasionally, the protein molecule at a given site of the surface (polymer surface)
may or may not be displaceable by a later arriving molecule of another protein, which
depends on how long time elapsed between the two events. The removability of the protein
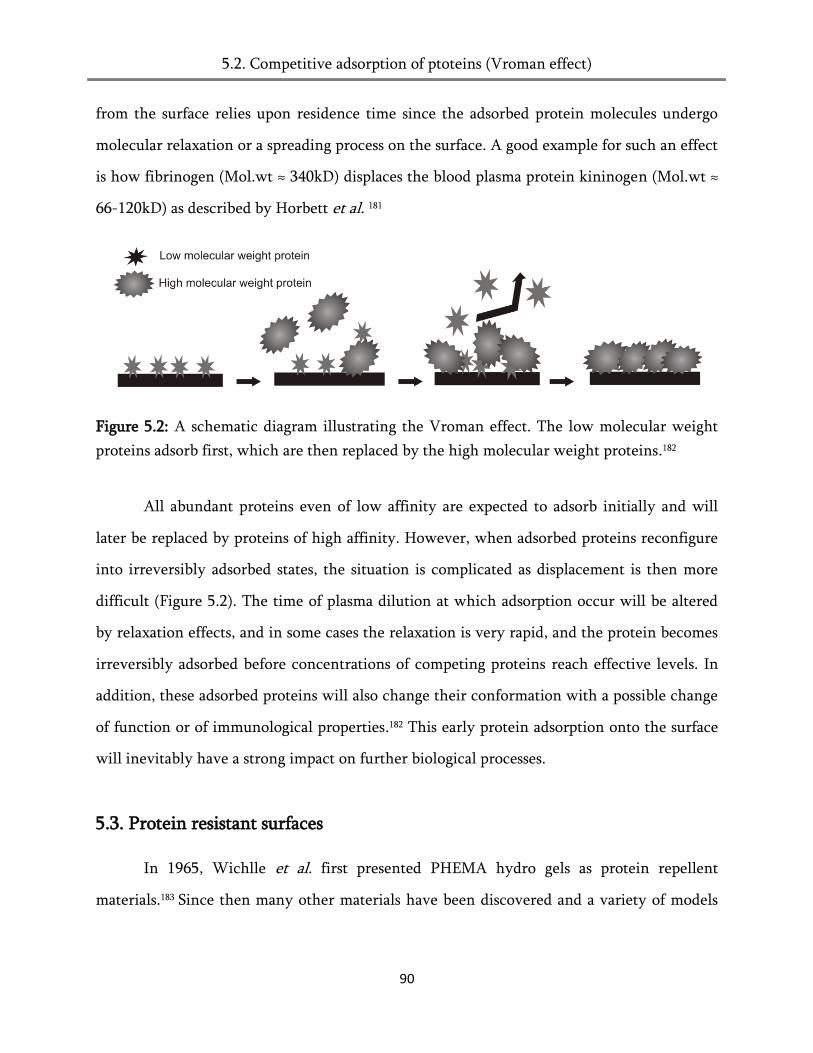
5.2. Competitive adsorption of ptoteins (Vroman effect)
90
from the surface relies upon residence time since the adsorbed protein molecules undergo
molecular relaxation or a spreading process on the surface. A good example for such an effect
is how fibrinogen (Mol.wt ≈ 340kD) displaces the blood plasma protein kininogen (Mol.wt ≈
66-120kD) as described by Horbett et al. 181
Figure 5.2: A schematic diagram illustrating the Vroman effect. The low molecular weight
proteins adsorb first, which are then replaced by the high molecular weight proteins.182
All abundant proteins even of low affinity are expected to adsorb initially and will
later be replaced by proteins of high affinity. However, when adsorbed proteins reconfigure
into irreversibly adsorbed states, the situation is complicated as displacement is then more
difficult (Figure 5.2). The time of plasma dilution at which adsorption occur will be altered
by relaxation effects, and in some cases the relaxation is very rapid, and the protein becomes
irreversibly adsorbed before concentrations of competing proteins reach effective levels. In
addition, these adsorbed proteins will also change their conformation with a possible change
of function or of immunological properties.182 This early protein adsorption onto the surface
will inevitably have a strong impact on further biological processes.
5.3. Protein resistant surfaces
In 1965, Wichlle et al. first presented PHEMA hydro gels as protein repellent
materials.183 Since then many other materials have been discovered and a variety of models
5.3. Protein resistant surfaces
91
have been proposed to explain this behavior. Some of these will be reviewed in the following
sections.
One of the classical models developed for the protein repellent surfaces is known as
mobility model.102 This model assumes that the protein requires certain time to adsorb onto
any given surfaces. According to this model, the surface-attached network and swollen
polymer chains posses high mobility and consequently the penetration of the protein
molecules on these surfaces are not possible i.e. it cannot penetrate inside the network.117
One can also name this as „wagging off‟ of the protein molecules cuased by the high chain
segment dynamics of the polymer networks.123
Perstin et al.184 studied the protein adsorption on oligoethyleneglycol self-assembled
monolayers (OEG-SAM) and proposed a model called „barrier model‟.184,123 This model is
based on the interaction of OEG-SAM‟s with water molecules, which depends on the
molecular confirmation of the SAM‟s and their ability to bind interfacial water molecules.
They reported that surfaces with high packing density are hydrophobic and the penetration
of proteins is facilitated through the hydrophobic interactions. When the surfaces are weakly
packed then the interface is mimic more water-like and hence the protein retains its natural
confirmation and moves freely from surfaces to medium withour adsorbing onto the surface.
Interestingly, Zhang et al.185 have studied the SAM‟s with terminal groups and found that the
large protein molecules can easily replace the loosely bound water molecules. While, tighly
bound water molecules are irreversible attached and consequently the interaction of protein-
polymer is restricted, therefore, the protein molecules are repelled from the surface.185,123
Jeon et al. and others demonstrated that poly (ethyleneoxide), (PEO) surfaces exhibit
protein repellency in solution.186 This behavior has been related to properties of these
molecules such as hydrophilicity, flexibility and the volume of exclusion exhibited by PEO
chains.187 These properties lead to a strong „steric repulsion‟ between PEO and proteins,
5.3. Protein resistant surfaces
92
which dominate over the weak van der Waals interactions. However, the chain length of
PEOs, and spacing on the surface are crucial parameters that determine the proteins.188-189
Ivanchenko et al. 190 have shown that PEOs with shorter chain length are more prone to
resist the proteins (chains length from 4 – 24). However, the question of controlling the
chain length of PEO is somewhat obscured due to the fact that they are not directly grafted
onto the surface but are side chains of the acrylate polymers.191
Wittemann et al. 192 developed a model for weak polyelectrolyte brushes considering
counter ion release from brushes. Accordingly, protein adsorption is facilitated at low ionic
strength of the buffer medium, while the penetration is hindered at high ionic strength.193
The chains of polyelectrolytes are stretched to the maximum in solution. At low ionic
strength, the osmotic pressure within the chains is relatively high, since most of the counter
ions are confined inside the brush layer. Hence, adsorption of protein tends to release
counter ions from brushes and thus lower the osmotic pressure within the system.117 At high
salt concentrations, ionic strength inside and outside of the polymer layer is identical and
this effect is vanished.130
Recently, a model was reported by Wörz et al. that is entirely based on
thermodynamic considerations.123 The interaction between the protein and polymer is
governed by the Gibbs free energy, which has enthalpic and entropic components. The
enthalpic term is stronger for hydrophobic or ionic interactions between surfaces and the
respective components of the proteins. Under this circumstance, the protein adsorption will
always take place. For neutral hydrogels no hydrophobic interactions are possible and the
enthalpic contribution is considerably less or zero (i.e., there is no interaction between
polymer and protein). Therefore, the interaction of entropy is governing the adsorption
process.130, 194 The details of this model along with size exclusion effect (the large protein
molecules are able to penetrate inside the small mesh of the network) will be investigated in
the following sections using homologous series of surface-attached poly (alkylacrylamides).

5.3. Protein adsorption on surface-attached poly (alkylacrylamide) networks
93
5.4. Protein adsorption on surface-attached poly (alkylacrylamides) networks
Surface Plasmon Resonance spectroscopy (SPR) was used to study the protein
adsorption behavior of surface-attached poly (alkylacrylamide) networks. The experimental
details of SPR and sample preparation are described in Chapter 10.2 and 10.3. Briefly, a thin
film of polymer was spin or dip coated onto a gold substrate, and the dry film thickness was
measured in a nitrogen atmosphere. A subsequent measurement in PBS buffer yields a
swollen layer thickness. The kinetics measurements of adsorption process were performed at
an angle just below the resonance angle determined for the swollen layer. All of these
experiments were performed at 37°C and a typical result is shown in Figure 5.3.
Figure 5.4 depicts the SPR kinetic measurement obtained from PMAAm and PBAAm
coatings. The measurement was started with PBS buffer until a stable base line was achieved,
and then the buffer was replaced with a fibrinogen solution. The hydrophobic polymer
PBAAm, which does not swell in PBS buffer and showed an immediate rise in the reflected
intensity upon introduction of the fibrinogen solution. The measurement was continued
until a plateau of the reflectivity was reached which took approximately 30-40 min. Then
the protein medium was again substituted with PBS buffer to wash away any non-adsorbed
proteins (about 15 min). After the washing step, the reflected intensity did not return to the
original level of the initial measurement in PBS medium (Figure 5.4, black line), indicating
that a thin layer of protein was adsorbed during exposure to the fibrinogen solution.
Similarly, the experiment was performed on hydrophilic polymer PMAAm. Interestingly, no
change in the reflectivity was noticed upon introduction of Fg solution (Figure 5.4, gray line)
indicating that no adsorption of Fg had taken place. The SPR reflectivity scans of surface-
attached PBAAm and PMAAm before and after the protein adsorption are presented in
Figure 5.5 and Figure 5.6, respectively.
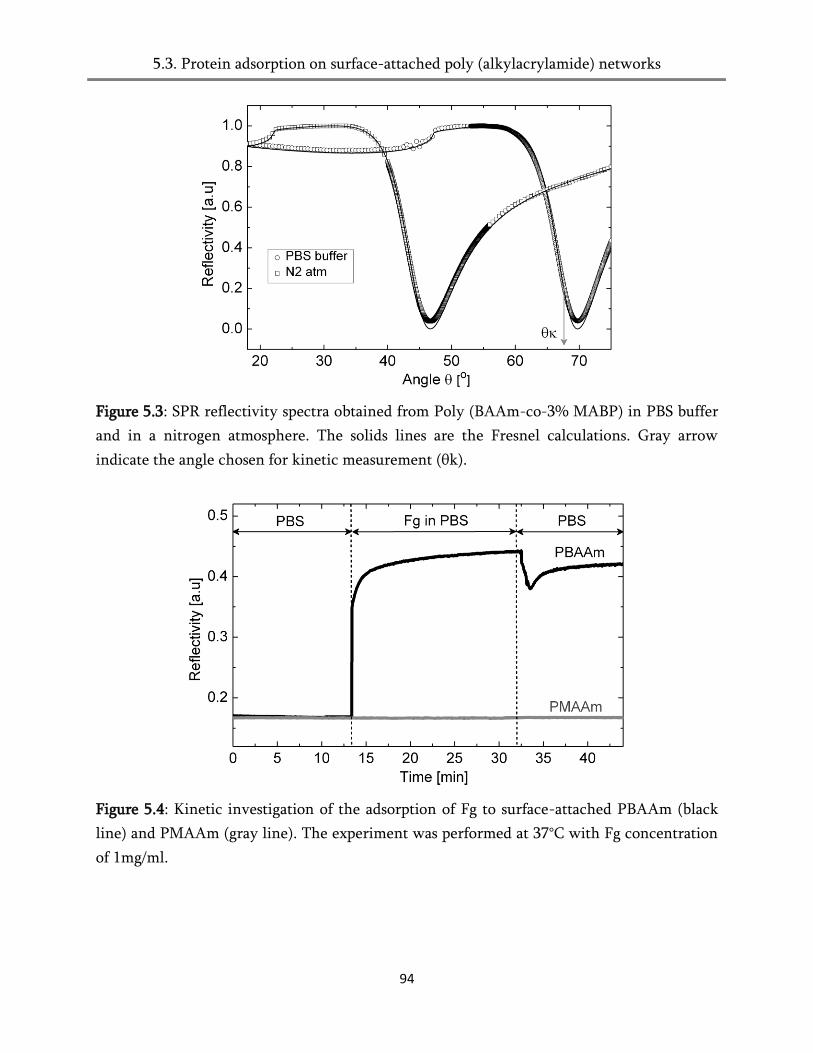
5.3. Protein adsorption on surface-attached poly (alkylacrylamide) networks
94
Figure 5.3: SPR reflectivity spectra obtained from Poly (BAAm-co-3% MABP) in PBS buffer
and in a nitrogen atmosphere. The solids lines are the Fresnel calculations. Gray arrow
indicate the angle chosen for kinetic measurement (θk).
Figure 5.4: Kinetic investigation of the adsorption of Fg to surface-attached PBAAm (black
line) and PMAAm (gray line). The experiment was performed at 37°C with Fg concentration
of 1mg/ml.
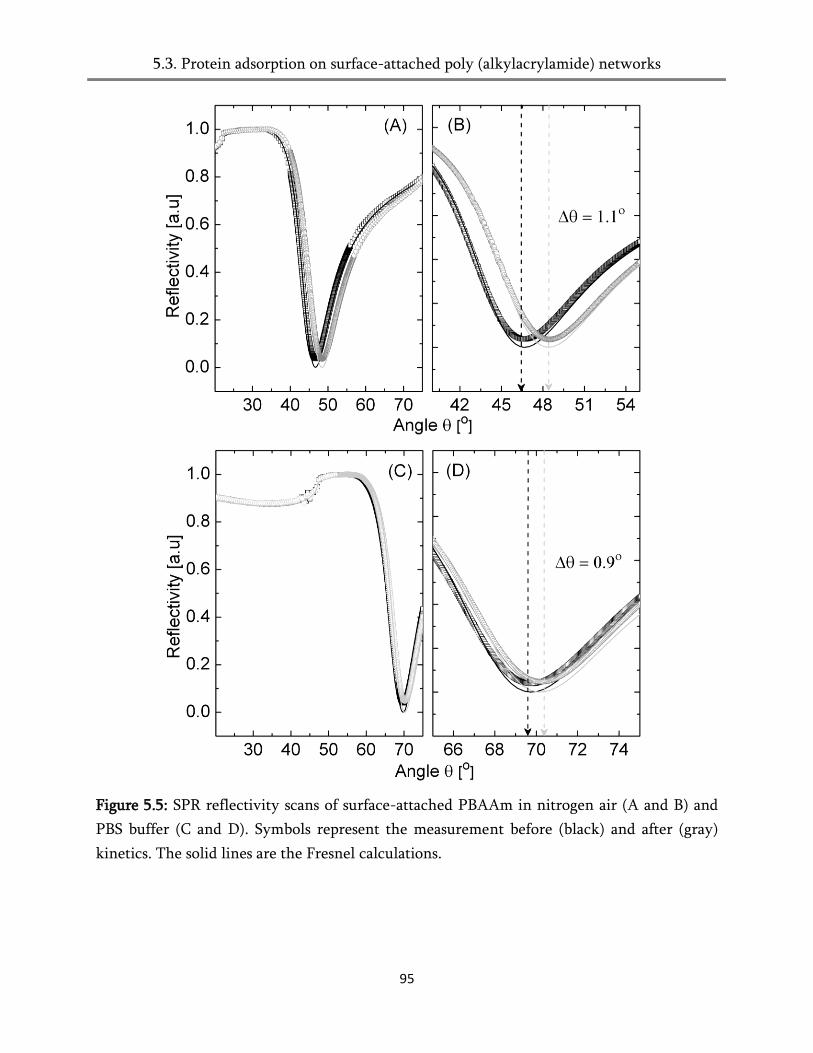
5.3. Protein adsorption on surface-attached poly (alkylacrylamide) networks
95
Figure 5.5: SPR reflectivity scans of surface-attached PBAAm in nitrogen air (A and B) and
PBS buffer (C and D). Symbols represent the measurement before (black) and after (gray)
kinetics. The solid lines are the Fresnel calculations.
5.3. Protein adsorption on surface-attached poly (alkylacrylamide) networks
96
Figure 5.6: SPR reflectivity scans of surface-attached PMAAm in nitrogen air (A and B) and
PBS buffer (C and D). Symbols represent the measurement before (black) and after (gray)
kinetics and the solid lines are the Fresnel calculations.
The SPR reflectivity scans of the hydrophobic PBAAm implies a significant difference
in the resonance angle i.e. angle θm is shifted to ≈1.1° (Δθ ≈1.1°). Additionally, the calculated

5.3. Protein adsorption on surface-attached poly (alkylacrylamide) networks
97
film thickness of the PBAAm using Freznel formalism was found to be 55 and 59 nm before
and after the Fg kinetics, respectively. The difference in the film thicknesses can be
attributed to the rise in the reflectivity upon exposure to Fg solution during the kinetics
experiment (and the ad-layer of Fg is approx. 4 nm). The hydrophilic PMAAm showed no
change in the resonance angle of the reflectivity after the Fg kinetics experiment i.e. Δθ ≈ 0°.
This would suggest that no protein is adsorbed on the surface upon protein exposure. In
addition, the calculated layer thickness of PMAAm coatings before and after the experiment
is identical (29 nm) and no ad-layer of fibrinogen has formed (Figure 5.6).
Figure 5.7: Fibrinogen ad-layer thickness on surface-attached poly (alkyl acrylamide)
networks. The film thickness was measured at physiological temperature (37°C) in a nitrogen
atmosphere after protein adsorption.
The results of the fibrinogen adsorption experiments on all other poly (alkyl
acrylamides) are presented in Figure 5.7. Layers of the hydrophobic polymers PDEAAm,
PPAAm and PBAAm (Z= 3,4a, and 4b) show adsorbed fibrinogen layer of approx. 3-4 nm.
All, hydrophilic and water swellable polymer layers (Z = 1, 2a and 2b) such as PMAAm,
5.3. Protein adsorption on surface-attached poly (alkylacrylamide) networks
98
PEAAm, and PDMAAm were found to be protein repellent and thus the ad-layer thickness is
zero.
Similarly, the adsorptions of other plasma proteins with different sizes are examined
on surface-attached poly (alkylacrylamide) networks. The molecular weight and size of the
various plasma proteins are summarized in Table 5.1. Here, two sets of experiments were
performed. First, the adsorption of proteins was examined individually on surfaces where the
experiment was started with water or buffer medium. After 5-10 minutes, the water was
replaced by a protein solution and a plateau was reached after approx. 20-30 minutes. Again,
the protein solution was substituted using buffer or water in order to remove any non-
adsorbed proteins. Typical SPR kinetics obtained from PBAAm and PDMAAm are presented
in Figure 5.8.
Table 5.1: Size and molecular weight of the plasma proteins used in the experiment.195-201
In the second experiment, the adsorption of various proteins was investigated
simultaneously by introducing them sequentially (aka. cocktail experiment). Similar to the
above experiment, the experiment was started with water until a stable base line was
achieved, then the water was replaced with a different protein solution one after another and
waited for approx. 20-30 minute until a plateau was reached. The protein solution was then
Protein Mol.wt (kDa) Rg (nm)
Fibronectin195-196 530 15,3± 0,3
Fibrinogen197-198 340-380 16,9
Vitronectin199 65-70 3 ± 0,6
BSA200 137 2,5
vonWillebrand factor201 500-387 16 (globular)
5.3. Protein adsorption on surface-attached poly (alkylacrylamide) networks
99
substituted with water to wash away any non-adsorbed proteins (approx. 15 min). Figure 5.9
depicts the typical SPR kinetic measurement obtained from PBAAm and PDMAAm coatings.
Figure 5.8: SPR Kinetics of the adsorption of the plasma proteins Von willebrand factor
(vWF), Fibrinogen (Fg), Collagen, and Fibronectin (Fn) on surface attached PBAAm (A) and
PDMAAm (B) coatings. The experiment was performed at 37°C and with the protein
concentration of 1mg/ml in corresponding buffer/water medium.
5.4.1. Determination of mesh size and size exclusion effect
100
Figure 5.9: SPR Kinetics of the adsorption of the plasma proteins Von willebrand factor
(vWF), Fibrinogen (Fg), Collagen, and Fibronectin (Fn) on surface attached PBAAm and
PDMAAm coatings. The experiment was performed at 37°C with a protein concentration of
1mg/ml in corresponding buffer/water medium.
As can be seen in Figures 5.8 and 5.9, the hydrophilic PDMAAm does not show any
change in reflectivity upon exposure to different protein solutions. While, the hydrophobic
PBAAm exhibit a sharp rise in the reflectivity upon introduction of protein solution and did
5.4.1. Determination of mesh size and size exclusion effect
101
not return to the original level of the initial reflectivity as in water. This indicates that it had
strong adsorption of protein during the course of the kinetics. The calculated ad-layer of
proteins is presented in Table 5.2.
Table 5.2: Ad-layer of various proteins on PBAAm and PDMAAm coatings.
Polymer Collagen VWF Fn Fg Cocktail†
PBAAm 3.17 nm 4.13 nm 3.2 nm 4.1 nm 6.5 nm
PDMAAm --* --* --* --* --*
†Result obtained from Figure 5.10. *Ad-layer ≈ 0 nm.
The results are in agreement with that of the Fg analysis in which hydrophobic
PBAAm had a protein ad-layer of 3-6 nm and no ad-layer of protein was formed in the case
of the hydrophilic PDMAAm coatings. Obviously, the protein repellent character of the
latter coatings can be directly related to their swelling. This result supports the above-
mentioned model of entropic shielding.
5.4.1. Determination of mesh size and the size exclusion effect
The mesh size of the network plays a crucial role in many bio-medical applications
especially in the field of drug delivery.202 Here, the transport mechanism of drugs through
any swollen polymeric network is mainly controlled by the space available between two
crosslinks known as pore or mesh size.203 A crucial parameter that is frequently employed in
describing the size of the pores is the correlation length, ξ, which is defined as the linear
distance between two adjacent cross-links, and can be calculated using the following
equation:
𝜉 = 𝛼𝑠(𝑟02)1/2 (Eq.5.1)
5.4.1. Determination of mesh size and size exclusion effect
102
Here, (𝑟02)1/2 is the root-mean-square, unperturbed, end-to-end distance of the
polymer chains between two neighboring cross-links and αs is the elongation ratio and it can
be related to the swollen polymer volume fraction, φ2, as
𝛼𝑠 = 𝜑2 −1/3 (For isotropic swelling) (Eq.5.2)
𝛼𝑠 = 𝜑2 −1 (For anisotropic swelling) (Eq.5.3)
The unperturbed end-to-end distance of the polymer chain between two adjacent
crosslinks can be calculated by using Eq.5.4
(𝑟02)1/2 = 𝑙(𝐶𝑛𝑛)1/2 (Eq.5.4)
𝑛 = 2𝑀𝑐
𝑀𝑟 (Eq.5.5)
Here, 𝐶𝑛 is the Flory characteristic ratio of the polymer, 𝑙 is the length of the bond
along the polymeric backbone (𝑙 = 1.25Å for PAAm‟s) and 𝑛 is the number of links/chain (C-
C bonds) between two crosslinks and the pre factor 2 comes from the C-C bonding of the
repeating unit (for acryl and vinyl polymers it is 2).204-205 Finally, 𝑀𝑐 is the number average
molecular weight between two cross-links and 𝑀𝑟 is the molecular weight of the repeat
unit.206
𝑀𝐶 = 𝑁𝐶𝑀𝑟 (Eq.5.6)
By combining the equations from 5.1 to 5.6, the correlation distance between two
adjacent crosslinks for anisotropically swollen network can be determined by the following
equation 207
𝜉 = (𝜑2)−1 2𝐶𝑛𝑀𝑐
𝑀𝑟
1/2
𝑙 (Eq.5.7)
The calculated mesh size of the surface-attached poly (alkyl acrylamide) networks
using the above equation in a swollen state is shown in Table 5.3. It was found that
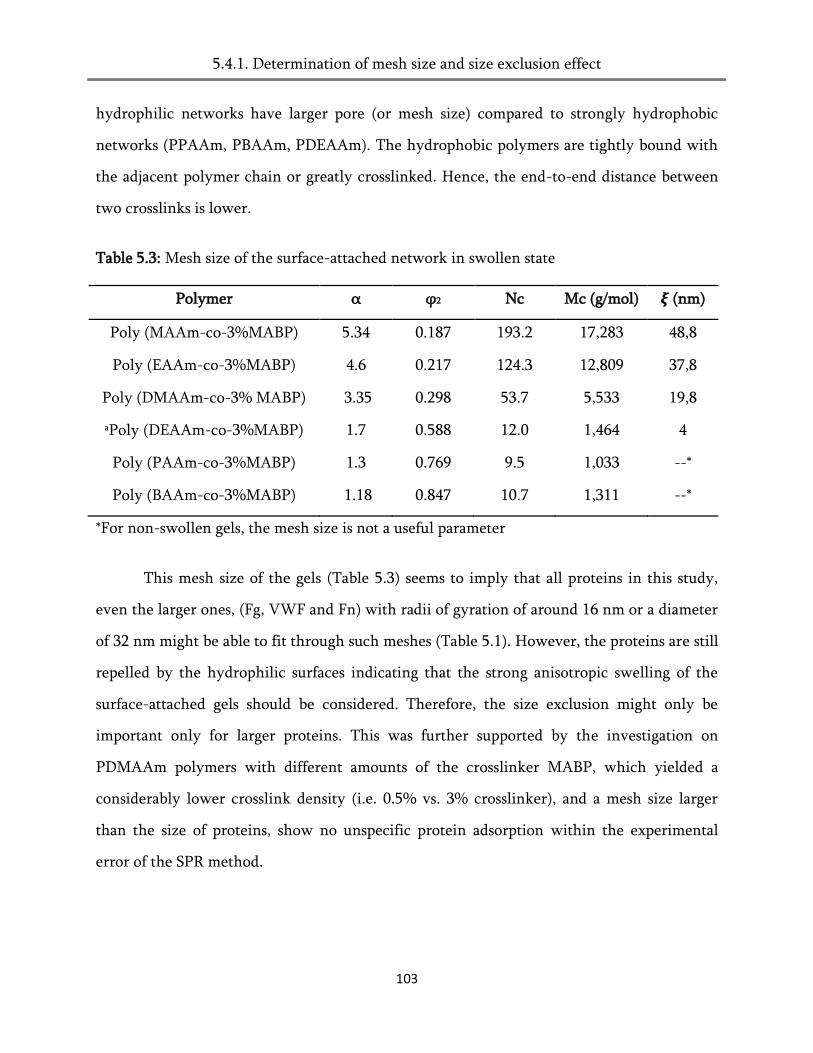
5.4.1. Determination of mesh size and size exclusion effect
103
hydrophilic networks have larger pore (or mesh size) compared to strongly hydrophobic
networks (PPAAm, PBAAm, PDEAAm). The hydrophobic polymers are tightly bound with
the adjacent polymer chain or greatly crosslinked. Hence, the end-to-end distance between
two crosslinks is lower.
Table 5.3: Mesh size of the surface-attached network in swollen state
Polymer α φ2 Nc Mc (g/mol) 𝝃 (nm)
Poly (MAAm-co-3%MABP) 5.34 0.187 193.2 17,283 48,8
Poly (EAAm-co-3%MABP) 4.6 0.217 124.3 12,809 37,8
Poly (DMAAm-co-3% MABP) 3.35 0.298 53.7 5,533 19,8
aPoly (DEAAm-co-3%MABP) 1.7 0.588 12.0 1,464 4
Poly (PAAm-co-3%MABP) 1.3 0.769 9.5 1,033 --*
Poly (BAAm-co-3%MABP) 1.18 0.847 10.7 1,311 --*
*For non-swollen gels, the mesh size is not a useful parameter
This mesh size of the gels (Table 5.3) seems to imply that all proteins in this study,
even the larger ones, (Fg, VWF and Fn) with radii of gyration of around 16 nm or a diameter
of 32 nm might be able to fit through such meshes (Table 5.1). However, the proteins are still
repelled by the hydrophilic surfaces indicating that the strong anisotropic swelling of the
surface-attached gels should be considered. Therefore, the size exclusion might only be
important only for larger proteins. This was further supported by the investigation on
PDMAAm polymers with different amounts of the crosslinker MABP, which yielded a
considerably lower crosslink density (i.e. 0.5% vs. 3% crosslinker), and a mesh size larger
than the size of proteins, show no unspecific protein adsorption within the experimental
error of the SPR method.
5.4.2. Entropic shielding
104
5.4.2. Entropic shielding
To explain of the observed differences within the homologous series of the surface-
attached poly (alkylacrylamide) networks, one needs to view the Gibbs free energy equation
for the overall adsorption process.208
∆Gads = ∆Hads – T (∆Sads) (Eq.5.8)
When hydrophobic patches of the protein interact with a hydrophobic polymer
attached to the substrate surface, the Gibbs free energy of adsorption (∆Gads) is dominated by
the enthalpy of adsorption (∆Hads) due to strong interactions with each other. The Gibbs free
energy of adsorption ∆Gads becomes negative and thus the adsorption of proteins is
thermodynamically favorable.209
The situation, however, is quite different for surface-attached hydrogels such as
PMAAm, PEAAm and PDMAAm. In the swollen state, these polymers do not show
significant interaction between proteins and polymers, i.e. the enthalpy of adsorption is very
small or even approaching zero (∆Hads = 0). Hence, the contribution of the entropic
component (∆Sads) is the crucial parameter, which determines the overall Gibbs free energy
of adsorption (∆Gads). ∆Sads contains two important factors, the entropy of mixing and the
entropy of configuration. The entropy of mixing (∆Smix) represents the uniform distribution
of molecules present in the system and is relatively low for most protein adsorption. The
entropy of configuration (∆Sconf) represents the significant chain stretching/ contraction of
polymers.123
∆Sads = - ∆Smix + ∆Sconf (Eq.5.9)
The surface-attachment of the polymer networks renders these systems to essentially
two-dimensions. Swelling is only possible perpendicular to the surface.122 It has been shown

5.4.2. Entropic shielding
105
that this leads to a strong stretching of molecules away from the surface, until an equilibrium
between the segment/ segment interactions (the osmotic pressure) and the energy required
for the elastic deformation of polymer chains is achieved.129 The extent of the swelling (and
chain stretching) can be described by the Flory-Rehner theory, provided that the
dimensionality of the system is taken into account (see Chapter 4.2). If now protein
molecules would diffuse into the layer this would require an even stronger swelling of the
network chains. Such an additional stretching reduces the chains entropy. As this entropy
loss is not compensated by any appropriate enthalpic gain, the Gibbs free energy of the
process becomes positive and protein penetration (or diffusion of any other macromolecule)
into the layers becomes energetically unfavorable.129, 210-212 One might call such a prevention
of unspecific protein adsorption caused by the entropic situation in the polymer film as
“entropic shielding” (Figure 5.10).
Figure 5.10: Schematic diagram illustrating the model entropic shielding. The penetration of
protein into the swollen network leads to a strong stretching of the chains. These chains,
however, are already stretched due to the swelling. Further stretching is entropically
unfavorable and hence, proteins are repelled.117,123, 130
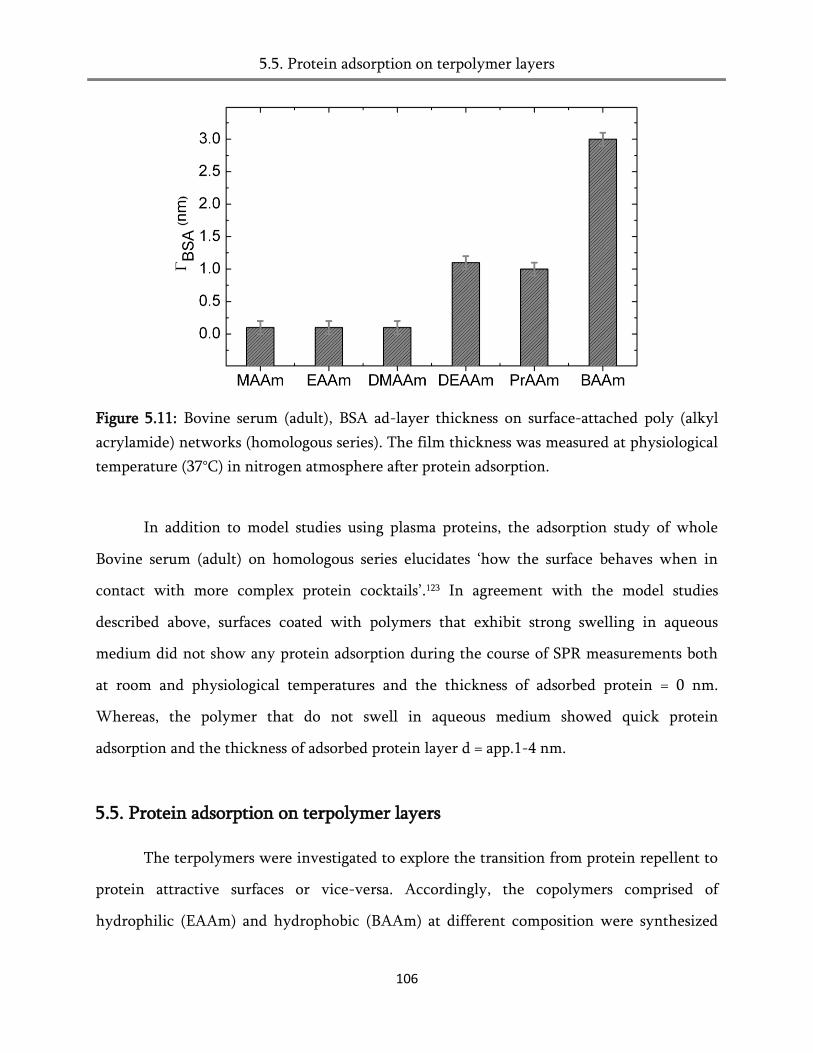
5.5. Protein adsorption on terpolymer layers
106
Figure 5.11: Bovine serum (adult), BSA ad-layer thickness on surface-attached poly (alkyl
acrylamide) networks (homologous series). The film thickness was measured at physiological
temperature (37°C) in nitrogen atmosphere after protein adsorption.
In addition to model studies using plasma proteins, the adsorption study of whole
Bovine serum (adult) on homologous series elucidates „how the surface behaves when in
contact with more complex protein cocktails‟.123 In agreement with the model studies
described above, surfaces coated with polymers that exhibit strong swelling in aqueous
medium did not show any protein adsorption during the course of SPR measurements both
at room and physiological temperatures and the thickness of adsorbed protein = 0 nm.
Whereas, the polymer that do not swell in aqueous medium showed quick protein
adsorption and the thickness of adsorbed protein layer d = app.1-4 nm.
5.5. Protein adsorption on terpolymer layers
The terpolymers were investigated to explore the transition from protein repellent to
protein attractive surfaces or vice-versa. Accordingly, the copolymers comprised of
hydrophilic (EAAm) and hydrophobic (BAAm) at different composition were synthesized

5.5. Protein adsorption on terpolymer layers
107
and studied using the fibrinogen (Fg) as a model protein. Figure 5.12 demonstrates the SPR
kinetics of Fg obtained from hydrophobic poly (25%EAAm-co-75%BAAm-co-3%MABP)
and hydrophilic poly (75%EAAm-co-25%BAAm-co-3%MABP) coatings. As can be seen, the
polymer with a high content of BAAm (75%), which does not swell in water showed a quick
rise in reflectivity upon introduction of fibrinogen solution; indicating that a quick
adsorption of protein has taken place. The polymer with a low amount of PBAAm (25%) or
high content of EAAm (75%) showed no change in the reflectivity upon exposure to
fibrinogen solution (Figure 5.11). The calculated swelling and the ad-layer of Fg on surface-
attached tri-copolymer layers are summarized in Table 5.4.
Figure 5.12: SPR Kinetic measurement obtained from surface-attached poly (25%EAAm-co-
75%BAAm-co-3%MABP), (Black line) and poly (75%EAAm-co-25%BAAm-co-3%MABP),
(Gray line). All experiments were performed at 37°C and with the fibrinogen concentration
of 1mg/ml.
The argument from the previous section can be applied to explain the observed
difference between the copolymer layers. The hydrophobic polymer (with 75% BAAm)
adsorbs protein through a strong hydrophobic-hydrophobic interaction between protein and
5.6. Protein repellency of PDMAAm gels
108
polymer. The Gibbs free energy of the process is dominated by the enthalpy of adsorption
and thus the adsorption is thermodynamically allowed.
Table 5.4: Correlation of swelling ratio and fibrinogen adsorption on trip copolymers
Polymer α(dwet/ddry) ΓFg (nm)
Poly (BAAm-co-3%MABP) 1.0 4 ± 0.2
Poly (25%EAAm-co-75%BAAm-co-3%MABP) 1.05 2.6 ± 0.2
Poly (50%EAAm-co-50%BAAm-co-3%MABP) 1.2 1 ± 0.5
Poly (75%EAAm-co-25%BAAm-co-3%MABP) 2.86 0 ± 0.2
Poly (EAAm-co-3%MABP) 4 0 ± 0.2
The polymer with 75% EAAm renders the system more hydrophilic, as a consequence
it exhibit a strong swelling in water and therefore, the enthalpic interaction with is almost
closer to zero. As a result, the Gibbs free energy of adsorption is governed by the entropic
term, where the penetration of Fg is thermodynamically forbidden by the combined effect of
entropic shielding and size exclusion (refer sections 5.4.1 and 5.4.2).
5.6. Protein repellency of PDMAAm gels
The transport mechanisms of biomacromolecules (typically proteins) through swollen
polymeric networks have been discussed in the previous sections. Topological barriers such
as the number of crosslinks (junctions), branches, and crystallography in a network will have
an influence on the values of the diffusion coefficient. For example, it was shown that the
drug diffusion coefficient through hydrogels decreases as the crosslink density increases and
as the equilibrium degree of swelling decreases.213
Therefore, the motivation of this particular section was to understand how the
crosslink density and mesh size of surface-attached gels can affect the protein diffusion in
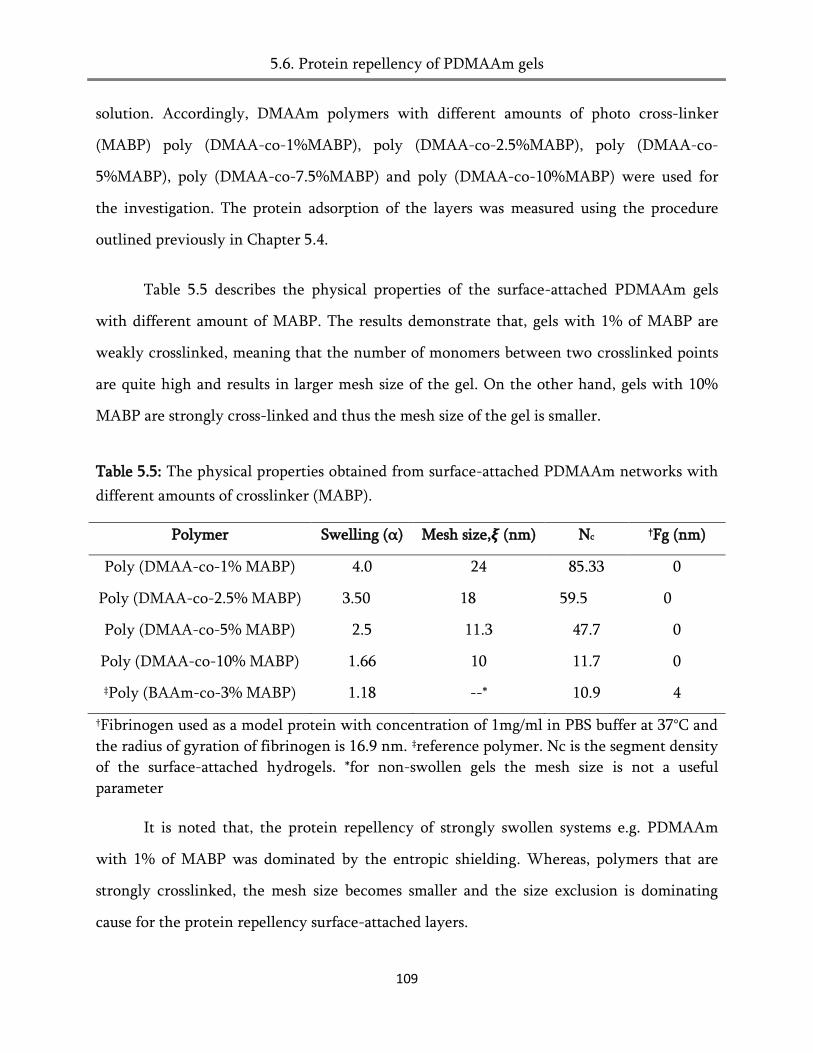
5.6. Protein repellency of PDMAAm gels
109
solution. Accordingly, DMAAm polymers with different amounts of photo cross-linker
(MABP) poly (DMAA-co-1%MABP), poly (DMAA-co-2.5%MABP), poly (DMAA-co-
5%MABP), poly (DMAA-co-7.5%MABP) and poly (DMAA-co-10%MABP) were used for
the investigation. The protein adsorption of the layers was measured using the procedure
outlined previously in Chapter 5.4.
Table 5.5 describes the physical properties of the surface-attached PDMAAm gels
with different amount of MABP. The results demonstrate that, gels with 1% of MABP are
weakly crosslinked, meaning that the number of monomers between two crosslinked points
are quite high and results in larger mesh size of the gel. On the other hand, gels with 10%
MABP are strongly cross-linked and thus the mesh size of the gel is smaller.
Table 5.5: The physical properties obtained from surface-attached PDMAAm networks with
different amounts of crosslinker (MABP).
Polymer Swelling (α) Mesh size,𝝃 (nm) Nc †Fg (nm)
Poly (DMAA-co-1% MABP) 4.0 24 85.33 0
Poly (DMAA-co-2.5% MABP) 3.50 18 59.5 0
Poly (DMAA-co-5% MABP) 2.5 11.3 47.7 0
Poly (DMAA-co-10% MABP) 1.66 10 11.7 0
‡Poly (BAAm-co-3% MABP) 1.18 --* 10.9 4
†Fibrinogen used as a model protein with concentration of 1mg/ml in PBS buffer at 37°C and
the radius of gyration of fibrinogen is 16.9 nm. ‡reference polymer. Nc is the segment density
of the surface-attached hydrogels. *for non-swollen gels the mesh size is not a useful
parameter
It is noted that, the protein repellency of strongly swollen systems e.g. PDMAAm
with 1% of MABP was dominated by the entropic shielding. Whereas, polymers that are
strongly crosslinked, the mesh size becomes smaller and the size exclusion is dominating
cause for the protein repellency surface-attached layers.

5.7. Adsorption of lipids
110
5.7. Adsorption of lipids
The motivation of this section was to interrogate the lipids adsorption of surface-
attached gels, especially onto protein repellent hydrogels. Accordingly, two distinct polymers
with different swelling properties were selected from homologous series as a model system.
One being neutral hydrophilic, water swellable poly (DMAAm-co-3% MABP), and the
other, neutral hydrophobic, not-swellable poly (BAAm-co-3% MABP). In addition, a
negatively charged poly (MAAc-co-10%SSAz), PMAAc was also used as a control, which
showed increased affinity to lipids (reference experiment). The phospholipid was chosen as a
model system for the investigation. It is constituted with the derivatives of phosphatic acid in
which the phosphate group is esterified with a choline residue, L-α-Phosphatidylcholine.
The chemical structure of the phospolipis is depicted in Figure 5.13.
CH3 N+
CH3
CH3
CH2 CH2 O P
OH
O
O CH2
CH O
CH2 O C
C
O
O
R
R
Figure 5.13: General structure of L-α-Phosphatidylcholine.215
Briefly, lipids are large organic ions that contain a single-charged entity at one end of
a long aliphatic chain or an amphiphilic molecules.214 These molecules are distinct due to
their aliphatic moieties, which will not interact with water yet tend to form hydrophobic
interactions with one another. Due to entropic driving forces, the aliphatic portions exclude
water and form van der Waals bonds, while the charged portions form hydrogen bonds and
electrostatic interaction with the aqueous medium.215 The effect of these different forces on
the structure of the solute, as well as its interaction with the solvent, is purely concentration
dependent. Thus, the concentration at which the change from a solubilized monomeric form
----------------------------------
Lipid adsorption experiments were performed by Mrs. Lisa Turnhoff, CPI-IMTEK, University of Freiburg,
Freiburg, Germany.

5.7. Adsorption of lipids
111
to a micelle occurs at is called the critical micelle concentration (Figure 5.14). Further basics
of lipids can be found in standard textbooks.214-215
The surface plasmon resonance spectroscopy was employed to study the lipid
adsorption on surface-attached polymer networks. As mentioned earlier, a thin film of
approximately 30 nm was generated on gold substrates and the layer thickness was measured
in nitrogen atmosphere and PBS buffer. The difference in layer thickness of pre- and post-
injection of lipid solution will reveal ad-layer thickness of lipid on polymer surface.
Figure 5.14: Arrangement of large organic ions into micelles. The polar head groups form the
outer hydrophilic surface that protects the hydrophobic aliphatic chains from having to
interact with water.215
Figure 5.15: Ad-layer thickness of L-α-Phosphatidylcholine (black column) and fibrinogen
adsorption (Gray column) on surface-attached polymer networks. Where, DMAAm
represents the poly (DMAAm-co-3%MABP), BAAm represents the poly (BAAm-co-3%
5.7. Adsorption of lipids
112
MABP) and MAAc represents the poly (MAAc-co-10%SSAz).The concentration 1mg/ml of
PC and Fg in PBS buffer were used for all the measurements at 37°C.
Figure 5.15 depicts the ad-layer thickness of L-α-Phosphatidylcholine on surface-
attached networks. The results demonstrate that hydrophobic PBAAm and negatively
charged PMAAc show lipid adsorption and consequently the ad-layer thickness of lipid
measured to be 4.6 nm (PBAAm) and 1.6 nm (PMAAc), respectively. At neutral pH, PBAAm
does not swell in PBS buffer. As a result, lipids adsorb through a strong hydrophobic
interaction, which is only the enthalpy of adsorption and simply dominates the Gibbs free
energy of adsorption and thus the adsorption is thermodynamically favorable. The PMAAc is
a weak polyelectrolyte and the extent of swelling is based on the pH of the medium.
Subsequently, the adsorption of lipids are depends on the ionic strength of the surrounding
medium.
Recently, Mossmann130 and Wörz et al. 117 revealed that poly acrylic acid (PAAc) is
susceptible to salt concentration. For example, PAAc show fibrinogen adsorbs at 0.2 mol/l of
NaCl, while repelling at 0.05mol/l NaCl solution. This is because at low ionic strength the
diffusion of fibrinogen into the PAAc network tends to release counterions, which enhances
the entropy of the system. In addition, fibrinogen acts like a multivalent counterion for
PAAc chains and both of them carry same negative charges. Hence, the change in entropy is
outrivaled by electrostatic repulsion and thus the fibrinogen adsorption is acquiesced. At
high ionic strength, the release of counter ions does not increase entropy due the same ionic
strength inside and outside of the PAAc network. Therefore, adsorption of fibrinogen is
prohibited.117,123
In our case, phospolipid (+ve) and PMAAc (-ve) are oppositely charged, hence the one
possible factor that could trigger lipid adsorption is ionic interaction. However, the
adsorption process is susceptible to the concentration of lipid (1mg/ml in PBS buffer) and salt
concentration (158 mM of NaCl). At a given situation PMAAc adsorb lipid through

5.7. Adsorption of lipids
113
electrostatic interactions and subsequently the measured layer is approx. 1.6 nm. The
adsorption is comparatively lower than PBAAm, which may be due to the charge
distribution around PMAAc chains, and it is weakly charged at neutral pH than at high pH.
Hence, the system is less charged and thus few molecules can interact with the chains of the
PMAAc and results in the low ad-layer thickness.
Hydrophilic PDMAAm does not show any adsorption during the course of lipid
kinetics. PDMAAm is a neutral polymer that shows strong swelling in PBS buffer and
consequently the chains of the polymer are surrounded with water molecules. In this case,
the enthalpy of adsorption (hydrophobic interaction) approaches zero and electrostatic
attraction is imperceptible due to the fact that the polymer does not carry any charge at pH
of 7.4 (for PBS buffer). It is conceivable that at higher salt concentration, polymer chains
tend to collapse and thus the adsorption may be possible. One should also consider the
energy required to expel bound water molecules larger than the energy required for lipid
interaction with PDMAAm chains.
Surface-attached PMAAc pre-adsorbed with phospolipid showed minor increment in
the reflectivity upon introduction of fibrinogen solution. The increased layer thickness was
approx. 0.9 nm, indicating that a larger fibrinogen molecule initially replaces the smaller
lipids before forming a monolayer on top of the lipid. However, the overall thickness
including lipid is approx. 4 nm (dlipid = 3 nm and dFg = 0.9 nm).
The preliminary results obtained from lipid adsorption implicit small insights on the
influence of protein adsorption. Accordingly, PDMAAm (neutral and hydrophilic) gel is
lipid and protein repellent due to their strong swelling in aqueous medium. While, PBAAm
(neural and hydrophobic) does not swell in water, and attracts both lipid and proteins
through hydrophobic interaction. To explore further, one has to consider several parameters
5.8. Conclusion
114
such as structural changes of incoming or penetrating molecules, salt content and lipid
concentration. These can be found in the reviews of Tonge and Schulz et al. 216-217
5.8. Conclusion
Protein adsorption of a homologous series surface-attached poly (alkylacrylamide)
networks was investigated using surface plasmon resonance spectroscopy. Hydrophobic
polymers (PPAAm, PBAAm and PDEAAm) which do not swell in water showed a strong
affinity to proteins. This non-specific adsorption is due to the strong hydrophobic interaction
between protein and polymers. Hence, the enthalpy of adsorption (ΔHads<0 i.e. -ve)
extravagantly makes the Gibbs free energy of adsorption as negative (ΔHads <0) and thus
adsorption of proteins is thermodynamically favorable.
The hydrophilic polymers (PMAAm, PEAAm and PDMAAm) that show strong
swelling in water were found to repel proteins. The enthalpy of adsorption is almost zero i.e.
there is no interaction between protein and polymer (ΔHads = 0). In such circumstances, two
important parameters such as size of the proteins in comparison with that of the mesh size of
gels the size exclusion effect, and the change in the entropy during the deposition of proteins
determines the adsorption process called as entropic shielding. The size exclusion effect is
more pronounced for the repellency of larger proteins due to the fact that mesh size is
smaller than the radii of gyration of protein (Fg, Fn and VWF). While, the latter was found
to be strongly dependant on the segment density of the swollen network were the extent of
swelling that a network can undergo in aqueous medium, independent of the chemical
composition of the system. The chains of a strongly swollen network were already stretched
to the maximum. Penetration of larger protein molecules will tend to stretch it further as a
result it lower the entropy of conformation and this loss is not compensated for by entropy
gain due to the adsorption. Therefore, the protein is repelled if there is no enthalpic
interaction with proteins.

5.8. Conclusion
115
PDMAAm gels with various amount of photo crosslinker (MABP) denote that the
mesh size of the gel is comparable to the size of the protein. In this case, it can be assumed
that both entropic shielding and size exclusion are equally important to determine the
protein resistance of hydrophilic PDMAAm networks. For example, PDMAAm with a
maximum of 10% MABP, swell to the factor of ≈1.7 (mesh size ≈ 10 nm, Rg of Fg ≈ 16 nm) in
water strongly is an ample indication for the above-mentioned statement. This also holds for
the explanation of other PDMAAm gels, e.g. poly (DMAAm-co-1% MABP), poly (DMAAm-
co-2.5% MABP) and poly (DMAAm-co-5% MABP).
In addition to the homologoues series and PDMAAm gels, protein adsorption studies
of copolymers containing both hydrophobic (PBAAm) and hydrophilic (PEAAm) moieties at
different composition were investigated. The results revealed that gels with more than 50%
BAAm tend to adsorb protein non-specifically. The gels less than 50% BAAm or over 50%
EAAm resist protein effectively. As noted earlier, the transitions between 50 to 75% of either
of them indicated that anything above 50% of BAAm leads to phase separation due to
collapse of polymer chains and consequently it showed a weak to zero swelling in water.
Hence, the hydrophobic pockets of polymer can interact with hydrophobic patches of
proteins. Above 50% of EAAm/DMAAm does not phase separate. Instead, it demonstrated
strong swelling in water and subsequently repelled proteins due to entropic shielding and
size exclusion effect. It was interesting to note that, even a minor change in the
hydrophobicity of polymers displayed a significant effect on the penetration of proteins. One
has to consider this critical parameter while designing the surfaces for medical applications.
Finally, lipid investigation on surface-attached PDMAAm and PBAAm illustrated
that as long as the gel is swollen in water, it can repel lipids adequately, provided it is not
undergoing any ionization. Hydrophobic and charged polymers show substantial adsorption
of lipids through electrostatic and hydrophobic interactions. However, more studies need to
be performed to have a clear understanding of the influence of lipids on protein adsorption.

6.1. Molecular mechanism of platelet adhesion
116
6. Platelet adhesion
The implantation of blood-contacting devices can trigger several undesirable clinical
complications due to platelet activation, adhesion or aggregation on biomaterial surfaces. As
mentioned in chapter 5, when an artificial material is exposed to blood, a layer of plasma
proteins (fibrinogen, fibronectin, vitronectin and von Willebrand factor ) quickly adsorbs to
the surface of the biomaterial. These adsorbed proteins have the tendency to bind to platelets
mediated through cell membrane receptors (e.g., GPIIb/IIIa also known as integrin IIb/IIIa).
Subsequently, the activated platelets adhere and trigger clotting events.116 The resulting
platelets aggregated in the vicinity of the implant, or dislodge and form emboli. The results
are often leads to life-threatening complications.
Consequently, the development of non-thromogenic surfaces has been a major focus
for the last three decades.116 A better understanding of the interactions of blood with
synthetic materials that stimulate clotting events is essential in order to design and generate
non-thrombogenic surfaces. Hence, the motivation of this chapter is to examine the
interaction of blood platelets with the surfaces generated from the homologous series of poly
(alkylacrylamide) networks. Furthermore, the platelets absorption is studied as a function of
the shear rate to mimic the blood flow.
6.1. Molecular mechanism of platelet adhesion
Platelet adhesion and activation is a multistep process involving several platelet-
receptor ligand interactions.218 Depending on rheological conditions, platelet adhesion occurs
through different mechanisms. Especially at high shear rates, vWF and Fg are essential
factors to decelerate fast-flowing platelets by reversible binding with platelet glycoproteins.
Among the different platelet adhesion receptors, glycoprotein GPIb and GPIIb/IIIa have the

6.2. Static platelet adhesion on surface-attached poly (alkylacrlamide) netwrorks
117
highest density on platelets. GPIb binds to adsorbed or immobilized vWF on the surface,
while the active form of GPIIb/IIIa crosslinks with Fg.219 Binding of Fg or other
glycoproteins containing Arg-Gly-Asp (RGD) sequences to activated GPIIb/IIIa triggers
platelet aggregation.220 Activated platelets also tend to release intracellular granules
containing coagulation factors VII and XI, the adhesion molecules P-selectin and vWF,
serotonin and platelet factor IV. All of these further affect the activation of other platelets,
coagulations and inflammation processes (Figure 6.1).
Figure 6.1: The activation of platelets by artificial surfaces: contact of platelets with artificial
surfaces leads to platelet activation in terms of ligand expression (GPIIb/IIIa). Activated
platelets either adhere (via proteins like fibrinogen) or aggregate to the surfaces.218
The mechanism of material-induced platelet activation is often presumed to happen
through the generation of thrombin due to the activation of intrinsic coagulation cascade or
the release of adenosine diphosphate (ADP) from damaged red blood cells or platelets. In
addition, even in the presence of heparin, small levels of thrombin are generated and thus
the activation of platelets is possible. However, the inability of thrombin and kellikrein

6.2. Static platelet adhesion on surface-attached poly (alkylacrlamide) netwrorks
118
inhibitors that reduce platelet activation, suggest that other agonists at least partially mediate
platelet activation (Figure 6.2).221 Gorbet and Sefton described the correlation between
compliment activation and thrombocytopenia during dialysis.222 This eventually leads to
definitive platelet arrest and subsequent thrombus formation (Figure 1.6, Chapter 1).
Figure 6.2: Activation of the coagulation system is initiated by biomaterial-protein
interaction. Activation of factor XII is the initial step. Reciprocal activation and auto-
activation lead to amplification of activated factor XII, which in turn initiates the intrinsic
coagulation pathway via activation of factor XI, and finally towards production of fibrin.218
6.2. Static platelet adhesion on surface-attached poly (alkylacrlamide) networks
Platelet adhesion testing involves three individual steps: 1) the preparation of platelet
rich plasma from blood, 2) incubation of PRP on surface-attached hydrogels and 3) fixing of
adhered cells for electron microscopy. These steps are described in the following sections and
more details can be found in the experimental part of this thesis.
----------------------------------
Platelet adhesion experiments were performed with the collaboration of Prof. Barbara Zieger, Department of
Pediatrics and Adolescent Medicine, University hospital Freiburg, Freiburg, Germany.
6.2. Static platelet adhesion on surface-attached poly (alkylacrlamide) netwrorks
119
Extraction of platelet rich plasma (PRP) from blood
Fresh human blood was collected from a healthy medication free donor and ACD
anti-coagulant is added. Platelet rich plasma (PRP) was harvested by centrifuging the blood
at 140g for 20 min at 25°C. The supernatant was again centrifuged at 250g for 15min at 25°C
to harvest the platelet poor plasma (PPP). The concentration of platelets was adjusted to 200
x 103 platelets/ µl by suspending PRP in platelet poor plasma (PPP).
Incubation of PRP on surface-attached networks
The glass slides covered with the surface-attached poly (alkyl acryl amide) networks
sterilized using 70% ethanol and dried for 12 hours‟ in a clean laminar flow hood. Then the
slides were transferred to 12-well plates and again sterilized with UV light (λ=254 nm for 1
min). After sterilization of the samples, 1 ml of PRP suspension was added to each well, and
incubated for 2 hours at physiological condition (37°C and 5% CO2). After incubation, the
non-adhered platelets were removed by rinsing with physiological saline. The morphology of
the adhered platelets was visualized using scanning electron microscopy (SEM).
Fixing of platelets on surfaces
The samples were incubated and rinsed with PBS buffer and then immersed in fixing
buffer containing 2.5% formaldehyde in PBS buffer. They were again rinsed three times with
PBS buffer. The fixed samples were dehydrated by incubation in ascending ethanol then
immersed in hexamethyl disilazane (HMDS), and dried overnight at room temperature. The
specimens were then covered with a 10-20 nm thick gold layer, and the morphology of
adhered platelets was examined by scanning electron microscopy (SEM).223-224
6.2. Static platelet adhesion on surface-attached poly (alkylacrlamide) netwrorks
120
The SEM images of the surface-attached gels (homologous series of poly (alkyl
acrylamides) and polyurethane (used as reference/control) obtained after platelet adhesion
tests are shown in Figure 7.3. The hydrophilic gels containing shorter alkyl substituents
(PMAAm, PEAAm, and PDMAAm) show stromgly reduced or no platelets adhesion. Platelet
adhesion is extremely sensitive to adsorbed Fg or even to a very low amount of adsorbed
fibrinogen (Fg), which is sufficient to endow the full-scale platelet adhesion irrespective of
flow conditions,225 in other words, in absence of proteins, platelets will not attach onto the
surface.
The largely reduced platelet adhesion on these gels is directly attributed to the
plasma-protein repellent character of the gels and, hence, their strong swelling in plasma.
Gels with longer alkyl substituent (PAAm, BAAm, and PU) show extensive platelet
adherence and aggregation along with extended pseudopodia. These hydrophobic surfaces
allow Fg and VWf to adhere onto the surface via non-specific interaction and consequently
the specific interaction with platelets is supported. Presumably, the adsorbed Fg
predominately mediates the platelet adhesion in the experiments because they were
performed under static conditions.226
The amount of adsorbed platelet is not linearly proportional to the amount of
adsorbed Fg. However, the ability of adsorbed Fg to mediate platelet adhesion is rather
variable and depends on the adsorption conditions.226 The difference in this molecular
potency is caused by the conformational and orientational changes of the adsorbed (plasma)
proteins that can affect the availability of the binding domains of the platelets.227 The
conformational and orientation change of adsorbed proteins play a crucial role in
determining the ability of platelets to activate and adhere, but these factors may not be
important if Fg adsorption is sufficiently low. Gel coatings with short alkyl substituents such
as PMAAm, PEAAm and PDMAAm exhibit ultralow adsorption of Fg and vWF due to the
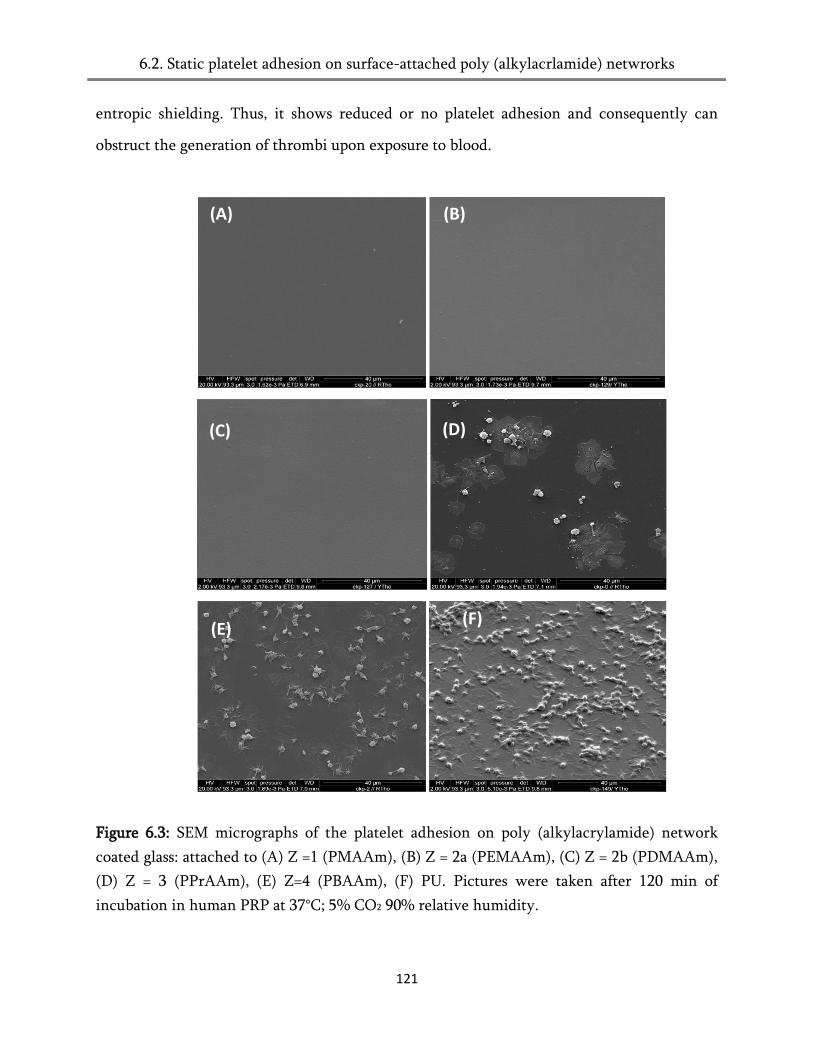
6.2. Static platelet adhesion on surface-attached poly (alkylacrlamide) netwrorks
121
entropic shielding. Thus, it shows reduced or no platelet adhesion and consequently can
obstruct the generation of thrombi upon exposure to blood.
Figure 6.3: SEM micrographs of the platelet adhesion on poly (alkylacrylamide) network
coated glass: attached to (A) Z =1 (PMAAm), (B) Z = 2a (PEMAAm), (C) Z = 2b (PDMAAm),
(D) Z = 3 (PPrAAm), (E) Z=4 (PBAAm), (F) PU. Pictures were taken after 120 min of
incubation in human PRP at 37°C; 5% CO2 90% relative humidity.
(A) (B)
(C) (D)
(E) (F)
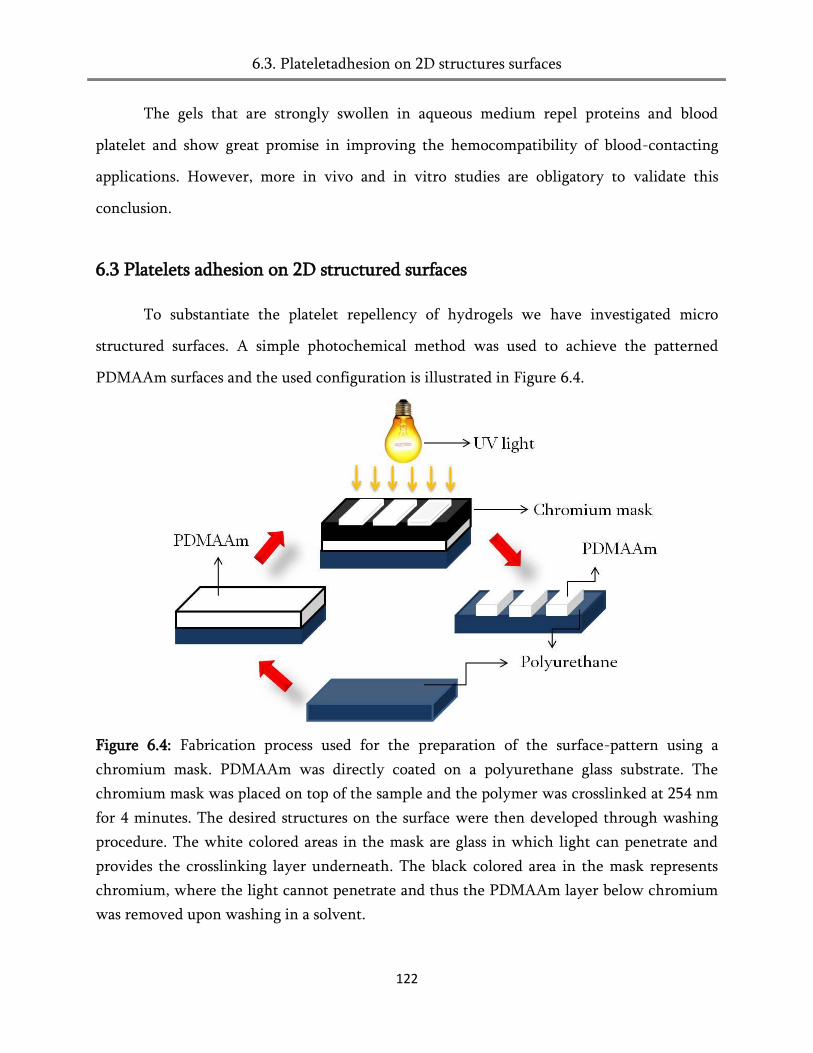
6.3. Plateletadhesion on 2D structures surfaces
122
The gels that are strongly swollen in aqueous medium repel proteins and blood
platelet and show great promise in improving the hemocompatibility of blood-contacting
applications. However, more in vivo and in vitro studies are obligatory to validate this
conclusion.
6.3 Platelets adhesion on 2D structured surfaces
To substantiate the platelet repellency of hydrogels we have investigated micro
structured surfaces. A simple photochemical method was used to achieve the patterned
PDMAAm surfaces and the used configuration is illustrated in Figure 6.4.
Figure 6.4: Fabrication process used for the preparation of the surface-pattern using a
chromium mask. PDMAAm was directly coated on a polyurethane glass substrate. The
chromium mask was placed on top of the sample and the polymer was crosslinked at 254 nm
for 4 minutes. The desired structures on the surface were then developed through washing
procedure. The white colored areas in the mask are glass in which light can penetrate and
provides the crosslinking layer underneath. The black colored area in the mask represents
chromium, where the light cannot penetrate and thus the PDMAAm layer below chromium
was removed upon washing in a solvent.

6.3. Platelet adhesion on 2D patterned surfaces
123
A 2D pattern of the PDMAAm hydrogel was directly prepared onto a polyurethane
covered glass substrate in order to evaluate the precision of the patterning technique, and to
demonstrate the contrast in the degree of platelet adhesion between uncoated and hydrogel-
coated polyurethane. In addition, this method allows the use of other plastic substrates, like
for e.g., polystyrene, polyurethane, or poly vinyl chloride, in the fabrication and yet enable
reliable thickness measurements. The PDMAAm (10 mg/ml in ethanol) is spin casted on top
of the polyurethane (PU) coated glass substrate (or silica wafer).The chromium mask with
desired pattern was placed above the sample and irradiated for 4 min at 254 nm. After cross-
linking, the sample was extracted and dried in ethanol and nitrogen air, respectively.
Further, the concentration precursor polymer and irradiation time can be used to govern the
thickness of the hydrogel layer.
Figure 6.5: SEM images of PDMAAm patterned surface after exposure to PRP. Extensive
platelet adherence was observed in the PU region and reduced or no platelet binding was
seen in the PDMAAm region.
The SEM images of the platelet adhesion on patterned surfaces are shown in Figure
6.5. The results indicate that, the platelet adhesion is drastically reduced in areas where the
surface is covered with the hydrogels. In contrast, the PU covered regions are full of adhered
platelets. This suggests that, the PDMAAm hydrogel is capable of showing strong inertness to
6.4. Ultrasound contrast angents to detect platelets at shear flow
124
non-specific adsorption of platelet adhering factors (Figure 6.1 and 6.2), as long as the
hydrogel is prepared with an adequate thickness. Hence, the PDMAAm gel, at least in the
period relevant to platelet adhesion events maintain a stable and well-defined surface
chemistry even after exposure to platelet rich blood plasma.
Furthermore, the patterned system thus allowed precise control on the mechanism of
the platelets adhesion, as well as, the lateral distribution of the adhering cells. The surface
chemistry described herein may be adopted as a platform for the development of a wide
range of cell microarrays with platelet assays as the primary application.
6.4. Ultrasound contrast agent to detect platelets at shear flow condition
Ultrasound contrast agents are micrometer-sized microbubbles consisting of a lipid
shell, and core contains a stabilizing gas, which can be injected into the blood stream. The
microbubble (MB) provide the contrast for ultrasound imaging and carry ligands from
outside to target specific locations.228 These agents enhance the contrast between different
types of tissues within the body and provide integrated information between molecular
events and the physiological events that takes place in the body.229
The uses of biomarkers linked to microbubbles (MB) that can specifically target and
elucidate molecular level interactions within the body provide a chance for earlier disease
detection. Targeted contrast agents are linked to chosen ligands, which selectively bind to
the molecules expressed on the plaque surface, like the activated GPIIb/GPIIIa receptor, the
scavenger receptor macrophages, or other molecules expressed by extracellular matrix,
thrombi, and neovasculature.230 Thus, molecular ultrasound imaging of aggregated or
adhering platelets may also offer a non-invasive diagnostic tool to identify thrombi within
unstable atherosclerotic plaques especially in-situ under flow condition.
----------------------------------
Microbubble targetting experiments were performed with the collaboration of Dr. Felix Günther, Universitäts-
Herzzentrum Freiburg, Freiburg, Germany.
6.4. Ultrasound contrast agent to detect platelets at shear flow condition
125
The aim is to target the activated platelets using microbubbles (MB). The MB‟s used as
a contrast agent, which utilizes the P-selectin ligand - sialys lewisa (sLea) as the targeting
molecule. Platelet activation comprises series of casecade reactions such as spearding of cells,
release of α-granules and the formation of microparticles.231 Upon activation, the platelets
undergo shape change and become more spherical and form pseudopods on their surfaces.
This activated platelet has specific interaction with P-selectin ligand of the MB.
MBs are composed of a decafluorobutane gas core, which is encapsulated by a
phosphatidylcholine lipid shell. A brush of polyethylene glycol is attached onto the lipid
shell through a lipid anchor embedded in the lipid monolayer. Some of the polyethylene
glycol (PEG) molecules carry biotin at the distal tip.231 Targeting can be achieved by coupling
biotinylated sLea ligand (Sialyl Lewis-polyacrylamide-biotin, Glycotech, Gaithesburg, MD) to
the biotinylated MB via a streptavidin linker. This Biotin-PAA-sialyl Lewis has specific
interaction with P-selectin of the activated platelets as shown in Figure 6.6.
A standard PS culture dish was etched using 10% sulfuric acid solution and
thoroughly washed with de-ionized water. The dry dish was then spin casted (2500 rpm for
60 S) with PDMAA hydrogel (10 mg/ml in ethanol), and subsequent crosslinking and
extraction leaves a stable surface-attached PDMAAm network on PS (Figure 6.7). Both
coated and uncoated PS dishes were incubated with human fibrinogen solution for 30
minutes at physiological condition, and washed thrice with PBS buffer. Meanwhile, the
platelets in human blood plasma are extracted by washing PRP with sepharose and eluting
platelets and adjusted to a concentration of about 250000 platelets/ ml in PBS buffer and
activated by adding 20µM of adenosine diphosphate (ADP). The platelet coverage was
achieved by adding 1 ml of ADP-activated platelets medium on 35 mm fibrinogen-covered
dishes by incubating 30 minutes at 37° C. After incubation, dishes were carefully rinsed by
PBS.

6.4. Ultrasound contrast agent to detect platelets at shear flow condition
126
Figure 6.6: Schematics of sLea-targeted microbubbles in the flow chamber. MB had
biotinylated PEG molecules on their shell and were coupled to biotinylated sialyl Lewis
polyacrylamide or a biotinylated control carbohydrate-freepolymer. Streptavidin was used as
a linker.231
The parallel plate flow chamber was employed to characterize the MB adhesion
efficiency to substrates to which fibrinogen and activated platelets were adsorbed. A silicon
gasket attached to a flow deck by vacuum grease, defined a rectangular flow path with a
width of 2.5 mm, a height of 0.127 mm, and a length of 20mm (Gasket A, Glycotech). The
wall shear stress in the chamber can be calculated by using following equation.
𝜏 =6𝜇𝑄
𝑏2 (Eq.6.1)
Where, τ denotes the wall shear stress (N/m2), µ is fluid viscosity (0.001N/s2 for water
at 20 °C), Q is fluid flow rate (m3/s), b is chamber width (m), and h is chamber height (m).
The wall shear stress is calculated in dynes/cm2 (one dynes/cm2= 1µbar = 0.1 Pa).
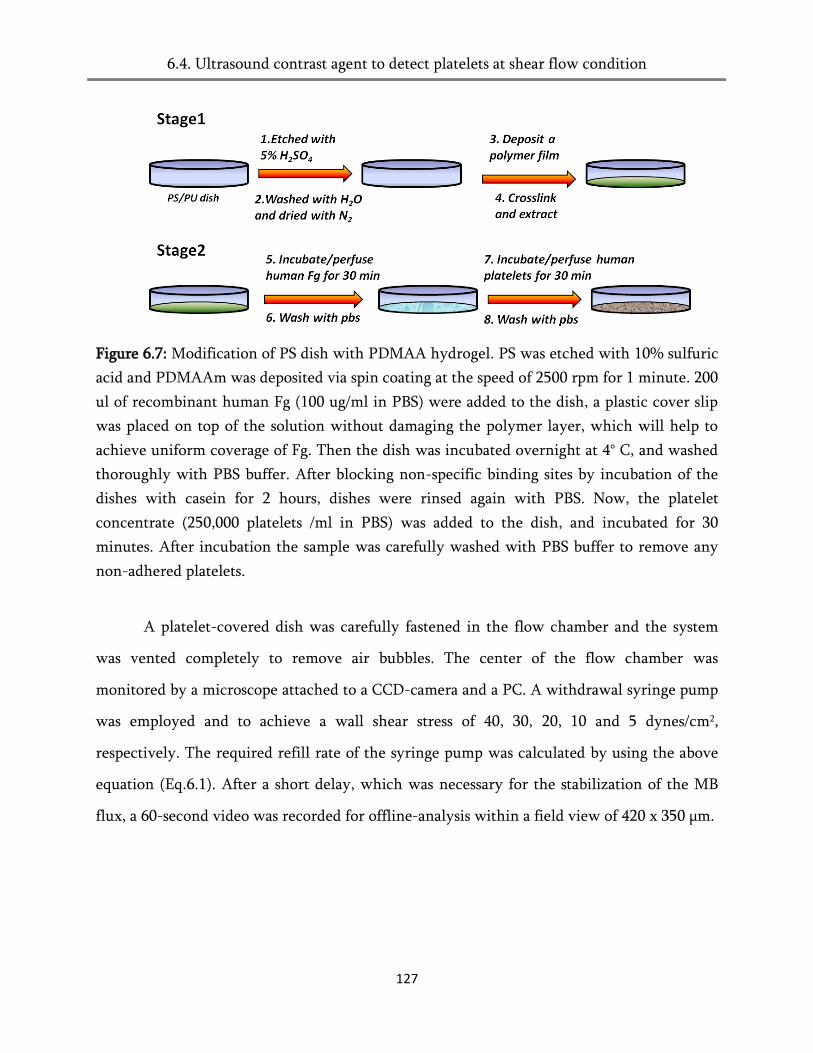
6.4. Ultrasound contrast agent to detect platelets at shear flow condition
127
Figure 6.7: Modification of PS dish with PDMAA hydrogel. PS was etched with 10% sulfuric
acid and PDMAAm was deposited via spin coating at the speed of 2500 rpm for 1 minute. 200
ul of recombinant human Fg (100 ug/ml in PBS) were added to the dish, a plastic cover slip
was placed on top of the solution without damaging the polymer layer, which will help to
achieve uniform coverage of Fg. Then the dish was incubated overnight at 4° C, and washed
thoroughly with PBS buffer. After blocking non-specific binding sites by incubation of the
dishes with casein for 2 hours, dishes were rinsed again with PBS. Now, the platelet
concentrate (250,000 platelets /ml in PBS) was added to the dish, and incubated for 30
minutes. After incubation the sample was carefully washed with PBS buffer to remove any
non-adhered platelets.
A platelet-covered dish was carefully fastened in the flow chamber and the system
was vented completely to remove air bubbles. The center of the flow chamber was
monitored by a microscope attached to a CCD-camera and a PC. A withdrawal syringe pump
was employed and to achieve a wall shear stress of 40, 30, 20, 10 and 5 dynes/cm2,
respectively. The required refill rate of the syringe pump was calculated by using the above
equation (Eq.6.1). After a short delay, which was necessary for the stabilization of the MB
flux, a 60-second video was recorded for offline-analysis within a field view of 420 x 350 µm.

6.4. Ultrasound contrast agent to detect platelets at shear flow condition
128
Figure 6.8: Illustration of the flow experiment using Microbubbles to visualize the platelets.
Micrographs of PS and PDMAAm coated dishes during platelet exposure are shown in
Figure 6.9. The PS dishes show a dense coverage with platelets. Hydrophobic polystyrene can
accommodate the Fg through a enthalpic interaction (also known as non-specific interaction,
as mentioned in the previous chapter protein adsorption). Consequently, the platelets adhere
to Fg covered surfaces which is specifically mediated by the glycoprotein‟s (GPIIb/GPIIIa).
Now, this scenario offers the feasibility for SLea MB to target the activated platelets,
specifically via P-selectin onto the activated platelet surface and thus, the extensive coverage
of SLea-targeted microbubbles were observed in the PS dishes (Figure 6.9C).
In addition, SLea MB have the tendency to bind to platelets even at high shear flow.
Apparently, after initial attachment of MB, they slowly roll on the surface of platelets along
with the flow direction (right to left, video), caused by continual detachment and immediate
reattachment of SLe to p-selectin. However, the capture efficiency is depending on the flow
rate and consequently decreases as the shear stress increased.229 The maximum capture
efficiency is achieved for 5 dynes /cm2, as 16.11% and the minimum capture efficiency
observed at 40 dynes/cm2, as 3.4%.231
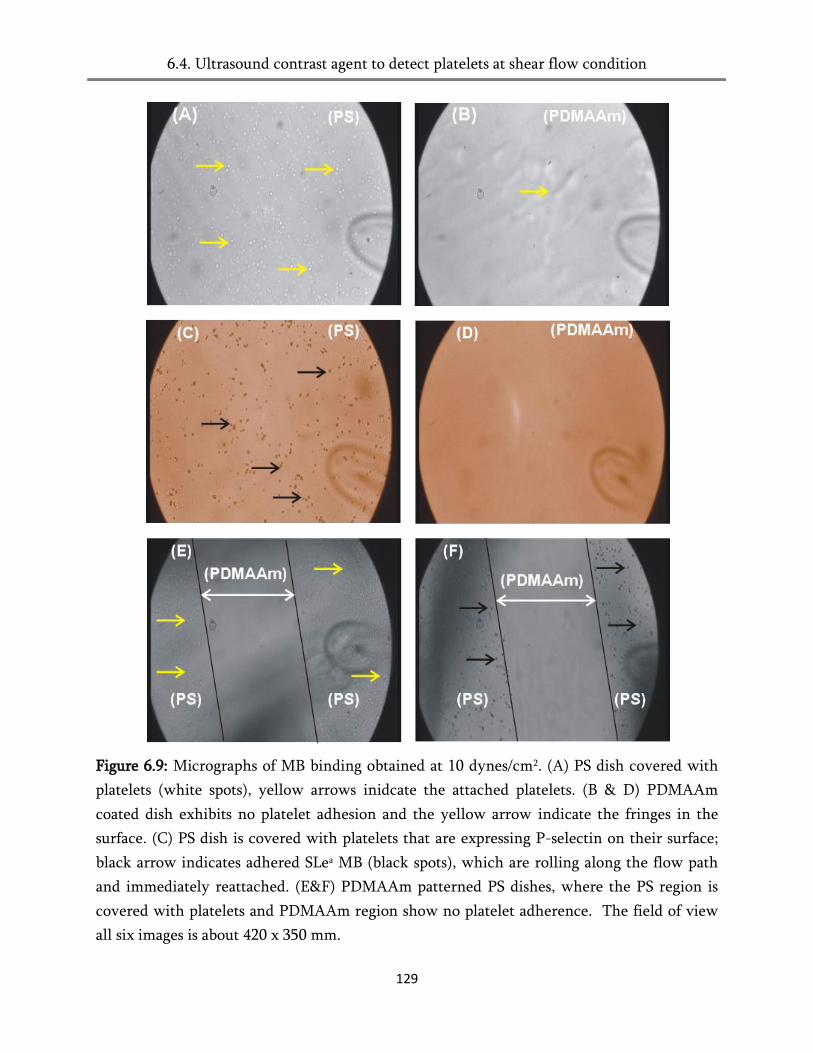
6.4. Ultrasound contrast agent to detect platelets at shear flow condition
129
Figure 6.9: Micrographs of MB binding obtained at 10 dynes/cm2. (A) PS dish covered with
platelets (white spots), yellow arrows inidcate the attached platelets. (B & D) PDMAAm
coated dish exhibits no platelet adhesion and the yellow arrow indicate the fringes in the
surface. (C) PS dish is covered with platelets that are expressing P-selectin on their surface;
black arrow indicates adhered SLea MB (black spots), which are rolling along the flow path
and immediately reattached. (E&F) PDMAAm patterned PS dishes, where the PS region is
covered with platelets and PDMAAm region show no platelet adherence. The field of view
all six images is about 420 x 350 mm.
6.4. Ultrasound contrast agent to detect platlets at shear flow condition
130
In contrast to the PS dishes, PDMAAm coated dishes show reduced or no platelet
adhesion (Figure 6.7B and 6.9D). This result can be attributed to their strong swelling in
aqueous medium that resists the adsorption of Fg through entropic shielding, and thus the
platelets (see Chapter 4. Protein repellency of PDMAAm gels). Hence, the surface observed
was plain without any MB attaching to the surface at any shear rate. Analogously, the
PDMAAm patterned PS dishes show, an extensive coverage of platelets (Figure 6.9E) and
binding of SLe MB (Figure 6.9F) in the region of PS. No platelet binding was observed in the
PDMAAm areas. These observations agree well with the previous results that PS is prone for
non-specific adsorption of proteins and subsequently platelets and that PDMAAm strongly
repels Fg and Platelets. More evidently, the different shear stress experiments on these
patterned surfaces also indicate that PDMAAm gels are very stable and render non-specific
adsorption at any given circumstance.
The specific adhesion of targeted SLe MB to P-selectin on activated platelets using
microscopy, along with a simple flow model was successfully demonstrated. To validate the
application of this system in targeted ultrasound imaging of activated platelets, more in vitro
and in vivo studies are need to be performed. Along this line, the modification of blood tubes
with PDMAAm hydrogel by implementing the above methods will be the first step to
visualize the thrombi inside the tube. Typically, the inner wall of the blood tube is modified
with PDMAAm hydrogels (see Chapter 8), followed by incubation in Fg solution and
platelets concentrate, and then will be subjected to SLe MB flow to capture the platelets.
From the principle point of view, platelet attached SLe MB will enhance the contrast for
ultrasound imaging and thus, it is possible to monitor the thrombi formation inside the tube,
later this would mean to be used in clinical applications. However, our preliminary results
(which are not shown) already confirm the bright future of this simple yet adequate and
cost-effective methodology to be commercialized.

6.5. Platelet adhesion under shear condition
131
6.5. Platelet adhesion under arterial flow condition
Flow is one crucial phenomenon in medical applications. It is well known to play a
vital role in haemostasis and thrombus formation by regulating the function of adhesive
proteins and blood cells.232 An increase in the shear rate increases the convective transport of
platelets and adhesive proteins to the vessel wall. Besides, flow also tends to remove and
dilute locally generated activators such as thrombin, and encourages the mixing with
inhibitors antithrombin III.232 It was already mentioned that Fg adsorption strongly promotes
platelet adhesion under static conditions. However, under flow condition, shear stress can
cause plasma proteins to change their conformation and exhibit a higher affinity to
platelets.233-234
By considering the above factors, the shear experiments were performed on
PDMAAm coated PS dishes using the flow chamber as described above (Figure 6.8). After
fixation of the modified dish in the flow chamber, the sample was perfused with Fg solution
(1 mg/ml in PBS buffer) for 60 minutes at 10dynes/cm2 (also 30 dynes/cm2), and then rinsed
with PBS for 2 minutes at the same shear rate. Similarly, the platelets solusion were also
perfused and washed using PBS buffer. The SLe MBs were permeated to visualize the
attached platelets through binding of SLe MB using microscope. The results demonstrate that
(appendix, video 11.1 and 11.2), spreading of platelets is observed only on the PS surface, and
it is utterly inhibited on the PDMAAm covered surfaces at all shear rates. This indicates that
the PDMAAm coating is stable at different (also arterial) shear rates. This provides a strong
evidence for the excellent anti-thromobogenicity of this coating also under flow condition.
6.6. Conclusion
In blood contacting devices, platelet adhesion is one of the important factors that
trigger the formation of a potentially life-threatening thrombus. Platelet adhesion is a
specific process, which caused by the adsorption of plasma proteins like Fg and vWF. These

6.6. Conclusion
132
proteins can bind to the cell membrane receptors such as GPIIb/ IIIa, which can lead to
platelet activation, adhesion and the formation of aggregates. Hence, it was an attempt of this
study to confirm this relation and to design a surface, which suppresses the platelet adhesion.
The stable surface-attached poly (alkylacrylamide) networks were prepared on glass
substrates, and the platelet adhesion was examined using fresh human platelet rich plasma
(PRP) under static and physiological condition. The gels that strongly swell in aqueous
medium (PMAAm, PEAAm and PDMAAm) were found to be platelet repellent. This was
due to the tendency of the gels to resist proteins that were present in the plasma. In contrast,
gels that do not swell in aqueous medium (PPAAm, PDEAAm and PBAAm) were platelet
attractive with extended adhesion and normal pseudopodia. These hydrophobic gels will
interact with plasma proteins and subsequently platelets will adhere on these surfaces
GPIIb/IIIa.
Furthermore, it was demonstrated that it is possible to target P-selectin of the
activated the platelets using SLea MB. The strong binding of SLe MB was observed on platelet
covered PS dishes at different shear rate (5 to 40 dynes/cm2). This methodology was used to
evaluate the platelet repellent of PDMAAm related hydrogels. The results were in excellent
agreement with that of the static experiments and no SLe MB binding was found on these
surfaces. The results from patterned dishes at different shear rate s, once again confirmed the
bio-inert character of PDMAAm related gels (PMAAm and PEAAm). Finally, from the above
investigation, PMAAm, PEAAm and PDMAAm were non-thrombogenic surfaces that might
be interesting for the fabrication of blood compatible devices. However, more in-vivo and
in-vitro studies are needed to prove long-term stability.

7.1. Mechanism of cell adhesion
133
7. Cell adhesion on surface-attached poly (alkylacrylamide) networks
The motivation of this chapter is to provide insights on cell compatibility of surface-
attached polymer networks.236 Normal human dermal fibroblast (NHDF), human umbilical
vein endothelial cells (HUVEC), and mouse fibroblasts (L929) are employed for the
investigation. Finally, the cell adhesion results are compared to that of swelling, and protein
adsorption surface-attached gels.
7.1. Mechanism of cell adhesion
Cells are extremely sensitive to their surroundings.235-237 Typically, between 10 and
100 µm in diameter, cells responds to the environment at all length scales from the macro to
the molecular levels. The outer membrane of a cell is covered by specific carbohydrate
structures, and at least six different receptor systems that can be activated by interactions
with adjacent cells, ligands in the surrounding extra cellular matrix (ECM), and segregated
signaling molecules.238 Until now, hundreds of proteins are known to play a critical role in
stimulating the cell receptors, which in turn determines a plethora of responses, including
cell migration in the early embryo, coordinated organogenesis, and wound healing
throughout human life.239 Synchronically, these extrinsic factors make up a highly defined
and specialized cell microenvironment, which is necessary for correct tissue development
and continued functions.240

7.1. Mechanism of cell adhesion
134
Figure 7.1: The process of integrin mediated cell adhesion comprises a cascade of four
different partly overlapping events:241 cell attachment, cell spreading, organization of the
actin cytoskeleton, and formation of focal adhesion sites. Firstly, in the initial attachment
step, the cell contacts the surface and some ligand binding occurs that allows the cell to
withstand gentle shear forces. Secondly, the cell body begins to flatten and its plasma
membrane spreads over the substratum. Thirdly, this leads to actin organization into
microfilament bundles, referred to as stress fibers. In the fourth step the formation of focal
adhesion sites occurs, which link the ECM to molecules of the actin cytoskeleton. Focal
adhesion sites consist of clustered integrins and more than 50 other transmembrane,
membrane associated and other cytosolic molecules. Among them e.g. tetraspanins, growth
factors receptors, syndecans, lipids, tensin, talin, vinculin, paxillin, and focal adhesion kinase
(FAK) were identified.242-245
Integrins are a diverse family of cell receptors that specifically binds to argininine-
glycine-aspartic acid (RGD) tri-peptides recognized in cell adhesive proteins such as laminin,
fibronectin, vitronectin and fibrinogen (Figure 6.1).246 These are heterodimers, which can
form in as many as 25 distinct pairings of their 18 α-subunits and 8 β-subunits, with each

7.1.1. Interaction with polymer surfaces
135
pair being sensitive to a unique set of ligands.247 For example, αvβ3 binds a wide range of
ECM molecules including fibronectin, fibrinogen, vonWillebrand factor, vitonectin, and
protelysed forms of collagen and laminin, while, integrin α5β1 specifically binds to
fibronectin.248 In addition to mediating the cellular adhesion to the ECM, integrins are
known to play a role as signal transducers, activating various intracellular signaling pathways
when activated upon ECM binding.248
7.1.1. Interaction with polymer surfaces
As outlined in chapter 5 (Protein adsorption), when a polymer is brought into contact
of biological medium, proteins (e.g. Fg, Fn, Vn and vWF) present in the medium tend to
cover the surface immediately.246 Subsequently, cell adhesion occurs through the mediation
of integrins.
One of the classical approaches that are used to enable the cell attachment on
polymeric surfaces is to deposit proteins such as fibronectin, collagen or laminin.249-251 This
approach, however, has some disadvantages in the medical perspective. At first, proteins
have to be isolated from other organisms and purified, which might lead to undesirable
immune responses and increases infection risks. In addition, proteins are susceptible to
proteolytic degradation and thus need to be refreshed occasionally.252 The conformational
change of proteins after adsorption on surfaces is another critical factor that influences the
cell adhesion.253-254 On hydrophobic surfaces, proteins tend to denature which often causes a
difference of the cell binding motifs.255 Hence, the wettability or water contact angles were
used to predict the cell adhesion. Most studies say that, polymers with moderate wettability
promote cell adhesion246 Lanza et al.247 demonstrated such wetting behavior of different
polymeric surface. The polymers with a contact angles in the range of 60 - 80° were found
have good cellular adhesion.247 However, the scattering in the plotted data indicates directly
that the water contact angle is not a suitable measure to classify the behaviors of the cells on
7.1.2. Biomimetic polymer surfaces
136
polymers. Other factors such as charges, surface topography and roughness that affect the
cell adhesion can be found elsewhere.254-255
7.1.2. Biomimetic polymer surfaces
A rather promising approach that is widely applied in stimulating cell adhesion is to
engineer surfaces with peptide sequences that are a part of the natural ECM. One common
example, which is often encountered in promoting the selective cellular adhesion, is to
employ RGD peptides.256 This is due of their wide spread distribution and use throughout the
organism, its ability to address more than one cell adhesion receptor, and its biological
impact on cell anchoring, behavior, and survival.257 Many attempts have been made to
develop RGD peptide based/ incorporated polymers.258-259
The covalent attachment of RGD sequence is achieved via functionalities like
hydroxyl-, amino-, or carboxyl groups.260 In the case of polymers, which do not contain such
functional groups, the RGD sequences are introduced by blending,261-263 copolymerization 264,
and chemical or physical treatment.265-266 However, it is well known that the RGD peptide
signal loses its affinity, and specificity when taken out of the context of a protein.267 For
example, RGD tripeptide exhibits virtually no effect in a cell detachment assay, but its
activity was retained by blocking the C-terminal carboxyl group or by adding flanking amino
acids according to the natural sequence: RGD (inactive) <RGD-NH2<RGDS<GRGDSP.268
Recently, Loschonsky269 and Petersen et al.268 have shown that a protein repellent
PDMAAm can promote cell adhesion upon modification with such RGD peptide sequences.
The adhesion of human fibroblasts in serum-free medium was investigated as a function of
the amount of peptide in the solution used for the film formation. It was noticed that, even
0.02 wt% of peptide in the film is enough to induce cell adhesion specifically to the regions
where the GRGDSP peptide is visible to macromolecules. Besides RGD, other important cell
7.2. Cell adhesion on surface-attched poly (alkylacrylamide) networks
137
adhesion motifs have been identified. Hence, the RGD sequence is not the universal cell
recognition motif, but it is nevertheless unique with respect to its broad distribution and
usage.266 It has been shown that factors other than the flanking amino acids are also
important such as the conformational presentation of the sequence.270 Other factors that
contribute to integrin-ligand binding affinity include the activation of integrins by divalent
cations and cytoplasmatic proteins. Further details about RGD and other stimulating factors
can be found in the literature of Jacob and Stevens et al. 271-272
7.2. Cell adhesion on surface-attached poly (alkylacrylamide) networks
Human umbilical vein endothelial cells (HUVEC), normal human dermal fibroblasts
(NHDF), and mouse fibroblasts (L929) are used in this study to evaluate the cell compatibility
of surface-attached gels. These are immortal cell lines, HUVEC is derived from normal
human umbilical vein, NHDF is derived from the dermis of juvenile foreskin or adult skin
from different locations like the face, the breasts, the abdomen, and the thighs and L929 is
derived from normal subcutaneous areolar and adipose tissue of a 100 days old male C3H/An
mouse. The complete description of sample preparation and other necessary details are
presented in the experimental section (see chapter 10.6).
Briefly, glass substrates (normal cover slips) were coated with surface-attached
polymer networks, sterilized by repeated immersion in 70% ethanol, and dried in a bio-safe
cabinet overnight. The samples were then transferred to 12-well plates and again sterilized
using UV light (λ = 254 nm) for 60 sec, followed by the addition of 1 ml of pre-warmed
medium to each well plate and incubation for 1 hour at 37°C and 5% CO2 atmosphere.
HUVEC, NHDF, and L929 cells (passage number of 5-7) were released from the culture
plates and washed using phosphate buffer. The cells were suspended in known amount of
basal medium, counted using a hemocytometer and diluted to the final concentration of
5x10⁵ cells/ ml. 1ml of this cell suspension was added to each well plate that contained the

7.2. Cell adhesion on surface-attached poly (alkylacrylamide) networks
138
prepared substrates. The suspensions were mixed by gentle swirling and then incubated for 3
hour at 37°C and 5% CO2. After this time, the swimming cells were removed by changing the
medium after every 24 hours. Cell adherence was then investigated using an inverted
microscope 48 hours after initial seeding. The results of the cell adhesion experiment are
shown in Figures 7.2-7.4.
Figure 7.2: Micrographs of Normal Dermal Human Fibroblasts (NHDF) on surface-attached
poly (alkylacrylamide) networks. (A) PMAAm, (B) PEAAm, (C) PDMAAm, (D) PPAAm,
(E)PDEAAm and (F) PBAAm. All the micrographs were taken after four days of incubation.

7.2. Cell adhesion on surface-attached poly (alkylacrylamide) networks
139
Figure 7.3: Micrographs of Mouse Fibroblasts (L929) on surface-attached poly (alkyl
acrylamide) networks. (A) PMAAm, (B) PEAAm, (C)PDMAAm, (D) PPAAm, (E)PDEAAm
and (F) PBAAm. All the micrographs were taken after four days of incubation.
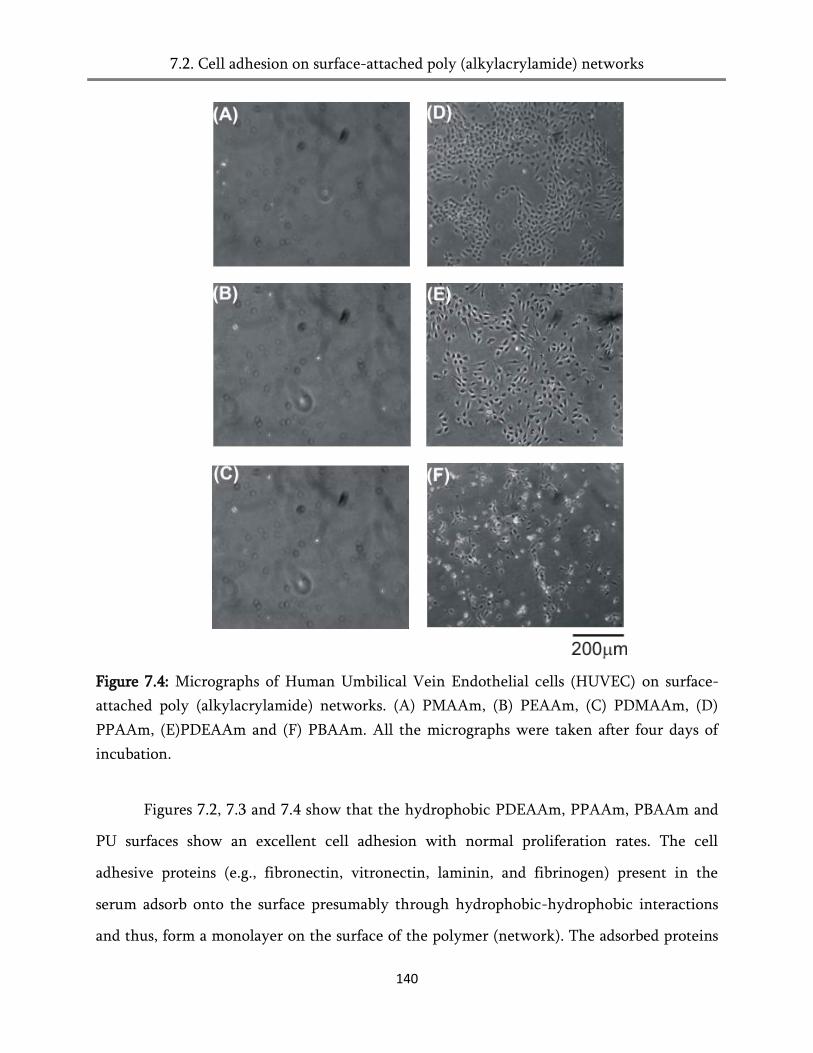
7.2. Cell adhesion on surface-attached poly (alkylacrylamide) networks
140
Figure 7.4: Micrographs of Human Umbilical Vein Endothelial cells (HUVEC) on surface-
attached poly (alkylacrylamide) networks. (A) PMAAm, (B) PEAAm, (C) PDMAAm, (D)
PPAAm, (E)PDEAAm and (F) PBAAm. All the micrographs were taken after four days of
incubation.
Figures 7.2, 7.3 and 7.4 show that the hydrophobic PDEAAm, PPAAm, PBAAm and
PU surfaces show an excellent cell adhesion with normal proliferation rates. The cell
adhesive proteins (e.g., fibronectin, vitronectin, laminin, and fibrinogen) present in the
serum adsorb onto the surface presumably through hydrophobic-hydrophobic interactions
and thus, form a monolayer on the surface of the polymer (network). The adsorbed proteins

7.3. Cell adhesion on patterned surfaces
141
enhance the interactions (via αβ integrins mediated cell adhesion) with adhesion sites on the
surface of the cells269, facilitating cell adhesion.
The highly hydrophilic hydrogel coatings based on PMAAm, PEAAm and PDMAAm
show no cell adhesion. This can be understood, as all these surfaces are strongly protein
repellent. It is interesting to note that the small difference between an ethyl- and a propyl
substituent is enough to generate a very strong change in the cell adhesion properties and
that the cell adhesion closely follows the swelling behavior of the systems.
Figure 7.5: NHDF cell growth of surface-attached poly (alkyl acrylamide) networks. The cells
only grow and proliferate on hydrophobic PBAAm, PPAAm and PDEAAm surfaces. The
hydrophilic PMAAm, PEAAm and PDMAAm show no cell adhesion even for prolonged
periods of times.
Figure 7.5 shows the cell adhesion profile of the attached cells over time on the
different polymer film surfaces. PMAAm, PEAAm, and PDMAAm are not supporting
cellular growth, as the count of cells remains almost unchanged between the first and the
seventh day of culture. Generally, anchorage-dependent cells such as L929, NHDF and
HUVEC need to adhere strongly to substrates in order to survive, spread, and transfer signals
7.3. Cell adhesion on patterned surfaces
142
into the cytosol to maintain cell homeostasis. Hence, the extent of cells spreading onto
substrates plays a crucial role in cell proliferation of the above-mentioned cells. Further, only
a few cells were firmly attached to the surfaces after 7 days of incubation, and these attached
cells showed poor spreading behavior. These results are consistent with previous findings by
Wörz that the swollen PDMAAm gel strongly repels the cells even for a period of up to 6
months. Similar findings have been observed for PMAAm and PEAAm gels.
In the case of hydrophobic PPAAm, PDEAAm and PBAAm coatings, the cells adopt a flat
and spreaded morphology, which results in the formation of a confluent cell layer. Cell
proliferation on these surfaces was significantly enhanced over time and can be positively
correlated to the hydrophobicity of the surface-attached gels. Accordingly, the most
hydrophobic PBAAm showed the maximum cell growth in the first few days and it keeps
increasing until the surface was completely covered with cells. PDEAAm and PPAAm also
showed a good proliferation rate time. All these gels support cellular adhesion and the results
are comparable to those obtained from standard PS culture plate.
7.3. Cell adhesion of patterned substrates
Cellular patterning is used in various aspects to control, modulate or understand the
behavior of cells on surfaces.273-275 In one example, an anisotropic solid micro-etching
procedure has been used for cellular patterning and for the analysis of microtubule
dynamics.275-276 The orientation of the division axis of cells has been found to be correlated to
the spatial distribution of adhesive micropatterns of a patterned extracellular matrix.277
Apoptosis of endothelial cells can be controlled by varying the size of adhesive islands micro-
patterned on gold surfaces and the differentiation of a stem cells can be modulated through a
variety of surface patterning techniques.278-280
7.3. Cell adhesion on patterned surfaces
143
A simple photochemical method wass employed to pattern the surface as described in
the section platelet adhesion. Accordingly, the cleaned glass Bp-Si coated cover slips were
first covered with hydrophobic PBAAm (or PPAAm or PDEAAm) and annealed at 70°C. The
sample was then crosslinked using UV-C-light at 254 nm for 4 min, followed by extraction
creating a stable surface-attached network. The above sample was then spin coated with
hydrophilic PDMAAm (PMAAm or PEAAm) and annealed at 70°C. The chromium mask
was placed on top of the polymer-covered sample and irradiated using UV-C-light at 254 nm
for 4 min, followed by extraction in a corresponding solvent that leaves a desired pattern on
the surface. The patterned samples were sterilized and seeded with cells as described above.
Micrographs were taken after seven days of incubation and the results are shown below.
Figure 7.6 shows that the protein attractive PBAAm areas on the sample promote cell
adhesion, while the protein repellent PEAAm region remains uncovered. The results are in
good agreement with the individual cell experiments presented in the previous section.
Evidently, the cells adhere and proliferate only in the region where the PBAAm is present,
while the PEAAm regions completely repel cells. In addition, the cell culture continued for
approximately four weeks, and it was found that the cells were not able to grow in the
PEAAm regions. In contrast, the cells were crowded in the PBAAm region, forming
aggregates, which then detached from the surface. Similar results were obtained for other
hydrogels, such as, PMAAm and PDMAAm on PBAAm. Overall, it can be concluded that
cell adhesion is completely controlled through the surface properties of the coatings.
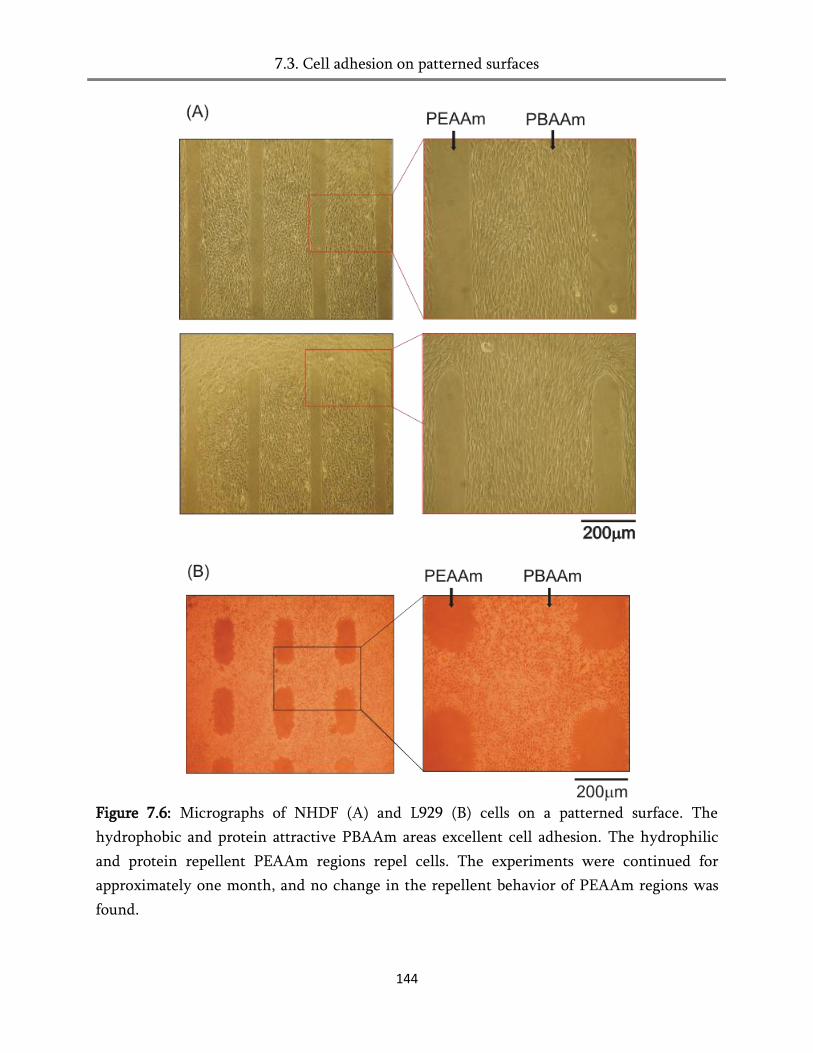
7.3. Cell adhesion on patterned surfaces
144
Figure 7.6: Micrographs of NHDF (A) and L929 (B) cells on a patterned surface. The
hydrophobic and protein attractive PBAAm areas excellent cell adhesion. The hydrophilic
and protein repellent PEAAm regions repel cells. The experiments were continued for
approximately one month, and no change in the repellent behavior of PEAAm regions was
found.

7.4. Cell adhesion on copolymers
145
7.4. Cell adhesion of copolymers
Tri-copolymer composed of PEAAm and PBAAm with different ratios were
synthesized to explore the transition between cell attractive and repellent character
exhibited by the surface-attached poly (alkyl acrylamide) networks. In a way, these „zoom in‟
systems will also allow us to predict what is the minimum swelling required for a polymer
surfaces to repel proteins and the subsequent cellular adhesion. Those polymers with high
BAAm content (75 or 50%) are protein attractive and were also found to promote the cellular
adhesion with a usual proliferation rate. These gels are hydrophobic in nature due to the
presence of the BAAm and consequently exhibit poor to no swelling in aqueous medium (See
swelling and protein adsorption). Hence, all adhesion proteins (e.g. Fg, Fn and Vn) present in
the growth medium can bind non-specifically and mediate cell attachment.
Polymer layers with low content of BAAm (25%) or high content of EAAm (50% and
75%) show reduced cellular adhesion. This can be attributed to their hydrophilic character
due to the domination of EAAm content over BAAm. Hence, the polymer was found to swell
more in aqueous medium to the factor of 2.86 (≈ 3) and consequently repels proteins (see
section 5.6 and table 5.2). The cellular adhesion on polymeric surfaces is completely
mediated by the proteins. When there are no proteins on the surface, then the interaction of
cell receptors are strictly inhibited and thus the cell adhesion becomes impossible. Therefore,
the protein repellent polymers (75% EAAm ) showed no cellular adhesion. Similar results
were observed for tri-copolymers composed from DMAAm and DEAAm (Figure 7.7 D, E and
F).
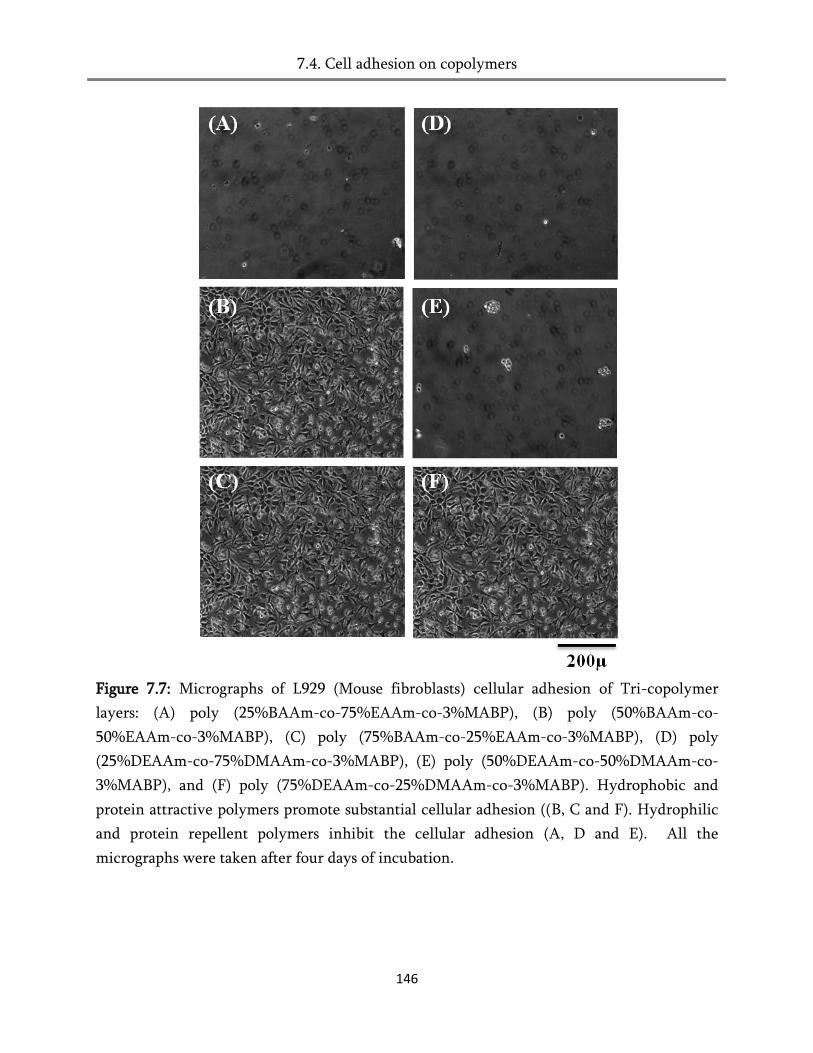
7.4. Cell adhesion on copolymers
146
Figure 7.7: Micrographs of L929 (Mouse fibroblasts) cellular adhesion of Tri-copolymer
layers: (A) poly (25%BAAm-co-75%EAAm-co-3%MABP), (B) poly (50%BAAm-co-
50%EAAm-co-3%MABP), (C) poly (75%BAAm-co-25%EAAm-co-3%MABP), (D) poly
(25%DEAAm-co-75%DMAAm-co-3%MABP), (E) poly (50%DEAAm-co-50%DMAAm-co-
3%MABP), and (F) poly (75%DEAAm-co-25%DMAAm-co-3%MABP). Hydrophobic and
protein attractive polymers promote substantial cellular adhesion ((B, C and F). Hydrophilic
and protein repellent polymers inhibit the cellular adhesion (A, D and E). All the
micrographs were taken after four days of incubation.
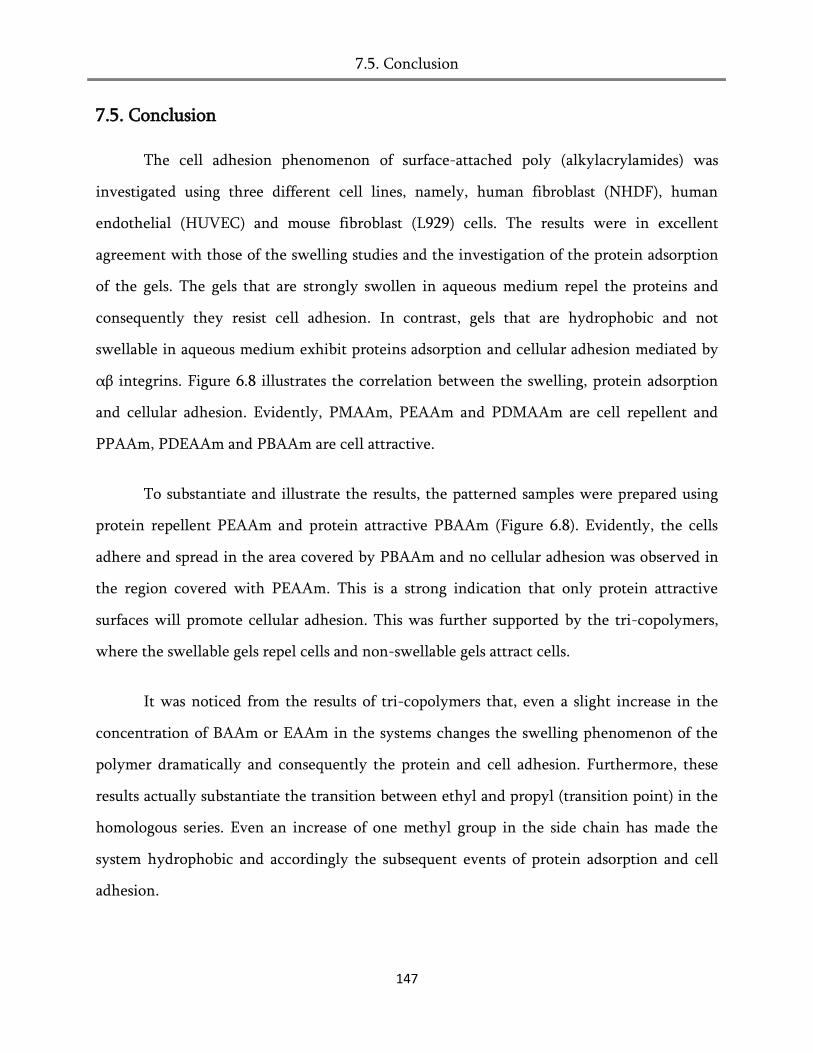
7.5. Conclusion
147
7.5. Conclusion
The cell adhesion phenomenon of surface-attached poly (alkylacrylamides) was
investigated using three different cell lines, namely, human fibroblast (NHDF), human
endothelial (HUVEC) and mouse fibroblast (L929) cells. The results were in excellent
agreement with those of the swelling studies and the investigation of the protein adsorption
of the gels. The gels that are strongly swollen in aqueous medium repel the proteins and
consequently they resist cell adhesion. In contrast, gels that are hydrophobic and not
swellable in aqueous medium exhibit proteins adsorption and cellular adhesion mediated by
αβ integrins. Figure 6.8 illustrates the correlation between the swelling, protein adsorption
and cellular adhesion. Evidently, PMAAm, PEAAm and PDMAAm are cell repellent and
PPAAm, PDEAAm and PBAAm are cell attractive.
To substantiate and illustrate the results, the patterned samples were prepared using
protein repellent PEAAm and protein attractive PBAAm (Figure 6.8). Evidently, the cells
adhere and spread in the area covered by PBAAm and no cellular adhesion was observed in
the region covered with PEAAm. This is a strong indication that only protein attractive
surfaces will promote cellular adhesion. This was further supported by the tri-copolymers,
where the swellable gels repel cells and non-swellable gels attract cells.
It was noticed from the results of tri-copolymers that, even a slight increase in the
concentration of BAAm or EAAm in the systems changes the swelling phenomenon of the
polymer dramatically and consequently the protein and cell adhesion. Furthermore, these
results actually substantiate the transition between ethyl and propyl (transition point) in the
homologous series. Even an increase of one methyl group in the side chain has made the
system hydrophobic and accordingly the subsequent events of protein adsorption and cell
adhesion.
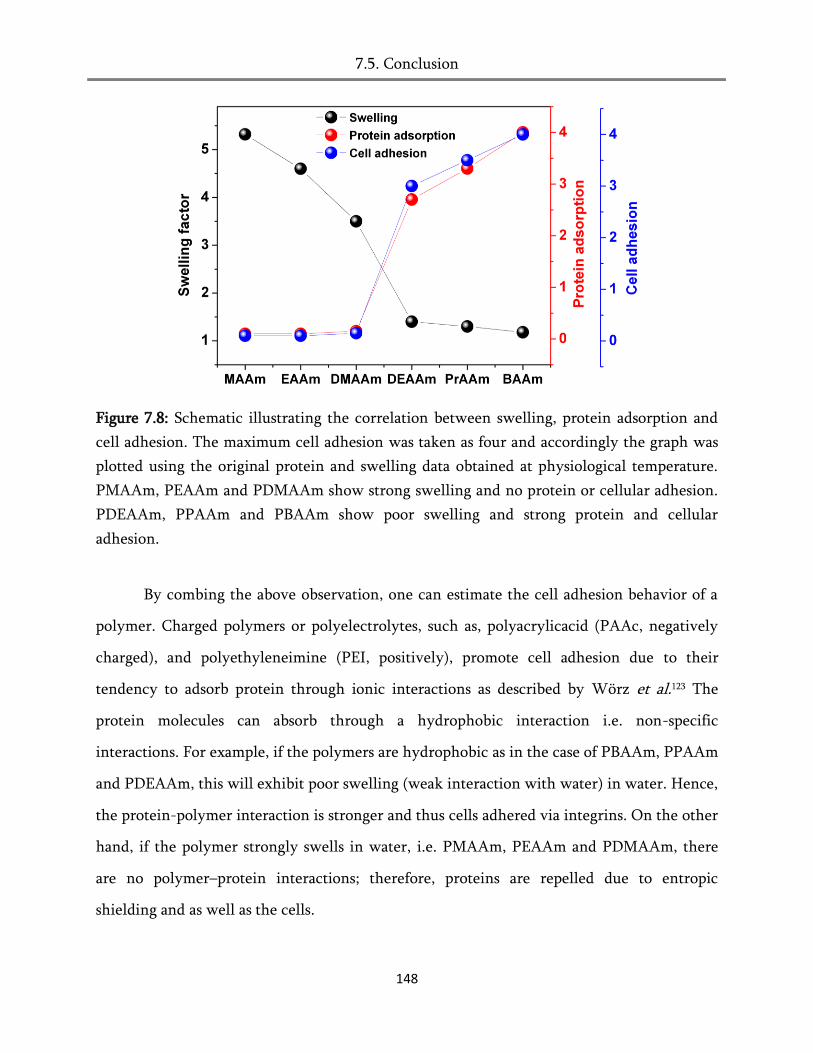
7.5. Conclusion
148
Figure 7.8: Schematic illustrating the correlation between swelling, protein adsorption and
cell adhesion. The maximum cell adhesion was taken as four and accordingly the graph was
plotted using the original protein and swelling data obtained at physiological temperature.
PMAAm, PEAAm and PDMAAm show strong swelling and no protein or cellular adhesion.
PDEAAm, PPAAm and PBAAm show poor swelling and strong protein and cellular
adhesion.
By combing the above observation, one can estimate the cell adhesion behavior of a
polymer. Charged polymers or polyelectrolytes, such as, polyacrylicacid (PAAc, negatively
charged), and polyethyleneimine (PEI, positively), promote cell adhesion due to their
tendency to adsorb protein through ionic interactions as described by Wörz et al.123 The
protein molecules can absorb through a hydrophobic interaction i.e. non-specific
interactions. For example, if the polymers are hydrophobic as in the case of PBAAm, PPAAm
and PDEAAm, this will exhibit poor swelling (weak interaction with water) in water. Hence,
the protein-polymer interaction is stronger and thus cells adhered via integrins. On the other
hand, if the polymer strongly swells in water, i.e. PMAAm, PEAAm and PDMAAm, there
are no polymer–protein interactions; therefore, proteins are repelled due to entropic
shielding and as well as the cells.

8.1. Attenuated Total Reflection spectroscopy (ATR)
149
8. Blood tube modification
The objective of this chapter is to develop an effective coating methodology that can
prevent the interaction between proteins and cells. Tubes that are currently being used in
the ventricular assist devices (VAD‟s) are made from polyvinylchloride (PVC). The product
(Medos® cannulae, size: 3/8 x 3/2.2 m) was purchased from Medos-Medizinintechnik AG
through the University hospital, Freiburg, Germany. The tube was coated with PDMAAm
through appropriate conditions and examined using surface-analytical tools, such as, contact
angle measurement and Attenuated Total reflection spectroscopy (ATR).
8.1. Attenated Total Reflection spectroscopy (ATR)
ATR was developed synchronously by Harrick280 and Fahrenfort281 It is a type of
internal reflection spectroscopy in which the sample is placed in contact with an internal
reflection element (IRE) of high refractive index (e.g. Zinc-Selenide or Germanium or
Titanium crystal). An Infrared beam is focused onto the edge of the IRE (in this case, the Zn-
Se crystal) and it is reflected through the IRE. The beam is then directed to a suitable
detector (Figure 9.1). At the sample/IRE interface, a complete internal reflection occurs and
that creates an evanescent wave. This evanescent wave penetrates a short distance into the
sample depending upon the wavelength of the incident light, where it can be absorbed.282
Consequently, an absorption spectrum of the sample in contact with the IRE or Zn-Se crystal
can thus be obtained. The spectrum is dependent on three important parameters such as the
angle of incident (θ), refractive index of the IRE (n1) and the sample (n2). The angle of
incidence or critical angle, and the penetrating depth (dp) can be obtained by using the
following equations 8.1 and 8.2, respectively.
𝜃 = 𝑠𝑖𝑛−1 𝑛2
𝑛1 (Eq.8.1)
𝑑𝑝 =𝜆
2𝜋𝑛1 𝑠𝑖𝑛2𝜃− 𝑛2 𝑛1 2 (Eq.8.2)
8.2. Modifications process
150
Figure 9.1: Schematic diagram of Attenuated Total Reflection (ATR) cell equipped with the
sample. I and R are the incident and the reflected beams, respectively.
The incoming infrared beam passes through an optically dense Zn-Se crystal and gets
reflected at the surface of the sample. When the propagating wave approaches through the
non-absorbing medium, i.e. the IRE or Zn-Se crystal, it forms a standing wave perpendicular
to the total reflecting surface. If the sample absorbs light (or energy), the propagating wave
interacts with the sample and becomes attenuated. This evanescent wave protrudes only a
few microns (0.5µ - 5µ) beyond the crystal surface and into the sample. Therefore, an
intimate contact between the sample and the surface of the crystal is utmost important for a
good spectrum.
8.2. Modification process
Polymer of interest
A thermal crosslinker styrene sulfonylazide (SSAz) developed by Kerstin Schuh was
used for the coating process. The copolymer of poly (DMAAm-co-5%SSAz) was synthesized
by following the procedures established by Schuh et al.283 The detailed mechanism of the
crosslinking process was revealed in the literature.284 Briefly, upon heating the sulfonyl azide
groups at 120°C, the nitrogen (N2) is removed, and it forms a nitrene. The resultant nitrene
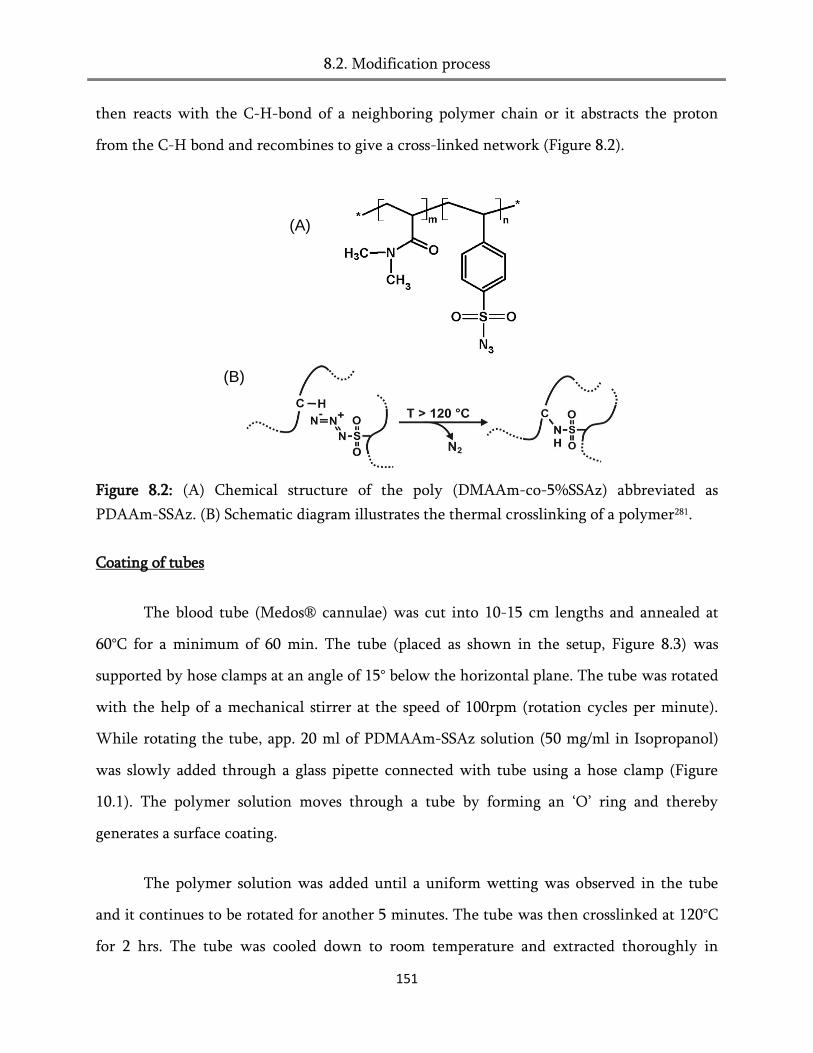
8.2. Modification process
151
then reacts with the C-H-bond of a neighboring polymer chain or it abstracts the proton
from the C-H bond and recombines to give a cross-linked network (Figure 8.2).
Figure 8.2: (A) Chemical structure of the poly (DMAAm-co-5%SSAz) abbreviated as
PDAAm-SSAz. (B) Schematic diagram illustrates the thermal crosslinking of a polymer281.
Coating of tubes
The blood tube (Medos® cannulae) was cut into 10-15 cm lengths and annealed at
60°C for a minimum of 60 min. The tube (placed as shown in the setup, Figure 8.3) was
supported by hose clamps at an angle of 15° below the horizontal plane. The tube was rotated
with the help of a mechanical stirrer at the speed of 100rpm (rotation cycles per minute).
While rotating the tube, app. 20 ml of PDMAAm-SSAz solution (50 mg/ml in Isopropanol)
was slowly added through a glass pipette connected with tube using a hose clamp (Figure
10.1). The polymer solution moves through a tube by forming an „O‟ ring and thereby
generates a surface coating.
The polymer solution was added until a uniform wetting was observed in the tube
and it continues to be rotated for another 5 minutes. The tube was then crosslinked at 120°C
for 2 hrs. The tube was cooled down to room temperature and extracted thoroughly in
(A)
(B)
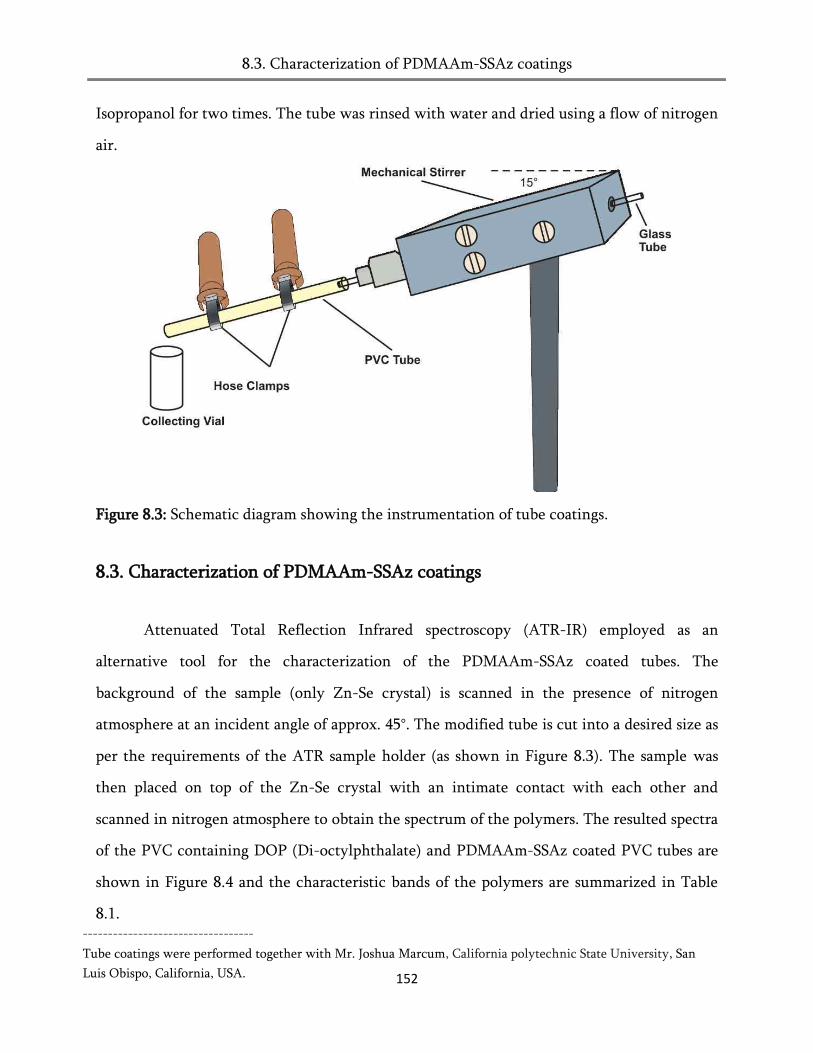
8.3. Characterization of PDMAAm-SSAz coatings
152
Isopropanol for two times. The tube was rinsed with water and dried using a flow of nitrogen
air.
Figure 8.3: Schematic diagram showing the instrumentation of tube coatings.
8.3. Characterization of PDMAAm-SSAz coatings
Attenuated Total Reflection Infrared spectroscopy (ATR-IR) employed as an
alternative tool for the characterization of the PDMAAm-SSAz coated tubes. The
background of the sample (only Zn-Se crystal) is scanned in the presence of nitrogen
atmosphere at an incident angle of approx. 45°. The modified tube is cut into a desired size as
per the requirements of the ATR sample holder (as shown in Figure 8.3). The sample was
then placed on top of the Zn-Se crystal with an intimate contact with each other and
scanned in nitrogen atmosphere to obtain the spectrum of the polymers. The resulted spectra
of the PVC containing DOP (Di-octylphthalate) and PDMAAm-SSAz coated PVC tubes are
shown in Figure 8.4 and the characteristic bands of the polymers are summarized in Table
8.1. ----------------------------------
Tube coatings were performed together with Mr. Joshua Marcum, California polytechnic State University, San
Luis Obispo, California, USA.

8.3. Characterization of PDMAAm-SSAz coatings
153
Figure 8.4: ATR spectra of PVC (A) and PDMAAm-SSAz coated PVC tube (B). DOP (Di-
octylphthalate) is a plasticizer present in the PVC tubing.
8.3. Characterization of PDMAAm-SSAz coatings
154
Table 8.1: ATR-FTIR frequencies of PVC and PDMAAm-SSAz.
Polymer Characteristic ATR-FTIR absorption frequencies
PVC
2964-2915 and 2853 cm-1 (s, CH and CH2 stretching), 1726 cm-1 (s, C=O
stretching of DOP), 1426, 1329 and 1253 cm-1 (w, CH2 and CH deformation),
1095 (w, C-C stretching), 964 cm-1 (w, CH2 deformation) and 686, 634 and
607 cm-1 (s, C-Cl stretching).
PDMAAm-
SSAz
2982 and 2873 (s, CH and CH2 stretching), 1641 cm-1 (s, –N-C=O stretching),
1528, 1496 and 1399 cm-1 (w, CH and CH2 bending), 1140- 1092 (C-O
stretching) and 750 cm-1 (w, CH bending).
w-weak, s-strong
As noticed in Figure 8.4 and Table 8.1, the results demonstrate that these two
polymers show their own characteristic bands based on the functional group present in the
moiety. PVC exhibits a strong carbonyl starching frequency at 1726 cm-1 (C=O streching of
DOP). Upon modification of PVC with PDMAAm-SSAz, the absorption intensity of the peak
(1726 cm-1) is lowered and a strong band is observed at 1645 cm-1 due to the
stretchingfrequency of carbonyl amide group of the PDMAAm-SSAz. This is ample evidence
that the PVC tube is completely covered with PDMAAm-SSAz.
In order to investigate the quality of the coatings, several samples at different
positions of the tubes were measured. In all those cases, the strong band at 1645 cm-1 was
obtained demonstrating that the tube was uniformly covered with PDMAAm-SSAz.
Furthermore, the stability of the coatings in water was examined by immersing a sample in
water for an extended period of time. The ATR-FTIR spectrum of the tube was recorded at
different time intervals and the results are shown in Figure 8.5.
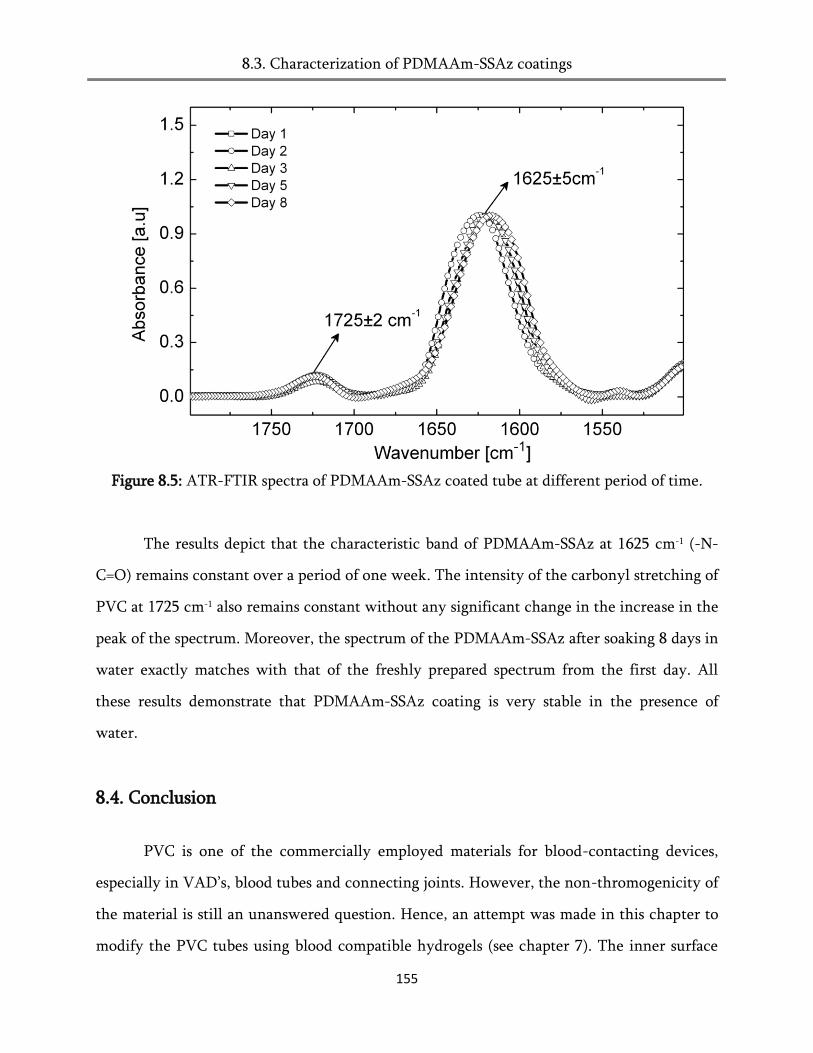
8.3. Characterization of PDMAAm-SSAz coatings
155
Figure 8.5: ATR-FTIR spectra of PDMAAm-SSAz coated tube at different period of time.
The results depict that the characteristic band of PDMAAm-SSAz at 1625 cm-1 (-N-
C=O) remains constant over a period of one week. The intensity of the carbonyl stretching of
PVC at 1725 cm-1 also remains constant without any significant change in the increase in the
peak of the spectrum. Moreover, the spectrum of the PDMAAm-SSAz after soaking 8 days in
water exactly matches with that of the freshly prepared spectrum from the first day. All
these results demonstrate that PDMAAm-SSAz coating is very stable in the presence of
water.
8.4. Conclusion
PVC is one of the commercially employed materials for blood-contacting devices,
especially in VAD‟s, blood tubes and connecting joints. However, the non-thromogenicity of
the material is still an unanswered question. Hence, an attempt was made in this chapter to
modify the PVC tubes using blood compatible hydrogels (see chapter 7). The inner surface
8.4. Conclusion
156
(or wall) of the tubes were successfully coated with PDMAAm-SSAz according to the
experimental setup as shown in Figure 8.2.
The crosslinker, styrene sulfonyl azide (SSAz) allows a simple and efficient cross-
linking upon heating the tube at 120°C for 2 hrs.283 The coating was very much similar to that
of surface-attached network on flat substrate surfaces (e.g. silica or glass substrates).The
coatings were characterized using ATR-FTIR spectroscopy. The results illustrated that the
tube contains a uniform layer of PDMAAm-SSAz. In addition, the stability of the PDMAAm-
SSAz modified tubes was examined by immersing a piece of tube in water for a prolonged
period of time and the ATR spectra was recorded at different time intervals. It was found
that the PDMAAm-SSAz network was stable in water. However, the exact homogeneity of
the coatings cannot be proved due to the restriction of the tube curvatures. More
sophisticated methods should be utilized to evaluate the coatings.
The above study is ample evidence for a modification in the blood contacting devices
or more precisely tubes or „T‟ or „Y‟ joints. Furthermore, it was successfully demonstrated
using ATR-FTIR spectroscopy. Our next step along this line of research is to perfuse with
whole blood and evaluate the non-thrombogenicity of the alkylacrylamide hydrogels at high
shear-stress conditions.
9. Summary
157
9. Summary
The lack of hemocompatibilty at the surface of blood contacting devices is still
remains a major challenge in the medical device industry.16,102,285-287 Hemocompatibility is
primarily affected by blood-material interactions which results from a multi-step process
having strong interdependencies at the individual steps, which include protein adsorption
and platelet activation.12, 288 These interactions strongly affect the short-term and long-term
thrombotic response of the employed materials. When blood is exposed to any artificial
material, the first event is an instantaneous adsorption of proteins present in the plasma.1, 115,
227, 289-290 The resulting protein layer interacts strongly with the platelet receptors on the
surface of the contacting blood platelets, anchoring the platelets onto the surface, thereby
causing platelet activation. This process of primary and secondary homeostasis finally leads
to the formation of a thrombus.26 Hence, minimizing protein adsorption is an important goal
to avoid platelet activation and the subsequent thrombus formation in blood contacting
devices.
Numerous attempts were made in an ongoing effort to develop new blood-contacting
materials.1 So far, hundreds of polymers and swellable hydrogel surfaces have been
evaluated, by taking into consideration, various aspects of their interactions with plasma
proteins (Chapter 1). Hydrogels are a promising candidate and were studied extensively due
to their excellent properties that resist proteins and platelets. However, the overall
relationship between the polymeric structure and hemocompatibility is still lacking.
Therefore, it was aim of this thesis to provide insights on the perspectives of the polymeric
structure that resist proteins and platelet cells, followed by the hemocompatibility
assessment of the surfaces.
Previously, it was shown that the poly (dimethyl acrylamide) hydrogels could resist
proteins and cells under physiological conditions.123 To stretch the thread along these lines,

9. Summary
158
we have synthesized a series of poly (alkyl acrylamides) that were structurally very similar
but differ in their number of carbon atoms at N-substitution or length of the alkyl chain at
N-substitution. All these polymers contained 2-3 mole percent of the photocrosslinker
MABP, which was sufficient to obtain the crosslinked and surface-attached networks
simultaneously. The stability of these coatings was investigated by immersing a substrate
covered with the poly (alkyl acrylamide) networks in water for a prolonged period of time.
Then the sample was taken out from water at various time intervals and the film thickness
was measured using ellipsometry in nitrogen. There was no significant change observed in
the film thickness for six months, which indicates that these coatings remained stable in an
aqueous medium.
Optical waveguide spectroscopy (OWS) was used to determine the swelling of
surface-attached poly (alkylacrylamide) networks. The film thicknesses of a series of samples
were measured in nitrogen and in aqueous medium. The polymers with shorter alkyl
substituent such as PMAAm, PEAAm and PDMAAm showed a strong anisotropic swelling in
water (swelling factor ≈ 3-5), whereas, polymers with longer alkyl substituents like PPAAm,
PBAAm and DEAAm do not swell appreciably. An increase in the carbon units at N-
substitutions increases the hydrophobicity and the swelling of the surface-attached network
decreases, accordingly. In addition, the swelling of the networks was measured as a function
of temperature in the range of 15 to 55°C. All the polymers showed almost no significant
change in the swelling with respect to the temperature except the poly (diethyl acylamide).
This polymer showed a swelling and de-swelling transition between 25°C and 37°C
indicating a LCST around 32°C.
The swelling of the surface-attached poly (alkylacrylamide) networks in humid air
was also investigated. It was found that the swelling purely depended on the hydrophilicity,
crosslink density and the amount of moisture in the environment. Analogously, the
hydrophilic coatings (PMAAm, PEAAm and PDMAAm) swelled to the factor of 1.4 i.e. it
9. Summary
159
retained approx. 30% water in their networks, when compared with that of hydrophobic
coatings (PPAAm, PBAAm and DEAAm) which were not swellable. More importantly, the
estimated volume fractions of water in the swollen networks and the volume fractions of
water in the moist air revealed that the hydrophilic and weakly crosslinked networks adsorb
water vapor from the air. The driving force for this phenomenon was the strong interactions
of the polar amide groups that are capable enough to extract water vapor from the air and
binds rather strongly.
As mentioned previously, the adsorption of plasma proteins on biomaterials plays a
important role in triggering platelet adhesion, platelet activation and the subsequent
thrombus formation.227, 289-290 Hence, the adsorption of plasma proteins such as fibrinogen
(Fg), fibrinoectin (Fn), von Willebrand factor (VWF) and vitronectin (Vn) on surface-
attached poly (alkylacrylamide) coatings was investigated using SPR spectroscopy. SPR offers
the possibility to monitor the protein adsorption in-situ and the protein ad-layer thickness
can be measured with an accuracy of less than 1 nm.123 The SPR results revealed that the
hydrophilic and water swellable coatings made from polymers containing shorter alkyl
substituents (PMAAm, PEAAm and PDMAAm) were absolutely protein resistance. The
hydrophobic and water non-swellable coatings with longer alkyl substituent (PPAAm,
PBAAm and PDEAAm) showed a stronger protein adsorption. Such discrepancies in the
protein adsorption of these coatings can be explained by considering the Gibbs free energy
adsorption process and the mesh size of the surface-attached gels.
When hydrophobic patches of the protein interact with a hydrophobic polymer
attached to the substrate surface, the Gibbs free energy of adsorption (∆Gads) is dominated by
the enthalpy of adsorption (∆Hads) due to strong interactions with each other. As a result, the
Gibbs free energy of adsorption ∆Gads becomes negative and thus the adsorption of proteins is
thermodynamically favorable.
9. Summary
160
However, the situation is quite different for the hydrophilic and swollen surface-
attached networks (PMAAm, PEAAm and PDMAAm) where the enthalpy of adsorption is
almost equals to zero i.e. no interaction takes place between the polymer and the proteins.
Under these circumstances, the contribution from the entropy of adsorption (∆Sads)
dominates the overall Gibbs free energy adsorption process. The ∆Sads contains the entropy of
mixing (∆Smix) and the entropy of configuration (∆Sconf). The ∆Smix represents the uniform
distribution of molecules present in the system and is relatively low for most protein
adsorptions. The ∆Sconf represents the significant chain stretching or contraction of polymers.
The surface-attachment of the networks renders the systems to swell only in one
direction, i.e. perpendicular to the substrate surface. Due to this reason, the swelling is
anisotropic and at equilibrium; all chains of the swollen networks are stretched to the
maximum. The diffusion of protein molecules into this layer would require an even stronger
swelling of the network. Such an additional stretching of the layer would further reduce the
entropy of the chain. As this entropy loss is not compensated by any gain in the enthalpy due
to adsorption, the Gibbs free energy of the process becomes positive and the protein
adsorption into these layers becomes energetically unfavorable. This prevention of unspecific
protein adsorption driven by the entropic situation is termed as „entropic shielding‟.
Therefore, the strongly swellable coatings PMAAm, PEAAm, and PDMAAm repel proteins
effectively. However, the entropic shielding alone may not always be the major cause for the
observed protein repellency of these swollen networks. Larger protein molecules may simply
not fit into the meshes of the networks. These proteins may be exclused by size.
The mesh size of the surface-attached poly (alkylacrylamide) networks was calculated
in the swollen state. The pores of the hydrophilic networks (PMAAm, PEAAm, and
PDMAAm) were larger (ξ = 48, 38 and 20 nm) than the hydrophobic coatings (PPAAm,
PBAAm, PDEAAm) which had pores less than 4 nm. However, the mesh is not a useful

9. Summary
161
parameter for non-swollen networks since they have strong hydrophobic interactions with
proteins. The mesh size of the swollen gels imply that some of the proteins in this study, i.e.
the larger ones, (e.g. Fg, VWF and Fn) with radii of gyration of around 16 nm or a diameter
of 32 nm might also be exclused by size. The small proteins however, which are still being
repelled by the swollen layers must be kept out by mechanism such as entropic shielding.
Platelet adhesion is an important factor governing the hemocompatibility of the
materials that are applicable in the blood contacting devices. Platelet adhesion and
aggregation would lead to the formation of thrombus. If such an event occurs at surface of
the implant, it may cause even a severe life-threatening problem. Hence, to evaluate the
hemocompatibilty of the surface-attached poly (alkylacrylamide) networks, platelet adhesion
experiments were performed using platelet rich plasma (PRP). The protein attractive
alkylacrylamide coatings showed strong platelet adhesion with normal pseudopodia. The
protein repellent coatings showed reduced or no platelet adhesion. Usually, the platelet
adhesion is mediated through glycoproteins such as GbIIb/ GbIIIa. Especially, under static
conditions the adsorbed Fg enhances the platelet activation and adhesion. In the absence of
Fg or any other plasma proteins the platelet activation is not possible and that was the reason
the protein resistance surfaces, such as, PMAAm, PEAAm and PDMAAm did not allow
platelet adhesion.
However, most of the medical devices are in contact with blood flow. Hence, the
evaluation of hemocompatibility of the biomaterials under flow condition is important for
any blood contacting device application. Accordingly, the platelet adhesion experiments
were performed at different shear rates (5, 10, 20 and 40 dyn cm-2) on surface-attached
networks. Before the perfusion of platelets, the samples were pre-incubated with Fg or VWF.
These proteins were identified to enhance the activation and adhesion of platelets. Again, the
swollen coatings did not show platelet adhesion at any shear rate, while the hydrophobic
coatings had a strong platelet adhesion. These results were in good agreement with results
9. Summary
162
obtained at static conditions. Hence, the same explanation can be applicable here as well.
Nevertheless, these coatings were not damaged even at a very high shear rate of 40 dyn cm-2
is an added evidence for their brilliant stability under flow situations.
The cell compatibility of the surface-attached poly (alkylacrylamide) networks was
examined using three different cell lines, Human Umbilical Vein Endothelial Cells
(HUVEC), Normal Human Dermal Fibroblasts (NHDF) and Mouse Fibroblasts (L929). The
hydrophobic polymers such as PPAAm, PDEAAm and PBAAm showed an excellent cell
adhesion and proliferation with respect to time. The proteins present in the cell growth
medium quickly adsorbed onto the surface, which later mediated the cells through αβ
integrins. In contrast to that the hydrophilic coatings made from PMAAm, PEAAm and
PDMAAm did not show any cellular adhesion even after a prolonged period time in culture
medium. This is again a consequence of the swelling of the coatings in aqueous medium and
as a result, they repel proteins for entropic reasons. As there were no proteins on these
surfaces, also cellular adhesion is not possible. To explore further, the cell culture
experiments were performed on patterned glass substrates fabricated using hydrophilic and
hydrophobic alkyl acrylamides. Again, the cells were able to grow and proliferate only in the
region where the surface was covered with hydrophobic polymers, while it was repellent in
the area covered with hydrophilic polymers. Furthermore, the experiment on the PDMAAm
patterned sample was continued for a period of six months and it was found that no cellular
adhesion was observed in the area coated with PDMAAm polymers, which is an added
evidence for the strong repellent character of these coatings.
Finally, the results of this study suggest design rules for the identification of potential
candidates for blood contacting non-thrombogenic surfaces. A suitable layer will consist of
neutral, water swellable surface-attached polymer networks. Any changes to the layer, varies
the hydrophilic/hydrophobic balance, which in turn will make the polymer more
hydrophobic. This will also induce cell or platelet adhesion and render the surface blood
9. Summary
163
incompatible. In conclusion, the results demonstrate tha the interaction of a material with a
biological environment requires a precise control of the surface physical properties and a
careful choice of parameters used for evaluation.
10.Zusammenfassung
164
10. Zusammenfassung
Aufgrund der fehlendenden Hämokopatibilität der Oberflächen implantierter
Geräte, steht die Untersuchung blutkompatibler Materialien im Fokus der Forschung der
Medizintechnik.16,102,285-287 Die Hämokompatibilität wird hauptsächlich von den
Wechselwirkungen zwischen Blut und Materialoberfläche beeinflusst. Es handelt sich
hierbei um einen Prozess, der aus mehreren Einzelschritten besteht, z.B. Proteinadsoption
und Thrombozytenaktivierung.12, 288 Die Wechselwirkungen beeinflussen die Kurz- und
Langzeitreaktion der Thrombozyten auf das eingesetzte Material sehr stark. Werden die
Oberflächen künstlicher Materialen Blut ausgesetzt, kommt es zu einer plötzlichen
Adsorption von Plasmaproteinen.289-290 Die so entstandene Proteinschicht reagiert nun mit
Rezeptoren an der Oberfläche der Thrombozyten. Diese haften an der Materialoberfläche
und werden aktiviert. Dieser Prozess der primären und sekundären Homeostase führt
schließlich zur Bildung von Thromben.26 Die Minimierung der Proteinadsorption sollte
somit die Aktivierung der Thrombozyten und damit auch die Bildung von Thromben
verhindern.
Bisherige Studien zeigen, dass Polydimethylacrylamidhydrogele zell- und
proteinabweisende Eigenschaften unter physiologischen Bedingungen aufweisen.1
Ausgehend von diesen Erkenntnissen wurde ein Reihe unterschiedlicher
Polyalkylacrylamide synthetisiert. Diese weisen eine sehr grosse strukturelle Ähnlichkeit
auf, unterscheiden sich aber dennoch in der Anzahl bzw. der Länge der Kohlenstoffketten
am Amidstickstoff. Zur Erzeugung beständiger, oberflächengebundener Hydrogelschichten
wurden alle hergestellten Polymere mit 2-3 % des Photovernetzers MABP versehen.
Die Quellungseigenschaften der oberflächengebundenen Polymernetzwerke wurde
mittels Oberflächenplasmonenspektroskopie (SPR) untersucht. Dazu wurden die
entsprechenden Schichtdicken der Polymerfilme im trockenen und im gequollenen Zustand
10.Zusammenfassung
165
bestimmt. Aus diesen Werten wurde dann der entsprechende Quellgrad ermittelt. Polymere
mit kurzen N-Alkylresten, wie PMAAm, PEAAm und PDAAm, zeigen eine starke
anisotrope Quellung in Wasser (Quellgrad ≈ 3-5). Dagegen zeigen die Polymere mit längeren
N-Alkylresten, wie PPAAm, PBAAm und DEAAm, kein ausgeprägtes Quellverhalten. Eine
Verlängerung der Kohlenstoffketten am Amidstickstoff führt damit zur Vergrösserung der
Hydrophobizität und damit zu einer Verminderung der Quellungsfähigkeit. Dies resultiert
aus den verstärkten hydrophoben Wechselwirkungen der Alkylgruppen und der daraus
resultierenden schlechteren Wechselwirkung mit Wasser.
Weiterhin wurde die Adsorption von Plasmaproteinen (z.B. Fibrinogen (Fg),
Fibrinoectin (Fn), von Willebrand Faktor (VWF) und Vitronectin (Vn)) auf
oberflächengebundenen Polymerfilmen mittels SPR-Spektroskopie untersucht. Die
hydrophilen und in Wasser quellbaren Polymerschichten (PMAAm, PEAAm und
PDMAAm) zeigten eine vollständige Resistenz gegen Proeinadsorption, wohingegen die
hydrophoben und nicht in Wasser quellbaren Polymerschichten (PPAAm, PBAAm und
PDEAAm) eine ausgeprägte Proteinadsorption aufweisen. Diese ist auf starke
Wechselwirkung zwischen dem hydrophoben Polymer und hydrophoben
Proteinsegmenten zurückzuführen. Die proteinabweisenden Eigenschaften der hydrophilen
Polymere sind ein Resultat der starken Quellung. Durch die Quellung in Wasser sind die
Polymerseitenketten sehr stark gestreckt. Unter diesen Bedingungen würde das Eindringen
von Proteinen oder Proteinsegmenten eine weitere Streckung der Polymerketten erfordern.
Thermodynamisch betrachtet würde diese weitere Streckung einen sehr großen
Entropieverlust bedeuten. Der entsprechende Enthalpiegewinn ware dann vergleichsweise
klein, sodass eine Proteinadsorption nicht stattfinden kann. Diese entropiegetriebene
proteinabweisende Eigenschaft quellbarer Polymerschichten wird als entropische
Abschirmung (oder entropic shielding) bezeichnet. Neben dieser entropischen Abschirmung

10.Zusammenfassung
166
kann ebenfalls die Größe der eindringenden Moleküle, verglichen mit der Porengröße der
Netzwerke in Betracht gezogen werden.
Um die Hämokompatibilität der Polyakrylamidschichten zu untersuchen wurden
Thrombozytenadhäsionsexperimente mit thrombozytenreichem Plasma (PRP) durchgeführt.
Erwartungsgemäss zeigten die proteinattraktiven Polyacrylamidschichten eine starke
Thrombozytenadsorption, wohingegen die proteinabweisenden Polymerschichten eine
reduzierte bzw. keine Thrombozytenadsorption zeigten. Die eingesetzten Thrombozyten
wurde durch Zugabe von Glycoproteinen, wie GbIIb/ GbIIIa, aktiviert. Speziell unter
statischen Bedingungen unterstützt adsorbiertes Fg die Thrombozytenaktivierung bzw. –
adhäsion. Ohne jegliche Plasmaproteine ist eine Thrombozytenaktivierung unmöglich.
Damit erklären sich die proteinresistenten Eigenschaften der hydrophilen und stark
quellbaren Polymeroberflächen (PMAAm, PEAAm und PDMAAm).
In Anlehnung an die Proteinadsorptions- und Hämokompatibilitätsstudien wurde
ebenfalls die Zellkompatibilität der Polymerschichten untersucht. Dazu wurden 3
verschiedene Zellinien eingesetzt: humane Hautfibroblasten, Endothelzellen und
Mausfibroblasten. Die hydrophoben Polymerschichten, wie PPAAm, PDEAAm und PBAAm
zeigten eine hervorragende Zelladhäsion und -proliferation. Dagegen zeigten die
hydrophilen, stark quellbaren Oberflächen aus den Polymeren PMAAm, PEAAm und
PDMAAm, auch nach längeren Zeit im Zellkulturmedium keinerlei Zelladhäsion aufgrund
der entropischen Abschirmung. Zelladhäsion lässt sich damit als ein Abfolge von
Einzelschritten beschreiben, wobei die Ablagerung von Proteinen auf Oberflächen eine
tragende Rolle spielt. Können sich keine Proteine auf einer Oberfläche ablagern, wird das
Zellwachstum vollständig verhindert.

10.Zusammenfassung
167
Aus diesen Erkenntnissen lassen sich damit Richtlinien für die Entwicklung von
blutkompatiblen und thrombusfreien Oberflächen ableiten. Eine geeignete Oberfläche sollte
aus einem neutralen, wasserquellbaren und oberflächengebundenen Polymernetzwerk
bestehen. Veränderungen der Oberfläche führen zu einer Verschiebung des Gleichgewichts
zwischen hydrophilen und hydrophoben Wechselwirkungen der Oberfläche mit dem
Umgebungsmedium. Dies kann unter anderem zur Adsorption von Lipidmolekülen führen,
welche wiederrum für eine erhöhte Hydrophobizität de r Oberfläche sorgen. Dieser Vorgang
führt dann ebenfalls zu Zell- bzw. Thrombozytenadhäsion, resultierend in einer
Blutinkompatibilität. Die in dieser Arbeit hergestellten Polymerschichten stellen also einen
Ausgangspunkt für die Entwicklung medizinisch nutzbarer, blutkompatibler Oberflächen
dar.

11.1. Materials
168
11. Experimental section
11.1. Materials
11.1.1. Chemicals, solvents and reagents
Acetone (p.a) Roth
Acrylamide (>98%) Fluka
Allylbromide Fluka
4-aminobenzophenone Fluka
4,4‟-Azobis(isobutyronitrile) Fluka
4-Benzoylbenzoic acid Fluka
1-Butanol (p.a) Roth
Butylacrylamide ABCR GmbH&Co KG, Germany
Chloroform-d Roth
Chloroform (p.a) Roth
Calcium chloride Sigma-Aldrich
Dichloromethane (p.a) Roth
Diethylether (p.a) Roth
Diethyacrylamide ABCR GmbH&Co KG, Germany
Dimethyacrylamide Sigma-Aldrich
Dimethylchlorosilane Fluka
Dimethylformamide (p.a) Roth
Dimethylsulphoxide (p.a) Roth
1,4-Dioxane (p.a) Roth
Ethanol (abs or 100%) Sigma-Aldrich
Ethanol (p.a) Roth
Ethyl acetate (p.a) Roth
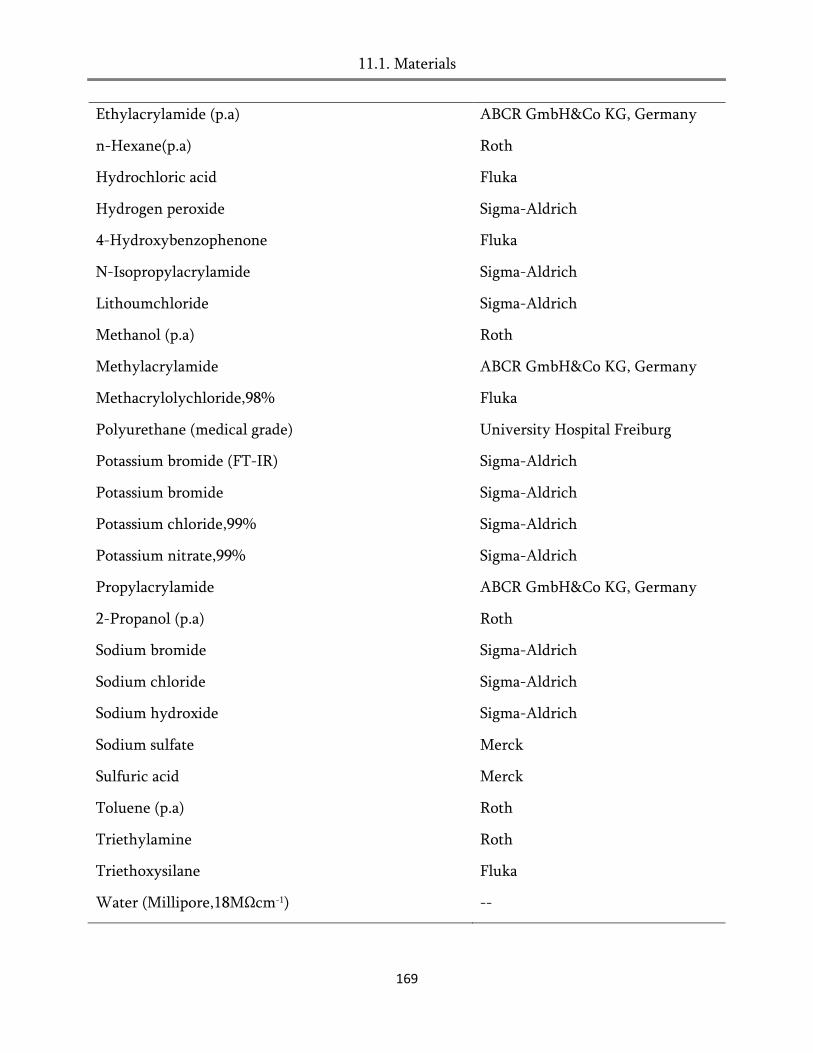
11.1. Materials
169
Ethylacrylamide (p.a) ABCR GmbH&Co KG, Germany
n-Hexane(p.a) Roth
Hydrochloric acid Fluka
Hydrogen peroxide Sigma-Aldrich
4-Hydroxybenzophenone Fluka
N-Isopropylacrylamide Sigma-Aldrich
Lithoumchloride Sigma-Aldrich
Methanol (p.a) Roth
Methylacrylamide ABCR GmbH&Co KG, Germany
Methacrylolychloride,98% Fluka
Polyurethane (medical grade) University Hospital Freiburg
Potassium bromide (FT-IR) Sigma-Aldrich
Potassium bromide Sigma-Aldrich
Potassium chloride,99% Sigma-Aldrich
Potassium nitrate,99% Sigma-Aldrich
Propylacrylamide ABCR GmbH&Co KG, Germany
2-Propanol (p.a) Roth
Sodium bromide Sigma-Aldrich
Sodium chloride Sigma-Aldrich
Sodium hydroxide Sigma-Aldrich
Sodium sulfate Merck
Sulfuric acid Merck
Toluene (p.a) Roth
Triethylamine Roth
Triethoxysilane Fluka
Water (Millipore,18MΩcm-1) --
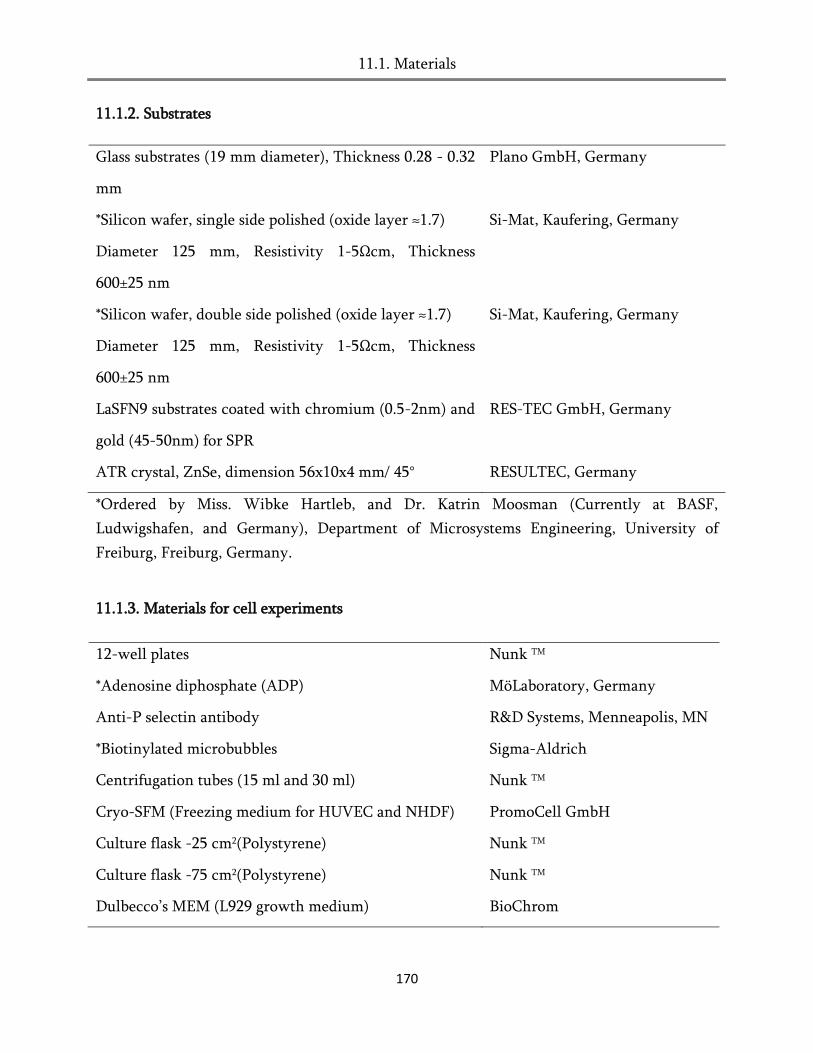
11.1. Materials
170
11.1.2. Substrates
Glass substrates (19 mm diameter), Thickness 0.28 - 0.32
mm
Plano GmbH, Germany
*Silicon wafer, single side polished (oxide layer ≈1.7)
Diameter 125 mm, Resistivity 1-5Ωcm, Thickness
600±25 nm
Si-Mat, Kaufering, Germany
*Silicon wafer, double side polished (oxide layer ≈1.7)
Diameter 125 mm, Resistivity 1-5Ωcm, Thickness
600±25 nm
Si-Mat, Kaufering, Germany
LaSFN9 substrates coated with chromium (0.5-2nm) and
gold (45-50nm) for SPR
RES-TEC GmbH, Germany
ATR crystal, ZnSe, dimension 56x10x4 mm/ 45° RESULTEC, Germany
*Ordered by Miss. Wibke Hartleb, and Dr. Katrin Moosman (Currently at BASF,
Ludwigshafen, and Germany), Department of Microsystems Engineering, University of
Freiburg, Freiburg, Germany.
11.1.3. Materials for cell experiments
12-well plates Nunk TM
*Adenosine diphosphate (ADP) MöLaboratory, Germany
Anti-P selectin antibody R&D Systems, Menneapolis, MN
*Biotinylated microbubbles Sigma-Aldrich
Centrifugation tubes (15 ml and 30 ml) Nunk TM
Cryo-SFM (Freezing medium for HUVEC and NHDF) PromoCell GmbH
Culture flask -25 cm2(Polystyrene) Nunk TM
Culture flask -75 cm2(Polystyrene) Nunk TM
Dulbecco‟s MEM (L929 growth medium) BioChrom

11.1. Materials
171
Dulbecco‟s phosphate buffered saline w/o Ca2+ and Mg 2+,
PBS
BioChrom
Endothelial cell growth medium PromoCell GmbH
Ethanol, absolute Sigma-Aldrich
Fetal Bovine serum (FBS) Superior BioChrom
Fibroblasts growth medium PromoCell GmbH
Flow chamber Glycotech
Formaldehyde Fluka
Glutaraldehyde Fluka
Haemacytometer VWR international GmbH
Hexamethyldisiloxane (HMDS) Sigma-Aldrich
Hepess buffer PromoCell GmbH
*Human Fibrinogen Enzyme Research Laboratory,
Swansea, United Kingdom
Human umbilical vein endothelial cells (HUVEC) PromoCell GmbH
L-Glutamine BioChrome
Micro tips sterilized (100μl, 200μl and 1000μl) Nunk TM
Normal human dermal fibroblasts (NHDF) PromoCell GmbH
Penicillin streptomycin solution Sigma-Aldrich
Pipettes (1ml, 5ml, 10ml and 25 ml) Nunk TM
*Platelet cells (Fresh) ‡Volunteer
†Platelet rich plasma (PRP) ‡Volunteer
*Polystyrene culture dish (35mm) Corning, NY
*Sialyl Lewisa-polyacrylamide biotin Glycotech,Gaithersburg,MD
*Streptavidin Sigma-Aldrich
Trypsin/EDTA Sigma-Aldrich
Tryptan Blue (0.4% (w/v)) Sigma-Aldrich
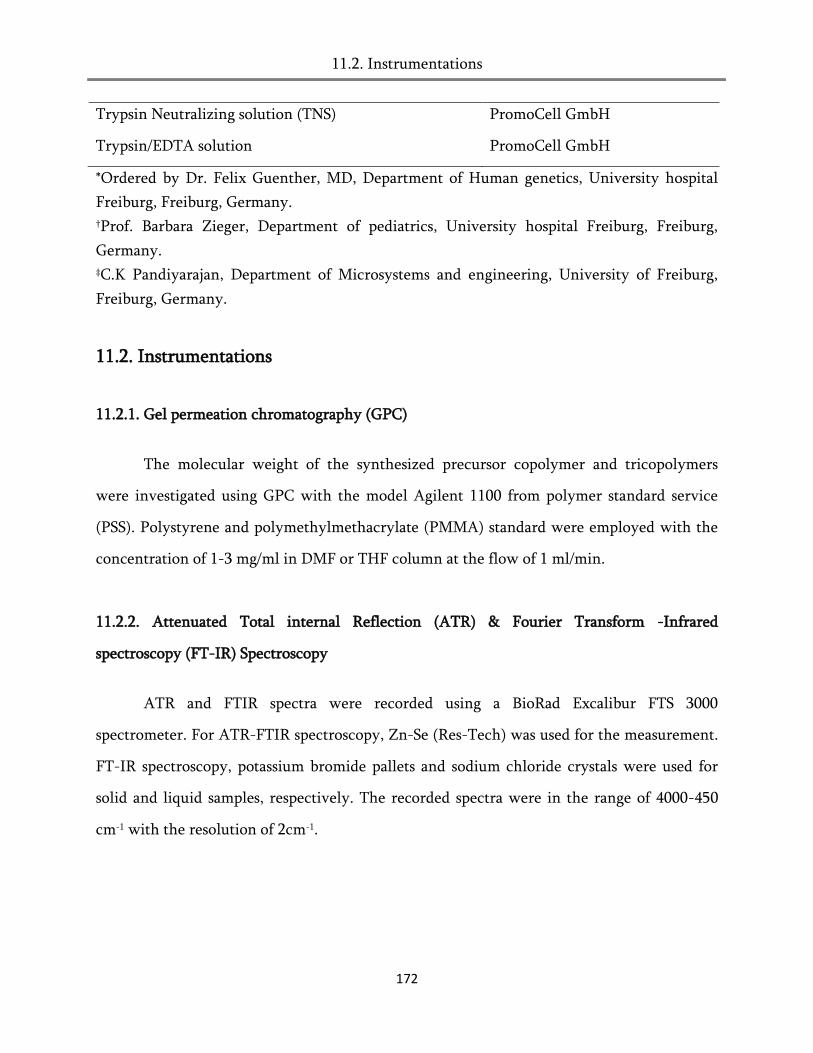
11.2. Instrumentations
172
Trypsin Neutralizing solution (TNS) PromoCell GmbH
Trypsin/EDTA solution PromoCell GmbH
*Ordered by Dr. Felix Guenther, MD, Department of Human genetics, University hospital
Freiburg, Freiburg, Germany. †Prof. Barbara Zieger, Department of pediatrics, University hospital Freiburg, Freiburg,
Germany. ‡C.K Pandiyarajan, Department of Microsystems and engineering, University of Freiburg,
Freiburg, Germany.
11.2. Instrumentations
11.2.1. Gel permeation chromatography (GPC)
The molecular weight of the synthesized precursor copolymer and tricopolymers
were investigated using GPC with the model Agilent 1100 from polymer standard service
(PSS). Polystyrene and polymethylmethacrylate (PMMA) standard were employed with the
concentration of 1-3 mg/ml in DMF or THF column at the flow of 1 ml/min.
11.2.2. Attenuated Total internal Reflection (ATR) & Fourier Transform -Infrared
spectroscopy (FT-IR) Spectroscopy
ATR and FTIR spectra were recorded using a BioRad Excalibur FTS 3000
spectrometer. For ATR-FTIR spectroscopy, Zn-Se (Res-Tech) was used for the measurement.
FT-IR spectroscopy, potassium bromide pallets and sodium chloride crystals were used for
solid and liquid samples, respectively. The recorded spectra were in the range of 4000-450
cm-1 with the resolution of 2cm-1.
11.2. Instrumentations
173
11.2.3. Nuclear Magnetic Resonance (NMR) spectroscopy
1HNMR (Proton NMR) and 13CNMR (Carbon NMR) spectra were acquired using
Avance 250MHz spectrometer from Brucker. For 1HNMR, the sample was dissolved in CDCl3
or d6-DMSO with the concentration of 10-20 mg/ml. For 13CNMR, the concentration of
solution was around 100-150 mg/ml.
11.2.4. Dip coating and spin coatings
The samples for SPR and Ellipsometry were prepared through dip coating using Z 2.5
tension testing machine from Zwicki GmbH. The precursor polymer with the concentration
5-20 mg/ml in a good solvent was prepared. The substrate sample, which was held using a
sample holder was dipped or immersed at the velocity of 100 mm/min and pulled at 100
mm/min. All of the dip coating was performed at an ambient room condition with the
temperature of around 25°C.
The spin coating of the samples was achieved by B.L.E. Delta 10 Spin coater at a
rotation speed of 2500 rpm for 60S at room temperature of around 25°C. The spin coating
was mainly employed to prepare thick polymer layers, like in the case of swelling and often
for cell experiments with extra care.
11.2.5. Contact angle measurements
Static contact angles of the surface-attached networks were measured using the sessile
drop method though an Optical Contact Angle Meter (OCA 20) setup (Dataphysics,
Filderstadt, Germany), with a liquid dispenser and an image processing program which
provides an automatic determination of the contact angles. The temperature during the
measurement was controlled by using peltier - 50.

11.2. Instrumentations
174
11.2.6. Ellipsometry
The deposited film thickness of the polymer layers were measured using auto-nulling
ellipsometry from Nanofilm (EP3) operated at the wavelength of λ= 532 nm at variable
angular modes from 45-75°. The thickness of the film was fitted using software called EP3
view with the help of the self-made model. All the thickness analysis was performed with an
object of 5x and at four zone measurements.
11.2.7. Atomic force microscopy (AFM)
AFM micrographs were recorded using Nanoscope IIIa microscope (digital
instrument, Santa Barbara, CA) and the microscope was operated in tapping mode, using
commercial tips with a frequency of ≈330kHz, and spring constant of ≈42 N/m. All the AFM
micrographs were obtained in ambient condition at room temperature of around 25°C.
11.2.8. Surface Plasmon Resonance (SPR) and Optical waveguide spectroscopy (OWS)
SPR and OWS measurements were performed with an instrument constructed with
Kretchmann configuration from RES-TEC. Where, He-Ne having the wavelength of 633 nm
(λ = 632.8 nm) was used as an efficient light source. The optical components of the films
were obtained by using the Fresnel simulation with the help of software winspall 3.02
developed by the Max Planck Institute for Polymer Research at Mainz. The real (ε1) and
imaginary (ε11) permittivity constants of the metal layers are summarized in the table 10.1.

11.2. Instrumentations
175
Figure 11.1: (A) Instrumentation of SPR/OWS. (B) Kretchmann configuration used in the SPR.
Table 11.1: Optical components materials that are employed in the SPR measurements.
Layer Thickness (nm) ε1 ε11
LaSFN9 --* 3.4036 0
Cr 0.3-2 -6.3 17-20
Au 45-50 -12.3 1.29
Polymers --† 2.2-2.4 0
H2O 1.769 0
PBS 0 1,769 0
N2 0 1 0
*Glass substrate with high refractive index of around 1.8
†Thickness varied from 400 nm to 800 nm.
(B)
(A)
11.3. Synthesis and characterizations of polymers
176
11.2.9. Peristaltic pump
The protein and PBS buffer solution was injected to the SPR flow cell using peristaltic
pump from Ismatec®, Type 1SM596D, Switzerland. The pump was operated in flow mode
with the flow rate of 100μl s-1. The machine was calibrated prior to the usage by measuring
the amount of liquid with respect to the time using the standard measuring cylinder.
11.2.10. Humidity sensor
The humidity and temperature of the SPR chamber was measured using Testo© 635-
1/2 (USA) humidity sensor. It has the detection resolution of 0.1% and can measure from 0 to
100% humidity. The accuracy and performance of the sensor was checked by measuring the
humidity and temperature of the standard cell culture incubator, which has automated with
the humidity sensor.
11.2.11. Calorimetry
The heat of hydration of the polymers were measured using solution calorimetry from
Thermometric Precision Solution Calorimeter (Thermometric AB) along with the software
called SolCal.
11.3. Synthesis and characterization of monomers and polymers
11.3.1. Synthesis 4-[3-(Triethoxy silyl)propyloxy]benzophenone
5g of 4-Allyloxy benzophenone was dissolved in ca.20 ml of freshly distilled dimethyl
chloro silane. 70 mg of Pt-C was then added to the reaction mixture slowly which was then
refluxed at 120°C for 5 hrs under nitrogen. After completion of reaction, the excess triethoxy
silane was removed by evaporation under vacuum. The catalyst was removed by filtration of
11.3. Synthesis and characterizations of polymers
177
the solution under nitrogen. This solution was then directly used to prepare the surface
attached polymer networks.
FT-1NMR: δ = 0.8 ppm (t, 2H, CH2-*CH2-Si), δ = 1.2 ppm (m, 9H, *CH3-CH2-O), δ = 1.9 ppm
(p, 2H, O-CH2-*CH2-CH2-Si), δ = 3.8 ppm (q, 6H, CH3-*CH2-O), δ = 4.0 ppm (t, 2H, O-*CH2-
BP), δ = 7.8-6.9 ppm (m, 9H, C-Haro)
11.3.2. Synthesis of 4-Methacryloyl-oxy-benzophenone (MABP)
In a typical run, 11.5 g of methacryloyl chloride in 40 ml of dichloromethane (DCM)
was added to a solution containing 19.8 g of 4-hydroxybenzophenone and 11.12 g of
triethylamine in 200 ml of DCM, while the reaction mixture was cooled in an ice bath. The
mixture was allowed to warm to room temperature and stirred overnight. After completion
of reaction, the mixture was thoroughly washed with 5% HCl, NaHCO3 solution and water
(Three times each). Then, the solution (organic phase) was added into a beaker containing
cold n-hexane (1:10) and kept in a freezer at -20 °C overnight to complete precipitation:
Subsequently, the precipitate was filtered off at 0°C, dried in vacuum and re-crystallized
from 10% ethyl acetate- hexane mixture. (1:9).
FT-IR: 3049(=C-H), 2980-2927(-C-H), 1732(-C=O), 1653(-HN-C=O), 1596(-C=C-) and 1446(-
C-H) cm-1
FT-1NMR: δ = 2.1 ppm (s, 3H, *CH3), δ = 5.7-6.3 ppm (2s, 2H, *CH2=), δ = 7.1-7.9 ppm
(various m, 9H, C-Haro)
11.3.3. Synthesis of Poly (alkylacrylamide-co-MABP)
A 100 ml Schlenk tube was dried using vacuum and charged with the 97 mmol of
acrylamides , 3 mmol of MABP and 14 mg of AIBN. The above mixture was dissolved in 20-
25 ml of MeOH for MAAm, DMAAm, EAAm and PAAm and THF for BAAm and DEAAm.
11.3. Synthesis and characterizations of polymers
178
Then, the schenk tube was closed carefully and degassed under nitrogen through three freeze
and thaw cycles: Polymerization was carried out at 60°C overnight in a thermostated water
bath. After completion of polymerization the polymer was precipitated in diethyl ether and
repeated for three times.
Figure 11.1: Molecular structures of the monomers used in the study.
Table 11.2: Synthetic details of Poly (alkyacrylamide-co-MABP)
Polymer Monome
r
(mmol)
MABP
(mmol)
Solvent for
polymerization
Solvent for
precipitation
*Mol.wt
(g/mol)
P(MAAm-co-MABP) 97 3 Methanol Ether 82000
P(EAAm-co-MABP) 97 3 Methanol Ether 70000
P(PAAm-co-MABP) 97 3 Methanol Ether 66000
P(BAAm-co-MABP) 97 3 THF Water 49000
P(DMAAm-co-MABP) 97 3 Methanol Ether 91000
P(DEAAm-co-MABP) 97 3 THF n-Hexane 52000
*Mw (weight average molecular weight)
Poly (MAAm-co-MABP)
FT-IR: 3314 (-HN-), 3019(=C-H), 2941(-C-H), 1727(-C=O), 1651(-HN-C=O), 1546 (-
C=C-) and 1410(-C-H) cm-1

11.3. Synthesis and characterizations of polymers
179
FT-1NMR: δ = 1.9-1.4 ppm (*CH2-CH), δ = 2.5 ppm (*CH3-NH), δ = 3.3 ppm (*CH-
CH2), δ = 7.8-7.3 ppm (C-Haro)
Poly (EAAm-co-MABP)
FT-IR: 3319 (-HN-), 3018 (=C-H), 2972- 2934(-C-H), 1743(-C=O), 1646(-HN-C=O),
1531(-C=C-) and 1448 (-C-H) cm-1
FT-1NMR: δ = 1.0 ppm (*CH3-CH2-NH), δ = 1.9-1.5 ppm (*CH2-CH), δ = 3.0ppm (*CH-
CH2), δ = 3.3 ppm (*CH2-NH), δ = 7.8-7.2 ppm (C-Haro)
Poly (PAAm-co-MABP)
FT-IR: 3314(-HN-), 3081(=C-H), 2962-2933(-C-H), 1741(-C=O), 1650(-HN-C=O),
1536(-C=C-) and 1459 (-C-H) cm-1
FT-1NMR: δ = 0.9 ppm (*CH3-CH2-CH2-NH), δ = 1.5 ppm (CH3-*CH2-CH2-NH), δ =
2.3-1.7 ppm (*CH2-CH), δ = 2.9 ppm (*CH-CH2), δ = 3.15 ppm (*CH2-NH), δ = 7.9-7.5
ppm (C-Haro)
Poly (BAAm-co-MABP)
FT-IR: 3317(-HN-), 3080(=C-H), 2958-2931(-C-H), 1741(-C=O), 1647(-HN-C=O),
1539(-C=C-) and 1462(-C-H) cm-1
FT-1NMR: δ = 0.9(*CH3-CH2-CH2-CH2-NH), δ = 1.3(CH3-*CH2-CH2-CH2-NH), δ = 1.5
ppm (CH3-CH2-*CH2-CH2-NH), δ = 2.2-1.7(*CH2-CH), δ = 2.7(*CH-CH2), δ = 3.2 ppm
(CH3-CH2-CH2-*CH2-NH), δ = 7.9-7.5(C-Haro)
11.3. Synthesis and characterizations of polymers
180
Poly (DMAAm-co-MABP)
FT-IR: 3061(=C-H), 2928-2873(-C-H), 1743(-C=O), 1641(-N-C=O), 1496(-C=C-) and
1399 (-C-H) cm-1
FT-1NMR: δ = 1.8-1.2 ppm (*CH2-CH), δ = 2.94-2.9 ppm (*(CH3)2-N), δ = 3.1 ppm
(*CH-CH2), δ = 7.9-7.4 ppm (C-Haro)
Poly (DEAAm-co-MABP)
FT-IR: 3065(=C-H), 2971-2933(-C-H), 1741(-C=O), 1636(-N-C=O), 1451 (-C=C-) and
1377(-C-H) cm-1
FT-1NMR: δ = 1.0ppm (*CH3-CH2-N), δ = 1.9-1.5 ppm (*CH2-CH), δ = 3.0 ppm (*CH-
CH2), δ = 3.3 ppm (*CH2-N), δ = 7.8-7.2 ppm (C-Haro)
11.3.4. Synthesis of Tri-copolymers
100 ml schlenk tube was dried with vacuum and back filled with N2 for three times.
The schelenk tube was then charged with calculated amount of ethylacrylamide or dimethyl
acrylamide, butylacrylamide or diethylacrylamide and mole percent of MABP and 0.014g of
AIBN (See table 3.2). The above mixture was dissolved in 20 ml of MeOH and 5 ml of 1, 4-
Dioxane followed by degassed with N2 using freeze and thaw (3 times). Polymerization was
carried out at 60°C for 16-18 hrs. After the completion of reaction, the solution was diluted
in the solvent used for polymerization and precipitated in not solvents (see table 10.3). Re-
precipitation was repeated thrice and dried under vacuum at 25°C.
Note: In the case of poly (25%DMAAm-co-75%DEAAm-co-3% MABP), after completion of
the polymerization, the solvent was evaporated and dissolved in THF and precipitated in
petroleum ether.

11.3. Synthesis and characterizations of polymers
181
Table 11.3: Synthetic details of Tri-copolymers
*Polymer Solvent for
polymerization
Solvent for
precipitation
Mol.wt
(g/mol)
Poly(75%EAAm-co-25%BAAm-co-3% MABP) Methanol †Ether 250000
Poly(50%EAAm-co-50%BAAm-co-3% MABP) Methanol †Ether 56000
Poly(25%EAAm-co-75%BAAm-co-3% MABP) THF Water 230000
Poly(75%DMAAm-co-25%DEAAm-co-3% MABP) Methanol †Ether 150000
Poly(50%DMAAm-co-50%DEAAm-co-3% MABP) Methanol Cyclohexane 86000
Poly(25%DMAAm-co-75%DEAAm-co-3% MABP) Methanol ‡Pet. ether 120000
*75% = 73.5 %, 50% = 48.5% and 25% = 23.5% , †Diethyl ether, ‡Petroleum ether
Poly (75%EAAm-co-25%BAAm-co-3% MABP)
FT-1NMR: δ = 0.92 ppm (*CH3-CH2-CH2-CH2-NH), δ = 1.12 ppm (*CH3-CH2-NH), δ =
1.34-1.47 ppm (*CH2-CH), δ = 3.0ppm (*CH-CH2), δ = 3.18 ppm (CH3*CH2-NH), δ =
3.35 ppm (CH2*CH2-NH)δ = 7.8-7.5 ppm (C-Haro)
Poly (50%EAAm-co-50%BAAm-co-3% MABP)
FT-1NMR: δ = 0.94 ppm (*CH3-CH2-CH2-CH2-NH), δ = 1.14 ppm (*CH3-CH2-NH), δ =
1.36-1.49 ppm (*CH2-CH), δ = 3.0ppm (*CH-CH2), δ = 3.21 ppm (CH3*CH2-NH), δ =
3.35 ppm (CH2*CH2-NH)δ = 7.8-7.5 ppm (C-Haro)
Poly (25%EAAm-co-75%BAAm-co-3% MABP)
FT-1NMR: δ = 0.92 ppm (*CH3-CH2-CH2-CH2-NH), δ = 1.13 ppm (*CH3-CH2-NH), δ =
1.47-1.34 ppm (*CH2-CH), δ = 2.3ppm (*CH-CH2), δ = 3.18 - 3.32cppm (CH3*CH2-NH),
δ = 7.8-7.46 ppm (C-Haro)
11.4. Deposition of surface-attahced networks
182
Poly (75%DMAAm-co-25%DEAAm-co-3% MABP)
FT-1NMR: δ = 0.92 ppm ((*CH3-CH2)2-N), δ = 1.88-1.66ppm (*CH2-CH), δ = 2.92-2.85
ppm (*(CH3)2-N), δ = 3.12 ppm (*CH-CH2), δ = 3.47-3.42ppm (CH3*CH2-NH) δ = 7.80-
7.50 ppm (C-Haro)
Poly (50%DMAAm-co-50%DEAAm-co-3% MABP)
FT-1NMR: δ = 1.09 ppm ((*CH3-CH2)2-N), δ = 1.83-1.62ppm (*CH2-CH), δ = 3.0-2.83
ppm (*(CH3)2-N), δ = 3.12 ppm (*CH-CH2), δ = 3.42-3.33ppm (CH3*CH2-NH) δ = 7.82-
7.47 ppm (C-Haro)
Poly (25%DMAAm-co-75%DEAAm-co-3% MABP)
FT-1NMR: δ = 1.08 ppm ((*CH3-CH2)2-N), δ = 1.87-1.56ppm (*CH2-CH), δ = 2.81 ppm
(*(CH3)2-N), δ = 3.2 ppm (*CH-CH2), δ = 3.56-3.42ppm (CH3*CH2-NH) δ = 7.80-7.50
ppm (C-Haro)
11.4. Deposition of surface-attached networks
11.4.1. Silanization on Silica wafer/Glass surface
Glass slides were cleaned by immersing them in piranha solution (30 ml of conc.
H2SO4: 10 ml of H2O2) for 1 hr followed by thorough washing with DI water and drying with
N2. Bp-Si (30 mmol) was freshly prepared in toluene and spin cast onto the cleaned substrate
at 2500 rpm for 20 seconds. The samples were then covered with aluminum foil, and
annealed at 120°C overnight, followed by extraction in toluene and drying over N2 gas,
which leaves a monolayer of Bp-Si (4-6 nm).

11.5. Preparation of protein solusion for SPR
183
11.4.2. Preparation of surface attached poly (alkylacrylamide) network
Table 11.4: Experimental conditions for spin coating.
Precursor polymer Solvent Concentration
(mg/ml)
Speed
(rpm)
Time
(s)
P(MAAm-co-3%MABP) Ethanol 10 2500 60
P(EAAm-co-3%MABP) Ethanol 10 2500 60
P(PAAm-co-3%MABP) Butanol 10 2500 60
P(BAAm-co-3%MABP) †Butanol 10 2500 60
P(DMAAm-co-3%MABP) Ethanol 10 2500 60
Poly(75%EAAm-co-25%BAAm-co-3% MABP) Ethanol 10 2500 60
Poly(50%EAAm-co-50%BAAm-co-3% MABP) Ethanol 10 2500 60
Poly(25%EAAm-co-75%BAAm-co-3% MABP) Butanol 10 2500 60
Poly(75%DMAAm-co-25%DEAAm-co-3% MABP) Butanol 10 2500 60
Poly(50%DMAAm-co-50%DEAAm-co-3% MABP) Ethanol 10 2500 60
Poly(25%DMAAm-co-75%DEAAm-co-3% MABP) Ethanol 10 2500 60
Poly(DMAAm-co-1% MABP) Ethanol 10 2500 60
Poly(DMAAm-co-2.5% MABP) Ethanol 10 2500 60
Poly(DMAAm-co-5% MABP) *IPA 10 2500 60
Poly(DMAAm-co-7.5% MABP) Butanol 10 2500 60
Poly(DMAAm-co-10% MABP) †Butanol 10 2500 60
*Isopropanol, †Hot (50-60°C)
Solutions of the precursor polymer were prepared with a concentration of 10mg/ml
and filtered (0.45μm filter). 50 µl of these solutions were used to spin cast a thin polymer
layer onto the BP-Si modified glass surface (2500 rpm for 60s). After evaporation of the
solvent, the obtained layers were illuminated with a total dosage of 4 J/cm2 with a UV-A-
11.6. Cell culture
184
light source (Stratalinker 2400, Stratagene, CA, USA). The samples are then extracted in
solvent and with nitrogen gas.
11.5. Preparation of Protein solution for SPR
The Proteins like 10 mg of Fibrinogen or Fibronectin were dissolved in 10 ml of PBS
buffer (pH=7.4). The above mixture is gently mixed to obtain the homogenous solution
without air bubbles. The solution is then filtered with 0.45μm filter to remove the unwanted
particles and used for the experiment. Similarly, other proteins vitronectin and von
willebrand factor is dissolved in de-ionized water with the concentration of 1 mg/ml.
11.6. Cell culture
11.6.1. Normal Dermal Human Fibroblasts (NHDF)
NHDF cells were cultured in a 75-cm2 culture containing 15 ml of growth medium at
37C, 5% (V/V) CO2 and steam saturated atmosphere. When the cell confluent reached 60-
80%, it was viewed under the microscope. The culture flask was brought into a laminar flow
cabinet from the incubator and the growth medium was carefully removed using a sterile
pipette. The medium was replaced with 7.5 ml of Hepes buffer, washed for 30S by swirling
gently, and removed carefully with a sterile pipette. The trypsin / EDTA solution was added
to the flask (100µm/cm2) and gently swirled for 30S and was examined under microscope.
When more than 50% of the cells were detached from the surface, then 7.5 ml of trypsin
neutralizing solution was added and the flask was washed thoroughly using a sterile pipette
and transferred to an 15 ml falcon tube without any air bubble. The cells were centrifuged at
about 220 x g for 4 minutes at room temperature, followed by the removal of the clear upper
layer. 5 ml of medium was then added and the cells were re-suspended. Cells were counted
using haemocytometer and the concentration was adjusted to 0.5x 10⁶ cells/ml, distributed to

11.7. Platelet adheison
185
the culture flask and placed in an incubator. The culture medium was changed for every 24
hrs and the confluence of cells was examined under the microscope.
11.6.2. Human Umbelical Vein Endothelial cells (HUVEC)
---- Refer 10.6.1 ----
11.6.3. Mouse fibroblasts (L929)
L929 cells were cultured in a 75-cm2 culture containing 15 ml of growth medium at
37C, 5% (V/V) CO2 and steam saturated atmosphere. When the cell confluent reached 60-
80%, it was viewed under the microscope. The culture flask was brought into a laminar flow
cabinet from the incubator and the growth medium was carefully removed using a sterile
pipette. The medium was replaced with 7.5 ml of PBS buffer, washed for 30S by swirling
gently, and removed carefully using a sterile pipette and repeated once more. 1.5 ml of
trypsin / EDTA solution was then added to the flask and gently swirled and removed
immediately. The flask was incubated for 90s, 10 ml of the growth medium was added to the
flask, and the cells were suspended and transferred to a 15 ml falcon tube. The cells were
centrifuged at about 220 x g for 4 minutes at room temperature and the clear upper layer was
removed. The cells were suspended in 5 ml of the growth medium and counted using
haemocytometer. The cell suspension was then distributed to the culture flask and placed in
an incubator. The culture medium was changed for every 24 hrs and the confluence of cells
was examined under the microscope.
11.7. Platelet extraction
11.7.1. Preparation of platelet concentrate
50-60 ml of Blood from healthy volunteers under no medication was anti-coagulated
with citric acid and centrifuged at 150 x g for 10 minutes. The resulting platelet rich plasma
(PRP) was separated and again centrifuged at 2000 x g for 10 minutes. The resulting platelet
11.6. Platelet extraction
186
repellet was carefully separated from the platelet poor plasma (PPP). The platelet cells were
then suspended in phosphate buffer (PBS) in a concentration of about 250,000 platelets ml.
The platelets were activated by adding 20 µM of adenosine diphosphate (ADP) and used for
the flow experiments.
11.7.2. Preparation of Microbubbles (MB)
The Microbubbles (MB) were prepared using the procedure established by Sakamoto
et al.291 Briefly, MB‟s are composed of decafluorobutane gas core encapsulated by a
phosphatidylcholine lipid shell. A brush of polyethylene glycol was attached onto the lipid
shell via a lipid anchor embedded in the lipid monolayer. Some of the polyethylene glycol
molecules contained biotin at the distal tip.40.291
Targeting was achieved by coupling biotinylated sLea ligand to the biotinylated MB
via a streptavidin linker (Figure 7.6). Biotinylated MB‟s were washed with phosphate
buffered saline by centrifugation (400 x g for 3 minutes) to remove excess of unincorporated
lipid, and incubated with streptavidin for 10 minutes at room temperature (3 µg streptavidin
per 107 MB). Again, excess streptavidin was removed by centrifugation. The MB‟s were
incubated either with biotinylated sLealigand or with a biotinylated control polyacrylamide
(control-PAA) with the same backbone without carrying the functional sialyl Lewis groups
for 10 minutes at room temperature (1.5 g sLealigand or control-PAA per 107 MB).
MB were washed again to remove unreacted ligand and stored at 4°C. The size
distribution of the MB‟s was determined using scanning electron microscopy (SEM)
observations. Aggregation of MB as the result of ligand coupling procedure was minimal.
Mean MB size was 2.71±0.05µm.291

12. Appendix
187
12. Appendix
11.1. Swelling of surface poly (alkylacrylamide) networks
Figure.12.1: Reflectivity scan of poly(MAAm-co-3%MABP). Solid lines are the Fresnel
formalism.
Figure 12.2: Reflectivity scan of poly (EAAm-co-3%MABP). Solid lines are the Fresnel
formalism.

12. Appendix
188
Figure 12.3: Reflectivity scan of poly (PAAm-co-3%MABP). Solid lines are the Fresnel
formalism.
Figure 12.4: Reflectivity scan of poly (DEAAm-co-3%MABP). Solid lines are the Fresnel
formalism.
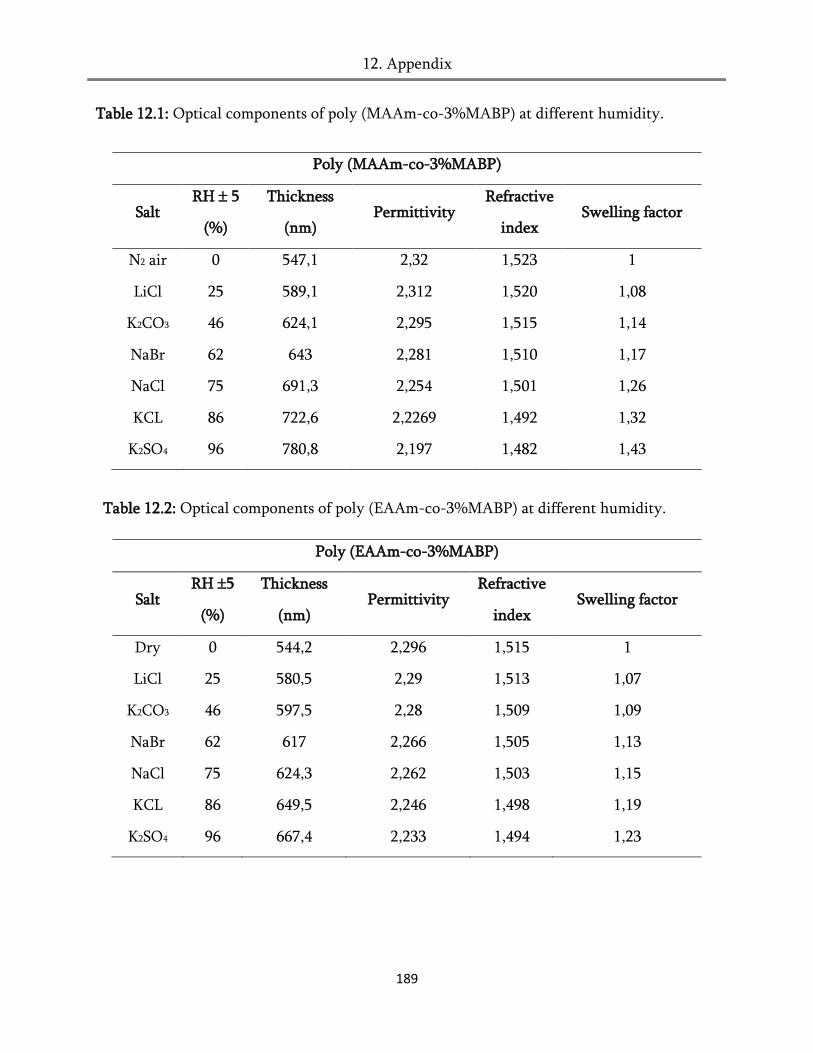
12. Appendix
189
Table 12.1: Optical components of poly (MAAm-co-3%MABP) at different humidity.
Poly (MAAm-co-3%MABP)
Salt RH 5
(%)
Thickness
(nm) Permittivity
Refractive
index Swelling factor
N2 air 0 547,1 2,32 1,523 1
LiCl 25 589,1 2,312 1,520 1,08
K2CO3 46 624,1 2,295 1,515 1,14
NaBr 62 643 2,281 1,510 1,17
NaCl 75 691,3 2,254 1,501 1,26
KCL 86 722,6 2,2269 1,492 1,32
K2SO4 96 780,8 2,197 1,482 1,43
Table 12.2: Optical components of poly (EAAm-co-3%MABP) at different humidity.
Poly (EAAm-co-3%MABP)
Salt RH 5
(%)
Thickness
(nm) Permittivity
Refractive
index Swelling factor
Dry 0 544,2 2,296 1,515 1
LiCl 25 580,5 2,29 1,513 1,07
K2CO3 46 597,5 2,28 1,509 1,09
NaBr 62 617 2,266 1,505 1,13
NaCl 75 624,3 2,262 1,503 1,15
KCL 86 649,5 2,246 1,498 1,19
K2SO4 96 667,4 2,233 1,494 1,23

12. Appendix
190
Table 12.3: Optical components of poly (PAAm-co-3%MABP) at different humidity.
Poly (PAAm-co-3%MABP)
Salt RH 5
(%)
Thickness
(nm) Permittivity
Refractive
index Swelling factor
Dry 0 624,46 2,2925 1,514 1
LiCl 25 649,16 2,2831 1,510 1,04
K2CO3 46 663,95 2,2783 1,509 1,06
NaBr 62 674,14 2,271 1,506 1,08
NaCl 75 686,21 2,264 1,504 1,10
KCL 86 701,71 2,2521 1,500 1,12
K2SO4 96 711,49 2,2451 1,498 1,14
Table 12.4: Optical components of poly (DEAAm-co-3%MABP) at different humidity.
Poly (PDEAAm-co-2.5%MABP)
Salt RH 5
(%) Thickness (nm) Permittivity
Refractive
index Swelling factor
Dry 0 562,82 2,2837 1,5111 1
LiCl 25 573,75 2,2811 1,5103 1,019
K2CO3 46 576,71 2,2805 1,5101 1,02
NaBr 62 582,07 2,28 1,5099 1,03
NaCl 75 587,3 2,2788 1,5095 1,04
KCL 86 594,6 2,2748 1,5082 1,06
K2SO4 96 598,1 2,271 1,5069 1,062

12. Appendix
191
Table 12.5: Optical components of poly (BAAm-co-3%MABP) at different humidity.
12.2. Synthesis and characterizations
12.2.1. Alfrey and Price Q, e Model.125,139
Monomer -A is Dimethyl acrylamide (DMAAm)
r1= 0.8653 (monomer reactivity ratio)
Q 1= 0.41 (reactivity)
e = -0.26 (polarity)
Monomer -B is Dimethyl acrylamide (DMAAm)
r1= 1.1527 (monomer reactivity ratio)
Q 1= 0.48 (reactivity)
e = -0.31 (polarity)
Monomer conversion can obtained from the following equation:
𝑋1 =𝑓𝐴 𝑟1𝑓𝐴+𝑓𝐵
𝑓𝐵 𝑟2𝑓𝐵+𝑓𝐴 (Eq. 11.1)
Poly (PBAAm-co-2.5%MABP)
Salt RH 5
(%)
Thickness
(nm) Permittivity
Refractive
index Swelling factor
Dry 0 741,6 2,253 1,500 1
LiCl 25 757 2,247 1,499 1,02
K2CO3 46 774,1 2,243 1,497 1,04
NaBr 62 780 2,242 1,497 1,05
NaCl 75 785,8 2,241 1,497 1,06
KCL 86 798,1 2,239 1,496 1,08
K2SO4 96 805,1 2,235 1,495 1,09
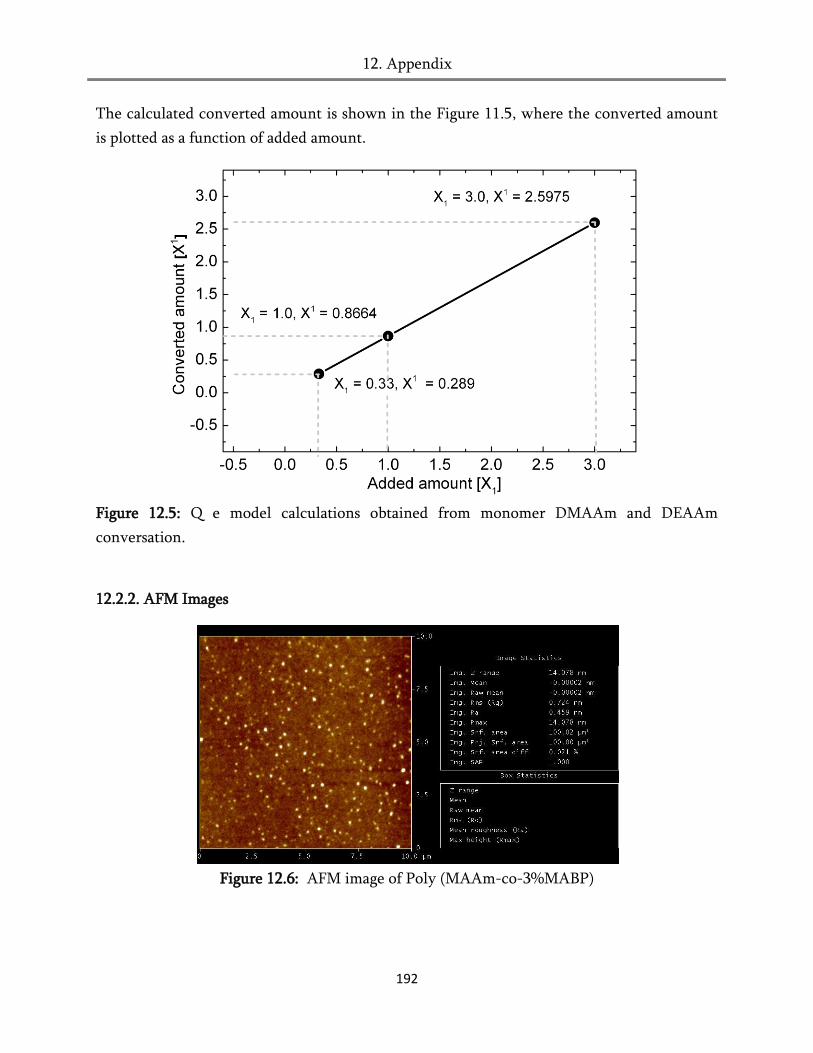
12. Appendix
192
The calculated converted amount is shown in the Figure 11.5, where the converted amount
is plotted as a function of added amount.
Figure 12.5: Q e model calculations obtained from monomer DMAAm and DEAAm
conversation.
12.2.2. AFM Images
Figure 12.6: AFM image of Poly (MAAm-co-3%MABP)

12. Appendix
193
Figure 12.7: AFM image of Poly (DMAAm-co-3%MABP)
Figure 12.8: AFM image of Poly (PAAm-co-3%MABP)
Figure 12.9: AFM image of Poly (DEAAm-co-3%MABP)
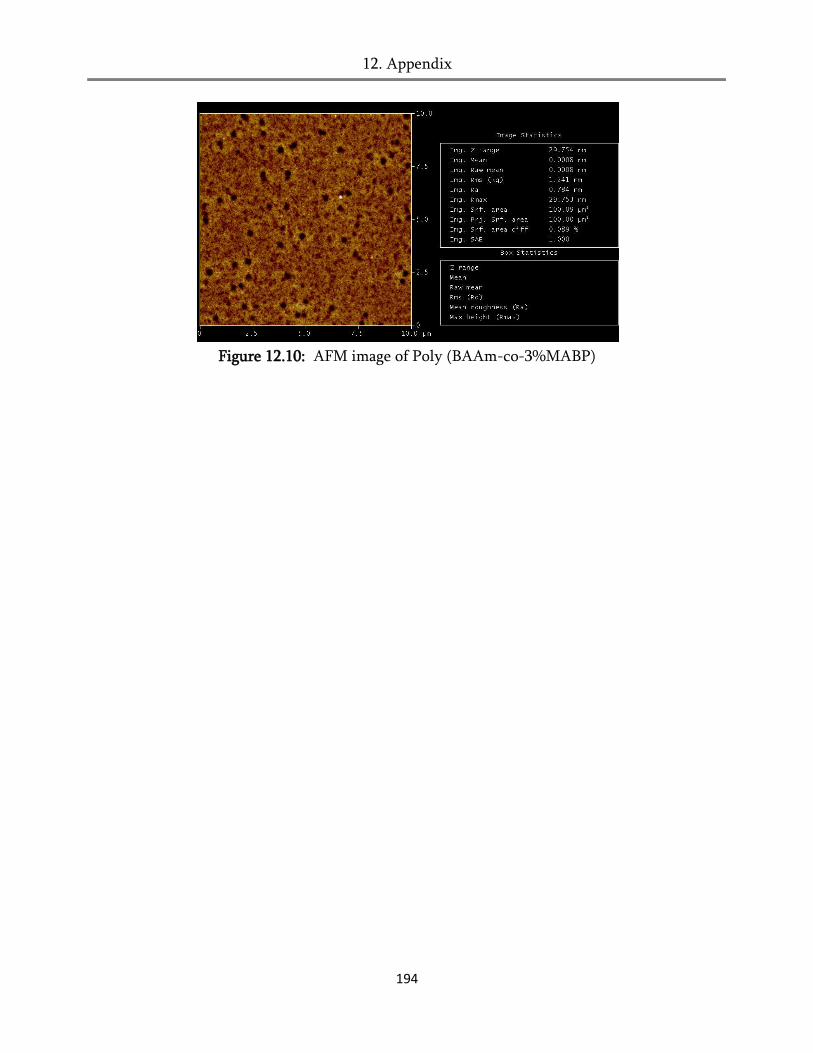
12. Appendix
194
Figure 12.10: AFM image of Poly (BAAm-co-3%MABP)
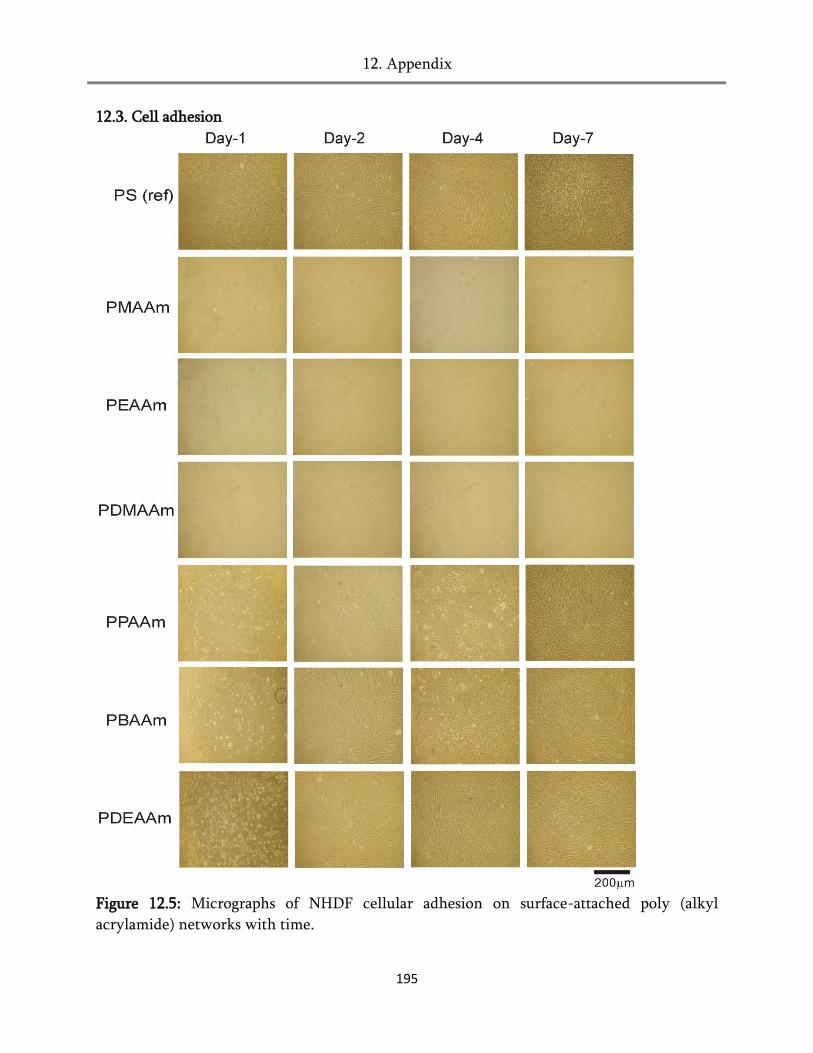
12. Appendix
195
12.3. Cell adhesion
Figure 12.5: Micrographs of NHDF cellular adhesion on surface-attached poly (alkyl
acrylamide) networks with time.
Journal publications and conference proceedings
196
Journal Publications
1. Pandiyarajan, C.K.; Prucker, O.; Zieger, B.; Rühe, J., Influence of the molecular
structure of surface-attached poly (alkylacrylamide) coatings on blood platelet
adhesion, Macromol. Biosci., 2013.
2. Pandiyarajan, C.K.; Prucker, O.; Zieger, B.; Rühe, J., Poly (alkylacrylamide) based
hydrogel coatings for blood devices, PMSE, 2012, 106, 349
3. Pandiyarajan, C.K.; Prucker, O.; Rühe, J., Swelling of surface-attached poly (alkyl
acrylamide) network in humid air, (2013 – expected).
Referred conference proceedings
1. Pandiyarajan, C.K.; Prucker, O.; Zieger, B.; Rühe, J., Poly (alkylacrylamide) based
hydrogel coatings for blood devices, 243rd ACS National Meeting and Exposition, San
Diego, CA, United States, Mar 25-Mar30, 2012. Poster presentation.
2. Pandiyarajan, C.K.; Prucker, O.; Zieger, B.; Rühe, J., Blood compatible hydrogel
coatings, Bayreuth Polymer Symposium-2011 (International symposium), University
of Bayreuth, Bayreuth, Germany, Sep 09- Sep12, 2011. Poster presentation.
3. Pandiyarajan, C.K.; Prucker, O.; Goto, S.; Zieger, B.; Rühe, J., Blood compatible
hydrogel coatings for VAD, IRTG summer school, Mittelwihr, France, July 10-14,
2011. Poster and oral presentations.

References
197
References
1. Werner, C.; Maitz, M.F.; Sperling, C., J.Mater.Chem., 2007, 17, 3376-3384.
2. Zdrahala,R.J.; Zdrahala,I.J., J.Biomater. Appl., 1999, 14, 67-90.
3. Tanser,P.H., The Merck home manual handbook, Blood vessels, 2006.
(http://materials.jhu.edu/index.php/research/detail/endothelial-cells-and-artificial-
blood-vessels)
4. Fontaine, A.B., United state Patent, 1995, No.5443498.
5. Blachford, Ed. Stacey L., Artificial Heart Valve. How Products are Made, Vol. 6, Gale
Cengage, 2002. eNotes.com, 14 Aug, 2012.
6. Osaki, S.; Edwards, V.; Johnson, et al., Eur.J. Cardio-Thoracic. Surg., 34 , 2 281–288
7. Chang, B.J., PhD thesis, Control of cell adhesion on heart valve implants through
ultrathin surface-attached polymer layers, University of Freiburg, 2002.
8. Sin, D.C.; Kei, H.L.; Miao, X., Expert. Rev. Med. Devices., 2009, 6, 1, 51-60.
9. Poinier, A.C.; Rosner, M.H., WebMD Medical Reference from Healthwise, 15 Sep
2011.
10. Drummond,M.; Braile,D.M.; Limaoliveira,A.M.; Camim,A.S.; Oyama,R.S.K.,
Sandoval, G.H., Braz. J. Cardiovasc. Surg., 2005, 20, 4, 432-437.
11. Noora, J.; Lamy,A.; Smith, K.M.; Kent, R.; Batt, D.; Fedoryshyn, J.; Wang, X.;
Perfusion, 2003, 18, 313 -320.
12. Klee, D.; Höcker, H., Adv.Polym Sci., 2000, 149, 1-57.
13. Silver, F.H., Biomaterials,Biomedical devices and Tissue engineering, An integrated
approach, First edition, Chapman & Hall, 1994, Chapter-1, p1-44.
14. Williams, D.F., Definition in Biomaterials.Progress in Biomedical Engineering, Vol 4,
Elsevier, New York, 1987.
15. Williams, D.F., Interdisk. Sci Rev., 1990, 15, 1,20-33.
16. Ratner, B.D., J.Biomed.Mater.Res., 1993, 27, 837-850.
17. Ikada, Y.; Shalaby, W., ACS symp. Ser., 1994, 540, chapter 3, p35-48.
18. Brash J.L.; Horbett T.A., Adv. Symp. Ser., 1987, 343,1-33.
19. Horbett, T.A.; Brash, J.L., Adv. Symp. Ser., 1995, 602, 1-23
20. Hu, W.J.; Eaton, J.W.; Tang, L., Blood 2001,98,1231-1238.
21. Tirrell, M.; Kokkoli, E.; Biesalski, M., Surf. Sci., 2002, 500, 61-83.
22. Vogler, E.A.; Siedlecki, C.A., Biomaterials 2009, 30, 1857-1869.
23. Li, Y.; Neoh,K.G.; Kang,E-T., J.Colloid.Interf. Sci., 2004, 275, 488–495.
24. Klose, T.; Welzel, P.B.; Werner, C., Colloid.Surfaces B., 2006, 51, 1-9.
References
198
25. Lee, J.H.;.Lee, H.B., J.Biomed.Mater.Res., 1998,41A,304-311.
26. Cao, L.; Chang,M.; Lee, C-Y.; Castner, D. G.; Sukavaneshvar, S.; Ratner, B.D.;
Horbett, T.A., J.Biomed.Mater.Res., 2007,81A,827-837.
27. Azioune, A.; Chehimi, M.M.; Miksa, B.; Basinska, T.; Slomkowski, S., Langmuir 2002,
18, 1150-1156.
28. Chen, Y.J.; Kang, E.T.; Neoh, K.G.; Wang, P.; Tan, K.L., Synth.Met.,2000, 110, 47-55.
29. Zhang, F.; Kang, E.T.; Neoh, K.G.; Wang, P.; Tan, K.L.,Biomaterials,2002,23,787-795.
30. Fujisawa, N.; Odell, R.A.; Poole-Warren, L.A.; Bertram, C.D.; Woodard, J.C.;
Schindhelm, K., J.Biomed.Mater.Res., 2000, 52A, 517-527.
31. Dion, I.; Roques, X.; More, N.; Labrousse, L.; Caix, J.; Lefebvre, F.; Rouais, F.;
Gautreau, J.; Baquey, C., Biomaterails 1993, 14, 9, 712-719 .
32. Huang, N.; Yang, P.; Chen, X.; Leng, Y.; Zeng, X.; Jun, G.; Zheng, Z.; Zhang, F.;
Chen, Y.; Liu, X.; Xi, T., Biomaterials 1998, 19, 771-776.
33. Robertson. J., Mat.Sci.Eng.R., 2002, 37 (4-6). 129-281.
34. Wang, D.; Li, J.; Sun, Y-H.; Shen, J-C.; Feng, L-X.; Elisseeff, J.H., Biomacromolecules
2002, 3, 1286-1295.
35. Kirkpatrick, C.J.; Otto, M.; Kooten,T.; Krump, V.; Kriegsmann, J.; Bittinger, F., J.
Mater. Sci. Mater. Med., 1999, 10, 589-594.
36. Deutsch, M.; Meinhart, J.; Fischlein, T.; Preiss, P.; Zilla,P., Surgery1999,126,847-855.
37. Surreys, P.W., Circulation 1996, 93, 412-422.
38. Zhou, Z.; Meyerhoff, M.E., Biomaterials 2005, 26, 6506-6517.
39. Shen, M.; Martinson, L.; Wagner, M. S.; Castner, D. G.; Ratner, B. D.; Horbett, T. A.,
J. Biomater. Sci., Polym. Ed., 2002, 13, 367-390.
40. Chen, H.; Zhang, Z.; Chen, Y.; Brook, M. A.; Sheardown, H., Biomaterials 2005, 26,
2391-2399.
41. Fushimi, F.; Nakayama,M.; Nishimura, K.; Hiyoshi,T., Artif.Organs.,1998,22,821-826.
42. Gorbet, M. B.; Sefton, M. V., J. Lab. Clin. Med., 2001, 137,5, 345-355.
43. Hansson, K. M.; Tosatti, S.; Isaksson, J.; Wettero, J.; Textor, M.; Lindahl, T. L.;
Tengvall P., Biomaterials, 2005, 26, 8, 861-872.
44. Cao, L.; Sukavaneshvar, S.; Ratner, B.D.; Horbett, T. A, J. Biomed. Mater. Res A.,
2006, 79, 788-803.
45. Ratner, B.D.; Hoffmann, A.S., Hydrogels for medical applications, ACS. Symp.
Ser.,1975, 31, Chapter 1, 1-36. Hoffman, A.S., Adv. Drug. Deliv., 2002,43,3-12.
46. Park, H.; Park, K., Hydrogels in Bioapplications, ACS. Symp. Ser., 1996, 627, Chapter
1, 1-10.

References
199
47. Bryce, T. A.; McKinnon, A. A.; Morris, E. R.; Rees, D. A.; Thom, D., Faraday
Discuss. Chem. Soc., 1974, 57, 221-229.
48. Srivastava, S.; Gorham, S.D.; Courtney, J.M., Biomaterials 1990, 11, 1, 162-168.
49. Kaufmann, P. M.; Heimrath, S.; Kim, B. S.; Mooney, D.J., Cell Transplant., 1997, 6,
463-468.
50. Auger, F.A.; Rouabhia, M.; Goulet, F.; Berthod, F.; Moulin, V.; Germain, L., Med.
Biol. Engin. Comput. 1998, 36, 5, 801-812
51. Choi, Y. S.; Hong, S. R.; Lee, Y. M.; Song, K. W.; Park, M. H.; Nam, Y. S., J. Biomed.
Mater. Res B., 1999, 48, 631-639.
52. Duranti, F.; Salti, G.; Bovani, B.; Calandra, M.; Rosati, M.L.; Dermatol. Surg. 1998, 24,
1317-1325.
53. Liu, L.S.; Thompson, A.Y.; Heidaran, M. A.; Poser, J.W.; Spiro,R.C.,Biomaterials1999,
20, 1097-1108.
54. Schense, J.C.; Hubbell, J.A.; Bioconjugate. Chem. 1999, 10, 75-81.
55. Klock, G.; Pfeffermann, A.; Ryser, C.; Grohn, P.; Kuttler, B.; Hahn, H.J.;
Zimmermann,U.; Biomaterials 1997, 18, 707-713.
56. Gombotz, W.R.; Wee ,S.F., Adv. Drug. Deliv. Rev., 1998, 31, 267-285.
57. Lee, K.Y.; Rowley, J.A., Eiselt, P.; Moy, E.M.; Bouhadir, K.H.; Mooney, D.J.,
Macromolecules 2000, 33, 4291-4294.
58. Singh, D.K.; Ray, A.R., J. Macromol. Sci.-Rev. Macromol. Chem. Phys., 2000, C40,
69.
59. Kurita, K.; Kojima, T.; Nishiyama, Y.; Shimojoh, M., Macromolecules 2000, 33, 4711-
4716.
60. Li, S. M.; Rashkov, I.; Espartero, J. L.; Manolova, N.; Vert, M., Macromolecules 1996,
29, 57-62.
61. Peppas, N.A.; Hilt, J.Z.; Khademhosseini, A.; Langer, R., Adv. Mater., 2006, 18 , 11,
1345-1360.
62. Peppas, N.A.; Bures, P.; Leobandung, W.; Ichikawa, H., Eur. J. Pharma. Biopharm.,
2000, 50, 27-46.
63. Peppas, N. A.; Hilt, J.Z.; Khademhosseini, A.; Langer, R., Adv. Mat., 2006, 18 11,
1345-1360.
64. Kidane, A.; Szabocsik, J. M.; Park, K., Biomaterials 1998, 19, 2051-2055.
65. Lu, S.; Anseth, K.S., J.Control. Release., 1999, 57, 291–300.
66. Wichterle, O.; Lim, D., Nature, 1960, 185, 117-118.
67. Keith, D.; Hong, B.; Christensen, M., Curr. Eye. Res., 1997, 16, 503–510.
References
200
68. Bohnert, J.L.; Horbett, T.A.; Ratner, B.D.; Royce, F.H., Invest. Ophthalmol. Vis. Sci.,
1988, 29 , 362–373.
69. Martens, P. J.; Anseth, K. S., Biomacromolecules 2003, 4, 283-292.
70. Schmaljohann, D., Adv. Drug. Deli. Rev.,2006, 58, 1655–1670.
71. Bawa, P.; Pillay, V; Choonara,Y.E.; Lisa, C.; Toit.D., Biomed. Mater., 2009, 4,22001-
220016
72. Tanaka, T., Phys. Rev. Lett.,1978, 40, 820.
73. Hirokawa, Y.; Tanaka, T., J. Chem. Phys.,1984, 81, 6379-6381.
74. Amiya, T.; Hirokawa, Y.; Hirose, Y.; Li, Y.; Tanaka, T., J. Chem.Phys., 1987,86, 2375-
2380.
75. Chen, G.; Hoffman, A.S., Nature,1995, 373, 49-52.
76. Tanaka, T., Phys. Rev. Lett.,1982, 45, 1636-1639.
77. Ilmain, F.; Tanaka, T.; Kokufuta, E., Nature 1991, 349, 400-401.
78. Schild, H.G., Prog. Polym. Sci.,1993, 17, 163–249.
79. Shibayama, M.; Norisuye, T.; Nomura, S., Macromolecules 1996, 29, 8746-8750.
80. Van Durme, K.; Verbrugghe, S.; Du Prez, F.E., Van Mele, B., Macromolecules 2004,
37, 1054-1061.
81. Makhaeva, E.E.; Tenhu, H.; Khokhlov, A.R., Macromolecules 1998, 31, 6112-6118.
82. Mikheeva, L.M.; Grinberg, N.V.; Mashkevich, A.Y.; Grinberg, V.Y.; Thanh, L.T.M.;
Makhaeva, E.E.; Khokhlov, A.R., Macromolecules 1997, 30, 2693-2699.
83. Kwon, Y.M.; Kim, S.W., Thermosensitive biodegradablehydrogels for the delivery of
therapeutic agents, in: G.S.Kwon (Ed.), Polymeric Drug Delivery Systems, Taylor
&Francis, Boca Raton, 2005, pp. 251–274.
84. Verbaan, F.; van Dam, I.; Takakura, Y.; Hashida, M.; Hennink, W.; Storm, G.;
Oussoren, C., Eur. J.Pharm. Sci., 2003, 20, 419–427.
85. Nakamae, K.; Miyata, T.; Hoffman, A. S., Macromol. Chem., 2003,193, 983–990
86. Miyata, T.; Nakamae, K.; Hoffman, A. S.; Kanzaki, Y., Macromol. Chem. Phys.,
2003,195 1110–1120.
87. Putnam D.; Zelikin, A.N.; Izumrudov, V.A.; Langer, R., Polyhistidine-PEG: DNA
nanocomposites for gene delivery, Biomaterials 2003, 24, 4425–4433.
88. Nicolson, P. C.; Vogt, J., Biomaterials 2001,22, 3273-3283.
89. Reece, T. B.; Maxey, T. S.; Kron, I. L., Am. J. Surg.,2001, 182(suppl.), 40S .
90. Seliktar, D., Science 2012, 336, 1124-1128
91. Langer,R.;. Peppas, N. A., Advances in Biomaterials, Drug Delivery, and
bionanotechnology. Bioeng. Food.Nat.Prod., 2003, 49, 12, 2990-3006.

References
201
92. Peppas, N.A.; Bures, P., Leobandung, W.; Ichikawa, H., Eur.J.Pharma.Biopharm.,
2000, 50, 27-46.
93. Junginger, H.E., Pharm. Ind., 1991, 53,1056-1065.
94. Knuth, K.; Amiji, M.; Robinson, J.R., Adv. Drug Deliv. Rev.,1993, 11, 137-167.
95. Nagai, T.; Machida, Y., Adv. Drug Deliv. Rev.,1993, 11, 179-191.
96. Park, H.; Park, K., Pharm. Res.,1996, 13, 1770-1776.
97. Yang,X.; Robinson, J.R., Bioadhesion in mucosal drug delivery, in:T. Okano (Ed.),
Biorelated Polymers and Gels, Academic Press, SanDiego, CA, 1998, pp. 135-192.
98. Chan, A.; Orme, R.P.; Fricker, R.A.; Roach, P., Adv. Drug. Deliver. Rev., 2012,
Article in press.
99. Watanabe, E.; Tomoshige, N.; Uyama, H., Macromol. Symp., 2007, 249–250, 509–
514.
100. Tanimoto, F.; Kitamura, Y.; Ono, T.; Yoshizawa, H., ACS Appl. Mater. Interfaces 2,
2010, 606–610.
101. Rajeswari, R.; Subramanian, S.; Reddy, V. J.; Shayanti, M.; Seeram, R., Macromol.
Biosci., 2012, 12,3, 286-311.
102. Lanza, R.; Langer, R.; Vacanti, J., Principles of Tissue engineering, 3rd Edn, Elsevier
Academic Press, 2007, p7-33.
103. Lee, K.Y.; Mooney, D.J., Chem.Rev., 2001, 101, 7, 1869-1879.
104. Jagur-Grodzinski, J., Polym. Adv. Technol., 200, 17, 395–418.
105. Datta, A., Master thesis, Characterization of polyethylene glycol hydrogels, Louisana
State University andAgricultural and Mechanical College.
106. Cummings, J.M.; Boullier, J.A.; Parra, R.O., J. Urol., 1996,155,1011–1013.
107. Dmochowski, R.R.; Appell, R.A., Urology 2000, 56, (Suppl 6A), 32–40.
108. Loebsack, A.; Greene, K.; Wyatt, S.; Culberson, C.; Austin, C.; Beiler, R.; Roland, W.;
Eiselt, P.; Rowley, J.; Burg, K.; Mooney, D.J.; Holder, W.; Halberstadt, C., J.
Biomed.Mater .Res., 2001, 57, 575–81.
109. Elbert, D.L.; Hubbell, J.A., J. Biomed. Mater. Res., 1998, 42, 55–65.
110. Bryant, S.J.; Anseth, K.S., J. Biomed. Mater. Res., 2002, 59, 63–72.
111. Atala, A.; Kim, W.; Paige, K.T.; Vacanti, C.A.; Retik, A.B.; J. Urol., 1994,152, Part 2,
641–643.
112. Langer, R.; Tirrell, M.A., Nature 2004, 428, 6982, 487-492.
113. Ratner,B.D., J. Biomed.Mater.Res.,1993, 27, 837-850.
114. Ratner,B.D., Biomaterials, 2007, 28, 5144–5147.
115. Tirrell,M.; Kokkoli,E.; Biesalski,M., Sur. Sci., 2002, 500, 61–83.
References
202
116. Tsai, W.B.; Grunkemeier, J. M.; McFarland, C. D.; Horbett, T. A., J. Biomed. Mater.
Res., 2002, 60,3, 348-359.
117. Wörz, A., PhD thesis, Entwicklung von maßgeschneiderten Oberflächen für die
ortsaufgelöste Adhäsion von Zellen, University of Freiburg, 2011.
118. Liu,R.; Fraylich,M.; Saunders,B.R., Colloid. Polym. Sci., 2009, 287,627–643.
119. Prucker,O.; Naumann,C.A.; Ruhe,J.; Knoll,K.; Frank,C.W., J. Am. Chem. Soc. 1999,
121, 8766-8770.
120. Knoll,W., Annu. Rev. Phys. Chem. 1998. 49, 569–638.
121. Change, B.J. PhD Thesis, Control of cell on heart valve implants through ultrathin
surface-attached polymer layers, University of Freiburg, 2002.
122. Toomey,R; Freidank.D; Ruehe,J. Macromolecules 2004, 37, 882-887.
123. Wörz, A.; Berchtold, B.; Moosmann, K.; Prucker, O.; Rühe,J. J.Mat. Chem., 2012, 22,
19547–19561.
124. Chang, B. J.; Prucker, O.; Groh, E.; Wallrath, A.; Dahm, M.; Rühe, J., Colloid. Surface
A., 2002, 198, 519-526.
125. Cowie.J.M.G., Polymers: Chemistry and Physics of Modern Materials, 2nd Edn,
Taylor & Francis Group,1991.
126. J.Baandrup, E.H.Immergut, E.A.Grulke, Polymer Handbook, John Wiley & sons,
1999, Vol 2 , 4th Edn.
127. Waham, A.L; Shahrir, H; Akos, N.I., Polym-Plastics Technol., 2011, 50, 14, 1475-
1486.
128. Kerstin, S., PhD thesis, Synthese und Charakterisierung von oberflächengebundenen
polymeren Netzwerken für die Herstellung von maßgeschneiderten Oberflächenund
polymeren Multilagen, University of Freiburg, 2010.
129. Freidank,D., PhD thesis 3D-DNA-Chips - Oberflächengebundene funktionelle
Polymernetzwerke als Matrix für Nukleinsäure-Microarrays, University of Freiburg,
2005.
130. Moosmann,K., PhD thesis, Capture and release in microchannels with surface-
attached hydrogels for the quantification of dopamine, University of Freiburg, 2012.
131. Belardi, J., PhD thesis, Artificial Cilia, University of Freiburg, 2012.
132. Bunte, C., PhD thesis, Photo-Crosslinked Redox Polymer Networks for Enzymatic
Biosensors and Biofuel Cells, University of Freiburg, 2011.
133. Gallagher, W.M.; Lynch, I.; Allen, L.T; Miller, I.; Penney, S.C.; O‟Connor, D.P.;
Pennington, S.; Keenan, A.K.; Dawson, K.A .,Biomaterials 2006, 27,35,5871–5882.
References
203
134. Kopyshev, A., PhD thesis, Motion of nano-particles by/on polymer brushes,
University of Freiburg, 2006.
135. Ratner, B. D.; Hoffman, A. S., ACS symposium series, 1976, 31, 1-36.
136. Flory,P.J.; and Rehner,J., J. Chem. Phys.,1943, 11, 512-520.
137. Flory,P.J.; and Rehner,J., J. Chem. Phys.,1943, 11, 521-526.
138. Peppas,N.A.; Huang,Y.; Torres-Hugo,M.; Ward,J.H.; Zhang,J., Annu. Rev. Biomed.
Eng., 2000. 2, 9–29.
139. Mark,J.E., Physical properties of polymer handbook,2nd Edn, Springer,2007,p341.
140. Willets,K.A.; Van Duyne,R.P., Annu. Rev. Phys. Chem., 2007, 58,267–97.
141. H. Raether, Surface plasmons on smooth and rough surfaces and on gratings,
Springer, Berlin, 1988.
142. Otto, A., Z. Phys.,1968, 216, 398–410.
143. Kretchmann, E., Z. Phys., 1971, 241, 313–324.
144. Arima,Y.; Toda,M.; Iwata,H., Advanced Drug Delivery Reviews, 2011, 63, 988–999.
145. Knoll,W., Annu. Rev. Phys. Chem. 1998. 49, 569–638.
146. Patnaik ,P., Applied Biochemistry and Biotechnology, 2005, 126, 79-92.
147. Chu,L-Q.; Mao,H-Q.; Knoll,W., Polymer, 2006, 47, 7406-7413.
148. Kleideiter,G.;Lechner,M.D.; Knoll,W., Macromol. Chem. Phys.,1999, 200,1028–1033.
149. van Os, M.T.; Menges,B.; Foerch, R.; Vancso, G. J.; Knoll,W., Chem. Mater. 1999, 11,
3252-3257.
150. Biesalski,M., PhD thesis, Terminal an Festkörperoberflächen gebundene
Polyelektrolytbürsten: Synthese und Quellungsverhalten,1999, University of
Freiburg, Germany.
151. Kim, DH; Lau, KHA; Robertson, JWF; Lee, O-J.; Jeong, U.; Lee,J.I.; Hawker,C.J.;
Russel, T.P.; Knoll,W., Adv. Mater. 2005, 17, 2442–2446.
152. Biesalski,M.; Ruehe,J., Langmuir 2000, 16, 1943-1950.
153. Kügler,R.; Schmitt,J.; Knoll,W., Macromol. Chem. Phys. 2002, 203, 413-419.
154. Hernandez, R. J.; Gavara,R., J. Polym. Sci., Part B: Polym. Phys., 994, 32, 2367-2374.
155. Chu,L-Q.; Forch,R.; Knoll,W., Langmuir 2006, 22, 2822-2826.
156. Chen,W-L.; Shull,K.R., Macromolecules 1999, 32, 136-144.
157. Ralf,K.; Ingo,D.; Patrick,O.; Laschewsky,A.; Fery,F.; Krastev,R., Langmuir 2009, 25,
19, 11576–11585.
158. Favre, A.; Nguyen, Q. T.; Schaetzel, P.; Clement, R.; Neel, J. J. Chem. Soc. Faraday.
Trans. 1993, 89, 4339-4346.
159. Auroy, P.; Auvray,L., Macromolecules 1992,25, 4134-4141.
References
204
160. Barraza,R.G.; Pena,M.L.; Rios,H.E., Polymer International, 1997, 42, 112-116.
161. Bunjes , N.; S. Paul,S.; Habicht,J.; Prucker,O.; Ruehe,J.; Knoll,W., Colloid. Polym.
Sci., 2004, 282, 939–945.
162. Wu, F., Mater Thesis, Swelling of surface-attached poly (alkylacrylamides) in humid
air, 2012, University of Freiburg, Germany.
163. Chena,H.; Yuana,L.; Songa,W.; Wub,S.; Li,D., Prog. Polym. Sci., 2008, 33, 1059–
1087.
164. Goldberg, M.; Langer, R.; Jia, X.Q., J. Biomat. Sci-Polym E., 2007, 18, 241–268.
165. Anderson, D.G.; Burdick, J.A.; Langer, R., Science 2004, 305, 1923–1924.
166. Cromar,G.L.; Xiong, X.; Chautard,E.; Ricard-Blum,S.; Parkinson,J., Proteins., 2012,
80, 6, 1522-1544.
167. Kaiser, E.T.; Keizdt, F.J., Proc. Natl. Acad. Sci. USA, 1993, 80, 1137-1143.
168. Brash, J.L.; Horbett, T.A. Proteins at Interfaces, ACS symposium series, 1995, 602,
chapter 1, pp 1-23.
169. Vogler, E.A., Biomaterials, 2012, 33,1201-1237.
170. Ivan S. Yermolenko; Valeryi K. Lishko; Tatiana P. Ugarova; Sergei N. Magonov;
Biomacromolecules 2011, 12, 370-379.
171. Norde,W.; Anusiem, A.C.I., Coll. Sur., 1992, 66. 299 .
172. Schaaf, P.; Talbot, J., J. Chem. Phys., 1989, 91, 4401-4409.
173. Rabe, T.E.; Tilton, R. J., Colloid Interf. Sci., 1993, 159, 243-245.
174. Tilton, R.D.; Robertson, C.R.; Gast, A.P., J. Colloid. Interf. Sci., 1990,137, 192-203.
175. Andrade, J.D; Hlady, V; Wei, A.P., Pure. Appl. Chem.,1992, 64,11, 777-1781.
176. Lasic, D.D.; Papahadjopoulos, P. Science 1995, 267, 1275-1276.
177. de Gennes, P. G., Ann. Chim.,1978, 7, 77, 389.
178. Vroman, L.; Adams, A.L., 1969. Surf. Sci. 16, 438–446.
179. Noh,H.; Vogler, EA. Biomaterials 2007, 28, 2007,405–422.
180. Jung,S-Y.; Lim,S-M.; Albertorio,F.; Kim,G.; Gurau,MC.; Yang,RD.; Holden,MA.;
Cremer,P.S., J. Am. Chem. Soc. 2003, 125, 12782-12786.
181. Horbett, T.A.; Brash, J.L., Proteins at Interfaces II: Fundamentals and Applications,
American Chemical Society,Washington DC, 1995,112–128.
182. Choi,C.; Yang,Y.; Chae,J., Biosens. Bioelectron., 2008, 24, 893–899.
183. Wichterlle,O.; Lim,D. Nature, 1960, 185, 117-118.
184. Pertsin, A. J.; Grunze, M., Langmuir, 2000, 16(23), 8829–8841.
185. Zheng, J.; Biophys. J., 2005, 89, 158–166.
References
205
186. Jeon, S.I.; Lee, J.H.; Andrade, J.D.; de Gennes, P.G., J. Colloid Interf. Sci., 1991, 142,
149-158.
187. Osterberg, E.; Bergstrom, K.; Holmberg, K.; Schuman, T.P.; Riggs, J.A.;Burns, N.L.;
Van Alstine, J.M.; Harris, J.M., J. Biomed. Mater. Res., 1995, 29, 741-747.
188. Prime, K.L.; Whitesides, G.M. J. Am. Chem. Soc., 1993, 115, 10714-10721.
189. Fotios M. Andreopoulos, Eric J. Beckman, Alan J. Russell, Biomaterials,1998, 19,
1343-1352.
190. Ivanchenko, M.I.; Kulik, E.A.; Ikada, Y., Proteins at Interfaces II: Fundamentals and
applications, ACS Symposium series., 1995, 602, 463-477.
191. Soriaga, M.P.; Song, D.; Zapien, D.C.; Hubbard, A.T. Langmuir 1985, 1, 123-127.
192. Wittemann, A.; Haupt, B.; Ballauff, M., Phys.Chem.Chem.Phys.,2003,5,8,1671-1677.
193. Wittemann, A.; Ballauff, M., Phys. Chem. Chem. Phys. 2006, 8 (45), 5269-5275.
194. Moosmann,K. PhD Thesis, Capture and release in microchannels with surface-
attached hydrogels for the quantification of dopamine, University of Freiburg,
Freiburg. Germany.
195. Ericson,H.P.; Carrell,N.; McDonagh,J., J. Cell. Biol., 1981, 91, 673-678.
196. Nelea,V.; Nakano,Y.; Kaartinen,M.T., Protein J., 2008, 27, 223-233.
197. Tunc,S.; Maitz,M.F.; Steiner,G.; Vazquez,L.; Pham,M.T.; Salzer, R., Colloid. Surface.
B., 2005, 42, 219-225.
198. Hall,C.E.; Slayter,H.S., J. Biophys. Biochem. Cy., 1959, 5, 1, 11- 15.
199. Lynn, G.W.; Heller,W.T.; Mayasundari, A.; Minor,K.H.; Peterson,C.B.,
Biochemistry, 2005, 44, 565-574.
200. G.W.Lynn, W.T.Heller, A. Mayasundari, K.H.Minor, C.B.Peterson, Biochemistry,
2005, 44, 565-574.
201. Fowler, W.E.; Fretto. L.J.; Hamilton, K.K.; Erickson, H.P.; McKee, P.A., J. Clin.
Invest, 1985, 76, 1491-1500.
202. Peppas, N.A.; Current Opinion in Colloid & Interface Science, 1997, 2, 5, 5311-537.
203. Bell, C.L.; Peppas, N.A., Biomaterials 1996, 17, 12, 1203-1218.
204. Baandrup,J.; Immergut,E.H.; Grulke, E.A., Polymer Handbook, John Wiley & sons,
1999, Vol 2 , 4th Edn, p VII/50.
205. Trossarelli, L.; Meirone, M. J.Polym.Sci., 57, 445-452.
206. Canal,T.; Peppas,N.A., Journal of Biomedical Materials Research,1989, 23,1183-1193.
207. Peppas,N.A.; Wright,S.L., European Journal of Pharmaceutics and
Biopharmaceutics, 1998, 46,15–29.
208. Keller,J.U., J.Non-Equil.Thermody., 2009, 34, 1,1-33.

References
206
209. Winter, R.; Lopes,D.; Grudzielanek,S.;Vogtt,J.,J.Non-Equil.Thermody.,2007,32,41-97.
210. C. Schuh, J.; Rühe, Macromolecules 2011, 44, 3502-3510.
211. Pandiyarajan,C.K.; Zieger,B.; Prucker,O.; Rühe,J. PMSE 2012.106, 349-349.
212. Pandiyarajan,C.K.; Zieger,B.; Prucker,O.; Rühe,J., Macromol. Biosci., 2013, Article in
press.
213. Canal,T.; Peppas,N.A. J.Biomed. Mat. Res. 2009, 23, 1183-1193.
214. Holmberg,K.; Joensson,B.; Kronberg,B.; Lindman,B., Surfactants and polymers in
aqueous solution, Jonn wiley & sons,2nd Edn., 2007, p277-298.
215. Bergethon,P.R., The physical Basis of Biochemistry: The foundations of Biophysics,
Springer, 2nd Edn., 2010, p461-484.
216. Tonge,S.R.; Tighe, B.J.; Adv. Drug. Deliver. Rev., 2001, 53, 109–122.
217. Schulz, M.; Adekunle Olubummo,A.; Binder,W.H., Soft Matter, 2012, 8, 4849-4864.
218. Simon, S.; Thomas, S.; Christof, S.; Karla,L. Materials 2010, 3, 638-655.
219. Gorbet, M.B.; Sefton, M.V. Biomaterials 2004, 25, 5681–5703.
220. Furie, B.; Furie, B.C. N. Eng. J. Med. 2008, 359, 938–949.
221. Wachtfogel, Y.T.; Hack, C.E.; Nuijens, J.H.; Kettner, C.; Reilly, T.M.; Knabb, R.M.;
Bischoff,R.; Tschesche, H.; Wenzel, H.; Kucich, U.; Edmonds, L.H., Jr.; Colman,
R.W. Am. J. Physiol. Heart Circ. Physiol., 1995, 26, H1352–H1357.
222. Hakim, R.M.; Schafer, A. Am. J. Med., 1985, 78, 575–580.
223. Jing, F.J.; Huang, N.; Liu, Y.W.; Zhang, W.; Zhao, X.B. Fu, R.K.Y.; Wang, J.B.; Shao,
Z.Y.; Chen, J.Y.; Leng, X.; Liu, X.Y.; Chu, P.K. J.Biomed.Mater.Res., 2008, 87A,
1027-1033.
224. Shively, S.; Miller, W. T., Kansas. Acad. Sci., 2009, 112, 3, 198-200
225. Kwak, D.; Wu, Y.; Horbett, T. A., J.Biomed. Mat. Res. 2005, 74A, 1, 69-83.
226. Tsai, WB.; Grunkemeier, JM.; Horbett TA., J.Biomed.Mater.Res. 2003, 67A, 1255–
1268.
227. Zhang,M.; Horbett, TA., J. Biomed. Mater. Res., 2000, 89, 791–803.
228. Schutt, E. G.; Klein, D. H.; Mattrey, R. M.; Riess, J. G. Angew. Chem., Int. Ed. 2003,
42, 3218-3235.
229. Unger, E. C.; Matsunaga, T. O.; McCreery, T.; Schumann, P.; Sweitzer, R.; Quigley,
R. Eur. J. Radiol. 2002, 42, 2,160-168.
230. Guenther,F.; Muhlen,C.; Ferrante,EA.; Grundmann,S.; Bode,C.; Klibanov, AL. Invest
Radiol 2010, 45, 586–591.
231. Ferrante, E.A.; Pickard, J.E.; Rychak, J.; , Klibanov, A.; Ley,K. J.Cont. Rel., 2009, 140
100–107.

References
207
232. Slack, SM.; Cui,Y.; Turitto, VT. Thromb. Haemost., 1993, 70, 129–134.
233. Ruggeri ZM. Thromb. Haemost., 1993, 70, 119–123.
234. Iijima, K.; Murata, M.; Nakamura, K.; Kitaguchi, T.; Handa, M.; Watanabe, K.;
Fujimura, Y.; Yoshioka, A.; Ikeda, Y. Biochem. Biophys. Res. Commun., 1997, 233,
796–800.
235. Pollack,G.H., Cells, Gels and the Engines of Life: A new, unifying approach to cell
function, Ebner and sons publications, 2001, p111.
236. Bergethon,P.R., The physical Basis of Biochemistry: The foundations of Biophysics,
Springer, 2nd Edn., 2010, p24-56.
237. Jacobs, T.; Morent, R.; De Geyter, N.; Dubruel, P.; Leys, C., Plasma Chemistry and
Plasma Processing 2012, 32, 5, 1039-1073.
238. Roach, P.; Eglin,D.; Rohde, K.; Perry C.C ., J Mater Sci Mater Med, 2007, 18,1263–
1277.
239. Molly M. Stevens and Julian H. George, Science 2005, 310, 1135-1138.
240. Rajeswari,R.; Subramanian,S.; Reddy, V. J.; Shayanti,M.; Seeram,R., Advances in
Polymeric Systems for Tissue Engineering and Biomedical Applications.
Macromolecular Bioscience 2012, 12, 3, 286-311.
241. Ulrich Hersel, Claudia Dahmen, Horst Kessler, Biomaterials, 2003, 24 4385–4415.
242. Zamir,E.; Geiger,B., J. Cell. Sci, 2001, 114, 3583–3590.
243. Geiger,B.; Bershadsky,A., Curr. Opin. Cell. Biol., 2001, 13, 584–592.
244. Petit,V.; Thiery,T.P., Biol Cell, 2001, 92, 477–494.
245. Pande,G., Curr Opin Cell Biol, 200o, 12 , 569–574.
246. Anselme,K.; Ploux,L.; Ponche,A., Journal of Adhesion Science and Technology, 2010
24, 831–852.
247. Lanza,R.; Langer,R.; Vacanti,J., Principles of Tissue Engineering, Elsevier, 3rd
Edn.,2007, p51-129.
248. Lutolf, M.P.; Hubbell, J.A., Nat. Biotechnol , 2005, 23, 47–55.
249. Li JM, Menconi MJ, Wheeler HB, Rohrer MJ, Klassen VA, Ansell JE, Appel MC.
Precoating expanded polytetrafluoroethylene grafts alters production of endothelial
cell-derived thrombomodulators. J VascSurg 1992,15,1010–1017.
250. Miyata T, Conte MS, Trudell LA, Mason D, Whittemore AD,Birinyi LK. Delayed
exposure to pulsatile shear stress improvesretention of human saphenous vein
endothelial cells on seededePTFE grafts. J. Surg. Res., 1991,50,485–493.
References
208
251. Vohra R, Thomson GJ, Carr HM, Sharma H, Walker MG.Comparison of different
vascular prostheses and matrices inrelation to endothelial seeding. Br J Surg 1991,78,
417–420.
252. WeiX N, Klee D, H.ocker H. Konzept zur bioaktiven Ausr.ustung von
Metallimplantatoberf.achen. Biomaterialien 2001, 2, 81–86.
253. Elbert, D.L.; Hubbell, J.A., Biomacromolecules 2001, 2, 430–441.
254. Lourenc, B.N.; Marchioli,G.; Song,W.; Reis, R.L.; Blitterswijk, C.A.; Karperien,M.;
Aart van Apeldoorn,A.; Mano,J.F., Biointerphases,2012, 7,46-57.
255. Horbett, T.A.; Lew, K.R., J. Biomater. Sci. Polym.Ed., 1994, 6,15–33.
256. Hersel,U.; Dahmen,C.; Kessler,H., Biomaterials 2003, 24, 4385–4415.
257. Lebaron, R.G.; Athanasiou, K.A., Tissue. Eng., 2000, 6, 85–103.
258. Giancotti, F.G.; Ruoslahti,E., Science 1999, 285, 5430, 1028-1033.
259. Chen, C.S.; Mrksich,M.; Huang, S.; Whitesides, G.M.; Ingber, D.E., Science 1997,
276, 1425–1428.
260. Hirano, Y.; Okuno, M.; Hayashi, T.; Goto, K.; Nakajima, A., J. Biomater. Sci. Polym.
Ed., 1993,4,235–243.
261. Walluscheck, K.P.; Steinhoff. G.; Kelm, S.; Haverich, A., Eur. J. Vasc. Endovasc.,
1996, 12, 321–30.
262. Varani, J.; Inman, D.R.; Fligiel, S.E.; Hillegas, W.J., Cytotechnology 1993, 13, 89–98.
263. Quirk, R.A.; Chan, W.C.; Davies, M.C.; Tendler, S.J.B.; Shakesheff, K.M.,
Biomaterials 2001, 22, 865–872.
264. Stile, R.A.; Healy, K.E., Biomacromolecules 2001, 2, 185–94.
265. Bearinger, J.P.; Castner,D.G.; Healy,K.E., J.Biomater.Sci. Polym. Ed.,1998, 9,629–652.
266. Breuers, W.; Klee, D.; Hocker, H.; Mittermayer, C., J. Mater. Sci: Mater. Med., 1991,
2, 106–109.
267. Kamlesh,S., PhD thesis, Bioactive nanomaterials from Self-assembled &
Polymerizable Peptide Amphiphiles: Towards cell-based Microsystems, University of
Freiburg, Freiburg, Germany.
268. Peterson,S., PhD thesis, Bioactive surface coatings based on peptide polymer
micropatterns-towards the design of cell-biochips., Technische Universitat
Darmstast, Darmstadt, Germany.
269. Loschonsky,S.; Shroff,K.; Woerz,A.; Prucker,O.;Rühe,J.; Biesalski,M., Biomacro-
molecules 2008, 9, 543-552.
270. Pierschbacher, M.D.; Ruoslahti, E., Nature, 1984, 309,30.

References
209
271. Jacobs, T.; Morent, R.; De Geyter, N.; Dubruel, P.; Leys, C, Plasma Chemistry and
Plasma Processing 2012, 32, 5, 1039-1073.
272. Stevens, M. M.; George, J. H., Science 2005, 310, 5751, 1135-1138.
273. Liberski, A.; Zhang, R.; Bradley, M., Chem. Comm., 2009, 7509–7511.
274. Limn J. Y.; Donahue, H. J., Tissue Eng., 2007, 13, 1879–1891.
275. Kandere-Grzybowska, K.; Campbell, C.; Komarova, Y.; Grzybowski, B. A.; Borisy,
G. G., Nat. Methods, 2005, 2, 739–741.
276. Thery, M.; Racine, V.; Pepin, A.; Piel, M.; Chen, Y.; Sibarita, J.-B.; Bornens, M.,
Nat. Cell Biol., 2005, 7, 947–953.
277. Chen, C. S.; Mrksich, M.; Huang, S.; Whitesides, G. M.; Ingber, D. E., Science,
1997, 276, 1425-1428.
278. D. G. Anderson, S. Levenburg and R. Langer, Nat. Biotechnol., 2004, 22, 863–866.
279. Rosenthal, A.; Macdonald, A.; Voldman,J., Biomaterials, 2007, 28, 3208–3216.
280. Harrick, N.J., J. Phys. Chem. 1960, 64, 1110-1114.
281. Fahrenfort, J., Spectrochim. Acta., 1961, 17, 698-709.
282. Andrew R. Hind, A.R.; Suresh K. Bhargava,S.K.; McKinnon,A., Adv.Colloid.Interfac.,
2001, 93 , 91-114.
283. Schuh,K., PhD thesis, Synthese und Charakterisierung von oberflächengebundenen
polymeren Netzwerken für die Herstellung von maßgeschneiderten Oberflächen
und polymeren Multilagen,2010, University of Freiburg, Germany.
284. Schuh, K.; Prucker, O.; Ruehe, J., Macromolecules 2008, 41, 23, 9284-9289.
285. Ratner, B.D., J.Biomat. Sci. Poly. Edn., 2000, 11,11, 1107-1119.
286. Geisen, U.; Heilmann, C.; Bayersdorf, F.; Benk, C.; Bertold-Herz, M.; Schlensak, C.;
Budde, U.; Zieger, B., Eur.J.Cardio-thorac., 2008,33,679-684.
287. Zhang, Z.; Zhang, M.; Shengfu, C.; Horbett, T.A.; Ratner, B.D.; Shaoyi, J.,
Biomaterials 2008,29,4285-4291.
288. Chen, J.M.; Naka, Y.; Rose, E.A., Nat.Clin.Prac.Card., 2006, 3, 7, 346-347.
289. Cao, L.; Sukavaneshvar, S.; Ratner, B.D.; Horbett, T.A., J. Biomed.Mater.Res.,2006,
79A, 788-803.
290. Cao, L.; Sukavaneshvar, S.; Ratner, B.D.; Horbett, T.A., J. Biomed. Mater. Res.
2007,81A, 12-23.
291. Sakamoto, S.: Watanabe, T.; Tokumaru, T.; Takagi,H.; Nakazato,H.; Lloyd,K.O.,
Cancer Res. 1989;49: 745–752.

Acknowledgements
210
Acknowledgements
I would like to express my sincere gratitude to Prof. Jürgen Rühe for giving me a
wonderful opportunity to work in his research group. I thank him for his excellent
supervision and many fruitful discussions that helped me to learn a proper science rather
than producing some results. I also thank him for his mentorship and help for my career.
I also sincerely thank Dr. Oswald Prucker for his guidance in this project. From the
beginning, he was a great support and very handful in all aspects of my research. Especially,
his help on humidity swelling measurements were highly appreciated. I also thank him for
his timely effort on correcting my thesis.
I take this opportunity to acknowledge my project collaborators Prof. Barbara Zieger
and Dr. Felix Günther, The University Hospital, Freiburg, Germany; for granting me the
opportunity to work in their lab and to learn more on platelet adhesion.
I greatly appreciate Mr. Joshua Markum, Mr. David Kroman, Mrs. Lisa Turnhoff, and
Mr. Fan Wu for doing their Bachelor‟s or Master‟s thesis with me and for their significant
contributions in the success of this research.
It is a great pleasure to acknowledge Dr. Josephine Selvaraj, Carson city, Nevada,
USA; for reading and correcting my thesis. Special thanks to Dr. Micael Henze for translating
my short summary to german (Kurzezusammenfassung). I am also grateful to Mrs. Maya
Narayanan Nair, Dr. Jon Green, Dr. A.G.Venkatesh and Mr. Nils Korf for their useful
suggestions and corrections in the thesis.
I thank Mrs. Petra Hettich, Mrs. Gudrun Condrad and Mrs. Waltraud Hanzer for
their help regarding administration procedures. My special thanks to Mrs. Petra Hettich for
helping many international students, especially for those who are new to the group. She is
one good assert in the group and deserves a high level of appreciation.
Acknowledgements
211
I thank Dr. Yi Thomann and Mr. Jonas Groton for their help regarding SEM images,
Mr. Xiaoqiang Hou for his timely help on AFM images, and Mrs. Natalia Schatz for synthetic
help and GPC measurements. I thank Mr. Martin Schoenstein for calorimetric and Mr.
Vitaly Kondrashov for contact angle measurements.
I thank Mr. Martin Marazita for sharing hood with me and being a wonderful friend
in the group. I greatly appreciate the company of Dr. Anke Würz, Dr. Chrishan Schuh, Dr.
Christine Bunte, Dr. Kerstin Schuh, Dr. Jacob Belardi, Mr.Gregor Osterwinter, Mrs. Melanie
Eichhorn and Mr. Vitaly Kondrashov for sharing office with me.
Finally, I thank and all members of CPI who provided me a wonderful work
environment that felt like home. Thank you one and all.