Embed Size (px)
Citation preview
The Intensity of Advertising and Other Selling Expenses
in Food and Tobacco Manufacturing :
Measurement, Determinants and Impacts*
John M. Connor Scott WeimerJf
The measurement of selling effort in the food processing industries has improved in several ways. An FTC data set on both advertising and promotional expenses is used to estimate some determinants of variations in the intensity of selling effort. They are found to be related to market sales concentration, the number of brands being sold, elaborateness of packaging, and product perishability. A second analysis finds that the intensity of food-manufacturer selling efforts is nonnegatively associated with grocery wholesalers’ or retailers’ gross margins. The latter finding challenges the view that manufacturer advertising provides information that ultimately benefits consumem through lower retail prices.
The size of selling costs plays a central role in the theory and testing of the basic paradigm of industrial-organization economics.’ Advertising-to-sales ratios (advertising intensity) are nearly universally employed in empirical studies as proxies for the degrees of product differentiation across brands within industries,
*An earlier version of this article was presented as a Selected Paper at the annual meeting of the American Agricultural Economics Association, Cornell University, Ithaca, NY, August 1984. This research was supported by the Purdue University School of Agriculture and Agricultural Research Station, Purdue Journal Paper No. 10,383.
tThe authors appreciate the constructive comments of Richard Rogers, Russell Parker, Stephen Hiemstra, Robert L. Wills, David Downey, Joseph Uhl, Richard Kohls, and an anonymous reviewer.
John M . Connor is Associate Professor, Department of Agricultural Economics, Purdue University, West Lafayette, Indiana.
Scott Weimer was a graduate student with the Department of Agricultural Economics, Purdue University, West Lafayette, Indiana. He currently with the Kellogg Company.
Agribusiness, Vol. 2, No. 3, 293-319 (1986) 0 1986 by John Wiley & Sons, Inc. CCC 0742-4477/86/030293-27$04.00
294 CONNOR AND WEIMER
as well as across industries. Product differentiation is a key determinant of several dimensions of performance in the food manufacturing industries.
This article has three main purposes. First, after making explicit our theoretical approach, we review advances made in the measurement of the intensity of selling costs of branded food and tobacco products. The earliest methods were confined to only a few media advertising expenditures, but a newly compiled data series utilized in this study permits the construction of far broader and more meaningful measures of selling costs. Second, we take a recently published model explaining the determinants of the intensities of broad selling costs across all manufacturing industries, apply it to data from the food and tobacco manufacturing industries, and attempt to refine the model. Third, we examine the interesting issue of the vertical transmission of selling costs by analyzing the relationship of selling costs of food and tobacco manufacturers to margins in grocery wholesaling and retailing.
THEORETICAL SETTING AND ISSUES Advertising is an aspect of both market structure and market conduct. As an element of market structure, product differentiation favorably shifts the demand for the products of one established firm relative to the demand for the products of other established sellers. All other things equal, industry profits will be redis- tributed toward the firms that are most successful in differentiating their brands. Moreover, product differentiation can, for several reasons, act as a barrier to new competition. 3,4 In this case there is a presumed asymmetry between the estab- lished sellers (incumbents) in an industry and potential entrants with respect to advertising and promotion.
Even if potential entrants face no disadvantages in economies of scale in production, “technological” economies of scale in advertising will create barriers to entry. Here advertising is viewed as a production process requiring various inputs to generate output (messages directed at potential buyers). Economies of scale in advertising can result from the high fixed costs of introductory advertising campaigns for new brands, from the necessity of introducing new products in subnational markets that require using less efficient regional media, and from the greater sales effectiveness of a larger volume of messages associated with repetition of a brand name or theme.
In addition to technological economies, there may be pecuniary advantages of size in advertising. Large advertisers tend to be multiproduct firms with leading brands. They are attractive clients for the most creative agencies. Leading estab- lished advertisers often have historical associations with the choicest program content or timing (e.g., the most appropriate shows, sports events, or personalities for reinforcing advertising effectiveness). Finally, blocks of media time are usually sold by private negotiations rather than through an open market process. For all these reasons, large incumbents can obtain rate discounts compared to new entrants for the same (quality-adjusted) volume of advertising.6 Such pecu- niary advantages could be dismissed if capital markets operated differently, but it is unconventional for financial institutions to lend to companies that would use as collateral the future goodwill capital that might be created by an advertising campaign.
In addition to advantages of size in advertising, potential entrants may face barriers to entry because of consumer behavior. For most kinds of consumer
ADVERTISING AND SELLING EXPENSES 295
goods, most research confirms that the level of advertising and promotion required to maintain already established consumer loyalty is less than the effort required to break that loyalty and switch purchasing to a new brand.7 This phenomenon may be due to simple habitation processes or risk-avoidance by consumers; another possibility is that thresholds of advertising-message awareness are higher for unfamiliar brands because of the cumulative impacts of repetitive advertising of established brands. Recently developed theoretical models of the advantages of “pioneering brands’’ are relevant. Schmalensee,8 for example, shows that in the case of experience goods, for which consumers learn about quality over time, early entry by a distinctly new product that provides utility for all consumers is sufficient to forestall, if not blockade, subsequent entry. If rational, risk-neutral consumers learn to judge product quality against the satisfactory standard of the pioneering brand, purely imitative brands will face substantial entry barriers; if consumers judge product quality by the images created by a pioneering brand’s advertising, potential entrants are similarly disadvantaged.
When the nature of the product in an industry lends itself to physical or image differentiation and when firms recognize their mutual interdependence, then selling effort tends to be a major form of $rm rivalry arising from oligopolistic market structures. Advertising, style changes, new product introductions, and other forms of nonprice conduct can enhance consumer brand loyalty and increase or stabilize firm market shares. Decreasing numbers of sellers, down to some point, may stimulate selling efforts because of game-theoretic considerations, such as the familiar “prisoners’ dilemma” reasoning. Moreover, as the mutual dependence among rivals becomes increasingly realized, they are more likely to forego price rivalry in favor of nonprice modes of conduct. However, with very small numbers of sellers, if oligopolistic coordination becomes nearly perfect, Greer’ has hypothesized that selling effort would be expected to fall to the level of a pure monopolist.
Advertising and promotion effort, in turn, feeds back on industry structure to heighten other barriers to entry. Recent theoretical modeling has focused on the uses of advertising conduct to deter entry. ‘c-’* Advertising, like some other forms of investment, can be used by incumbents to raise the costs of entry by new firms, so long as the advertising effects are durable and there are some real economies of scale. These entry-barrier effects are especially evident in the case of nondurable “experience” goods sold through self-service retail outlets and promoted mainly by exhortative (persuasive) media advertising. Most packaged, branded, processed grocery products fall into this category. l3
Selling costs have been shown to influence various measures of performance. Several published studies found that advertising intensity raises industry margins and profits. in the food manufacturing industries (reviewed in Connor et al.’). Additionally, Wills” found that advertising intensity was positively associated with the relative prices of brands of processed foods within narrowly defined markets. However, these studies were confined to advertising-margin (or adver- tising-price) relationships at only one stage of the food marketing system-the manufacturing stage. From the point of view of final consumer welfare, an impor- tant issue is whether there is an impact of manufacturers’ selling effort on either distributors’ margins or retail prices. Even though the weight of the evidence is that food manufacturers’ advertising raises processing margins and prices, it is possible that manufacturing-level advertising could reduce wholesaler-retailer
296 CONNOR AND WEIMER
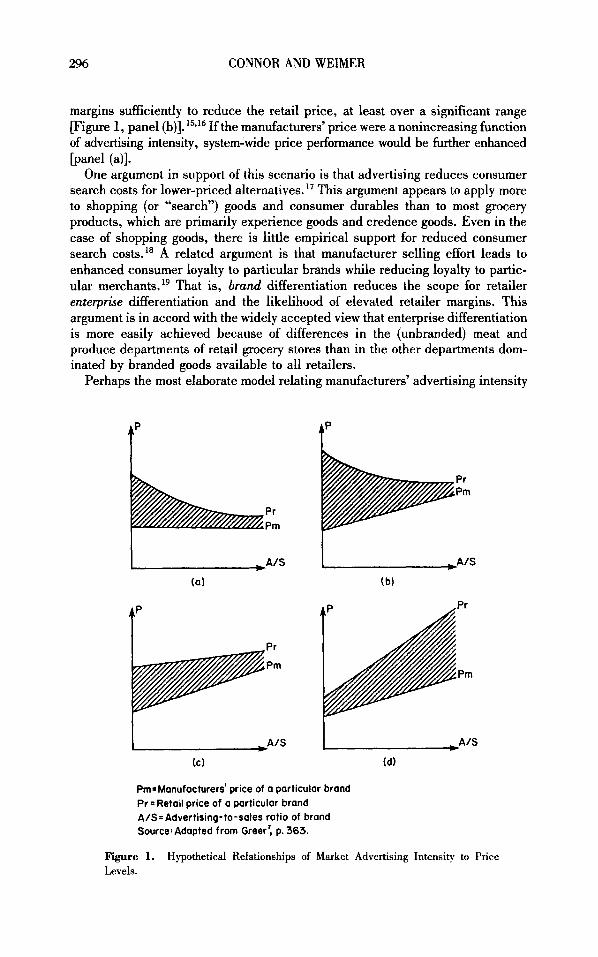
margins sufficiently to reduce the retail price, at least over a significant range [Figure 1, panel (b)]. 15~16 If the manufacturers' price were a nonincreasing function of advertising intensity, system-wide price performance would be further enhanced [panel (41.
One argument in support of this scenario is that advertising reduces consumer search costs for lower-priced alternatives. This argument appears to apply more to shopping (or "search") goods and consumer durables than to most grocery products, which are primarily experience goods and credence goods. Even in the case of shopping goods, there is little empirical support for reduced consumer search costs. l8 A related argument is that manufacturer selling effort leads to enhanced consumer loyalty to particular brands while reducing loyalty to partic- ular merchants. l9 That is, brand differentiation reduces the scope for retailer enterprise differentiation and the likelihood of elevated retailer margins. This argument is in accord with the widely accepted view that enterprise differentiation is more easily achieved because of differences in the (unbranded) meat and produce departments of retail grocery stores than in the other departments dom- inated by branded goods available to all retailers.
Perhaps the most elaborate model relating manufacturers' advertising intensity
t'
Pm-Manufacturers' price of a particular brand Pr =Retail price of a particular brand A/S=Advertising-to-sales ratio of brand Source:Adapted from Greer', p. 363.
Figure 1. Levels.
Hypothetical Relationships of Market Advertising Intensity to Price
ADVERTISING AND SELLING EXPENSES 297
to retail prices is that developed by Robert Steiner.20*21 It is a long-run dynamic model involving strategic interaction and countervailing power. In Steiner’s view, the advent of consumer advertising was the major force in fostering the appearance of mass merchandisers that emphasized high annual turnover with lower margins; as these replace traditional retailers, retail prices fall. In a mature market, either manufacture brands or private-label products may become dominant which would result in high margins for one party or the other and high prices reasserting themselves. Steiner believes that the third alternative, a mixed regimen of man- ufacturer and store labels, results in the lowest possible prices, assuming that consumers can effectively make interstore and intrastore price comparisons. A more recent exposition of Steiner’s views in the context of grocery retailers is contained in AlbionI6 who contends that retailers use heavily advertised products as “loss leaders” and “traffic builders.” Albion’s empirical test using data pro- vided by one regional grocery chain confirmed that highly advertised brands of grocery products have significantly lower retailer gross margins than unadvertised grocery products. Steiner’s hypothesis is depicted in panel (b) of Figure 1.
Even if distributor percentage margins are inversely correlated with advertising intensity, it is an empirical question whether retail prices of particular brands will fall [compare panels (b) and (c) of Figure 11. The relationship of retail price to manufacturers’ advertising intensity (A&) depends on the net result of the effect of A/S on retailer gross margins and the effect of A/S on manufacturer margins. * Moreover, if manufacturers set higher margins on their more advertised, less demand-elastic products, retailers could conceivably decide to pyramid their margins in accordance with observed advertising levels [panel (d)]. Greer’ opines that most foods fit the situation illustrated in panel (b) but that the most heavily advertised grocery products (soft drinks, breakfast cereals, cigarettes, and alco- holic beverages) best fit panel (c).
Some theorists have proposed that selling costs themselves might be considered an aspect of performance. The main impediment is disagreement about whether an objective critical competitive standard can be devised even for single industry. Various writers have suggested that selling costs above 1% to 4% of sales are excessive, but the methods used to arrive at these levels are often obscure or arbitra~y.~**~ Direct measurement of excessive advertising would require distin- guishing the informational from persuasive components of advertising, rent-seek- ing selling costs from barrier-evading expenditures, and other equally arduous tasks.
Setting an optimal advertising budget is also an important problem in the business-management literature. Management surveys indicate that the adver- tising budget is usually fixed as a percent of sales on each product sold, of profits, or of cash This begs the question of how the original fixed per- centage was derived. Farris and Buzze1lZ5 suggest that a firm’s advertising intensity
*A more subtle point is raised by Wills% in his review of Albion’s16 book. Variable Price merchandizing by food retailem could lower the retail gross margins on heavily advertised brands while simultaneously raising the margins on private label or unadvertised products. Indeed, Albion’s own data supports this view (see also Albion and Farris,I5 Figure 3). That is, reduced retail margins on the highIy advertised brands in a store do not necessarily imply any effect on total store (or firm) gross margins or on the price level of the market basket of grocery products purchased by consumers.
298 CONNOR AND WEIMER
is simply equated to the industry’s average advertising intensity. Long’sz6 empir- ical investigation of advertising intensity at the individual line-of-business level showed, for 12 food industries, that firm A/S was generally positively associated with industry A/S but negatively associated with market share. Thus, in addition to market averages, firms in some industries also consider their market position when setting their A/S ratios.
Given the central role ascribed to selling costs in theory, its strong explanatory power in empirical studies of the food industries, and the implications for business marketing decisions, it is important to measure as precisely as possible the selling costs of grocery products. In this respect, there has been marked improvement in techniques and data sources.
MEASURING SELLING EXPENSES Well over two-thirds of the advertising and promotion expenses in the US food system originate wth grocery-products manufacturers. Advertising by grocery retailers amounts to only about 1% of retail sales, and most of it is “cooperativeyy advertising-price-oriented newspaper advertising paid for by manufacturers.” Like grocery retailers, advertising by the food service industry also appears mainly in newspapers; it averages less than 0.2% of sales.” However, the advertising by major fast-food chains amounts to about 3% of sales.= Food wholesalers advertise at very low levels in trade publications. Media advertising expenditures by US agricultural commodity associations-so-called generic advertising- accounted for about 1.7% of total mass media food advertising in 1982.30 The rest of this article is confined to the selling costs of food and tobacco manufacturers because they are more varied and dominate the selling efforts of other stages of the food marketing system.28
There are three main types of manufacturer selling costs. (1) The first type is mass-media advertising, which includes electronic (TV and radio, both spot and network) and printed (newspapers, magazines, billboards, and newspaper sup- plements) advertising. Since the 1960s, it has been possible to purchase data on annual advertising expenditures by brand for eight different mass media. 31 (2) Other (“non-media”) advertising includes point-of-purchase displays, free sam- ples, direct mail, catalogs, calendars, and the like. (3) Promotional effort- selling costs other than advertising-are the most varied. Direct selling by a manufacturer’s representative is probably the largest single promotional cost, though in some industries a significant portion of salesmen’s expenses are for purely distributive services. Other clearly promotional costs are premiums, sweepstakes, contests, coupons, trade fairs, and convention displays. In addition, some costs of product development, market testing, and special price deals may be considered, in part, promotional expenses.
The last two decades have witnessed steady improvements and refinements in measuring food selling costs. Agricultural economists and agribusiness research- ers have been quick to capitalize on newly available data sources. To understand the advantages of the broadly defined selling cost data used in this article, it is helpful to review these advances in measuring food selling costs.
There is evidence of significant food advertising by manufacturers since at least the turn of the ~entury.~’ Yet, the first industrial organization study of the food processing industries contained practically no data on advertising or other
ADVERTISING AND SELLING EXPENSES 299
selling costs.% The technical reports of the National Commission on Food M ~ k e t i n P ~ ~ contained some of the first systematic treatments of selling costs. One source used in Technical Study No. 8% was corporate income-tax data on advertising costs compiled by the Internal Revenue Service. These data include media and nonmedia advertising expenditures, and they are still widely used by researchers, but IRS data are increasingly unreliable because firms are cate- gorized by their principal industry. Hence, much of the advertising expenditures and sales of diversified firms applies to other industries. By 1977 about 60% of the sales of companies primarily categorized as food manufacturers occurred outside its principal enterprise category.2 A second data source used in Technical Study No. 8 was brand-by-brand dollar expenditures in four mass media (Network TV, spot TV, general magazines, and newspapers). This method is more precise because each brand’s advertising can be matched to industry shipments value, but it understates the intensity of selling effort because expenditures on several types of selling effort are omitted.
Technical Study No. 6 may have been the first published study of total selling costs in any food industry-the breakfast cereal and cookie and cracker indus- tries. The study used a questionnaire mail survey with a nearly 100% response rate.35 Total selling costs included not only media advertising but also sales promotion (coupons, free samples, cents-off deals, point-of-purchase displays, and advertising allowances to retailers), personal selling costs (salesmen), mar- keting research, new product development costs, and physical distribution (ware- housing and transportation). Total manufacturers’ selling expenses in 1964 amounted to 27% and 24% of sales for breakfast cereals and cookies and crackers, respectively. There were striking differences between the two industries. Media advertising accounted for over 50% of selling costs for cereals but less than 10% for baked goods; but personal selling and distribution costs were 80% of selling costs for cookies and crackers and only 25% for cereals.35 No similar data were published for other food or tobacco manufacturing industries until 1980.
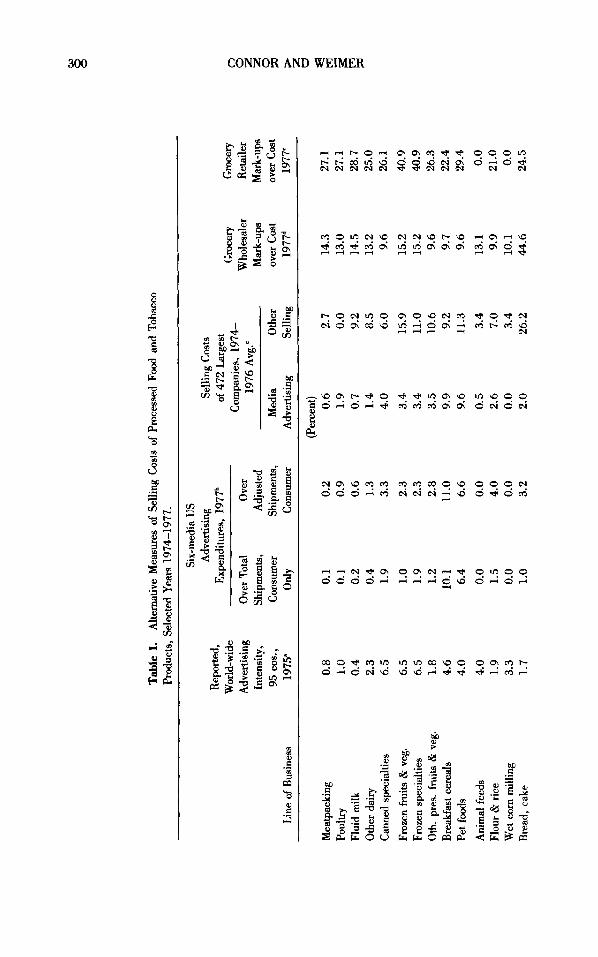
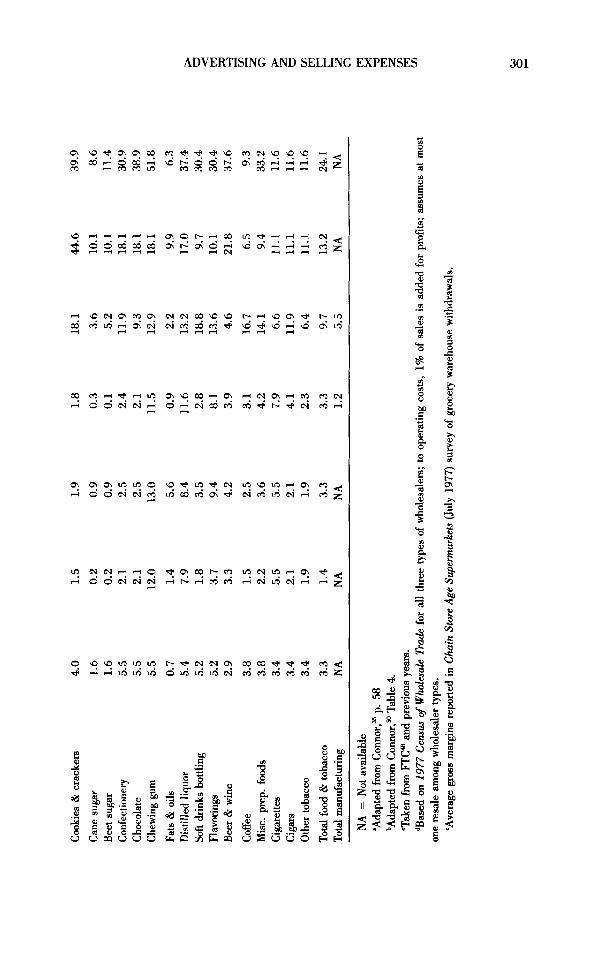
A few refinements were made in measuring the intensity of selling costs in the intervening years. Conno136 included a number of different measures of adver- tising intensity. One approach categorized the advertising expenditures and com- pany sales from the annual reports of the 95 largest publicly owned food and tobacco manufacturers of 1975 (Table I, first column). These are world-wide data and suffer from the same problems of domestic sales diversification as do IRS data; moreover, this approach usually must omit cooperatives, foreign-owned US affiliates, and other private companies that do not issue public financial reports. Rogers3’ reconciled media advertising expenditures to food manufacturing ship- ments for several time periods. Most empirical work has used unaltered Census shipments data, but obviously there is little or no media advertising directed by food manufacturers at shipments of semiprocessed foodstuffs, export sales, sales to foodservice operators, or private label products. For some empirical work, it would be most appropriate to use advertising data that removes some or all of the shipments of these unadvertised sales channels. The large differences that can result in calculations of media advertising intensities using different ship- ments’ definitions are shown in Table I (second and third columns).
Galloz* was the first to calculate total selling expenses for all foods (including unprocessed foods, but excluding alcoholic beverages and tobacco products). Extrapolating these data to all food and tobacco manufacturers, consumer-directed
Q
Table
I. Pr
oduc
ts,
Sele
cted
Yea
rs 1
974-
1977
. A
ltern
ativ
e M
easu
res
of Se
lling
Cos
ts o
f Pr
oces
sed
Food
and
Tob
acco
Six-
med
ia U
S A
dver
tisin
g Se
lling
Cos
ts
Expe
nditu
res,
197
7b
of 47
2 La
rges
t R
epor
ted,
Adv
ertis
ing
Ove
r Tot
al
Ove
r 19
76 A
vg.‘
Who
lesa
ler
Ret
aile
r In
tens
ity,
Ship
men
ts,
Adj
uste
d M
mk-
ups
Mar
k-up
s 95
cos
., C
onsu
mer
Sh
ipm
ents
, M
edia
O
ther
ov
er C
ost
over
Cos
t
Wor
ld-w
ide
Com
pani
es,
1974
- G
roce
ry
Gro
cery
n
% s 0
2 z 0 P U
Line
of
Bus
ines
s 19
75”
OdY
C
onsu
mer
A
dver
tisin
g Se
lling
19
77d
1977
‘
a E3 (P
erce
nt)
Mea
tpac
king
0.
8 0.
1 0.
2 0.
6 2.
7 14
.3
27.1
Po
ultry
1.
0 0.
1 0.
9 1.
9 0.
0 13
.0
27.1
Fl
uid
milk
0.
4 0.
2 0.
6 0.
7 9.
2 14
.5
28.7
O
ther
dai
ry
2.3
0.4
1.3
1.4
8.5
13.2
25
.0
Can
ned
spec
ialti
es
6.5
1.9
3.3
4.0
6.0
9.6
26.1
9
Froz
en f
ruits
& v
eg.
6.5
1.0
2.3
3.4
15.9
15
.2
4.9
Fr
ozen
spe
cial
ties
6.5
1.9
2.3
3.4
11.0
15
.2
40.9
0t
h. p
res.
frui
ts &
veg
. 1.
8 1.
2 2.
8 3.
5 10
.6
9.6
26.3
B
reak
fast
cer
eals
4.
6 10
.1
11.0
9.
9 9.
2 9.
7 22
.4
Pet f
oods
4.
0 6.
4 6.
6 9.
6 11
.3
9.6
29.4
Ani
mal
fee
ds
4.0
0.0
0.0
0.5
3.4
13.1
0.
0 Fl
our
& ri
ce
1.9
1.5
4.0
2.6
7.0
9.9
21.0
W
et c
orn
mill
ing
3.3
0.0
0.0
0.0
3.4
10.1
0.
0 B
read
, ca
ke
1.7
1.0
3.2
2.0
26.2
44
.6
24.5
Coo
kies
& c
rack
ers
4.0
1.5
1.9
1.8
18.1
44
.6
39.9
Can
e su
gar
1.6
0.2
0.9
0.3
3.6
10.1
8.
6 B
eet s
ugar
1.
6 0.
2 0.
9 0.
1 5.
2 10
.1
11.4
C
onfe
ctio
nery
5.
5 2.
1 2.
5 2.
4 11
.9
18.1
30
.9
Cho
cola
te
5.5
2.1
2.5
2.1
9.3
18.1
38
.9
Che
win
g gu
m
5.5
12.0
13
.0
11.5
12
.9
18.1
51
.8
Fats
& o
ils
0.7
1.4
5.6
0.9
2.2
9.9
6.3
Dis
tille
d liq
uor
5.4
7.9
8.4
11.6
13
.2
17.0
37
.4
9
Soft
drin
ks b
ottli
ng
5.2
1.8
3.5
2.8
18.8
9.
7 30
.4
U
Flav
orin
gs
5.2
3.7
9.4
8.1
13.6
10
.1
30.4
s =a
4 z z -
Bee
r &
win
e 2.
9 3.
3 4.
2 3.
9 4.
6 21
.8
37.6
Cof
fee
3.8
1.5
2.5
3.1
16.7
6.
5 9.
3 !2
Misc
. pr
ep.
food
s 3.
8 2.
2 3.
6 4.
2 14
.1
9.4
33.2
0
Cig
aret
tes
3.4
5.5
5.5
7.9
6.6
11.1
11
.6
4
Cig
ars
3.4
2.1
2.1
4.1
11.9
11
.1
11.6
G
m
Tota
l man
ufac
turi
ng
NA
N
A
NA
1.2
5.5
NA
NA
2
NA =
Not
ava
ilabl
e m
bAda
pted
from
Con
nor,5
0 Tab
le 4
. “T
aken
from
FTCa
and
prev
ious
yea
rs.
Ifl
Oth
er to
bacc
o 3.
4 1.
9 1.
9 2.
3 6.
4 11
.1
11.6
Tota
l foo
d &
toba
cco
3.3
1.4
3.3
3.3
9.7
13.2
24
.1
E 0 3
“Ada
pted
from
C~
nn
or,
~~
p.
58
2
m
M
Ifl
dBas
ed on
197
7 C
ensu
c of
Wbk
sale
Tra
de fo
r a
ll th
ree
type
s of
who
lesa
lers
; to
oper
atin
g co
sts,
1%
of
sale
s is
add
ed f
or p
rofit
s; a
ssum
es a
t m
ost
‘Ave
rage
gro
ss m
argi
ns re
porte
d in
Chain S
tore
Age
Su
pem
rket
s (J
uly
1977
) sur
vey
of g
roce
ry w
areh
ouse
with
draw
als.
on
e re
sale
am
ong
who
lesa
ler t
ypes
.
302 CONNOR AND WEIMER
selling effort (media advertising, incentives, and coupons) amounted to $4.5 billion in 1979. Dealer-directed promotion efforts (trade shows, trade-publication advertising, advertising allowances, point-of-purchase, and direct selling) amounted to $6.8 to $7.9 billion in 1979. Thus, total selling-effort expenditures by food and tobacco manufacturers were $11.3 to $12.4 billion, or 5.0 to 5.5% of the value of manufacturers’ shipments in 1979. Not included in these totals are an estimated $3 to $6 billion in deals and discounts to distributors. Nor are the costs of warehousing, storage, or transportation included; for example, only the commissions of driver-salesmen are included, not their salaries.
Deals and discounts are properly treated as a reduction in sales by both manufacturers and retailers, if the price reductions are passed on completely to consumers. Legal prohibitions on vertical price restraints mean that manufac- turers cannot enforce the intended temporary price reductions. * Even retailers that cut prices during deal periods often build large inventories of deal mer- chandise and sell them at normal prices after the deal period has expired. The high margins on such merchandise may well encourage retailers to use shelf placement, special displays, or other means at their disposal to increase store sales. Similarly, at least part of the salaries of manufacturers’ representatives are spent with the expectation that their presence in the store will improve or preserve their brands’ share of store sales. In both cases, therefore, an unknown portion of the costs of deals, discounts, and labor have the same effect as other dealer- directed promotion expenditures. It is unlikely that these will ever be adequately measured.
’
DETERMINANTS OF MEDIA ADVERTISING AND OTHER SELLING EXPENSES
The state of knowledge of the determinants of relative selling costs across indus- tries is deficient in several respects. First, advertising, we have argued, is both evidence of the degree of product differentiation achieved by goods in the market (structure) and one of several perhaps complementary selling strategies open to firms in oligopolistic markets (conduct). In empirical work within an industrial organization framework it is likely to be difficult to disentangle these two sources of variation. However, it does limit the search for determinants of variation in advertising intensities to the nature of the product (durability, novelty, capital or consumer good, etc.), demand characteristics (frequency of purchase, typical size of purchase units, type of distribution channel, growth rates), and market structure (buyer or seller concentration, market shares). That is, we view observed industry advertising intensities as an outcome of the basic demand and supply conditions that influence stmtural product differentiation and elements of market structure that affect selling on conduct. Several published studies of variation in advertising intensities include primarily performance elements, such as unit price
*An interesting recent case% is a 1983 price change on candy bars initiated by Henhey. The wholesale price increase was designed to raise the retail price of ordinary bars from 30 to 35 cents. Mars, Hershey’s main rival (both had market shares of about 35%), failed to follow, hoping to increase its market share. Instead, retailers simply raised the retail price of both companies’ candy bars to 35 cents and for a while enjoyed extra-large margins on Mars’ brands.
ADVERTISING AND SELLING EXPENSES 303
or profits (these may be justified as explanatory factors in a business-management or firm-finance
A second concern is the level of analysis. Advertising budgets are set at the level of the brand or for a group of brands controlled by a single company (or company profit center). Yet, most empirical studies have used advertising data from broadly defined industries or diversified Lambin41 and Fanis and Buzze1lZ5 are among the few studies at the appropriate brand or profit-center level of analysis.
A final limitation of most published research on the topic is lack of data on selling effort beyond media advertising. Unmeasured media advertising (e. g., handbills) and nonmedia advertising (premiums, coupons, sweepstakes, package design) directed at consumers are very likely complementary to the measured- media data available. Data on the intensity of food couponing activity, reported by Gallo, Hamm, and Zellner,42 were -highly correlated across industries with media advertising-to-sales ratios. However, there is little known about the many forms of distributor-directed “push” promotions (primarily direct sales forces, but also deals, allowances, trade fairs, conventions, and others). For a given market or firm, push and pull methods of selling effort may substitute for each other or may be complementary; Lambin’s4I study suggests the latter for consumer goods. The present study overcomes all three of these limitations.
There has been a modest amount of empirical testing of the sources of variation in advertising-to-sales ratios. Six cross-sectional statistical studies are reviewed in Albion and F a r r i ~ . ~ ~ * * Three more such quantitative studies of the variation in advertising-to-sales ratio were published since their survey appeared: Long,26 Gupta,a and Weiss, Pascoe, and Martin.44 Most of these studies have relied on major mass-media advertising expenditures by manufacturers on manufactured products. The determinants of advertising intensity also have been modeled as part of a simultaneous equation system linking market structure elements to pe r f~ rmance .~~’ In the case of the food manufacturing industries, Pagoulatos and SorensenM tested a model with advertising intensity, seller market concen- tration, and 1972 industry price cost margins endogenous.? A common finding of these simultaneous-equation efforts is that, compared to single-equation models, there is no evidence of simultaneous-equation bias. a Because simultaneity con- cerns apply more to other organizational variables (profits, concentration, and R&D) than to advertising, we feel confident in estimating the determinants of advertising intensity using a single equation model.
*One of the best such statistical investigations is by Farris and B~zzell .’~ They had access to data on both advertising and sales promotion expenditures of firms in 281 consumer lines of business. They found that the ratio of these selling expenditures to sales was positively and significantly related to: “standardization” (not custom-made), infrequency of purchase, small unit- purchase value, proportion of sales to distributors (as opposed to direct sales to final consumers), and proportion of new products marketed by the business. Except for infrequency of purchase, these characteristics are fairly typical of packaged, branded grocery products.
$In the equation with advertising intensity as the dependent variable, four variables were found to exert a significant positive influence: growth in value of shipments, price-cost margins, the proportion of consumer to total industry demand, and the average number of brands per firm in the industry.
304 CONNOR AND WEIMER
The study by Weiss et aLM is the most recent statistical investigation of the determinants of the intensities of selling costs. Unlike previously published work, they provide separate estimates for the two major kinds of selling costs: Media advertising (A/S) and “other selling” expenses (OS/S). The data are from the FTC’s@ line-of-business reporting program for one year, 1975. The sample con- tained data on 270 lines of business of 471 large manufacturing firms. A line of business corresponds to one or a few four-digit SIC industries. “Other selling” expenses include direct selling, point-of-sale displays, coupons, samples, retail- ers’ advertising allowances, and trade allowances to retailers. Deliveries to ware- houses and inventory maintainance were not counted as selling expenses. Weiss et a1.@ estimated the determinants of variation in both kinds of selling costs across 85 consumer-goods lines of business.
In the present study we restricted ourselves to a simple additive, single- equation model. Virtually all the data are drawn from the 1974-1977 period, one that is short enough to be assumed to be structurally stable. We began with the model tested by Weiss et al. which consisted of media intensity and other selling costs as a function of (1) household demand divided by total demand (CD/ S), (2) adjusted percentage four-firm sales concentration (CR4), (3) adjusted concentration squared (CR4’), and (4) distance shipped in thousands of miles (DIST). We omitted buyer concentration because it was insignificant in all the Weiss et al.44 p n s with consumer goods, a result in accord with Martin.* The first variable, CDIS, was developed from data from the 1977 US Input-Output Table. The data for CR4 and CR4’ were drawn from Weiss and Pascoe.” The concentration ratios were adjusted for noncompeting subgroups, local or regional markets, interindustry competition, and import and exports. These variables may be considered lagged because concentration levels across Lines of Business are generally stable and slow to change. Distance shipped (DIST) was average dis- tance that accounted for 80% of the shipment tonnage from manufacturing plants in 1977.% Like Weiss et al. our model uses the FI’C Line of Business selling cost data; unlike Weiss et al. , we computed averages for three years and restricted ourselves to 30 food and tobacco manufacturing lines (Table I, fourth and fifth columns).
The hypotheses underlying inclusion of these four variables are fairly straight- forward. The variable CD/S distinguishes consumer-product sales from the sales of industrial food materials. CD/S should be positive for both advertising and nonadvertising selling intensities because, for a given amount of sales, it is more expensive to inform numerous scattered households about product characteristics than the fewer professional buyers of industrial foodstuffs. Moreover, the per- suasive component of selling costs is likely to be directed mainly toward house- holds. Concentration is expected to have a positive influence on selling costs if firms increasingly substitute nonprice rivalry for competitive pricing strategies as CR4 rises; CR42 is included to allow for a nonlinear relationship that might arise because, at some point, food manufacturers begin to realize that mutual, coordinated reductions in selling costs will raise joint profits through cost savings (and the threat of entry does not rise dangerously). Finally, the DIST may be interpreted as an additional correction on CR4, an important correction for the typically subnational markets for processed food products. When DIST is low, say 200 miles or less, there are likely to be many geographically localized selling markets. In this case, the published data on national CR4 will severely understate
ADVERTISING AND SELLING EXPENSES 305
actual concentration in the market. When DIST is large, published CR4 data are a more accurate reflection of actual concentration. Because CR4 is generally understated, DIST is expected to be nonpositive.
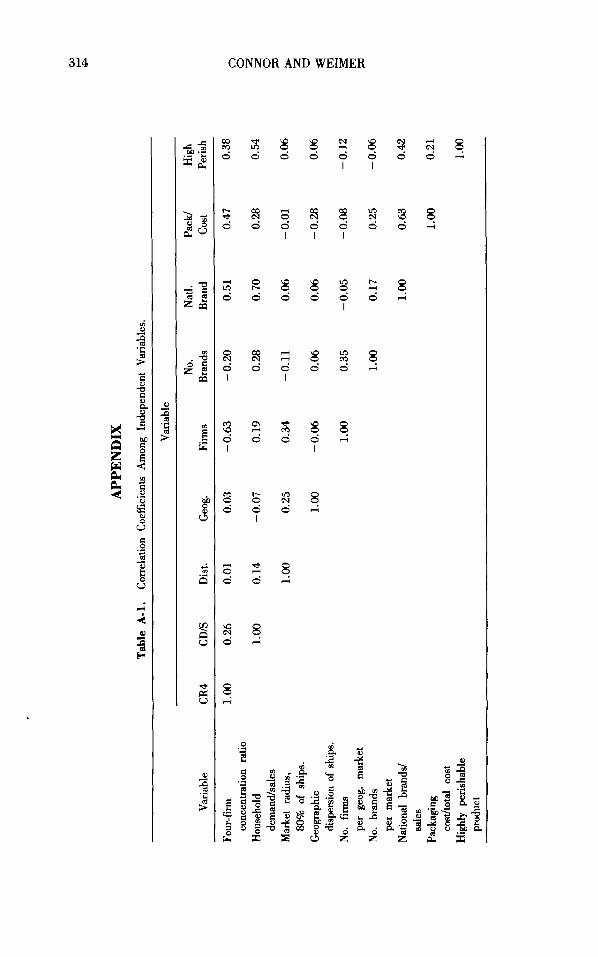
Six new determinants were considered. The first was the average number of firms in 1977 per geographic US market within each line of business (FIRMS). Concentration is defined as the number and size distribution of sellers in a market. The concentration ratio captures only the size asymmetry aspect of market con- centration. Like a high concentration ratio, low firm numbers signal the feasibility and likelihood of collusion or interdependent behavior among sellers. In addition, when the number firms in the same geographic market is larger than some modest level (say 10 or ZO), many firms are likely to become specialized in the private- label or foodservice channels that require relatively little selling effort to con- sumers. Company numbers are significantly correlated with the concentration ratio ( r = - 0.63) (see Appendix, Table A-1). For these reasons, it was expected that numbers of firms would be inversely related to the intensity of media adver- tising. On the other hand, a large number of firms is characteristic of geograph- ically localized markets and perishable goods. Such markets tend to rely on direct-store-delivery systems, but nonadvertising selling expenses should be pos- itively related to the number of firms when the concentration is also included to capture the influence of overt or tacit collusion. The data for this variable are from Connor. 5o
Our second new variable was the total number of brands within each line of business (BRANDS). The source of these 1975 data was Connor and Mather.31 It was hypothesized that a large number of brands would cause a higher level of advertising intensity because the advertising “clutter” created by numerous brands increases the amount of self-cancelling advertising. This variable may also capture the presence of entry-deterring strategies by incumbent firms. 51 For nonadver- tising selling expenses, the expected direction of influence of the number of brands is not clear because there may be substantial economies of scope for the direct field salesforces of diversified grocery marketing firms. Farris and Albion” found that large numbers of brands are associated with higher advertising-to- sales ratios; Pagoulatos and Soremen& found the same result among food man- ufacturing industries.
Our third new variable was called “perishability.” It was included as a dummy variable (PERISH). In some studies of broad samples of goods, nondurable but infrequently purchased consumer products were related to higher advertising and other-expenses-to-sales ratios.I7 While the range is not very wide in our sample, food products were classified into two groups based on a combination of the durability of the product and frequency of purchase. PERISH took a value of 1 if the products are highly or moderately nondurable with average household purchases rates of 30 days or less (see Gallo5*). The remainder are products with relatively high storability that are usually purchased less frequently than once a month-canned goods, flour, sugar, distilled liquor, and a few others. Because perishable products are predominantly “experience” goods and the storable goods have some slight search-goods characteristics, PERISH is expected to have a positive effect on the intensity of selling effort.
Fourth, a variable was developed that measures the geographic dispersion of industry production compared to the distribution of US population (GEOG). It is roughly the same as DIST, so it is never used in the same model with GEOG.
306 CONNOR AND WEIMER
However, because GEOG has been more widely used in previous industrial- organization studies as a correction on CR4 for local and regional markets, it was tried as an alternative to DIST, especially in view of their low simple cor- relation (see Appendix, Table A-1).
Fifth, a variable was introduced that represents the proportion of grocery- store sales in the line of business accounted for by manufacturer-brand items (NATL BRAND). This variable helps correct for the presence of private-label and foodservice sales in the denominator of the intensities of selling effort, especially advertising. Advertising is directed at branded products only, so adver- tising intensities should be higher when NATL BRAND is high (see ConnoP). The same (but weaker) relationship should hold for nonadvertising promotion efforts; it will be weaker because some direct delivery costs are incurred for private label bread, dairy products, and the like.
Finally, PACWCOST measures the cost to manufacturers of packaging mate- rials relative to all other materials purchased (mostly food and chemical ingre- dients). Elaborate or expensive packaging is one outward manifestation of the degree of physical differentiation of products in a market. 53 Advertisements often hinge on the ability to make a statement about some tangible differences among brands. Media advertising messages, including depictions of the trademark and repetition of the tradename, can be reinforced in the grocery store as the consumer gazes at product displays. Therefore, media advertising and packaging costs are likely to be highly complementary expenditures in a given market. The absence of manufacturer packaging (such as in fresh meats or random-cut cheeses wrapped in stores) inhibits the development of brands. For other types of selling effort, packaging is not likely to play as strong a role, especially for direct-delivery costs for bread and milk. We expect no relationship of PACWCOST to the other- selling effort-to-sales ratio. Packaging cost data were developed from the 1977 Census of Manufactures industry reports.
REGRESSION RESULTS
Media Advertising
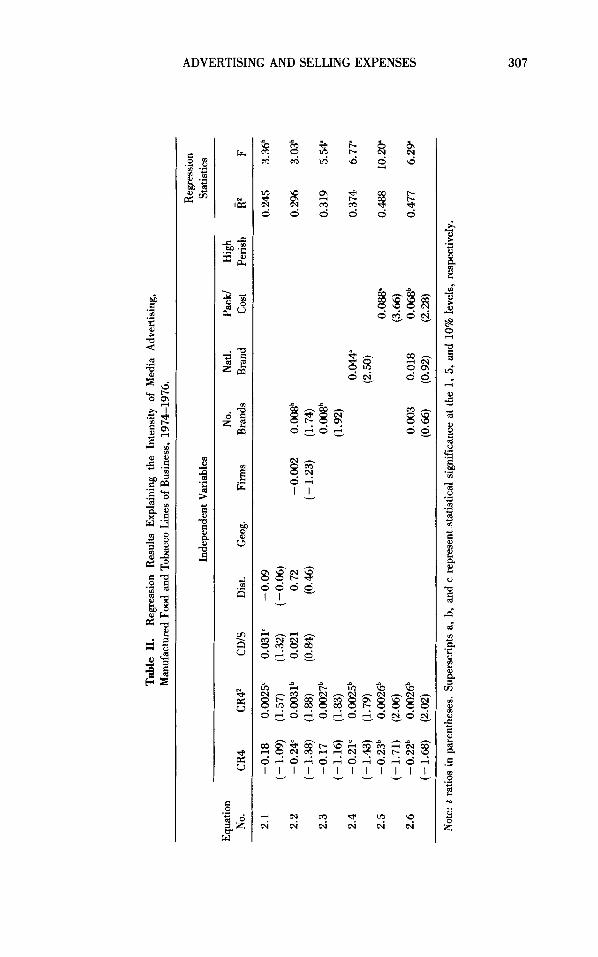
Table I1 contains our regression results with the media advertising-to-sales ratio as dependent variable. The F tests for all equations were significant at the 5% level or better. The corrected coefficient of determination, R2, was considerably higher than those obtained in Weiss et a1.@ for a comparable model. Our sample of 30 lines of business constitutes about one-third of the consumer goods industries used by Weiss et a1.44 Our (uncorrected) R2 value was as high as 0.58 with five independent variables.
Food-industry sales concentration (CR4 and CR47 is significant in each equa- tion, but in the media-advertising models the shape is an unexpected downward- bending parabola; it reaches its minimum value at about CR4 = 40%. This relationship is different from the results of Weiss et a1.& for all manufacturing, which described an upward-bending parabola with the peak at 50 to 55%.5 From the significant positive sign of the coefficient of CR42 we must infer that food manufacturers are unable to cooperate in reducing media-advertising intensity as markets approach monopoly levels of concentration. Models (not shown) con- taining only a first degree CR4 term are significantly positive. There may be
Tab
le 1
1. M
anuf
actu
red Food a
nd T
obac
co L
ines
of
Bus
ines
s, 1
974-
1976
. R
egre
ssio
n R
esul
ts E
xpla
inin
g th
e In
tens
ity o
f M
edia
Adv
ertis
ing,
Reg
ress
ion
Inde
pend
ent V
aria
bles
St
atis
tics
Equa
tion
No.
Nat
l. Pa
ck/
Hig
h -
No.
CR
4 CR
4’
CDIS
D
ist.
Geo
E.
Firm
s B
rand
s B
rand
C
ost
Peri
sh
R’
F
2.1
-0.1
8 0.
0025
’ 0.
031‘
-0
.09
0.24
5 3.
36b
2.2
-0.2
4“
0.00
31b
0.02
1 0.
72
-0.0
02
0.00
8b
0.2%
3.
03b
2.3
-0.1
7 0.
0027
b O
.Wb
0.31
9 5.
54:
2.4
-0.2
1‘
0.00
25b
0.W
0.
374
6.77
”
2.5
- 0.
23b
0.
O02
6b
0.088’
0.488
10.2w
2.6
-0.2
2b
0.00
26b
0.00
3 0.
018
0.06
8b
0.47
7 6.
29
(-1.
09)
(1.5
7)
(1.3
2)
(-0.
06)
(-1.
38)
(1.8
8)
(0.M
) (0. ‘w
(-
1.2
3)
(1.7
4)
(- 1
.16)
(1
.83)
(1
.92)
(- 1
.43)
(1
.79)
(2
.50)
(- 1
.71)
(2
.06)
(3
.66)
(- 1
.68)
(2
.02)
(0
.66)
(0
.92)
(2
.28)
Not
e: 1
ratio
s in
par
enth
eses
. Su
pers
crip
ts a
, b,
and
c r
epre
sent
sta
tistic
al s
igni
fica
nce
at t
he 1
, 5, a
nd 1
0% le
vels
, res
pect
ivel
y.
ui m
308 CONNOR AND WEIMER
some collinearity between CR4 and FIRMS, CR4 and NATL BRAND, and CD/ S and NATL BRAND (see Appendix, Table A-1). The insignificance of FIRMS implies that size inequality among sellers, but not the existence of potential competition from fringe sellers, is the aspect of market concentration that affects advertising intensity.
The proportion of consumer demand (CD/S) is positive but is insignificant or marginally significant in the media advertising equations. There are only three predominantly producer-goods observations in our data set (e. g., animal feeds), and on average about 60% of industry shipments are consumer goods. These results are about the same as Weiss et a1.@ but the lower insignificance is probably due to less variation in CD/S. Unlike the Weiss et a1.@ study, neither distance shipped (DIST) nor geographic dispersion (GEOG) was ever significant in our regressions. Therefore, the direct adjustments for local and regional markets made for CR4 were sufficient in the case of the food manufacturing industries.
Among the additional explanatory factors tried in our models, the number of brands, national-brand proportion, and packaging costs have, as expected, sig- nificant (positive) impacts on media advertising intensity. These three variables are collinear, so all three seem to be proxies for some more general, underlying market type which might be called an elaborately packaged, tightly packed, branded goods market. Of the three proxies alone, PACUCOST explained the greatest variation in media advertising intensity (Equations 2.3 to 2.5 in Table 11). The coefficient of the number of firms per market is always negative, but never statistically quite significant. The dummy variable representing perisha- bility (durability, storability) has no significant relationship to advertising inten- sity.
Other Selling Costs
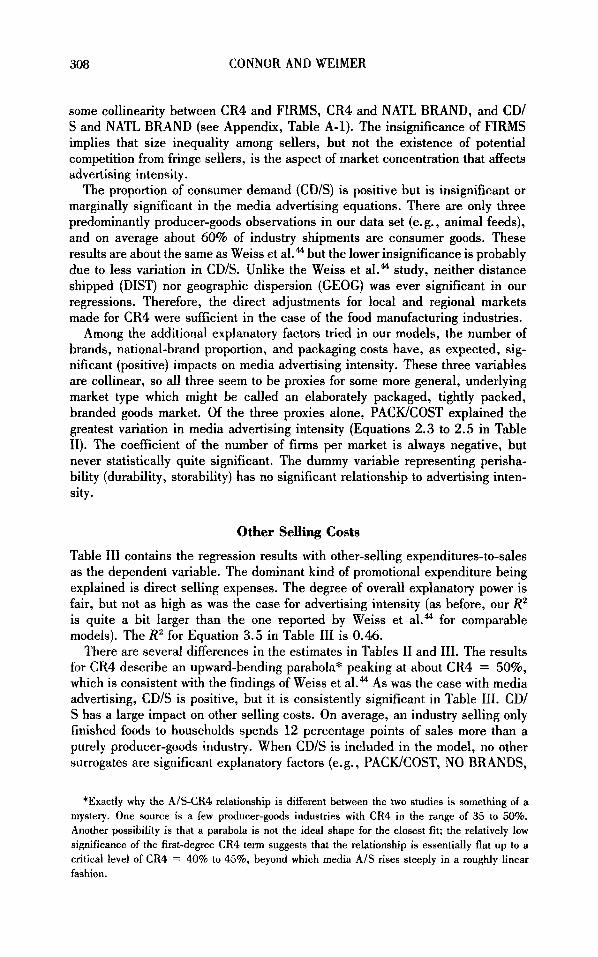
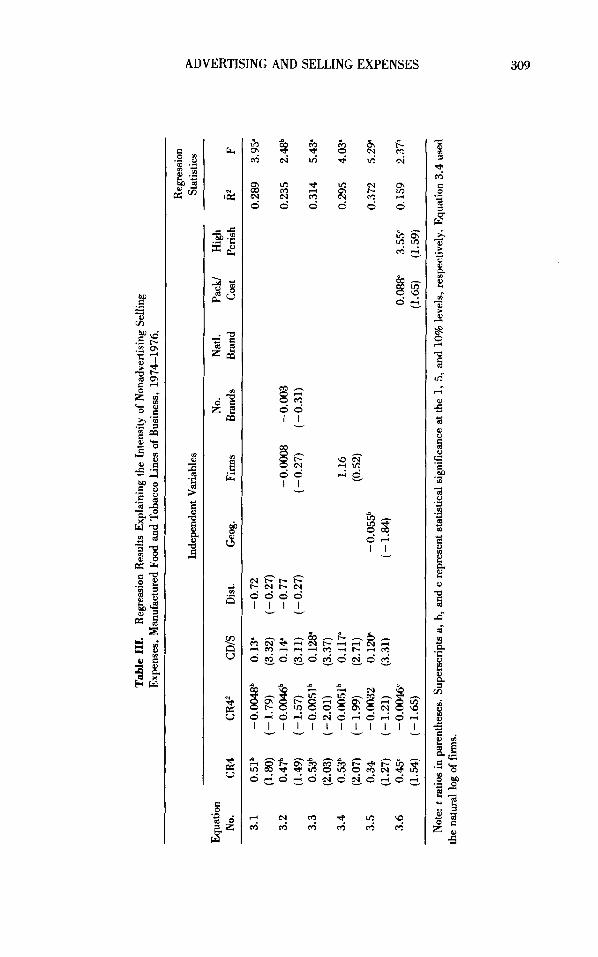
Table 111 contains the regression results with other-selling expenditures-to-sales as the dependent variable. The dominant kind of promotional expenditure being explained is direct selling expenses. The degree of overall explanatory power is fair, but not as high as was the case for advertising intensity (as before, our R2 is quite a bit larger than the one reported by Weiss et aLM for comparable models). The R2 for Equation 3.5 in Table I11 is 0.46.
There are several differences in the estimates in Tables I1 and 111. The results for CR4 describe an upward-bending parabola* peaking at about CR4 = 50%, which is consistent with the findings of Weiss et a1.44 As was the case with media advertising, CD/S is positive, but it is consistently significant in Table 111. CD/ S has a large impact on other selling costs. On average, an industry selling only finished foods to households spends 12 percentage points of sales more than a purely producer-goods industry. When CD/S is included in the model, no other surrogates are significant explanatory factors (e.g., PACKICOST, NO BRANDS,
*Exactly why the A/S-CR4 relationship is different between the two studies is something of a mystery. One source is a few producer-goods industries with CR4 in the range of 35 to 50%. Another possibility is that a parabola is not the ideal shape for the closest fit; the relatively low significance of the first-degree CR4 term suggests that the relationship is essentially flat up to a critical level of CR4 = 40% to 45%, beyond which media AIS rises steeply in a roughly linear fashion.
Table
111.
Exp
ense
s, M
anuf
actu
red
Food
and
Tob
acco
Lin
es o
f B
usin
ess,
197
4-19
76.
Reg
ress
ion
Res
ults
Exp
lain
ing
the
Inte
nsity
of
Non
adve
rtisi
ng S
ellin
g
Reg
ress
ion
9
Inde
pend
ent V
aria
bles
St
atis
tics
U s
- =a
4
E!
z 0 *
3.2
0.47
b -
O.W
b
0.14
' -0
.77
-0.O
008
-0.0
03
0.23
5 2.
Ub
z (1
.49)
(-
1.57
) (3
.11)
(-
0.27
) (-
0.27
) (-
0.31
) U
8 r (2
.03)
(-
2.01
) (3
.37)
E
(2.0
7)
(- 1
.99)
(2
.71)
(0
.52)
m
% (1
.27)
(-
1.2
1)
(3.3
1)
(- 1
.84)
m
3.
6 0.
45'
-0
.W
0.W
3.
55'
0.15
9 2.
37b
z (1
.54)
(-
1.6
5)
(1.6
5)
(1.5
9)
F:
Equ
atio
n N
o. N
atl.
Pack
/ H
igh
- N
o. CR
4 C
R4z
CD
IS
Dis
t. G
eog.
Fi
rms
Bra
nds
Bra
nd
Cos
t Pe
rish
R2
F
3.1
0.51
b -0
.Wb
0.
13'
-0.7
2 0.
289
3.95
' (1
.80)
(-
1.7
9)
(3.3
2)
(-0.
27)
3.3
O.S
b -0
.005
1b
0.12
8'
0.31
4 5.
43'
3.4
0.53
b -0
.005
1b
0.11
7'
1.16
0.
295
4.03
'
3.5
0.34
-0
.003
2 0.
120"
- 0.
055b
0.
372
5.29
z 0
Not
e: t
ratio
s in
par
enth
eses
. Sup
ersc
ript
s a,
b,
and
c re
pres
ent s
tatis
tical
sig
nifi
canc
e at t
he 1
, 5, a
nd 1
0% le
vels
, res
pect
ivel
y. E
quat
ion
3.4
used
th
e na
tura
l log
of firms.
310 CONNOR AND WEIMER
PERISH, NATL BRAND). If, however, CD/S is omitted from the model as in Equation 3.6 in Table 111, it can be seen that high packaging costs and high perishability are significant positive explanatory factors. Therefore, an interesting result of our analysis is that media advertising flourishes in market segments that are crowded with heavily packaged consumer items but that direct selling efforts will complement nearly any consumer food products, especially relatively per- ishable packaged goods. Bakery goods, packaged cold cuts, candy, snacks, and soft drinks are examples of lines of business that typically rely more on direct selling or other promotions than on mass-media advertising. By comparing Equa- tions 3.3 and 3.5 in Table 111, it is evident that there is (by construction) a high degree of collinearity between CR4 and GEOG. This comparison demonstrates that sales forces and direct-store delivery are significantly more intense in con- sumer product markets that are geographically restricted (urban and more densely populated areas).
Limitations of Analyeis
Multicollinearity and heteroskedasticity were present in the estimates made here, but examination of the patterns of residuals led us to conclude that neither bias nor imprecision are serious problems. Some potential determinants of advertising intensity were intentionally omitted on the basis of previous empirical studies, so model misspecification might be a problem. Market growth rates have been generally nonsignificant f a ~ t o r s ~ ~ ’ ~ , ~ though contrary results can be found. 46*47
Buyer concentration ratios have had negative impacts in some studies using broad data sets (e.g., Farber47), but this factor can be dismissed in the context of industries that are predominantly consumer-oriented. Finally, measures of scale barriers to entry were not found to affect advertising intensity in the studies where they were tried.46*47.43 However, two omitted variables may be worth exploring in the future, The typical unit value of a purchase has been found to be negatively related to selling costs of consumer products.54 Even more promising would be a proxy for the size of foreign affiliates’ sales, which has had strong positive effects on advertising intensities in Canadian and Swedish studies.aJ7
SELLING COSTS AND DISTRIBUTORS’ MARGINS A subsidiary question addressed by Weiss et a1.@ was the relationship of adver- tising by manufacturers to retailer margins. This is an important issue because it bears on the degree to which market power held by manufacturers can be transmitted vertically forward to distributors. If Steiner20-21 is correct and there is a tradeoff between brand and enterprise loyalty, then manufacturer advertising- to-sales ratios will be inversely related to retailer margins as a proportion of sales. By analogy, nonadvertising selling effort also would be inversely related to distributors’ margins (Table I, sixth and seventh columns). This issue has not been addressed previously by agribusiness researchers. 55
We tested this hypothesis using our sample of 30 processed food and tobacco product lines (Table I). Selling effort to create manufacturers’ brand loyalty is represented by media advertising-to-sales ratios (A&) and other-selling-costs-to- sales (0%) for 1974-1976. Grocery retail margins (GRM), expressed as mark- ups over cost, were weighted averages of several hundred product margins data
ADVERTISING AND SELLING EXPENSES 31 1
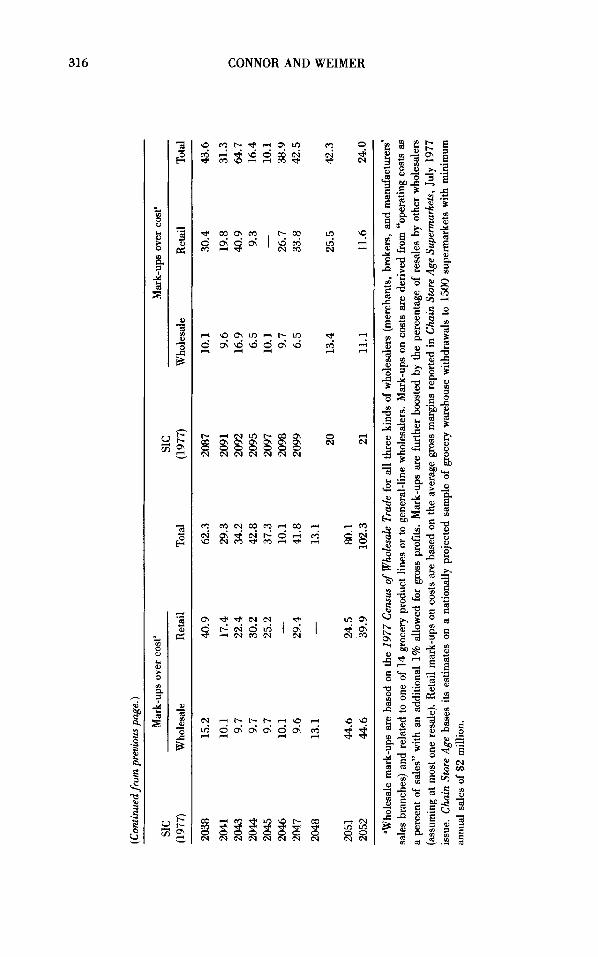
reported for 1976 by the Chain Store Age Supermarkets survey. Grocery wholesale margins (GWM) are computed from 1977 Census Bureau data.
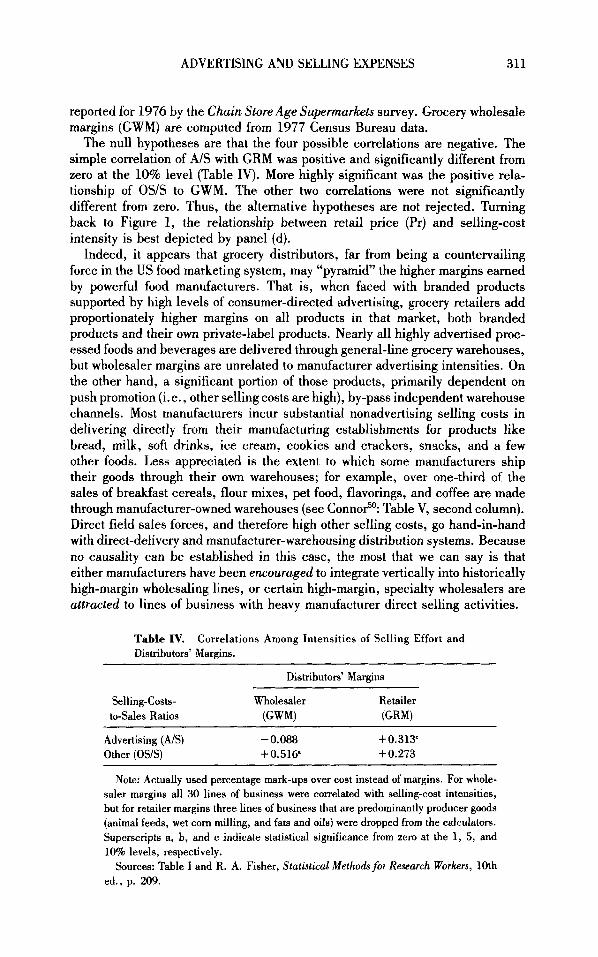
The null hypotheses are that the four possible correlations are negative. The simple correlation of A/S with GRM was positive and significantly different from zero at the 10% level (Table IV). More highly significant was the positive rela- tionship of OS/S to GWM. The other two correlations were not significantly different from zero. Thus, the alternative hypotheses are not rejected. Turning back to Figure 1, the relationship between retail price (Pr) and selling-cost intensity is best depicted by panel (d).
Indeed, it appears that grocery distributors, far from being a countervailing force in the US food marketing system, may “pyramid” the higher margins earned by powerful food manufacturers. That is, when faced with branded products supported by high levels of consumer-directed advertising, grocery retailers add proportionately higher margins on all products in that market, both branded products and their own private-label products. Nearly all highly advertised proc- essed foods and beverages are delivered through general-line grocery warehouses, but wholesaler margins are unrelated to manufacturer advertising intensities. On the other hand, a significant portion of those products, primarily dependent on push promotion (i. e., other selling costs are high), by-pass independent warehouse channels. Most manufacturers incur substantial nonadvertising selling costs in delivering directly from their manufacturing establishments for products like bread, milk, soft drinks, ice cream, cookies and crackers, snacks, and a few other foods. Less appreciated is the extent to which some manufacturers ship their goods through their own warehouses; for example, over one-third of the sales of breakfast cereals, flour mixes, pet food, flavorings, and coffee are made through manufacturer-owned warehouses (see Conno?’: Table V, second column). Direct field sales forces, and therefore high other selling costs, go hand-in-hand with direct-delivery and manufacturer-warehousing distribution systems. Because no causality can be established in this case, the most that we can say is that either manufacturers have been encouraged to integrate vertically into historically high-margin wholesaling lines, or certain high-margin, specialty wholesalers are attracted to lines of business with heavy manufacturer direct selling activities.
Table IV. Distributon’ Margins.
Correlations Among Intensities of Selling Effort and
Distributors’ Margins
Seiling-Costs- Wholesaler Retailer to-Sales Ratios (GWW (GRW
Advertising (NS) -0.088 +0.313’ Other (OS/S) +0.516‘ + 0.273
Note: Actually used percentage mark-ups over cost instead of margins. For whole- saler margins all 30 lines of business were correlated with selling-cost intensities, but for retailer margins three lines of business that are predominantly producer goods (animal feeds, wet corn milling, and fats and oils) were dropped from the calculators. Superscripts a, b, and c indicate statistical significance from zero at the 1, 5, and 10% levels, respectively.
Sources: Table I and R. A. Fisher, Statistical Methods for Research Workers, 10th ed., p. 209.
312 CONNOR AND WEIMER
Caveats
The data employed for the tests in Table IV are more detailed than those used by Weiss et al. who had GRMs for only at most 13 types of retail outlets (of which one was grocery retailing) for about 80 consumer-manufacturing lines of business. They did not examine the relationship of GWMs to selling costs. Our GRM data are more precise than those of Weiss et a1.& They are built up from hundreds of retail margins for individual grocery items, each assigned to one manufacturing line of business and weighted by projected annual retail product sales. However, these data are limited by their dependence on a Chain Store Age sample that is large but of unknown representativeness; moreover, all meat and all dairy products share the same margins.
Our GWM data are much more limited, being based on only 14 grocery product lines and one general-line-wholesale category. There was an attempt made to account for intenvholesaler sales by using ERS-USDA estimates of resales among the three main classes of wholesalers (merchants, brokers, and manufacturers' sales branches) and assuming that the portions resold among wholesalers are sold only once. Despite these attempted refinements, the GWM data remain relatively crude, and the reader should place less confidence in the wholesale-margin results than the retail-margin results.
SUMMARY
The accuracy, variety, and comprehensiveness of available measures of the inten- sity of selling effort across the food and tobacco manufacturing industries have improved noticeably over the last two decades. Estimation methods based on company-wide advertising expenditures have given way to brand-level, mass- media advertising expenditures that are aggregated up to the product class or industry level. Increased effort is being expended on developing data on non- media advertising and sales promotion expenditures. The most recent develop- ment was the availability of total selling costs from the F"I'C's (1980) Line of Business program. * In 1974-1976, media advertising expenses for the leading and largest food and tobacco manufacturers averaged 3.3% of sales, but other selling expenses were an additional 9.7% of sales. Total selling effort in food and tobacco (13.0%) was twice the all-manufacturing average.
Two analyses grounded in the industrial-organization tradition were made of these FTC data. First, simple regression models of the determinants of advertising intensity and other-selling costs intensity were estimated using data from 30 food and tobacco lines of business. Both types of selling effort are positively related to the proportion of consumer to total demand, but in the case of advertising intensity, the household-demand proportion appears to be a proxy for the number of brands in the market and the extent of packaging. Other selling methods are used more intensely for consumer products that are perishable or sold in local or regional markets. The relationship of selling effort to manufacturers' sales concentration depended on the type of selling effort. Other selling effort was positively related to sales concentration until it reached a maximum at about
*Unfortunately, opposition from the 500 or so companies required to report to this program, as well as other considerations, persuaded the FTC to terminate the program in late 1983.
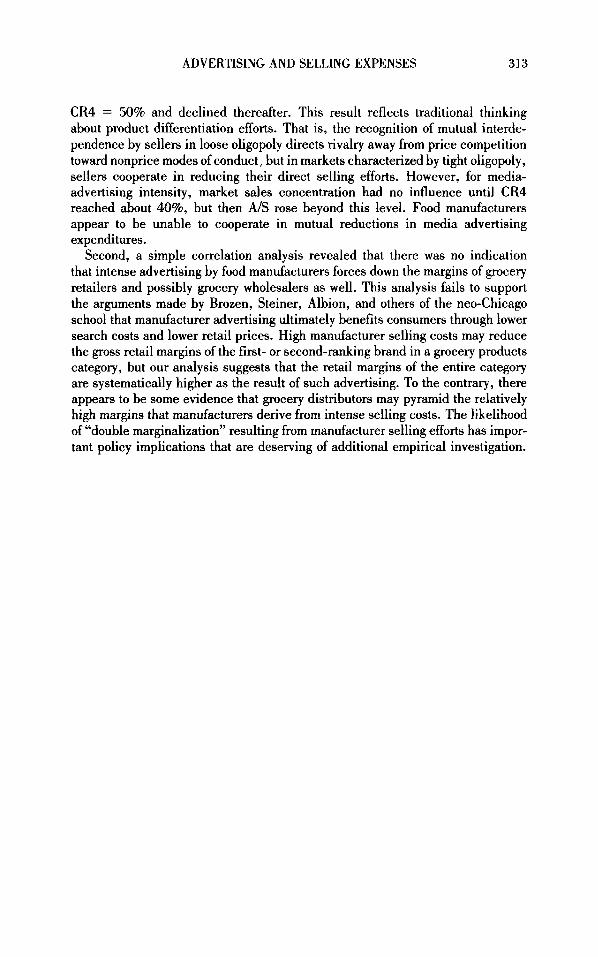
ADVERTISING AND SELLING EXPENSES 313
CR4 = 50% and declined thereafter. This result reflects traditional thinking about product differentiation efforts. That is, the recognition of mutual interde- pendence by sellers in loose oligopoly directs rivalry away from price competition toward nonprice modes of conduct, but in markets characterized by tight oligopoly, sellers cooperate in reducing their direct selling efforts. However, for media- advertising intensity, market sales concentration had no influence until CR4 reached about 40%, but then A/S rose beyond this level. Food manufacturers appear to be unable to cooperate in mutual reductions in media advertising expenditures.
Second, a simple correlation analysis revealed that there was no indication that intense advertising by food manufacturers forces down the margins of grocery retailers and possibly grocery wholesalers as well. This analysis fails to support the arguments made by Brozen, Steiner, Albion, and others of the neo-Chicago school that manufacturer advertising ultimately benefits consumers through lower search costs and lower retail prices. High manufacturer selling costs may reduce the gross retail margins of the first- or second-ranking brand in a grocery products category, but our analysis suggests that the retail margins of the entire category are systematically higher as the result of such advertising. To the contrary, there appears to be some evidence that grocery distributors may pyramid the relatively high margins that manufacturers derive from intense selling costs. The likelihood of “double marginalization” resulting from manufacturer selling efforts has impor- tant policy implications that are deserving of additional empirical investigation.
APP
EN
DIX
Tab
le A
- 1.
Cor
rela
tion
Coe
ffic
ient
s A
mon
g In
depe
nden
t V
aria
bles
.
Var
iabl
e
No.
N
atl.
Pack
l H
igh
Var
iabl
e C
R4
C D/S
D
ist.
Geo
l?.
Firm
s B
rand
s Br
and
cost
Pe
rish
Four
-firm
1.
00
0.26
0.
01
conc
entr
atio
n ra
tio
Hou
seho
ld
1.00
0.
14
- de
man
dsal
es
Mar
ket
radi
us,
1.00
80
% o
f sh
ips.
G
eogr
aphi
c di
sper
sion
of s
hips
. N
o. firms
per
geog
. m
arke
t N
o. b
rand
s pe
r m
arke
t N
atio
nal
bran
ds/
sale
s Pa
ckag
ing
cosd
tota
l co
st
Hig
hly
peri
shab
le
prod
uct
0.03
-0
.63
-0.2
0 0.
51
0.47
-0.0
7 0.
19
0.28
0.
70
0.28
0.25
0.
34
-0.1
1 0.
06
-0.0
1
1.00
-0
.06
0.06
0.
06
- 0.
28
1.00
0.
35
-0.0
5 -0
.08
1.00
0.
17
0.25
1.00
0.
63
1.00
n
0
Z
0
=a z U
0.38
0.54
z
0.06
2- 4
m
0.06
- 0.
12
E! =a
-0.0
6
0.42
0.21
1.00
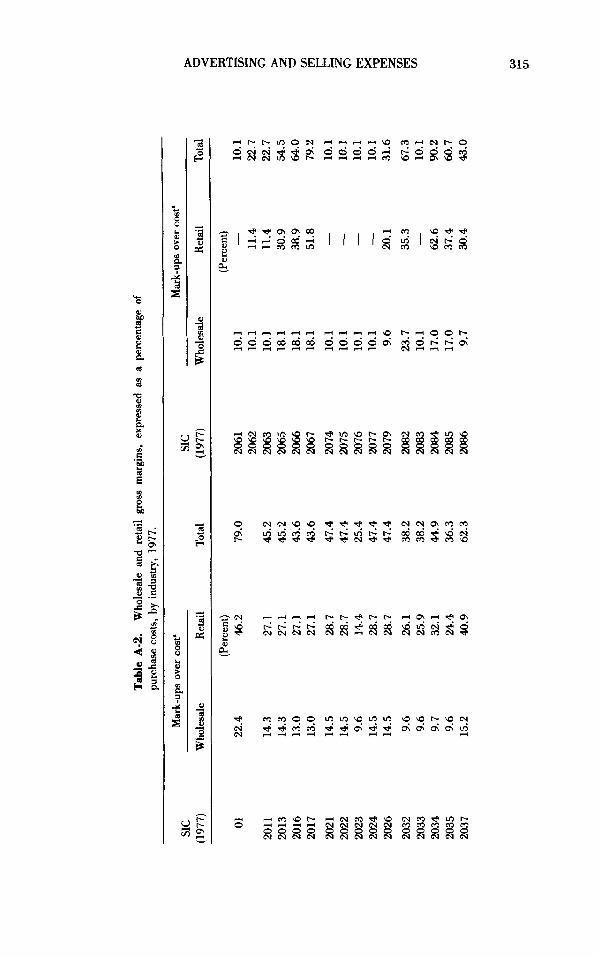
Table A-2.
purc
hase
cos
ts,
by in
dust
ry, 1
977.
W
hole
sale
and
ret
ail
gros
s m
argi
ns,
expr
esse
d as a
per
cent
age
of
Mar
k-up
s ov
er c
ost.
Mar
k-up
s ove
r co
st'
SIC
SIC
(197
7)
Who
lesa
le
Ret
ail
Tot
al
(197
7)
Who
lesa
le
Ret
ail
Tot
al
01
201 1
20
13
2016
20
17
2021
20
22
2023
20
24
2026
20
32
2033
20
34
2035
20
37
22.4
14.3
14
.3
13.0
13
.0
14.5
14
.5
9.6
14.5
14
.5
9.6
9.6
9.7
9.6
15.2
(Per
cent
) 46
.2
27.1
27
.1
27.1
27
.1
28.7
28
.7
14.4
28
.7
28.7
26
.1
25.9
32
.1
24.4
40
.9
79.0
45.2
45
.2
43.6
43
.6
47.4
47
.4
25.4
47
.4
47.4
38.2
38
.2
44.9
36
.3
62.3
2061
20
62
2063
20
65
2066
20
67
2074
20
75
2076
20
77
2079
2082
20
83
2084
20
85
2086
10.1
10
.1
10.1
18
.1
18.1
18
.1
10.1
10
.1
10.1
10
.1
9.6
23.7
10
.1
17.0
17
.0
9.7
(Per
cent
)
11.4
11
.4
30.9
38
.9
51.8
-
20.1
35.3
62.6
37
.4
30.4
-
10.1
22
.7
22.7
54
.5
64.0
79
.2
10.1
10
.1
10.1
10
.1
31.6
67
.3
10.1
90
.2
60.7
43
.0
(Con
tinue
dfro
m pr
evio
us p
age.
)
Mar
k-up
s ov
er c
ost’
Mar
k-up
s ov
er c
ost’
SIC
SIC
(197
7)
Who
lesa
le
Ret
ail
Tota
l (1
977)
W
hole
sale
R
etai
l To
tal
2038
15
.2
40.9
62
.3
2087
10
.1
30.4
43
.6
2041
10
.1
17.4
29
.3
2091
9.
6 19
.8
31.3
20
43
9.7
22.4
34
.2
2092
16
.9
40.9
64
.7
2044
9.
7 30
.2
42.8
20
95
6.5
9.3
16.4
20
45
9.7
25.2
37
.3
2097
10
.1
-
10.1
20
46
10.1
-
10.1
20
98
9.7
26.7
38
.9
2047
9.
6 29
.4
41.8
20
99
6.5
33.8
42
.5
2048
13
.1
-
13.1
20
13
.4
25.5
42
.3
2051
44
4.6
24.5
80
.1
2052
44
.6
39.9
10
2.3
21
11.1
11
.6
24.0
“Who
lesa
le m
ark-
ups
are
base
d on
the
197
7 C
ensu
s of
Who
lesa
le T
rade
for
all
thre
e ki
nds
of w
hole
sale
rs (
mer
chan
ts, b
roke
rs, a
nd m
anuf
actu
rers
’ sa
les
bran
ches
) and
rel
ated
to
one
of 1
4 gr
ocer
y pr
oduc
t lin
es o
r to
gen
eral
-lin
e w
hole
sale
rs.
Mar
k-up
s on
cos
ts a
re d
eriv
ed fr
om “
oper
atin
g co
sts as
a pe
rcen
t of
sale
s” w
ith a
n ad
ditio
nal
1% a
llow
ed fo
r gr
oss
prof
its.
Mar
k-up
s ar
e fu
rthe
r bo
oste
d by
the
per
cent
age
of r
esal
es b
y ot
her w
hole
sale
rs
(ass
umin
g at
mos
t one
res
ale)
. Ret
ail m
ark-
ups
on c
osts
are
bas
ed o
n th
e av
erag
e gr
oss
mar
gins
repo
rted
in C
hain
Sto
re A
ge S
upnn
arke
ts,
July
197
7 is
sue.
Cha
in S
tore
Age
bas
es i
ts e
stim
ates
on
a na
tiona
lly p
roje
cted
sam
ple
of g
roce
ry w
areh
ouse
with
draw
als
to 1
500
supe
rmar
kets
with
min
imum
an
nual
sal
es o
f $2
mill
ion.
r,
0 z z 0 P * z U
ADVERTISING AND SELLING EXPENSES 317
REFERENCES
1. F. M. Scherer, Industrial Market Structure and Economic Performance, 2nd ed., Rand McNally, Chicago, 1980.
2. J. M. Connor, R. T. Rogers, B. W. Marion, and W. F. Mueller, The US. Food Manufacturing Industries: Structure, Strategies, Performance, and Policies, Lexington Books, Lexington, MA, 1985.
3. W. S. Comanor and T. A. Wilson, Advertising and Market Power, Harvard University Press, Cambridge, MA, 1974.
4. W. S. Cornanor and T. A. Wilson, “The Effect of Advertising on Competition: A Survey,” Journal of Economic Literature, 17, 453-476 (1979).
5. J. R. Scala, “Advertising and Shared Monopoly in Consumer Goods Industries,” Columbia Journul of Law and Social Problems, 9, 241-278 (1973).
6. S. Levmore, Small Firm Disadvantages in Television Advertising, Ph.D. Dissertation Yale University, New Haven, CT, 1978.
7. D. F. Greer, Industrial Organization &Public Policy, 2nd ed., Macmillan, New York, 1984,
8. R. Schmalensee, “Product Differentiation Barriers to Entry,” American Economic Review, 72,
9. D. F. Greer, “Advertising and Market Concentration,” Southern Economics Journal, 38, 19- 32 (1971).
10. M. A. Spence, “Notes on Advertising, Economies of Scale, and Entry Barrien,” Quarterly Journal of Economics, 95, 493-507 (1980).
11. J. S. Cubbin, “Advertising and the Theory of Entry Barriers,” Econornica, 48, 289-298 (1981).
12. J. P. Baldani and R. T. Masson, Economies of Scale, Strategic Advertising, and Fully Credible Entry Deterrence, Working Paper, Cornell University, Ithaca, NY, September 1981.
13. J. M. Connor, “Advertising, Promotion, and Competition: A Survey with Special Reference to Food,” Agricultural Economic Research, 33, 19-27 (1981).
14. R. L. Wills, The Impact of Market Structure and Advertising on Brand Pricing in Processed Food Products, Ph.D. Dissertation, University of Wisconsin, Madison, WI, 1983.
15. M. S. Albion and P. W. Farris, The Effect of Manufacturer Advertising on Consumer Prices: A Managerial Overview, Report No. 82-108, Marketing Science Institute, Cambridge, MA, 1982.
16. M. S. Albion, Advertising’s Hidden Effects: Manufmturers’ Advertising and Retail Pricing, Auburn House, Boston, MA, 1983.
17. Y. Brozen, “Entry Barriers: Advertising and Product Differentiation,” in Industrial Concen- tration: The New Learning, H. J . Goldschmidt et al. Eds., Little, Brown, Boston, MA, 1974.
18. P. W. Farris and M. S. Albion, Determinants of Variations in the Advertising-to-Sales Ratio, Report No. 80-107, Marketing Science Institute, cambridge, MA, 1980.
19. L. W. Weiss, Case Studies in American Industry, Wiley, New York, 1980. 20. R. L. Steiner, “Does Advertising Lower Prices?” Journal ofMarketing, 37, 19-26 (1973). 21. R. L. Steiner, “Marketing Productivity in Consumer Good‘s Industries-A Vertical Perspec-
tive,” Journal of Marketing, 44, 60-70 (1978). 22. R. L. Wills, Review of Advertising’s Hidden Effects Manufacturers’ Advertising and Retail
Pricing, American Journal of Agricultural Economics, 66, 397 (1984). 23. G. E. Brandow, “Appraising the Economic Performance of the Food Industry,” in C. Edwards
Ed., Lectures in Agricultural Economics, Washington, DC, Economic Research Service, USDA 1977.
24. A. J. San Augustine and W. F. Foley, “How Large Advertisers Set Their Budgets,” Journal of Advertising Research, 15, 11-16 (1975).
25. P. W. Farris and R. D. Buzzell, “Why Advertising and Promotional Costs Vary: Some Cross- Sectional Analyses,” Journal of Marketing Research, 43, 112-122 (1979).
pp. 171-176.
349-365 (1982).
318 CONNOR AND WEIMER
26. W. F. Long, “Advertising Intensity, Market Share, Concentration, and Degree of Cooperation,” Paper presented at the American Economic Association meeting, Denver, CO 1980, 19 pp.
27. R. D. Boynton, V. McCracken, and S. Irwin, “Food Advertising as a Source of Consumer Information: A Case Study of Newspaper Advertising and Its Relation to Public Price Reports,” in Advertising and the Food system, J. M. Connor and R. Ward, Eds., Monograph No. 14, NC 117, Madison, WI, 1983.
28. A. E. Gallo, Advertising and Promotion in Food Marketing, Staff Report No. AGES831007, Washington, DC, ERS-USDA, 1984.
29. R. T. Rogers and L. L. Mather, “Food Advertising, 1954 to 1979,” in Advertising and the Food system, J. M. Connor and R. Ward, Monograph No. 14, NC 117, Madison, WI, 1983.
30. R. Menzer Morrison, Generic Advertising of Farm Products, Agricultural Information Bulletin No. 481, Washington, DC, Economic Research Service, USDA, September 1984.
31. J. M. Connor and L. L. Mather, Directory ofthe 200 Largest Food and Tobacco Processing Companies, 1975, Special Report No. 2, North Central Regional Project NC117, Madison, WI, 1978.
32. A. Manchester, “The Role and Dimensions of Food Advertising for 100 Years,’’ in Advertising and the Food system, J. M. Connor and R. Ward, Eds., Monograph No. 14, NC 117, Madison, WI, 1983.
33. A. C. Hoffman, Large-Scale Organization in the Foodlndustries, Monograph No. 35, Temporary National Economic Committee, US Congress, Washington, DC, 1940.
34. National Commission on Food Marketing, The Structure of Food Manufacturing, Technical Study No. 8, US Government Printing Office, Washington, DC, 1966.
35. National Commission on Food Marketing, Studies of Organization and Competition in Grocery Manufacturing, Technical Study No. 8, US Government Printing Office, Washington, DC 1966.
36. J. M. Connor, The US. Food and Tobacco Manufacturing Industries: Market Structure, Strut- tural Change, and Economic Performance, Agricultural Economic Report No. 451, Washing- ton, DC, ESCS-USDA, 1980.
37. R. T. Rogers, Advertising and Concentration Change in Food and Tobacco Products, 1954- 1972, Ph.D. Dissertation, University of Wisconsin, Madison, WI, 1982.
38. Fortune Magazine, “Bar Wars: Hershey Bites Mars,” July 8, 1985, pp. 52-57. 39. M. S. Albion and P. W. Fams, Appraising Research on Advertising’s Economic Impacts, Report
No. 79-1 15, Marketing Science Institute, Cambridge, MA, 1979. 4.0. E. Pagoulatos and R. Sorenson, “The Competitive Impact of Advertising in U.S. Food Proc-
essing Industries: A Simultaneous Equation Approach,” in Advertising and the Food system, J. M. Connor and R. Ward, Eds., Monograph No. 14, NC 117, Madison, WI, 1983.
41. J. J. Lambin, Advertising, Competition and Market Conduct in Oligopoly Over Time, North- Holland, Amsterdam, The Netherlands, 1976.
42. A. E. Gallo, L. Hamm, and J. A. Zellner, Couponing’s Growth in Food Marketing, Agricultural Economic Report No. 486, USDA, Washington, DC, June 1982.
43. V. K. Gupta, “Factors Determining Interindustry Differences in Advertising Intensity: Cana- dian Manufacturing,” Quarterly Review .f Economic and Business, 20, 60-76 (1980).
44. L. W. Weiss, G. Pascoe, and S. Martin, “The Size of Selling Costs,’’ Review of Economics and Statistics, 65, 668-672 (1983).
45. A. D. Strickland and L. W. Weiss, “Advertising, Concentration, and Price-cost Margins,” Journul of Political Economy, 84, 1109-1121 (1976).
46. S. Martin, “Entry Barriers, Concentration, and Profits,” Southern Economics Joura l , 46,
47. S. Farber, “Buyer Market Structure and R&D Effort: A Simultaneous Equation Model,” Review
48. Federal Trade Commission (FTC), Annual Line of Business Report, 1976 (and previous years),
471-488 (1979).
of Economics and Statistics, 63, 336-345 (1981).
Statistical Report of the Bureau of Economics, Fl’C, Washington, DC, 1982.

ADVERTISING AND SELLING EXPENSES 319
49. L. W. Weiss and G. Pascoe, Adjusted Concentration Ratios in Manufacturing-1 972, Line of Business Program Report No. 33, Federal Trade Commission, Washington, DC, 1982.
50. J. M. Connor, Estimates of Manyfacturers’ Food and Beverage Shipments Among Major Mar- keting channels, 1977, Staff Report No. AGES8204.16, ERS-USDA, Washington, DC, 1982.
51. R. Schmalensee, ‘‘Entry Deterrence in the Ready-to-Eat Breakfast Cereal Industry,” Bell Journal of Economics, 9, 205-227 (1978).
52. A. E. Gallo, “Food Consumption Patterns: Concentration and Frequency,” Natural Food Review, 22, 5-7 (1982).
53. R. C. Stokes, “The Effects of Price, Package Design, and Brand Familiarity on Perceived Quality,” in Perceived Quality, J. Jacoby and J. C. Olson, Eds., Lexington Books, Lexington, MA, 1985.
54. P. W. Farris and M. S. Albion, “The Impact of Advertising on the Price of Consumer Products,” Journal ofMarketing, 44, 17-35 (1979).
55. J. M. Connor and R. Ward, Eds., Advertising and the Food System, Monograph No. 14, NC 117, Madison, WI, 1983.


![11.[7 17]determinants of adoption and labour intensity of stone-terraces in eastern highlands of ethiopia](https://img.pdfslide.us/doc/110x75/546c184bb4af9f7a2c8b4f77/117-17determinants-of-adoption-and-labour-intensity-of-stone-terraces-in-eastern-highlands-of-ethiopia.jpg)