Embed Size (px)
Citation preview
Faculty of Engineering and Surveying
The Integration of Sensory Control for
Sugar Cane Harvesters
A Dissertation submitted by
Stuart George McCarthy
BEng (Hons)
For the award of
Doctor of Philosophy
2003
Abstract
The research concerns the design and implementation of mechatronic systems to
assist in the operation and control of a sugar cane harvester. Two functions were
chosen for attention, the primary separation system, and the ‘topper’ that discards
the leafy crown. Although these operations are given low priority by the operator
of the harvester, their optimisation is of particular significance to the industry.
Optimum separation requires a fine balance between discarding ‘trash’ that
would contaminate the quality of the cane billets and losing good sugar-bearing
material through over cleaning. Poor control of the topper can create extra load
for the separation system and cause it to operate at a low efficiency with high
loss. Alternatively it can cause a length of sugar-bearing cane stalk to be lost
before it even enters the harvester system at all.
A variety of mechatronic techniques were explored, that addressed the problem
of providing useful data directly from the harvester functions and the electronic
instrumentation to allow the data to be collected in a useful form in real-time.
Computer control issues were also investigated, to make best use of the data
stream.
Novel acoustic transducers were introduced to the sensory separation system to
provide a signal that indicated material striking the fan blades. A rotary
transformer was required to allow transmission of the signal, and a signal
interface system was implemented to record the returned data. Many real-time
time-series analyses were conducted, and from these a suitable algorithm to
extract an impact signal was developed. This system was assessed under
harvesting conditions with results that confirmed its ability to quantify the
amount of cane lost from the harvest.
An investigation was conducted to detect the optimum topping height on a sugar
cane stalk. The techniques considered both the internal and external attributes of
the stalk, and a method was selected to measure the sugar concentration with a
II

chemical sensor. An important design parameter was that the sensor must operate
on the harvester in real time. The novel refractometer worked well in laboratory
conditions, yielding repeatable and accurate results. The field environment
complicated the application of this system, however this was partly overcome
with introduction of a custom sample-crushing mechanism. This device provided
the necessary juice sample from a selection of the topped cane stalks. The
complete sampling and measuring mechanism operated well on cane stalks, and
returned encouraging results.
Both sets of data returned useful information regarding the operation of the
particular harvester operations. The control of either the separation system or the
topper requires careful balancing, and novel control techniques that consider the
ergonomics for the operator are discussed. These include visual indication
devices through to automatic control algorithms.
With the integration of mechatronic techniques into the functioning of the sugar
cane harvester, the overall efficiency of many of its functions may be improved,
and the operator’s task may be greatly simplified. The ultimate objective is to
maximise the yield with an improved level of harvested and separated cane.
III

Certificate of Dissertation
I certify that the ideas, experimental work, results, analysis and conclusions
reported in this dissertation are entirely my own effort, except where otherwise
acknowledged.
I also certify that the work is original and has not been previously submitted for
any other award.
Signature of Candidate – Stuart G. McCarthy Date
Endorsement
Signature of Supervisor – Professor John Billingsley Date
IV

Acknowledgments
The work described in this dissertation was conducted at the Faculty of
Engineering and Surveying, University of Southern Queensland between
February 1999 and November 2002.
It is with much gratitude I acknowledge the Sugar Research and Development
Corporation for sponsoring this project during the course of the studies, and also
the National Centre for Engineering in Agriculture for the financial assistance it
has provided.
The contributions and assistance of the following people are also gratefully
acknowledged:
Professor John Billingsley for his direction, enthusiasm and support that kept
things fun and interesting over the course of the project, and of course the
opportunity to ride an elephant. Thank you for the opportunity to study under
you, JB!
Dr Harry Harris for his efforts to secure the project sponsorship, and his
experience and support, especially with the cane field trials. Also thank you for
tolerating my (over?) use of Araldite, duct tape and zip ties during testing – soon
enough these items will become recognised engineering tools.
Staff of the National Centre for Engineering in Agriculture: Director Matthew
Durack, my road trip partner Damian Spinaze, Simon Zillman, Nick Stone, Jason
Stone and David Jones.
Faculty of Engineering and Surveying staff: Chris Galligan, Brian Aston, Glen
Bartowski, Dean Beliveau, Terry Byrne, Jim Scott and Chris Lock.
V

Dr Tania van den Ancker for her chemistry expertise and her contributions in the
developmental stages of the chemical sensing.
Jeff Budd and the other members of the Murwillumbah Co-op who allowed me
to conduct field trials in the beautiful South Tweed. Thank you for your time, and
more often than not your patience!
Gary Sandell, BSES, for his efforts in getting the field data sensory separation
system.
My parents, George and Lesley, and my sisters, Elizabeth, Cheryl and Alison
who have always provided me with unconditional support.
And of course Liana, who joined me near the completion of this fun voyage, but
who will be there with me for all new adventures in the future ☺
VI

Table of Contents
ABSTRACT.........................................................................................................II
CERTIFICATE OF DISSERTATION ........................................................... IV
ACKNOWLEDGMENTS ..................................................................................V
TABLE OF CONTENTS.................................................................................VII
LIST OF PUBLICATIONS.............................................................................. XI
LIST OF FIGURES ....................................................................................... XIII
LIST OF TABLES ...................................................................................... XVIII
CHAPTER 1 - INTRODUCTION......................................................................1
1.1. THE SUGAR CANE HARVESTER CONTROL CONCEPT ...............................1
1.2 PROJECT OBJECTIVES..............................................................................2
1.3 PROJECT ACHIEVEMENTS........................................................................3
1.4 THE DISSERTATION .................................................................................6
...............................................................................7 1.5 CDROM CONTENTS
CHAPTER 2 - BACKGROUND ........................................................................8
2.1 THE AUSTRALIAN SUGAR INDUSTRY ......................................................8
2.2 SUGAR CANE...........................................................................................9
2.3 GROWING SUGAR CANE..........................................................................9
2.4 MECHANICAL HARVESTING ..................................................................10
2.4.1 The Chopper Harvester................................................................12
2.4.2 Cleaning System...........................................................................14
2.4.3 Topper ..........................................................................................15
CHAPTER 3 - THE ‘SMARTER HARVESTER’..........................................16
3.1 JUSTIFICATION OF STUDY......................................................................16
VII
3.2 PRECEDING WORK ................................................................................17
3.3 RELEVANT ADVANCES IN OTHER AGRICULTURAL EQUIPMENT ............21
3.4 CHAPTER SUMMARY .............................................................................23
CHAPTER 4 - SUGAR CANE HARVESTING LOGISTICS.......................24
...........................................................................................24 4.1 ECONOMICS
4.2 RESPONSIBILITIES OF THE HARVESTER OPERATOR ...............................26
4.3 INEFFICIENCIES EXPOSED......................................................................28
4.3.1 Primary Extractor Fan.................................................................28
4.3.2 Topper ..........................................................................................29
4.4 CHAPTER SUMMARY .............................................................................31
CHAPTER 5 - SENSORY SEPARATION SYSTEM ....................................32
......................................................................................32 5.1 INTRODUCTION
5.2 DETECTION SYSTEM CONCEPT..............................................................33
5.2.1 Sensor...........................................................................................34
5.2.2 Transducer ...................................................................................37
5.2.3 Rotary Transformer......................................................................42
5.2.4 Signal Interface ............................................................................50
5.2.5 Data Acquisition Technique.........................................................51
5.3 CHAPTER SUMMARY .............................................................................52
CHAPTER 6 - SENSORY SEPARATION SYSTEM RESULTS .................53
6.1 INTRODUCTION......................................................................................53
6.2 EARLY DETECTION SYSTEMS ................................................................54
6.2.1 Simulated Field Trials..................................................................54
6.2.2 Cane Field Trials and Preliminary Results .................................59
6.3 FREQUENCY ANALYSIS OF SENSORY SEPARATION SYSTEM..................62
6.3.1 Spectrogram of Recorded Signal .................................................63
6.3.2 Discrete Fourier Transform of Recorded Signal .........................64
6.4 DISCRETE TIME-SERIES ANALYSIS OF SENSORY SEPARATION SYSTEM 66
6.4.1 Statistical Analysis .......................................................................67
VIII
6.4.2 Correlation Functions..................................................................68
6.4.3 Matched Filters ............................................................................70
6.4.4 Moving Average Filter .................................................................72
6.4.5 Frequency Filter...........................................................................74
6.5 IMPLEMENTATION OF REAL-TIME FILTERS ...........................................74
6.5.1 Digital Filtering ...........................................................................75
6.5.2 Analogue Filtering .......................................................................76
6.6 LONG TERM TRIALS..............................................................................77
6.7 CHAPTER SUMMARY .............................................................................79
CHAPTER 7 - SENSORY TOPPING SYSTEM ............................................80
7.1 INTRODUCTION......................................................................................80
7.2 DETERMINATION OF OPTIMUM TOPPING HEIGHT..................................82
7.2.1 Properties of Sucrose ...................................................................82
7.2.2 Measuring Environment...............................................................84
7.2.3 Preliminary Laboratory Testing ..................................................86
7.3 DETECTION SYSTEM ALTERNATIVES ....................................................86
7.3.1 Refractometry...............................................................................87
7.3.2 Polarimetry ..................................................................................88
7.3.3 Spectrum Analysis ........................................................................90
7.3.4 Acoustics ......................................................................................93
7.3.5 Machine Vision ............................................................................94
7.4 DEVELOPMENT OF SENSOR CONCEPT....................................................95
7.5 CHAPTER SUMMARY .............................................................................97
CHAPTER 8 - SENSORY TOPPING SYSTEM RESULTS .........................98
......................................................................................98 8.1 INTRODUCTION
8.2 LABORATORY RESULTS FOR NOVEL REFRACTOMETER.........................99
8.2.1 Signal Analysis .............................................................................99
8.3 CANE FIELD TRIALS............................................................................101
8.3.1 First Concept..............................................................................102
8.3.2 Second Concept..........................................................................103
IX

8.4 LABORATORY TESTING .......................................................................109
8.5 CHAPTER SUMMARY ...........................................................................111
CHAPTER 9 - INTEGRATING THE SYSTEMS........................................112
....................................................................................112 9.1 INTRODUCTION
9.2 FEEDBACK ALTERNATIVES .................................................................113
9.2.1 Visual Indicators ........................................................................113
9.2.2 Automatic Control......................................................................114
9.2.3 Combination of Active and Passive Control ..............................117
9.3 CHAPTER SUMMARY ...........................................................................117
CHAPTER 10 - CONCLUSIONS AND RECOMMENDATIONS.............118
.....................................................................................118 10.1 CONCLUSIONS
...........................................................................119 10.2 RECOMMENDATIONS
REFERENCES.................................................................................................122
APPENDIX - PROJECT RESEARCH PUBLICATIONS ..........................126
X
List of Publications
1. McCarthy, S.G., Billingsley, J., and Harris, H. 2000, ‘Listening for Cane
Loss’, Paper presented at the 7th IEEE International Conference on
Mechatronics and Machine Vision in Practice, Hervey Bay, Queensland,
Australia.
This paper also appeared in the book:
Billingsley, J. (ed.) 2000, Mechatronics and Machine Vision, Research
Studies Press Ltd, Hertfordshire, England.
2. McCarthy, S.G., Billingsley, J., and Harris, H. 2001, ‘Where the
Sweetness Ends’, Proceedings of the 8th IEEE International Conference
on Mechatronics and Machine Vision in Practice, Hong Kong.
3. McCarthy, S.G., Billingsley, J., and Harris, H. 2002, ‘Development of an
advanced cane loss monitoring system’, Proceedings of the Australian
Society of Sugar Cane Technologists, Cairns Queensland.
4. McCarthy, S.G., Billingsley, J., and Harris, H. 2002, ‘A Sensor For The
Sugar Cane Harvester Topper’, Sensor Review, vol. 22, no. 3, pp. 242-
246.
5. McCarthy, S.G., Billingsley, J., and Harris, H. 2002, ‘Control of the
Sugar Cane Harvester Topper’, Proceedings of the 9th IEEE International
Conference on Mechatronics and Machine Vision in Practice, Chiang
Mai.
This paper also appeared in the book:
XI

Billingsley, J. and Bradbeer, R.S. (eds.) 2002, Mechatronics and Machine
Vision 2002: current practice, Research Studies Press Ltd, Hertfordshire,
England.
6. McCarthy, S.G., Billingsley, J., and Harris, H. 2002, ‘A Sugar Cane
Harvester System’, Proceedings of the 2002 International Conference on
Engineering in Agriculture, Wagga Wagga NSW.
XII
List of Figures
FIGURE 1.1: SAMPLE OF DATA RETURNED FROM SENSORY SEPARATION SYSTEM ....4
FIGURE 1.2: RELATIONSHIP BETWEEN RECORDED IMPACTS AND FAN SPEED ...........4
FIGURE 1.3: SQUASHING MECHANISM IN LABORATORY CRUSHING SUGAR CANE
STALK..............................................................................................................5
FIGURE 1.4: DISTRIBUTION OF SUGAR CONCENTRATION FROM REFRACTOMETER
WITH SAMPLES FROM STALK (LEFT) UP TO TOP (RIGHT)...................................5
FIGURE 2.1: MECHANICAL HARVESTING OF A SUGAR CANE CROP ...........................8
FIGURE 2.2: MECHANISATION FROM 1957 TO 1977 (RIDGE, 1987) ......................11
FIGURE 2.3A: PLAN VIEW OF A MECHANICAL SUGAR CANE HARVESTER................14
FIGURE 2.3B: SIDE ELEVATION OF A MECHANICAL SUGAR CANE HARVESTER .......14
FIGURE 3.1: VIEW FROM HARVESTER CABIN .........................................................16
FIGURE 3.2: ILLUSTRATION OF MECHANICAL HARVESTER WITH MAJOR FUNCTIONS
INDICATED ....................................................................................................18
FIGURE 3.3: EXISTING COMMERCIALLY-AVAILABLE CANE LOSS MONITOR ...........19
FIGURE 4.1: TREND RELATIONSHIPS BETWEEN EXTRANEOUS MATTER AND CANE
LOSS FOR TOPPING AND FOR SEPARATION SYSTEMS (BROTHERTON & POPE
1995) ............................................................................................................25
FIGURE 4.2: CONTROLS AND GAUGES IN HARVESTER CABIN .................................26
FIGURE 4.3: THE EFFECT OF FAN SPEED ON CANE LOSS (AGNEW 1999).................29
FIGURE 4.4: THE EFFECT OF TOPPING HEIGHT ON THE FINANCIAL RETURN OF THE
CANE GROWER...............................................................................................30
FIGURE 4.5: CANE QUALITY INDEX (I) VS RELATIVE CUTTING HEIGHT OF TOPPER
(HR) (FERNANDEZ 1993)...............................................................................30
FIGURE 5.1: EXTRACTION CHAMBER INDICATED (LEFT) AND A CLOSER VIEW OF
HOOD CHUTE .................................................................................................32
XIII

FIGURE 5.2: CANE BILLET IN EJECTED MASS BEFORE (ABOVE) AND AFTER (BELOW)
STRIKING UNDERSIDE OF EXTRACTOR FAN BLADE .........................................34
FIGURE 5.3: FAN ASSEMBLY INSIDE EXTRACTION CHAMBER.................................35
FIGURE 5.4: VERTICAL VIBRATION OF EXTRACTOR FAN BLADE ............................36
FIGURE 5.5: SIMPLIFIED REPRESENTATION OF FAN FOR VIBRATION ANALYSIS ......36
FIGURE 5.6: VARIABLE RELUCTANCE TRANSDUCER..............................................39
FIGURE 5.7: TRANSDUCER MOUNTED IN HUB FLANGE...........................................41
FIGURE 5.8: SIMPLIFIED ILLUSTRATION OF MODERN PRIMARY EXTRACTOR FAN
ASSEMBLY.....................................................................................................42
FIGURE 5.9: INITIAL PASSIVE TRANSFORMER CONCEPT OF TWO COILS ENCLOSED IN
A CONDUCTIVE HOUSING ...............................................................................44
FIGURE 5.10: FIRST CONCEPT FIELD TRIALS OF THE ROTATING TRANSFORMER
WITHOUT (LEFT) AND WITH STATIONARY CYLINDRICAL SHIELD. A CIRCLE IN
THE RIGHT-HAND PICTURE HAS INDICATED THE PICK-OFF DEVICE .................46
FIGURE 5.11: FIRST INTERNAL ROTARY TRANSFORMER ........................................47
FIGURE 5.12: FINAL VERSION OF ROTARY TRANSFORMER (FOREGROUND), AND
DRIVE SHAFT IN END CAP (BACK-RIGHT)........................................................48
FIGURE 5.13: SIMPLIFIED ROTARY TRANSFORMER ................................................49
FIGURE 5.14: SIGNAL INTERFACE MODULE CONTAINING CONDITIONING AND
AMPLIFIER .....................................................................................................50
FIGURE 5.15: DATA COLLECTION SYSTEM USED FOR INITIAL TRIALS ....................51
FIGURE 6.1: SAMPLE INCLUDING BILLET, TRASH, AND OTHER NOISE OVERTONES.53
FIGURE 6.2: TEST RIG FOR SIMULATED PRIMARY EXTRACTOR FAN TRIALS............55
FIGURE 6.3: SAMPLES RECORDED FROM INSTRUMENTED TEST RIG: UPPER
WAVEFORM HAS AN IMPACT INDICATED, AND THIS IS SHOWN IN MORE DETAIL
IN THE LOWER WAVEFORM ............................................................................56
FIGURE 6.4: MAGNET PLACED ON ROTATING FAN SLEEVE TO SUPERIMPOSE INDEX
PULSE ONTO RECORDED SIGNAL TO INDICATE START/END OF A REVOLUTION
FOR POST-PROCESSING ..................................................................................58
FIGURE 6.5: RECORDED SAMPLE FROM TEST-RIG WITH A BILLET IMPACT AT 0.53
SECONDS, AND A CLEAR INDUCED INDEX PULSE ON THE SIGNAL ...................59
FIGURE 6.6: RECORDED SAMPLE FROM EXTRACTOR FAN WITH INDUCED INDEX
PULSES ..........................................................................................................60
XIV

FIGURE 6.7: SAMPLE RECORDED FROM INSTRUMENTED CANE HARVESTER: UPPER
WAVEFORM WAS A LONGER TIME SAMPLE, AND A SECTION OF THIS IS SHOWN
IN MORE DETAIL IN THE LOWER WAVEFORM..................................................61
FIGURE 6.8: SAMPLE INCLUDING BILLET, TRASH, AND OTHER NOISE OVERTONES.63
FIGURE 6.9: SPECTROGRAM (BELOW) OF TEST SAMPLE (ABOVE) AT 22 KHZ WITH
8-BIT RESOLUTION.........................................................................................64
FIGURE 6.10: DFT OF SAMPLES DEMONSTRATING CHARACTERISTIC FREQUENCY
RESPONSES: DIFFERENT FAN SPEEDS (ABOVE) AND DIFFERENT OPERATING
CONDITIONS (BELOW)....................................................................................65
FIGURE 6.11: HISTOGRAM (BELOW) OF THREE SECTIONS FROM TEST SAMPLE
(ABOVE) ........................................................................................................68
FIGURE 6.12: AUTOCORRELATION FUNCTION (BELOW) FOR SINGLE BILLET IMPACT
(ABOVE) ........................................................................................................69
FIGURE 6.13: CROSS-CORRELATION FUNCTIONS OF TEST SAMPLE (TOP), WITH
SINGLE IMPACT SIGNAL (MIDDLE) AND A GENERATED 1.5 KHZ SINUSOID .....71
FIGURE 6.14: MOVING AVERAGE FILTER (M = 61) (BELOW) APPLIED TO TEST
SAMPLE (ABOVE)...........................................................................................73
FIGURE 6.15: OUTPUTS FROM MOVING AVERAGE FILTERS OF VARYING WINDOW
SIZE APPLIED TO TEST SAMPLE.......................................................................75
FIGURE 6.16: BLOCK DIAGRAM OF ‘MOVING AVERAGE’ FILTERING ......................76
FIGURE 6.17: OUTPUT FROM OSCILLOSCOPE WITH A TEST WAVEFORM AS THE TOP
TRACE IN EACH FRAME, AND THE TTL OUTPUT FROM THE ANALOGUE
FILTERING (BELOW).......................................................................................77
FIGURE 6.18: SAMPLE RESULT OF SENSORY SEPARATION SYSTEM WITH RAW COUNT
OF IMPACTS ...................................................................................................78
FIGURE 6.19: RELATIONSHIP BETWEEN RECORDED IMPACTS AND FAN SPEED .......79
FIGURE 7.1: HARVESTER (LEFT) WITH TOPPER INDICATED, AND A CLOSER VIEW..80
FIGURE 7.2: COMPOSITION OF A RIPENING SUGAR CANE STALK (BARNES 1964) ...82
FIGURE 7.3: CHEMICAL STRUCTURE OF SUCROSE (BLOOMFIELD 1987) ................83
FIGURE 7.4: MANUFACTURED CAMERA BOX AND ADJUSTABLE MOUNTING
BRACKET .......................................................................................................84
FIGURE 7.5: MANUFACTURED CAMERA BOX MOUNTED ON TOPPER IN TWO
INDICATED POSITIONS: (A) AT CUTTING INTERFACE, AND (B) BACK OF HOOD85
XV
FIGURE 7.6: VIEW FROM CAMERA MOUNTED IN POSITION (B) ONTO TOPS OF
FRESHLY TOPPED STALKS ..............................................................................86
FIGURE 7.7: CRITICAL ANGLE FOR LIGHT TRANSMITTED BETWEEN TWO MEDIA....87
FIGURE 7.8: VALUES OF SUCROSE AND REFRACTIVE INDEX, RI, MEASURED ALONG
THE LENGTH OF CANE STALKS .......................................................................88
FIGURE 7.9: INVERSION OF SUCROSE.....................................................................89
FIGURE 7.10: VALUES OF ROTATION ANGLE AND RI AGAINST SUCROSE
CONCENTRATION MEASURED ALONG THE LENGTH OF CANE STALKS .............89
FIGURE 7.11: OPERATION OF SIMPLE SPECTROMETER ...........................................90
FIGURE 7.12: SPECTROMETER TEST RIG WITH CUVETTE IN POSITION IN BOX, AND
THE COLLIMATOR IS IN THE FOREGROUND.....................................................91
FIGURE 7.13: IR SPECTRUM FROM GAMEBOY CAMERA........................................92
FIGURE 7.14: SPECTROFLUORIMETER OUTPUT ......................................................92
FIGURE 7.15: PLACEMENT OF TRANSDUCERS (INDICATED) ON TOPPER TO COLLECT
ACOUSTIC INFORMATION: (A) CUTTING INTERFACE, AND (B) BACK OF HOOD 93
FIGURE 7.16: SAMPLE OF COLLECTED ACOUSTIC TOPPER DATA FROM THE CUTTING
INTERFACE (TOP) AND THE BACK OF THE HOOD (BOTTOM)............................94
FIGURE 7.17: TOPPER REMOVING LEAFY WASTE MATERIAL FROM UPPER SECTION
OF CANE STALKS ...........................................................................................95
FIGURE 7.18: SIMPLISTIC VIEW OF CRITICAL ANGLE REFRACTOMETER .................96
FIGURE 7.19: SENSOR OUTPUT FROM 20% SUGAR (LEFT), AND 0% SUGAR (RIGHT)
......................................................................................................................96
FIGURE 8.1: ROW OF CANE....................................................................................98
FIGURE 8.2: SIMPLE CRITICAL-ANGLE REFRACTOMETER IN HOUSING....................99
FIGURE 8.3: REFRACTOMETER OUTPUT FROM TWO DIFFERENT SUGAR SAMPLES
MEASURED WITH TRADITIONAL REFRACTOMETER.......................................100
FIGURE 8.4: SENSOR OUTPUT FROM 20% SUCROSE (LEFT), AND 0% SUCROSE
(RIGHT) .......................................................................................................101
FIGURE 8.5: OPERATOR’S VIEW OF REFRACTOMETER (LEFT), AND INSTRUMENT
MOUNTED ON BACK OF HOOD (RIGHT) .........................................................103
FIGURE 8.6: RESULTS OF DEFORMED STALK CROSS-SECTIONS ............................104
XVI
XVII
FIGURE 8.7: SQUASHING CONCEPTS TO EXTRACT SUFFICIENT SUGAR SAMPLE: (A)
SPRING-LOADED ROLLERS, (B) IMPACT DEVICE, AND (C) SPRING LOADED
ROLLER .......................................................................................................105
FIGURE 8.8: CAM-DRIVEN CANE SQUASHING MECHANISM ..................................106
FIGURE 8.9: PROTOTYPE SQUASHING MECHANISM WITH KEY ELEMENTS INDICATED,
AND STALK ORIENTATION ILLUSTRATED .....................................................106
FIGURE 8.10: SQUASHING DEVICE FROM BEHIND ................................................108
FIGURE 8.11: CRUSHING MECHANISM MOUNTED ON TOPPER ARM ......................109
FIGURE 8.12: SQUASHING MECHANISM IN LABORATORY CRUSHING SUGAR CANE
STALK..........................................................................................................109
FIGURE 8.13: DISTRIBUTION OF SUGAR CONCENTRATION FROM REFRACTOMETER
WITH SAMPLES FROM STALK (LEFT) UP TO TOP (RIGHT). THE SAMPLES WERE
TAKEN FROM DIFFERENT STALKS.................................................................110
FIGURE 9.1: MEASUREMENT SYSTEMS MODEL ....................................................112
FIGURE 9.2: FEEDBACK APPLIED TO MEASUREMENT SYSTEMS MODEL................113
FIGURE 9.3: VISUAL INDICATOR CONCEPT ..........................................................114
FIGURE 9.4: IMPLEMENTED CONTROL ALGORITHM ON SIMULATED DATA ...........116

XVIII
List of Tables
TABLE 5.1: DEPENDENCE OF FAN BLADE’S NATURAL FREQUENCY ON MASS.........37
TABLE 6.1: COMPARISON OF TIMES FOR COMPUTATIONS OF OSCILLATORY DATA.76
TABLE 7.1: RELATIVE SWEETNESS OF SUCROSE AND ITS REDUCING SUGARS (EDS.
PIGMAN ET AL. 1970)....................................................................................83
Chapter 1
Introduction
1.1. The Sugar Cane Harvester Control Concept All sugar cane grown in Australia is harvested mechanically. There have been
severe economic pressures to optimise production efficiency and product quality.
The harvesting process is a demanding task for the harvester operator as there are
many different functions to control under difficult visual conditions. The
transition from burnt to green cane harvesting in recent times has resulted in a
substantially greater workload demanded of the operator. This, compounded with
the lower green cane harvesting rate increases operator fatigue.
There is a great deal of potential to improve the efficiency of the mechanical
harvesting process. By quantifying the inefficiencies of the cutting and cleaning
systems with intelligent sensors, monitoring systems or even automatic control
could be developed to take over functions traditionally controlled by the
operator. This would reduce the responsibilities of the operator, and result in an
improvement in the performance and efficiency of the harvesting process.
This research has culminated in workable and useable advancements in the field
of sensory control. The chosen application of a mechanical sugar cane harvester
provides tremendous opportunity for these technologies to be integrated to
reduce the demands on the operator, and to improve the quality and quantity of
the harvested cane.
An improvement in the efficiency of the harvester would increase the yield
returned to the sugar mill for processing, and hence would be of considerable
financial benefit to the Australian sugar industry.
1

Chapter 1 - Introduction
1.2 Project Objectives The proposition for this research was based on simplifying the operation of a
mechanical harvester to reduce the demands on the operator during the
harvesting process. Any reduction in the responsibilities of an operator will
decrease the inherent human error involved with controlling the harvester. In
other words, an improvement in the operating conditions for the operator will
greatly increase the efficiency of the harvesting process, and will maximise the
yield returned to the sugar mill.
It was proposed that events during harvesting should be detected and
communicated directly from their source, be it from the cutting, cleaning or any
other selected system’s interface with the cane product. The necessary
information will be extracted from the signal returned from these systems and
will be applied appropriately.
By identifying the principal functions of the harvester, sensory systems will be
developed, introduced and integrated to provide relevant real-time information to
the operator, or to automatically control the functions, or a combination of the
two.
To support the proposition the objectives of this research program were as
follows.
1. Investigate the application environment and select appropriate
functions of a cane harvester to introduce sensory control.
2. Investigate existing instrumentation and control of cane harvesters to
determine deficiencies and/or drawbacks in their current design,
measurement technique, and performance, and investigate advantages
of introducing novel techniques.
2
Chapter 1 - Introduction
3. Describe and model innovative methods for the sensing of certain
events and parameters needed for control of the functions of a cane
harvester, in particular the introduction of mechatronic methods.
4. Consider ergonomic aspects of the presentation of additional
information to a human controller.
5. Devise and develop prototype sensory control or monitoring systems
to meet objectives using novel technologies.
6. Evaluate performance capabilities and limitations of prototyped
sensory systems.
1.3 Project Achievements Two functions of the harvester have been investigated – the cleaning system and
the topper. The operator controls both of these functions, however they represent
only a small portion of the workload and are often given low priority.
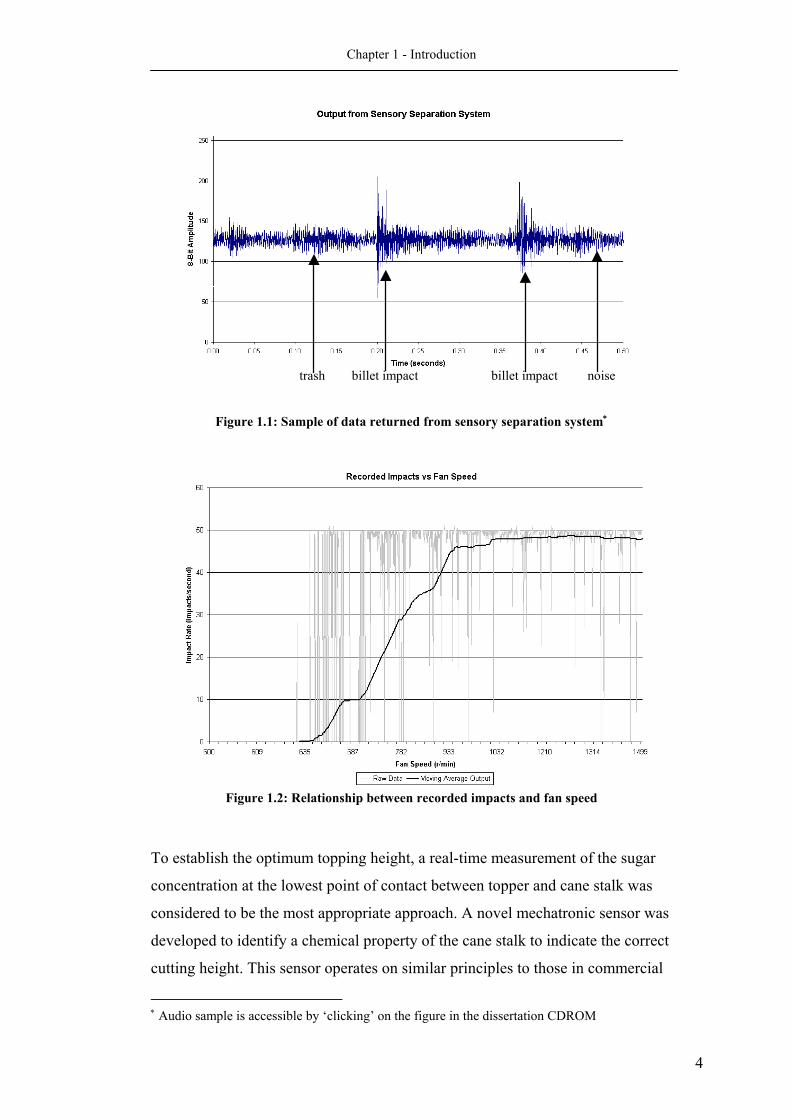
A method of assessing cane loss was developed in which cane billet impacts on
the primary extractor fan blades were detected by a novel audio transducer. The
signals from this transducer were coupled from the moving blades to the
stationary frame, where these signals were collected. The method demonstrated
the relationship between fan speed and cane loss and showed promise of
providing an accurate real time assessment of cane loss.
3
Chapter 1 - Introduction
Figure 1.1: Sample of data returned from sensory separation system∗
Figure 1.2: Relationship between recorded impacts and fan speed
noise billet impact billet impact trash
To establish the optimum topping height, a real-time measurement of the sugar
concentration at the lowest point of contact between topper and cane stalk was
considered to be the most appropriate approach. A novel mechatronic sensor was
developed to identify a chemical property of the cane stalk to indicate the correct
cutting height. This sensor operates on similar principles to those in commercial
4
∗ Audio sample is accessible by ‘clicking’ on the figure in the dissertation CDROM
Chapter 1 - Introduction
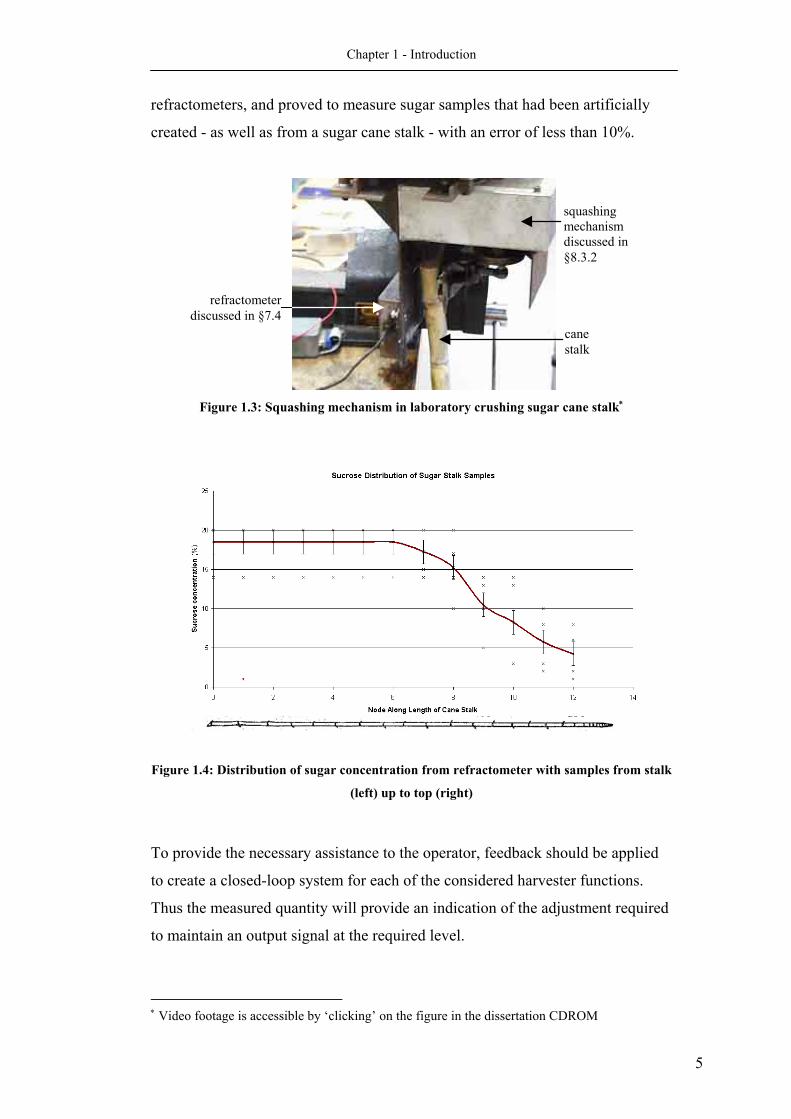
refractometers, and proved to measure sugar samples that had been artificially
created - as well as from a sugar cane stalk - with an error of less than 10%.
Figure 1.3: Squashing mechanism in laboratory crushing sugar cane stalk∗
squashing mechanism discussed in §8.3.2
cane stalk
refractometer discussed in §7.4
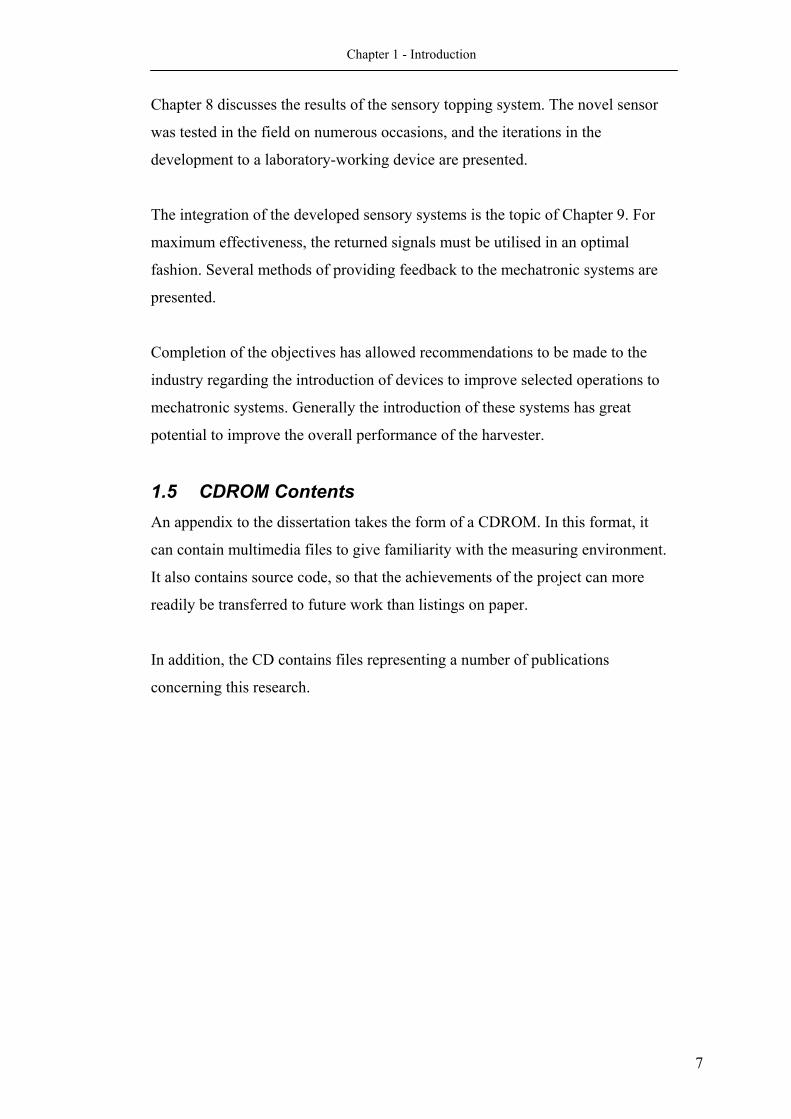
Figure 1.4: Distribution of sugar concentration from refractometer with samples from stalk
(left) up to top (right)
To provide the necessary assistance to the operator, feedback should be applied
to create a closed-loop system for each of the considered harvester functions.
Thus the measured quantity will provide an indication of the adjustment required
to maintain an output signal at the required level.
∗ Video footage is accessible by ‘clicking’ on the figure in the dissertation CDROM
5

Chapter 1 - Introduction
Ultimately the developed control systems will be integrated to form the basis of a
more efficient sugar cane harvester.
1.4 The Dissertation This chapter has provided an introduction to the thesis, and the application of the
developed technologies to the sugar cane industry. The layout of the remainder
of the dissertation is addressed in this section.
A brief introduction to the sugar industry, its logistics and the modern
mechanical cane harvester is provided in Chapter 2.
Chapter 3 discusses the measuring environment, and identifies the obvious lack
of technologies in integral harvesting mechanisms. Two harvester operations are
selected for further study – the separation system and topper.
The fiscal concerns of poor and inefficient operation of the selected functions are
the topic of Chapter 4. The efficiencies of the two systems are linked, and this is
identified.
The concept of a sensory separation system is introduced in Chapter 5.
Substantial familiarity was required in the measuring environment, and this is
reflected in the development stages of the system.
A novel sensory separation system was developed and finalised for field-testing,
and the results are discussed in Chapter 6. The returned signals from the system
revealed interesting methods for quantifying cane loss. Various time-series
analyses to identify lost cane are presented, and the results achieved from
applying the most successful of these are included.
The concept of the development of sensing mechanisms to be applied to various
harvester functions continues in Chapter 7, and this time the focus is the topper.
Appropriate sensing techniques are considered, and the development stages of
the most appropriate system are discussed.
6
Chapter 1 - Introduction
Chapter 8 discusses the results of the sensory topping system. The novel sensor
was tested in the field on numerous occasions, and the iterations in the
development to a laboratory-working device are presented.
The integration of the developed sensory systems is the topic of Chapter 9. For
maximum effectiveness, the returned signals must be utilised in an optimal
fashion. Several methods of providing feedback to the mechatronic systems are
presented.
Completion of the objectives has allowed recommendations to be made to the
industry regarding the introduction of devices to improve selected operations to
mechatronic systems. Generally the introduction of these systems has great
potential to improve the overall performance of the harvester.
1.5 CDROM Contents An appendix to the dissertation takes the form of a CDROM. In this format, it
can contain multimedia files to give familiarity with the measuring environment.
It also contains source code, so that the achievements of the project can more
readily be transferred to future work than listings on paper.
In addition, the CD contains files representing a number of publications
concerning this research.
7
Chapter 2
Background
2.1 The Australian Sugar Industry Sugar is Australia’s second largest export crop, and contributes up to $2 billion
dollars annually to the economy. Over 545 000 hectares (ha) are devoted to sugar
cane growing in Australia (Queensland Sugar Corporation 1997). This area is
generally on coastal plains and river valleys along 2100 km of the eastern
coastline between Mossman in north Queensland and Grafton in the northern part
of New South Wales. Additionally, in 1996 the Ord River region of Western
Australia had its first full season.
Australia produces 4% of the world’s sugar. However the domestic consumption
of sugar is quite low, and as a result, the sugar produced here represents 12% of
the total global free sugar trade.
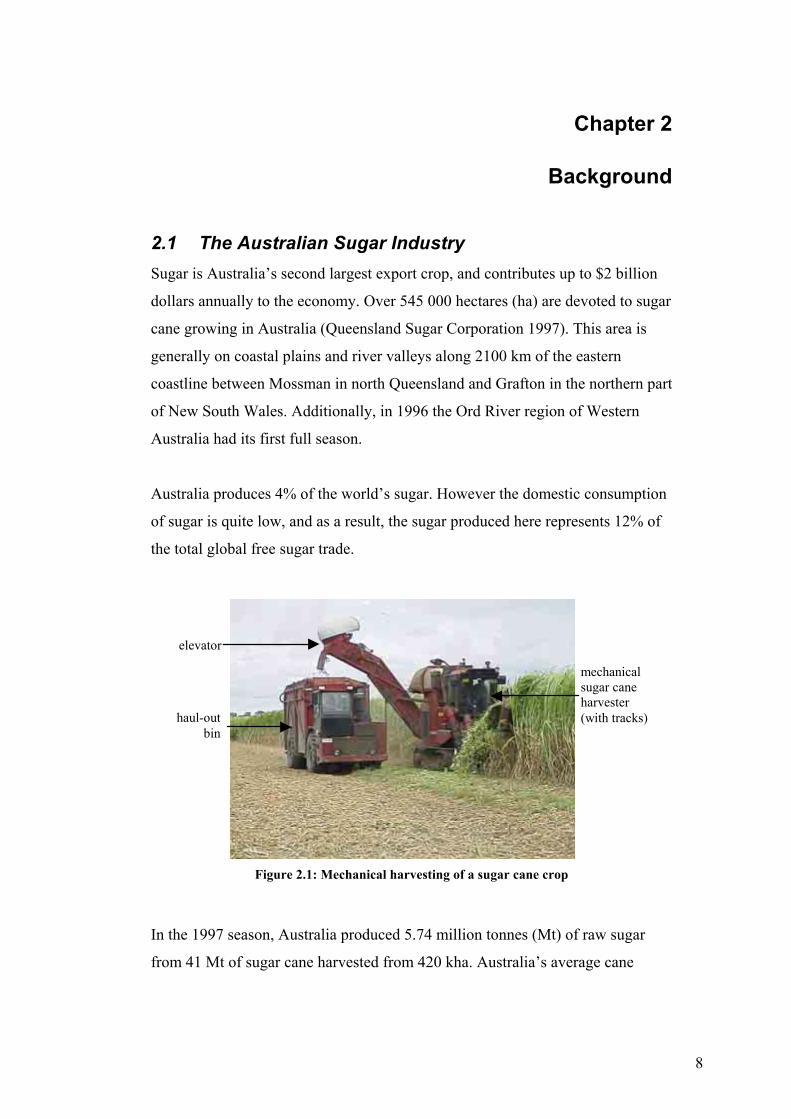
mechanical sugar cane harvester (with tracks)
elevator
haul-out bin
Figure 2.1: Mechanical harvesting of a sugar cane crop
In the 1997 season, Australia produced 5.74 million tonnes (Mt) of raw sugar
from 41 Mt of sugar cane harvested from 420 kha. Australia’s average cane
8
Chapter 2 - Background
production was 98 t/ha and sugar production was 13.8 t/ha – though these figures
can vary quite drastically.
2.2 Sugar Cane Sugar cane is a giant grass of the family Gramineae of the genus Saccharum
(Barnes 1964); its botanical name is Saccharum officinarum L.
Sugar cane has the ability to trap the sun’s energy and convert that energy into
sucrose (sugar) more effectively than most other crops. Sugar is produced in the
leaves of a cane plant through photosynthesis. Chlorophyll absorbs energy from
the sun and combines with carbon dioxide and water to produce high
concentrations of sugars stored as juice.
The sugar cane plant, which at maturity is between 2.5m to 3.5m high, can be
divided into four principal sections. From the top down there are the flower (or
arrow), the leaves (top and leaf), the stalk, and the root system. The area of the
plant of greatest interest for the grower is the stalk (culm, stem) because this is
where the commercial product, sucrose, is stored. A cross-section of the stalk is
generally roughly cylindrical (oval for some varieties) and the diameters vary
considerably, from 12 to 50mm. The outer portion, consisting of a tough rind,
encloses a softer, fleshy, internal portion of juice-soaked fibres.
2.3 Growing Sugar Cane The Australian industry has more than doubled its productivity in the last 60
years through advanced farming practices and new cane varieties (Queensland
Sugar Corporation 1997). The average yield of cane in the 1930s was 40 tonnes
per hectare that produced five tonnes of raw sugar. A hectare of land nowadays
in Australia typically yields between 80-100 tonnes of cane from which 10-15
tonnes of raw sugar is produced.
Sugar cane is grown from setts (cuttings from mature cane stalks) containing two
or more eyes (growing points) that are planted in rows approximately 1.5m apart.
The setts are usually billets that are supplied straight from the harvester. The
9
Chapter 2 - Background
propensity of sugar cane to produce new shoots from planted stalks allows
several crops to be harvested from the original plant. The subsequent crops are
called ratoon crops, and they are usually limited to three before fresh seeds are
planted.
The composition of the cane stalk is best considered as two members, vegetative
and chemical, and both of these vary in different varieties, and are influenced by
the conditions under which the cane is grown. Factors affecting the composition
of the cane of any variety include soil, environment, climate, water supply (rain
or irrigation), cultural treatment (fertilizer application), and age.
Sugar cane generally grows for 10 to 18 months before being harvested, usually
during the winter months when cane growth is slowest and sugar content is at or
near its peak. In Australia, the harvest season is generally between June and
December.
2.4 Mechanical Harvesting In many parts of the world, the harvesting of sugar cane is still performed
manually. Sugar cane is one of the most difficult crops to harvest mechanically
because of the size of plants, varying crop density, the number of different crop
varieties, and irregularities in growing patterns (Schneider & Baker 1997). For
example cane does not always grow perpendicular to the ground. If heavy rain
and winds occur during the growing season the cane may be blown over or even
collapse from the weight of the wet tops combined with the soft ground. These
plants continue to grow, however the cane stalks now take the shape of a large
hook (lodged crops) as the tops continue to turn upward toward the sun.
All of these factors have needed to be considered during the development of the
mechanical harvester. Harvesting of sugar cane via mechanical means was
pioneered in Australia, and is a process that began evolving as far back as 1889
(Spargo & Baxter 1975), but it was not until much later that any significant
progress towards improving the mechanical harvesting process was made.
10
Chapter 2 - Background
The years 1930 to 1955 included the development of many different models of
‘whole stalk’ cutters, most of which were developed by inventive farmers. These
machines performed well in erect crops, however could not harvest efficiently in
badly sprawled or lodged and tangled cane stalks. The functional limitation of
whole stalk cutters is their inability to handle bent stalks after they are cut. To
operate most efficiently, the requirement is to lay the cut stalks on the ground in
a series of aligned and compact bundles to be collected in a transport. This is a
relatively simple task to achieve if the stalks are straight, but if it is a lodged crop
the stalks may be severely bent and twisted.
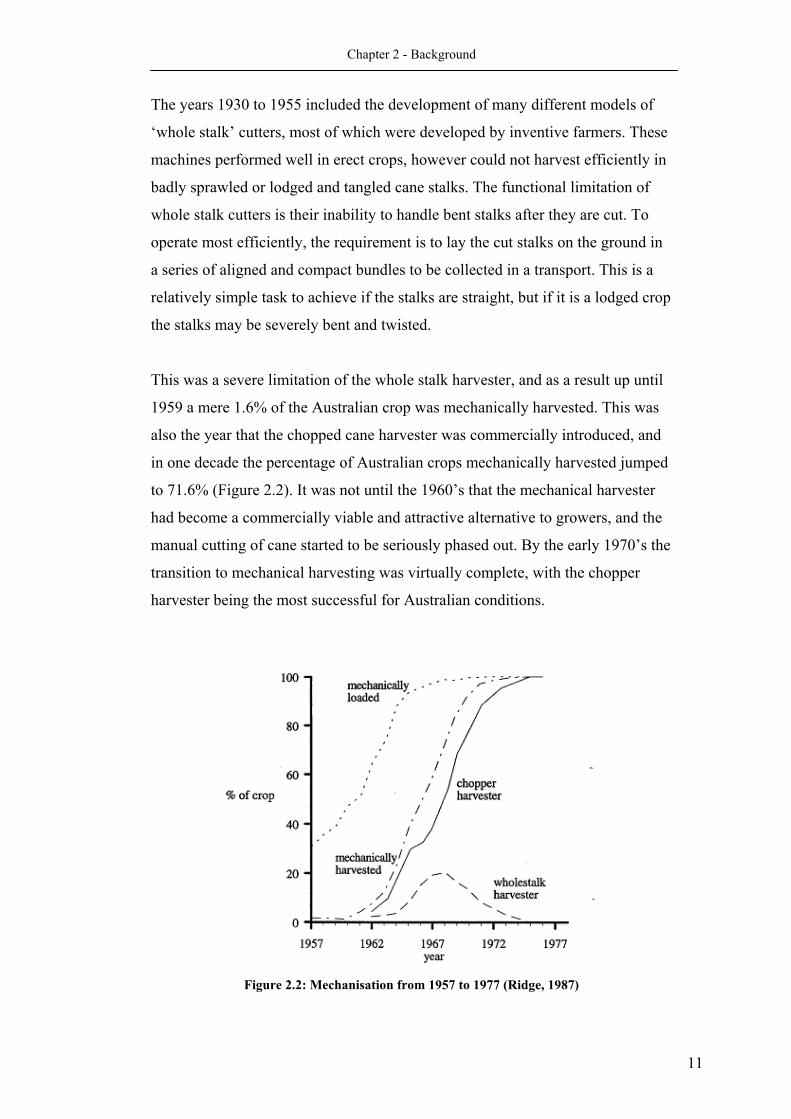
This was a severe limitation of the whole stalk harvester, and as a result up until
1959 a mere 1.6% of the Australian crop was mechanically harvested. This was
also the year that the chopped cane harvester was commercially introduced, and
in one decade the percentage of Australian crops mechanically harvested jumped
to 71.6% (Figure 2.2). It was not until the 1960’s that the mechanical harvester
had become a commercially viable and attractive alternative to growers, and the
manual cutting of cane started to be seriously phased out. By the early 1970’s the
transition to mechanical harvesting was virtually complete, with the chopper
harvester being the most successful for Australian conditions.
Figure 2.2: Mechanisation from 1957 to 1977 (Ridge, 1987)
11
Chapter 2 - Background
In many other sugar growing countries, whole stalk harvesting still proves
popular because the deterioration of whole stalks is slower than that of smaller
chopped up billets, and also there is less extraneous and other waste matter
included in the cane supply. Despite these factors the chopper harvester still
became most popular. The advantages were higher productivity, the ability to
harvest lodged cane, and producing a uniform material that could be easily
transported to the sugar mill using the existing efficient transport and scheduling
systems.
There are two methods commonly used for harvesting sugar cane:
• Burnt cane harvesting is the traditional condition under which cane was
cut. To prepare for harvesting, the crop was burnt to remove leaves,
weeds and other matter that may impede harvesting and milling
operations, and also as a measure to control the disease spread by rats.
This method is becoming less popular because of the damage caused to
the field via weed germination and moisture loss.
• Green cane harvesting involves cutting the crop as it stands without
prior preparation, and has in recent times become the more popular
method. Using this technique the leafy tops fall to the ground and provide
a protective trash blanket to organically mulch the field as well as
reducing the level of soil erosion and preserving soil nutrition for crop
growth. It also provides a cost saving to farmers because weed
germination is prevented. However in some growing areas the trash
blanket may waterlog the field, particularly where there is poor drainage.
In cooler climates the blanket lowers the soil temperature, which can
impede early plant growth. In modern times, some mill areas green
harvest up to 90% of the crops.
2.4.1 The Chopper Harvester
The modern mechanical harvester is still an evolving piece of technology. It is an
awkward machine consisting of numerous functions, most of which are
controlled by the operator.
12
Chapter 2 - Background
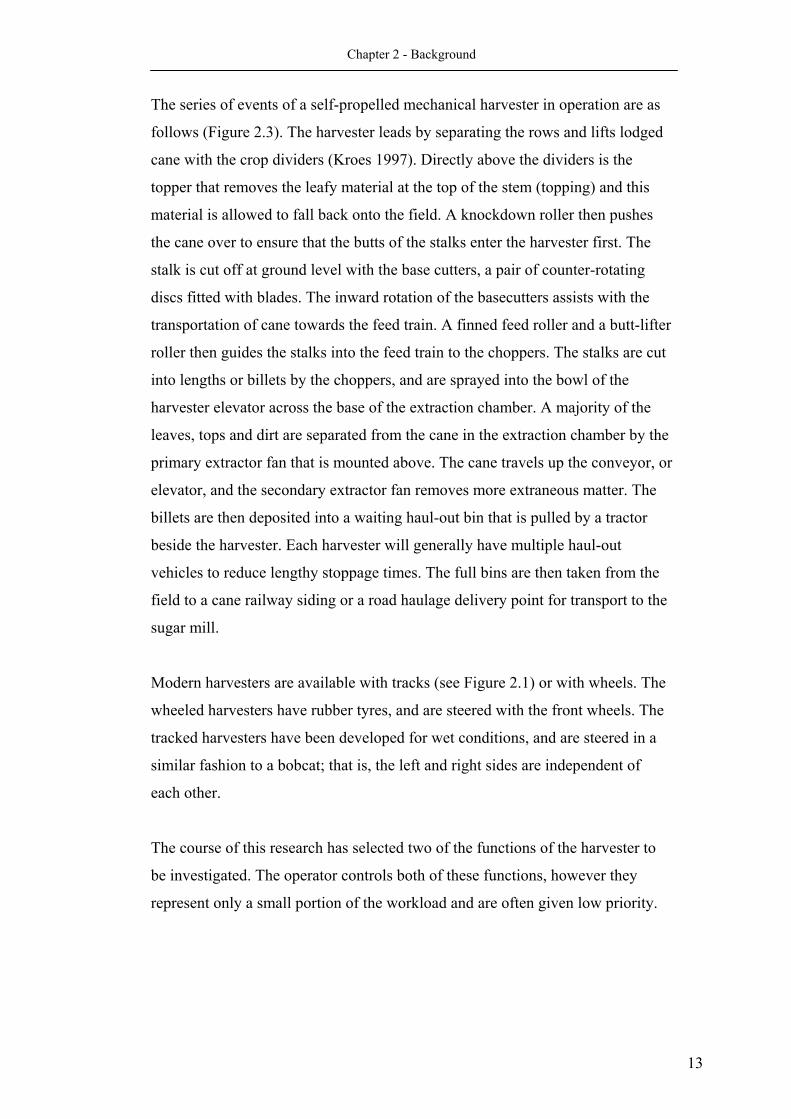
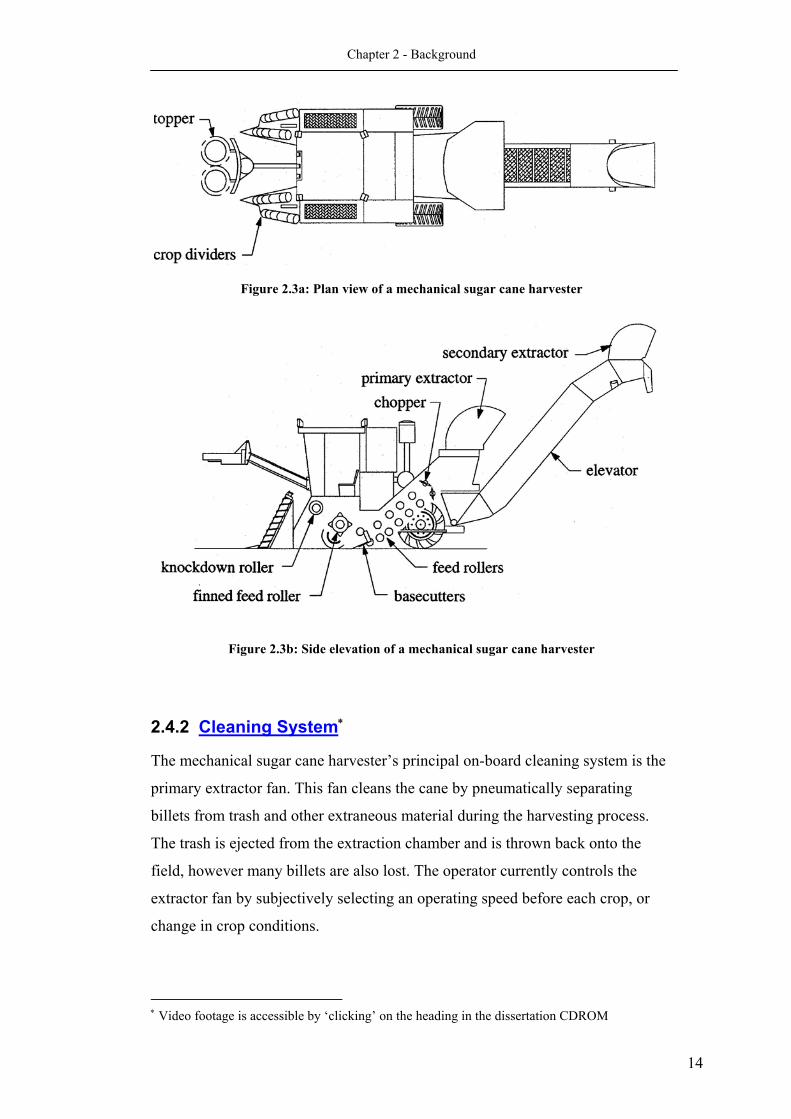
The series of events of a self-propelled mechanical harvester in operation are as
follows (Figure 2.3). The harvester leads by separating the rows and lifts lodged
cane with the crop dividers (Kroes 1997). Directly above the dividers is the
topper that removes the leafy material at the top of the stem (topping) and this
material is allowed to fall back onto the field. A knockdown roller then pushes
the cane over to ensure that the butts of the stalks enter the harvester first. The
stalk is cut off at ground level with the base cutters, a pair of counter-rotating
discs fitted with blades. The inward rotation of the basecutters assists with the
transportation of cane towards the feed train. A finned feed roller and a butt-lifter
roller then guides the stalks into the feed train to the choppers. The stalks are cut
into lengths or billets by the choppers, and are sprayed into the bowl of the
harvester elevator across the base of the extraction chamber. A majority of the
leaves, tops and dirt are separated from the cane in the extraction chamber by the
primary extractor fan that is mounted above. The cane travels up the conveyor, or
elevator, and the secondary extractor fan removes more extraneous matter. The
billets are then deposited into a waiting haul-out bin that is pulled by a tractor
beside the harvester. Each harvester will generally have multiple haul-out
vehicles to reduce lengthy stoppage times. The full bins are then taken from the
field to a cane railway siding or a road haulage delivery point for transport to the
sugar mill.
Modern harvesters are available with tracks (see Figure 2.1) or with wheels. The
wheeled harvesters have rubber tyres, and are steered with the front wheels. The
tracked harvesters have been developed for wet conditions, and are steered in a
similar fashion to a bobcat; that is, the left and right sides are independent of
each other.
The course of this research has selected two of the functions of the harvester to
be investigated. The operator controls both of these functions, however they
represent only a small portion of the workload and are often given low priority.
13
Chapter 2 - Background
Figure 2.3a: Plan view of a mechanical sugar cane harvester
Figure 2.3b: Side elevation of a mechanical sugar cane harvester
2.4.2 Cleaning System∗
The mechanical sugar cane harvester’s principal on-board cleaning system is the
primary extractor fan. This fan cleans the cane by pneumatically separating
billets from trash and other extraneous material during the harvesting process.
The trash is ejected from the extraction chamber and is thrown back onto the
field, however many billets are also lost. The operator currently controls the
extractor fan by subjectively selecting an operating speed before each crop, or
change in crop conditions.
∗ Video footage is accessible by ‘clicking’ on the heading in the dissertation CDROM
14
Chapter 2 - Background
2.4.3 Topper∗
The function of the topper is to gather, sever and discard the leafy, immature, and
non-productive tops of the sugar cane stalk. Modern toppers are called ‘shredder
toppers’ because of their ability to gather and shred the cane tops before
discarding the waste back onto the field. Physically the topper is a large
hydraulically powered, vertically rotating drum with many razor knives on the
rotating drum and gathering walls. The operator currently controls the height of
the topper by subjectively judging the optimum topping point on the cane stalk.
∗ Video footage is accessible by ‘clicking’ on the heading in the dissertation CDROM
15
Chapter 3
The ‘Smarter Harvester’
3.1 Justification of Study Modern mechanical harvesters are complex machines that are often difficult to
manoeuvre. There are numerous simultaneous functions that must be directly
controlled by the operator. A majority of these have to be controlled under
extremely difficult visual conditions, if they can be seen at all.
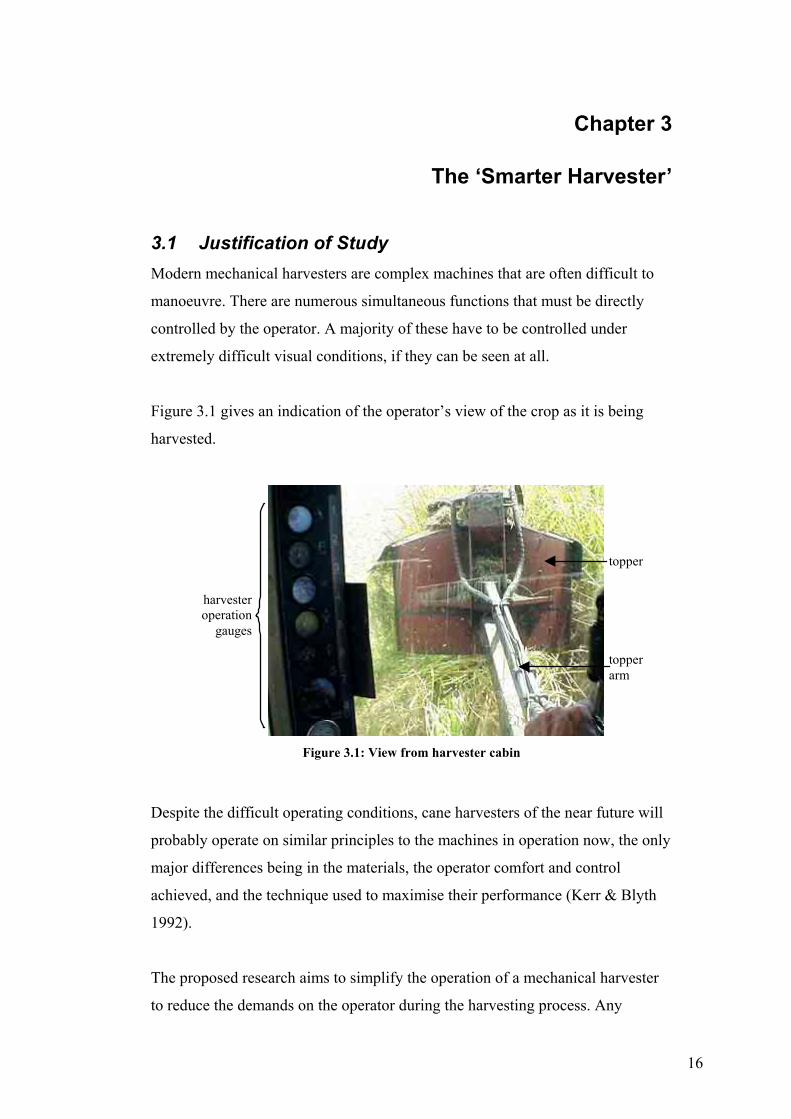
Figure 3.1 gives an indication of the operator’s view of the crop as it is being
harvested.
harvester operation
gauges
topper
topper arm
Figure 3.1: View from harvester cabin
Despite the difficult operating conditions, cane harvesters of the near future will
probably operate on similar principles to the machines in operation now, the only
major differences being in the materials, the operator comfort and control
achieved, and the technique used to maximise their performance (Kerr & Blyth
1992).
The proposed research aims to simplify the operation of a mechanical harvester
to reduce the demands on the operator during the harvesting process. Any
16

Chapter 3 –The ‘Smarter Harvester’
reduction in the responsibilities of an operator will decrease the possibility of
error that is inevitably involved with human control of the harvester. An
improvement in the operating conditions for the operator will greatly increase the
efficiency of the harvesting process, and will maximise the yield returned to the
sugar mill.
3.2 Preceding Work The idea for the proposition continues from earlier work conducted by Pandey
and Billingsley (1998) at the University of Southern Queensland. This research
was concerned with the automatic control of both the steering and base cutter
height of a cane harvester.
Many of the harvester’s operations rely on mechanical blades, be it for cutting or
cleaning, and this earlier work demonstrated that if these operations were sensed
at the point of contact via acoustic means, information relevant for the automatic
control of these operations could be extracted from the returned data.
The methods explored by Pandey and Billingsley (1998) proved to be relatively
successful, but their work also demonstrated that there is potential for a great
deal more research and development in the field of cane harvester automation.
There have been many attempts at automating a cane harvester. These techniques
have not yet been shown to be completely reliable - as will be discussed in §3.2 -
and as a consequence the harvester operator still controls all of the harvester
functions.
The cane harvester is required to operate in an extremely hostile environment.
Mechanical components, such as blades, are subjected to abrasive and acidic
conditions that cause severe wear. As a consequence, the harvesting environment
is an important consideration when designing any sensory system for the
harvester.
17
Chapter 3 –The ‘Smarter Harvester’
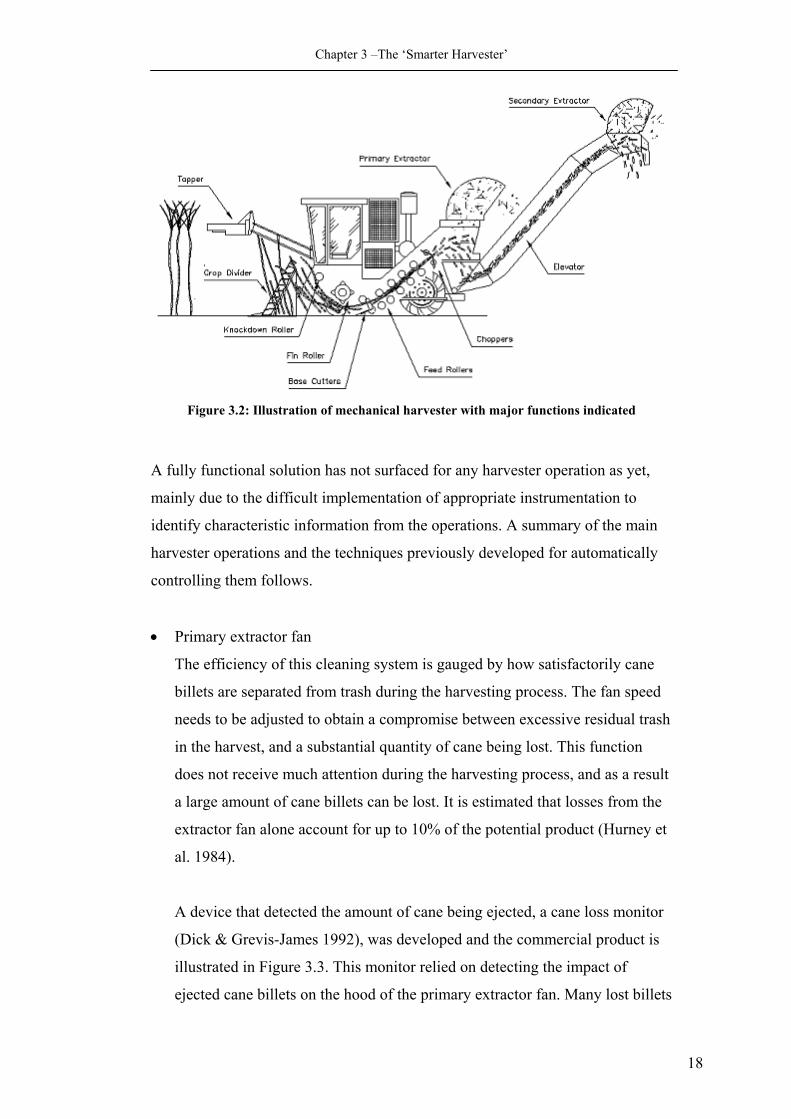
Figure 3.2: Illustration of mechanical harvester with major functions indicated
A fully functional solution has not surfaced for any harvester operation as yet,
mainly due to the difficult implementation of appropriate instrumentation to
identify characteristic information from the operations. A summary of the main
harvester operations and the techniques previously developed for automatically
controlling them follows.
• Primary extractor fan
The efficiency of this cleaning system is gauged by how satisfactorily cane
billets are separated from trash during the harvesting process. The fan speed
needs to be adjusted to obtain a compromise between excessive residual trash
in the harvest, and a substantial quantity of cane being lost. This function
does not receive much attention during the harvesting process, and as a result
a large amount of cane billets can be lost. It is estimated that losses from the
extractor fan alone account for up to 10% of the potential product (Hurney et
al. 1984).
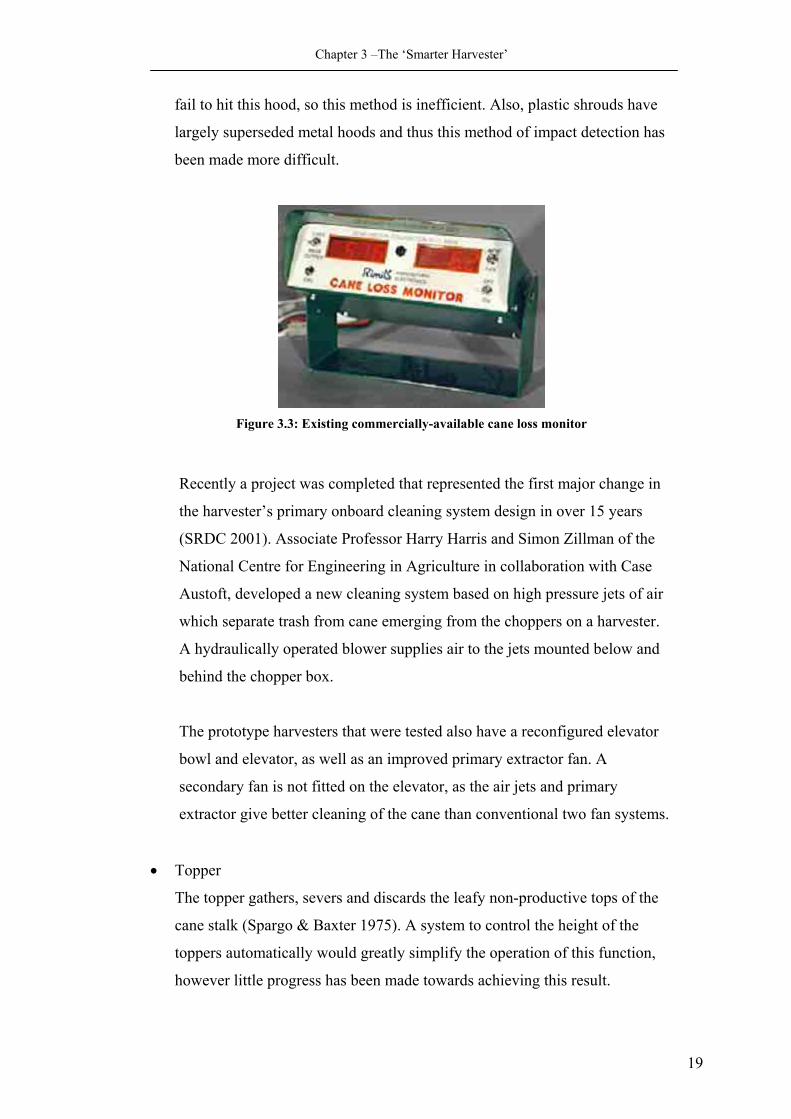
A device that detected the amount of cane being ejected, a cane loss monitor
(Dick & Grevis-James 1992), was developed and the commercial product is
illustrated in Figure 3.3. This monitor relied on detecting the impact of
ejected cane billets on the hood of the primary extractor fan. Many lost billets
18
Chapter 3 –The ‘Smarter Harvester’
fail to hit this hood, so this method is inefficient. Also, plastic shrouds have
largely superseded metal hoods and thus this method of impact detection has
been made more difficult.
Figure 3.3: Existing commercially-available cane loss monitor
Recently a project was completed that represented the first major change in
the harvester’s primary onboard cleaning system design in over 15 years
(SRDC 2001). Associate Professor Harry Harris and Simon Zillman of the
National Centre for Engineering in Agriculture in collaboration with Case
Austoft, developed a new cleaning system based on high pressure jets of air
which separate trash from cane emerging from the choppers on a harvester.
A hydraulically operated blower supplies air to the jets mounted below and
behind the chopper box.
The prototype harvesters that were tested also have a reconfigured elevator
bowl and elevator, as well as an improved primary extractor fan. A
secondary fan is not fitted on the elevator, as the air jets and primary
extractor give better cleaning of the cane than conventional two fan systems.
• Topper
The topper gathers, severs and discards the leafy non-productive tops of the
cane stalk (Spargo & Baxter 1975). A system to control the height of the
toppers automatically would greatly simplify the operation of this function,
however little progress has been made towards achieving this result.
19
Chapter 3 –The ‘Smarter Harvester’
• Base cutters
The function of the base cutters is to cut the cane stalk off at ground level.
The base cutters are probably the most difficult operation to control because
they are completely hidden from the view of the operator. They are two
600mm steel discs that have up to six blades mounted on each. These discs
are mounted behind the front wheels of the harvester, and they contra-rotate
at approximately 600rpm.
The height of the base cutters is controlled by two hydraulic rams that raise
or lower the front section of the harvester. Inaccurate height control
contributes to both a reduction in yield, as well as excessive extraneous
matter in the harvest that can cost the Australian industry up to 40 million
dollars per year (SRDC 1997).
Automatically controlling the height of the base cutters has been the most
investigated function of the cane harvester. Attempts have been made to use
data collected from the base cutter height sensors to automatically control the
steering of the harvester along the rows of the crop. Some techniques that
have been attempted include basecutter hydraulic drive fluctuations, acoustic
sensing and ultrasonic height detection.
Suggs and Abrams (1972) and Garson (1992) considered base cutter
hydraulic drive fluctuations as being a technique for height control. This
method attempted to monitor fluctuations about the mean of the pressure in
either of the base cutter’s hydraulic drives. The fluctuations in pressure
indicated that the base cutter required more power, and hence was cutting
through the solid soil bed rather than the lighter cane.
Pandey and Billingsley (1998) investigated the technique of identifying base
cutter noise signatures for height control. This work introduced the method of
using a sensor in the form of a microphone to listen to each of the discs. The
differential raw signals from the base cutter blades gave an indication of the
steering control feedback required. Height control was attempted by
20
Chapter 3 –The ‘Smarter Harvester’
analysing each disc’s recording to discriminate between the blades cutting
cane and the soil bed.
Schembri and Everitt (1999) attempted the most promising approach,
ultrasonic height sensing, by attaching two such sensors to the harvester
frame slightly ahead of the base cutters. The height measurements indicated
the effect of the elevator position on the angle of incline of the harvester,
which impacts on the cutting performance of the base cutters. The centre of
the row was also detectable from the outputs of the sensors.
Ultrasonic techniques have also been successfully employed as a method to
monitor the height of the crop dividers. The operators usually control the
height above ground level of the crop dividers on harvester fronts. Imprecise
control can result in soil being shovelled onto cane entering the harvester
throat if dividers are set too deep, or lodged cane escaping under the divider
shoe if set too high. Matt Schembri of the Sugar Research Institute (SRDC
2001) demonstrated that ultrasonic sensors could be used to measure the
height of the crop divider shoe from the soil surface, and thus allow
automatic control of the crop divider height regulated by a microprocessor.
New means of improving the quality of the sugar cane product returned to the
mill are not restricted to design changes of the mechanical harvester. Cox, Harris
and Cox (1998) developed a sensor to monitor the yield from a sugar cane
harvester. This product represented a first in the world of precision agriculture
for cane, and the industry has identified precision agriculture as critical for future
productivity gains in the cane industry. The benefits of the system included
improved fertiliser management, reduced environmental impact and enhanced
overall farm management. The data acquired using the system continues to be
utilised by farmers and researchers in the field.
3.3 Relevant Advances in Other Agricultural Equipment In the past, the manufacturers and producers of agricultural machinery have
emphasised raw power over technical sophistication (Romans et al. 2000), and
21
Chapter 3 –The ‘Smarter Harvester’
one of the major impediments of the electronics adoption was the unreliability of
early sensors in the measuring environment. However in more recent times the
use of electronics was more widespread as equipment manufacturers paid more
attention to operator comfort. The introduction of the enclosed cabin of modern
agricultural equipment also meant more controls, monitors, and other electronic
equipment could be mounted on every pillar and flat surface in the cabin.
Zander (1972) considered that the advent of mechanisation had influenced the
nature of the workload in the agricultural harvesting industry, and now the main
issue was the perception and processing of information, as well as controlling
and regulating the work being done by machines. In particular, this study
focussed on the ergonomic system-analysis of the operation of a self- propelled
combine harvester.
The grain industry has for some time had technology to monitor the amount of
grain lost during the harvesting process. Many products are now available that
measure a combine harvester’s throughput and loss, and these quantities are
useful to control the ground speed of the harvester so that a desired material flow
rate may be maintained (Downs & Stone 1988). These sensors detect the sound
of the grain striking the plate and send a pulse back to the monitor for each seed
strike. The meter calculates the average frequency of seed strikes and displays a
relative reading.
Another relevant advance in the grain industry is the infrared grain analyser. This
product calculates protein or moisture and oil content for the grain of interest
continuously during the harvesting process (Sheppard 1999). It is envisaged that
this system will allow the separation of high- and low-quality grains into bins
directly from the combine harvester.
The discipline of agricultural field vehicle guidance is a topic that continues to be
well explored. Various methods have been reported including such techniques as
buried-wire guidance of tractors, guidance of agricultural vehicles via trailed
implements, crop feeler systems for harvesters, vision systems, and in more
22

Chapter 3 –The ‘Smarter Harvester’
current times the use of GPS as a tool has become perhaps the most accurate
method yet.
3.4 Chapter Summary Clearly the mechanical harvesting of su7ar cane is a process that has potential for
improvement. Through the introduction of mechatronic techniques, the
efficiencies of this particular facet of the Australian sugar industry may be
substantially enhanced.
23
Chapter 4
Sugar Cane Harvesting Logistics
4.1 Economics The manner in which a sugar cane harvester is operated has a considerable effect
on the financial return to the growers, millers and harvester owners. This is
significant because of two factors: cane quality, and loss of millable cane
(Brotherton & Pope 1995). Cane quality relates to the presence of extraneous
matter (EM) in the product. Fuelling (1982) describes extraneous matter in
chopped cane as consisting of tops, trash (green and dry leaf), dead cane, and
dirt.
Topping low to reduce the extraneous matter results in loss of cane on the
proportion of taller stalks (Brotherton & Pope 1995). Similarly topping high to
reduce this loss results in inclusion of increased quantity of tops in the product,
as well as increasing demand on the separation systems.
The ideal topping height for individual stalks in lodged crops is varied and it is
nearly impossible to prevent tops entering the harvester.
Inclusion of tops normally represents a major proportion of the extraneous matter
in the cane supply that is delivered to mills. In chopped cane, the top is of cane
billet length and approximately the same density. Often it forms part of a billet of
cane, and so it is very difficult to separate from the cane without undue losses.
Leaving the cane stalks untopped during the harvesting process increases
tonnage, and has a negative impact on sugar quality. High levels of extraneous
matter are undesirable because of their adverse effect on the commercial cane
sugar (CCS) content of the cane supply. Commercial cane sugar represents the
sugar content of cane as sugar mills purchase it, and it is generally accepted that
it is substantially decreased for each percentage unit increase in extraneous
matter.
24
Chapter 4 – Sugar Cane Harvesting Logistics
A trial in Far-North Queensland in 1997 (Agnew 1999) showed that untopped
treatments had 4% more tonnes cane/ha but the net income to the grower was
reduced by 5% because of the reduction in CCS from including the tops and
increasing harvesting and transporting costs.
Therefore the efficiency of the harvesting process influences the quantity and
CCS of the cane received by the mill. It follows that the amount and distribution
of profits is extremely dependent on the harvesting process.
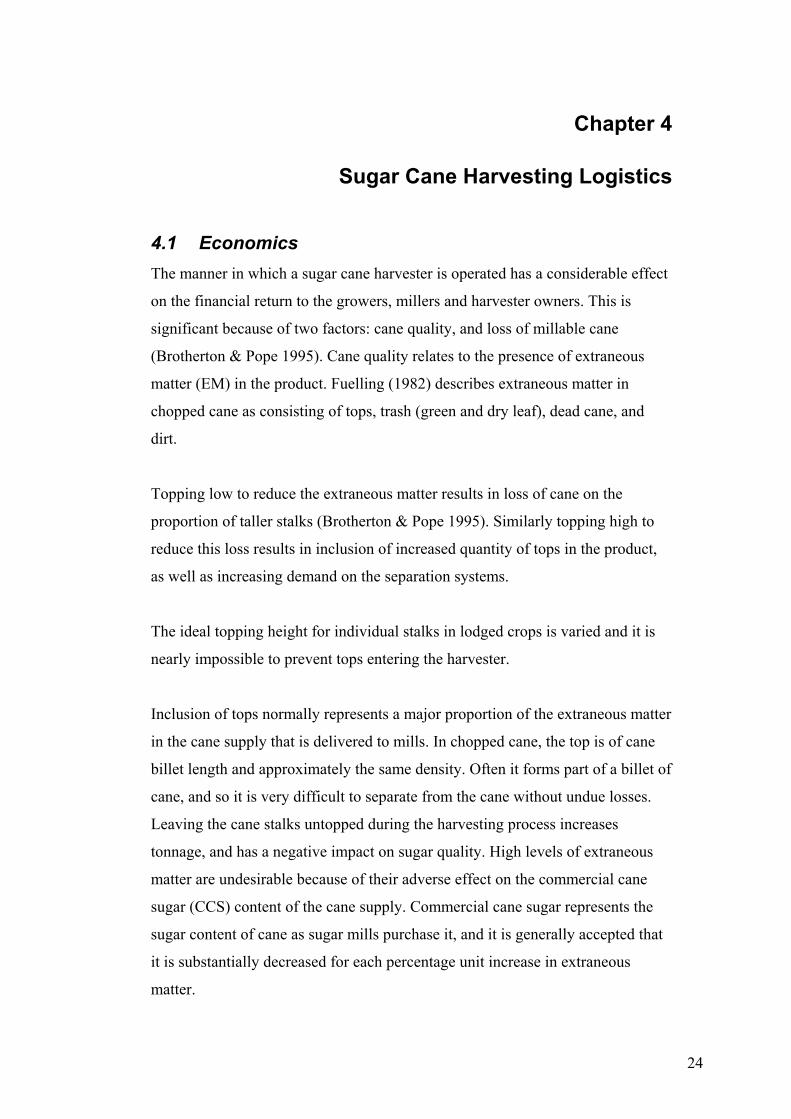
Brotherton and Pope (1995) developed relationships between extraneous matter
and cane losses for topping and extractor fans. There is an inverse relationship
between the amount of cane lost in discarded tops and the extraneous matter due
to tops inclusion. Also an inverse relationship exists between extractor fan cane
loss and the associated extraneous matter. These relationships are illustrated in
Figure 4.1.
Figure 4.1: Trend relationships between extraneous matter and cane loss for topping and
for separation systems (Brotherton & Pope 1995)
The significance of improving the mechanical harvesting system is clear. Sugar
mills have urged the provision of cane with minimal extraneous matter, and
enforce financial penalties through the CCS return. Therefore the harvesting
system must be made more efficient to alleviate the detrimental influence of the
inclusion of extraneous matter.
25
Chapter 4 – Sugar Cane Harvesting Logistics
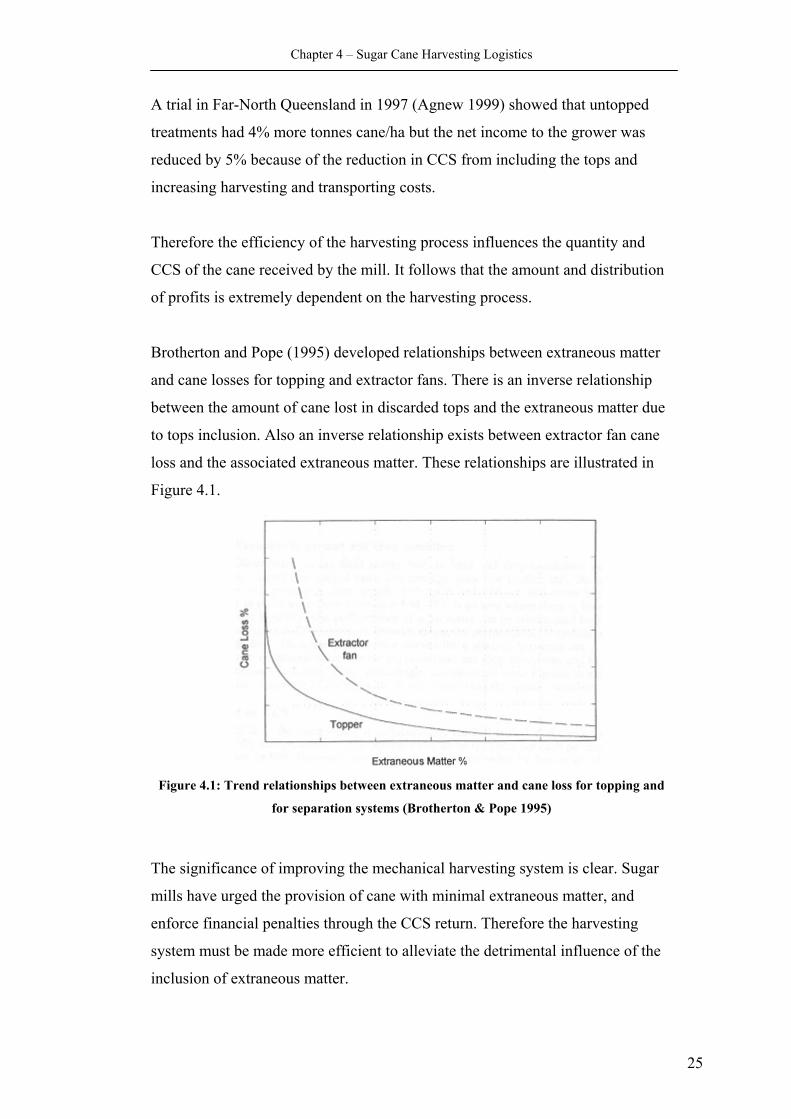
4.2 Responsibilities of the Harvester Operator Operation of a mechanical sugar cane harvester is a very labour intensive task
that occurs under extremely difficult visual and physical conditions. During
harvesting season, the operator must work long shifts with few rest days. The
cabin is a confined space filled with controls for harvester functions, and gauges
indicating the status of these. Figure 4.2 illustrates the harvester cabin from
different angles.
Figure 4.2: Controls and gauges in harvester cabin
major proportion of these harvester functions require regular monitoring and
1. The basecutter blades cut the cane stalks near the base, ideally at
his
2. eed train, and it directs
power and control panel
positioned overhead controls and swiches mounted
on right arm-restgauges mounted on windscreen frame
A
efficient controlling. The responsibilities expected of the harvester operator are
listed here (in no specific order) with a short description of each (Agnew 1999).
ground level. The operator sets the height of the two basecutters. T
adjustment is usually based on the hydraulic drive pressure, or the
amount of dirt being collected in the harvest.
The buttlifter is the first feed element in the f
the cane into the rollers. It also lifts the cane bundle above the fan of
soil that sprays off the basecutters. The feed train depends on a steady
intake of cane, but higher buttlifter rotational speeds also increase the
dirt intake.
26
Chapter 4 – Sugar Cane Harvesting Logistics
3. Choppers cut the cane stalks fed by the feed train into billet lengths.
The set rotational speed of the choppers produces billets of
characteristic length.
4. Inconsistencies between the row spacing (ideally 1.5m) and
equipment track width (1.83m) result in compaction in the near-row
and over-the-row area. The compaction caused by the wide and heavy
machinery is difficult and costly to correct. The operator must ensure
that harvesting occurs under the driest soil condition possible. The
number of passes must be restricted and care taken when turning the
harvester to minimise paddock disturbance.
5. The height of the crop dividers must follow the terrain to prevent
grading of soil into the basecutters, and where possible, this is
determined visually by the operator.
6. The adjustable deflector plate is mounted above the choppers, and
directs the pouring of billets and trash into the elevator bowl.
Optimum deflector plate settings improve trash extraction and
minimise cane loss, and the plate should be adjusted to cope with
different crop or harvesting conditions.
7. The elevator lifts the clean billets to be carefully poured into the
mobile collection bins. It is essential to provide a consistent feed of
harvested cane to the transport, and to minimise lost cane at the
collection point.
8. The speed of the primary and secondary extractor fans needs to be
controlled to minimise the amount of trash and extraneous material in
the cane supply, and possibly more importantly the cane loss.
9. Floating shoes prevent cane from escaping the feed train. They
should always be in contact with the ground, but they should be set up
to reduce grading of soil into the basecutters.
10. The forward speed of the harvester must be suitable for the operating
conditions. Excessive forward speed causes problems in the feeding,
cleaning, loss and harvested cane quality mechanisms.
11. Adequate maintenance of hydraulic pumps and motors is necessary
for optimum feeding and cleaning of cane.
27
Chapter 4 – Sugar Cane Harvesting Logistics
12. Rotating paddles mounted in the cleaning chamber behind the
chopper deflect billets down and away from the extractor fan while
still allowing trash to flow out with the air stream. Substantial
reductions in cane loss are achieved when operated correctly.
13. All rollers should be run at the same speed, and this will provide a
consistent thin mat of material through the machine, producing
quality billets with improved feeding, dirt rejection and cleaning
without excessive cane loss.
14. The shredder topper should be operated to gather and chop up tops.
The performance of most of these functions may be monitored either visually, or
by the indicator gauges mounted in the cabin of the harvester. From this
summary of the operator’s responsibilities, it can be appreciated that a great deal
of skill, experience and judgment is involved in operating a mechanical
harvester.
4.3 Inefficiencies Exposed Unfortunately the complexity of operating the cane harvester often leads to the
system not performing as efficiently as possible. The toppers and primary
extractor fan of the harvester have been identified as being particularly
inefficient, partly because of the obvious difficulties in controlling their
operation, and also they are frequently under-prioritised by the operator.
Operation of these two functions has already been briefly described, but
theoretical losses associated with each, and their inter-dependence will be
discussed.
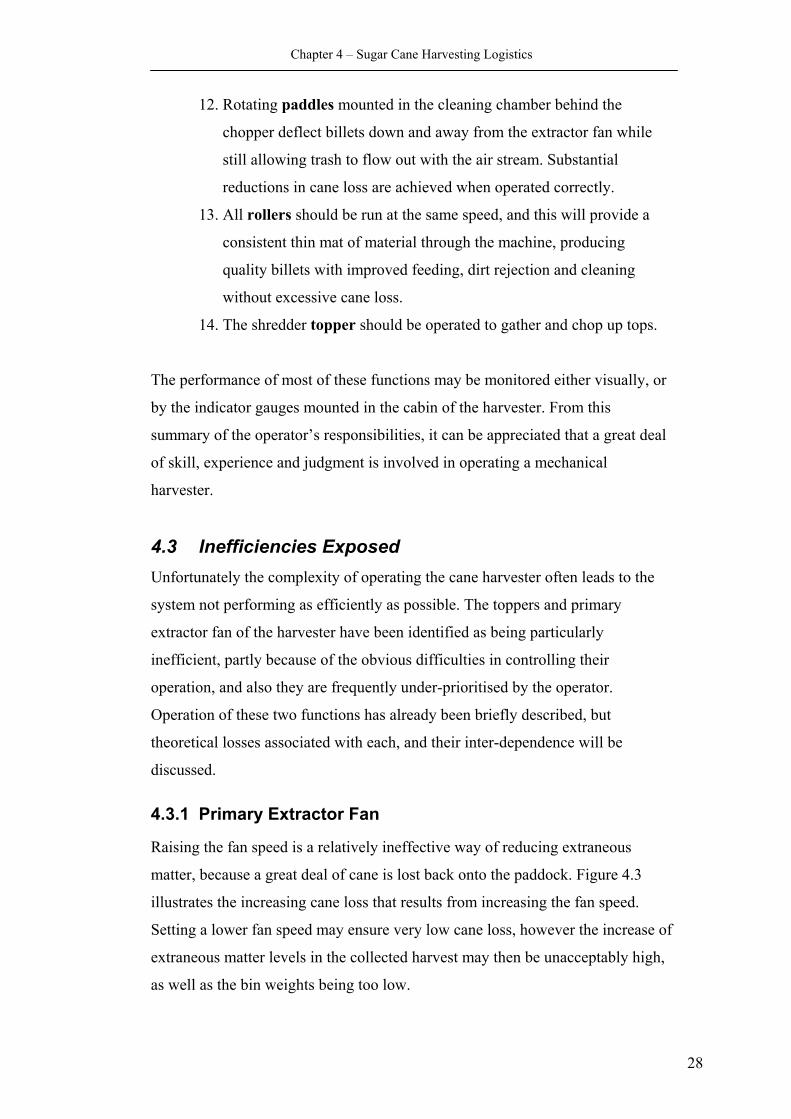
4.3.1 Primary Extractor Fan
Raising the fan speed is a relatively ineffective way of reducing extraneous
matter, because a great deal of cane is lost back onto the paddock. Figure 4.3
illustrates the increasing cane loss that results from increasing the fan speed.
Setting a lower fan speed may ensure very low cane loss, however the increase of
extraneous matter levels in the collected harvest may then be unacceptably high,
as well as the bin weights being too low.
28
Chapter 4 – Sugar Cane Harvesting Logistics
Cane Loss vs Extractor Speed 1995-1997 Model Harvesters, Mulgrave
Extractor Speed (rpm)
Can
e Lo
ss (t
onne
s/ha
)
Figure 4.3: The effect of fan speed on cane loss (Agnew 1999)
Ideally the primary extractor fan speed should be adjusted to suit differing crop
conditions, even while harvesting in the one field. Regular monitoring of the fan
speed is a difficult task for the operator because of the numerous other tasks, and
as a result cane loss due to the extractor of to 25 tonnes/hectare is not
uncommon.
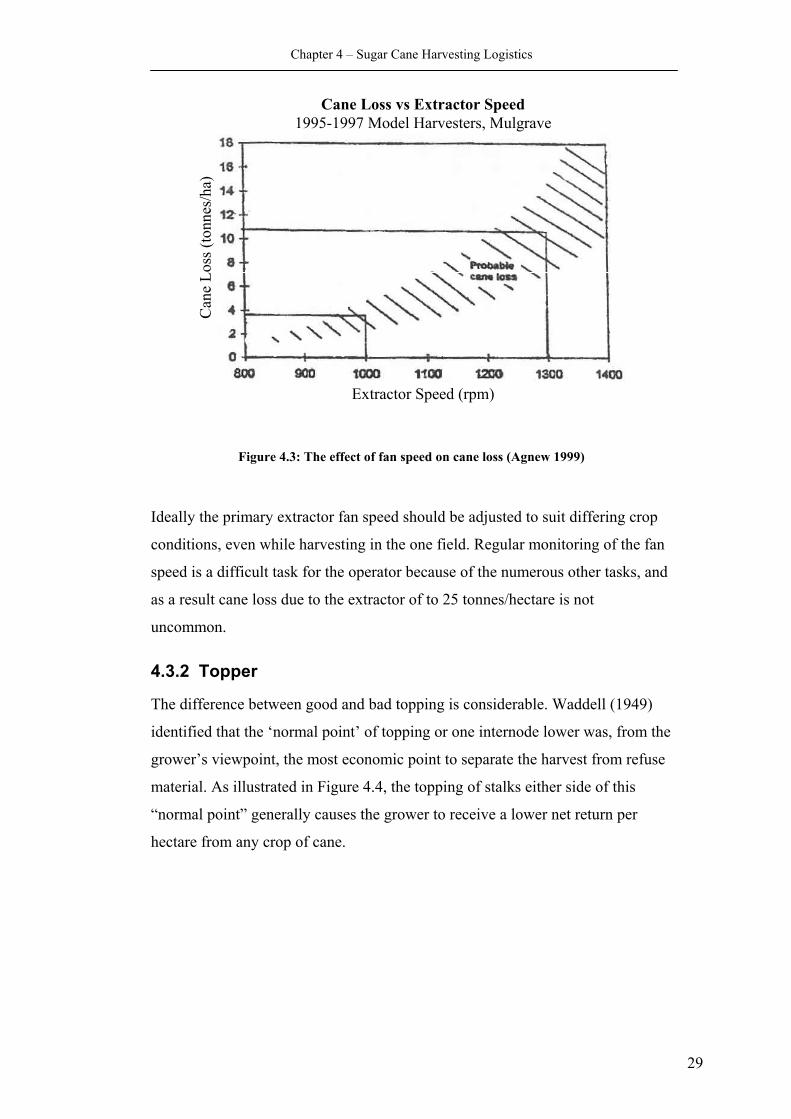
4.3.2 Topper
The difference between good and bad topping is considerable. Waddell (1949)
identified that the ‘normal point’ of topping or one internode lower was, from the
grower’s viewpoint, the most economic point to separate the harvest from refuse
material. As illustrated in Figure 4.4, the topping of stalks either side of this
“normal point” generally causes the grower to receive a lower net return per
hectare from any crop of cane.
29
Chapter 4 – Sugar Cane Harvesting Logistics
nodes
Figure 4.4: The effect of topping height on the financial return of the cane grower
(Waddell 1949)
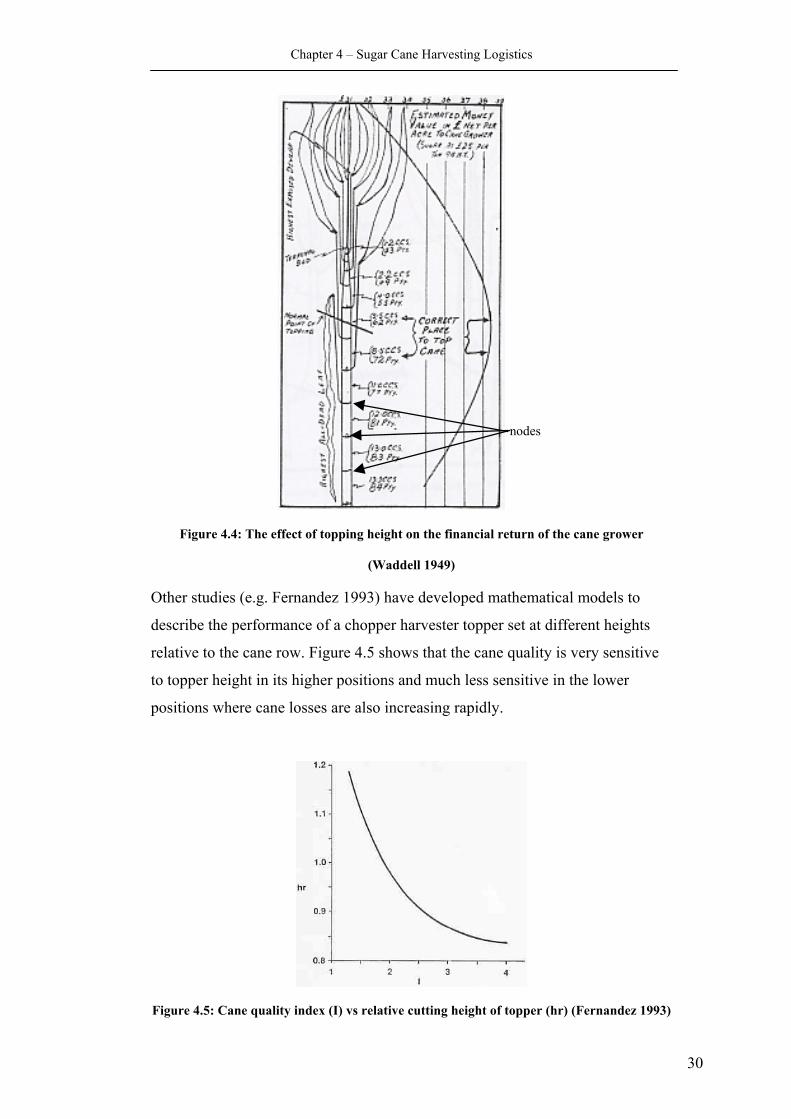
Other studies (e.g. Fernandez 1993) have developed mathematical models to
describe the performance of a chopper harvester topper set at different heights
relative to the cane row. Figure 4.5 shows that the cane quality is very sensitive
to topper height in its higher positions and much less sensitive in the lower
positions where cane losses are also increasing rapidly.
Figure 4.5: Cane quality index (I) vs relative cutting height of topper (hr) (Fernandez 1993)
30

Chapter 4 – Sugar Cane Harvesting Logistics
4.4 Chapter Summary The operation of a sugar cane harvester is an extremely demanding task, and this
results in the system not performing as efficiently as possible. The control tasks
expected of the operator have been identified, and the workspace of the operator
has been illustrated. The economic aspects of poor operation of the harvester are
dramatic, and there is a great deal of room for improvement of particular
harvester functions.
31
Chapter 5
Sensory Separation System
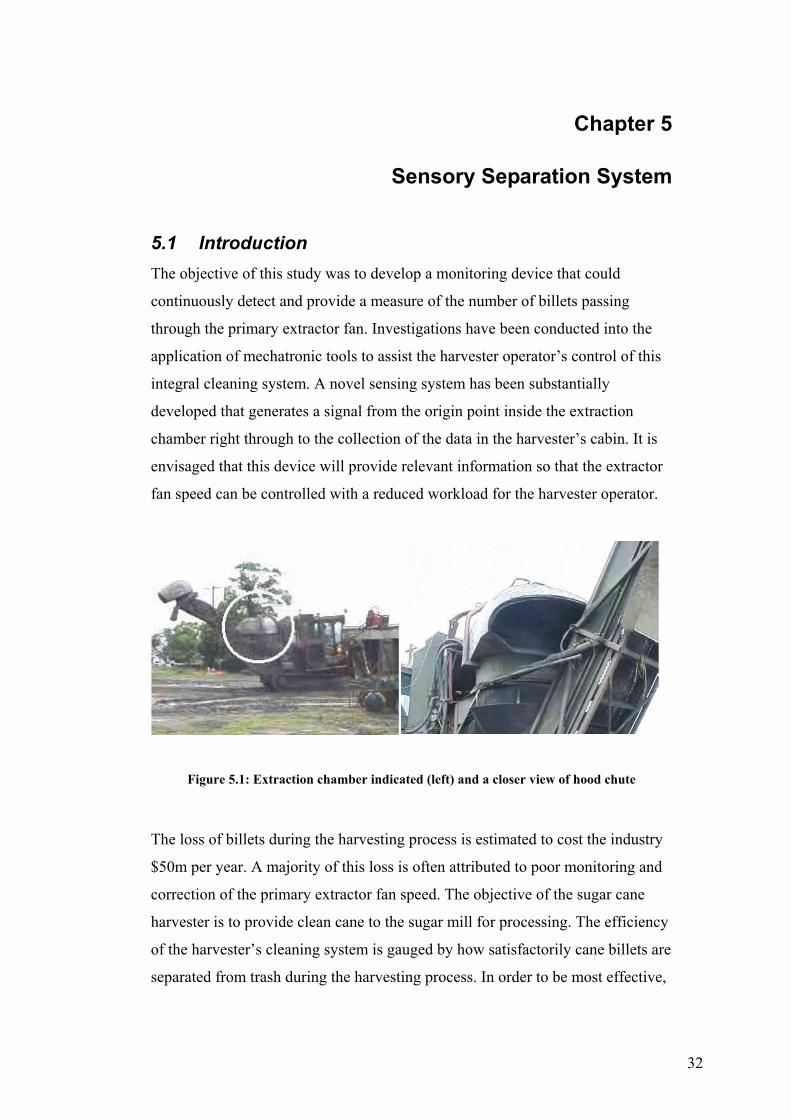
5.1 Introduction The objective of this study was to develop a monitoring device that could
continuously detect and provide a measure of the number of billets passing
through the primary extractor fan. Investigations have been conducted into the
application of mechatronic tools to assist the harvester operator’s control of this
integral cleaning system. A novel sensing system has been substantially
developed that generates a signal from the origin point inside the extraction
chamber right through to the collection of the data in the harvester’s cabin. It is
envisaged that this device will provide relevant information so that the extractor
fan speed can be controlled with a reduced workload for the harvester operator.
Figure 5.1: Extraction chamber indicated (left) and a closer view of hood chute
The loss of billets during the harvesting process is estimated to cost the industry
$50m per year. A majority of this loss is often attributed to poor monitoring and
correction of the primary extractor fan speed. The objective of the sugar cane
harvester is to provide clean cane to the sugar mill for processing. The efficiency
of the harvester’s cleaning system is gauged by how satisfactorily cane billets are
separated from trash during the harvesting process. In order to be most effective,
32
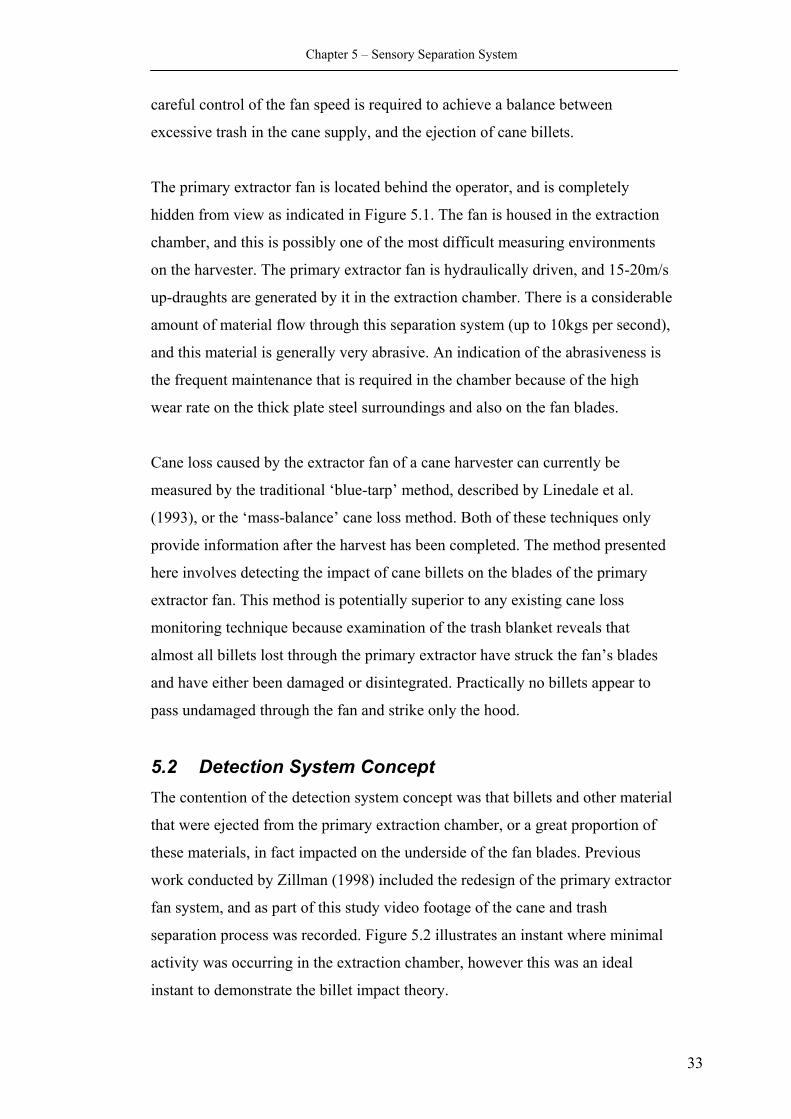
Chapter 5 – Sensory Separation System
careful control of the fan speed is required to achieve a balance between
excessive trash in the cane supply, and the ejection of cane billets.
The primary extractor fan is located behind the operator, and is completely
hidden from view as indicated in Figure 5.1. The fan is housed in the extraction
chamber, and this is possibly one of the most difficult measuring environments
on the harvester. The primary extractor fan is hydraulically driven, and 15-20m/s
up-draughts are generated by it in the extraction chamber. There is a considerable
amount of material flow through this separation system (up to 10kgs per second),
and this material is generally very abrasive. An indication of the abrasiveness is
the frequent maintenance that is required in the chamber because of the high
wear rate on the thick plate steel surroundings and also on the fan blades.
Cane loss caused by the extractor fan of a cane harvester can currently be
measured by the traditional ‘blue-tarp’ method, described by Linedale et al.
(1993), or the ‘mass-balance’ cane loss method. Both of these techniques only
provide information after the harvest has been completed. The method presented
here involves detecting the impact of cane billets on the blades of the primary
extractor fan. This method is potentially superior to any existing cane loss
monitoring technique because examination of the trash blanket reveals that
almost all billets lost through the primary extractor have struck the fan’s blades
and have either been damaged or disintegrated. Practically no billets appear to
pass undamaged through the fan and strike only the hood.
5.2 Detection System Concept The contention of the detection system concept was that billets and other material
that were ejected from the primary extraction chamber, or a great proportion of
these materials, in fact impacted on the underside of the fan blades. Previous
work conducted by Zillman (1998) included the redesign of the primary extractor
fan system, and as part of this study video footage of the cane and trash
separation process was recorded. Figure 5.2 illustrates an instant where minimal
activity was occurring in the extraction chamber, however this was an ideal
instant to demonstrate the billet impact theory.
33
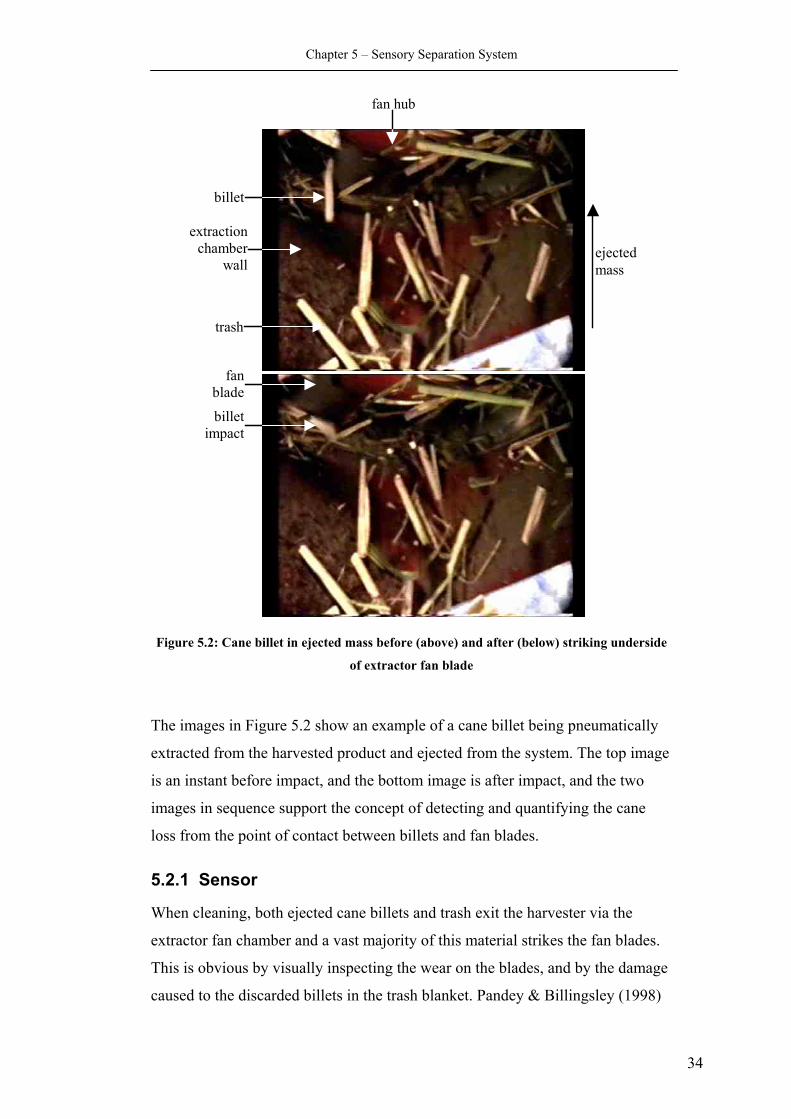
Chapter 5 – Sensory Separation System
fan hub
extraction chamber
wall
fanblade
billetimpact
billet
trash
ejected mass
Figure 5.2: Cane billet in ejected mass before (above) and after (below) striking underside
of extractor fan blade
The images in Figure 5.2 show an example of a cane billet being pneumatically
extracted from the harvested product and ejected from the system. The top image
is an instant before impact, and the bottom image is after impact, and the two
images in sequence support the concept of detecting and quantifying the cane
loss from the point of contact between billets and fan blades.
5.2.1 Sensor
When cleaning, both ejected cane billets and trash exit the harvester via the
extractor fan chamber and a vast majority of this material strikes the fan blades.
This is obvious by visually inspecting the wear on the blades, and by the damage
caused to the discarded billets in the trash blanket. Pandey & Billingsley (1998)
34
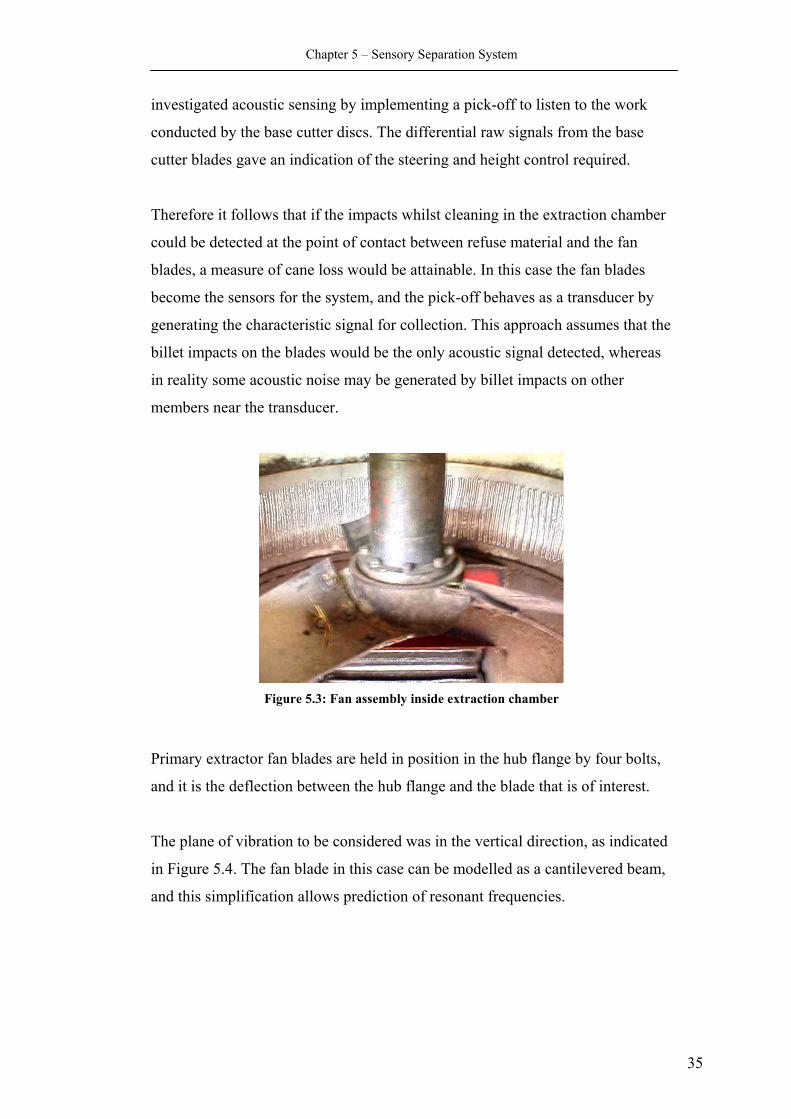
Chapter 5 – Sensory Separation System
investigated acoustic sensing by implementing a pick-off to listen to the work
conducted by the base cutter discs. The differential raw signals from the base
cutter blades gave an indication of the steering and height control required.
Therefore it follows that if the impacts whilst cleaning in the extraction chamber
could be detected at the point of contact between refuse material and the fan
blades, a measure of cane loss would be attainable. In this case the fan blades
become the sensors for the system, and the pick-off behaves as a transducer by
generating the characteristic signal for collection. This approach assumes that the
billet impacts on the blades would be the only acoustic signal detected, whereas
in reality some acoustic noise may be generated by billet impacts on other
members near the transducer.
Figure 5.3: Fan assembly inside extraction chamber
Primary extractor fan blades are held in position in the hub flange by four bolts,
and it is the deflection between the hub flange and the blade that is of interest.
The plane of vibration to be considered was in the vertical direction, as indicated
in Figure 5.4. The fan blade in this case can be modelled as a cantilevered beam,
and this simplification allows prediction of resonant frequencies.
35
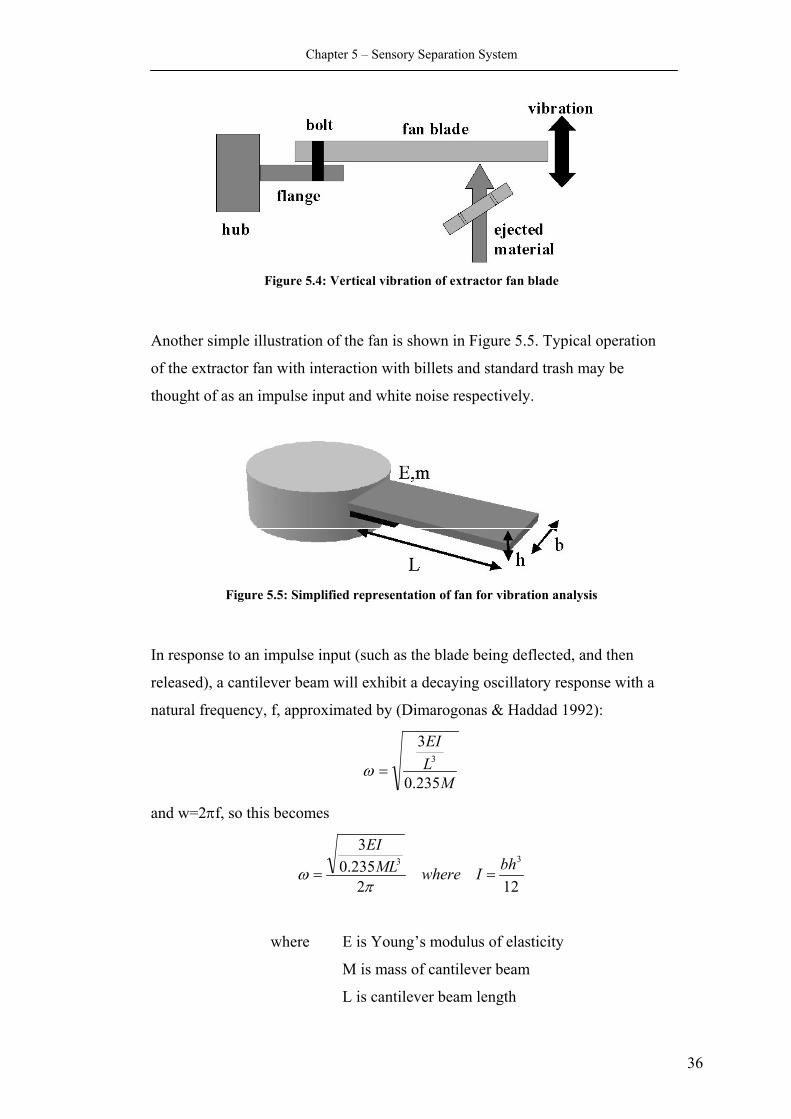
Chapter 5 – Sensory Separation System
Figure 5.4: Vertical vibration of extractor fan blade
Another simple illustration of the fan is shown in Figure 5.5. Typical operation
of the extractor fan with interaction with billets and standard trash may be
thought of as an impulse input and white noise respectively.
Figure 5.5: Simplified representation of fan for vibration analysis
In response to an impulse input (such as the blade being deflected, and then
released), a cantilever beam will exhibit a decaying oscillatory response with a
natural frequency, f, approximated by (Dimarogonas & Haddad 1992):
MLEI
235.0
33
=ω
and w=2πf, so this becomes
122235.03
33 bhIwhereMLEI
==π
ω
where E is Young’s modulus of elasticity
M is mass of cantilever beam
L is cantilever beam length
36
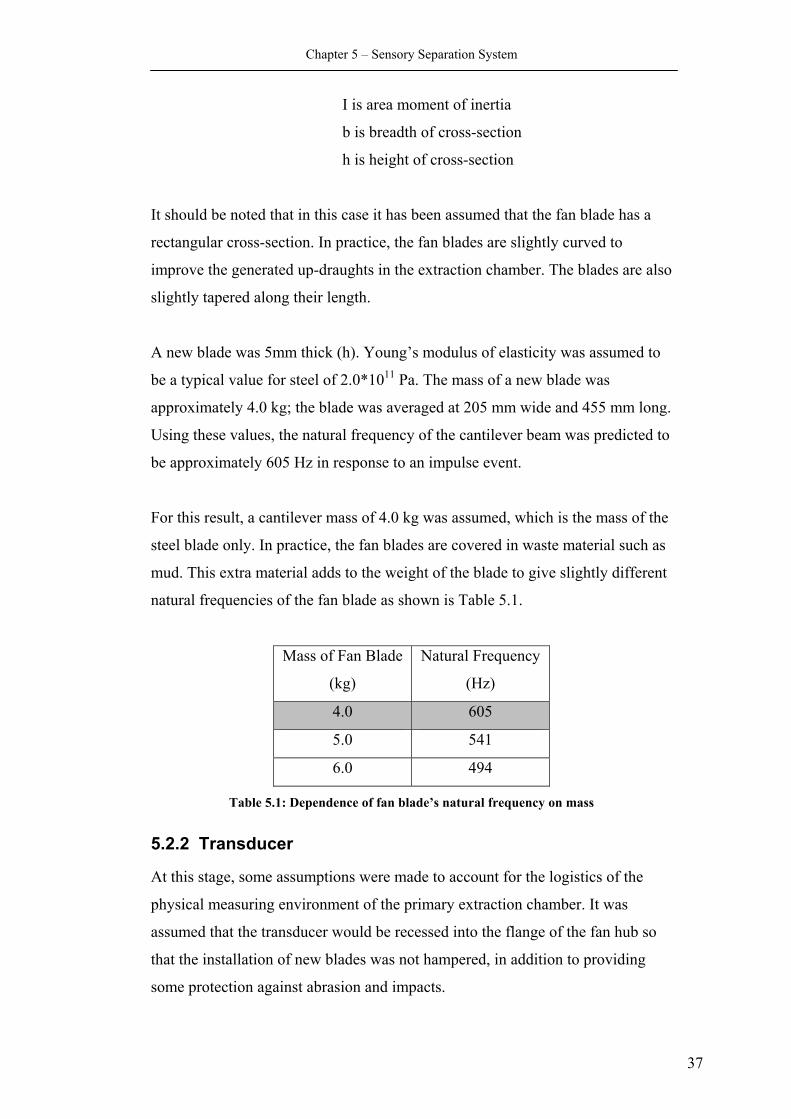
Chapter 5 – Sensory Separation System
I is area moment of inertia
b is breadth of cross-section
h is height of cross-section
It should be noted that in this case it has been assumed that the fan blade has a
rectangular cross-section. In practice, the fan blades are slightly curved to
improve the generated up-draughts in the extraction chamber. The blades are also
slightly tapered along their length.
A new blade was 5mm thick (h). Young’s modulus of elasticity was assumed to
be a typical value for steel of 2.0*1011 Pa. The mass of a new blade was
approximately 4.0 kg; the blade was averaged at 205 mm wide and 455 mm long.
Using these values, the natural frequency of the cantilever beam was predicted to
be approximately 605 Hz in response to an impulse event.
For this result, a cantilever mass of 4.0 kg was assumed, which is the mass of the
steel blade only. In practice, the fan blades are covered in waste material such as
mud. This extra material adds to the weight of the blade to give slightly different
natural frequencies of the fan blade as shown is Table 5.1.
Mass of Fan Blade
(kg)
Natural Frequency
(Hz)
4.0 605
5.0 541
6.0 494
Table 5.1: Dependence of fan blade’s natural frequency on mass
5.2.2 Transducer
At this stage, some assumptions were made to account for the logistics of the
physical measuring environment of the primary extraction chamber. It was
assumed that the transducer would be recessed into the flange of the fan hub so
that the installation of new blades was not hampered, in addition to providing
some protection against abrasion and impacts.
37
Chapter 5 – Sensory Separation System
Originally, a transducer was considered on each sensor individually, i.e. on each
blade, and when the fan was considered as a system, it was logical that three
transducers would be required. The connection of the three transducers needed to
be considered: series or parallel? If connected in series, any impact would have a
substantial signal generated by that blade’s transducer and this signal would be
reinforced with smaller auxiliary signals from the other transducers. However,
this method would suffer from increased noise and signal loss from the increased
load of three transducers compared to one. The advantage of connecting the
transducers in parallel would be that if one transducer was damaged and ceased
functioning, a failure condition would be averted. Following this, it was assumed
that the installation of only one transducer in one flange would be sufficient to
detect the substantial vibrations that are caused by the impacts of cane billets.
This was later confirmed with static trials of the system.
The harsh environmental conditions required the implementation of a simple,
fully sealed and robust transducer design. Ideally the device should be self-
powered to avoid the complications of supplying power across a rotating
interface, and other systems such as batteries and even electromagnetic
transmissions were considered too complex.
There are several practical methods of converting mechanical vibrations into
electrical signals. Of these, only electrodynamic and piezoelectric devices meet
the self-powering criteria. Piezoelectric devices are quite fragile, but more
importantly their output impedance is extremely high, and this would not allow a
transformer to be energised to transfer the signal across an air gap.
The most common of the electrodynamic transducers are the moving coil,
moving magnet and variable reluctance. In the moving coil example, vibrations
of the diaphragm cause movement of an attached coil of wire. A permanent
magnet produces a magnetic field that surrounds the coil, and the motion of the
coil within this field induces a current. A moving magnet transducer operates in a
similar fashion, except in this case the permanent magnet is coupled to the
diaphragm, and the coil is fixed. Pandey and Billingsley (1998) successfully
38
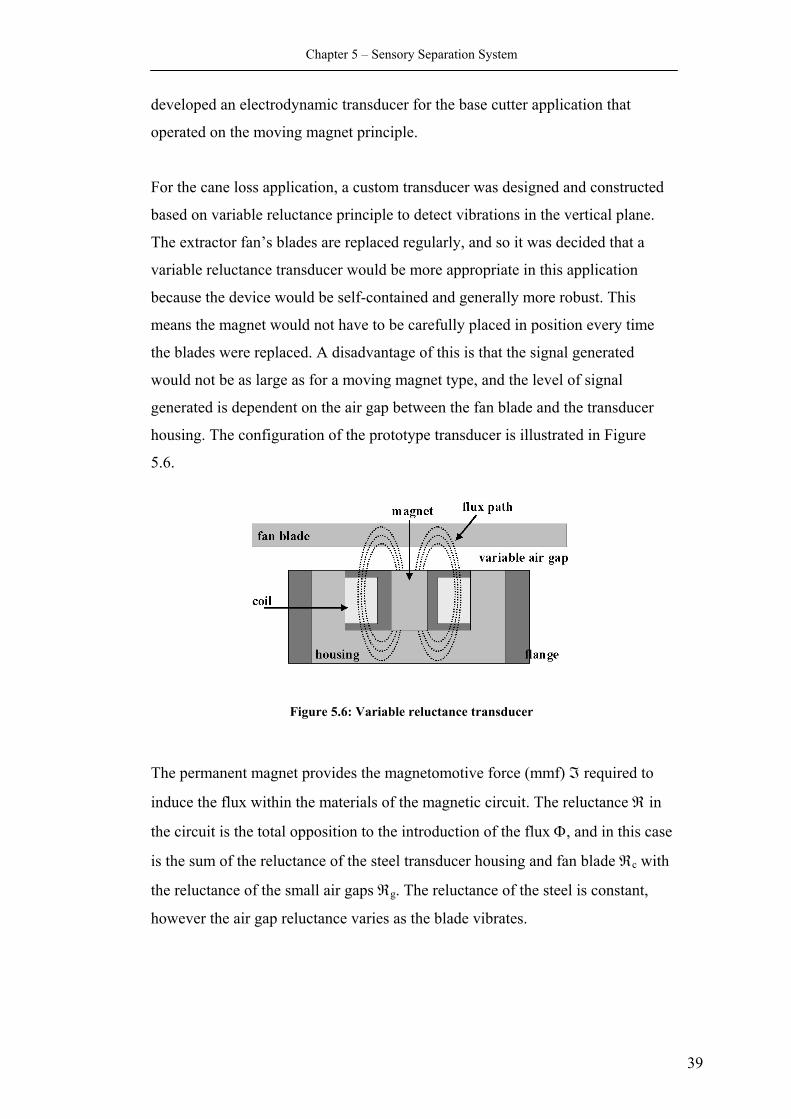
Chapter 5 – Sensory Separation System
developed an electrodynamic transducer for the base cutter application that
operated on the moving magnet principle.
For the cane loss application, a custom transducer was designed and constructed
based on variable reluctance principle to detect vibrations in the vertical plane.
The extractor fan’s blades are replaced regularly, and so it was decided that a
variable reluctance transducer would be more appropriate in this application
because the device would be self-contained and generally more robust. This
means the magnet would not have to be carefully placed in position every time
the blades were replaced. A disadvantage of this is that the signal generated
would not be as large as for a moving magnet type, and the level of signal
generated is dependent on the air gap between the fan blade and the transducer
housing. The configuration of the prototype transducer is illustrated in Figure
5.6.
Figure 5.6: Variable reluctance transducer
The permanent magnet provides the magnetomotive force (mmf) ℑ required to
induce the flux within the materials of the magnetic circuit. The reluctance ℜ in
the circuit is the total opposition to the introduction of the flux Φ, and in this case
is the sum of the reluctance of the steel transducer housing and fan blade ℜc with
the reluctance of the small air gaps ℜg. The reluctance of the steel is constant,
however the air gap reluctance varies as the blade vibrates.
39
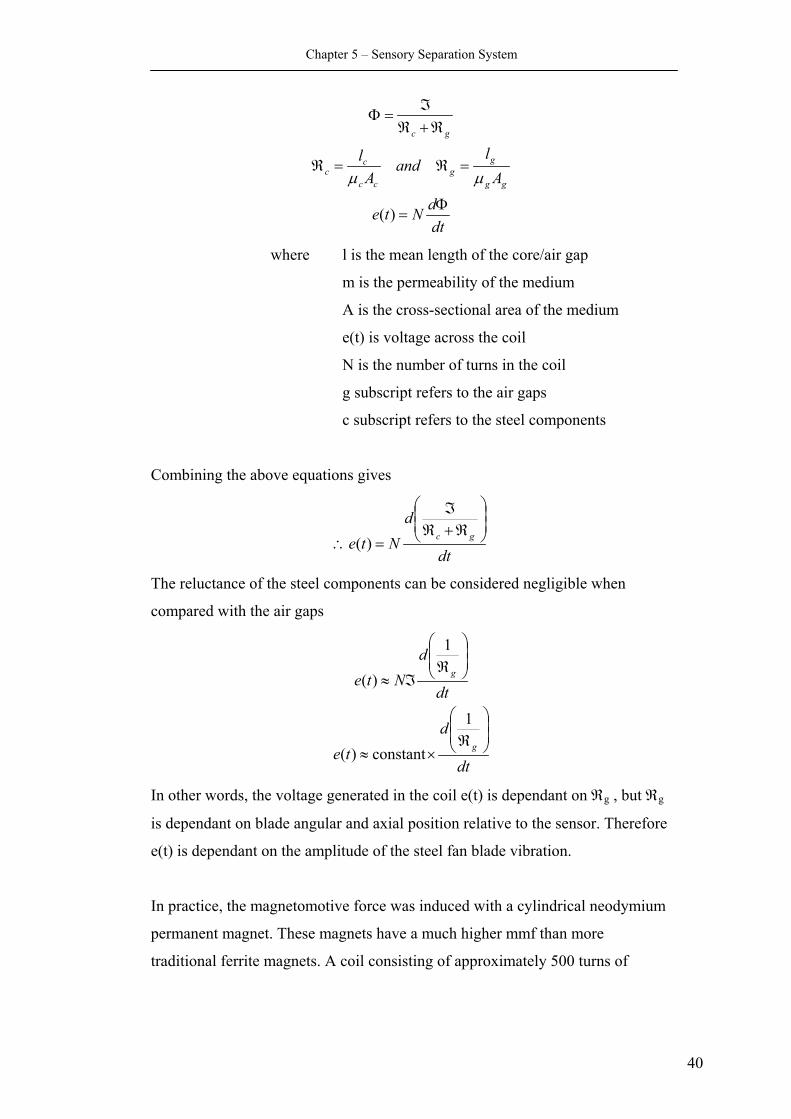
Chapter 5 – Sensory Separation System
dtdNte
Al
andA
l
gg
gg
cc
cc
gc
Φ=
=ℜ=ℜ
ℜ+ℜℑ
=Φ
)(
µµ
where l is the mean length of the core/air gap
m is the permeability of the medium
A is the cross-sectional area of the medium
e(t) is voltage across the coil
N is the number of turns in the coil
g subscript refers to the air gaps
c subscript refers to the steel components
Combining the above equations gives
dt
dNte gc
ℜ+ℜℑ
=∴ )(
The reluctance of the steel components can be considered negligible when
compared with the air gaps
dt
dte
dt
dNte
g
g
ℜ×≈
ℜℑ≈
1
constant)(
1
)(
In other words, the voltage generated in the coil e(t) is dependant on ℜg , but ℜg
is dependant on blade angular and axial position relative to the sensor. Therefore
e(t) is dependant on the amplitude of the steel fan blade vibration.
In practice, the magnetomotive force was induced with a cylindrical neodymium
permanent magnet. These magnets have a much higher mmf than more
traditional ferrite magnets. A coil consisting of approximately 500 turns of
40
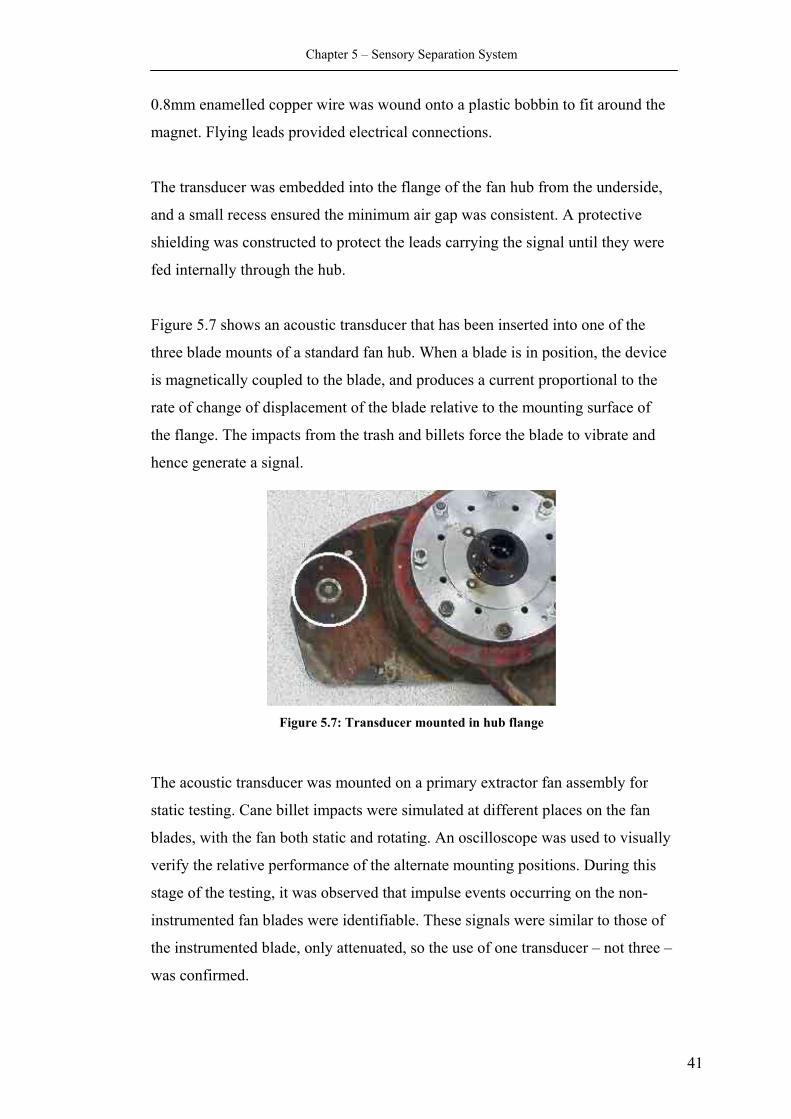
Chapter 5 – Sensory Separation System
0.8mm enamelled copper wire was wound onto a plastic bobbin to fit around the
magnet. Flying leads provided electrical connections.
The transducer was embedded into the flange of the fan hub from the underside,
and a small recess ensured the minimum air gap was consistent. A protective
shielding was constructed to protect the leads carrying the signal until they were
fed internally through the hub.
Figure 5.7 shows an acoustic transducer that has been inserted into one of the
three blade mounts of a standard fan hub. When a blade is in position, the device
is magnetically coupled to the blade, and produces a current proportional to the
rate of change of displacement of the blade relative to the mounting surface of
the flange. The impacts from the trash and billets force the blade to vibrate and
hence generate a signal.
Figure 5.7: Transducer mounted in hub flange
The acoustic transducer was mounted on a primary extractor fan assembly for
static testing. Cane billet impacts were simulated at different places on the fan
blades, with the fan both static and rotating. An oscilloscope was used to visually
verify the relative performance of the alternate mounting positions. During this
stage of the testing, it was observed that impulse events occurring on the non-
instrumented fan blades were identifiable. These signals were similar to those of
the instrumented blade, only attenuated, so the use of one transducer – not three –
was confirmed.
41
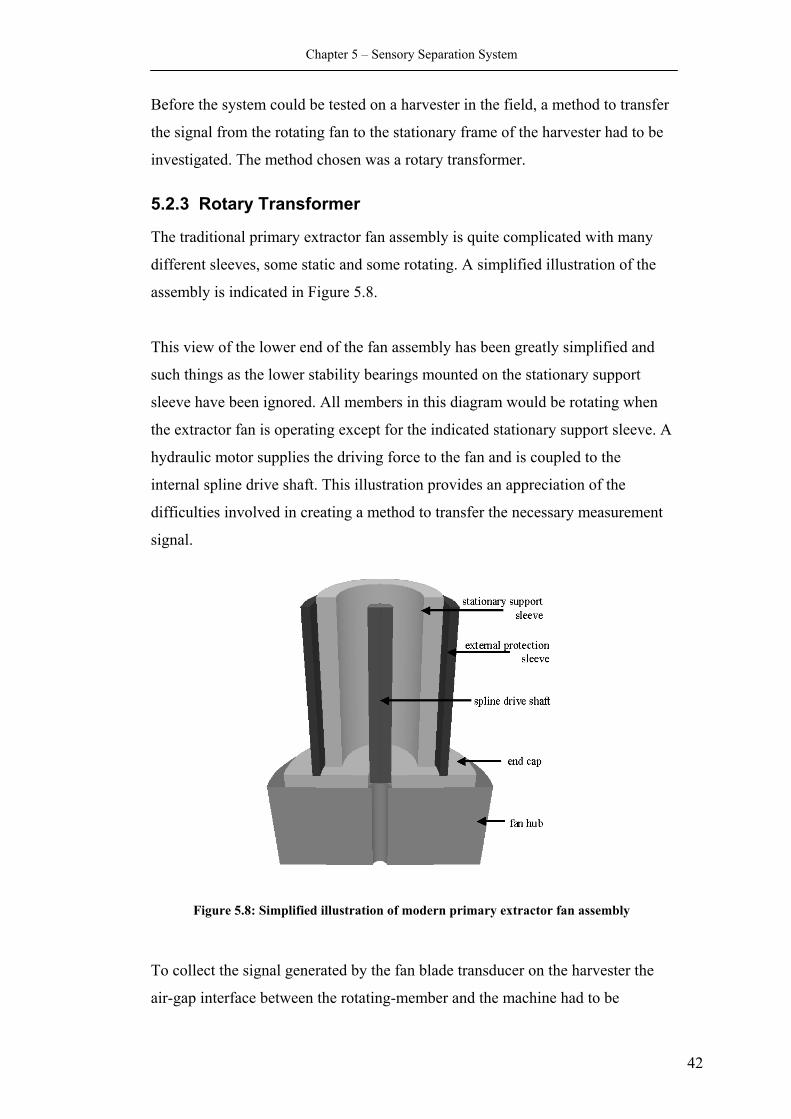
Chapter 5 – Sensory Separation System
Before the system could be tested on a harvester in the field, a method to transfer
the signal from the rotating fan to the stationary frame of the harvester had to be
investigated. The method chosen was a rotary transformer.
5.2.3 Rotary Transformer
The traditional primary extractor fan assembly is quite complicated with many
different sleeves, some static and some rotating. A simplified illustration of the
assembly is indicated in Figure 5.8.
This view of the lower end of the fan assembly has been greatly simplified and
such things as the lower stability bearings mounted on the stationary support
sleeve have been ignored. All members in this diagram would be rotating when
the extractor fan is operating except for the indicated stationary support sleeve. A
hydraulic motor supplies the driving force to the fan and is coupled to the
internal spline drive shaft. This illustration provides an appreciation of the
difficulties involved in creating a method to transfer the necessary measurement
signal.
Figure 5.8: Simplified illustration of modern primary extractor fan assembly
To collect the signal generated by the fan blade transducer on the harvester the
air-gap interface between the rotating-member and the machine had to be
42

Chapter 5 – Sensory Separation System
bridged. Many techniques are available to accomplish this, but in this case a
passively induced rotating transformer was selected. A rotating transformer is
simply a transformer that is constructed so that the primary can freely rotate
about the pick-off, or vice-versa. A great deal of experimentation and many
prototypes were attempted, and a selection of these will be presented in this
section.
In the research by Pandey and Billingsley (1998), a similar situation was
encountered. This work implemented a primary coil wrapped around the outside
surface of a cylindrical rotating member, and a signal was induced across to a
stationary pick-off that had a ‘c-shape’ that was beneficial to completing the
magnetic path. This method proved satisfactory, however in the extractor fan
case, other more efficient alternatives were considered to improve the level and
quality of the transferred signal.
Each rotary transformer prototype had some common design elements and these
will be briefly discussed here. In general terms, the transformer was considered
as two halves: a primary, and a secondary. The primary was always attached to
the rotating member, and hence also rotated. The primary loop was constructed
from 0.8mm enamelled copper wire – the same as the transducer - and the
number of turns required for maximum power transfer was calculated by
matching the transducer coil impedance to the load coil which in this case
doubles as the transformer primary coil.
= coil load ofLength coilprimary ofLength
PL
PL
LLPP
NRRN
NRNR
=
×=× ππ 22
where RP is the radius of the primary coil
RL is the radius of the load coil
NP is the number of turns of the primary coil
NL is the number of turns of the load coil
43
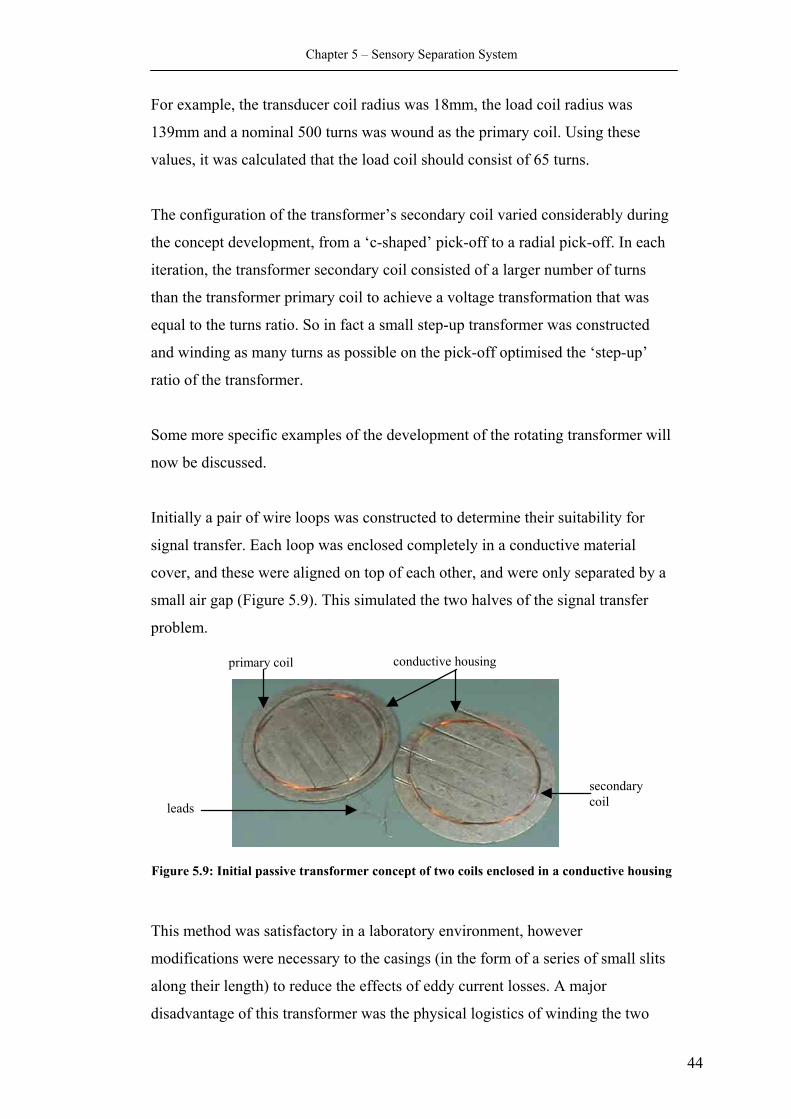
Chapter 5 – Sensory Separation System
For example, the transducer coil radius was 18mm, the load coil radius was
139mm and a nominal 500 turns was wound as the primary coil. Using these
values, it was calculated that the load coil should consist of 65 turns.
The configuration of the transformer’s secondary coil varied considerably during
the concept development, from a ‘c-shaped’ pick-off to a radial pick-off. In each
iteration, the transformer secondary coil consisted of a larger number of turns
than the transformer primary coil to achieve a voltage transformation that was
equal to the turns ratio. So in fact a small step-up transformer was constructed
and winding as many turns as possible on the pick-off optimised the ‘step-up’
ratio of the transformer.
Some more specific examples of the development of the rotating transformer will
now be discussed.
Initially a pair of wire loops was constructed to determine their suitability for
signal transfer. Each loop was enclosed completely in a conductive material
cover, and these were aligned on top of each other, and were only separated by a
small air gap (Figure 5.9). This simulated the two halves of the signal transfer
problem.
conductive housing primary coil
secondary coil leads
Figure 5.9: Initial passive transformer concept of two coils enclosed in a conductive housing
This method was satisfactory in a laboratory environment, however
modifications were necessary to the casings (in the form of a series of small slits
along their length) to reduce the effects of eddy current losses. A major
disadvantage of this transformer was the physical logistics of winding the two
44
Chapter 5 – Sensory Separation System
coils on location in a harvester. Also, this passive transformer did not provide
repeatable results, and the concept was not robust enough for the intended
environment.
The next configuration was the first to be tested in the harsh measuring
environment of the sugar cane harvester’s primary extraction chamber. It was
very similar to the original concept of winding the primary coil around the
exterior of the main shielding shaft on top of a ‘money-chain’ arrangement of
mumetal strips. Mumetal was selected because it was readily available at the
time of manufacture, and the result is illustrated in Figure 5.10. In this case the
secondary coil was a number of wire loops wrapped around a ‘c-shaped’
configuration of laminar strips taken from a small power transformer block. The
concept was to induce the signal across the gap by creating an almost complete
magnetic loop between the rotating mumetal strips across to the stationary pick-
off, similar to the magnetic path described in Figure 5.13.
In this very early case of the system, the transducer was embedded in the flange
of the hub, and the two fly leads were run up the exterior of the shielding shaft to
the contacts of the primary coil of the rotary transformer. The pick-off of the
transformer was suspended the necessary distance from the primary coil via a
protective cylindrical shield that was clamped to a small stationary lip at the top
of the extractor fan. This part of the instrumentation was completely sealed via
another disc shield that was clamped to the exterior of the shielding shaft, which
has not been illustrated here.
This method was not particularly robust and proved to be unreliable in the field.
The main reason was the failure of the external wire that ran directly from the
transducer to the primary winding contacts, despite the use of strong fasteners.
These trials were not completely hapless however, and a small amount of data
was collected, as well as a greater appreciation of the harshness of the measuring
environment.
45
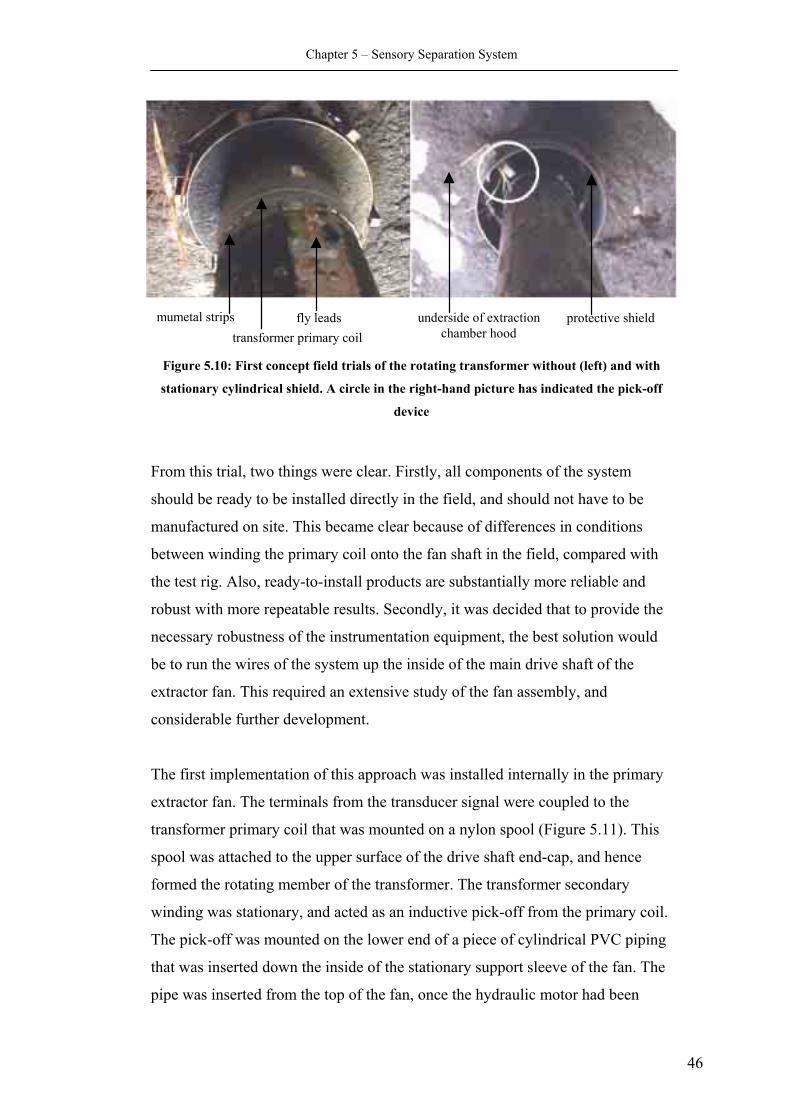
Chapter 5 – Sensory Separation System
mumetal strips transformer primary coil
fly leads underside of extraction chamber hood
protective shield
Figure 5.10: First concept field trials of the rotating transformer without (left) and with
stationary cylindrical shield. A circle in the right-hand picture has indicated the pick-off
device
From this trial, two things were clear. Firstly, all components of the system
should be ready to be installed directly in the field, and should not have to be
manufactured on site. This became clear because of differences in conditions
between winding the primary coil onto the fan shaft in the field, compared with
the test rig. Also, ready-to-install products are substantially more reliable and
robust with more repeatable results. Secondly, it was decided that to provide the
necessary robustness of the instrumentation equipment, the best solution would
be to run the wires of the system up the inside of the main drive shaft of the
extractor fan. This required an extensive study of the fan assembly, and
considerable further development.
The first implementation of this approach was installed internally in the primary
extractor fan. The terminals from the transducer signal were coupled to the
transformer primary coil that was mounted on a nylon spool (Figure 5.11). This
spool was attached to the upper surface of the drive shaft end-cap, and hence
formed the rotating member of the transformer. The transformer secondary
winding was stationary, and acted as an inductive pick-off from the primary coil.
The pick-off was mounted on the lower end of a piece of cylindrical PVC piping
that was inserted down the inside of the stationary support sleeve of the fan. The
pipe was inserted from the top of the fan, once the hydraulic motor had been
46
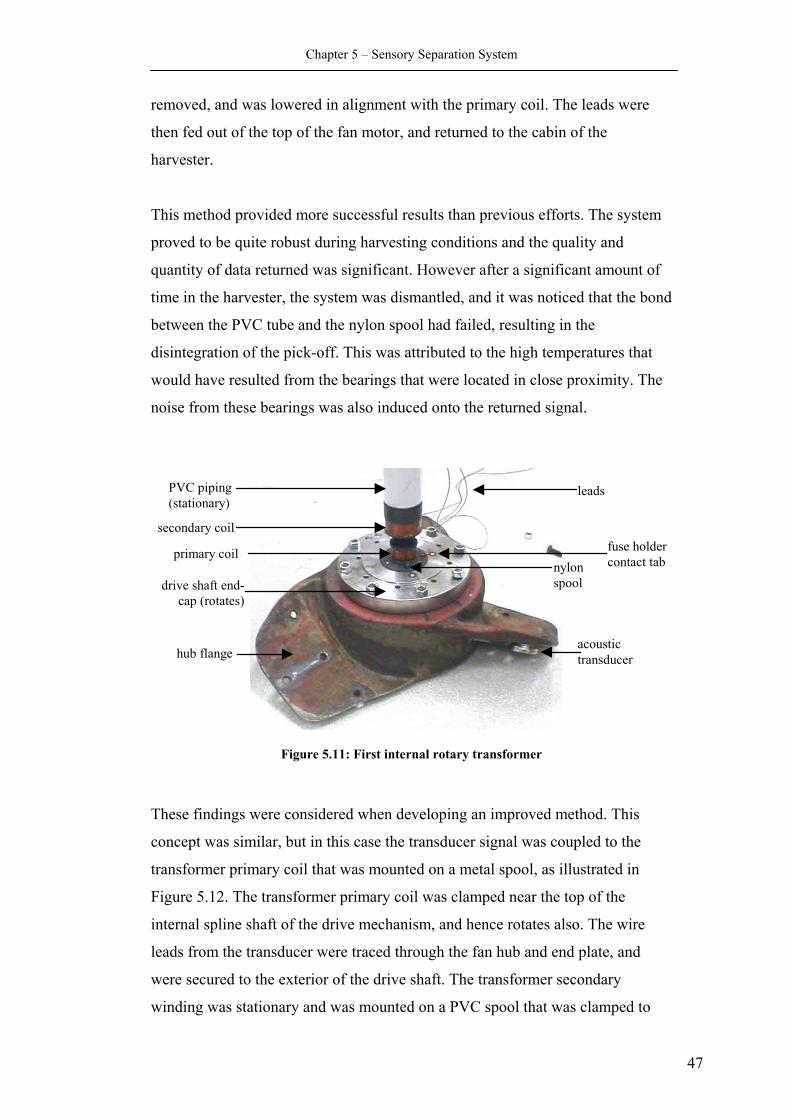
Chapter 5 – Sensory Separation System
removed, and was lowered in alignment with the primary coil. The leads were
then fed out of the top of the fan motor, and returned to the cabin of the
harvester.
This method provided more successful results than previous efforts. The system
proved to be quite robust during harvesting conditions and the quality and
quantity of data returned was significant. However after a significant amount of
time in the harvester, the system was dismantled, and it was noticed that the bond
between the PVC tube and the nylon spool had failed, resulting in the
disintegration of the pick-off. This was attributed to the high temperatures that
would have resulted from the bearings that were located in close proximity. The
noise from these bearings was also induced onto the returned signal.
acoustic transducer
nylon spool
primary coil
secondary coil
drive shaft end-cap (rotates)
leads PVC piping (stationary)
hub flange
fuse holder contact tab
Figure 5.11: First internal rotary transformer
These findings were considered when developing an improved method. This
concept was similar, but in this case the transducer signal was coupled to the
transformer primary coil that was mounted on a metal spool, as illustrated in
Figure 5.12. The transformer primary coil was clamped near the top of the
internal spline shaft of the drive mechanism, and hence rotates also. The wire
leads from the transducer were traced through the fan hub and end plate, and
were secured to the exterior of the drive shaft. The transformer secondary
winding was stationary and was mounted on a PVC spool that was clamped to
47
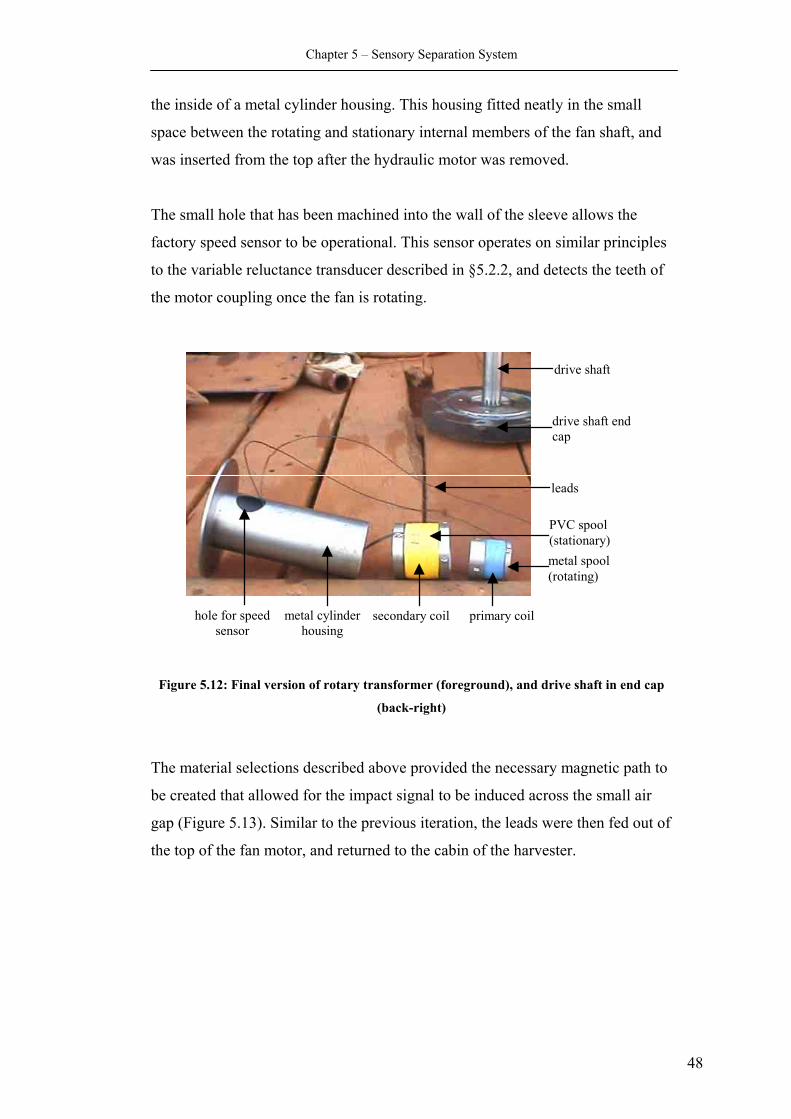
Chapter 5 – Sensory Separation System
the inside of a metal cylinder housing. This housing fitted neatly in the small
space between the rotating and stationary internal members of the fan shaft, and
was inserted from the top after the hydraulic motor was removed.
The small hole that has been machined into the wall of the sleeve allows the
factory speed sensor to be operational. This sensor operates on similar principles
to the variable reluctance transducer described in §5.2.2, and detects the teeth of
the motor coupling once the fan is rotating.
drive shaft
drive shaft end cap
leads
secondary coil
PVC spool (stationary)
primary coil
metal spool (rotating)
metal cylinder housing
hole for speed sensor
Figure 5.12: Final version of rotary transformer (foreground), and drive shaft in end cap
(back-right)
The material selections described above provided the necessary magnetic path to
be created that allowed for the impact signal to be induced across the small air
gap (Figure 5.13). Similar to the previous iteration, the leads were then fed out of
the top of the fan motor, and returned to the cabin of the harvester.
48
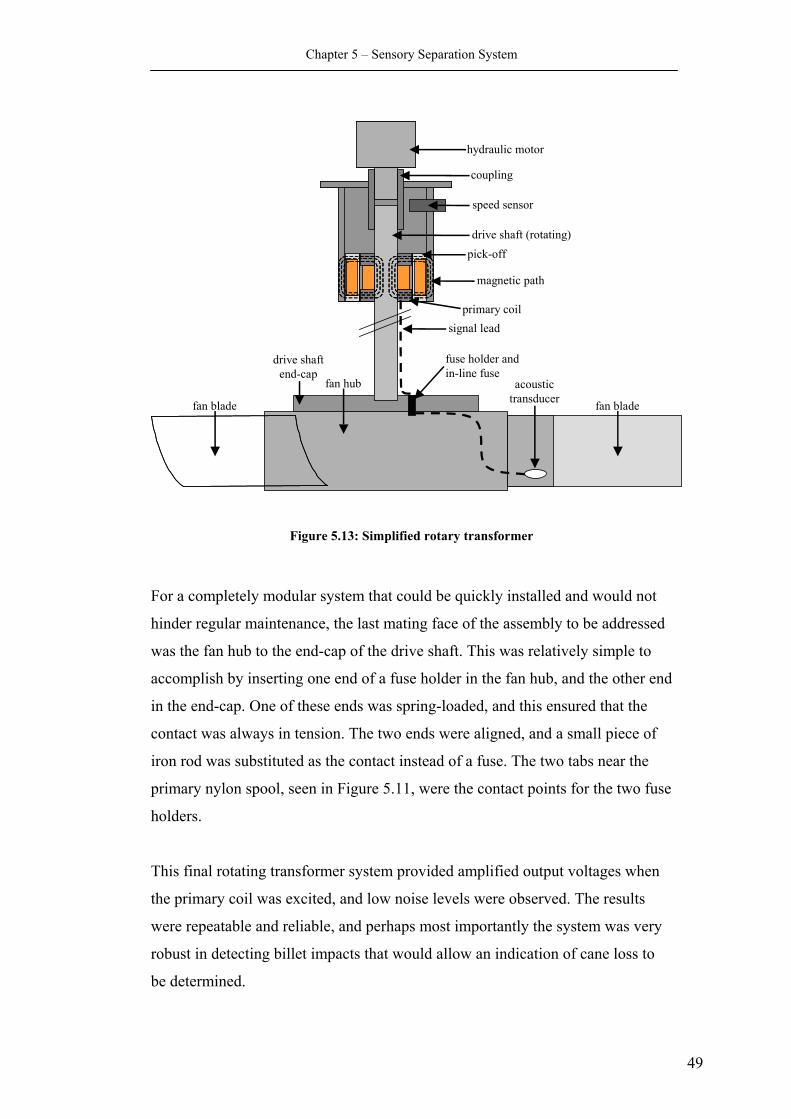
Chapter 5 – Sensory Separation System
hydraulic motor
coupling
speed sensor
drive shaft (rotating)pick-off
magnetic path
primary coil
acoustic transducer fan bladefan blade
drive shaft end-cap
fan hub
signal lead
fuse holder and in-line fuse
Figure 5.13: Simplified rotary transformer
For a completely modular system that could be quickly installed and would not
hinder regular maintenance, the last mating face of the assembly to be addressed
was the fan hub to the end-cap of the drive shaft. This was relatively simple to
accomplish by inserting one end of a fuse holder in the fan hub, and the other end
in the end-cap. One of these ends was spring-loaded, and this ensured that the
contact was always in tension. The two ends were aligned, and a small piece of
iron rod was substituted as the contact instead of a fuse. The two tabs near the
primary nylon spool, seen in Figure 5.11, were the contact points for the two fuse
holders.
This final rotating transformer system provided amplified output voltages when
the primary coil was excited, and low noise levels were observed. The results
were repeatable and reliable, and perhaps most importantly the system was very
robust in detecting billet impacts that would allow an indication of cane loss to
be determined.
49
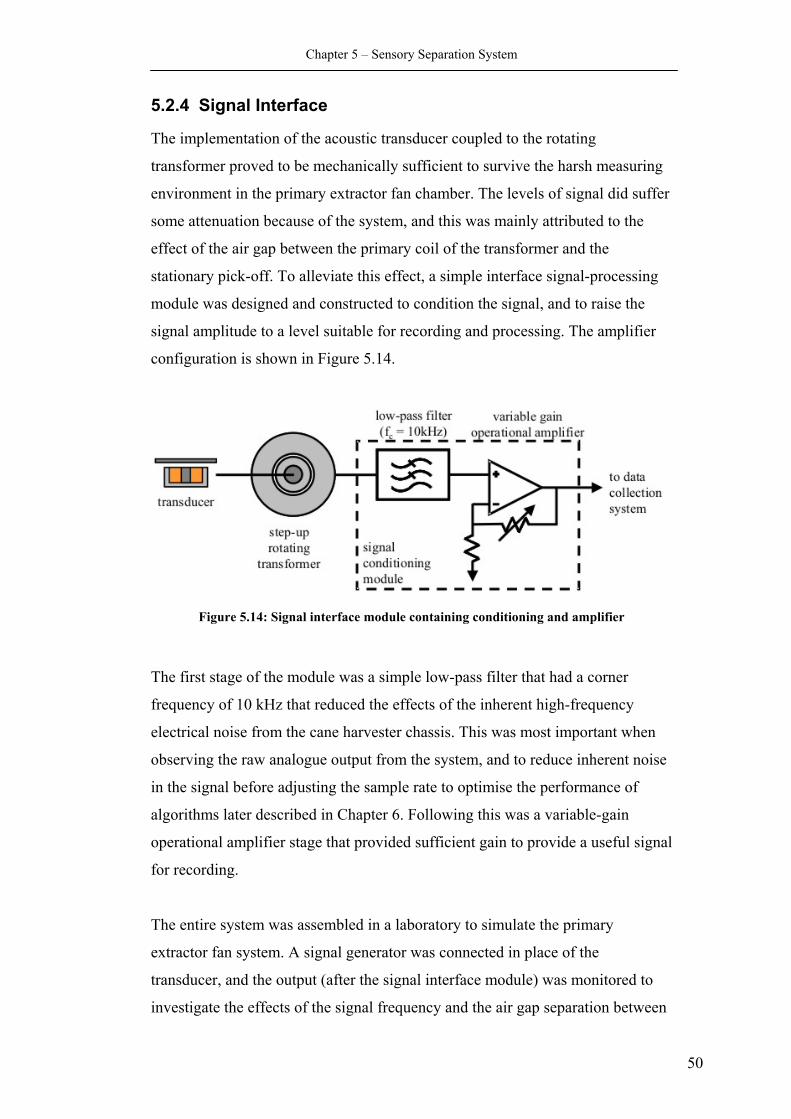
Chapter 5 – Sensory Separation System
5.2.4 Signal Interface
The implementation of the acoustic transducer coupled to the rotating
transformer proved to be mechanically sufficient to survive the harsh measuring
environment in the primary extractor fan chamber. The levels of signal did suffer
some attenuation because of the system, and this was mainly attributed to the
effect of the air gap between the primary coil of the transformer and the
stationary pick-off. To alleviate this effect, a simple interface signal-processing
module was designed and constructed to condition the signal, and to raise the
signal amplitude to a level suitable for recording and processing. The amplifier
configuration is shown in Figure 5.14.
Figure 5.14: Signal interface module containing conditioning and amplifier
The first stage of the module was a simple low-pass filter that had a corner
frequency of 10 kHz that reduced the effects of the inherent high-frequency
electrical noise from the cane harvester chassis. This was most important when
observing the raw analogue output from the system, and to reduce inherent noise
in the signal before adjusting the sample rate to optimise the performance of
algorithms later described in Chapter 6. Following this was a variable-gain
operational amplifier stage that provided sufficient gain to provide a useful signal
for recording.
The entire system was assembled in a laboratory to simulate the primary
extractor fan system. A signal generator was connected in place of the
transducer, and the output (after the signal interface module) was monitored to
investigate the effects of the signal frequency and the air gap separation between
50
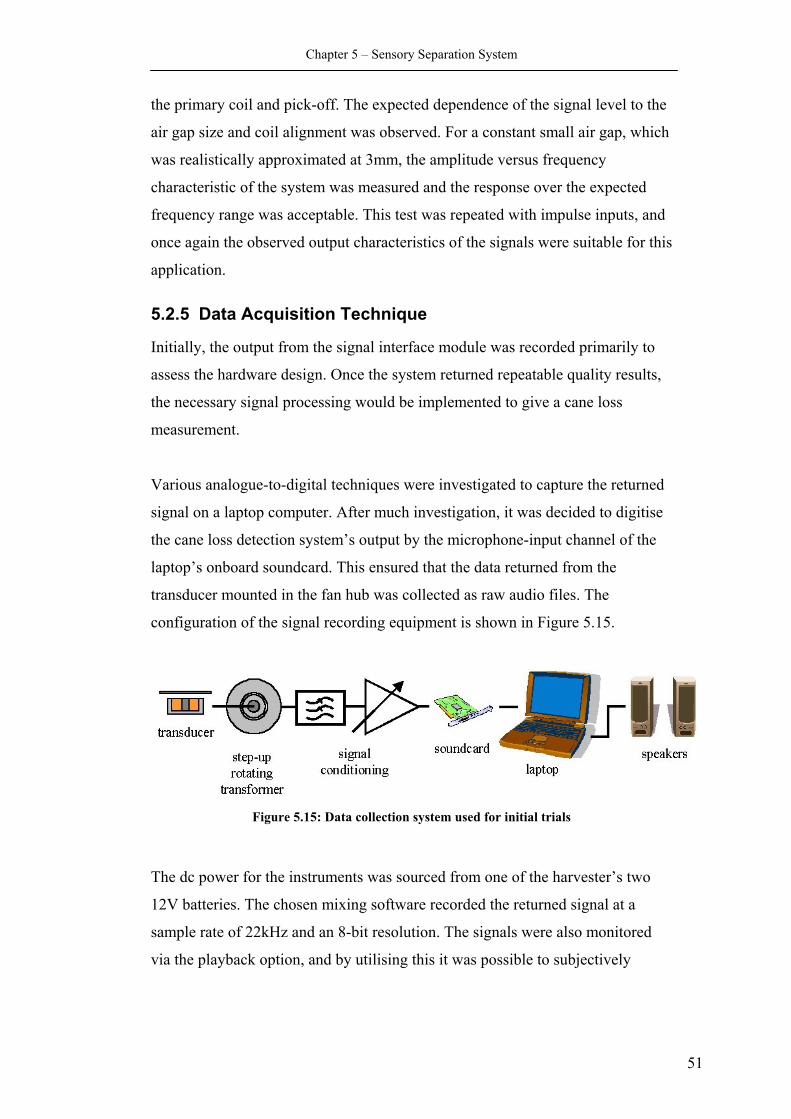
Chapter 5 – Sensory Separation System
the primary coil and pick-off. The expected dependence of the signal level to the
air gap size and coil alignment was observed. For a constant small air gap, which
was realistically approximated at 3mm, the amplitude versus frequency
characteristic of the system was measured and the response over the expected
frequency range was acceptable. This test was repeated with impulse inputs, and
once again the observed output characteristics of the signals were suitable for this
application.
5.2.5 Data Acquisition Technique
Initially, the output from the signal interface module was recorded primarily to
assess the hardware design. Once the system returned repeatable quality results,
the necessary signal processing would be implemented to give a cane loss
measurement.
Various analogue-to-digital techniques were investigated to capture the returned
signal on a laptop computer. After much investigation, it was decided to digitise
the cane loss detection system’s output by the microphone-input channel of the
laptop’s onboard soundcard. This ensured that the data returned from the
transducer mounted in the fan hub was collected as raw audio files. The
configuration of the signal recording equipment is shown in Figure 5.15.
Figure 5.15: Data collection system used for initial trials
The dc power for the instruments was sourced from one of the harvester’s two
12V batteries. The chosen mixing software recorded the returned signal at a
sample rate of 22kHz and an 8-bit resolution. The signals were also monitored
via the playback option, and by utilising this it was possible to subjectively
51

Chapter 5 – Sensory Separation System
discriminate both visually and aurally billet impacts from trash and ambient
noise under different harvesting conditions.
5.3 Chapter Summary An improved method of assessing cane loss has been described in which cane
billet impacts on the primary extractor fan blades are detected by an audio
transducer. The signals from this transducer are coupled from the moving blades
to the stationary frame, where these signals are collected for analysis.
52
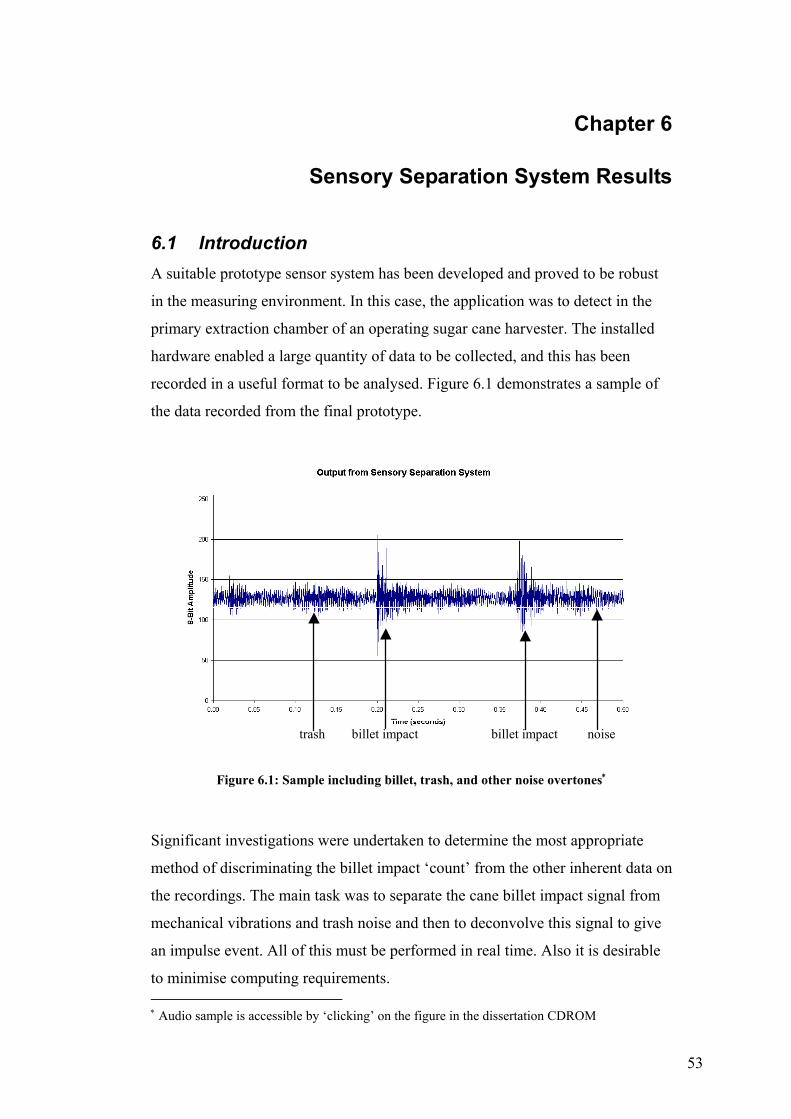
Chapter 6
Sensory Separation System Results
6.1 Introduction A suitable prototype sensor system has been developed and proved to be robust
in the measuring environment. In this case, the application was to detect in the
primary extraction chamber of an operating sugar cane harvester. The installed
hardware enabled a large quantity of data to be collected, and this has been
recorded in a useful format to be analysed. Figure 6.1 demonstrates a sample of
the data recorded from the final prototype.
noise billet impact billet impact trash
Figure 6.1: Sample including billet, trash, and other noise overtones∗
Significant investigations were undertaken to determine the most appropriate
method of discriminating the billet impact ‘count’ from the other inherent data on
the recordings. The main task was to separate the cane billet impact signal from
mechanical vibrations and trash noise and then to deconvolve this signal to give
53
an impulse event. All of this must be performed in real time. Also it is desirable
to minimise computing requirements. ∗ Audio sample is accessible by ‘clicking’ on the figure in the dissertation CDROM
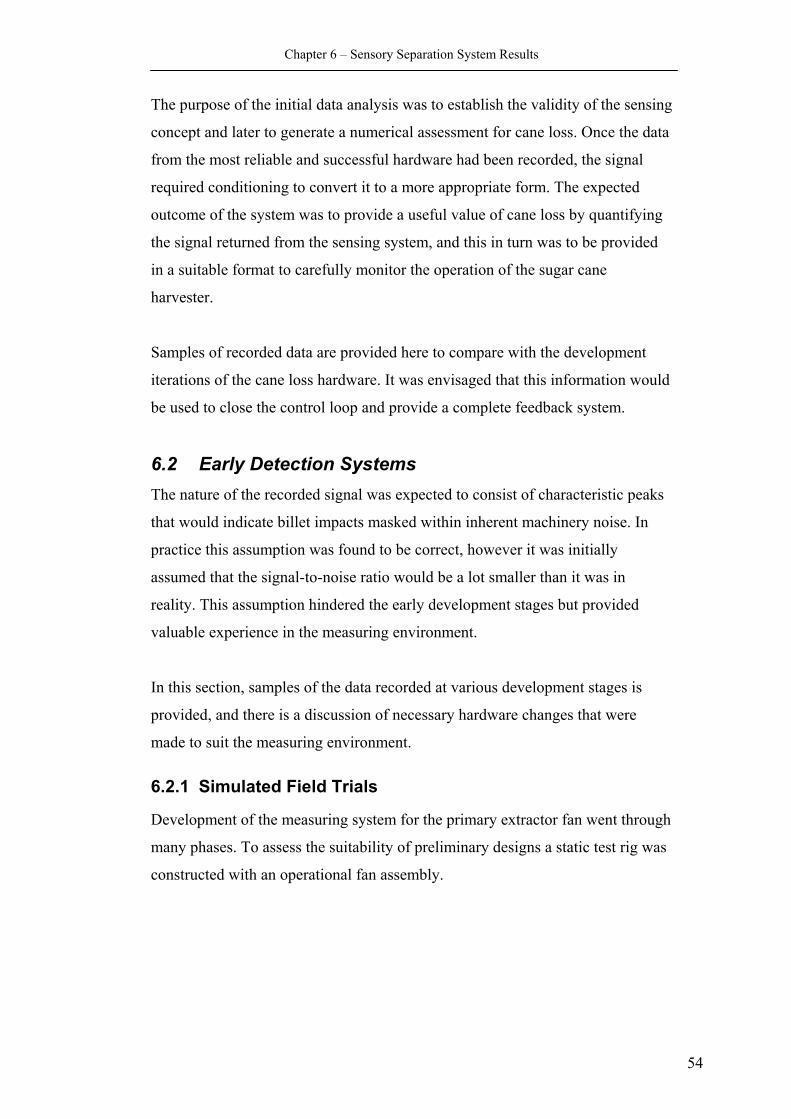
Chapter 6 – Sensory Separation System Results
The purpose of the initial data analysis was to establish the validity of the sensing
concept and later to generate a numeric
al assessment for cane loss. Once the data
g
d
recorded data are provided here to compare with the development
erations of the cane loss hardware. It was envisaged that this information would
he nature of the recorded signal was expected to consist of characteristic peaks
ithin inherent machinery noise. In
ed
us development stages is
rovided, and there is a discussion of necessary hardware changes that were
Development of the measuring system for the primary extractor fan went through
inary designs a static test rig was
from the most reliable and successful hardware had been recorded, the signal
required conditioning to convert it to a more appropriate form. The expected
outcome of the system was to provide a useful value of cane loss by quantifyin
the signal returned from the sensing system, and this in turn was to be provide
in a suitable format to carefully monitor the operation of the sugar cane
harvester.
Samples of
it
be used to close the control loop and provide a complete feedback system.
6.2 Early Detection Systems T
that would indicate billet impacts masked w
practice this assumption was found to be correct, however it was initially
assumed that the signal-to-noise ratio would be a lot smaller than it was in
reality. This assumption hindered the early development stages but provid
valuable experience in the measuring environment.
In this section, samples of the data recorded at vario
p
made to suit the measuring environment.
6.2.1 Simulated Field Trials
many phases. To assess the suitability of prelim
constructed with an operational fan assembly.
54
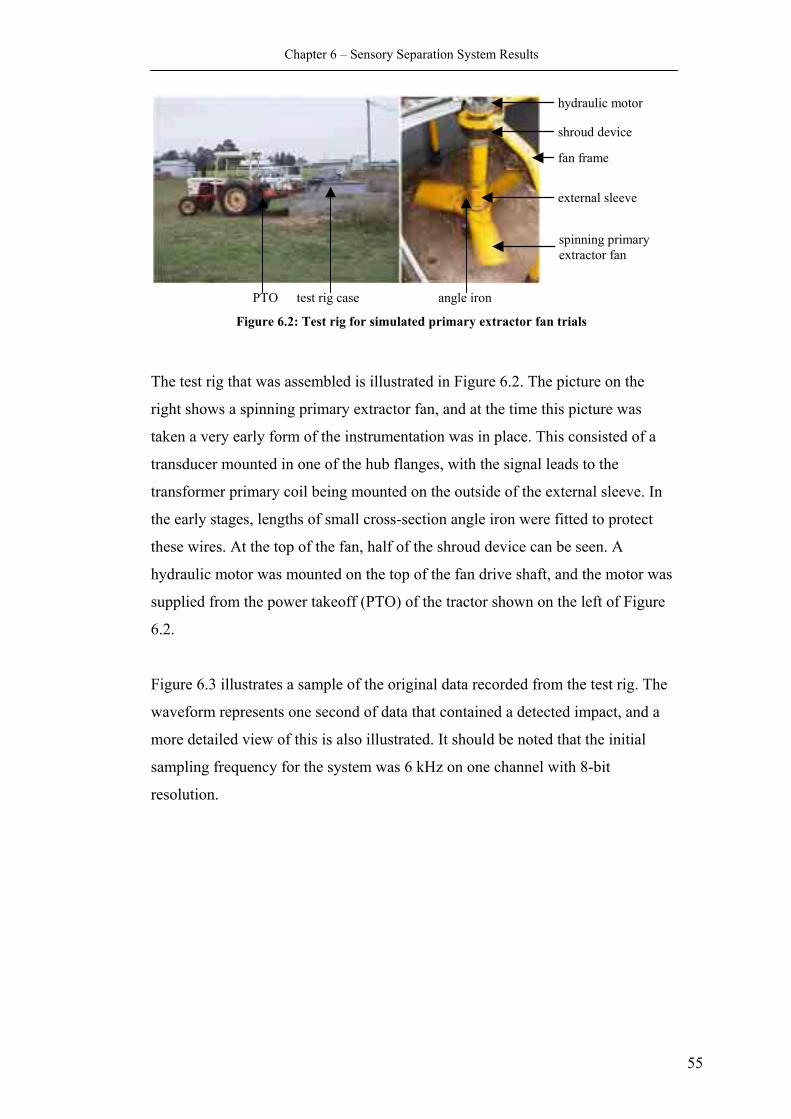
Chapter 6 – Sensory Separation System Results
spinning primary extractor fan
shroud device
hydraulic motor
external sleeve
fan frame
PTO angle iron test rig case
Figure 6.2: Test rig for simulated primary extractor fan trials
The test rig that was assembled is illustrated in Figure 6.2. The picture on the
right shows a spinning primary extractor fan, and at the time this picture was
taken a very early form of the instrumentation was in place. This consisted of a
transducer mounted in one of the hub flanges, with the signal leads to the
transformer primary coil being mounted on the outside of the external sleeve. In
the early stages, lengths of small cross-section angle iron were fitted to protect
these wires. At the top of the fan, half of the shroud device can be seen. A
hydraulic motor was mounted on the top of the fan drive shaft, and the motor was
supplied from the power takeoff (PTO) of the tractor shown on the left of Figure
6.2.
Figure 6.3 illustrates a sample of the original data recorded from the test rig. The
waveform represents one second of data that contained a detected impact, and a
more detailed view of this is also illustrated. It should be noted that the initial
sampling frequency for the system was 6 kHz on one channel with 8-bit
resolution.
55
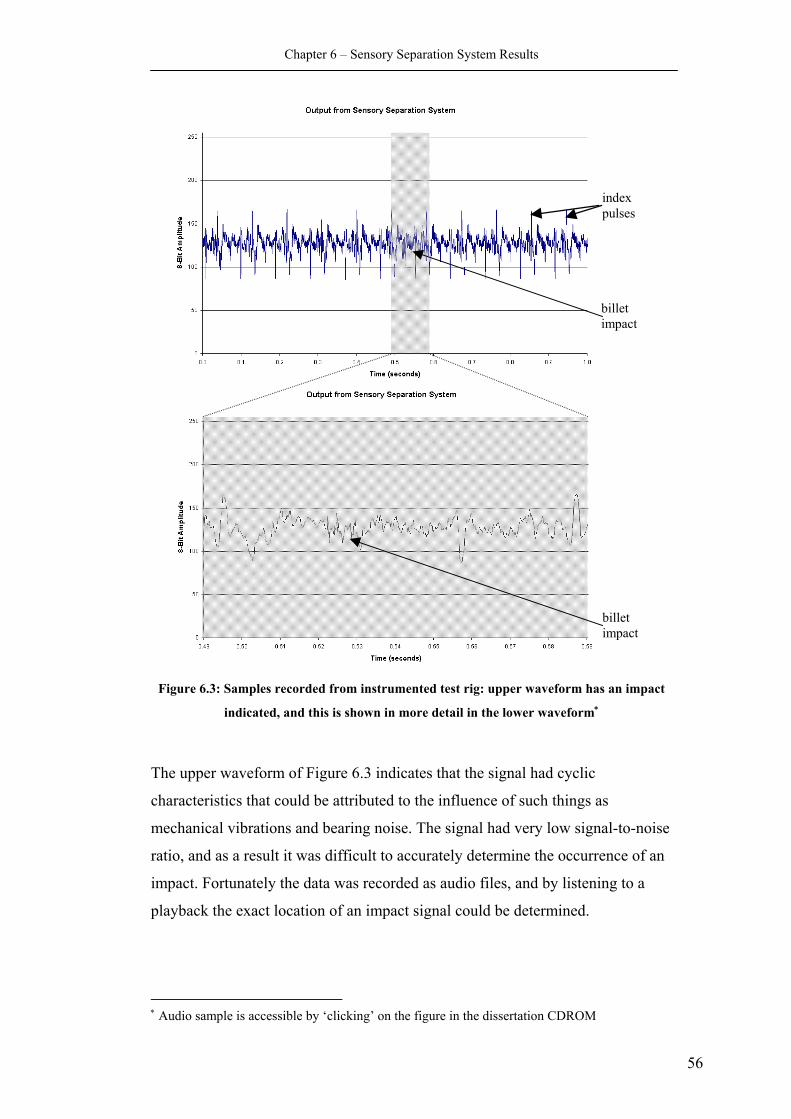
Chapter 6 – Sensory Separation System Results
Figure 6.3: Samples recorded from instrumented test rig: upper waveform has an impact
indicated, and this is shown in more detail in the lower waveform∗
The upper waveform of Figure 6.3 indicates that the signal had cyclic
characteristics that could be attributed to the influence of such things as
mechanical vibrations and bearing noise. The signal had very low signal-to-noise
ratio, and as a result it was difficult to accurately determine the occurrence of an
impact. Fortunately the data was recorded as audio files, and by listening to a
playback the exact location of an impact signal could be determined.
index pulses
billet impact
billet impact
∗ Audio sample is accessible by ‘clicking’ on the figure in the dissertation CDROM
56
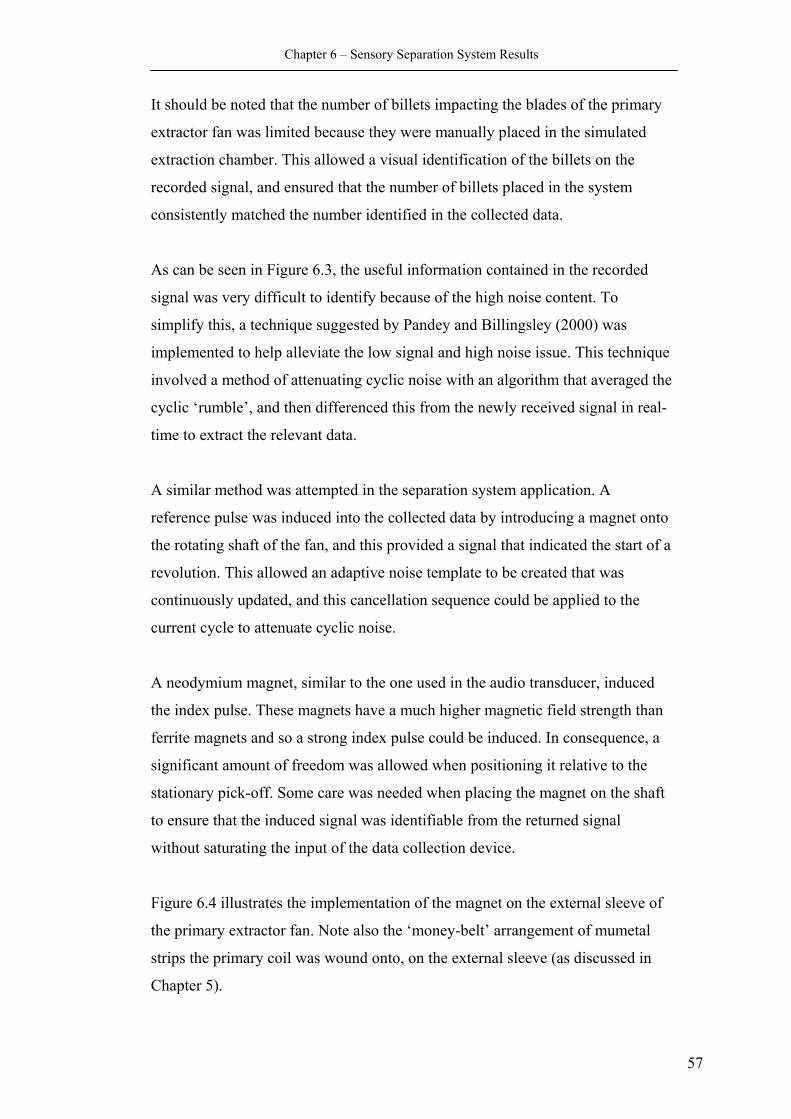
Chapter 6 – Sensory Separation System Results
It should be noted that the number of billets impacting the blades of the primary
extractor fan was limited because they were manually placed in the simulated
extraction chamber. This allowed a visual identification of the billets on the
recorded signal, and ensured that the number of billets placed in the system
consistently matched the number identified in the collected data.
As can be seen in Figure 6.3, the useful information contained in the recorded
signal was very difficult to identify because of the high noise content. To
simplify this, a technique suggested by Pandey and Billingsley (2000) was
implemented to help alleviate the low signal and high noise issue. This technique
involved a method of attenuating cyclic noise with an algorithm that averaged the
cyclic ‘rumble’, and then differenced this from the newly received signal in real-
time to extract the relevant data.
A similar method was attempted in the separation system application. A
reference pulse was induced into the collected data by introducing a magnet onto
the rotating shaft of the fan, and this provided a signal that indicated the start of a
revolution. This allowed an adaptive noise template to be created that was
continuously updated, and this cancellation sequence could be applied to the
current cycle to attenuate cyclic noise.
A neodymium magnet, similar to the one used in the audio transducer, induced
the index pulse. These magnets have a much higher magnetic field strength than
ferrite magnets and so a strong index pulse could be induced. In consequence, a
significant amount of freedom was allowed when positioning it relative to the
stationary pick-off. Some care was needed when placing the magnet on the shaft
to ensure that the induced signal was identifiable from the returned signal
without saturating the input of the data collection device.
Figure 6.4 illustrates the implementation of the magnet on the external sleeve of
the primary extractor fan. Note also the ‘money-belt’ arrangement of mumetal
strips the primary coil was wound onto, on the external sleeve (as discussed in
Chapter 5).
57
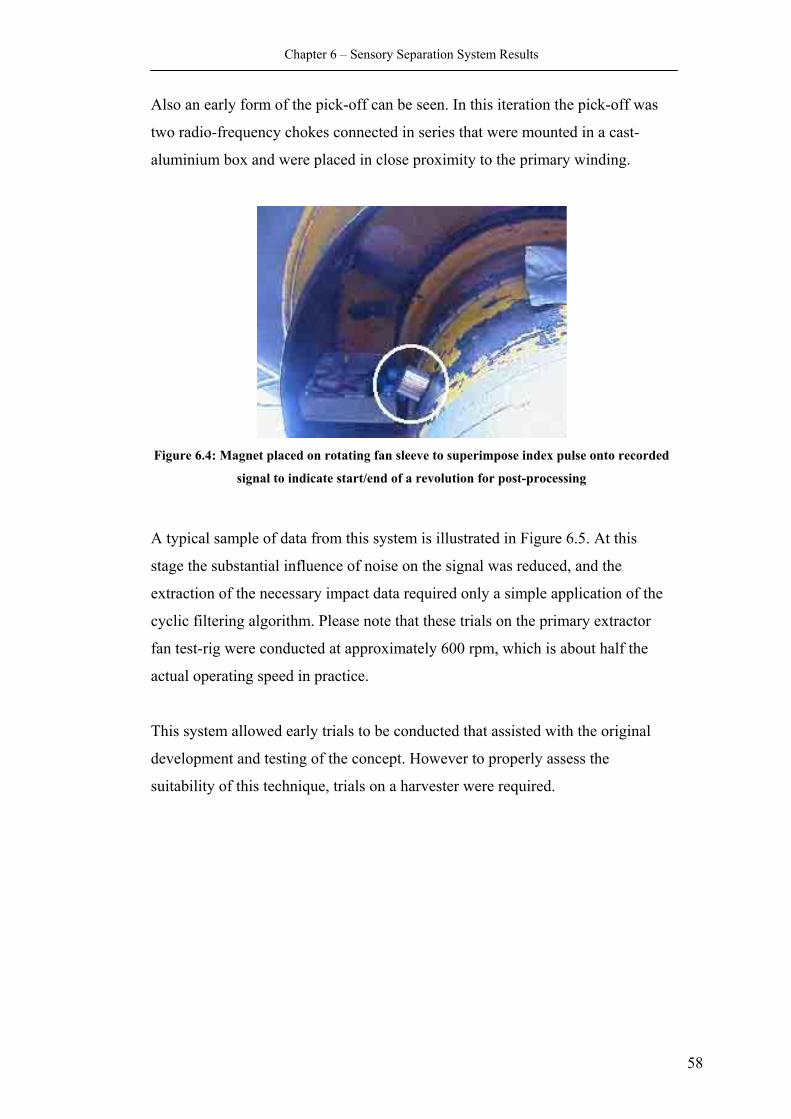
Chapter 6 – Sensory Separation System Results
Also an early form of the pick-off can be seen. In this iteration the pick-off was
two radio-frequency chokes connected in series that were mounted in a cast-
aluminium box and were placed in close proximity to the primary winding.
Figure 6.4: Magnet placed on rotating fan sleeve to superimpose index pulse onto recorded
signal to indicate start/end of a revolution for post-processing
A typical sample of data from this system is illustrated in Figure 6.5. At this
stage the substantial influence of noise on the signal was reduced, and the
extraction of the necessary impact data required only a simple application of the
cyclic filtering algorithm. Please note that these trials on the primary extractor
fan test-rig were conducted at approximately 600 rpm, which is about half the
actual operating speed in practice.
This system allowed early trials to be conducted that assisted with the original
development and testing of the concept. However to properly assess the
suitability of this technique, trials on a harvester were required.
58
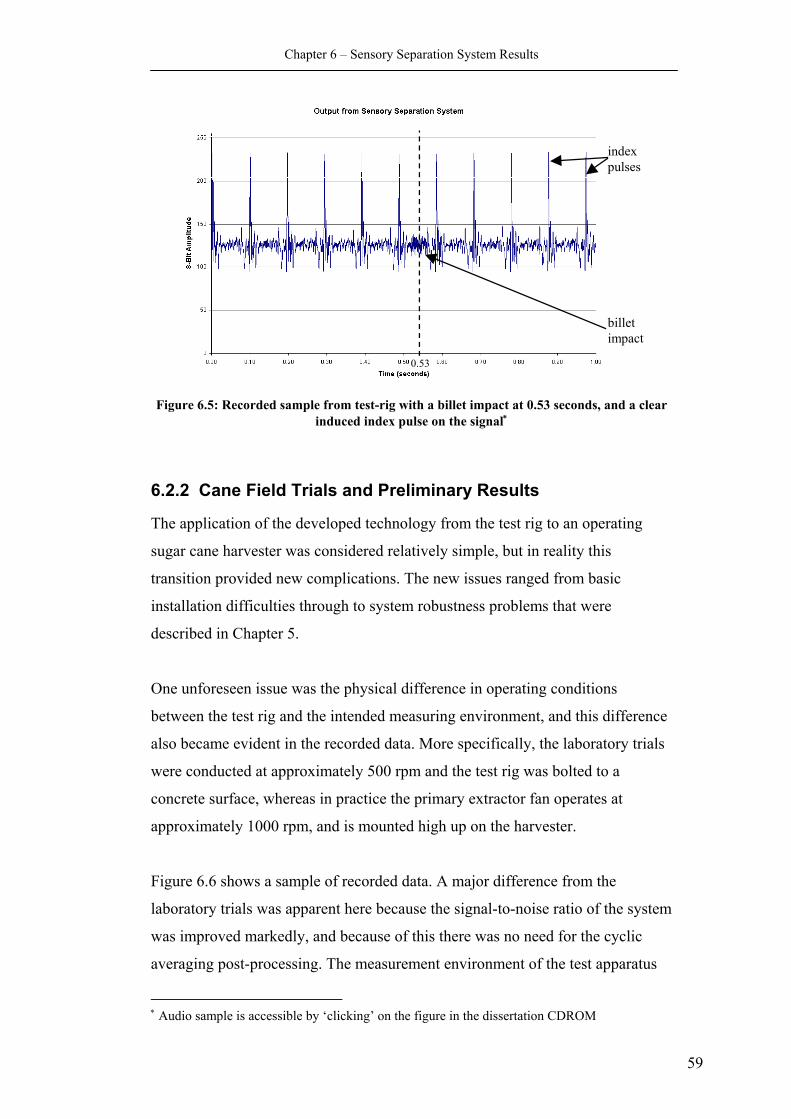
Chapter 6 – Sensory Separation System Results
Figure 6.5: Recorded sample from test-rig with a billet impact at 0.53 seconds, and a clear induced index pulse on the signal∗
6.2.2 Cane Field Trials and Preliminary Results
The application of the developed technology from the test rig to an operating
sugar cane harvester was considered relatively simple, but in reality this
transition provided new complications. The new issues ranged from basic
installation difficulties through to system robustness problems that were
described in Chapter 5.
One unforeseen issue was the physical difference in operating conditions
between the test rig and the intended measuring environment, and this difference
also became evident in the recorded data. More specifically, the laboratory trials
were conducted at approximately 500 rpm and the test rig was bolted to a
concrete surface, whereas in practice the primary extractor fan operates at
approximately 1000 rpm, and is mounted high up on the harvester.
Figure 6.6 shows a sample of recorded data. A major difference from the
laboratory trials was apparent here because the signal-to-noise ratio of the system
was improved markedly, and because of this there was no need for the cyclic
averaging post-processing. The measurement environment of the test apparatus
0.53
index pulses
billet impact
59
∗ Audio sample is accessible by ‘clicking’ on the figure in the dissertation CDROM
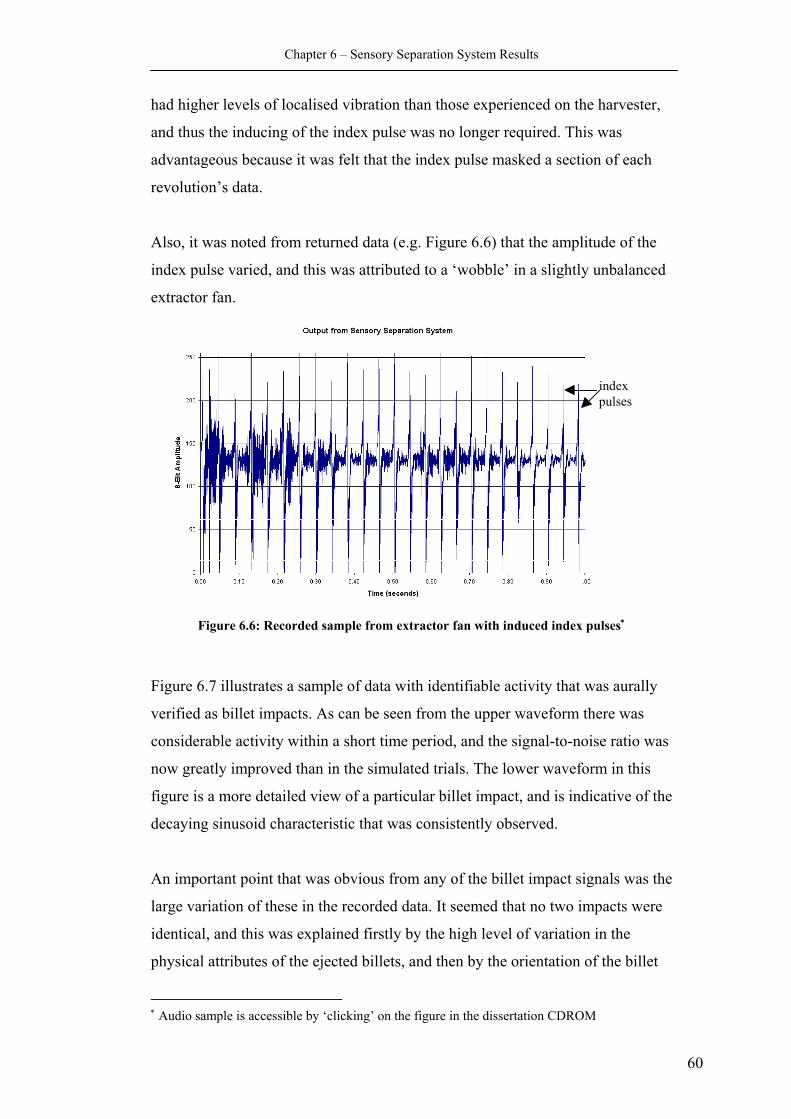
Chapter 6 – Sensory Separation System Results
had higher levels of localised vibration than those experienced on the harvester,
and thus the inducing of the index pulse was no longer required. This was
advantageous because it was felt that the index pulse masked a section of each
revolution’s data.
Also, it was noted from returned data (e.g. Figure 6.6) that the amplitude of the
index pulse varied, and this was attributed to a ‘wobble’ in a slightly unbalanced
extractor fan.
index pulses
Figure 6.6: Recorded sample from extractor fan with induced index pulses∗
Figure 6.7 illustrates a sample of data with identifiable activity that was aurally
verified as billet impacts. As can be seen from the upper waveform there was
considerable activity within a short time period, and the signal-to-noise ratio was
now greatly improved than in the simulated trials. The lower waveform in this
figure is a more detailed view of a particular billet impact, and is indicative of the
decaying sinusoid characteristic that was consistently observed.
An important point that was obvious from any of the billet impact signals was the
large variation of these in the recorded data. It seemed that no two impacts were
identical, and this was explained firstly by the high level of variation in the
physical attributes of the ejected billets, and then by the orientation of the billet
60
∗ Audio sample is accessible by ‘clicking’ on the figure in the dissertation CDROM
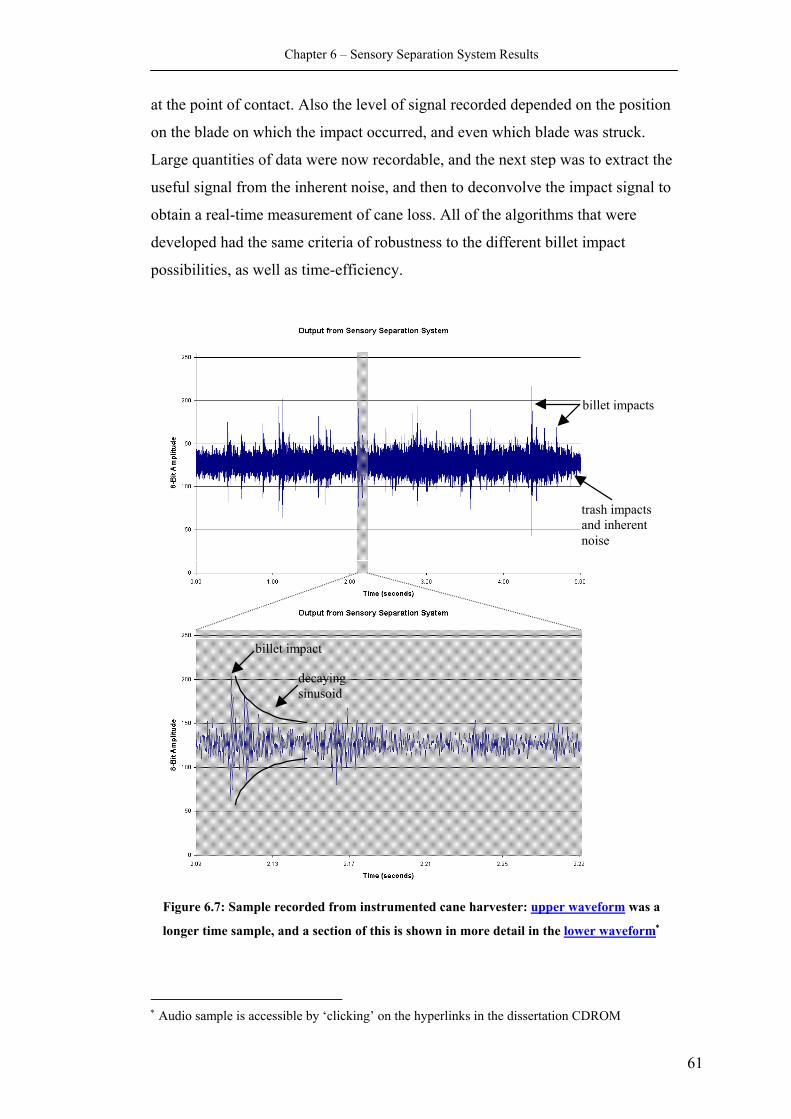
Chapter 6 – Sensory Separation System Results
at the point of contact. Also the level of signal recorded depended on the position
on the blade on which the impact occurred, and even which blade was struck.
Large quantities of data were now recordable, and the next step was to extract the
useful signal from the inherent noise, and then to deconvolve the impact signal to
obtain a real-time measurement of cane loss. All of the algorithms that were
developed had the same criteria of robustness to the different billet impact
possibilities, as well as time-efficiency.
billet impacts
trash impacts and inherent noise
billet impact
decaying sinusoid
Figure 6.7: Sample recorded from instrumented cane harvester: upper waveform was a
longer time sample, and a section of this is shown in more detail in the lower waveform∗
∗ Audio sample is accessible by ‘clicking’ on the hyperlinks in the dissertation CDROM
61
Chapter 6 – Sensory Separation System Results
6.3 Frequency Analysis of Sensory Separation System The resonant nature of the billet impact signal has been identified both in the
theoretical calculation of the natural frequency of a fan blade in Chapter 5, and in
the samples of collected data that have been included in the previous section of
this chapter.
The high level of oscillation that was characteristic of a billet impact provided an
interesting deconvolution problem. Ideally the signal that provided the measure
of cane loss should be an impulse with minimal noise content. However the high
levels of vibration that occurred in the measuring environment complicated the
extraction of the useful signal from the collected data. The initial analysis of the
numerous noise components on the recorded data was difficult in the time
domain, but fortunately this was much simpler in the frequency domain.
It should be noted that once the design of the sensory separation system started to
consistently return quality data, the sample rate of the recorded data was
increased to 22 kHz on one channel with an 8-bit resolution. The higher sampling
rate increased the Nyquist frequency, and this allowed a broader view of the
signal. If more detail was required at lower frequencies, the resolution of the
sample’s spectrum was increased by down sampling with desktop audio-
processing software.
Figure 6.8 shows the test sample that was used for a majority of the signal
analyses. This sample was selected because it contained what was judged to be
the three most likely circumstances to be present in the recorded data: billet
impact, trash noise, and engine noise. The different noises were discriminated
visually, and were objectively classified by their amplitude, intensity and
duration. This sample will be illustrated wherever appropriate in the following
discussion for convenience.
62
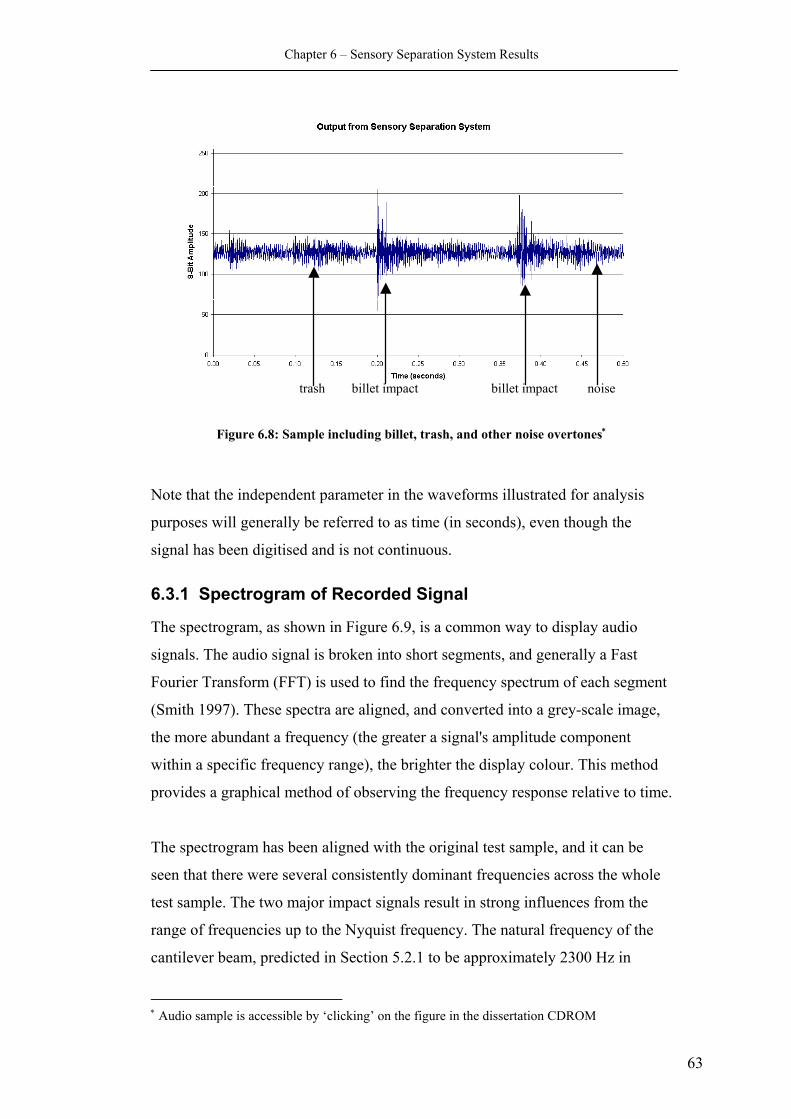
Chapter 6 – Sensory Separation System Results
noise billet impact billet impact trash
Figure 6.8: Sample including billet, trash, and other noise overtones∗
Note that the independent parameter in the waveforms illustrated for analysis
purposes will generally be referred to as time (in seconds), even though the
signal has been digitised and is not continuous.
6.3.1 Spectrogram of Recorded Signal
The spectrogram, as shown in Figure 6.9, is a common way to display audio
signals. The audio signal is broken into short segments, and generally a Fast
Fourier Transform (FFT) is used to find the frequency spectrum of each segment
(Smith 1997). These spectra are aligned, and converted into a grey-scale image,
the more abundant a frequency (the greater a signal's amplitude component
within a specific frequency range), the brighter the display colour. This method
provides a graphical method of observing the frequency response relative to time.
The spectrogram has been aligned with the original test sample, and it can be
seen that there were several consistently dominant frequencies across the whole
test sample. The two major impact signals result in strong influences from the
range of frequencies up to the Nyquist frequency. The natural frequency of the
cantilever beam, predicted in Section 5.2.1 to be approximately 2300 Hz in
∗ Audio sample is accessible by ‘clicking’ on the figure in the dissertation CDROM
63
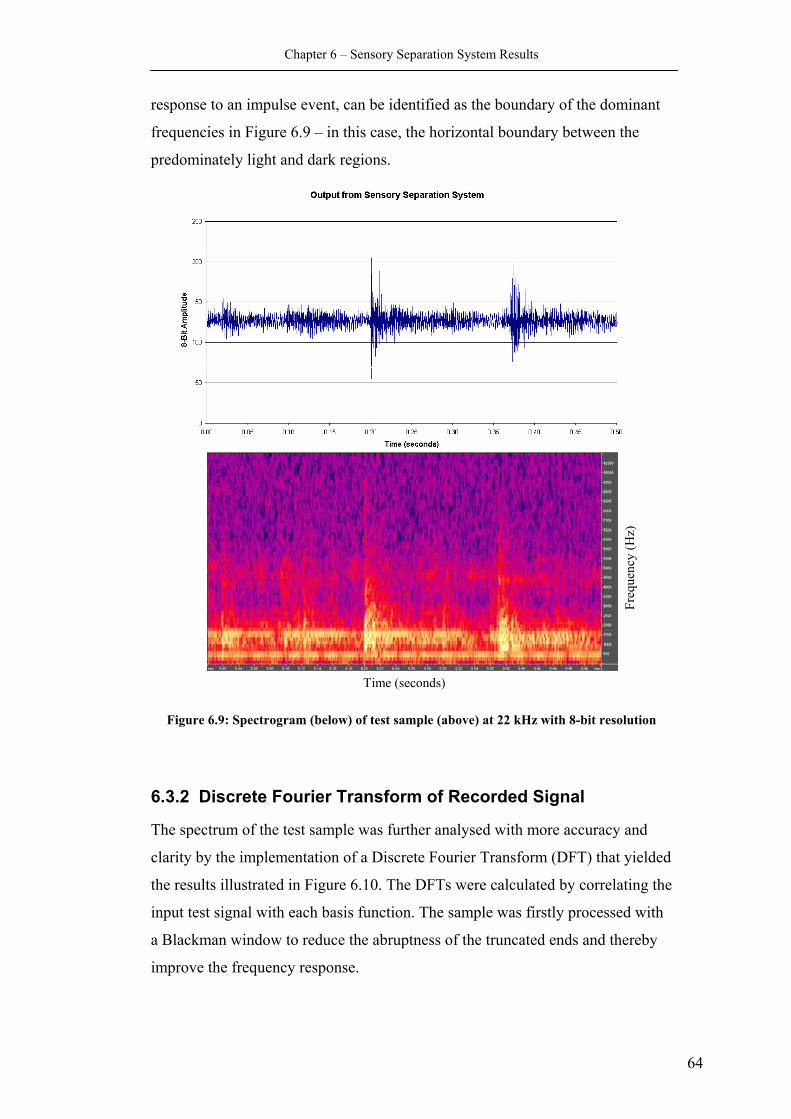
Chapter 6 – Sensory Separation System Results
response to an impulse event, can be identified as the boundary of the dominant
frequencies in Figure 6.9 – in this case, the horizontal boundary between the
predominately light and dark regions.
Freq
uenc
y (H
z)
Time (seconds)
Figure 6.9: Spectrogram (below) of test sample (above) at 22 kHz with 8-bit resolution
6.3.2 Discrete Fourier Transform of Recorded Signal
The spectrum of the test sample was further analysed with more accuracy and
clarity by the implementation of a Discrete Fourier Transform (DFT) that yielded
the results illustrated in Figure 6.10. The DFTs were calculated by correlating the
input test signal with each basis function. The sample was firstly processed with
a Blackman window to reduce the abruptness of the truncated ends and thereby
improve the frequency response.
64
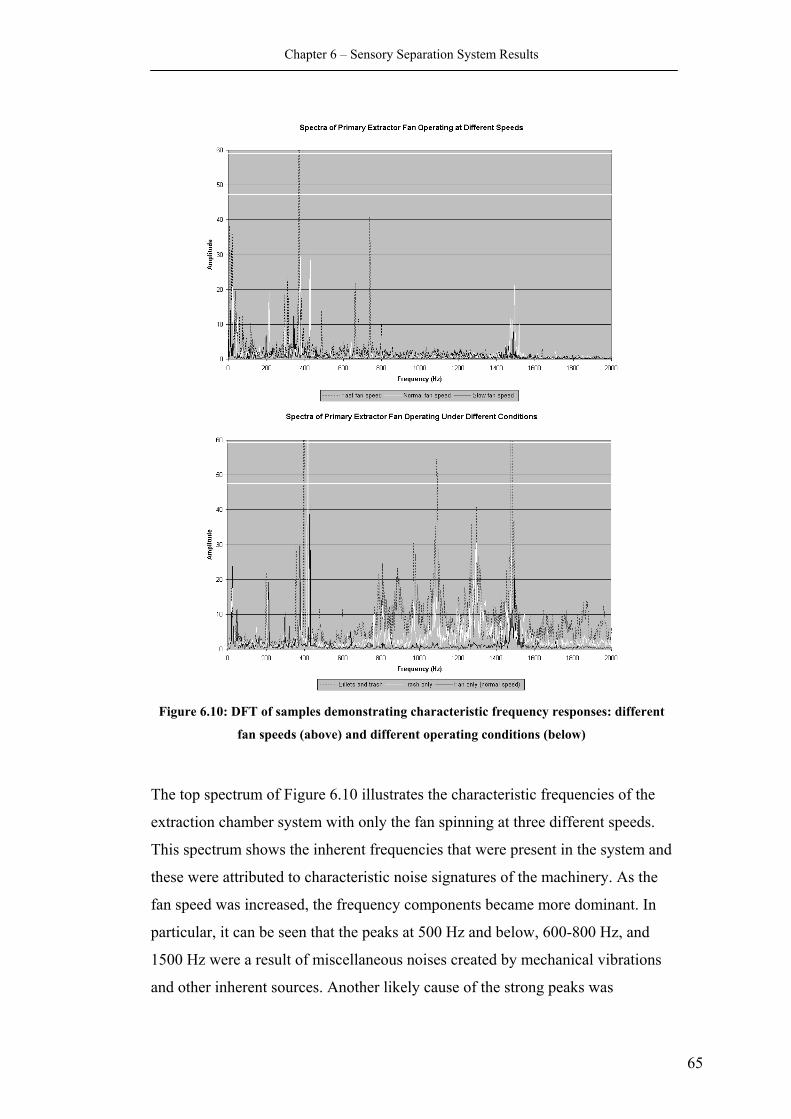
Chapter 6 – Sensory Separation System Results
Figure 6.10: DFT of samples demonstrating characteristic frequency responses: different
fan speeds (above) and different operating conditions (below)
The top spectrum of Figure 6.10 illustrates the characteristic frequencies of the
extraction chamber system with only the fan spinning at three different speeds.
This spectrum shows the inherent frequencies that were present in the system and
these were attributed to characteristic noise signatures of the machinery. As the
fan speed was increased, the frequency components became more dominant. In
particular, it can be seen that the peaks at 500 Hz and below, 600-800 Hz, and
1500 Hz were a result of miscellaneous noises created by mechanical vibrations
and other inherent sources. Another likely cause of the strong peaks was
65
Chapter 6 – Sensory Separation System Results
considered to be either a result of the induced cyclic bearing noise, or some
imperfection in one of the magnetic fields of the rotary transformer. Also, in
Table 5.1 of §5.2.1, it was predicted that the natural frequency of the
instrumented fan blade was approximately 500 Hz, depending on the mass of the
blade, and this can be verified in Figure 6.10.
In the lower spectrum of Figure 6.10, there are three larger peaks at
approximately 1.1 kHz, 1.3 kHz and 1.5 kHz. These three peaked frequencies
would each represent one of the fan blades when impacted with the ejected
material: 1.5 kHz was the instrumented fan blade, and the other two frequencies
were impact echoes detected by the other two fan blades. Even though the
spectrum indicates that these are the dominant frequencies, there is a substantial
noise level that tends to surround the signal in the frequency range of interest.
The high levels of spectral noise from 800 – 2000 Hz were attributed to the
impacts on the fan blades by the many objects being ejected from the extraction
chamber. The lower end of this range would have been billets, both whole and
damaged, as well as other more dense materials. The higher end of this range
represented the large quantity of separated trash.
This spectrum analysis was particularly useful when determining the validity of
the sensory separation system because the quality and level of information
encoded in the recorded samples could be more easily verified than in the time-
domain.
6.4 Discrete Time-Series Analysis of Sensory Separation System
Samples of collected data have been illustrated, but the required outcome of
these analyses was to determine the most appropriate method to quickly and
accurately determine a measure of cane loss to close the control loop on the fan
speed operation.
66
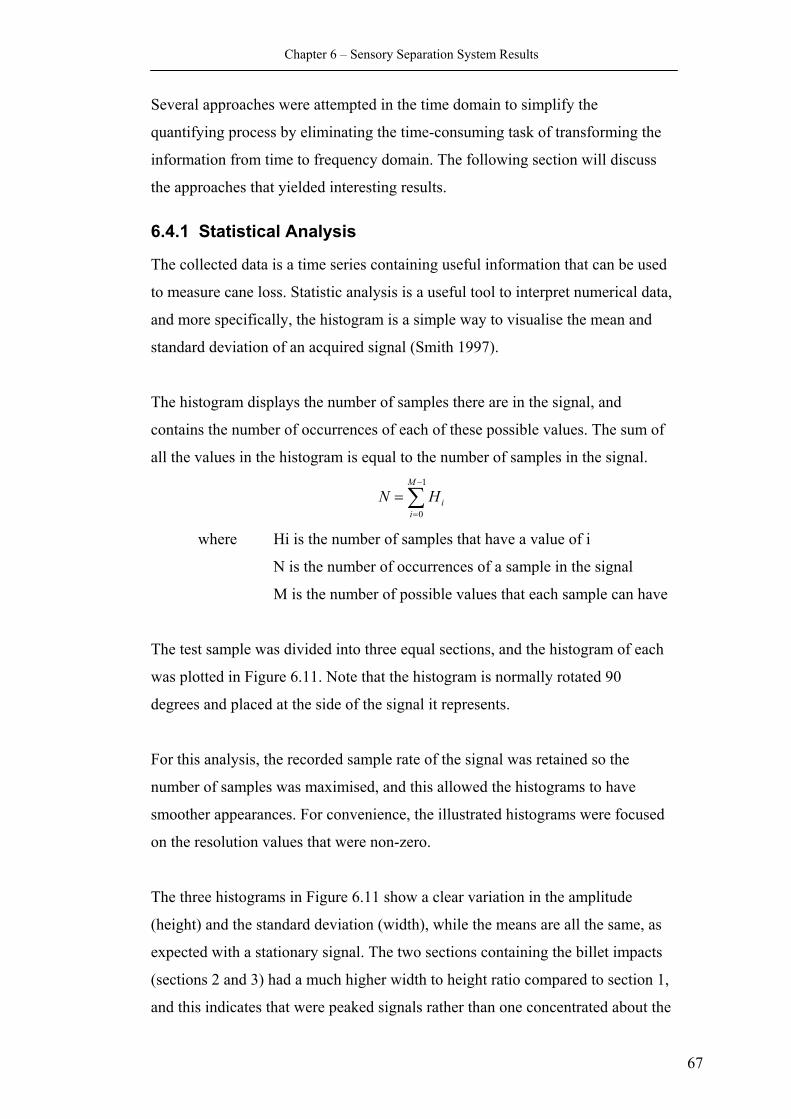
Chapter 6 – Sensory Separation System Results
Several approaches were attempted in the time domain to simplify the
quantifying process by eliminating the time-consuming task of transforming the
information from time to frequency domain. The following section will discuss
the approaches that yielded interesting results.
6.4.1 Statistical Analysis
The collected data is a time series containing useful information that can be used
to measure cane loss. Statistic analysis is a useful tool to interpret numerical data,
and more specifically, the histogram is a simple way to visualise the mean and
standard deviation of an acquired signal (Smith 1997).
The histogram displays the number of samples there are in the signal, and
contains the number of occurrences of each of these possible values. The sum of
all the values in the histogram is equal to the number of samples in the signal.
ii∑
=0
M
HN−
=1
where Hi is the number of samples that have a value of i
N is the number of occurrences of a sample in the signal
M is the number of possible values that each sample can have
The test sample was divided into three equal sections, and the histogram of each
was plotted in Figure 6.11. Note that the histogram is normally rotated 90
degrees and placed at the side of the signal it represents.
For this analysis, the recorded sample rate of the signal was retained so the
number of samples was maximised, and this allowed the histograms to have
smoother appearances. For convenience, the illustrated histograms were focused
on the resolution values that were non-zero.
The three histograms in Figure 6.11 show a clear variation in the amplitude
(height) and the standard deviation (width), while the means are all the same, as
expected with a stationary signal. The two sections containing the billet impacts
(sections 2 and 3) had a much higher width to height ratio compared to section 1,
and this indicates that were peaked signals rather than one concentrated about the
67
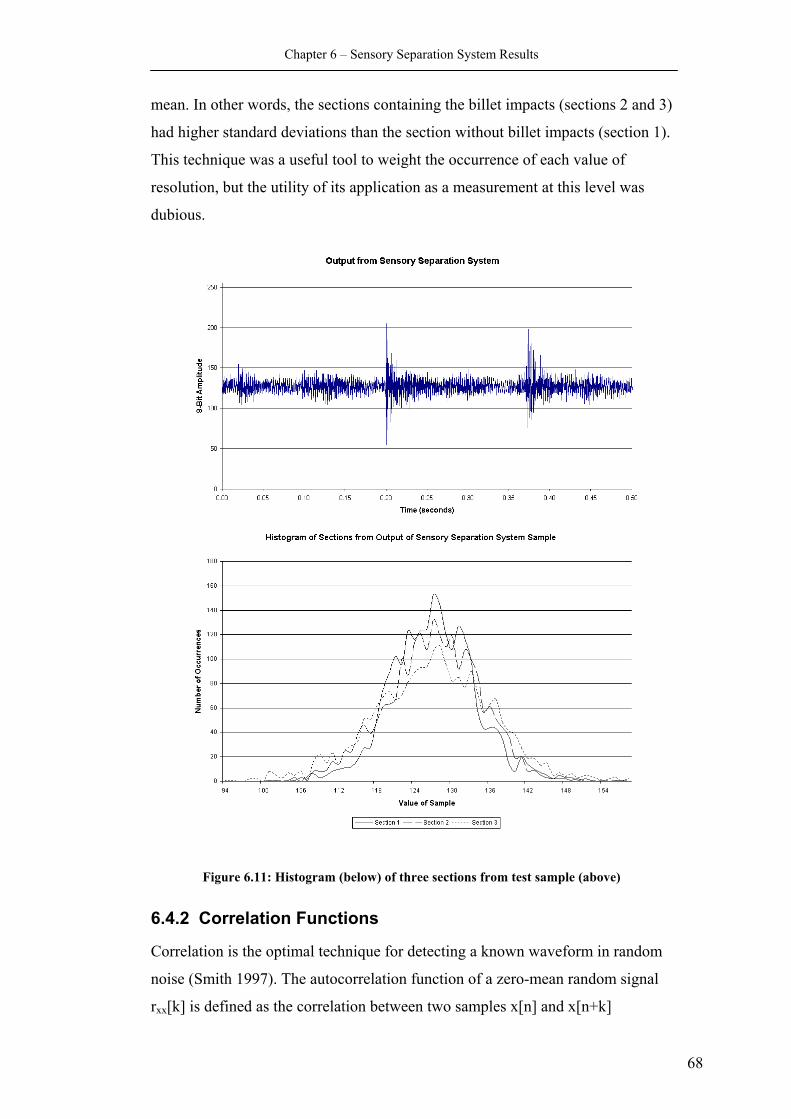
Chapter 6 – Sensory Separation System Results
mean. In other words, the sections containing the billet impacts (sections 2 and 3)
had higher standard deviations than the section without billet impacts (section 1).
This technique was a useful tool to weight the occurrence of each value of
resolution, but the utility of its application as a measurement at this level was
dubious.
Figure 6.11: Histogram (below) of three sections from test sample (above)
6.4.2 Correlation Functions
Correlation is the optimal technique for detecting a known waveform in random
noise (Smith 1997). The autocorrelation function of a zero-mean random signal
rxx[k] is defined as the correlation between two samples x[n] and x[n+k]
68
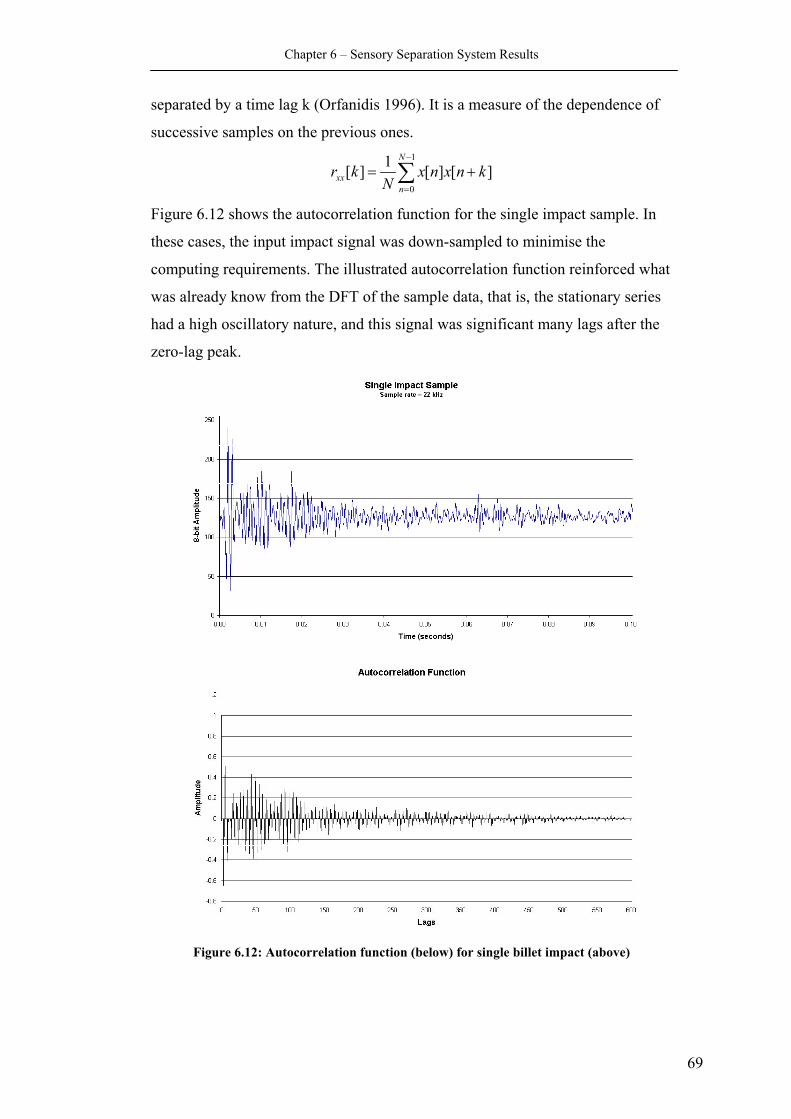
Chapter 6 – Sensory Separation System Results
separated by a time lag k (Orfanidis 1996). It is a measure of the dependence of
successive samples on the previous ones.
][][1][1
0
knxnxN
krN
nxx += ∑
−
=
Figure 6.12 shows the autocorrelation function for the single impact sample. In
these cases, the input impact signal was down-sampled to minimise the
computing requirements. The illustrated autocorrelation function reinforced what
was already know from the DFT of the sample data, that is, the stationary series
had a high oscillatory nature, and this signal was significant many lags after the
zero-lag peak.
Figure 6.12: Autocorrelation function (below) for single billet impact (above)
69
Chapter 6 – Sensory Separation System Results
Similarly, the cross-correlation function rxx[k] is defined as the similarity of a
signal x[n] with a delayed version of another signal x[n+k].
][][1][1
0
knynxN
krN
nxx += ∑
−
=
The cross-correlations of two functions with the original test sample are
illustrated in Figure 6.13. When cross-correlated with the test sample, both the
single impact signal and the generated tone indicated activity by amplitude peaks
at the lags corresponding to where impacts were visually determined to have
occurred.
Even though the content of the recorded signals had been determined to contain
impact data as well as other inherent noise, correlation was a useful tool to
establish the level of oscillation in a cane billet impact signal, as well as another
option to automatically determine the occurrence of an impact. Unfortunately
this method does require considerable computing resources.
6.4.3 Matched Filters
Matched filtering involves the correlation of a known signal with a target signal
being detected using convolution (Smith 1997). The amplitude of each point in
the output of signal was a measure of how well the known signal matches the
corresponding segment of the input signal. When the input sequence is fed into
an appropriate matched filter, the output does not necessarily look like the signal
being detected (Lynn & Fuerst 1998). In fact, the output waveform should be a
noisy version of the autocorrelation function. To implement this technique the
matched filter signal must be known, but in this application the billet impact
signals were considered too dissimilar.
Another approach was to use a filter signal sample of a characteristic signal, for
example 1.5 kHz from the DFT of Figure 6.10. This approach resulted in an
output waveform similar to an autocorrelation function, with peaks
corresponding to the two central values being higher than the surrounding
oscillations. This method would have been more appropriate in applications
where the target signal is more identifiable with fewer oscillations, and as can be
seen here the extra computing did not provide any outstanding results. Also the
70
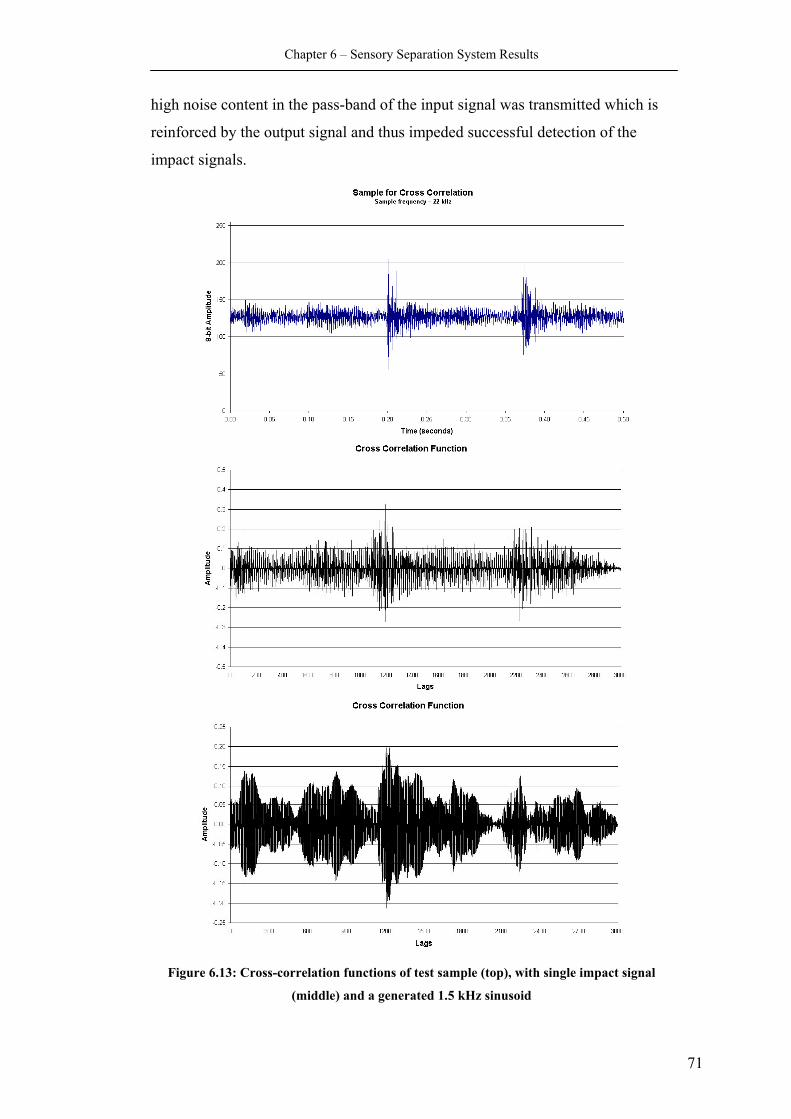
Chapter 6 – Sensory Separation System Results
high noise content in the pass-band of the input signal was transmitted which is
reinforced by the output signal and thus impeded successful detection of the
impact signals.
Figure 6.13: Cross-correlation functions of test sample (top), with single impact signal
(middle) and a generated 1.5 kHz sinusoid
71

Chapter 6 – Sensory Separation System Results
6.4.4 Moving Average Filter
The moving average is the most common filter in digital signal processing,
because of its simplicity (Smith 1997). Despite this, the moving average filter is
optimal for reducing random noise while retaining a sharp step response, which
is ideal for time-domain encoded signals.
The moving average filter may be implemented as an explicit convolution of the
input signal with a rectangular pulse of unity area. The filter pulse may be either
averaged on one side, or symmetrically, the only difference being that one side
implementation introduces a delay to the output signal.
A much faster algorithm was the moving average filter by recursion, which was a
more implicit form of convolution.
][][]1[][ qixpixiyiy −−++−=
where x[] is the input signal
y[] is the output signal
M is the (odd) number of points in the moving average
p = (M – 1) / 2
q = p + 1
This method uses both the input signal and previously calculated output values,
and for this reason the equation is recursive. This filter is unlike other recursive
filters because while these generally have an infinite impulse response (IIR)
composed of sinusoids and exponentials, the impulse response of the moving
average is a rectangular pulse (finite impulse response FIR).
The execution speed of this algorithm can be appreciated for a few reasons:
regardless of the filter length only two computations are required per point; the
only operations required per iteration are a simple addition and subtraction; and
integer data types can be implemented because the samples were recorded with
72
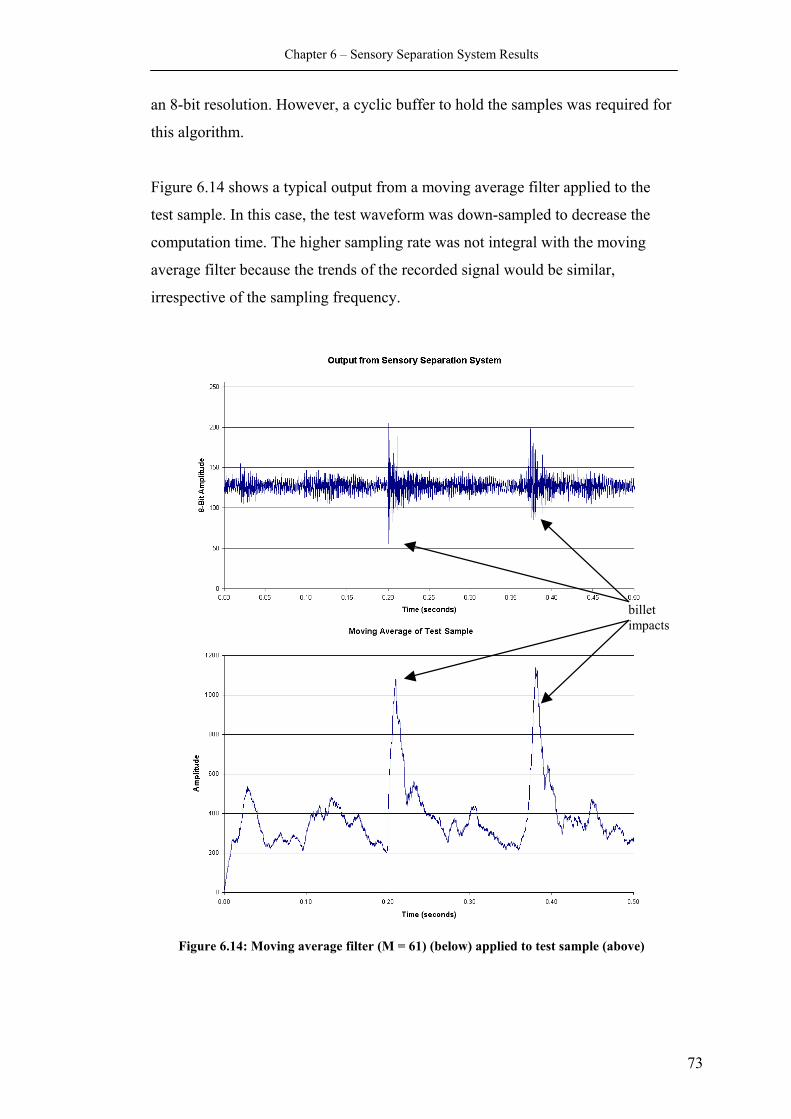
Chapter 6 – Sensory Separation System Results
an 8-bit resolution. However, a cyclic buffer to hold the samples was required for
this algorithm.
Figure 6.14 shows a typical output from a moving average filter applied to the
test sample. In this case, the test waveform was down-sampled to decrease the
computation time. The higher sampling rate was not integral with the moving
average filter because the trends of the recorded signal would be similar,
irrespective of the sampling frequency.
billet impacts
Figure 6.14: Moving average filter (M = 61) (below) applied to test sample (above)
73
Chapter 6 – Sensory Separation System Results
The application of this filter was analogous to demodulating AM signals: the
input signal was firstly rectified, and then the moving average filter was applied
to the signal, which was equivalent to a low-pass filter in analogue terms. By
implementing this variation in the algorithm, the output waveform was simplified
to a trend line that followed the amplitude peaks. This effectively alleviated the
high oscillatory nature of the input signal.
This output signal from the moving average filter indicates that an indeterminate
input signal may be deconvolved with a relatively simple and time-efficient
algorithm. The moving average filter is the optimal solution for this problem,
providing the lowest noise possible for a given edge sharpness.
6.4.5 Frequency Filter
This type of filter separates signals based on their frequency spectra (Smith
1997). Some input signals have spectrum characteristics where at some
frequencies there is mostly signal, while at others there is mostly noise. It follows
that the frequencies that contain a large amount of useful signal should pass
through the filter, while the noisy frequencies should be blocked. Once such
implementation of this idea is the Wiener filter that then also considers the
relative powers of signal and gain at each frequency to maximise the filter gain.
In the case of the returned signal from the sensory separation system, the FFT of
Figure 6.10 has already established that the frequencies of the billet impact
signals were characteristic; however there was a high noise content across the
spectrum and thus this implementation was considered inappropriate.
6.5 Implementation of Real-Time Filters Various methods of extracting a useful measure of billet impact in any time
period from the recorded signal of the sensory separation system have been
discussed. However, to implement any of these techniques in actuality, many
important practical factors must be considered and addressed. The filter must be
capable of analysing an input signal in real-time with an acceptable level of
performance, but also needs to be robust enough to manage subtle variations, and
not be completely determined by the characteristics of the returned signal.
74
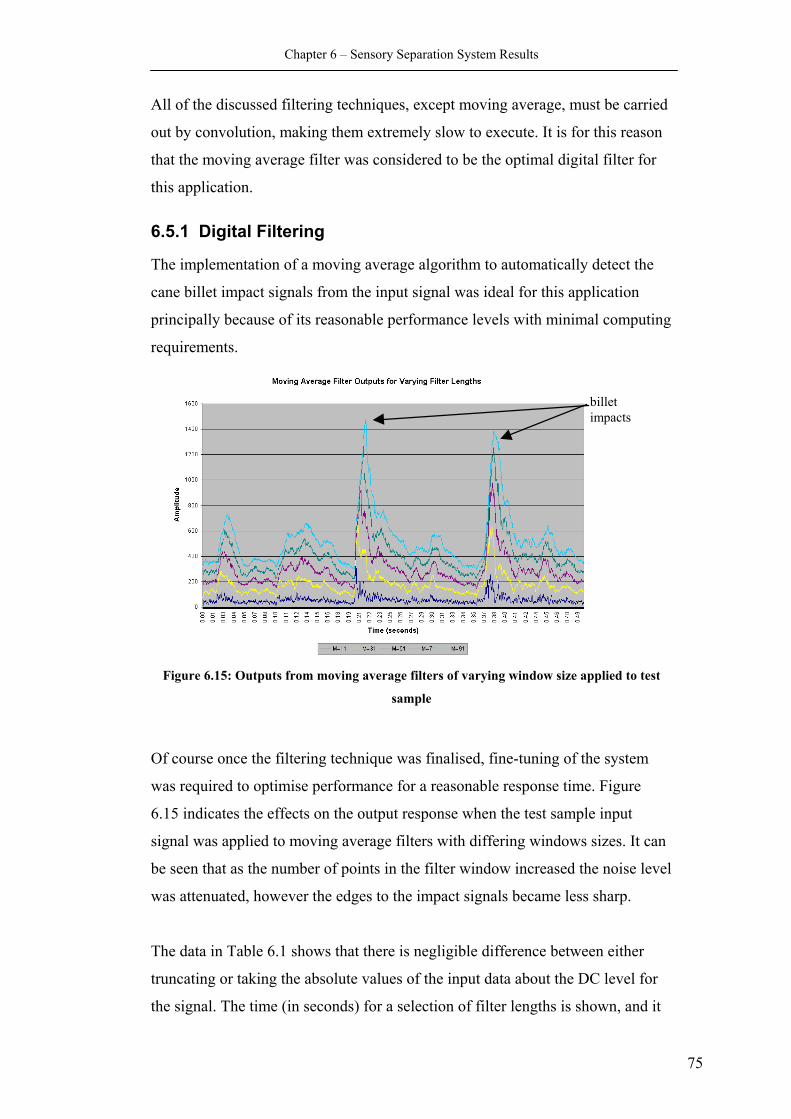
Chapter 6 – Sensory Separation System Results
All of the discussed filtering techniques, except moving average, must be carried
out by convolution, making them extremely slow to execute. It is for this reason
that the moving average filter was considered to be the optimal digital filter for
this application.
6.5.1 Digital Filtering
The implementation of a moving average algorithm to automatically detect the
cane billet impact signals from the input signal was ideal for this application
principally because of its reasonable performance levels with minimal computing
requirements.
billet impacts
Figure 6.15: Outputs from moving average filters of varying window size applied to test
sample
Of course once the filtering technique was finalised, fine-tuning of the system
was required to optimise performance for a reasonable response time. Figure
6.15 indicates the effects on the output response when the test sample input
signal was applied to moving average filters with differing windows sizes. It can
be seen that as the number of points in the filter window increased the noise level
was attenuated, however the edges to the impact signals became less sharp.
The data in Table 6.1 shows that there is negligible difference between either
truncating or taking the absolute values of the input data about the DC level for
the signal. The time (in seconds) for a selection of filter lengths is shown, and it
75
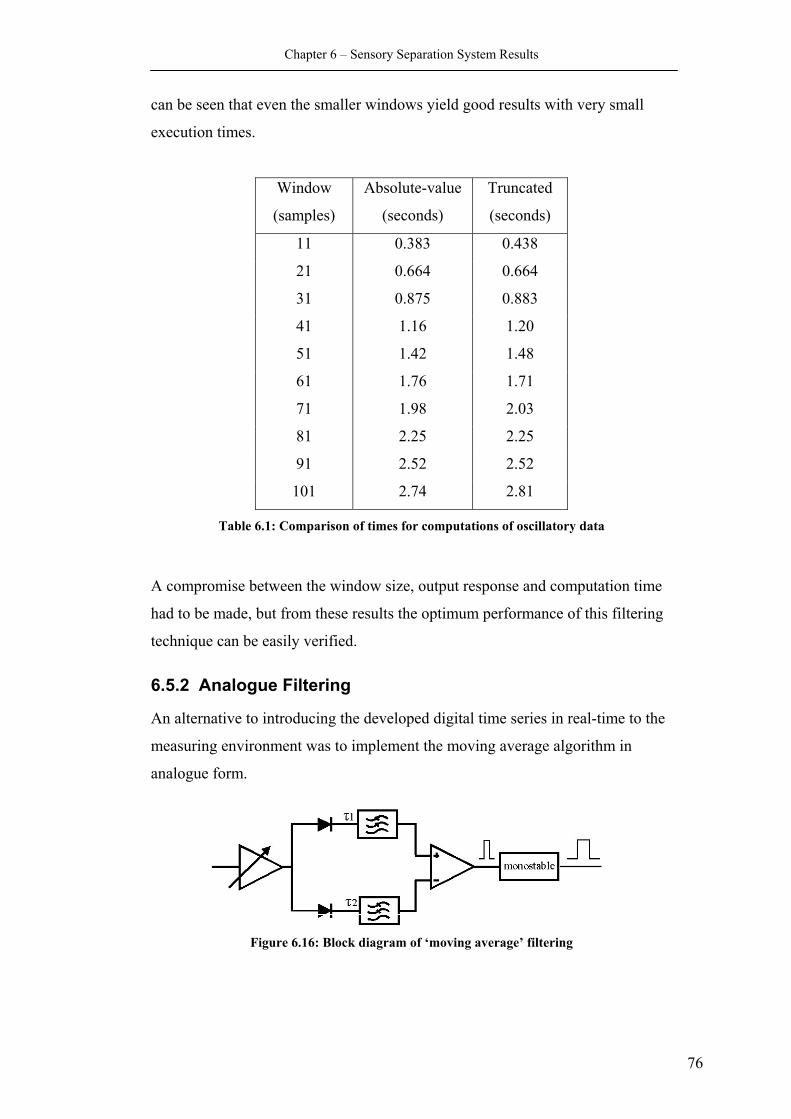
Chapter 6 – Sensory Separation System Results
can be seen that even the smaller windows yield good results with very small
execution times.
Window
(samples)
Absolute-value
(seconds)
Truncated
(seconds)
11 0.383 0.438
21 0.664 0.664
31 0.875 0.883
41 1.16 1.20
51 1.42 1.48
61 1.76 1.71
71 1.98 2.03
81 2.25 2.25
91 2.52 2.52
101 2.74 2.81
Table 6.1: Comparison of times for computations of oscillatory data
A compromise between the window size, output response and computation time
had to be made, but from these results the optimum performance of this filtering
technique can be easily verified.
6.5.2 Analogue Filtering
An alternative to introducing the developed digital time series in real-time to the
measuring environment was to implement the moving average algorithm in
analogue form.
Figure 6.16: Block diagram of ‘moving average’ filtering
76
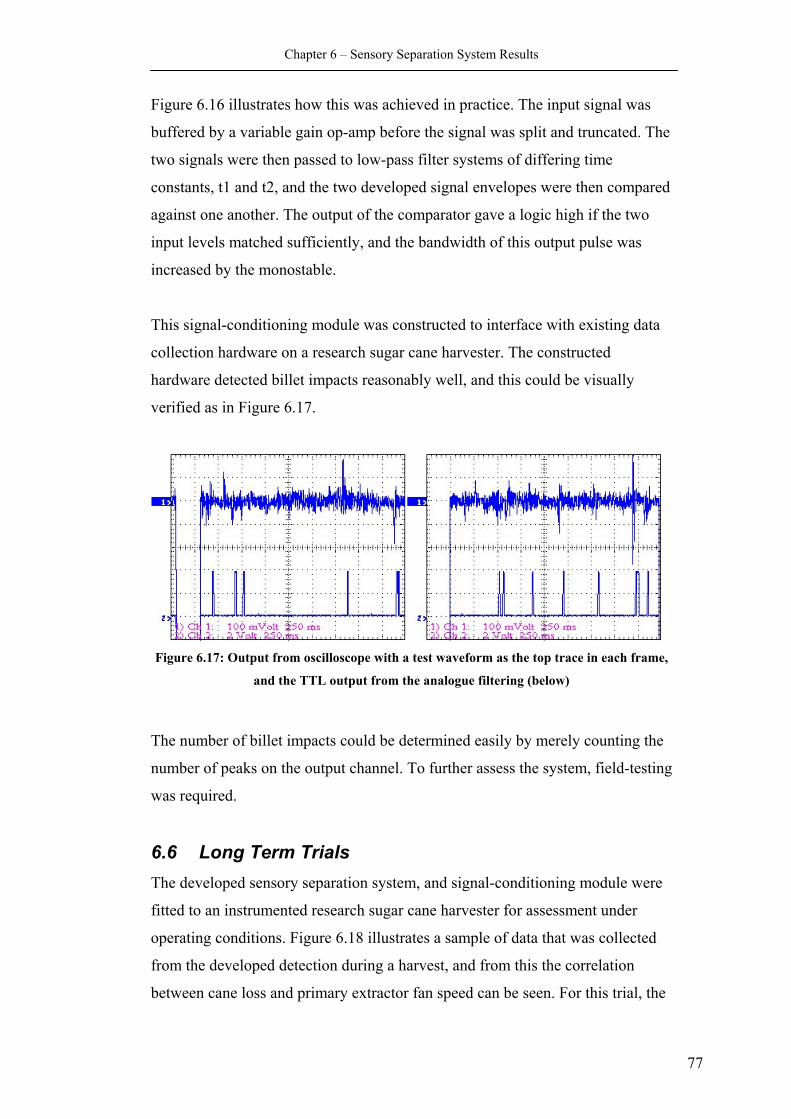
Chapter 6 – Sensory Separation System Results
Figure 6.16 illustrates how this was achieved in practice. The input signal was
buffered by a variable gain op-amp before the signal was split and truncated. The
two signals were then passed to low-pass filter systems of differing time
constants, t1 and t2, and the two developed signal envelopes were then compared
against one another. The output of the comparator gave a logic high if the two
input levels matched sufficiently, and the bandwidth of this output pulse was
increased by the monostable.
This signal-conditioning module was constructed to interface with existing data
collection hardware on a research sugar cane harvester. The constructed
hardware detected billet impacts reasonably well, and this could be visually
verified as in Figure 6.17.
ure 6.17: Output from oscilloscope with a test waveform as the top trace in each frame,
he number of billet impacts could be determined easily by merely counting the
.6 Long Term Trials e n system, and signal-conditioning module were
d
the
Fig
and the TTL output from the analogue filtering (below)
T
number of peaks on the output channel. To further assess the system, field-testing
was required.
6The d veloped sensory separatio
fitted to an instrumented research sugar cane harvester for assessment under
operating conditions. Figure 6.18 illustrates a sample of data that was collecte
from the developed detection during a harvest, and from this the correlation
between cane loss and primary extractor fan speed can be seen. For this trial,
77
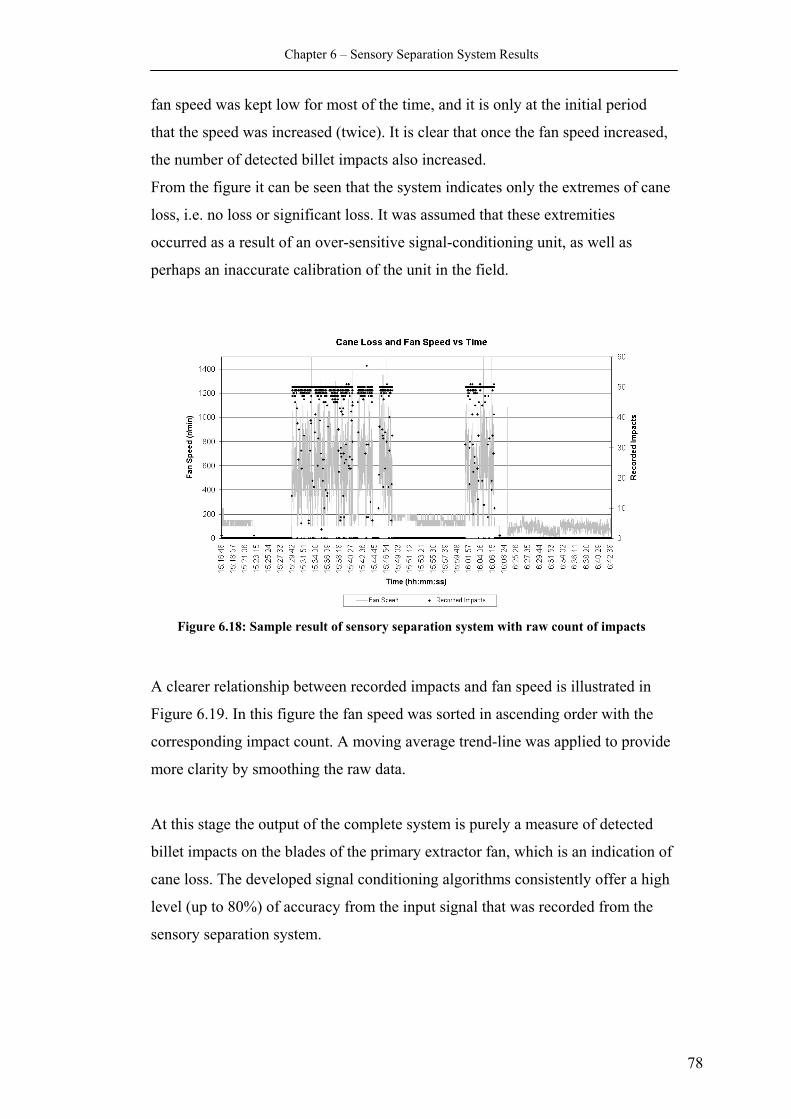
Chapter 6 – Sensory Separation System Results
fan speed was kept low for most of the time, and it is only at the initial period
that the speed was increased (twice). It is clear that once the fan speed increase
the number of detected billet impacts also increased.
From the figure it can be seen that the system indicate
d,
s only the extremes of cane
s
Figure 6.18: Sample result of sensory separation system with raw count of impacts
clearer relationship between recorded impacts and fan speed is illustrated in
e
t this stage the output of the complete system is purely a measure of detected
f
loss, i.e. no loss or significant loss. It was assumed that these extremities
occurred as a result of an over-sensitive signal-conditioning unit, as well a
perhaps an inaccurate calibration of the unit in the field.
A
Figure 6.19. In this figure the fan speed was sorted in ascending order with the
corresponding impact count. A moving average trend-line was applied to provid
more clarity by smoothing the raw data.
A
billet impacts on the blades of the primary extractor fan, which is an indication o
cane loss. The developed signal conditioning algorithms consistently offer a high
level (up to 80%) of accuracy from the input signal that was recorded from the
sensory separation system.
78
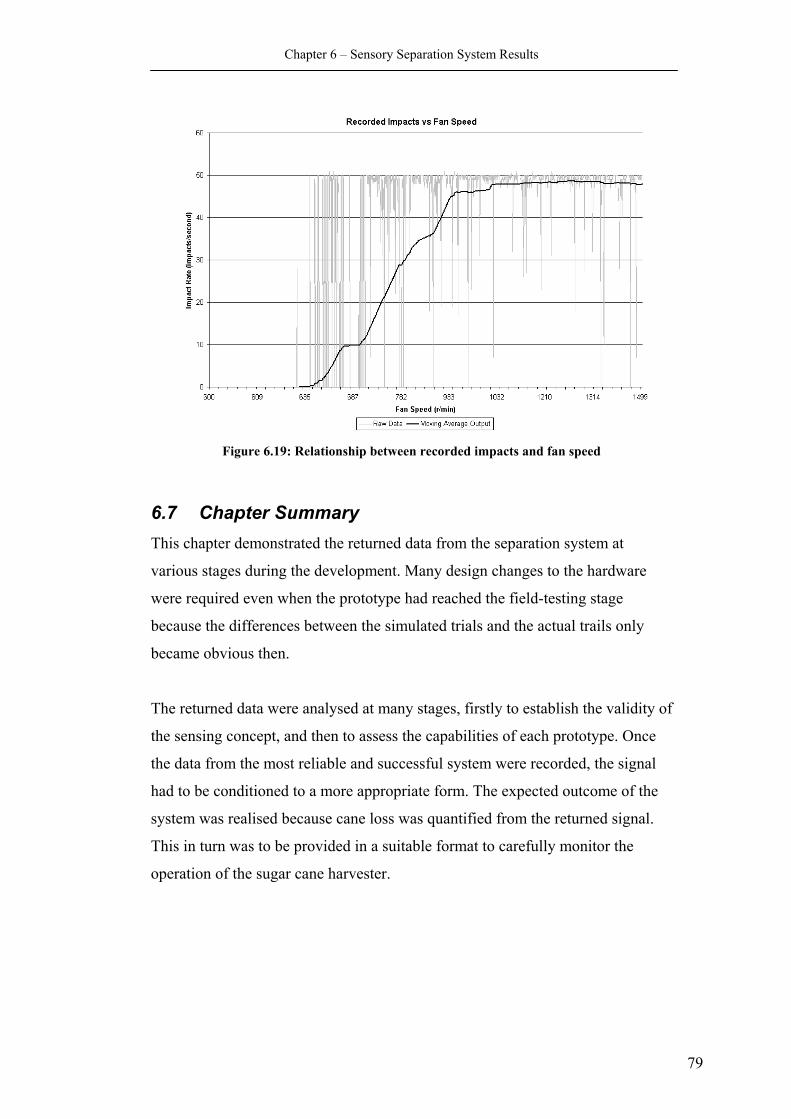
Chapter 6 – Sensory Separation System Results
Figure 6.19: Relationship between recorded impacts and fan speed
6.7 Chapter Summary This chapter demonstrated the returned data from the separation system at
various stages during the development. Many design changes to the hardware
were required even when the prototype had reached the field-testing stage
because the differences between the simulated trials and the actual trails only
became obvious then.
The returned data were analysed at many stages, firstly to establish the validity of
the sensing concept, and then to assess the capabilities of each prototype. Once
the data from the most reliable and successful system were recorded, the signal
had to be conditioned to a more appropriate form. The expected outcome of the
system was realised because cane loss was quantified from the returned signal.
This in turn was to be provided in a suitable format to carefully monitor the
operation of the sugar cane harvester.
79
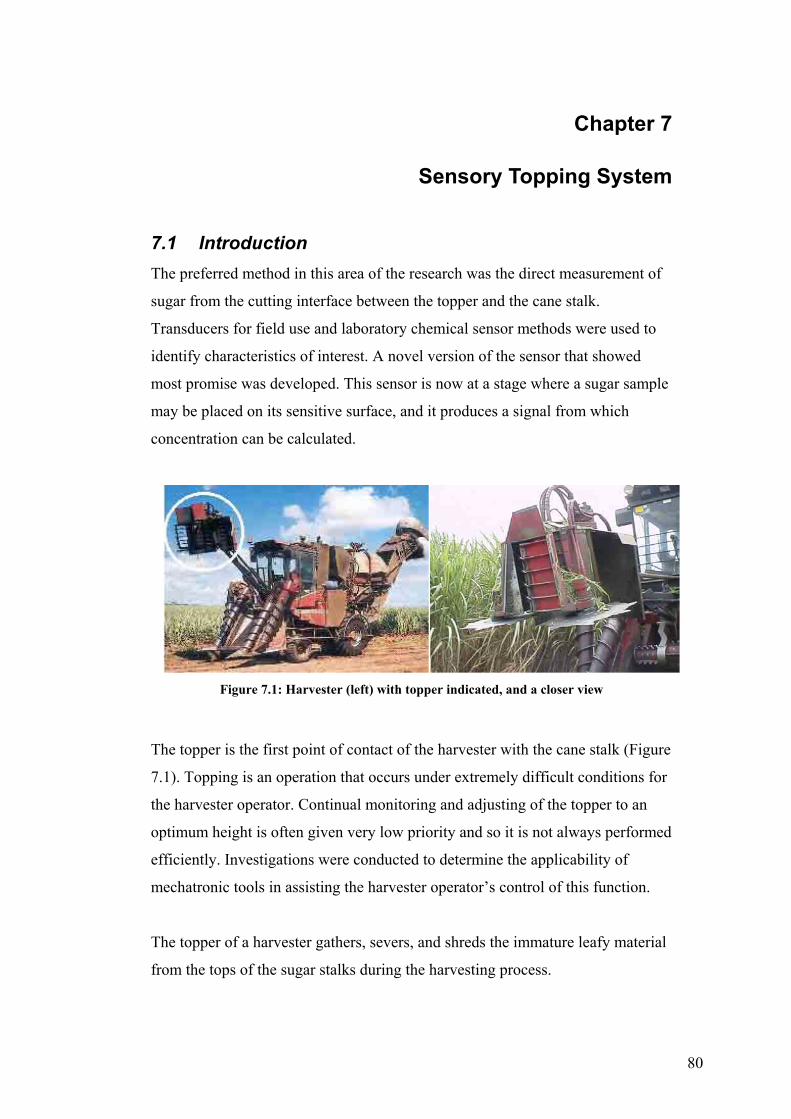
Chapter 7
Sensory Topping System
7.1 Introduction The preferred method in this area of the research was the direct measurement of
sugar from the cutting interface between the topper and the cane stalk.
Transducers for field use and laboratory chemical sensor methods were used to
identify characteristics of interest. A novel version of the sensor that showed
most promise was developed. This sensor is now at a stage where a sugar sample
may be placed on its sensitive surface, and it produces a signal from which
concentration can be calculated.
Figure 7.1: Harvester (left) with topper indicated, and a closer view
he topper is the first point of contact of the harvester with the cane stalk (Figure
ed
n.
he topper of a harvester gathers, severs, and shreds the immature leafy material
T
7.1). Topping is an operation that occurs under extremely difficult conditions for
the harvester operator. Continual monitoring and adjusting of the topper to an
optimum height is often given very low priority and so it is not always perform
efficiently. Investigations were conducted to determine the applicability of
mechatronic tools in assisting the harvester operator’s control of this functio
T
from the tops of the sugar stalks during the harvesting process.
80
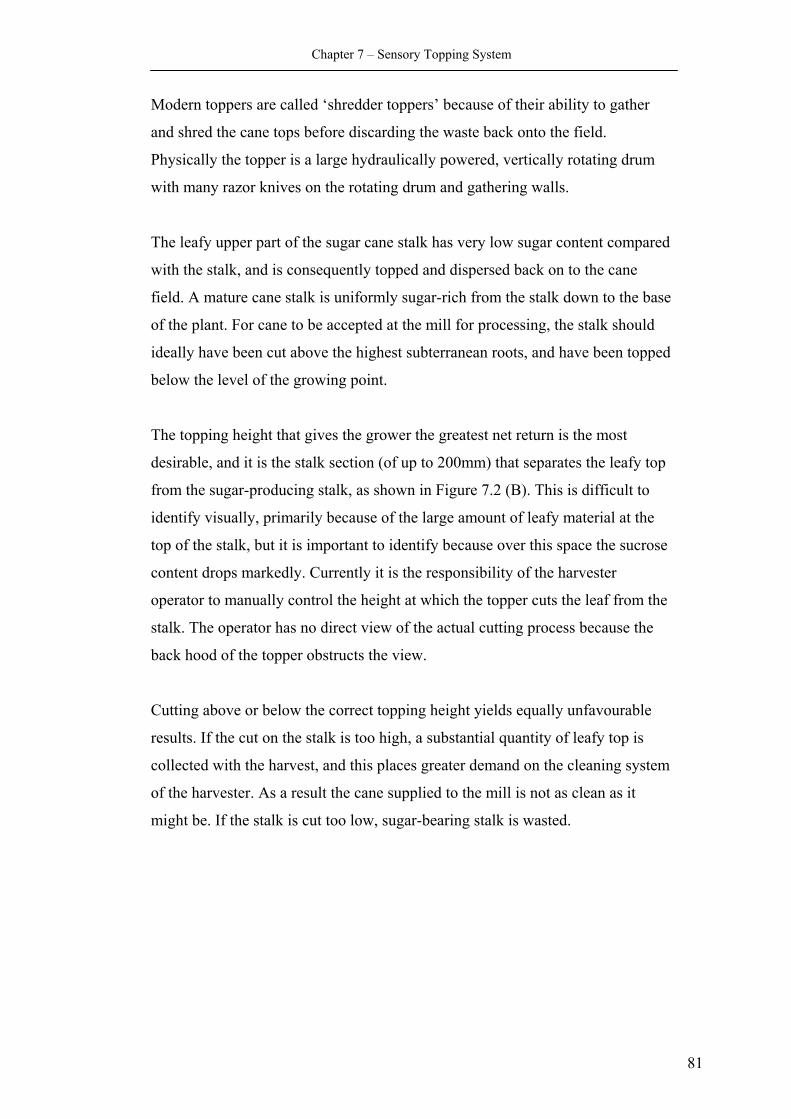
Chapter 7 – Sensory Topping System
Modern toppers are called ‘shredder toppers’ because of their ability to gather
drum
he leafy upper part of the sugar cane stalk has very low sugar content compared
ase
d
he topping height that gives the grower the greatest net return is the most
y top
e
om the
utting above or below the correct topping height yields equally unfavourable
em
and shred the cane tops before discarding the waste back onto the field.
Physically the topper is a large hydraulically powered, vertically rotating
with many razor knives on the rotating drum and gathering walls.
T
with the stalk, and is consequently topped and dispersed back on to the cane
field. A mature cane stalk is uniformly sugar-rich from the stalk down to the b
of the plant. For cane to be accepted at the mill for processing, the stalk should
ideally have been cut above the highest subterranean roots, and have been toppe
below the level of the growing point.
T
desirable, and it is the stalk section (of up to 200mm) that separates the leaf
from the sugar-producing stalk, as shown in Figure 7.2 (B). This is difficult to
identify visually, primarily because of the large amount of leafy material at the
top of the stalk, but it is important to identify because over this space the sucros
content drops markedly. Currently it is the responsibility of the harvester
operator to manually control the height at which the topper cuts the leaf fr
stalk. The operator has no direct view of the actual cutting process because the
back hood of the topper obstructs the view.
C
results. If the cut on the stalk is too high, a substantial quantity of leafy top is
collected with the harvest, and this places greater demand on the cleaning syst
of the harvester. As a result the cane supplied to the mill is not as clean as it
might be. If the stalk is cut too low, sugar-bearing stalk is wasted.
81
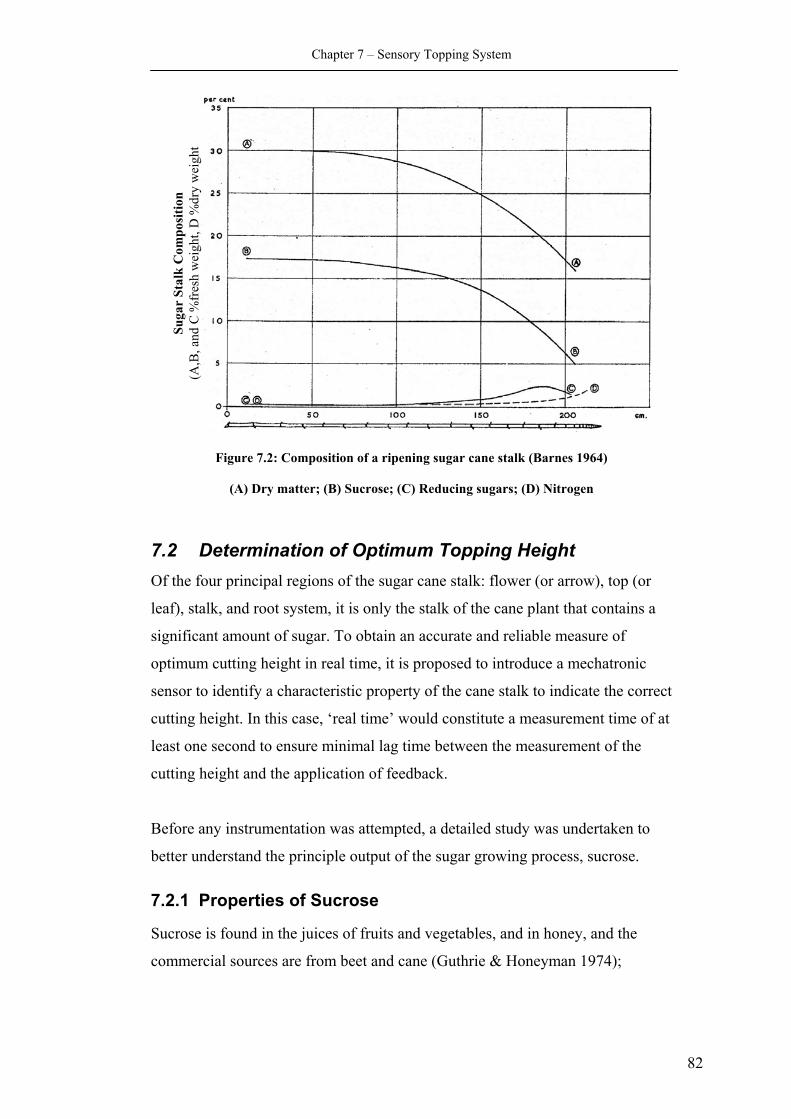
Chapter 7 – Sensory Topping System
Suga
r St
alk
Com
posi
tion
(A,B
, and
C %
fres
h w
eigh
t, D
%dr
y w
eigh
t
Figure 7.2: Composition of a ripening sugar cane stalk (Barnes 1964)
(A) Dry matter; (B) Sucrose; (C) Reducing sugars; (D) Nitrogen
7.2 Determination of Optimum Topping Height Of the four principal regions of the sugar cane stalk: flower (or arrow), top (or
leaf), stalk, and root system, it is only the stalk of the cane plant that contains a
significant amount of sugar. To obtain an accurate and reliable measure of
optimum cutting height in real time, it is proposed to introduce a mechatronic
sensor to identify a characteristic property of the cane stalk to indicate the correct
cutting height. In this case, ‘real time’ would constitute a measurement time of at
least one second to ensure minimal lag time between the measurement of the
cutting height and the application of feedback.
Before any instrumentation was attempted, a detailed study was undertaken to
better understand the principle output of the sugar growing process, sucrose.
7.2.1 Properties of Sucrose
Sucrose is found in the juices of fruits and vegetables, and in honey, and the
commercial sources are from beet and cane (Guthrie & Honeyman 1974);
82
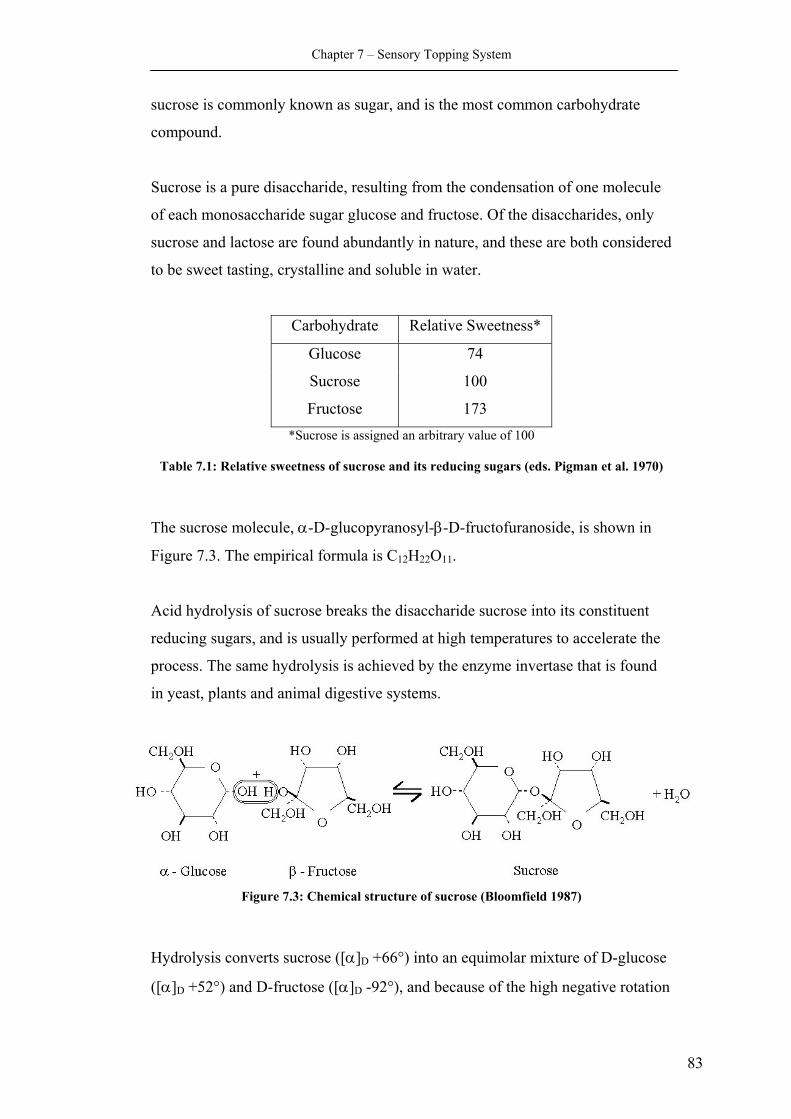
Chapter 7 – Sensory Topping System
sucrose is commonly known as sugar, and is the most common carbohydrate
compound.
Sucrose is a pure disaccharide, resulting from the condensation of one molecule
of each monosaccharide sugar glucose and fructose. Of the disaccharides, only
sucrose and lactose are found abundantly in nature, and these are both considered
to be sweet tasting, crystalline and soluble in water.
Carbohydrate Relative Sweetness*
Glucose 74
Sucrose 100
Fructose 173 *Sucrose is assigned an arbitrary value of 100
Table 7.1: Relative sweetness of sucrose and its reducing sugars (eds. Pigman et al. 1970)
The sucrose molecule, α-D-glucopyranosyl-β-D-fructofuranoside, is shown in
Figure 7.3. The empirical formula is C12H22O11.
Acid hydrolysis of sucrose breaks the disaccharide sucrose into its constituent
reducing sugars, and is usually performed at high temperatures to accelerate the
process. The same hydrolysis is achieved by the enzyme invertase that is found
in yeast, plants and animal digestive systems.
Figure 7.3: Chemical structure of sucrose (Bloomfield 1987)
Hydrolysis converts sucrose ([α]D +66°) into an equimolar mixture of D-glucose
([α]D +52°) and D-fructose ([α]D -92°), and because of the high negative rotation
83
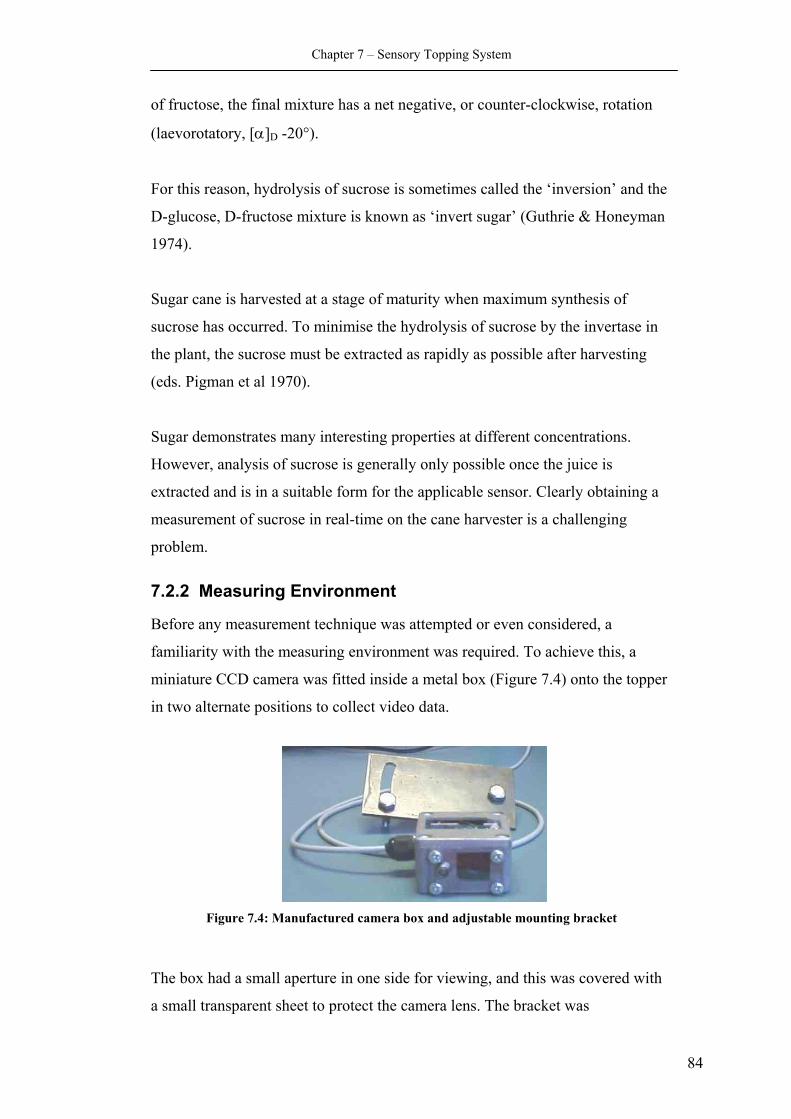
Chapter 7 – Sensory Topping System
of fructose, the final mixture has a net negative, or counter-clockwise, rotation
(laevorotatory, [α]D -20°).
For this reason, hydrolysis of sucrose is sometimes called the ‘inversion’ and the
D-glucose, D-fructose mixture is known as ‘invert sugar’ (Guthrie & Honeyman
1974).
Sugar cane is harvested at a stage of maturity when maximum synthesis of
sucrose has occurred. To minimise the hydrolysis of sucrose by the invertase in
the plant, the sucrose must be extracted as rapidly as possible after harvesting
(eds. Pigman et al 1970).
Sugar demonstrates many interesting properties at different concentrations.
However, analysis of sucrose is generally only possible once the juice is
extracted and is in a suitable form for the applicable sensor. Clearly obtaining a
measurement of sucrose in real-time on the cane harvester is a challenging
problem.
7.2.2 Measuring Environment
Before any measurement technique was attempted or even considered, a
familiarity with the measuring environment was required. To achieve this, a
miniature CCD camera was fitted inside a metal box (Figure 7.4) onto the topper
in two alternate positions to collect video data.
Figure 7.4: Manufactured camera box and adjustable mounting bracket
The box had a small aperture in one side for viewing, and this was covered with
a small transparent sheet to protect the camera lens. The bracket was
84
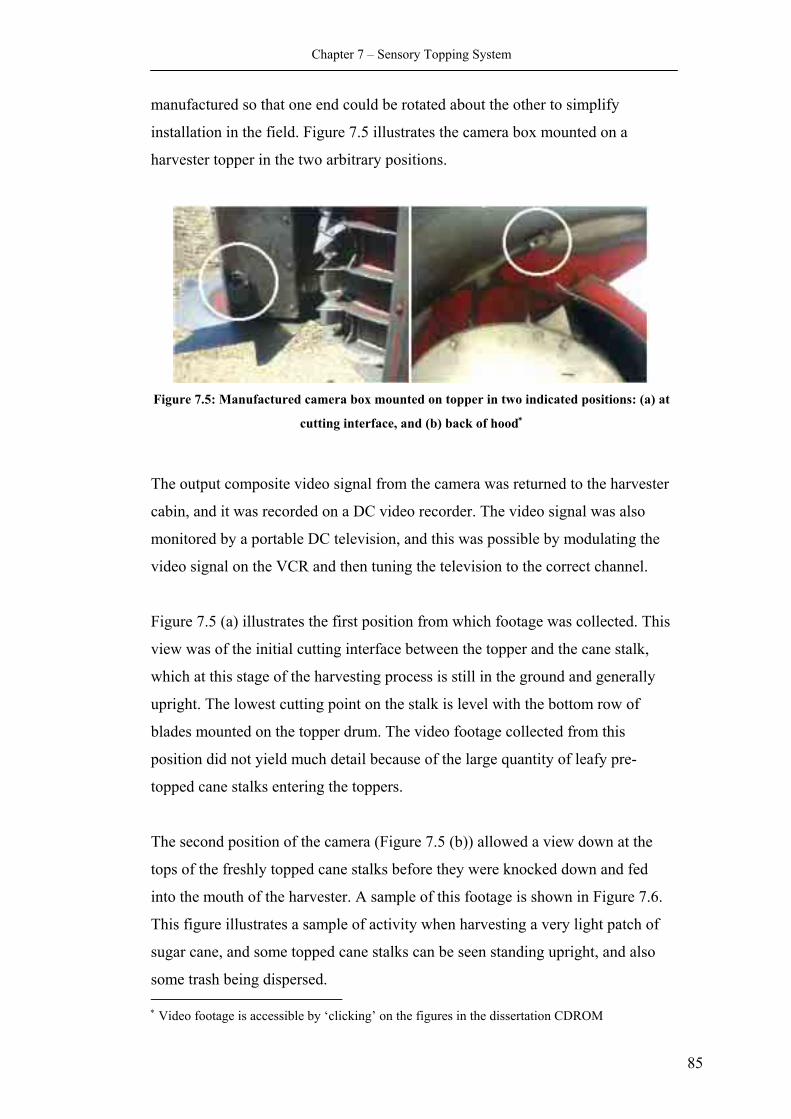
Chapter 7 – Sensory Topping System
manufactured so that one end could be rotated about the other to simplify
installation in the field. Figure 7.5 illustrates the camera box mounted on a
harvester topper in the two arbitrary positions.
Figure 7.5: Manufactured camera box mounted on topper in two indicated positions: (a) at
cutting interface, and (b) back of hood∗
The output composite video signal from the camera was returned to the harvester
cabin, and it was recorded on a DC video recorder. The video signal was also
monitored by a portable DC television, and this was possible by modulating the
video signal on the VCR and then tuning the television to the correct channel.
Figure 7.5 (a) illustrates the first position from which footage was collected. This
view was of the initial cutting interface between the topper and the cane stalk,
which at this stage of the harvesting process is still in the ground and generally
upright. The lowest cutting point on the stalk is level with the bottom row of
blades mounted on the topper drum. The video footage collected from this
position did not yield much detail because of the large quantity of leafy pre-
topped cane stalks entering the toppers.
The second position of the camera (Figure 7.5 (b)) allowed a view down at the
tops of the freshly topped cane stalks before they were knocked down and fed
into the mouth of the harvester. A sample of this footage is shown in Figure 7.6.
This figure illustrates a sample of activity when harvesting a very light patch of
sugar cane, and some topped cane stalks can be seen standing upright, and also
some trash being dispersed. ∗ Video footage is accessible by ‘clicking’ on the figures in the dissertation CDROM
85
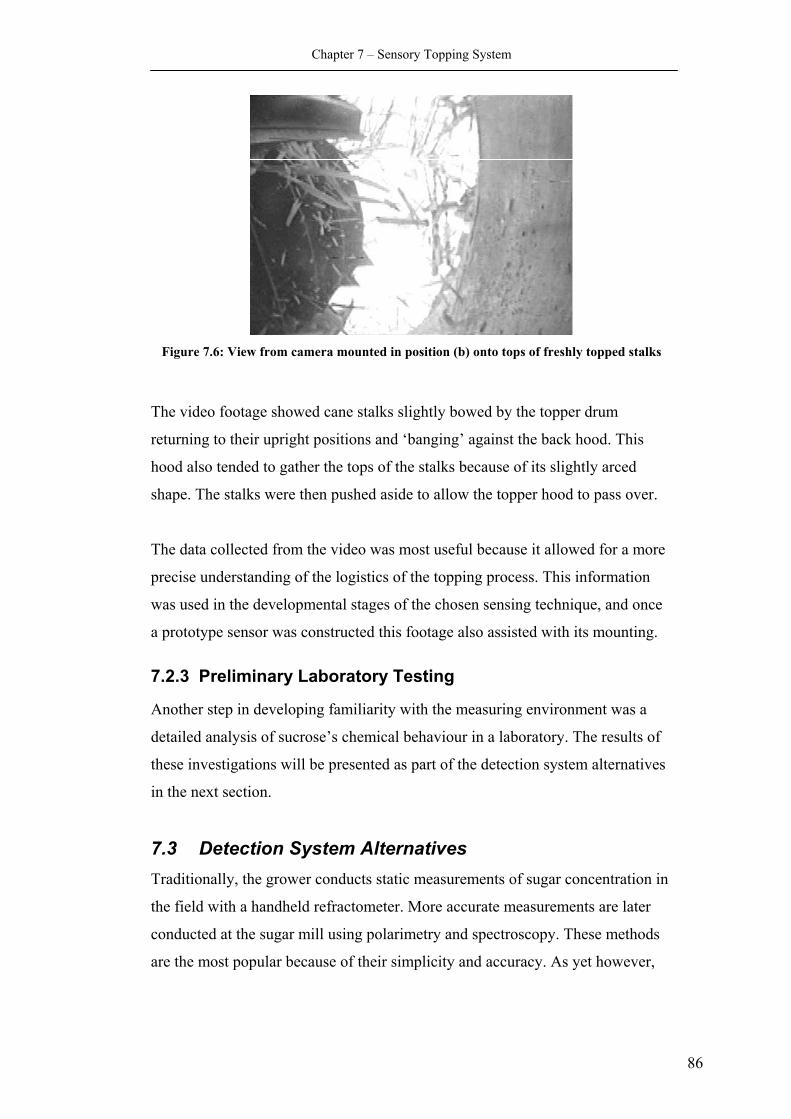
Chapter 7 – Sensory Topping System
Figure 7.6: View from camera mounted in position (b) onto tops of freshly topped stalks
ning to their upright positions and ‘banging’ against the back hood. This
d
ise understanding of the logistics of the topping process. This information
Preliminary Laboratory Testing
Another step in developing familiarity with the measuring environment was a
r in a laboratory. The results
System Alternatives itionally, the grower conducts static measurements of sugar concentration in
rate measurements are later
T
tur
.
rec
7.2.3
of
s
rad
he video footage showed cane stalks slightly bowed by the topper drum
re
hood also tended to gather the tops of the stalks because of its slightly arce
shape. The stalks were then pushed aside to allow the topper hood to pass over
The data collected from the video was most useful because it allowed for a more
p
was used in the developmental stages of the chosen sensing technique, and once
a prototype sensor was constructed this footage also assisted with its mounting.
detailed analysis of sucrose’s chemical behaviou
these investigations will be presented as part of the detection system alternative
in the next section.
7.3 DetectionT
the field with a handheld refractometer. More accu
conducted at the sugar mill using polarimetry and spectroscopy. These methods
are the most popular because of their simplicity and accuracy. As yet however,
86
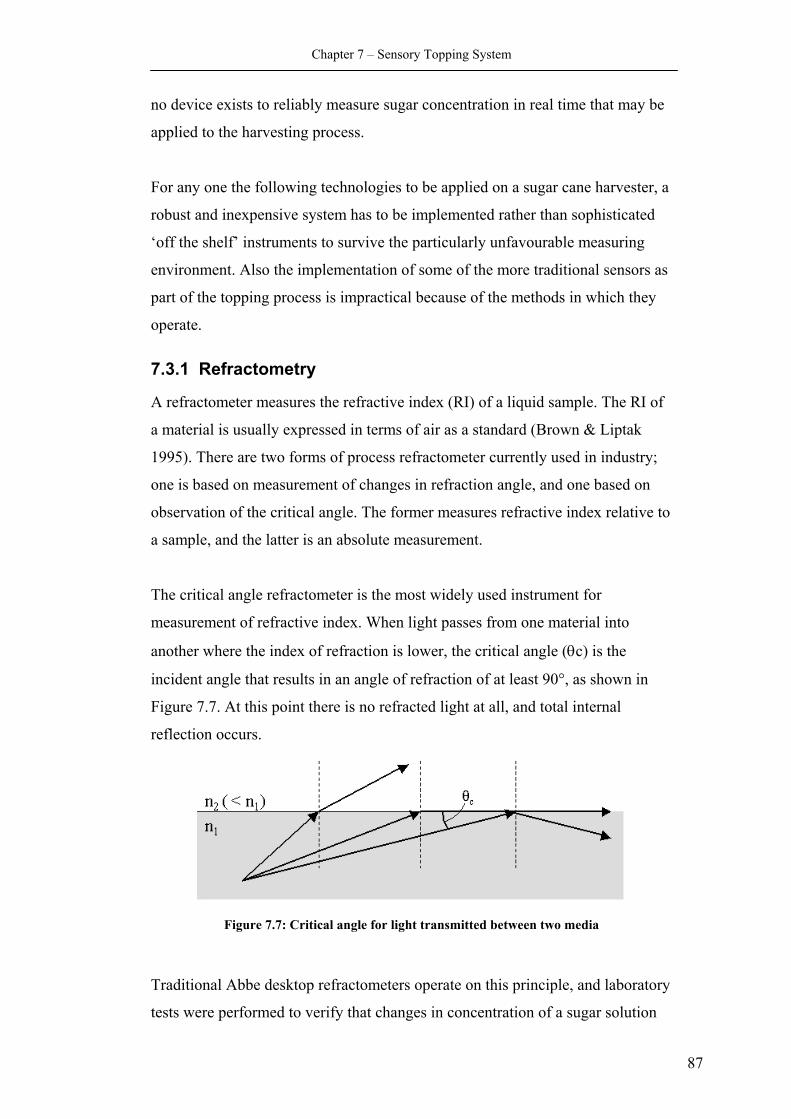
Chapter 7 – Sensory Topping System
no device exists to reliably measure sugar concentration in real time that may be
applied to the harvesting process.
or any one the following t n a sugar cane harvester, a
as
7.3.1 Refractometry
e refractive index (RI) of a liquid sample. The RI of
;
to
he critical angle refractometer is the most widely used instrument for
nto
n
F echnologies to be applied o
robust and inexpensive system has to be implemented rather than sophisticated
‘off the shelf’ instruments to survive the particularly unfavourable measuring
environment. Also the implementation of some of the more traditional sensors
part of the topping process is impractical because of the methods in which they
operate.
A refractometer measures th
a material is usually expressed in terms of air as a standard (Brown & Liptak
1995). There are two forms of process refractometer currently used in industry
one is based on measurement of changes in refraction angle, and one based on
observation of the critical angle. The former measures refractive index relative
a sample, and the latter is an absolute measurement.
T
measurement of refractive index. When light passes from one material i
another where the index of refraction is lower, the critical angle (θc) is the
incident angle that results in an angle of refraction of at least 90°, as shown
Figure 7.7. At this point there is no refracted light at all, and total internal
reflection occurs.
i
Figure 7.7: Critical angle for light transmitted between two media
raditional Abbe desktop refractometers operate on this principle, and laboratory
tests were performed to verify that changes in concentration of a sugar solution
T
87
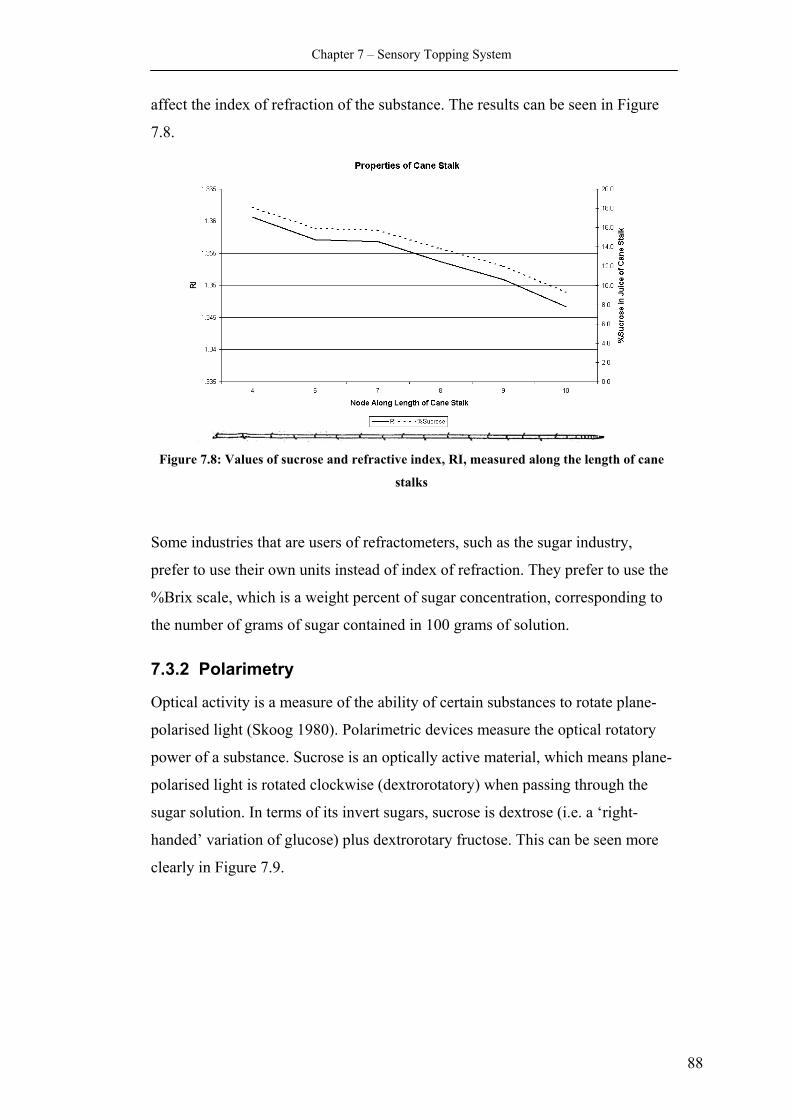
Chapter 7 – Sensory Topping System
affect the index of refraction of the substance. The results can be seen in Figure
7.8.
Figure 7.8: Values of sucrose and refractive index, RI, measured along the length of cane
stalks
Some industries that are users of refra ers, such as the sugar industry,
refer to use their own units instead of index of refraction. They prefer to use the
to
7.3.2 Polarimetry
Optical activity is a measure of the ability of certain substances to rotate plane-
980). Polarimetric devices measure the optical rotatory
e-
ctomet
p
%Brix scale, which is a weight percent of sugar concentration, corresponding
the number of grams of sugar contained in 100 grams of solution.
polarised light (Skoog 1
power of a substance. Sucrose is an optically active material, which means plan
polarised light is rotated clockwise (dextrorotatory) when passing through the
sugar solution. In terms of its invert sugars, sucrose is dextrose (i.e. a ‘right-
handed’ variation of glucose) plus dextrorotary fructose. This can be seen more
clearly in Figure 7.9.
88
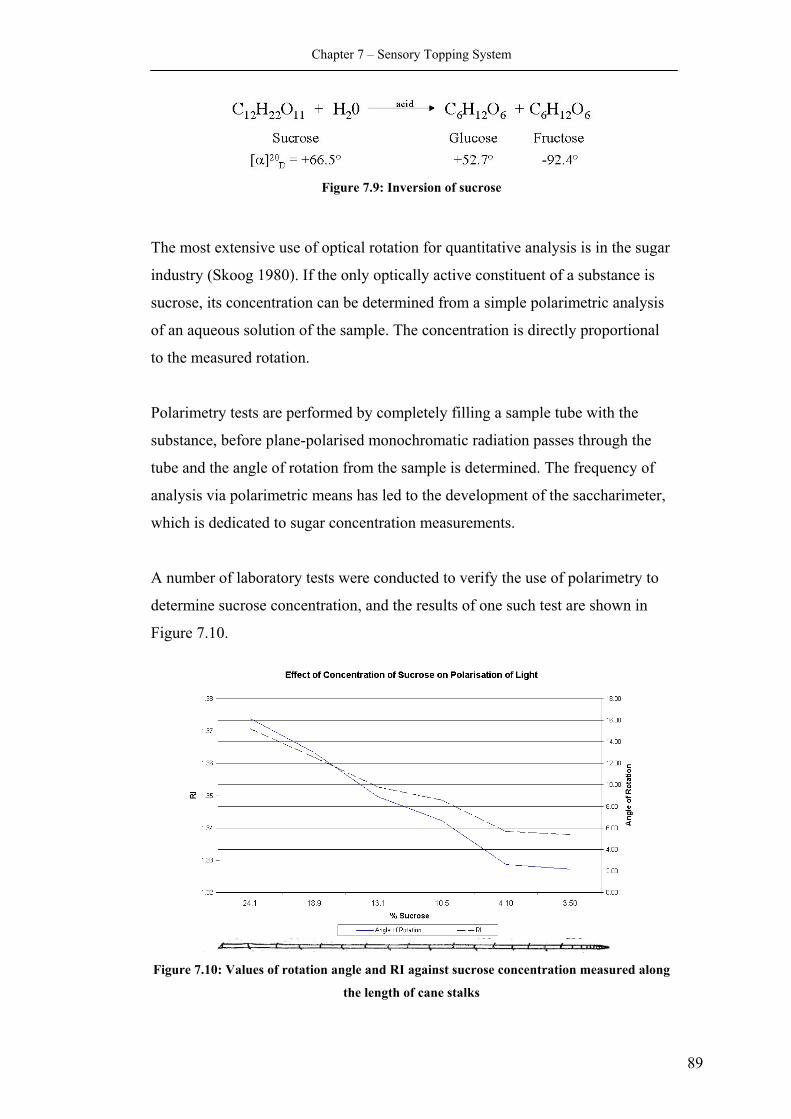
Chapter 7 – Sensory Topping System
Figure 7.9: Inversion of sucrose
The most extensive use of optical rotation for quantitative analysis is in the sugar
industry (Skoog 1980). If the only optically active constituent of a substance is
sucrose, its concentration can be determined from a simple polarimetric analysis
of an aqueous solution of the sample. The concentration is directly proportional
to the measured rotation.
Polarimetry tests are performed by completely filling a sample tube with the
substance, before plane-polarised monochromatic radiation passes through the
tube and the angle of rotation from the sample is determined. The frequency of
analysis via polarimetric means has led to the development of the saccharimeter,
which is dedicated to sugar concentration measurements.
A number of laboratory tests were conducted to verify the use of polarimetry to
determine sucrose concentration, and the results of one such test are shown in
Figure 7.10.
Figure 7.10: Values of rotation angle and RI against sucrose concentration measured along
the length of cane stalks
89
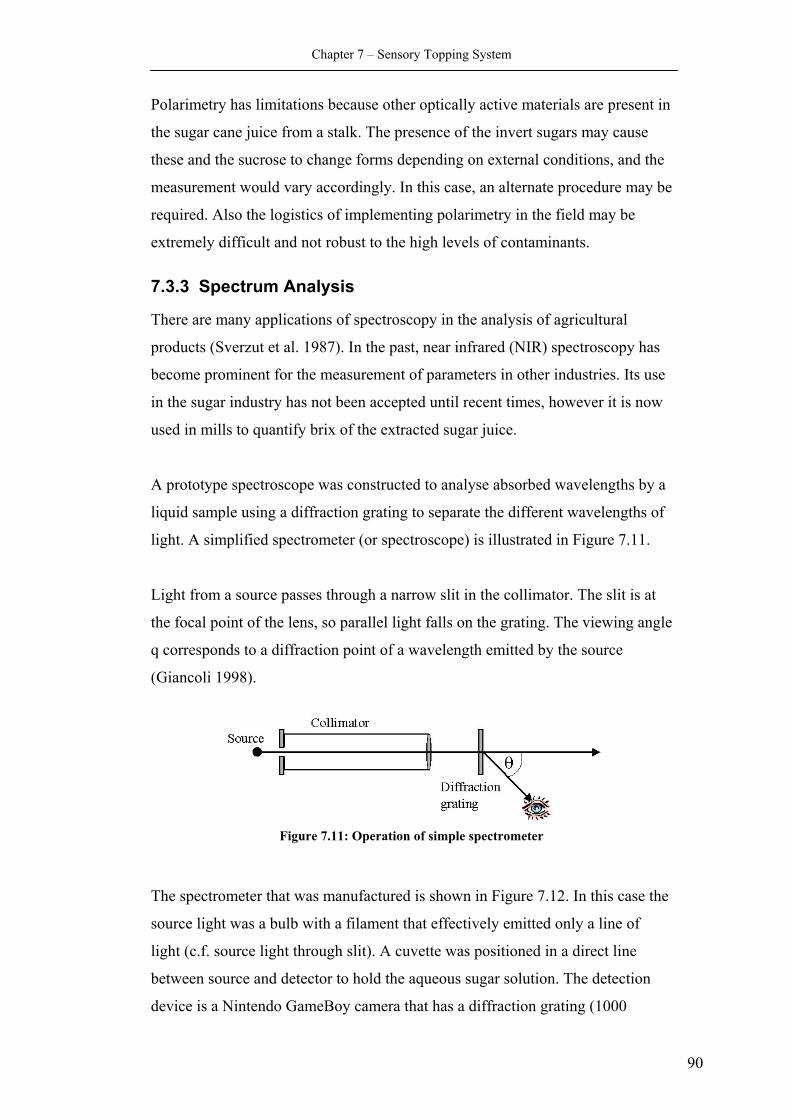
Chapter 7 – Sensory Topping System
Polarimetry has limitations because other optically active materials are present in
the sugar cane juice from a stalk. The presence of the invert sugars may cause
these and the sucrose to change forms depending on external conditions, and the
measurement would vary accordingly. In this case, an alternate procedure may be
required. Also the logistics of implementing polarimetry in the field may be
extremely difficult and not robust to the high levels of contaminants.
7.3.3 Spectrum Analysis
There are many applications of spectroscopy in the analysis of agricultural
products (Sverzut et al. 1987). In the past, near infrared (NIR) spectroscopy has
become prominent for the measurement of parameters in other industries. Its use
in the sugar industry has not been accepted until recent times, however it is now
used in mills to quantify brix of the extracted sugar juice.
A prototype spectroscope was constructed to analyse absorbed wavelengths by a
liquid sample using a diffraction grating to separate the different wavelengths of
light. A simplified spectrometer (or spectroscope) is illustrated in Figure 7.11.
Light from a source passes through a narrow slit in the collimator. The slit is at
the focal point of the lens, so parallel light falls on the grating. The viewing angle
q corresponds to a diffraction point of a wavelength emitted by the source
(Giancoli 1998).
Figure 7.11: Operation of simple spectrometer
The spectrometer that was manufactured is shown in Figure 7.12. In this case the
source light was a bulb with a filament that effectively emitted only a line of
light (c.f. source light through slit). A cuvette was positioned in a direct line
between source and detector to hold the aqueous sugar solution. The detection
device is a Nintendo GameBoy camera that has a diffraction grating (1000
90
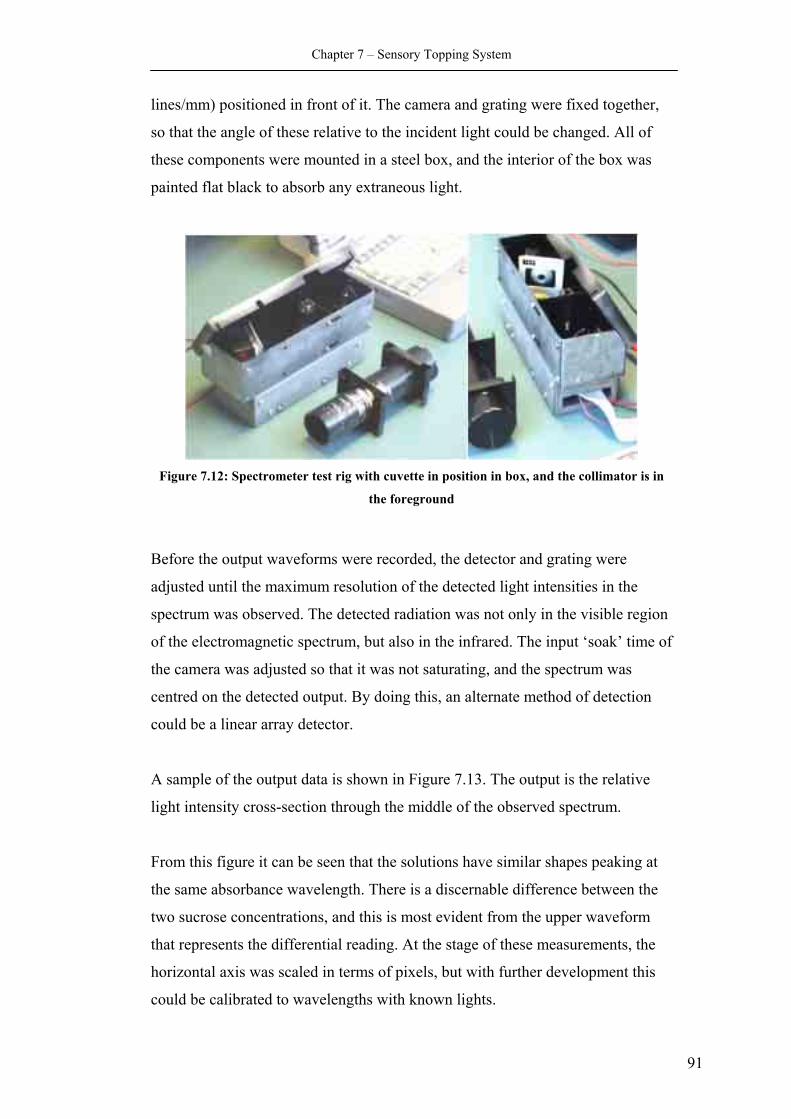
Chapter 7 – Sensory Topping System
lines/mm) positioned in front of it. The camera and grating were fixed together,
so that the angle of these relative to the incident light could be changed. All of
these components were mounted in a steel box, and the interior of the box was
painted flat black to absorb any extraneous light.
Figure 7.12: Spectrometer test rig with cuvette in position in box, and the collimator is in
the foreground
Before the output waveforms were recorded, the detector and grating were
adjusted until the maximum resolution of the detected light intensities in the
spectrum was observed. The detected radiation was not only in the visible region
of the electromagnetic spectrum, but also in the infrared. The input ‘soak’ time of
the camera was adjusted so that it was not saturating, and the spectrum was
centred on the detected output. By doing this, an alternate method of detection
could be a linear array detector.
A sample of the output data is shown in Figure 7.13. The output is the relative
light intensity cross-section through the middle of the observed spectrum.
From this figure it can be seen that the solutions have similar shapes peaking at
the same absorbance wavelength. There is a discernable difference between the
two sucrose concentrations, and this is most evident from the upper waveform
that represents the differential reading. At the stage of these measurements, the
horizontal axis was scaled in terms of pixels, but with further development this
could be calibrated to wavelengths with known lights.
91
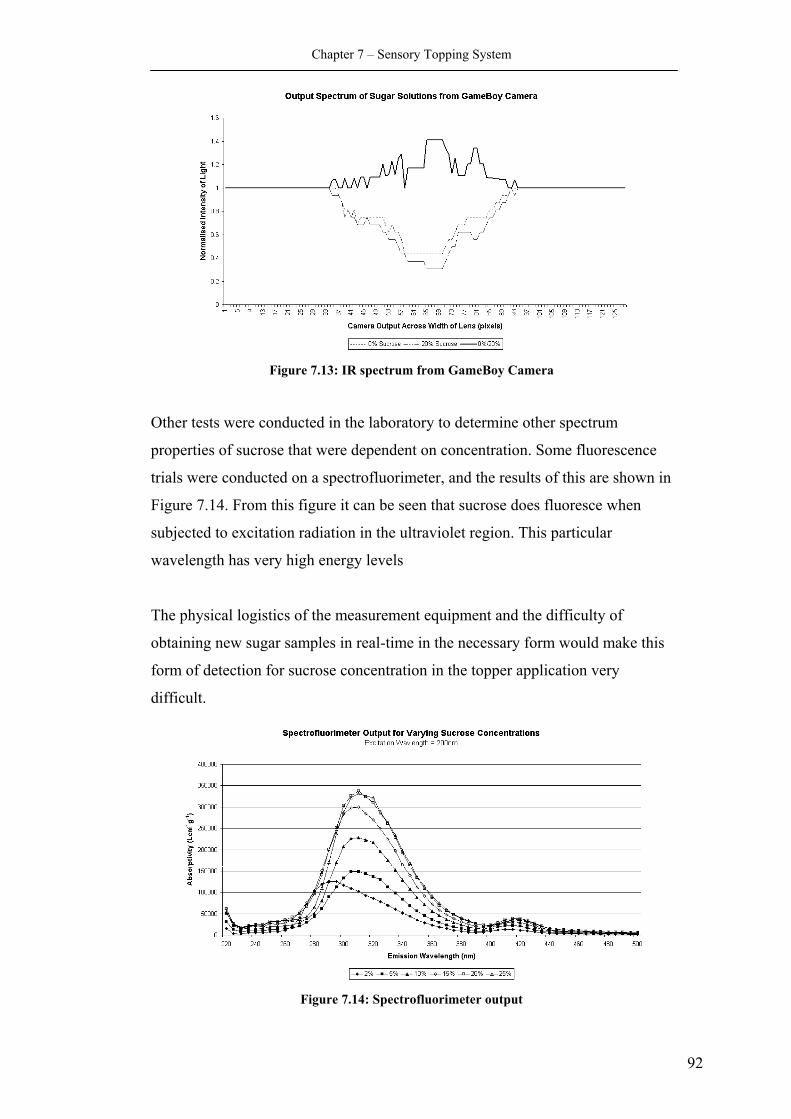
Chapter 7 – Sensory Topping System
Figure 7.13: IR spectrum from GameBoy Camera
Other tests were conducted in the laboratory to determine other spectrum
properties of sucrose that were dependent on concentration. Some fluorescence
trials were conducted on a spectrofluorimeter, and the results of this are shown in
Figure 7.14. From this figure it can be seen that sucrose does fluoresce when
subjected to excitation radiation in the ultraviolet region. This particular
wavelength has very high energy levels
The physical logistics of the measurement equipment and the difficulty of
obtaining new sugar samples in real-time in the necessary form would make this
form of detection for sucrose concentration in the topper application very
difficult.
Figure 7.14: Spectrofluorimeter output
92
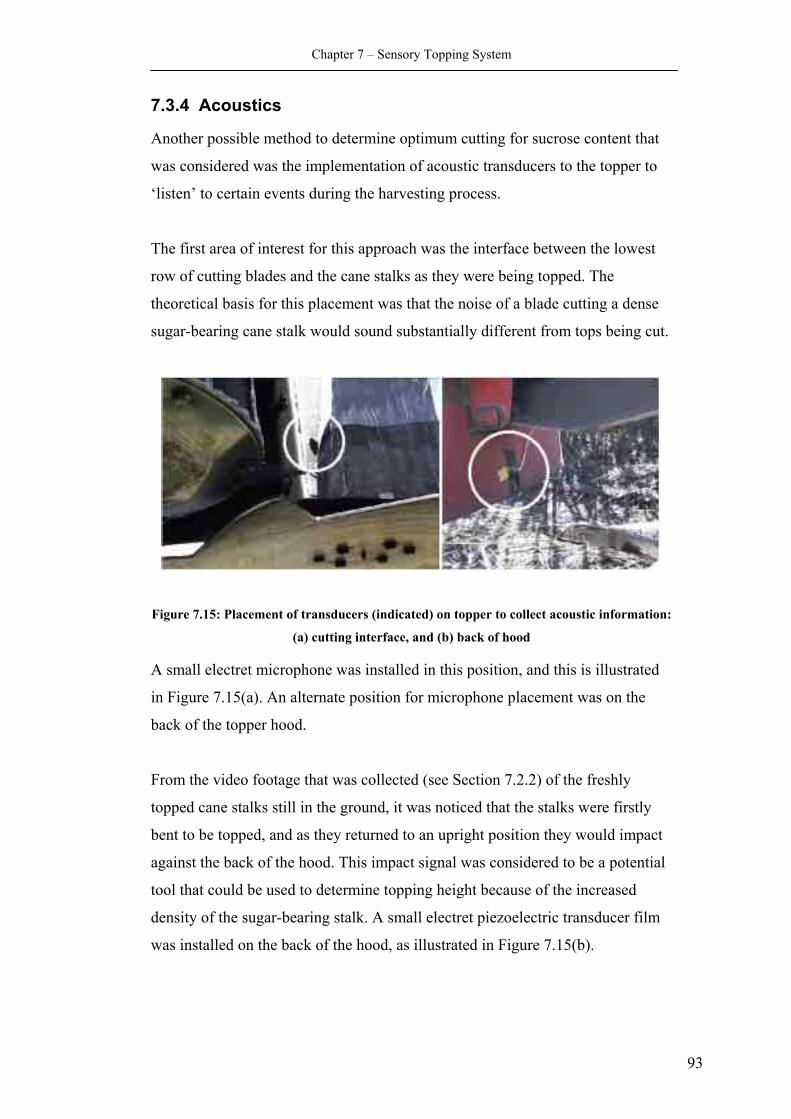
Chapter 7 – Sensory Topping System
7.3.4 Acoustics
od to determine optimum cutting for sucrose content that
was considered was the implementation of acoustic transducers to the topper to
‘listen’ to certain events during the harvesting process.
he first area of interest for this approach was the interface between the lowest
row of cutting blades and the cane stalks as they were being topped. The
theoretical basis for this placement was that the noise of a blade cutting a dense
A small electret microphone was installed in this position, and this is illustrated
in Figure 7.15(a). An alternate position for microphone placement was on the
back of the topper hood.
From the video footage that was collected (see Section 7.2.2) of the freshly
topped cane stalks still in the ground, it was noticed that the stalks were firstly
bent to be topped, and as they returned to an upright position they would impact
against the back of the hood. This impact signal was considered to be a potential
tool that could be used to determine topping height because of the increased
density of the sugar-bearing stalk. A small electret piezoelectric transducer film
was installed on the back of the hood, as illustrated in Figure 7.15(b).
Another possible meth
T
sugar-bearing cane stalk would sound substantially different from tops being cut.
igure 7.15: Placement of transducers (indicated) on topper to collect acoustic information:
(a) cutting interface, and (b) back of hood
F
93
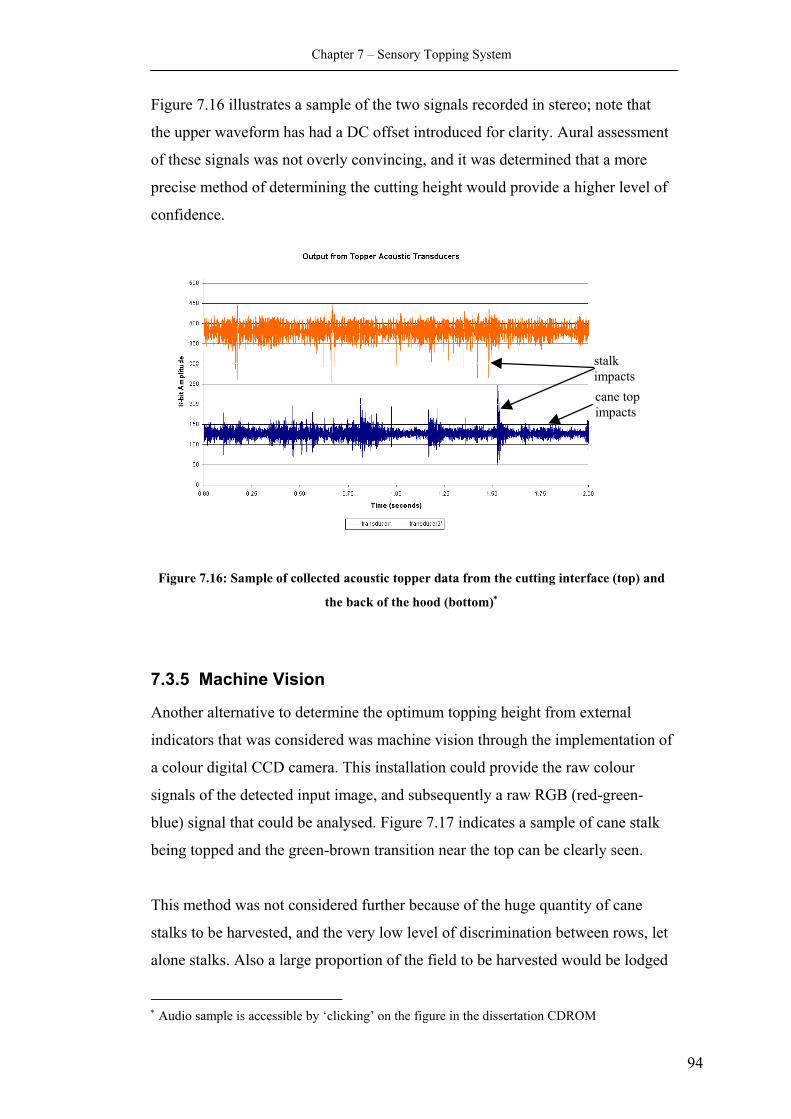
Chapter 7 – Sensory Topping System
Figure 7.16 illustrates a sample of the two signals recorded in stereo; note that
the upper waveform has had a DC offset introduced for clarity. Aural assessment
of these signals was not overly convincing, and it was determined that a more
precise method of determining the cutting height would provide a higher level of
confidence.
Figure 7.16: Sample of collected acoustic topper data from the cutting interface (top) and
the back of the hood (bottom)∗
7.3.5 Machine Vision
Another alternative to determine the optimum topping height from external
indicators that was considered was machine vision through the implementation of
a colour digital CCD camera. This installation could provide the raw colour
signals of the detected input image, and subsequently a raw RGB (red-green-
blue) signal that could be analysed. Figure 7.17 indicates a sample of cane stalk
being topped and the green-brown transition near the top can be clearly seen.
This method was not considered further because of the huge quantity of cane
stalks to be harvested, and the very low level of discrimination between rows, let
alone stalks. Also a large proportion of the field to be harvested would be lodged
stalk impacts cane top impacts
94
∗ Audio sample is accessible by ‘clicking’ on the figure in the dissertation CDROM
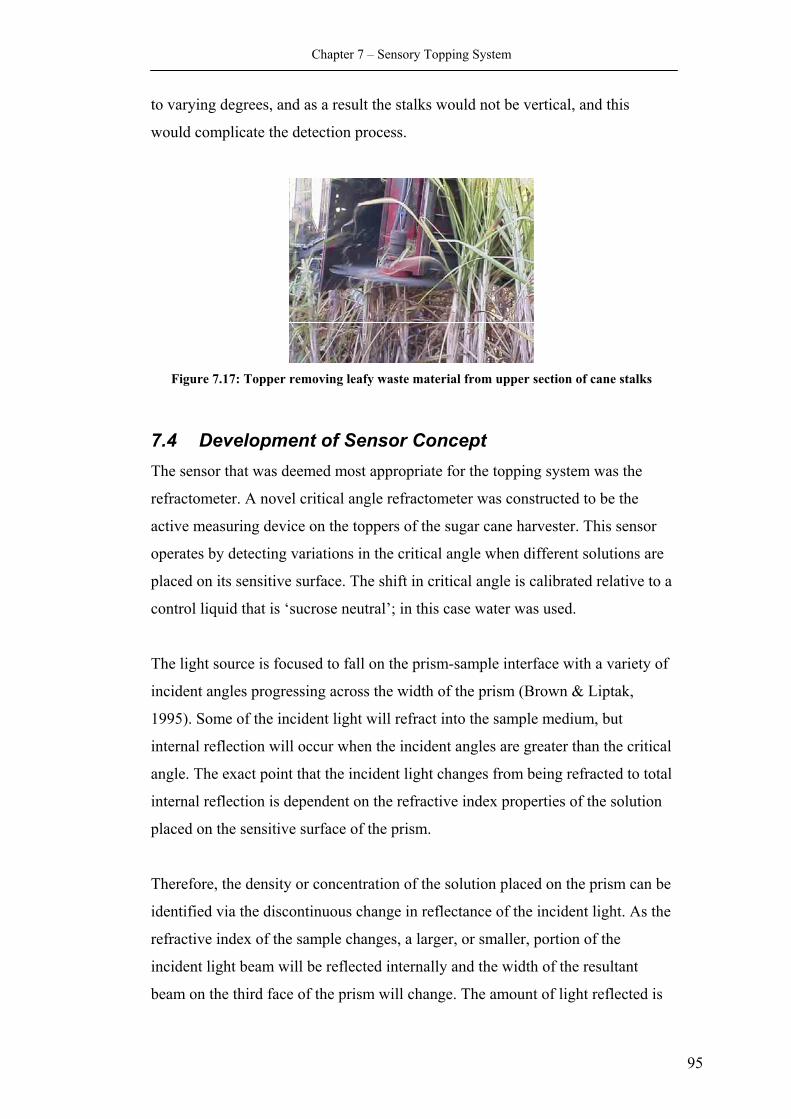
Chapter 7 – Sensory Topping System
to varying degrees, and as a result the stalks would not be vertical, and this
would complicate the detection process.
Figure 7.17: Topper removing leafy waste material from upper section of cane stalks
7.4 Development of Sensor Concept The sensor that was deemed most appropriate for the topping system was the
refractometer. A novel critical angle refractometer was constructed to be the
active measuring device on the toppers of the sugar cane harvester. This sensor
operates by detecting variations in the critical angle when different solutions are
placed on its sensitive surface. The shift in critical angle is calibrated relative to a
control liquid that is ‘sucrose neutral’; in this case water was used.
The light source is focused to fall on the prism-sample interface with a variety of
incident angles progressing across the width of the prism (Brown & Liptak,
1995). Some of the incident light will refract into the sample medium, but
internal reflection will occur when the incident angles are greater than the critical
angle. The exact point that the incident light changes from being refracted to total
internal reflection is dependent on the refractive index properties of the solution
placed on the sensitive surface of the prism.
Therefore, the density or concentration of the solution placed on the prism can be
identified via the discontinuous change in reflectance of the incident light. As the
refractive index of the sample changes, a larger, or smaller, portion of the
incident light beam will be reflected internally and the width of the resultant
beam on the third face of the prism will change. The amount of light reflected is
95
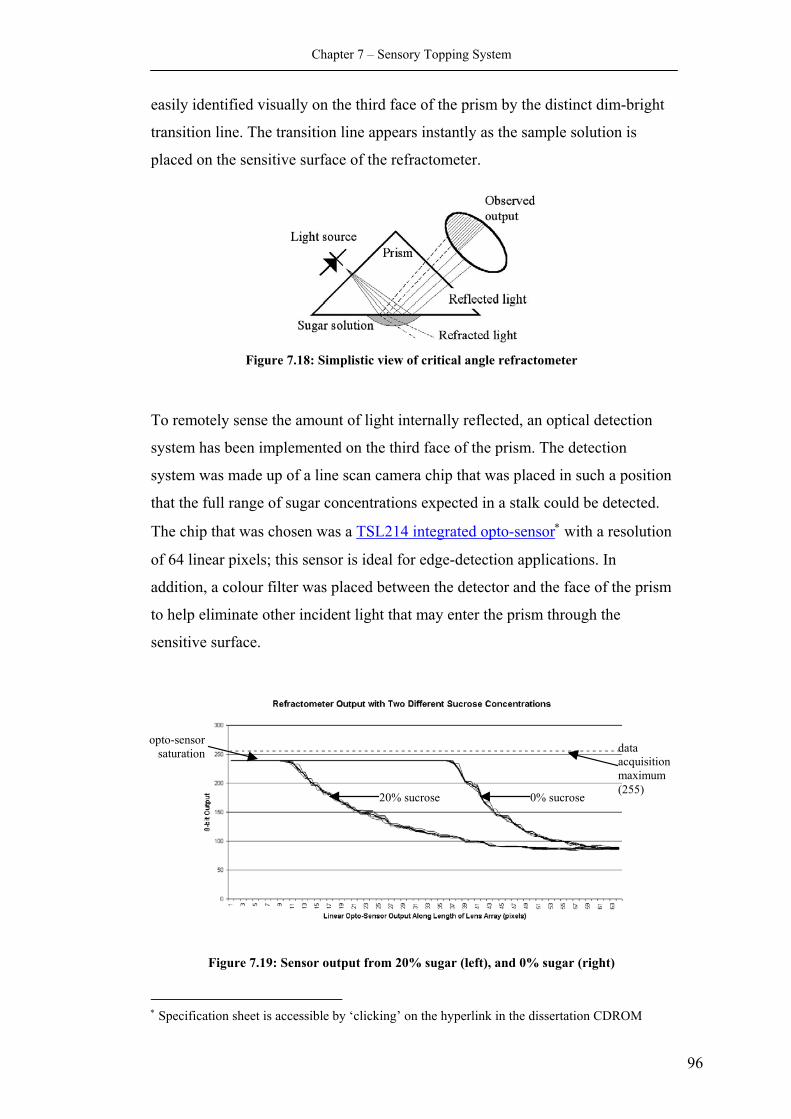
Chapter 7 – Sensory Topping System
easily identified visually on the third face of the prism by the distinct dim-bright
transition line. The transition line appears instantly as the sample solution is
placed on the sensitive surface of the refractometer.
Figure 7.18: Simplistic view of critical angle refractometer
To remotely sense the amount of light internally reflected, an optical detection
system has been implemented on the third face of the prism. The detection
system was made up of a line scan camera chip that was placed in such a position
that the full range of sugar concentrations expected in a stalk could be detected.
The chip that was chosen was a TSL214 integrated opto-sensor∗ with a resolution
of 64 linear pixels; this sensor is ideal for edge-detection applications. In
addition, a colour filter was placed between the detector and the face of the prism
to help eliminate other incident light that may enter the prism through the
sensitive surface.
opto-sensor saturation data
acquisition maximum (255)
0% sucrose 20% sucrose
Figure 7.19: Sensor output from 20% sugar (left), and 0% sugar (right)
96
∗ Specification sheet is accessible by ‘clicking’ on the hyperlink in the dissertation CDROM

Chapter 7 – Sensory Topping System
Preliminary trials and analyses in the laboratory have indicated a strong
correlation between the output of this device and the traditional Abbe desktop
refractometer.
7.5 Chapter Summary The topper of the cane harvester is a difficult operation to control accurately, and
as a result this function is often neglected. Numerous methods were considered
potentially useful for determining the optimum topping height. These methods
detected height from both internal and external indicators on the sugar cane stalk.
One promising method to accurately and reliably measure sugar concentration at
the top of cane stalks in real-time during the harvesting process has been
described. This information could possibly be used to optimise the topping height
of the cane by either automatically controlling the height of the topper operation,
or by providing relevant information to the harvester operator.
The next step for the sensor was the transition to field-testing for further
evaluation.
97
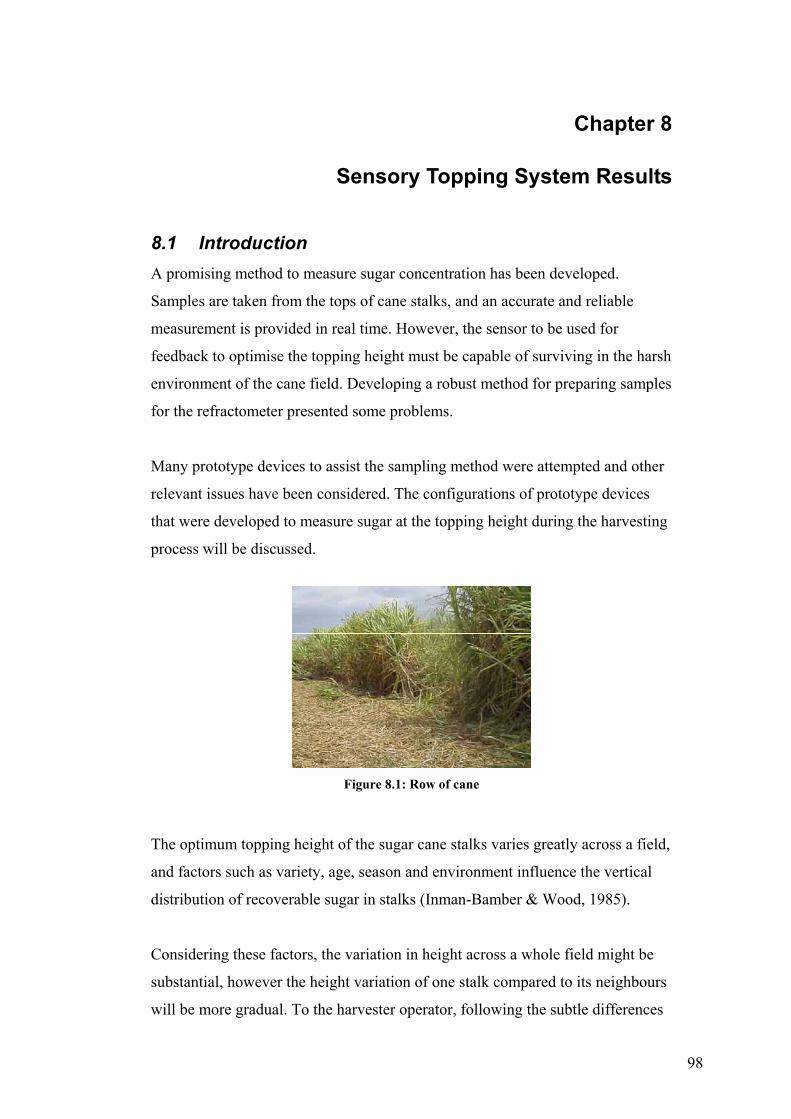
Chapter 8
Sensory Topping System Results
8.1 Introduction A promising method to measure sugar concentration has been developed.
Samples are taken from the tops of cane stalks, and an accurate and reliable
measurement is provided in real time. However, the sensor to be used for
feedback to optimise the topping height must be capable of surviving in the harsh
environment of the cane field. Developing a robust method for preparing samples
for the refractometer presented some problems.
Many prototype devices to assist the sampling method were attempted and other
relevant issues have been considered. The configurations of prototype devices
that were developed to measure sugar at the topping height during the harvesting
process will be discussed.
Figure 8.1: Row of cane
The optimum topping height of the sugar cane stalks varies greatly across a field,
and factors such as variety, age, season and environment influence the vertical
distribution of recoverable sugar in stalks (Inman-Bamber & Wood, 1985).
Considering these factors, the variation in height across a whole field might be
substantial, however the height variation of one stalk compared to its neighbours
will be more gradual. To the harvester operator, following the subtle differences
98
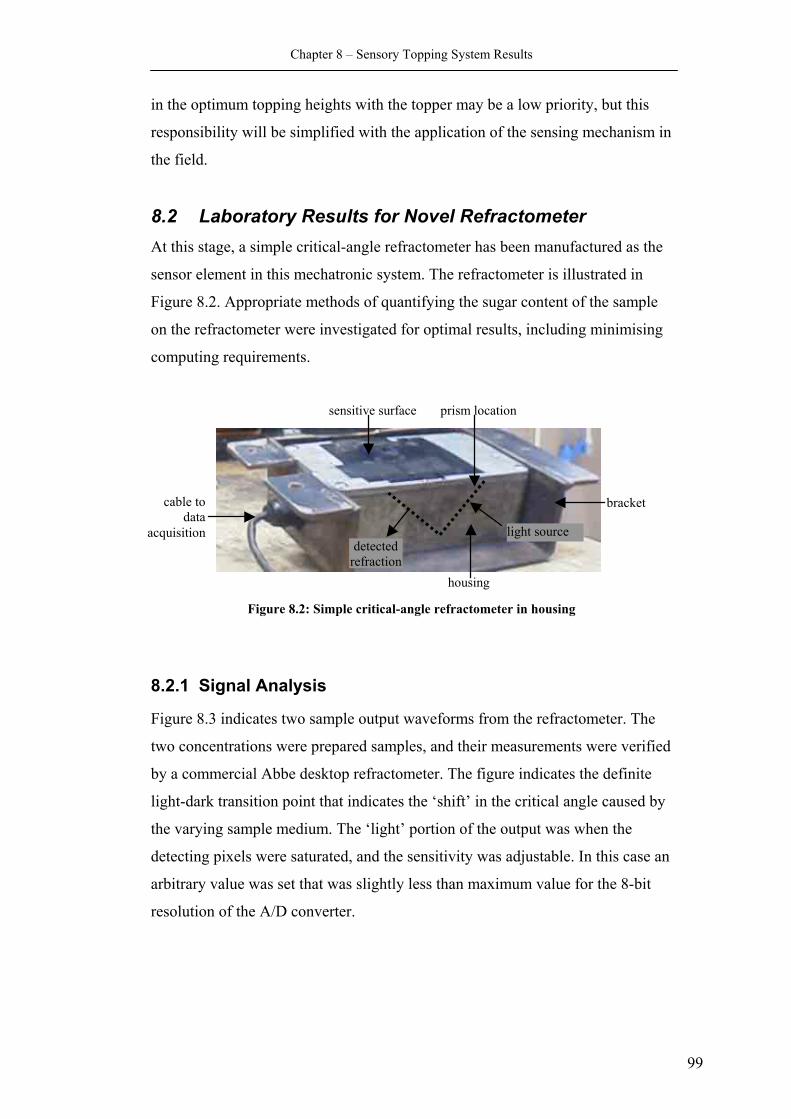
Chapter 8 – Sensory Topping System Results
in the optimum topping heights with the topper may be a low priority, but this
responsibility will be simplified with the application of the sensing mechanism in
the field.
8.2 Laboratory Results for Novel Refractometer At this stage, a simple critical-angle refractometer has been manufactured as the
sensor element in this mechatronic system. The refractometer is illustrated in
Figure 8.2. Appropriate methods of quantifying the sugar content of the sample
on the refractometer were investigated for optimal results, including minimising
computing requirements.
light source detected
refraction
bracket cable to data
acquisition
sensitive surface
housing
prism location
Figure 8.2: Simple critical-angle refractometer in housing
8.2.1 Signal Analysis
Figure 8.3 indicates two sample output waveforms from the refractometer. The
two concentrations were prepared samples, and their measurements were verified
by a commercial Abbe desktop refractometer. The figure indicates the definite
light-dark transition point that indicates the ‘shift’ in the critical angle caused by
the varying sample medium. The ‘light’ portion of the output was when the
detecting pixels were saturated, and the sensitivity was adjustable. In this case an
arbitrary value was set that was slightly less than maximum value for the 8-bit
resolution of the A/D converter.
99
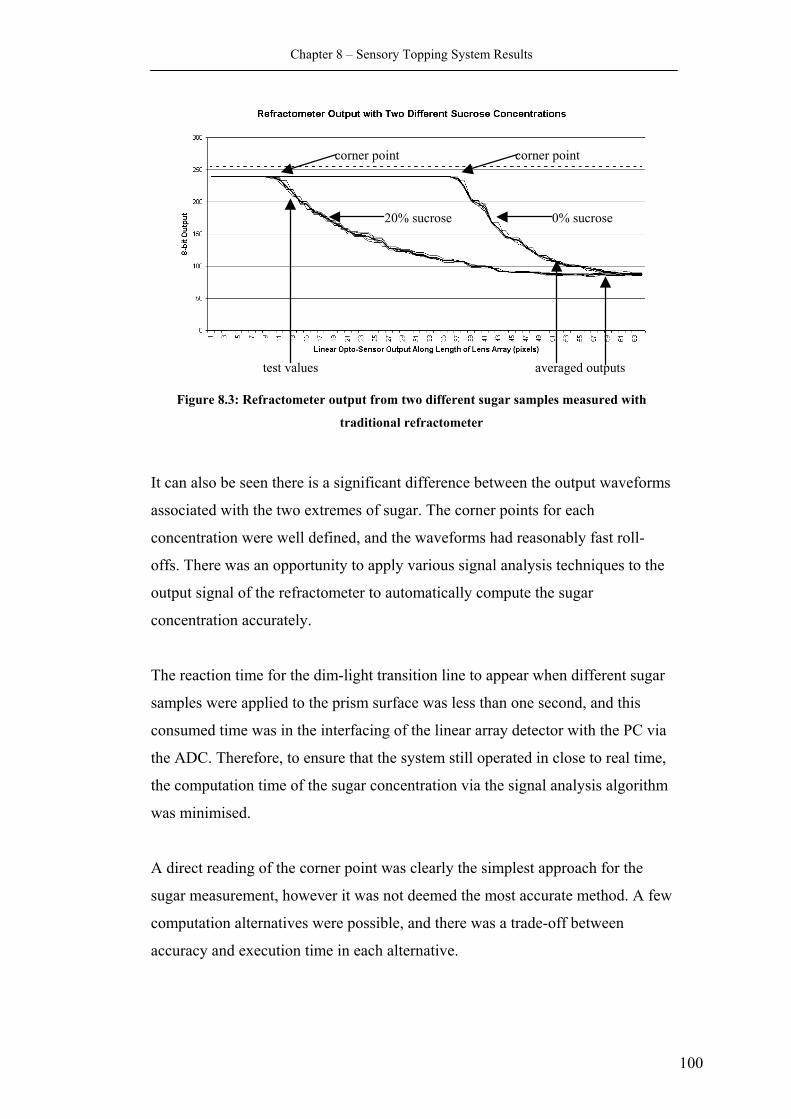
Chapter 8 – Sensory Topping System Results
corner point
0% sucrose 20% sucrose
corner point
averaged outputs test values
Figure 8.3: Refractometer output from two different sugar samples measured with
traditional refractometer
It can also be seen there is a significant difference between the output waveforms
associated with the two extremes of sugar. The corner points for each
concentration were well defined, and the waveforms had reasonably fast roll-
offs. There was an opportunity to apply various signal analysis techniques to the
output signal of the refractometer to automatically compute the sugar
concentration accurately.
The reaction time for the dim-light transition line to appear when different sugar
samples were applied to the prism surface was less than one second, and this
consumed time was in the interfacing of the linear array detector with the PC via
the ADC. Therefore, to ensure that the system still operated in close to real time,
the computation time of the sugar concentration via the signal analysis algorithm
was minimised.
A direct reading of the corner point was clearly the simplest approach for the
sugar measurement, however it was not deemed the most accurate method. A few
computation alternatives were possible, and there was a trade-off between
accuracy and execution time in each alternative.
100
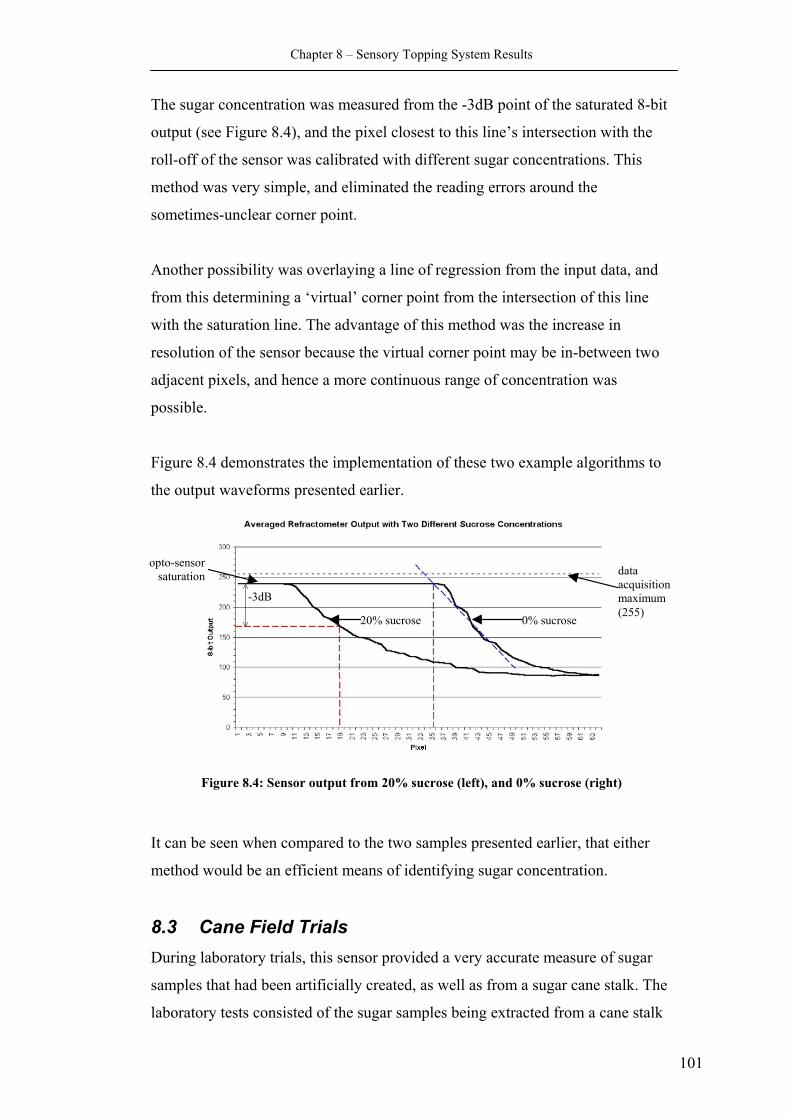
Chapter 8 – Sensory Topping System Results
The sugar concentration was measured from the -3dB point of the saturated 8-bit
output (see Figure 8.4), and the pixel closest to this line’s intersection with the
roll-off of the sensor was calibrated with different sugar concentrations. This
method was very simple, and eliminated the reading errors around the
sometimes-unclear corner point.
Another possibility was overlaying a line of regression from the input data, and
from this determining a ‘virtual’ corner point from the intersection of this line
with the saturation line. The advantage of this method was the increase in
resolution of the sensor because the virtual corner point may be in-between two
adjacent pixels, and hence a more continuous range of concentration was
possible.
Figure 8.4 demonstrates the implementation of these two example algorithms to
the output waveforms presented earlier.
Figure 8.4: Sensor output from 20% sucrose (left), and 0% sucrose (right)
It can be seen when compared to the two samples presented earlier, that either
method would be an efficient means of identifying sugar concentration.
8.3 Cane Field Trials During laboratory trials, this sensor provided a very accurate measure of sugar
samples that had been artificially created, as well as from a sugar cane stalk. The
laboratory tests consisted of the sugar samples being extracted from a cane stalk
opto-sensor saturation data
acquisition maximum (255)
0% sucrose 20% sucrose
-3dB
101
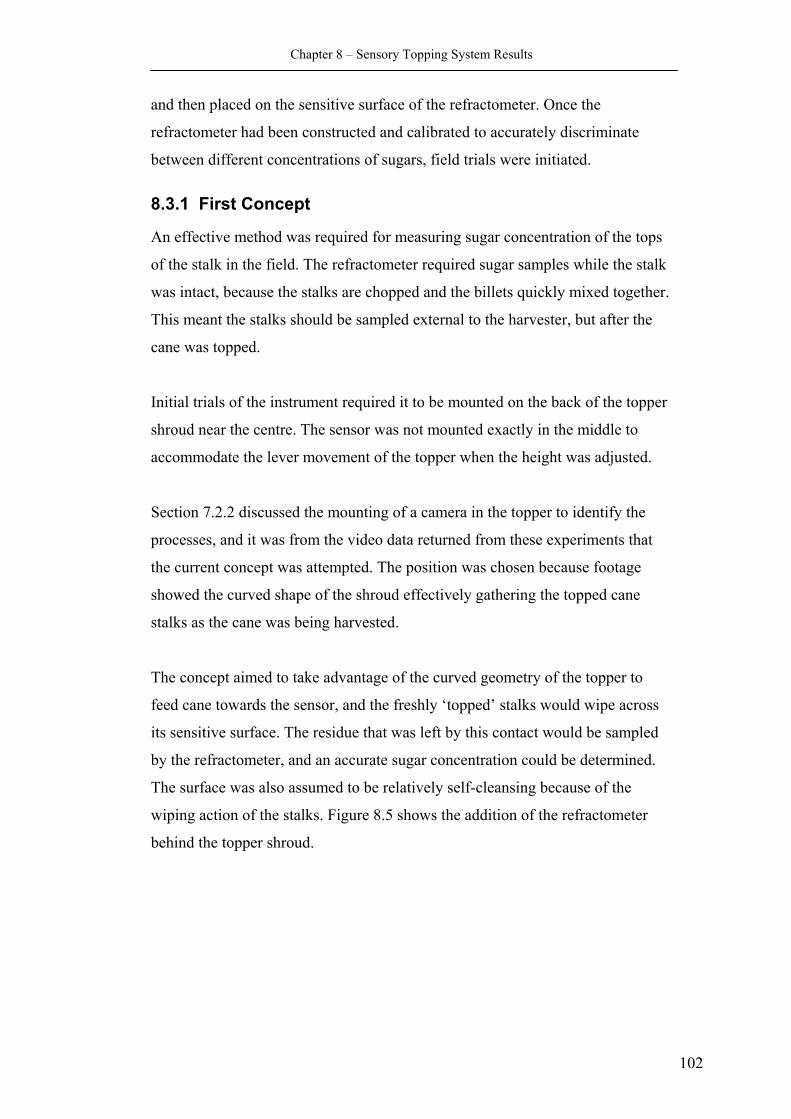
Chapter 8 – Sensory Topping System Results
and then placed on the sensitive surface of the refractometer. Once the
refractometer had been constructed and calibrated to accurately discrim
between different concentrations of sugars, field trials were initiated.
inate
8.3.1 First Concept
quired for measuring sugar concentration of the tops
itial trials of the instrument required it to be mounted on the back of the topper
.
ection 7.2.2 discussed the mounting of a camera in the topper to identify the
he concept aimed to take advantage of the curved geometry of the topper to
s
r
An effective method was re
of the stalk in the field. The refractometer required sugar samples while the stalk
was intact, because the stalks are chopped and the billets quickly mixed together.
This meant the stalks should be sampled external to the harvester, but after the
cane was topped.
In
shroud near the centre. The sensor was not mounted exactly in the middle to
accommodate the lever movement of the topper when the height was adjusted
S
processes, and it was from the video data returned from these experiments that
the current concept was attempted. The position was chosen because footage
showed the curved shape of the shroud effectively gathering the topped cane
stalks as the cane was being harvested.
T
feed cane towards the sensor, and the freshly ‘topped’ stalks would wipe acros
its sensitive surface. The residue that was left by this contact would be sampled
by the refractometer, and an accurate sugar concentration could be determined.
The surface was also assumed to be relatively self-cleansing because of the
wiping action of the stalks. Figure 8.5 shows the addition of the refractomete
behind the topper shroud.
102
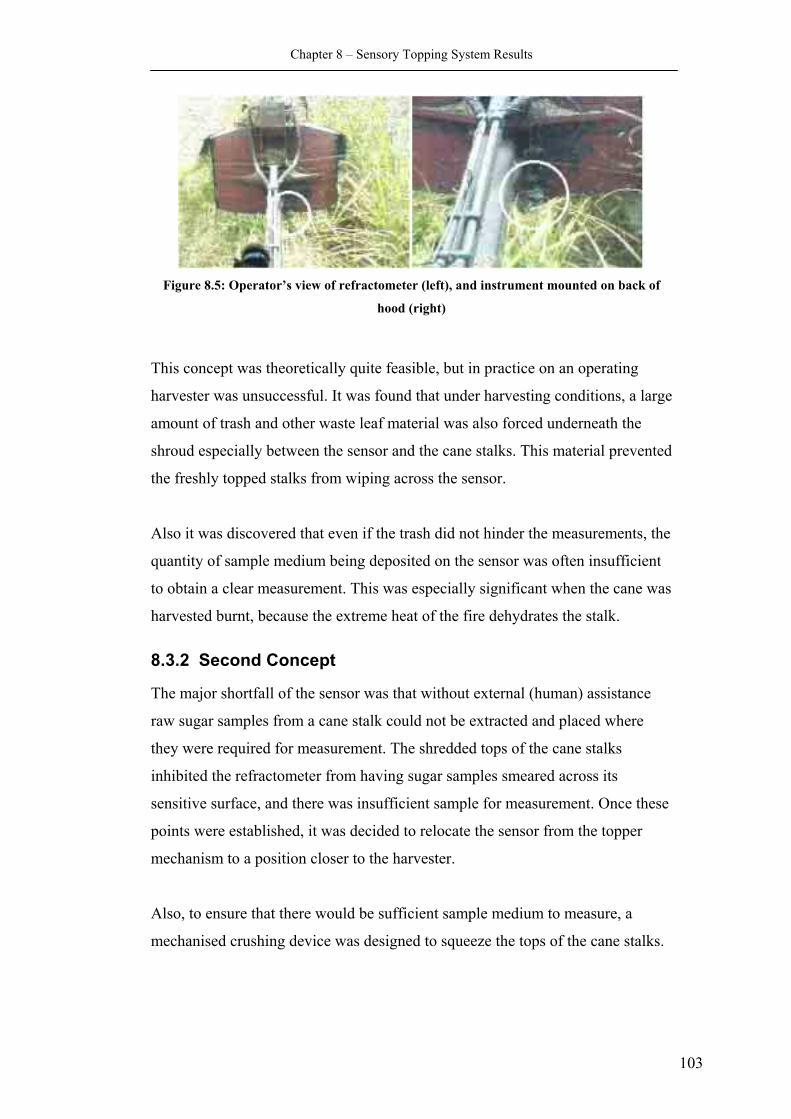
Chapter 8 – Sensory Topping System Results
Figure 8.5: Operator’s view of refractometer (left), and instrument mounted on back of
hood (right)
This concept was theoretically quite feasible, but in practice on an operating
harvester was unsuccessful. It was found that under harvesting conditions, a large
amount of trash and other waste leaf material was also forced underneath the
shroud especially between the sensor and the cane stalks. This material prevented
the freshly topped stalks from wiping across the sensor.
Also it was discovered that even if the trash did not hinder the measurements, the
quantity of sample medium being deposited on the sensor was often insufficient
to obtain a clear measurement. This was especially significant when the cane was
harvested burnt, because the extreme heat of the fire dehydrates the stalk.
8.3.2 Second Concept
The major shortfall of the sensor was that without external (human) assistance
raw sugar samples from a cane stalk could not be extracted and placed where
they were required for measurement. The shredded tops of the cane stalks
inhibited the refractometer from having sugar samples smeared across its
sensitive surface, and there was insufficient sample for measurement. Once these
points were established, it was decided to relocate the sensor from the topper
mechanism to a position closer to the harvester.
Also, to ensure that there would be sufficient sample medium to measure, a
mechanised crushing device was designed to squeeze the tops of the cane stalks.
103
Chapter 8 – Sensory Topping System Results
The sampling concept for the squashing mechanism was to test the juice
extracted at particular heights by the mechanism, starting high in the leafy tops
and gradually lowering the topper until the transition section was detected.
The squashing mechanism was to be mounted on the topper arm. This was
chosen because the height of the crushing was always then going to be
proportional to the lowest cutting plane of the topper.
Static load frame tests were performed along the length of cane stalks to
determine the force required to deform the cross-section. The load was
incremented until an adequate amount of juice sample was extracted that would
enable a measurement of sugar concentration. The amount of deformation
required for this was up to approximately 30% deformation. The results of these
trials are illustrated in Figure 8.6.
Figure 8.6: Results of deformed stalk cross-sections
The trials were conducted on the internode above and below the optimum
topping height. As can be seen from the figure, the load required for the 30%
deformation varied by up to 400 N over the transition section of the mature cane
stalk: from approximately 800 N to 400 N respectively.
104
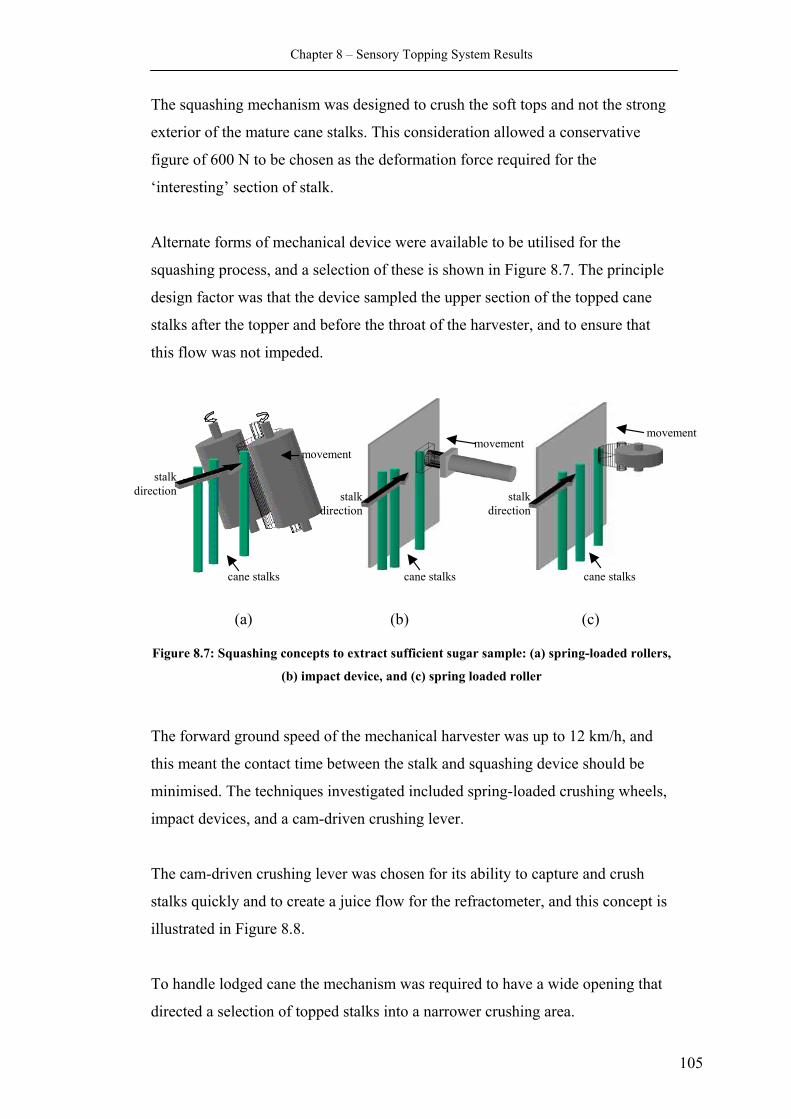
Chapter 8 – Sensory Topping System Results
The squashing mechanism was designed to crush the soft tops and not the strong
exterior of the mature cane stalks. This consideration allowed a conservative
figure of 600 N to be chosen as the deformation force required for the
‘interesting’ section of stalk.
Alternate forms of mechanical device were available to be utilised for the
squashing process, and a selection of these is shown in Figure 8.7. The principle
design factor was that the device sampled the upper section of the topped cane
stalks after the topper and before the throat of the harvester, and to ensure that
this flow was not impeded.
cane stalks cane stalks cane stalks
movementmovement
movement
stalk direction stalk
directionstalk
direction
(a) (b) (c)
Figure 8.7: Squashing concepts to extract sufficient sugar sample: (a) spring-loaded rollers,
(b) impact device, and (c) spring loaded roller
The forward ground speed of the mechanical harvester was up to 12 km/h, and
this meant the contact time between the stalk and squashing device should be
minimised. The techniques investigated included spring-loaded crushing wheels,
impact devices, and a cam-driven crushing lever.
The cam-driven crushing lever was chosen for its ability to capture and crush
stalks quickly and to create a juice flow for the refractometer, and this concept is
illustrated in Figure 8.8.
To handle lodged cane the mechanism was required to have a wide opening that
directed a selection of topped stalks into a narrower crushing area.
105
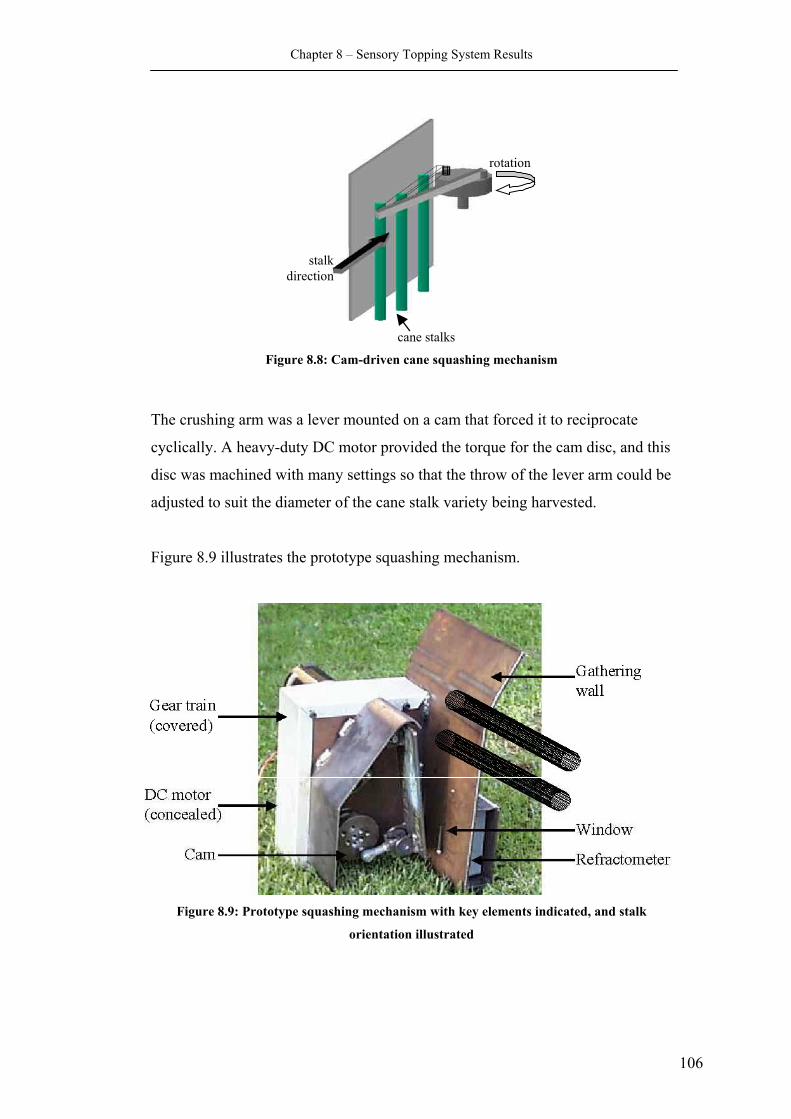
Chapter 8 – Sensory Topping System Results
Figure 8.8: Cam-driven cane squashing mechanism
The crushing arm was a lever mounted on a cam that forced it to reciprocate
cyclically. A heavy-duty DC motor provided the torque for the cam disc, and this
disc was machined with many settings so that the throw of the lever arm could be
adjusted to suit the diameter of the cane stalk variety being harvested.
Figure 8.9 illustrates the prototype squashing mechanism.
cane stalks
rotation
stalk direction
Figure 8.9: Prototype squashing mechanism with key elements indicated, and stalk
orientation illustrated
106
Chapter 8 – Sensory Topping System Results
The selected DC motor had inadequate torque to generate the required amount of
force to deform the top section of stalks. The required torque was generated via a
gear train to provide the necessary mechanical advantage. The ratio required was
calculated to be up to 30:1 as shown below.
IN
OUT
IN
OUT
OUT
IN
rr
ττ
ωω
=== advantage Mechanical
where ω is the angular velocity of the indicated gear
r is the radius of the indicated gear
τ is the torque at the nominated position
and the subscripts ‘in’ and ‘out’ represent the input
and output stages of the gear train
A nominal radius of 25mm was selected for the gear, and in these calculations
this is effectively the lever arm. From §8.3.2 it was determined that a force of
600 N was required to deform the top section of a cane stalk. These values give a
required torque, τOUT of 15 Nm. The maximum torque available from the
selected dc motor, τIN, was 0.576 Nm.
ratiogear Required 26576.015
=≈===IN
OUT
IN
OUT
OUT
IN
rr
ττ
ωω
Captured stalks were crushed between the lever and the stationary back wall. The
periodic throw generated by the cam allows stalks to be captured, crushed and
released in a relatively quick motion. The crushed stalk provided sufficient juice
to flow down the back wall and onto the refractometer through a small window.
The window has a sharp blade positioned near it that penetrated the stalk when
being crushed. This blade allows a sufficient quantity of juice to flow. Also, the
crushing arm had two rails attached to it to concentrate the crushing force on the
cane stalk in an effort to maximise extracted sugar juice.
107
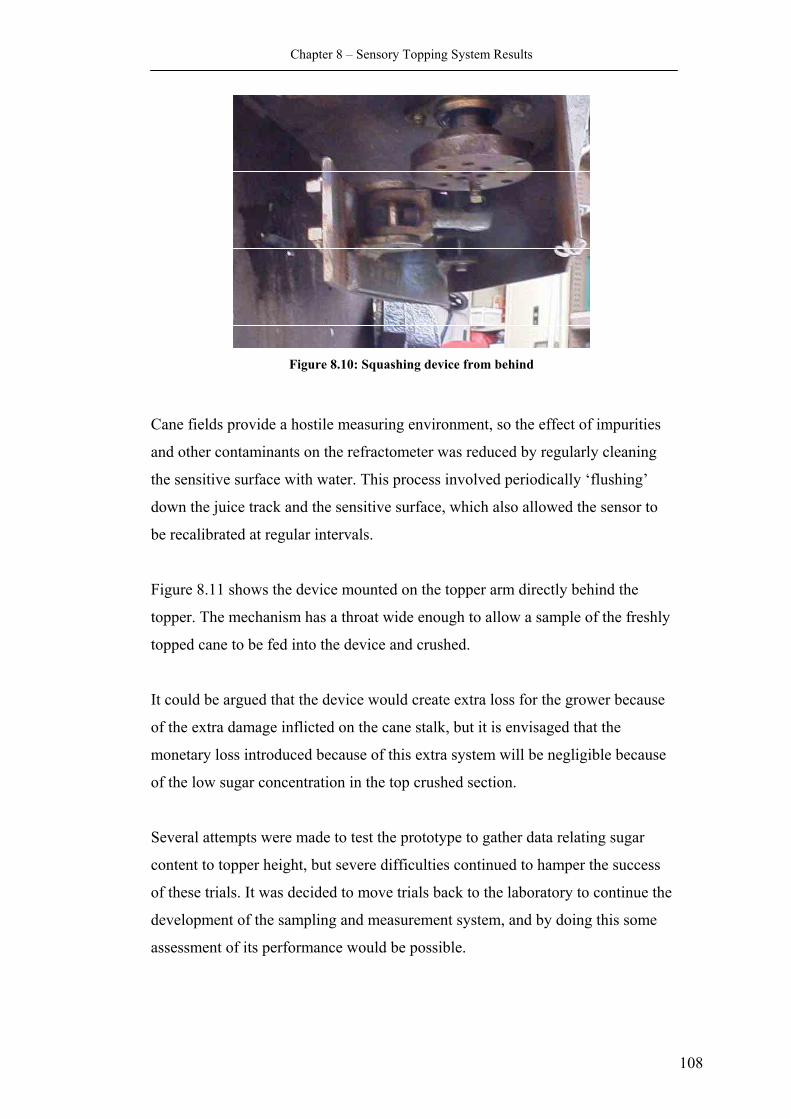
Chapter 8 – Sensory Topping System Results
Figure 8.10: Squashing device from behind
Cane fields provide a hostile measuring environment, so the effect of impurities
and other contaminants on the refractometer was reduced by regularly cleaning
the sensitive surface with water. This process involved periodically ‘flushing’
down the juice track and the sensitive surface, which also allowed the sensor to
be recalibrated at regular intervals.
Figure 8.11 shows the device mounted on the topper arm directly behind the
topper. The mechanism has a throat wide enough to allow a sample of the freshly
topped cane to be fed into the device and crushed.
It could be argued that the device would create extra loss for the grower because
of the extra damage inflicted on the cane stalk, but it is envisaged that the
monetary loss introduced because of this extra system will be negligible because
of the low sugar concentration in the top crushed section.
Several attempts were made to test the prototype to gather data relating sugar
content to topper height, but severe difficulties continued to hamper the success
of these trials. It was decided to move trials back to the laboratory to continue the
development of the sampling and measurement system, and by doing this some
assessment of its performance would be possible.
108
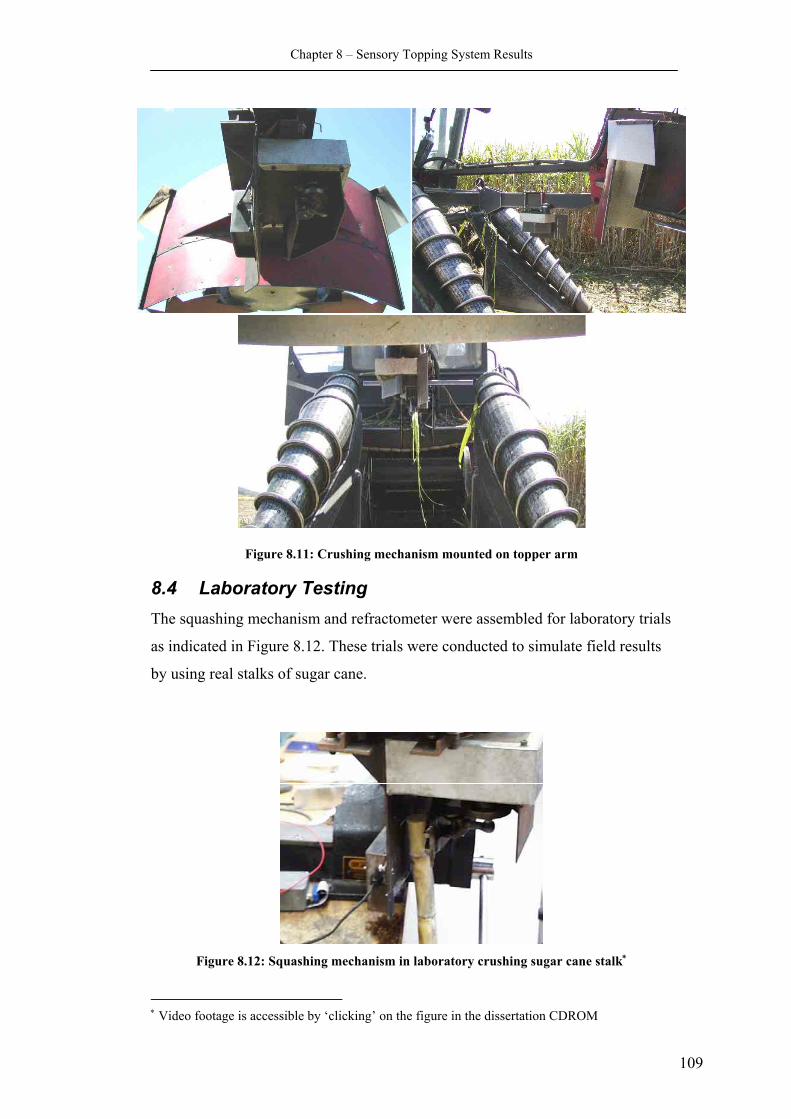
Chapter 8 – Sensory Topping System Results
Figure 8.11: Crushing mechanism mounted on topper arm
8.4 Laboratory Testing The squashing mechanism and refractometer were assembled for laboratory trials
as indicated in Figure 8.12. These trials were conducted to simulate field results
by using real stalks of sugar cane.
Figure 8.12: Squashing mechanism in laboratory crushing sugar cane stalk∗
109
∗ Video footage is accessible by ‘clicking’ on the figure in the dissertation CDROM
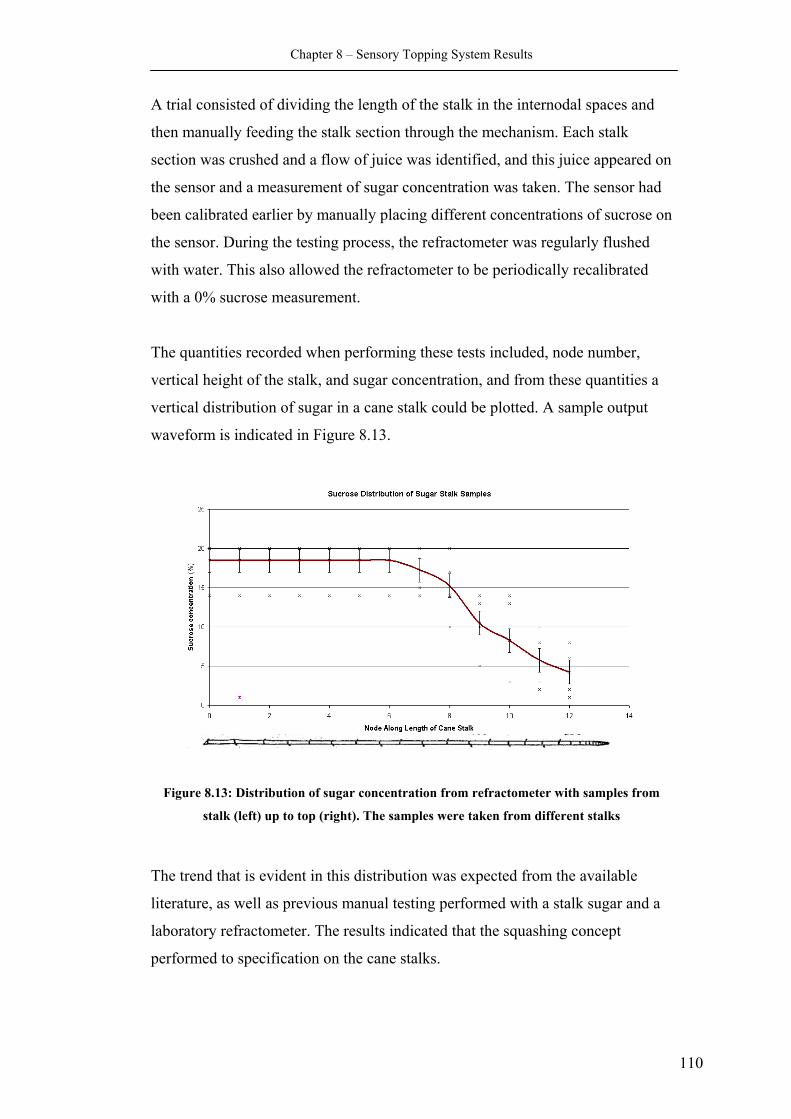
Chapter 8 – Sensory Topping System Results
A trial consisted of dividing the length of the stalk in the internodal spaces and
then manually feeding the stalk section through the mechanism. Each stalk
section was crushed and a flow of juice was identified, and this juice appeared on
the sensor and a measurement of sugar concentration was taken. The sensor had
been calibrated earlier by manually placing different concentrations of sucrose on
the sensor. During the testing process, the refractometer was regularly flushed
with water. This also allowed the refractometer to be periodically recalibrated
with a 0% sucrose measurement.
The quantities recorded when performing these tests included, node number,
vertical height of the stalk, and sugar concentration, and from these quantities a
vertical distribution of sugar in a cane stalk could be plotted. A sample output
waveform is indicated in Figure 8.13.
Figure 8.13: Distribution of sugar concentration from refractometer with samples from
stalk (left) up to top (right). The samples were taken from different stalks
The trend that is evident in this distribution was expected from the available
literature, as well as previous manual testing performed with a stalk sugar and a
laboratory refractometer. The results indicated that the squashing concept
performed to specification on the cane stalks.
110
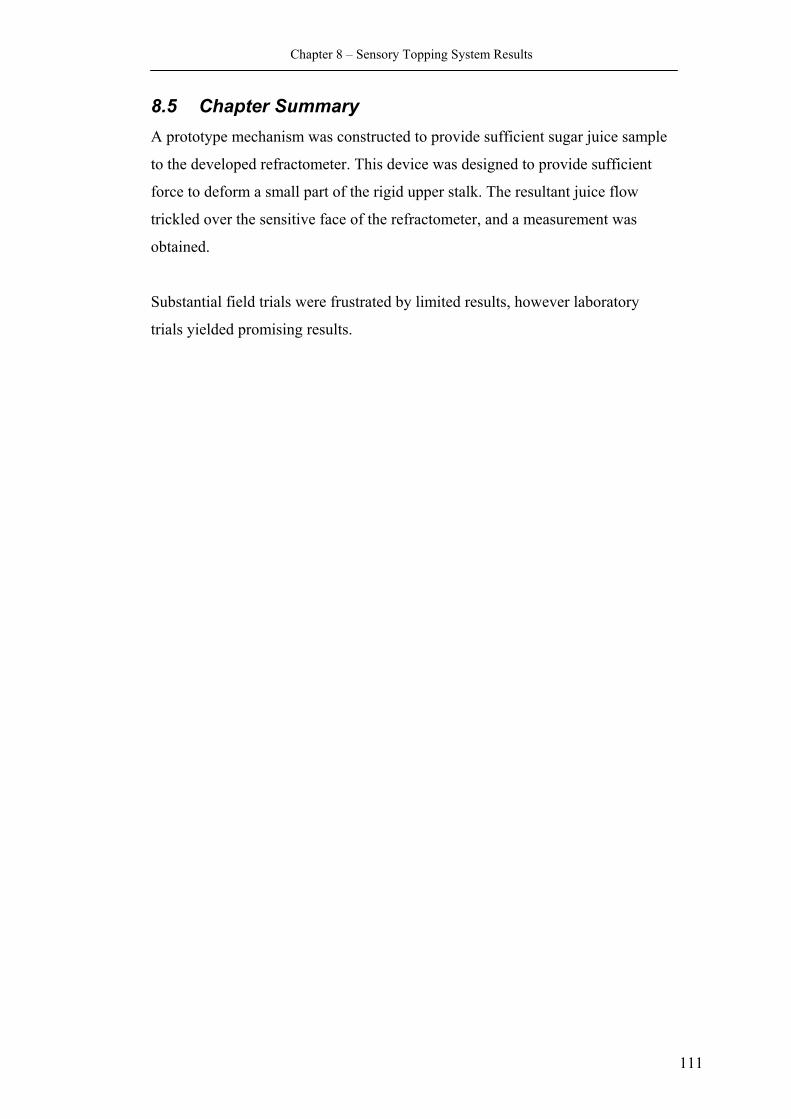
Chapter 8 – Sensory Topping System Results
8.5 Chapter Summary A prototype mechanism was constructed to provide sufficient sugar juice sample
to the developed refractometer. This device was designed to provide sufficient
force to deform a small part of the rigid upper stalk. The resultant juice flow
trickled over the sensitive face of the refractometer, and a measurement was
obtained.
Substantial field trials were frustrated by limited results, however laboratory
trials yielded promising results.
111
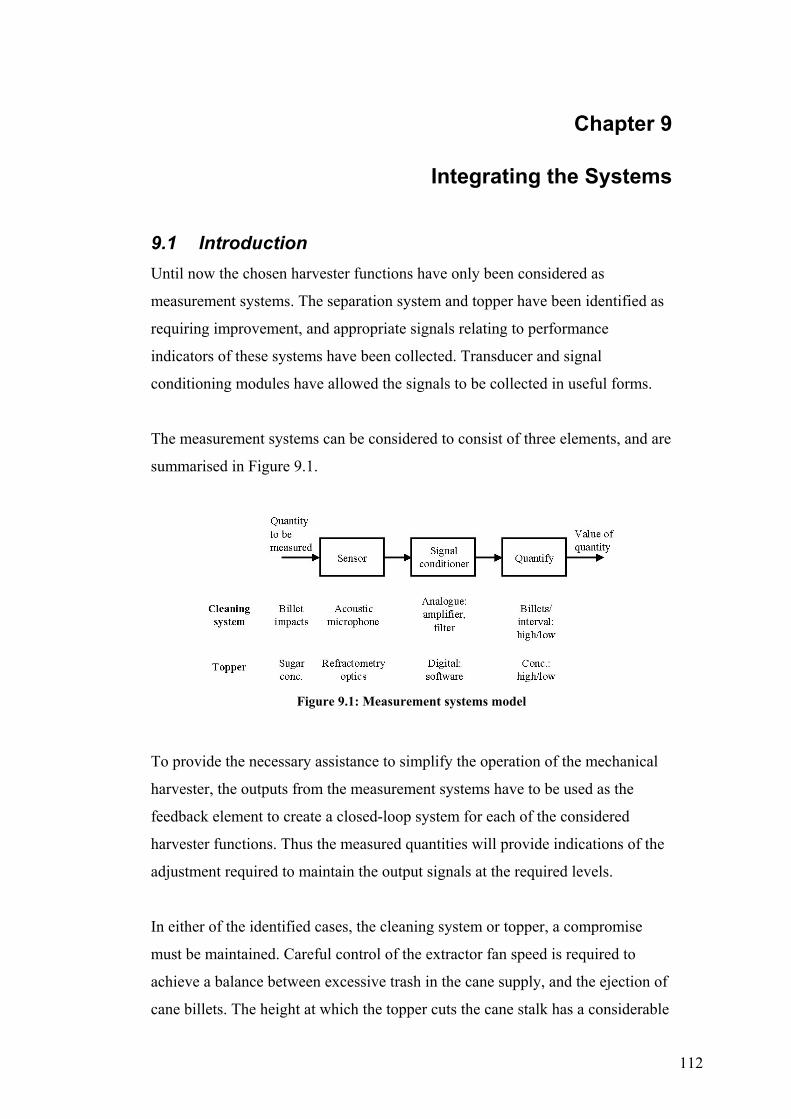
Chapter 9
Integrating the Systems
9.1 Introduction Until now the chosen harvester functions have only been considered as
measurement systems. The separation system and topper have been identified as
requiring improvement, and appropriate signals relating to performance
indicators of these systems have been collected. Transducer and signal
conditioning modules have allowed the signals to be collected in useful forms.
The measurement systems can be considered to consist of three elements, and are
summarised in Figure 9.1.
Figure 9.1: Measurement systems model
To provide the necessary assistance to simplify the operation of the mechanical
harvester, the outputs from the measurement systems have to be used as the
feedback element to create a closed-loop system for each of the considered
harvester functions. Thus the measured quantities will provide indications of the
adjustment required to maintain the output signals at the required levels.
In either of the identified cases, the cleaning system or topper, a compromise
must be maintained. Careful control of the extractor fan speed is required to
achieve a balance between excessive trash in the cane supply, and the ejection of
cane billets. The height at which the topper cuts the cane stalk has a considerable
112
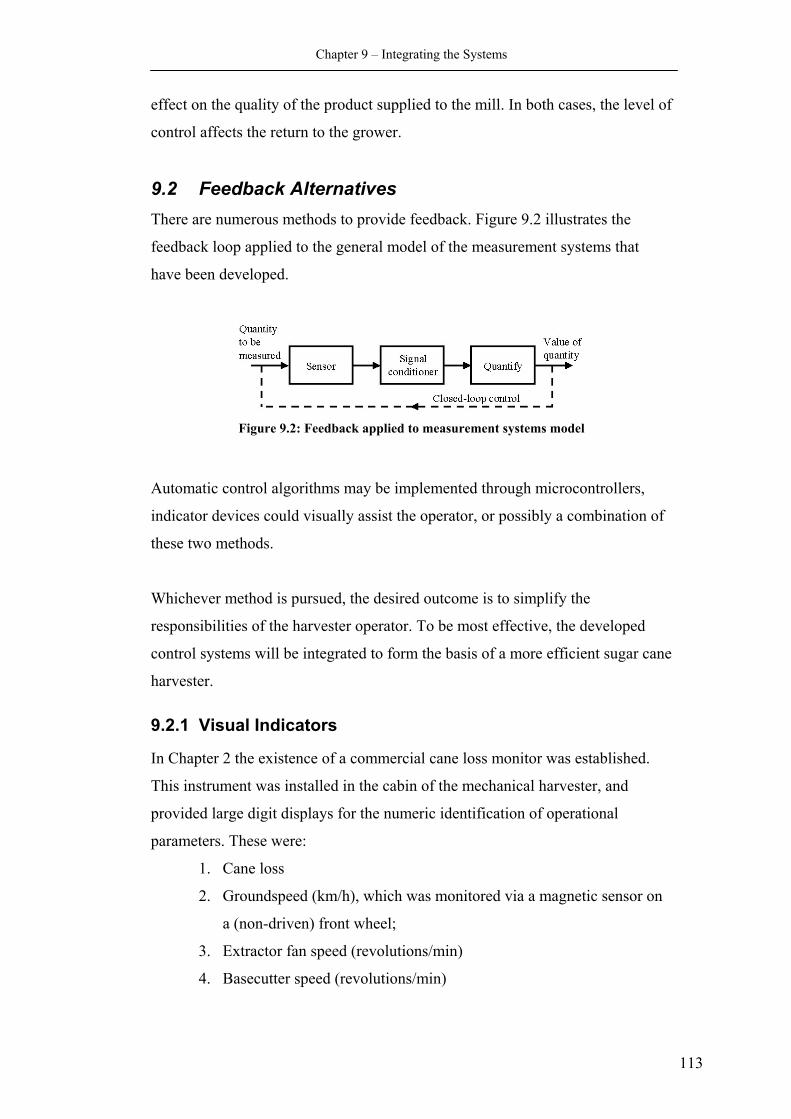
Chapter 9 – Integrating the Systems
effect on the quality of the product supplied to the mill. In both cases, the level of
control affects the return to the grower.
9.2 Feedback Alternatives There are numerous methods to provide feedback. Figure 9.2 illustrates the
feedback loop applied to the general model of the measurement systems that
have been developed.
Figure 9.2: Feedback applied to measurement systems model
Automatic control algorithms may be implemented through microcontrollers,
indicator devices could visually assist the operator, or possibly a combination of
these two methods.
Whichever method is pursued, the desired outcome is to simplify the
responsibilities of the harvester operator. To be most effective, the developed
control systems will be integrated to form the basis of a more efficient sugar cane
harvester.
9.2.1 Visual Indicators
In Chapter 2 the existence of a commercial cane loss monitor was established.
This instrument was installed in the cabin of the mechanical harvester, and
provided large digit displays for the numeric identification of operational
parameters. These were:
1. Cane loss
2. Groundspeed (km/h), which was monitored via a magnetic sensor on
a (non-driven) front wheel;
3. Extractor fan speed (revolutions/min)
4. Basecutter speed (revolutions/min)
113
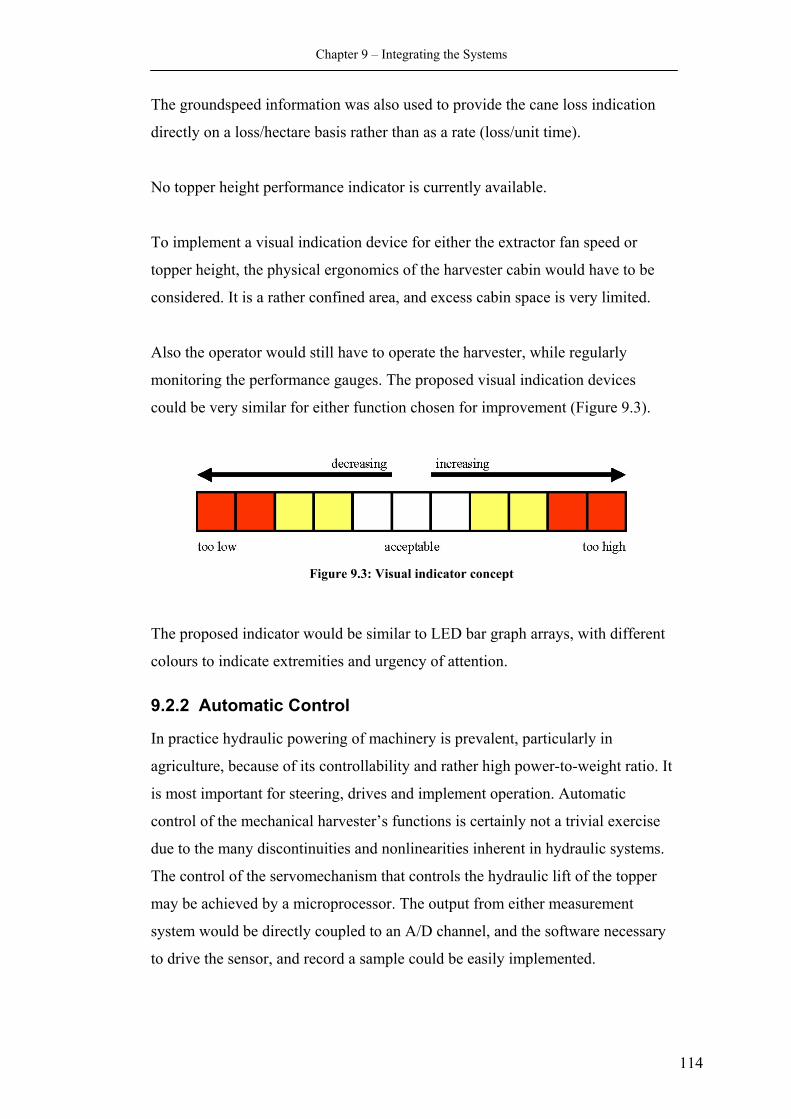
Chapter 9 – Integrating the Systems
The groundspeed information was also used to provide the cane loss indication
directly on a loss/hectare basis rather than as a rate (loss/unit time).
No topper height performance indicator is currently available.
To implement a visual indication device for either the extractor fan speed or
topper height, the physical ergonomics of the harvester cabin would have to be
considered. It is a rather confined area, and excess cabin space is very limited.
Also the operator would still have to operate the harvester, while regularly
monitoring the performance gauges. The proposed visual indication devices
could be very similar for either function chosen for improvement (Figure 9.3).
Figure 9.3: Visual indicator concept
The proposed indicator would be similar to LED bar graph arrays, with different
colours to indicate extremities and urgency of attention.
9.2.2 Automatic Control
In practice hydraulic powering of machinery is prevalent, particularly in
agriculture, because of its controllability and rather high power-to-weight ratio. It
is most important for steering, drives and implement operation. Automatic
control of the mechanical harvester’s functions is certainly not a trivial exercise
due to the many discontinuities and nonlinearities inherent in hydraulic systems.
The control of the servomechanism that controls the hydraulic lift of the topper
may be achieved by a microprocessor. The output from either measurement
system would be directly coupled to an A/D channel, and the software necessary
to drive the sensor, and record a sample could be easily implemented.
114
Chapter 9 – Integrating the Systems
For automatic control, a decision-based system would need to be implemented,
and one option could possibly be tracking trends and predicting the optimum fan
speed/topper height. An alternative could be a nonlinear control algorithm, where
the primary extractor fan speed is lowered until the cane loss reaches an
unacceptable level, then the fan speed is lowered and the process is repeated.
Similarly the topper would be lowered until the sugar concentration is too high,
then the topper is ‘backed off’ or lifted, and once again the process is repeated.
An important point to note is that if any method of automatic control is desired,
some form of manual override should also be implemented if either function’s
operation becomes extreme.
Figure 9.4 illustrates three examples of a proposed nonlinear control algorithm.
The random input data was simulated in software, and it typifies the trends that
would be expected from either measurement system during the harvesting
process. The three simulated cases were for varying standard deviations about the
same mean.
The signal that illustrates the control algorithm linearly decays at a certain rate
until this intersected the input measurement signal. Once this occurs, the output
signal is quickly raised at a rate much greater than the decay, and the cycle
repeats. The decay and rise times of the algorithm were arbitrary for this
simulation, but these would be calibrated in practice.
Figure 9.4 demonstrates that this algorithm would work well in practice, and its
adaptive nature would improve efficiencies of the chosen systems. Of course to
implement this, or any algorithm, in practice, physical nonlinearities of the
machinery such as function slew rates would have to be considered.
115
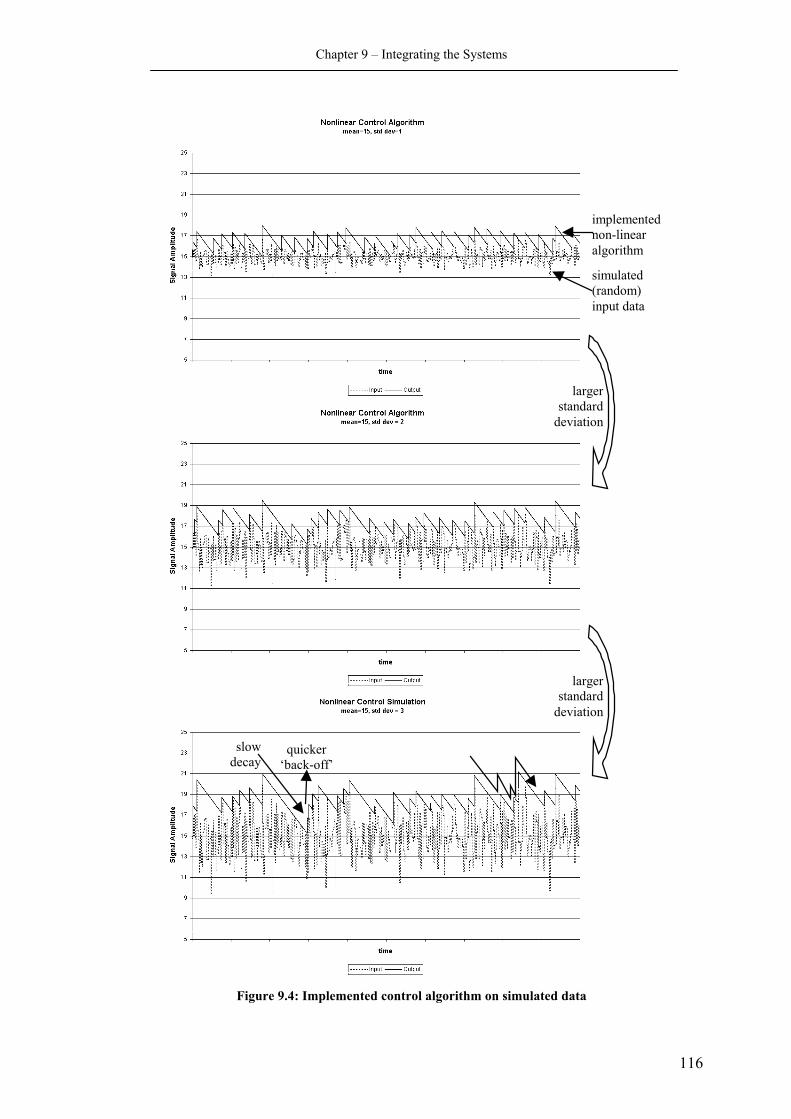
Chapter 9 – Integrating the Systems
116
simulated (random) input data
implemented non-linear algorithm
largerstandard
deviation
largerstandard
deviation
slowdecay
quicker ‘back-off’
Figure 9.4: Implemented control algorithm on simulated data
Chapter 9 – Integrating the Systems
9.2.3 Combination of Active and Passive Control
It is possible to combine the first two alternatives presented. The automatic
control would be implemented, and the performance of the designated function
would be monitored by the visual indication. If either function’s operation
becomes extreme, or erratic, when automatically controlled, manual override of
the function would be enforced, and the indicator would monitor the operation
once again.
9.3 Chapter Summary Measurement sensors have been developed that have an electronic output
suitable for interfacing to the eventual on-line control system. Consideration has
been given to appropriate feedback strategies and the means of implementation,
although opportunities for field tests have as yet been extremely limited.
117
Chapter 10
Conclusions and Recommendations
10.1 Conclusions There are many areas where sugar cane harvesters seem to be particularly
inefficient compared to agricultural machines in general. An in-depth study of
two of the harvester's functions has been made and this dissertation has presented
methods whereby their efficiency can be improved. It is important to maintain a
generic view of the project to appreciate the objective of simplifying the arduous
task of operating a mechanical harvester.
A project such as this requires familiarity with the machinery and its operating
environment. To this end, considerable time was spent in the cane field, first to
observe the variables that had to be measured and later to commission the
resulting measurement and control systems. The time spent in the field led to the
selection of two areas of interest, the topper control and the system that separated
harvested billets from the trash to be discarded.
The first project was to provide a means of measuring the effectiveness of the
primary separation system. A novel measuring system was developed in which
the transducer was mounted at the point of contact between ejected billet and fan
blade. A rotating signal interface was developed that was suitable for gathering
signals returned from the transducer.
The returned signals were analysed and a technique was established to
effectively extract the impact information in an accurate and reliable fashion. The
signal was in a form that would be useful as a feedback parameter and cane loss
was quantifiable.
The next harvester function to be investigated was the topper. Substantial efforts
to identify suitable optimum height indicators were expended. These efforts
118
Chapter 10 – Conclusions and Recommendations
resulted in the development of a novel chemical method that measured the sugar
content of the cane stalk at the cutting interface. Developing a suitable method of
sampling the stalk in the field created some problems, but these were overcome
with the construction of a crushing mechanism that could be mounted to the
topper arm. Results from the laboratory tests with the manufactured crushing
mechanism and sensor gave promising indications that the proposed technique
was suitable. The sugar cane stalk sugar concentration was quantified reliably
and accurately, and this information would be useful as an indicator for the
optimum topping height.
Ultimately it is the simplifying of the operation of the mechanical harvester that
is most important. The logistics of implementing a closed-loop system to the
identified harvester functions were discussed, and even the ergonomics for driver
assistance were considered to simplify the demanding multifunction task. The
developed systems form the basis of an improved harvesting process, and when
integrated with other such systems, will improve the standing of Australia’s
sugar industry.
10.2 Recommendations Experience gained in field-testing has indicated some modifications that would
benefit any future implementations of this project.
Separation System
• Further development of the transducer and signal interface elements should
be undertaken so the manufacturing of system components is less labour-
intensive. It would be preferable if common components could be
implemented rather than custom designs.
• Ideally the transducer would be embedded into the flange of the fan hub, with
the leads completely internal to avoid the need for external shielding devices.
• An investigation of the introduction of digital signal processing algorithms to
quantify cane loss is advisable. The small microcontroller required could also
include the control system software, and this would provide a simple low-
cost product.
119
Chapter 10 – Conclusions and Recommendations
• The user-control interface requires further investigation. Studies in the
industry should be conducted to determine the most suitable control method.
Topper System
• The refractometer could be further developed so that it is less complex.
• Software to interface with the sensor could be developed to provide a
more ‘user-friendly’ environment.
• Once the feedback information is available the most suitable control
method should be investigated.
Field-testing conducted under harvesting conditions should focus on the
following.
Separation System
• Substantial long-term field trials should be conducted to further assess the
relevance of the developed advanced cane loss monitoring technique.
This would need to be a broad study that covers the large range of
variables that are experienced in the field environment, for example cane
variety, harvesting conditions (e.g. burnt or green), and moisture content.
• The sensory separation system should be attempted on the range of
primary extractor fans that are commercially available.
Topper System
• Further studies are required to ensure that there is a successful transition
for this system from the laboratory to the field environment. This may
require changes to the squashing mechanism and juice flow, or even a
complete redesign of the concept(s).
• A real-time relationship between sugar content and height of the topper
would be the ideal method, so trials to this end could be attempted.
• Perhaps real-time sugar measurements taken inside the harvester (e.g. the
choppers) could be used in conjunction with GPS information to develop
Brix maps, similar to current yield mapping systems. Although there are
120
Chapter 10 – Conclusions and Recommendations
other factors relating Brix to CCS, such maps could possibly be useful as
an assessment of cane fields.
The complete redesign of the modern mechanical sugar cane harvester is not a
practical consideration, especially if attempting to standardise – or optimise – the
performances of all ‘traditional’ harvesters currently in service. The applications
of some of the technologies that have been presented in this dissertation are
beneficial for the retrofitting of harvesters in service, but also should be a
consideration for the design of new harvesters.
121
References
Agnew, J. 1999, Draft Harvester Best Practices Guidelines, BSES, Mackay.
Barnes, A.C. 1964, The Sugar Cane, Interscience Publishers Inc., New York.
Bloomfield, M. 1987, Chemistry and the Living Organism, John Wiley and Sons,
Brisbane.
Brotherton, G.A. and Pope, G. 1995, ‘The Financial Implications of Harvester
Characteristics’, Proceedings of the Australian Society of Sugar Cane
Technologists, Bundaberg Queensland, pp. 55-60.
Brown, J.E. and Liptak, B.G. 1995, ‘Refractometers’, in Process Measurement
and Analysis, ed B.G. Liptak, Radnor, Pennsylvania.
The Cleaning of Sugar Cane 1998, video footage, Leading Edge, Toowoomba.
Footage taken by Simon Zillman as part of SRDC Project NCA001.
Cox, G., Harris, H. and Cox, D. 1998, ‘Application of precision agriculture to
sugar cane’, Proceedings of the 4th International Conference on Precision
Agriculture, Minnesota US.
Dick, R.G. and Grevis-James, I.W. 1992, ‘The electronic cane loss monitor’,
Proceedings of the Australian Society of Sugar Cane Technologists,
Cairns Queensland, pp. 150-155.
Dimarogonas, A.D. and Haddad, S. 1992, Vibration for Engineers, Prentice Hall,
New Jersey.
Downs, H.W. and Stone, M.L. 1988, ‘Determining Accuracy of Combine Loss
Monitors’, Transactions of the ASAE, vol. 31, no. 2, pp. 396-400.
122
Fernandez, J.L. 1993, ‘Effects of the use of toppers’, Sugar Cane, no. 3
May/June, pp. 2–4.
Fuelling, T.G. 1982, ‘Sugar Cane Harvester Design’, Proceedings of the
Australian Society of Sugar Cane Technologists, Townsville Queensland,
pp. 131-137.
Garson, C.A. 1992, ‘Control of harvester base cutter height’, Proceedings of the
Australian Society of Sugar Cane Technologists, Cairns Queensland, pp.
156-162.
Giancoli, D.C. 1998. Physics: Principles with Applications, Prentice-Hall,
Sydney.
Guthrie, R.D. and Honeyman J. 1974, An Introduction to the Chemistry of
Carbohydrates, Clarendon Press, Oxford.
Hurney, A.P., Ridge, D.R. and Dick, R.G. 1984, ‘Evaluation of the efficiency of
cane harvesters in removing extraneous matter and in limiting cane losses
during the cleaning process’, Proceedings of the Australian Society of
Sugar Cane Technologists, Cairns Queensland, pp. 11-19.
Inman-Bamber, N.G. and Wood, R.A. 1987, ‘Estimating sucrose content in the
top part of cane stalks to identify optimum topping height’, Proceedings
of The South African Sugar Technologists Association, South African
Sugar Technologists Association, Mount. Edgecombe Natal, pp. 128-131.
Kerr, B. and Blyth, K. 1992, They’re all half crazy, Canegrowers, Brisbane, pp.
108-115.
Kroes, S. 1997, The Cutting of Sugarcane, PhD Dissertation, USQ.
123
Linedale, A.I., Ridge, D.R. and Chapman, F.L. 1993, ‘A coordinated extension
approach for maximising returns from mechanical harvesting’,
Proceedings of the Australian Society of Sugar Cane Technologists,
Cairns Queensland, pp. 45-51.
Lynn, P.A. and Fuerst, W. 1998, ‘Introductory Signal Processing with Computer
Applications’, John Wiley and Sons Ltd, England.
Orfanidis, S.J. 1996, ‘Introduction to Signal Processing’, Prentice-Hall, Inc.,
New Jersey.
Pandey, N. and Billingsley, J. 1998, ‘Base cutter height control and automatic
steering of sugar cane harvesters’, Paper No. SEAg 98/058, International
Conference on Engineering in Agriculture, Perth Western Australia.
Pigman, W., Horton, D. and Herp, A. 1970, The Carbohydrates: Chemistry and
Biochemistry, Academic Press, New York.
Queensland Sugar Corporation 1997, Australian Sugar Notes, Brisbane.
Ridge, D.R. 1987, ‘Efficiency through mechanisation – 1957 – 1987’, BSES
Bulletin, issue 19, pp. 4-5, Bureau of Sugar Experimental Stations,
Brisbane.
Romans, W., Poore, B. and Mutziger, J. 2000, ‘Advanced Instrumentation for
Agricultural Equipment’, IEEE Instrumentation and Measurement
Magazine, March 2000, pp. 26-29.
Schembri, M.G. and Everitt, P.G. 1999, ‘Obtaining reliable basecutter height
measurements on the harvester’, Proceedings of the Australian Society of
Sugar Cane Technologists, Townsville Queensland, p. 506.
Schneider, R.T. and Baker, M. 1997, ‘Tough sugar cane surrenders to tougher
hydraulic harvester’, Hydraulics and Pneumatics, March, pp. 6-7.
124
Sheppard, L.M. 1999, ‘Infrared Grain Analyser Goes with the Flow’, Retrieved
July 21, 2003, from
http://www.photonics.com/spectra/applications/XQ/ASP/aoaid.145/QX/r
ead.htm
Skoog, D.A. 1980, Principles of Instrumental Analysis, Saunders College,
Philadelphia.
Smith, S.W. 1997, ‘The Scientist and Engineer’s Guide to Digital Signal
Processing’, California Technical Publishing, San Diego.
Spargo, R.F. and Baxter, S.W.D. 1975, ‘The Development of the Australian
Chopped Sugar Cane Harvester’, Transactions of the ASAE, vol. 18, no.
5, pp. 806-810.
SRDC 1997, Annual Report 1996-97, Department of Primary Industries and
Energy, Brisbane Queensland, pp. 45-47.
SRDC 2001, SRDC Update, Department of Primary Industries and Energy,
Brisbane Queensland.
Suggs, C.W., and Abrams Jr., C.F. 1972, ‘Automatic Hydraulic Height Control
Mechanism for Rotary Cutting Harvesting Equipment’, Transactions of
the ASAE, pp. 428-432.
Sverzut, C.B., Verma, L.R. and French A.D. 1987, ‘Sugarcane analysis using
near infrared spectroscopy’, Transactions of the ASAE, vol. 30, Jan-Feb,
pp. 255-258.
Waddell, C.W. 1949, ‘The topping of cane’, Proceedings of the Queensland
Society of Sugar Cane Technologists, Mackay Queensland, pp. 121-128.
Zander, J. 1972, ‘Ergonomics in Machine Design (A Case Study of the Self-
Propelled Combine Harvester)’, Wageningen, Netherlands.
125
Appendix
Project Research Publications
1. McCarthy, S.G., Billingsley, J., and Harris, H. 2000, ‘Listening for Cane
Loss’, in Mechatronics and Machine Vision, eds J. Billingsley, Research
Studies Press Ltd, Hertfordshire, England.
2. McCarthy, S.G., Billingsley, J., and Harris, H. 2001, ‘Where the
Sweetness Ends’, Proceedings of the 8th IEEE International Conference
on Mechatronics and Machine Vision in Practice, Hong Kong.
3. McCarthy, S.G., Billingsley, J., and Harris, H. 2002, ‘Development of an
advanced cane loss monitoring system’, Proceedings of the Australian
Society of Sugar Cane Technologists, Cairns Queensland.
4. McCarthy, S.G. and Billingsley, J. 2002, ‘A Sensor for the Sugar Cane
Harvester Topper’, Sensor Review, vol. 22, no. 3, pp. 242-246.
5. McCarthy, S.G., Billingsley, J., and Harris, H. 2002, ‘Control of the
Sugar Cane Harvester Topper’, Proceedings of the 9th IEEE International
Conference on Mechatronics and Machine Vision in Practice, Chiang
Mai.
6. McCarthy, S.G., Billingsley, J., and Harris, H. 2002, ‘A Sugar Cane
Harvester System’, Proceedings of the 2002 International Conference on
Engineering in Agriculture, Wagga Wagga NSW.
126