Embed Size (px)
Citation preview
The Intake and Composition of Intermittent Fasting, the 5:2 Method
Erin Scholtens
A thesis submitted in partial fulfillment of the requirements for the degree of
Master of Dietetics
At the University of Otago, Dunedin, New Zealand
November, 2018
ii
Abstract
Background: Obesity is a major contributing factor to the development of metabolic disease
worldwide, with dietary intervention a primary intervention strategy. Currently, a common
approach to weight loss is daily energy restriction (DER), otherwise known as continuous
energy restriction (CER). The DER regimen limits energy intake every day and has been
proven to be effective at achieving significant weight loss. However, the long-term
effectiveness is limited due to decreased adherence over time (1). As a result, new dietary
approaches are investigated. Recently intermittent fasting (IF) has become popular as a
weight-loss diet. There are multiple versions of intermittent fasting and all of them are
popular, due to greater flexibility in regime when compared with traditional weight loss diets.
However, the macronutrient and micronutrient intake and composition of the intermittent
fasting diet have often been over looked.
Objective: The primary aim of this study was to describe the macronutrient and
micronutrient intake and composition of the 5:2 method of the intermittent fasting diet (IF
5:2). Additional aims included describing the change in intake from baseline to week six, as
well as describing the food and beverages consumed on fasting days.
Design: This was a secondary analysis of two previous studies that used IF 5:2 as a dietary
intervention. The final analysis included 38 participants, which were overweight and obese,
males and females. The dietary intervention was two days per week of fasting, either
consecutive or non-consecutive, with an energy intake of 2090-2508 kJ/d. The remaining five
days were non-fasting days and participants were advised to have habitual intakes.
Prospectively filled out 4-day estimated food records were used to assess dietary intake at
baseline and week six. Participants recorded at least one fasting day per week. Intakes were
analysed using the computer software program Foodworks (2).
iii
Results: During IF 5:2 the macronutrient composition was within the acceptable
macronutrient distribution range for protein and fat, above for saturated fat, and below for
carbohydrates. Fibre intake was lower than both male and female recommendations. The
weighted weekly intake of calcium, zinc, magnesium and potassium during intermittent
fasting were lower than recommendations. Furthermore, sodium intakes exceeded the
suggested daily target. The intake of all macronutrients and micronutrients, except caffeine,
decreased on fasting days. Conversely, the percent of total energy from protein significantly
increased (p=0.02). On non-fasting days the energy intake decreased in week six when
compared with baseline, despite intake being unrestricted. Additionally, participants intake
on fasting days indicates that they followed meal suggestions provided.
Conclusion: This composition of IF 5:2 was a high protein, moderate fat, low carbohydrate
diet. The intake for fibre and some micronutrients during intermittent fasting were lower than
recommendations. Further research is required assessing adequacy of this diet to inform
individuals if there are nutritional risks to following it. Currently the 5:2 method of
intermittent fasting appears as though it is a suitable alternative weight-loss diet.

iv
Preface
Erin Scholtens (candidate) conducted this thesis under the supervisor of Dr. Rosemary Hall
and co-supervisor Assoc. Prof Jeremy Krebs. Dr. Jill Haszard conducted the statistical
analysis of the data.
This thesis was a secondary analysis of two previous studies; Changes in Resting Energy
Expenditure with Different Schedules of caloric restriction and the Intermittent Fasting and
Hypoglycaemia study.
The candidate was responsible for;
• Review of literature regarding intermittent fasting
• With guidance, selection of macronutrients and micronutrients to focus on
• Quality control of food record entries into food analysis program
• Creating a data entry protocol
• Cleaning and sorting of data used in this analysis
• Analysing and interpreting data
• Writing of thesis
v
Acknowledgements
Firstly, I would like to thank my supervisor’s Dr. Rosemary Hall and Assoc. Prof Jeremy
Krebs, for the continuous support and guidance throughout this project. I would also like to
thank Brian Corley for answering all of my questions as well as Amber Parry-Strong for all
your help, especially with Foodworks.
To Jill Haszard, you helped me from week one, I would have been very confused without
your expertise and explanations.
To my family and friends who have helped me not only this year but over the course of my
University years, thank you all so much. The support, availability to listen to my challenges
and advice have been needed and appreciated. A special thank you to my sister Megan, you
have been like a third supervisor for me and my top proof reader, so thank you for that.
To all of my dietetic class mates, these past two years have been amazing, and I would not
have enjoyed the highs and lows as much without you all. I have made some lifelong friends
and I cannot wait to see where our profession takes us all.
vi
Table of Contents
Abstract ................................................................................................................................ ii
Preface ................................................................................................................................. iv
Acknowledgements ............................................................................................................... v
List of Tables ....................................................................................................................... ix
List of Figures ....................................................................................................................... x
List of Abbreviations ........................................................................................................... xi
1 Introduction ................................................................................................................... 1
2 Literature Review .......................................................................................................... 3
2.1 Introduction ........................................................................................................... 3
2.2 Search Methods ..................................................................................................... 3
2.3 Intermittent Fasting................................................................................................ 3
2.3.1 Alternate day fasting ...................................................................................... 4
2.3.2 Intermittent fasting compared to Daily Energy Restriction for weight-loss ..... 5
2.3.3 Adherence to diet protocol ............................................................................. 8
2.3.4 Appetite during Intermittent Fasting ............................................................... 9
2.4 Measuring macronutrients and micronutrients:..................................................... 10
2.4.1 Collecting dietary intake data ....................................................................... 10
2.4.2 Measuring macronutrient intake and composition ........................................ 11
2.4.3 Measuring micronutrients intake and adequacy of a group ........................... 12
2.5 Nutrient intake and composition of Intermittent Fasting diets............................... 13
2.5.1 Macronutrient profiles during Intermittent Fasting ....................................... 13
2.5.2 Micronutrient intake during Intermittent Fasting, 5:2 method ....................... 16
vii
2.6 Summary: ............................................................................................................ 17
3 Objective Statement .................................................................................................... 18
4 Subjects and Methods .................................................................................................. 19
4.1 Study design: ....................................................................................................... 19
4.2 Participants: ......................................................................................................... 20
4.3 Measurements:..................................................................................................... 21
4.3.1 Data collection: ............................................................................................ 21
4.3.2 Data validation: ............................................................................................ 24
4.4 Data analysis: ...................................................................................................... 24
5 Results ........................................................................................................................ 27
5.1 Participant characteristics .................................................................................... 27
5.2 Food records returned .......................................................................................... 30
5.3 Energy intake during Intermittent Fasting ............................................................ 30
5.4 Protein intake during Intermittent Fasting ............................................................ 30
5.5 Fat intake during Intermittent Fasting .................................................................. 30
5.6 Carbohydrate and fibre intake during Intermittent Fasting .................................... 31
5.7 Micronutrients with low intake during Intermittent Fasting .................................. 31
5.8 Micronutrients with excess intake during Intermittent Fasting.............................. 31
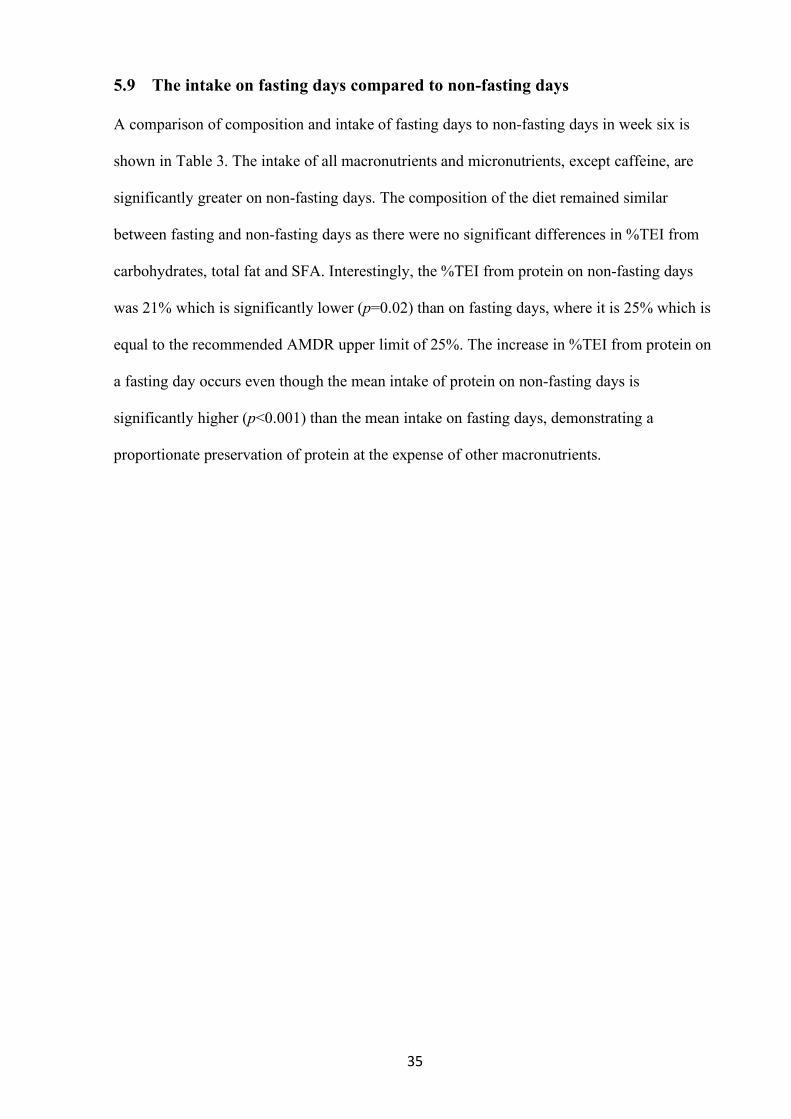
5.9 The intake on fasting days compared to non-fasting days ..................................... 35
5.10 The macronutrient and micronutrient intake during week six compared to baseline
37
5.11 Non-fasting days at baseline compared to non-fasting days during week six ........ 39
5.12 Food and beverages chosen on fasting days ......................................................... 41
6 Discussion ................................................................................................................... 44
viii
6.1 Macronutrients: ................................................................................................... 44
6.2 Micronutrients: .................................................................................................... 47
6.3 Energy intake: ..................................................................................................... 48
6.4 Food and beverages chosen on fasting days: ........................................................ 49
6.5 Strengths and limitations: .................................................................................... 49
6.6 Conclusion: ......................................................................................................... 50
7 Application to Practice ................................................................................................ 51
8 References ................................................................................................................... 52
9 Appendices.................................................................................................................. 59
9.1 Appendix A: Dietary collection methods table of comparison .............................. 59
9.2 Appendix B: Template Food Record .................................................................... 61
9.3 Appendix C: Intermittent Fasting and Hypoglycaemia study - fasting day meal
ideas participant hand-out ................................................................................................ 67
9.4 Appendix D: CREEDS ‘Guide to calorie counting’ participant handout ............... 69
9.5 Appendix E: Diet entry protocol .......................................................................... 89
ix
List of Tables
Table 1: Baseline demographics of the participant sample used in this study. ......... 29
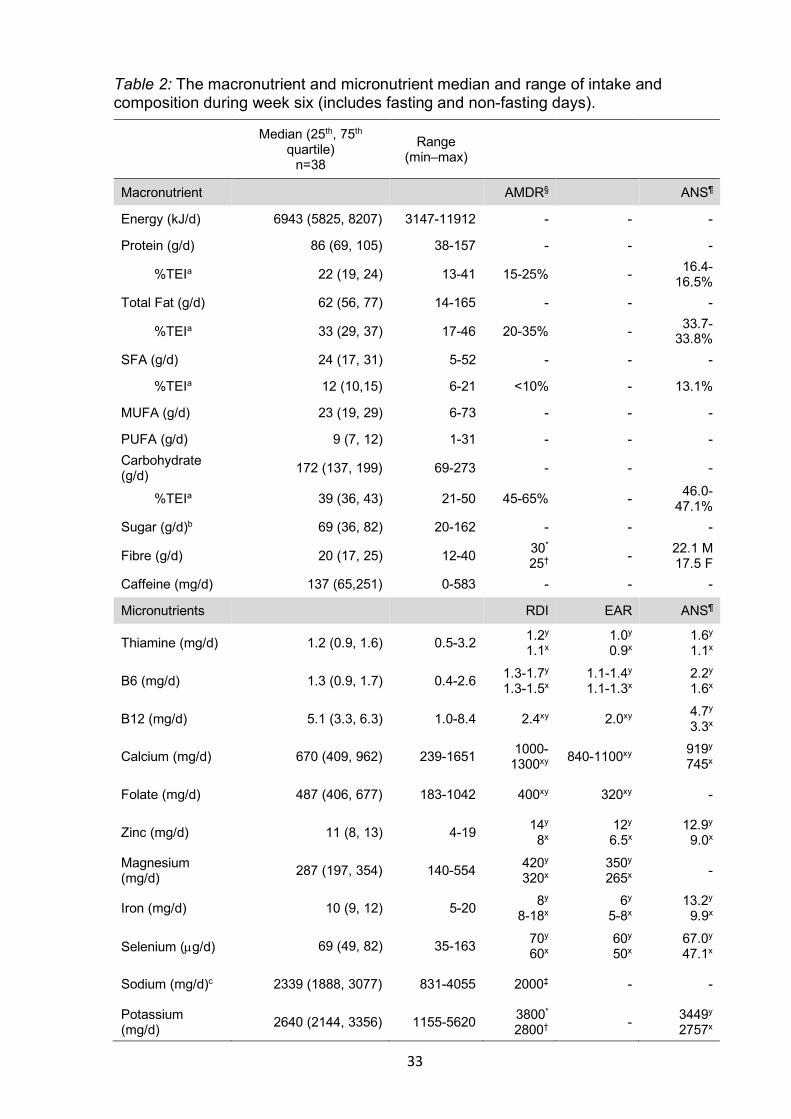
Table 2: The macronutrient and micronutrient median and range of intake and
composition during week six (includes fasting and non-fasting days). ....................... 33
Table 3: Comparison of the macronutrient and micronutrient composition and intake
of fasting days versus non-fasting days ......................................................................... 36
Table 4: Mean macronutrient and micronutrient intake and composition from
baseline and week six in participants (n=33) with both baseline and week six food
records (includes fasting and non-fasting days)............................................................ 38
Table 5: Comparison of macronutrient and micronutrient intake and composition of
non-fasting days, baseline compared to week six, in participants (n=33) with both
baseline and week six food records. .............................................................................. 40
Table 6: The most frequent food types consumed from the top 10 food categories on
fasting days. ...................................................................................................................... 43
x
List of Figures
Figure 1: Participant flow chart for inclusion into this study ........................................ 28
Figure 2: The proportion of participants that consumed the 10 most-consumed food
types on fasting days. ...................................................................................................... 42
xi
List of Abbreviations
IF Intermittent Fasting
IF 5:2 Intermittent fasting, the 5:2 method
DER Daily energy restriction
CER Continuous energy restriction
TRF Time restricted feeding
ADF Alternate day fasting
RCT Randomized control trial
EI Energy intake
EER Estimated energy requirements
%TEI Percent of total energy intake
VAS Visual analogue scale
BMI Body mass index
AMDR Acceptable macronutrient distribution range
EAR Estimated average requirement
RDI Recommended daily intake
AI Adequate intake
SFA Saturated fat
RDA Recommended dietary allowance
CREEDS Changes in resting energy expenditure with different schedules of caloric
restriction
IF-Hypo Intermittent fasting and hypoglycaemia
Type 2 DM Type two diabetes mellitus
ANS 2008/09 Adult Nutrition Survey
1
1 Introduction
Obesity is a major contributing factor to the development of metabolic disease worldwide,
with dietary intervention a primary intervention strategy. Currently, the common dietary
practice for weight loss is daily energy restriction (DER), otherwise known as continuous
energy restriction (CER). The DER method involves a limiting energy intake each day and
has been shown to work. However, the long-term application is challenged due decreased
adherence over time (1). Therefore, new dietary initiatives are often trialed to find an
alternative.
A diet that has become popular recently, perhaps because of the book ‘The Fast Diet’ (3), is
intermittent fasting (IF). IF has gained attention as it has periods of severe energy restriction
and periods of no restriction which could decrease the challenge of adherence. There are
multiple methods of IF with the most common being; time restricted feeding, alternate day
fasting and IF the 5:2 method. Time restricted feeding (TRF) typically involves a 16-hour
fasting period and 8-hour feeding period per 24-hours. Alternate day fasting (ADF) is one day
of substantial energy restriction, followed by a feast day. IF the 5:2 method (IF 5:2) involves
two days per week of substantial energy restriction.
The current literature investigating the effectiveness and safety of IF diets is limited. The
majority of research that examines the TRF approach has been performed in animals whereas,
ADF and IF 5:2, are more often conducted in humans. Previous studies have compared either
ADF or IF 5:2 to DER to evaluate if one diet is superior for weight loss. Similar degrees of
weight loss were observed when ADF was compared to DER (4-7) as well as when IF 5:2
was compared to DER (8-11). Therefore, current evidence suggests that ADF and IF 5:2 are
similarly effective for weight loss when compared to DER.
2
A question that current research regarding IF has failed to address is what the macronutrient
and micronutrient composition and intake of the diet is. This is important because if IF
becomes a popular diet choice, then individuals need to be informed if there is an increased
risk of inadequate intake, particularly if planning to follow IF for extended periods.
Furthermore, the dietary intake on fasting days is often only reported when it is provided by
research facilities. Therefore, it would be interesting to have insight into what participants
choose to eat on a fasting day when food is not provided.
This secondary analysis will contribute to filling the current gap in knowledge regarding IF
5:2. The aim is to describe the macronutrient and micronutrient composition and intake while
participants are following IF 5:2. Additionally, how participants diets changed from baseline
to week six, as well as what food and beverages are consumed on fasting days, will be
described.
3
2 Literature Review
2.1 Introduction
This literature review summarizes the current literature regarding intermittent fasting diets
(IF). It will also cover how the macronutrient and micronutrient composition and intake of
diet are assessed.
2.2 Search Methods
The key words “intermittent fasting”, “alternate day fasting”, “periodic fasting” and “time-
restricted feeding” were used in the search engine of Medline (Ovid), Scopus and Google
Scholar. Other key words included; energy restriction, 5:2 method, macronutrient and
micronutrient.
2.3 Intermittent Fasting
Fasting has been defined as ‘partial or total abstention from all foods, or a select abstention
from prohibited foods’ (12). Various fasting methods have been practiced as a part of
different religions for a long time. Examples include Greek Orthodox Christians who have
three fasting periods; Nativity fast, Lent and Assumption where fasters abstain from
consumption of certain items such as fish and dairy products every day of the week (12).
During Ramadan, Muslims abstain from food and drink between sunrise and sunset for an
entire month (13). In the past few years IF has gained popularity as a weight loss diet as it is
less restrictive than traditional diets.
IF is an umbrella term with multiple variations of the diet. The two variations of IF that have
been used most often in human studies are alternate day fasting (ADF) and the 5:2 method (IF
5:2). ADF comprises of 24 hours ad libitum intake followed by 24 hours of fasting (either
calorie restricted or zero intake) and IF 5:2 includes two days per week of restricted intake
and five days of habitual or ad libitum intake. Another researched method is time restricted
4
feeding (TRF) where there is an active phase of ad libitum eating (usually 8 hours) and then
the other 16 hours is fasting (no intake). The TRF approach has been promoted in the media
and therefore, has become popular. Animal studies that have used TRF have reported that
rodents fed time-restricted high fat diets, compared to ad libitum high fat diets and normal
diets, had less weight gain (14-16), improved glucose tolerance (14, 15) and a reduction in
insulin resistance (15). As animal studies cannot directly be applied to humans (17), human
based studies need to be conducted to explore if TRF has these same effects. Currently, there
are a small number of human studies that have examined TRF, but these are limited by the
lack of control groups, small sample sizes and variations in length of time fasting. Therefore,
it is difficult to form clear conclusions from these (18).
2.3.1 Alternate day fasting
Three observational studies, ranging from three to eight weeks in duration, have investigated
the effects of ADF in women and men who were either overweight/obese or a healthy weight
(19-21). The prescribed intake on fasting days ranged between studies from 0% to 25-30% of
estimated energy requirements (EER). On non-fasting days the prescribed intake also varied
from; ad libitum, 100% of EER, usual intake for three days plus ad libitum for one day, or the
advice to double usual intake. All three studies observed a significant weight loss following
ADF (5.6 ± 1.0 kg, p<0.01 (20), 2.5 ± 0.5%, p<0.01 (21), p<0.0001 (19)). The observational
nature of the design means that a causal relationship between the dietary approach and weight
loss cannot be assumed therefore, randomised control trials (RCTs) need to be conducted to
determine a causal relationship.
An RCT (22) with an eight week weight-loss intervention period compared an ADF high fat
diet (45% of energy intake from fat) to an ADF low fat diet (25% energy intake from fat) in
obese women. The reported results demonstrated that both diets reduced weight significantly
(p<0.0001), 4.3 ± 1.0 kg in ADF high fat and 3.7 ± 0.7 kg in ADF low fat, with no differences
5
between groups for weight loss at any time point. This study indicates that in woman, a high
fat ADF diet is equally as effective for weight-loss as a low-fat diet. However, before these
benefits can be generalised, studies which include males need to be conducted.
2.3.2 Intermittent fasting compared to Daily Energy Restriction for weight-loss
Daily energy restriction (DER), otherwise known as continuous energy restriction (CER), is
the traditional intervention method for weight loss. The DER method is effective, but
adherence tends to decrease over time (1). To date, most studies that involve IF have assessed
the effectiveness of it in comparison to the traditional DER approach for weight loss. The
hypothesis being that IF can be less restrictive, and therefore it may be more feasible for
individuals to adhere to the IF diet regimen in both the short and long term.
In RCTs that have compared IF 5:2 to DER for weight-loss in overweight and obese
participants, all found that weight-loss was significant, with neither group superior for weight-
loss (8-11). The most recent of these studies is from Sundfør et al. 2018 (11) which was a 12-
month trial that included a six month weight loss intervention as well as six months of weight
maintenance. The 112 participants, men and women, were randomised into either a
continuous or intermittent energy restricted diet. The IF 5:2 diet prescribed was 1672 kJ/d for
females and 2508 kJ/d for males on non-consecutive fasting days, with habitual intake the
remaining five days of the week. The diet prescribed to DER participants were the individuals
estimated total weekly energy expenditure minus the total reduction of energy intake (EI) per
week of a fasting participant. For example, a female participant that was fasting had an energy
reduction of 1672 kJ twice per week, totalling 3344 kJ per week. Therefore, the females in
DER had 3344 kJ divided by seven to give the energy reduction per day, which is 477 kJ per
day. The male’s energy reduction was calculated to be 717 kJ per day in the DER group.
Other studies have used a 25% reduction in EI per day based on individual EER (8, 9) or an
EI of 5000-6500 kJ/d (10) in respective DER groups. The participants in the Sundfør et al.
6
2018 (11) DER group were prescribed to follow a Mediterranean based diet of 25% total
energy intake (TEI) from protein, 45% from carbohydrates and 30% from fat, which is similar
to the Mediterranean based diet and the CSIRO ‘Total Wellbeing Diet’ (23) prescribed to
DER groups in other studies (8-10).
The results of Sundfør et al. 2018 (11) study demonstrated that during the weight loss phase,
both groups had significant weight-loss (9.1 ± 5.0 kg for IF 5:2 group, 9.4 ± 5.3 kg for DER
group, both p<0.001) with no between-group differences (p=0.9), which is supported by other
studies (8-10). During the weight maintenance phase, the DER group gained a non-significant
0.4 ± 4.0 kg while the IF group gained a significant 1.1 ± 3.8 kg (p<0.05) but there was no
significant between-group difference. Harvie et al. 2013 (9) also found no significant
difference between groups during a one-month weight maintenance period. Overall, studies
have indicated that IF 5:2 is equally as effective for weight loss and weight loss maintenance
as DER.
When ADF and DER diets have been compared they have also been shown to produce
significant weight loss (6.4 ± 4.6 kg, p<0.001 (7), 7.1 ± 1.0 kg for DER 8.2 ± 0.9 ADF,
p<0.001 (5), p<0.001(4)) with no between group differences in RCTs (4-7). Coutinho et al.
2018 (4) had 35 participants, randomized into ADF or DER, for the 12-week weight-loss
intervention. The ADF diet prescribed was 2299 kJ/d for females and 2759 kJ/d for males on
fasting days, of which there were three non-consecutive fasting days per week. On non-
fasting days 100% of EI was prescribed. Coutinho et al. 2018 (4) prescribed the DER group a
33% reduction of EER. Both groups had significant weight loss (p<0.001 for both groups)
with no between group differences (p=0.126). The finding of similar weight loss between
ADF and DER is supported by other studies. Having said this, the respective study protocols
varied in; duration, the prescribed EI on fasting days and non-fasting days, having
7
consecutive or non-consecutive fasting days as well as the prescribed EI of the DER group (5-
7).
Some RCTs have also compared the effect of alternating fasting weeks (rather than certain
days) to DER in relation to weight loss. Over the 8-week weight-loss period, for overweight
and obese women, Keogh et al. 2014 (24) compared one week of energy restriction (5500
kJ/d) then one week ad libitum diet, to weekly energy restriction (5500 kJ/d). Both groups had
significant weight-loss (3.2 ± 2.1 in DER, 2.0 ± 1.9 kg in intermittent energy restriction) with
no between-group differences (p=0.063). Byrne et al. 2018 (25) compared DER to IF weeks,
where participants had two weeks of energy restriction followed by two weeks of energy
balance. The EI for both groups was reduced by 33% for the 16-weeks of energy restriction.
The results were that in the participants which completed the intervention the IF group had
greater weight-loss compared to the DER group (13.4 ± 5.7 kg in IF group vs 8.5 ± 4.2 kg in
continuous group, p=0.002), which directly contrasts with studies that have compared ADF to
DER and found no significant between-group differences (4-7). Byrne et al. 2018 (25) does
not assess adherence to the prescribed diet, therefore, it is possible that the DER group did not
adhere to the diet as well as the IF group resulting in less weight-loss from that group.
However, as the daily self-reported food diaries were not analysed EI cannot be compared.
Further research into alternating week energy restriction, specifically two weeks of IF and two
weeks of energy balance, is required before it can be concluded that it produces superior
weight-loss compared to DER.
The relationship between IF, both IF 5:2 and ADF, and weight-loss requires greater
exploration. The current literature on IF is not consistent in regard to the degree of energy
restriction on fasting days, whether the fasting days are consecutive or non-consecutive and if
the non-fasting days are energy restricted or ad libitum. Therefore, it is difficult to directly
8
compare studies and form strong conclusions about the most effective form of IF and how it
affects weight. At this point, the only definitive conclusion is that both IF 5:2 and ADF result
in weight loss as effectively as DER. Whether one form of IF is superior to the other, and
which protocol of each form is the most effective for weight-loss, is yet to be determined.
2.3.3 Adherence to diet protocol
Adherence to a diet protocol has been shown to decrease over time (1). Therefore, finding an
approach that enhances adherence is the goal. In RCTs that have compared IF (both IF 5:2
and ADF) to DER, adherence to diet prescriptions were usually measured with seven-day
food records. The majority of the studies reported that adherence was similar between diet
groups (4, 7, 8, 10, 11). Interestingly, one study using IF 5:2 (9) and another using ADF (6)
found that the participants in the IF group significantly reduced their EI to lower than
prescribed, on non-fasting days. In addition, Trepanowski et al. 2017 (6) found that the
participants in the ADF group significantly exceeded prescribed EI of fasting days at months
three and six, and a higher proportion of participants in the DER group had greater
compliance with the diet compared to ADF.
The proportion of participants that withdrew from studies due to difficulty with adhering to
diet interventions was found to be similar between the IF diet and DER diet groups in four
studies, two using IF 5:2 (8, 9) and two ADF (4, 7). Furthermore, two studies, which both
used IF 5:2, reported no drop outs due to the difficulty of diet adherence(10, 11). Conversely,
Trepanowski et al. 2017 (6) found that five participants dropped out of the ADF diet due to
difficulty adhering to the ADF diet compared to zero for the DER group.
Overall, it is unclear if either IF method provides greater adherence to dietary prescriptions
when compared to DER. It is also unclear if there is a superior form of IF for participants’
9
adherence to a diet protocol, as no study has compared ADF to IF 5:2. Thus, more studies
need to assess adherence when comparing IF to DER as well as comparing ADF to IF 5:2.
2.3.4 Appetite during Intermittent Fasting
When individuals change their diet to lose weight, alterations to the amount they are
consuming occurs, which leads to counter-regulatory changes in hunger and satiety (26). A
validated tool to measure satiety is a visual analogue scale (VAS).
Of the studies that compared IF (either 5:2 or ADF) to DER, four RCTs measured appetite
markers and used a VAS to do so (4, 9-11). One study of 112 obese men and women
compared IF 5:2 to DER and reported that the IF group answered ‘I have often felt hungry
while on the diet’ to a significantly higher degree than the DER group (11). Harvie et al. 2013
(9) found that at one month, after the first day of fasting, the hunger and desire to eat scores
were greater in the IF group compared to IF with additional protein and fat, and DER groups.
However, this difference was no longer significant at month three and four. Additionally, the
average weekly hunger scores did not differ throughout the study. Together these results
suggest that the IF group’s appetite adjusted to the diet. Carter et al. 2016 (10) compared IF
5:2 to moderate DER and reported a significant reduction in appetite over time, with reported
fullness and satisfaction increasing with time for both IF and DER groups. In contrast,
Coutinho et al. 2018 (4), compared ADF to DER and found no significant changes in appetite
in either group.
An RCT that compared ADF and a control diet reported that satisfaction and fullness, which
were measured at the end of the day, increased from baseline to post-treatment in the ADF
group, but not in the control group (27). An observational study of ADF which assessed
appetite at the following times; 1000, 1200, 1400 and 1600 at baseline and on four fasting
days, and found that subjects had a significant increase in hunger and a decrease in fullness on
10
their first day of fasting when compared to baseline (21). However, the appetite measures
over time showed no significant changes in subjects’ perception of hunger, and participants
reported feelings of fullness increased (p<0.05) which indicates that the participants’ appetites
adapted to the ADF regimen.
Based on the current literature, it is unclear whether participants’ appetite is decreased or
increased, which may lead to the desire to eat more, during IF. It is also unclear whether
participants feel hungrier on an IF diet compared to DER. Future studies that includes appetite
measures are required so that a clear conclusion can be made.
2.4 Measuring macronutrients and micronutrients:
2.4.1 Collecting dietary intake data
Four commonly used methods of dietary data collection are; a 24-hour diet recall, a
prospectively filled out food record (weighed or estimated), a diet history and a food
frequency questionnaire. There are strengths and limitations to all dietary collection methods
(Appendix A: Dietary collection methods table of comparison). Therefore, choosing the one
most appropriate for the objectives of the study is essential for collecting appropriate data
(28).
Intervention studies require information on participants’ usual intake before, during and after
the intervention to be able to assess the impact of the intervention (29). To assess usual intake,
all dietary collection methods can be used. However, a 24-hour recall requires a large
representative sample size as well as days of the week to be adequately represented and
estimated, and weighed records require multiple days to be recorded (28). The minimum
length of time required to assess usual intake is two days, however the amount of days
recorded is study dependent (29). A commonly used measure of adherence to the prescribed
diet is gathering self-reported dietary intake during the intervention and then comparing this
11
intake to what the protocol intended (30). All self-reported dietary intake measures are prone
to respondent bias which is over-reporting ‘good foods’ and under-reporting ‘bad foods’.
Furthermore, body mass index (BMI), gender and prior obesity are factors that can influence
the degree of respondent bias that occurs (28). Seven-day food records are often used as they
allow for day-to-day variation by recording every day. However, recording for seven days is
burdensome on participants, and thus problems with compliance may occur (28). To combat
this compliance issue, a food record of two to five days, which incorporates both week and
weekend days, can be utilized. Additionally, few differences in mean intake were found when
weighed food records were compared to estimated food records (31). Therefore, estimated
records have the potential to decrease the participant burden without decreasing the accuracy
of intake reported.
2.4.2 Measuring macronutrient intake and composition
Macronutrients (carbohydrates, protein and fat) are the three main components of food that
provide our bodies with the nutrients it requires. The data gathered from dietary collection
methods can be converted to nutrient intake using food reference tables or via a computer
analysis system (29). When measuring the intake of a group, the mean daily intake is
calculated and presented as grams per day (g/d).
The Acceptable Macronutrient Distribution Ranges (AMDRs) are ‘an estimate of the range of
intake for each macronutrient for individuals (expressed as per cent contribution to energy),
which would allow for an adequate intake of all the other nutrients whilst maximising general
health outcome.’(32). The current recommendations for the AMDRs are; 15-25% of energy
from protein, 20-35% from total fat, <10% from saturated fat (SFA) and 45-65% from
carbohydrates (32).
12
2.4.3 Measuring micronutrients intake and adequacy of a group
Micronutrients are vitamins and minerals that are essential to many physiological processes.
When insufficient amounts are consumed impairment to physiological processes can occur
(28). The dietary intake of nutrients can be determined through data collection of diet and
using food reference tables or computer programs to calculate intake. When evaluating the
intake of a group the mean daily intake is used. To assess if the intake of nutrients for a group
is adequate, the proportion at risk of inadequacy is determined.
The Estimated Average Requirement (EAR) of a nutrient is the estimated amount required for
50% of a healthy population to meet their needs (28, 33). The Recommended Daily Intake
(RDI) is a value that will provide the required intake amount of a nutrient for 97-98% of the
healthy population (28, 33).
To assess the adequacy of a groups intake it is inappropriate to compare the mean intake
directly to the RDI, as the proportion of the group at risk of inadequacy would be
overestimated due to the RDI exceeding the requirements for the majority of the population
(28, 33). The appropriate method is the EAR cutpoint method (28). The EAR cutpoint method
requires at least two non-consecutive days of dietary intake and uses statistical methods to
adjust intakes for day-to-day variation. This adjustment is important as the amount of each
micronutrient that an individual consumes each day varies considerably and if not accounted
for, the results would over or under estimate the probability of those at risk of inadequate
intake (33). It is important to note that the EAR cutpoint method requires nutrients to have a
symmetrical distribution. As iron has a skewed distribution, it is more appropriate to analyse
the adequacy of iron using the full probability approach (28).
13
Some nutrients do not have an EAR and therefore the nutritional inadequacy of its intake
cannot be determined. In this case, the adequate intake (AI) is used. The AI is the
recommended average daily intake assumed to meet the needs of healthy individuals (28, 33).
If the group has a mean intake above the AI, then the likelihood of inadequacy is low.
However, if the mean intake is below the AI it does not conclude inadequacy (28, 33).
2.5 Nutrient intake and composition of Intermittent Fasting diets
The composition of IF diets is scarcely researched, potentially because the diet itself does not
restrict individual nutrients but instead periodically restricts energy intake. Also, majority of
literature that has studied IF in comparison to DER are weight-loss trials, where the EI of the
diet is examined, sometimes without consideration of macronutrients and micronutrients. It is
important to determine the nutrient intake while participants partake in IF, to assess if there
are risks, such as nutrient deficiencies, to individuals who follow IF for long time periods.
2.5.1 Macronutrient profiles during Intermittent Fasting
In randomised controlled weight loss trials that have compared IF 5:2, to DER, the
macronutrient intake and composition of the IF diets varied. The range of EI for the four
RCTs that reported it was 5187-7081 kJ/d, a difference of 1894 kJ (8-11). A study which
assessed the adequacy of IF 5:2 reported macronutrient intake (34) as well as two that
compared IF 5:2 to DER (8, 9). Harvie et al. 2013 (9) reported intakes in the supplementary
material. Both Harvie et al. 2011 (8) and Harvie et al. 2013 (9) reported intakes at months one
and three, with Harvie et al. 2011(8) having an additional measurement at month six.
Meanwhile Tully 2016 (34) had only one measurement. Energy intakes reported in kcal/d
were converted to kJ/d (1 kcal = 4.18 kJ) (32) to be able to compare studies.
The macronutrient intake of studies (8, 9, 34) ranged with; 70.5-81.1 g/d from protein, 43.3-
72.4 g/d from fat, 14.3-28.4 g/d from SFA, 128.1-180.4 g/d from carbohydrates and 12.8-19.6
g/d from fibre. The lowest carbohydrate intake was reported in Harvie et al. 2013 (9) which
14
had two IF 5:2 groups, both with a prescribed limit of <40g of carbohydrates per fasting day.
Furthermore, both IF 5:2 groups consumed 32% less than the prescribed carbohydrate amount
on non-fasting days, thus, potentially reducing the groups mean intake of carbohydrate. All
reported fibre intakes, which ranged from 12.8-19.6 g/d, were below the AI recommendation
of 25 g/d for adult women and 30 g/d for adult males (32).
The composition of the diet is displayed by the %TEI. The macronutrient intakes at month
one and three for Harvie et al. 2013 (9) and month one, three and six for Harvie et al. 2011
(8) were converted to %TEI to assess the composition of the diet as well as enabling a
comparison to the composition reported in Tully (34). Intakes were converted to %TEI using
the formula: ((g of macronutrient*Atwater factor)/energy intake in kJ)*100 = %TEI. The
Atwater factors used were 16.7 kJ/g for carbohydrate or protein and 37.7 kJ/g fat (35). The
diet composition was similar across all timepoints for both studies with the largest difference
an increase or decrease of 2%.
Of the three studies, Harvie et al. 2011 (8) was closest to meeting AMDR recommendations
(Section 2.4.2) with the %TEI for protein, carbohydrate and total fat within the desired ranges
meanwhile the 10% from SFA is on the <10% TEI limit. The other two studies (9, 34) both
met recommendations for protein, were below for carbohydrates, were above for SFA and all
but one IF group in Harvie et al. 2013 (9) were above total fat recommendations.
Three of the RCTs that compared ADF to DER provided a mean weekly EI, which ranged
from 5743-6316 kJ/d, a difference of 573 kJ/d (4, 5, 7) meanwhile Trepanowski et al. 2017
(6) displayed the prescribed intake compared to actual intake for fasting days and feasting
days in a figure where the numerical value could not be identified. Catenacci et al. 2016 (5)
reported the mean macronutrient intake for the entire 8-week intervention meanwhile
15
Coutinho et al. 2018 (4) reported weeks one, four, eight and twelve individually, in the
supplementary material. The intake from these two studies (4, 5) ranged, with; 55.2-75.4 g/d
from protein, 42.3-49.4 g/d from fat and 167.6-185.4 g/d from carbohydrates. Coutinho et al.
2018 (4) reported participants in the ADF group had a fibre intake of 29.1-31.3 g/d over the
intervention time points, complying with the AI of 25 g/d for women and at some points for
men (AI of 30 g/d). Participants in this study had a diet plan for non-fasting days which
included multiple high fibre items (wholegrain bread, rice, pasta, potatoes, tortilla) which
explains how participants reached this intake. Conversely, Trepanowski et al. 2017 (6)
reported the ADF group had a fibre intake of 14 g/d on a feast day and 11 g/d on a fasting day
which is well below the AI for women (25 g/d) and men (30 g/d).
Coutinho et al. 2018 (4) provided the %TEI in the supplementary material however, for
Catenacci et al. 2016 (5) this was calculated from the macronutrient and EI reported, using
the formula: ((g of macronutrient*Atwater factor)/energy intake in kJ)*100 = % of energy
from macronutrient. The Atwater factors used were 16.7 kJ/g for carbohydrate or protein and
37.7 kJ/g fat (35). The macronutrient composition of both ADF diets were within all AMDR
ranges (Section 2.4.2)(4, 5). Trepanowski et al. 2017 (6) reported the %TEI on fasting and
feasting days individually with both meeting the AMDR recommendations for all
macronutrient except total fat which was 35-36% TEI, and the upper limit is 35% TEI. The
fasting methods were different for these three studies as one had a 0% energy intake on
fasting days (5) while the others consumed either a liquid meal replacement plus optional
non-starchy vegetables (4) or 25% of EI between 12-2 pm (6). These results show that even
with different methods of ADF, the macronutrient composition of the diet can meet
recommendations.
16
Coutinho et al. 2018 (4) also published the diet composition during a fasting day with an EI of
2466-2479 kJ/d broken down into 38.5-39.1% from protein, 15.1% from fat, 39.0-40.0% from
carbohydrates and a fibre intake of 5.8-6.0 g/d. The macronutrients for the fasting day were
below the AMDR for both fat and carbohydrates but above the AMDR for protein. The fibre
intake was well below the AI for women (25 g/d) and men (30 g/d) (32).
Overall, the composition and intake of IF diets range considerably between studies that
looked at IF 5:2 and ADF. Based on the studies presented in this thesis, the ADF method is
more closely aligned to the current AMDRs. IF 5:2 method had adequate protein, two of the
three studies had a %TEI for carbohydrate lower than AMDR recommendations and only one
study was within recommendations for both %TEI from fat and SFA. The current studies that
have investigated the IF diet have reported limited data regarding the composition and intake
of participants diets. Future studies will need to incorporate an adequate measure of actual
intake and diet composition so that this can be made clear.
2.5.2 Micronutrient intake during Intermittent Fasting, 5:2 method
There is limited research examining the micronutrient intake and adequacy of subjects
partaking in IF. In two of the RCTs that compared IF 5:2 to DER, participants were supplied
with an over the counter multivitamin and mineral supplement (8, 9). These supplements
provided the recommended dietary allowance (RDA) for vitamins and typically 20-50% for
minerals on restricted days. Harvie et al. 2013 (9) reported that the IF group met the RDA
requirements for all B vitamins, vitamin E and vitamin C, but indicated deficiencies in
magnesium, iron, zinc, calcium, vitamin A and vitamin D. However, Harvie et al. 2013 (9)
compared the mean intake of nutrients directly to the RDA which can overestimate
inadequacies (28, 33). Tully 2016 (34) measured the adequacy of IF 5:2 diet using the EAR
cutpoint method. The results show that the prevalence of inadequate intake was 90-98% of
participants for folate, calcium, magnesium and selenium, and 27-31% of participants for
17
thiamine, vitamin B6 and zinc. The intakes of Vitamin E and sodium for the IF group met the
AI threshold so participants had a low risk of inadequacy. No supplements were provided in
this study. The findings from these studies indicate that the micronutrient intake while
following IF 5:2 is not adequate. However, a greater number of studies examining the
adequacy of IF 5:2 are required to confirm this.
2.6 Summary
In summary, fasting is a historically a religious practice that has become popular as weight-
loss diet. As the current practice of DER for weight-loss has the challenge of adherence, the
various methods of IF have the potential for greater adherence due to greater flexibility. The
research to date of DER compared to IF have found them comparable for weight-loss
however, there is insufficient evidence to form a conclusion about adherence or appetite. The
current literature has focused on weight loss therefore, there is limited literature regarding the
macronutrient composition and micronutrient intake of the IF diets. However, the studies that
did report this information indicate that ADF aligns more closely to AMDR recommendations
meanwhile during IF 5:2 the intake of micronutrients, such as calcium, folate, magnesium,
selenium, zinc, iron, vitamin A and vitamin D may be inadequate.
18
3 Objective Statement
The primary aim of this study is to describe the macronutrient and micronutrient composition
and intake of participants during the 5:2 method of intermittent fasting. Participants were
included from the Intermittent Fasting and Hypoglycaemia study (IF-Hypo) and the Changes
to Resting Energy Expenditure with Different Schedules of Calorie Restriction (CREEDS)
study.
Secondary aims include;
• To describe how the participants macronutrient and micronutrient composition and
intake alters from baseline to week six
• To describe what participants are consuming on fasting days
19
4 Subjects and Methods
4.1 Study design:
This study was a secondary analysis of data collected from two previous studies; Changes in
Resting Energy Expenditure with Different Schedules of caloric restriction (CREEDS)
conducted by Department of Medicine, University of Otago Wellington, New Zealand and
Intermittent Fasting and Hypoglycaemia (IF-Hypo)(36) conducted by Centre for Endocrine
Diabetes and Obesity Research, Wellington Hospital and Department of Medicine, University
of Otago Wellington, New Zealand.
The CREEDS study was a 6-week non-blinded randomized parallel group, dietary
intervention study. The primary outcome was the change in resting energy expenditure over
six weeks comparing participants undergoing daily versus intermittent energy restriction,
providing the same net energy deficit per week. The dietary prescription of the intermittent
fasting (IF) arm was the 5:2 method (IF 5:2). Participants were prescribed to consume 25% of
estimated total daily energy requirements on two non-consecutive days per week, and 100%
energy intake the other five days. The continuous daily restriction participants were
prescribed to consume 80% of their estimated total daily requirements each day.
The IF-Hypo study was a 12-week non-blinded randomized parallel group interventional trial.
The primary outcome was the difference in the rate of hypoglycaemia between treatment arms
in individuals with Type 2 Diabetes Mellitus (Type 2 DM). Participants followed the IF 5:2
diet. Two days per week the prescribed energy intake (EI) was 2092 kJ (women) 2510 kJ
(men), while the other five days intake was ad libitum. Participants were randomized into
consecutive or non-consecutive fasting days.
20
This current thesis describes the macronutrient and micronutrient composition and intake of
participants undertaking the IF 5:2 from the CREEDS and IF-Hypo studies.
Secondary aims include;
1. Describe how the participants macronutrient and micronutrient composition and intake
alters from baseline to week six
2. Describe what participants were consuming on fasting days
4.2 Participants:
Participants included in the CREEDS study were male with a Body Mass Index (BMI) >30
(kg/m2) and aged between 18-65 years. Exclusion criteria were: weight change >5 kg in past
month, current medications or illness that may influence resting energy expenditure, smoker,
weight >220 kg, history of disordered eating, Type 2 DM requiring treatment other than
metformin or diet, or poorly controlled Type 2 DM with an HbA1c of >64 mmol/mol, or a
fasting plasma glucose >10 mmol/L
The inclusion criteria for the IF-Hypo study were a BMI 30-45 (kg/m2), >18 years old, to
have Type 2 DM and have a HbA1c of between 50-85 mmol/mol. Exclusion criteria were:
weight change of >5 kg in the preceding three months, a diagnosis of an eating disorder,
pregnant or planning pregnancy, blood pressure > 180/100 mmHg despite medical therapy, or
previous bariatric surgery.
This study included participants from both CREEDS and IF-Hypo. Participants were included
in the analysis if; they had baseline and week six or only week six 4-day food records and if
they were randomised to the IF treatment arm for the CREEDS study.
Ethical approval for conducting both studies was obtained by the principal investigator of
those studies. Both studies received ethical approval from the New Zealand Health and
21
Disability Ethics Committee (IF HYPO: 14/NTB/33/AM03, CREEDS: 16/NTA/208) and
were performed in accordance with the Declaration of Helsinki. The Australia New Zealand
Clinical Trial Registry numbers are; 12614000402640 (IF HYPO), 12617000635369
(CREEDS). For the CREEDS study consultation with Maori was conducted during protocol
development with Wellington Regional Hospital’s Research Advisory Group – Māori. A
grant-in-aid for this study was received from the Maurice and Phyllis Paykel Trust, registered
charity number CC27541.
4.3 Measurements:
4.3.1 Data collection:
Participants were instructed to prospectively complete 4-day food records at baseline and
week six. This method of dietary data collection was selected for both CREEDS and IF-Hypo
as it provided a cost-effective measure of dietary intake, lower participant burden and
adequate dietary information for the intentions of these studies. The benefits and limitations
of commonly used dietary collection methods are displayed in Appendix A: Dietary collection
methods table of comparison and a brief discussion of dietary collection methods is included
in the literature review (Section 2.4.1). Template food records were provided in hardcopy and
softcopy format which included written instructions and an example entry (Appendix B:
Template Food Record). The CREEDS participants filled out their baseline entry prior to their
first clinic appointment. At their week one visit to the clinic, the food record that was
completed was read over by the research team. Any areas that required greater detail were
discussed so that the participant’s future food records were competently completed. IF-Hypo
participants completed their baseline food record after their baseline clinic visit, where they
had been instructed how to correctly fill in a food record and provided with a template
(Appendix B: Template Food Record).
22
At week six participants were asked to include at least one fasting day and to indicate which
day this was in their food record. If a participant did not indicate the fasting day, then it was
determined by an intake less than or equal to 50% of the average EI for week six. If none of
the EIs for the 4-days were under this EI than the day with the lowest EI was chosen. For
participants in the IF-Hypo study that did not indicate their fasting days and were randomized
to fast on consecutive days, the lowest consecutive EIs were chosen as fasting days.
All food record templates provided had written instructions and a sample entry. Participants
were encouraged to specify the quantity of food consumed, listing all ingredients and
including brand names. Some participants chose to record their food intake via a smart phone
application. Each record entry was reviewed by the research team and checked for error or
lack of detail. If clarification was required, this was then discussed with the participant via
phone call or next study visit, whichever occurred first.
Participants in the IF-Hypo study were provided with seven days of sample recipes for their
fasting days (Appendix C: Intermittent Fasting and Hypoglycaemia study - fasting day meal
ideas participant hand-out). These were designed by the research dietitian and consisted of
two snacks and one main meal per day. The energy intake of these meals ranged from 2092
kJ/d for females to 2510 kJ/d for males. The CREEDS participants were provided with ‘A
guide to calorie counting’ (Appendix D: CREEDS ‘Guide to calorie counting’ participant
handout) which included; tips for sticking to a low-calorie diet, a two-page quick reference
guide containing calorie counts for common food and drink items, sample meal-plans for
fasting days and recipe cards for low calorie meals. The guide also contained; a list of recipe
websites that provide calorie counts, links to online-calorie counters, the names of android
and iOS compatible calorie counting apps such as The Easy Diet Diary (37) and calorie
23
counting or IF recipe books. The Easy Diet Diary (37) app for iPhone and the Calorie King
website (www.calorieking.com.au) were recommended for calorie counting, as they are based
on the food composition databases of the Food Standards Authority Australia New Zealand
(38). Participants were provided to option of completing their food records via the mobile
phone application or website to encourage adherence to accurately recording their diet.
The 4-day food records were then entered by trained members of the research team into the
computer program Foodworks (2) for analysis. This software utilizes the Australian and NZ
foodbased files and composition tables.
To be able to describe what participants consumed on fasting day the individual food items
and beverages consumed needed to be categorised. The categories decided were; alcohol,
biscuits, bread, cheese, coffee, crackers, desserts, eggs, fizzy drink, fruit, juice, legumes,
meat, milk, milo, miscellaneous, mixed meals, nuts, porridge, potato, rice, salad, snacks, soup,
spreads, sweets, tea, vegetables, Weetbix and yoghurt. These categories were chosen based on
frequency of selection as well as being specific enough to describe the foods and beverages.
The items that were consumed on a fasting day but were not categorised included; water,
sauces, spices, sugar, sweetener, flour, vinegar, dressings and oil. These were excluded from
categorization as they were recorded inconsistently between participants and/or were not the
main component of food or beverage choices. Only milk volumes over 150 ml were included
in the milk category as any volume lower than 150 ml was likely an addition to a different
item which was already categorised, such as hot beverages and cereal, rather than milk as a
beverage. Salad was a separate category from vegetables as some included items other than
vegetables, such as couscous. Additionally, some participants recorded a meal as one single
item, rather than individual ingredients, such as lasagne or kebab, therefore, these were
categorised as mixed meals as they contained multiple categories. The miscellaneous category
24
included quinoa, noodles, optifast and tofu. These were included in the miscellaneous
category as they did not belong in any other and there was only one frequency of each.
4.3.2 Data validation:
Methods of quality control for data entry of food records include 10% of food records are re-
selected, re-entered and then compared to the original entry (39) or the hard copy food record
is compared to the original food analysis system entry (40), such as Foodworks (2). The 4-day
food records used in this analysis were originally entered into Foodworks (2) by a research
team that were not involved in this current study. As the previous research team was not
involved all food record hard copies were compared with the original Foodworks (2) entry by
this research team. Any discrepancies, errors or differences in interpretation were noted, and
altered if required. Throughout this quality control process a data entry protocol (Appendix E:
Diet entry protocol) was developed to standardize unclear food record entries. Food records
that are ambiguous rely on the coder entering the record into the analysis software to make
decisions regarding its correct interpretation. These decisions can be different between coders
and thus, can be a source of error if a data entry protocol is not developed (31, 39). Another
error in coding that can occur is an inaccurate weight for a food item is coded. To detect
inaccurate weight entries the highest and lowest 10 values for each nutrient are filtered and
the weight checked for accuracy (28), which was completed in this study.
4.4 Data analysis:
Nutrients per person per day were calculated using Foodworks (2). The participants
completed 4-day food records of which one or two were fasting days in week six. To account
for fasting and non-fasting days the food record days were weighted appropriately to give an
average intake over the entire week. Mean nutrient intakes were compared between groups.
Percent of total energy intake (%TEI) was compared with calculated acceptable macronutrient
distribution ranges (AMDRs). STATA was used to calculate mean, median, 25th and 75th
quartiles, standard deviation, confidence intervals, mean differences and p-values. The
25
sodium intake reported did not account for discretionary salt use, which is the addition of
table salt during cooking or at the table. Therefore, intake is likely underestimated. However,
as sodium is an important dietary factor the reported intake is included in this thesis, but
should be interpreted with caution. To validate sodium intake 24-hour or spot urine samples
are required (28), as neither of these were available from the studies included, it was decided
that the accuracy of intake was inadequate to perform a statistical analysis.
The adequacy of nutrient intakes of a group can be investigated by calculating the proportion
of the group at risk of inadequacy. To calculate adequacy usual dietary intake needs to be
adjusted to account for intra-individual (day-to-day) variation, which requires at least two
non-consecutive days of dietary intake. Once variation has been accounted for the adjusted
usual intake is compared to the Estimated Average Requirement (EAR) to determine what
proportion of the group is at risk of inadequacy. This is known as the EAR cutpoint method
(28). However, this method requires a minimum of 30 participants. The present thesis
includes a total of 38 participants, but the two separate cohorts have 27 participants from IF-
Hypo and 11 from CREEDS which is an inadequate number to perform the EAR cutpoint
method. Additionally, the week six data are adjusted to account for the fasting and non-fasting
days. Thus, further statistical analysis to account to the intra-individual variation was too
complex for the context of this thesis. Taking these factors into account it was determined that
the EAR cutpoint method was not performed and therefore, risk of inadequacy of the IF diet
could not be assessed.
Some nutrients do not have an EAR as there is insufficient data to establish one, therefore
they have an Adequate Intake (AI). A group’s usual mean intake can be compared to the AI
but can only be used in confidence when the AI represents a group similar to the one being
26
evaluated (28). If it meets the AI, then the group likely has an adequate intake. However, if
the group mean is below the AI it does not conclude the prevalence of inadequacy (33).
The RDI and EAR values for micronutrients were included in Table 2. These were used to
illustrate what intake is recommended for an individual to have a high probability of meeting
requirements and to provide clinical context. The range of intake (max, min, median, 25th
quartile and 75th quartile) was used to show the variety of intake participants in this study had
while participating in IF.
27
5 Results
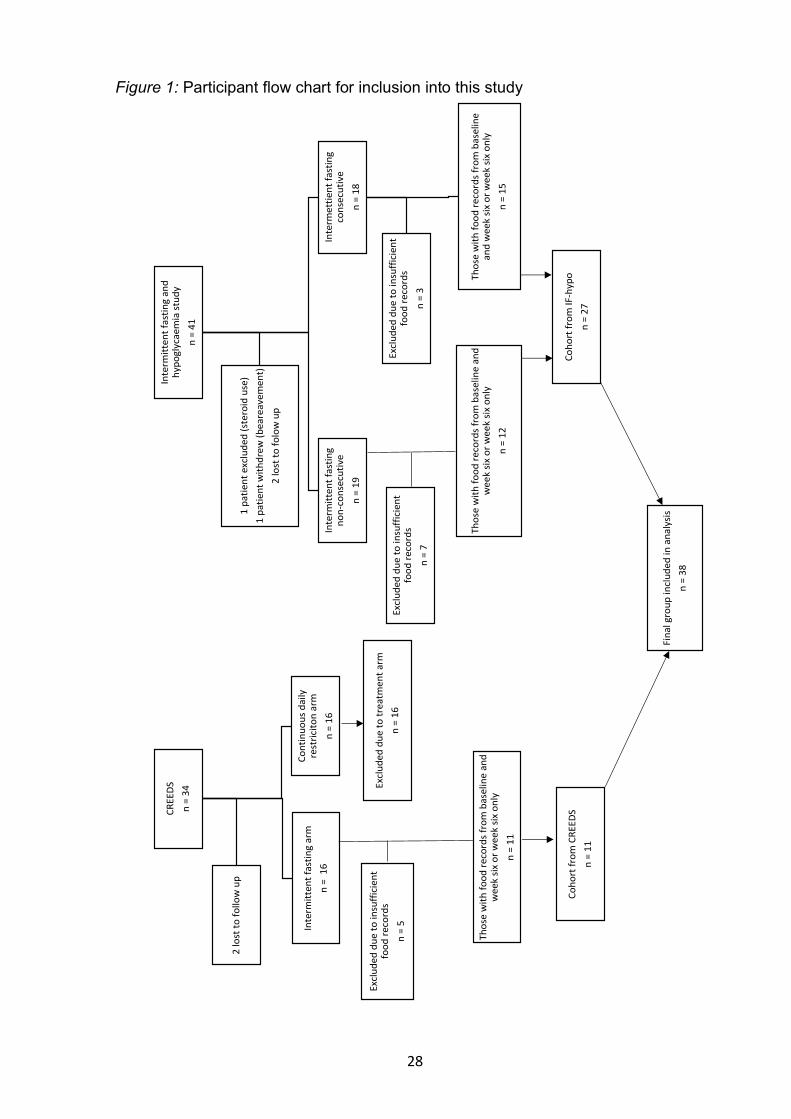
5.1 Participant characteristics
The study population was selected from the previous Changes in Resting Energy Expenditure
with Different Schedules of caloric restriction (CREEDS) and Intermittent Fasting and
Hypoglycaemia (IF-Hypo) study populations as shown in Figure 1. There were 75
participants involved in both studies, after exclusion 38 remained in the final dataset. Reasons
for exclusion of participants are shown in Figure 1. The baseline characteristics of the 38
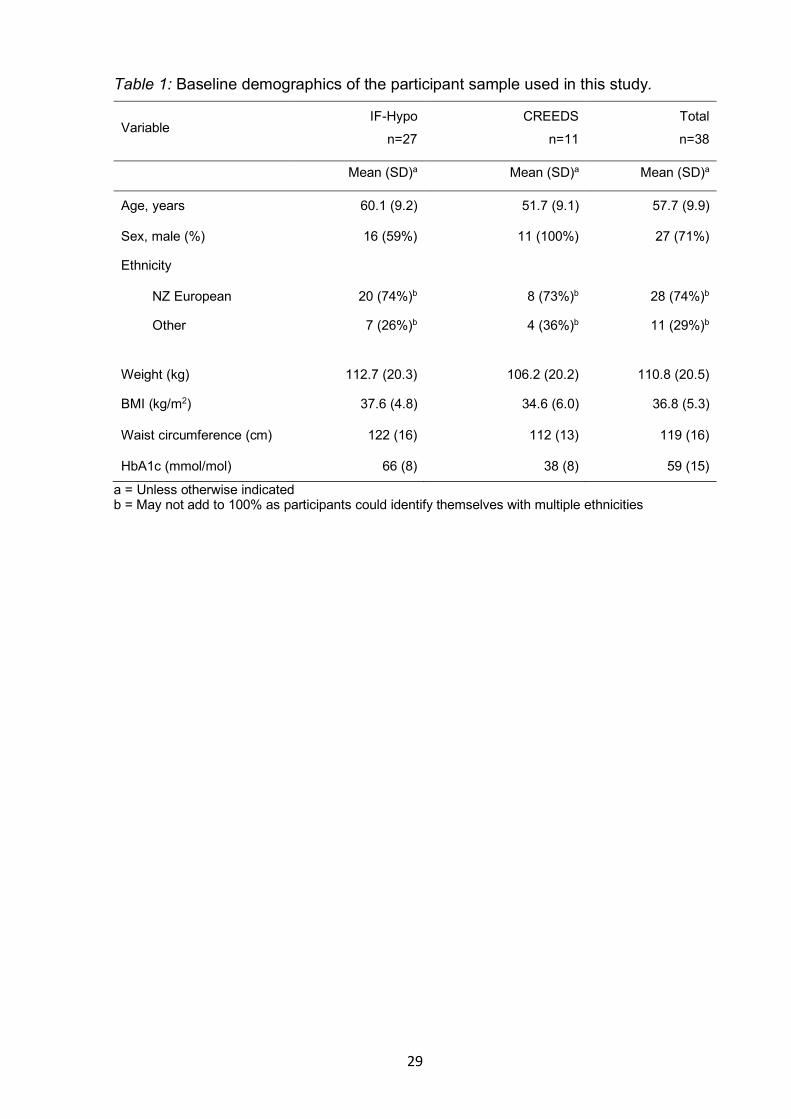
participants are presented in Table 1. Twenty seven participants are from the IF-Hypo study
and 11 participants are from the CREEDS study. The mean age of participants included in this
analyses was 57.7 y, ranging from 35-76 y. The majority of participants were male (71%)
which was influenced by the CREEDS study being only conducted in men. A greater
proportion of the study population identified as New Zealand European. The total response
rate for ethnicity was applied to allow individuals that identify with more than one ethnicity to
be represented. Thus, if a participant identified themselves with more than one ethnicity, both
were included in this demographic table. The mean weights were 112.7 kg and 106.2 kg
(ranging from 85.3 kg to 170.0 kg) and mean body mass index (BMI) were 37.6 kg/m2 and
34.6 kg/m2 (ranging from 30.1 kg/m2 to 50.5 kg/m2), for IF-Hypo and CREEDS, respectively.
The participants from the IF-Hypo study had a HbA1c range of 52-83 mmol/mol while those
from CREEDS ranged from 30-56 mmol/mol. Again, this difference between studies is due to
the inclusion criteria (Section 4.2) as the IF-Hypo cohort required a HbA1c of 50-85
mmol/mol.
28
CREE
DSn
= 34
Inte
rmitt
ent f
astin
g ar
mn
= 1
6
Thos
e w
ith fo
od re
cord
s fro
m b
asel
ine
and
wee
k six
or w
eek
six o
nly
n =
11
Coho
rt fr
om C
REED
Sn
= 11
Exclu
ded
due
to in
suffi
cient
fo
od re
cord
s n
= 5
Cont
inuo
us d
aily
re
stric
iton
arm
n
= 16
Exclu
ded
due
to tr
eatm
ent a
rm
n =
16
2 lo
st to
follo
w u
p
Inte
rmitt
ent f
astin
g an
d hy
pogl
ycae
mia
stud
y n
= 41
Inte
rmitt
ent f
astin
g no
n-co
nsec
utiv
e n
= 19
Thos
e w
ith fo
od re
cord
s fro
m b
asel
ine
and
wee
k six
or w
eek
six o
nly
n =
12
Exclu
ded
due
to in
suffi
cient
fo
od re
cord
sn
= 7
Inte
rmet
tient
fast
ing
cons
ecut
ive
n =
18
Thos
e w
ith fo
od re
cord
s fro
m b
asel
ine
and
wee
k six
or w
eek
six o
nly
n =
15
Coho
rt fr
om IF
-hyp
o n
= 27
Fina
l gro
up in
clude
d in
ana
lysis
n =
38
Exclu
ded
due
to in
suffi
cient
fo
od re
cord
sn
= 3
1 pa
tient
exc
lude
d (s
tero
id u
se)
1 pa
tient
with
drew
(bea
reav
emen
t)2
lost
to fo
low
up
Figure 1: Participant flow chart for inclusion into this study
29
Table 1: Baseline demographics of the participant sample used in this study.
Variable IF-Hypo
n=27
CREEDS
n=11
Total
n=38
Mean (SD)a Mean (SD)a Mean (SD)a
Age, years 60.1 (9.2) 51.7 (9.1) 57.7 (9.9)
Sex, male (%) 16 (59%) 11 (100%) 27 (71%)
Ethnicity
NZ European 20 (74%)b 8 (73%)b 28 (74%)b
Other 7 (26%)b 4 (36%)b 11 (29%)b
Weight (kg) 112.7 (20.3) 106.2 (20.2) 110.8 (20.5)
BMI (kg/m2) 37.6 (4.8) 34.6 (6.0) 36.8 (5.3)
Waist circumference (cm) 122 (16) 112 (13) 119 (16)
HbA1c (mmol/mol) 66 (8) 38 (8) 59 (15)
a = Unless otherwise indicated b = May not add to 100% as participants could identify themselves with multiple ethnicities
30
5.2 Food records returned
Of the 38 participants in this analysis, 33 returned baseline food records. The majority
(90.0%) returned 4-day records however, one of the participants only returned records for one
day, another for two days and another for three days. All 38 participants returned food records
for week six. Of these records 94.7% of participants returned four days, however, one
participant returned only two days, and another participant three days. The number of days in
which dietary intake was collected were 126 for baseline and 149 for week six. Of the 149
days there were 53 days for fasting and 96 days for non-fasting.
5.3 Energy intake during Intermittent Fasting
The mean macronutrient and micronutrient range of intake and composition of participant’s
diets during intermittent fasting (IF) in week six are shown in Table 2. This is a weighted
average that includes both fasting and non-fasting days. The mean energy intake (EI) was
6943 kJ per day, with an interquartile range of 5825-8207 kJ/d. The difference between the
25th and 75th quartiles is 2382 kJ. This difference indicates that the average EI while
participants are participating in IF varies considerably.
5.4 Protein intake during Intermittent Fasting
The percent of total energy intake (%TEI) of 22% from protein is within the acceptable
macronutrient distribution range (AMDR) of 15-25%. The 75th percentile for protein is 24%
which is close to the AMDR upper limit of 25%, and the maximum of 41% is above the upper
limit, together indicating that a proportion of participants in the upper quartile exceeded the
protein AMDR upper limit.
5.5 Fat intake during Intermittent Fasting
The median intake from fat was 33% which is within the AMDR of 20-35%. The 75th
percentile for fat is 37% which shows that 25% of the study population is above the
recommended upper limit of 35%. Also, the median composition from saturated fat (SFA) of
31
12% is above the recommendation of <10% TEI, indicating that 50% of the study population
is above the AMDR.
5.6 Carbohydrate and fibre intake during Intermittent Fasting
The 75th percentile for %TEI from carbohydrates was 43% which is below the recommended
45-65% AMDR indicating that 75% of participants consumed lower than
recommended %TEI from carbohydrates. The fibre intake of 25 g/d for participants in the top
25% of intake shows that it is unlikely majority of the study sample will be meeting
requirements, especially males as the adequate intake (AI) is 30 g/d.
5.7 Micronutrients with low intake during Intermittent Fasting
As specified in the literature review (Section 2.4.3), it is inappropriate to assess the adequacy
of a groups intake by directly comparing mean intake recommended daily intake (RDI).
Therefore, RDI and estimated average requirement (EAR) are included in Table 2 to provide
clinical context. Additionally, the median intake of nutrients from the 2008/09 Adult Nutrition
Survey (ANS) (41) are included to show what the intake of New Zealand adults were in the
most recent national survey. The intakes of calcium, zinc, magnesium and potassium are of
interest. The median intake of calcium and magnesium are lower than the respective RDIs.
Additionally, calcium intake was lower than both the EAR and the reported intake of males
and females in the ANS. The intake of zinc during IF 5:2 was lower than the RDI and EAR
for males, but higher than the RDI and EAR for females. Furthermore, the median intake of
zinc is 1.9 mg below the ANS intake of adult males which indicates an intake lower than a
typical New Zealand adult male. The potassium intake shows that 50% of this sample has an
intake beneath the AI as well as the intake reported in the ANS, for both males and females.
5.8 Micronutrients with excess intake during Intermittent Fasting
The lowest 25% of sodium intake was below the suggested daily target however, the median
sodium intake is greater that the suggested daily target. Additionally, the top 25% of intake is

32
1000 mg in excess of the suggested daily target and the maximum intake is double the
suggested daily target. This shows that at least 50% of the participants were consuming
excess sodium.
The maximum intake of folate was 1042 mg of dietary folate equivalents which is above the
upper limit of 1000 mg/d dietary folate equivalents (32) which suggests at least one
participant had excess intake.
33
Table 2: The macronutrient and micronutrient median and range of intake and composition during week six (includes fasting and non-fasting days).
Median (25th, 75th
quartile) n=38
Range (min–max)
Macronutrient AMDR§ ANS¶
Energy (kJ/d) 6943 (5825, 8207) 3147-11912 - - -
Protein (g/d) 86 (69, 105) 38-157 - - -
%TEIa 22 (19, 24) 13-41 15-25% - 16.4-16.5%
Total Fat (g/d) 62 (56, 77) 14-165 - - -
%TEIa 33 (29, 37) 17-46 20-35% - 33.7-33.8%
SFA (g/d) 24 (17, 31) 5-52 - - -
%TEIa 12 (10,15) 6-21 <10% - 13.1%
MUFA (g/d) 23 (19, 29) 6-73 - - -
PUFA (g/d) 9 (7, 12) 1-31 - - - Carbohydrate (g/d) 172 (137, 199) 69-273 - - -
%TEIa 39 (36, 43) 21-50 45-65% - 46.0-47.1%
Sugar (g/d)b 69 (36, 82) 20-162 - - -
Fibre (g/d) 20 (17, 25) 12-40 30*
25† - 22.1 M 17.5 F
Caffeine (mg/d) 137 (65,251) 0-583 - - -
Micronutrients RDI EAR ANS¶
Thiamine (mg/d) 1.2 (0.9, 1.6) 0.5-3.2 1.2y 1.1x
1.0y
0.9x 1.6y
1.1x
B6 (mg/d) 1.3 (0.9, 1.7) 0.4-2.6 1.3-1.7y
1.3-1.5x 1.1-1.4y
1.1-1.3x 2.2y
1.6x
B12 (mg/d) 5.1 (3.3, 6.3) 1.0-8.4 2.4xy 2.0xy 4.7y
3.3x
Calcium (mg/d) 670 (409, 962) 239-1651 1000-1300xy 840-1100xy 919y
745x
Folate (mg/d) 487 (406, 677) 183-1042 400xy 320xy -
Zinc (mg/d) 11 (8, 13) 4-19 14y
8x 12y
6.5x 12.9y
9.0x
Magnesium (mg/d) 287 (197, 354) 140-554 420y
320x 350y
265x -
Iron (mg/d) 10 (9, 12) 5-20 8y
8-18x 6y
5-8x 13.2y
9.9x
Selenium (µg/d) 69 (49, 82) 35-163 70y
60x 60y
50x 67.0y
47.1x
Sodium (mg/d)c 2339 (1888, 3077) 831-4055 2000‡ - -
Potassium (mg/d) 2640 (2144, 3356) 1155-5620 3800*
2800† - 3449y
2757x

34
a = %TEI stands for percent of total energy intake b = the value for sugar includes both added and naturally occurring sugar c = the intake of sodium does not include discretionary salt use x = Adult females (19-70 y) y = Adult males (19-70 y) xy = Adult males and females (19-70 y) * = AI for male † = AI for female ‡ = Suggested daily target for adults (42) § = AMDR stands for the acceptable macronutrient distribution range (32) ¶ = ANS 08/09 stands for the Adult Nutrition Survey conducted in 2008/09 (41)
35
5.9 The intake on fasting days compared to non-fasting days
A comparison of composition and intake of fasting days to non-fasting days in week six is
shown in Table 3. The intake of all macronutrients and micronutrients, except caffeine, are
significantly greater on non-fasting days. The composition of the diet remained similar
between fasting and non-fasting days as there were no significant differences in %TEI from
carbohydrates, total fat and SFA. Interestingly, the %TEI from protein on non-fasting days
was 21% which is significantly lower (p=0.02) than on fasting days, where it is 25% which is
equal to the recommended AMDR upper limit of 25%. The increase in %TEI from protein on
a fasting day occurs even though the mean intake of protein on non-fasting days is
significantly higher (p<0.001) than the mean intake on fasting days, demonstrating a
proportionate preservation of protein at the expense of other macronutrients.
36
Table 3: Comparison of the macronutrient and micronutrient composition and intake of fasting days versus non-fasting days
Fasting Non-fasting
Mean (SD) n=38
Mean (SD) n=38
Mean difference (95% CI) P-value
Macronutrient
Energy (kJ/d) 3767 (1568) 8313 (2454) 4447 (3534-5361) <0.001*
Protein (g/d) 55 (26) 100 (32) 45 (32-58) <0.001*
%TEIa 25 (10) 21 (4) -4 (-8 - -1) 0.02*
Total Fat (g/d) 33 (21) 79 (33) 45 (33-58) <0.001*
%TEIa 31 (10) 34 (7) 4 (0-7) 0.07
SFA (g/d) 12 (12) 29 (13) 17 (12-22) <0.001*
%TEIa 11 (5) 13 (4) 2 (0-4) 0.06
MUFA (g/d) 12 (8) 30 (15) 18 (13-23) <0.001*
PUFA (g/d) 5 (4) 12 (7) 7 (4-9) <0.001*
Carbohydrate (g/d) 88 (41) 196 (61) 108 (85-131) <0.001*
%TEIa 38 (10) 39 (7) 1 (-3 - 4) 0.78
Sugar (g/d)b 45 (33) 74 (35) 30 (15-45) <0.001*
Fibre (g/d) 14 (6) 24 (9) 10 (7-13) <0.001*
Caffeine (mg/d) 176 (189) 176 (148) 0 (-75-75) 1.00
Micronutrients
Thiamine (mg/d) 1.1 (0.8) 1.5 (0.7) 0.4 (0.1-0.7) 0.02*
B6 (mg/d) 1.1 (0.6) 1.5 (0.7) 0.3 (0.1-0.6) 0.02*
B12 (mg/d) 3.6 (2.6) 5.4 (2.4) 1.9 (0.8-3.0) 0.00*
Calcium (mg/d) 554 (389) 814 (415) 261 (83-440) 0.00*
Folate (mg/d) 373 (199) 618 (267) 244 (141-347) <0.001*
Zinc (mg/d) 6 (4) 12 (5) 6 (4-8) <0.001*
Magnesium (mg/d) 190 (77) 331 (122) 142 (96-187) <0.001*
Iron (mg/d) 7 (3) 12 (4) 5 (3-6) <0.001*
Selenium (µg/d) 53 (36) 79 (32) 26 (11-41) 0.001*
Sodium (mg/d)c 1421 (703) 2796 (1085) - -
Potassium (mg/d) 1893 (926) 3191 (1209) 1298 (820-1775) <0.001* a = %TEI stands for percent of total energy intake b = the value for sugar includes both added and naturally occurring sugar. c = the intake of sodium does not include discretionary salt use. * P<0.05 indicates statistical significance for the difference between non-fasting days and fasting days
37
5.10 The macronutrient and micronutrient intake during week six compared to
baseline
The macronutrient and micronutrient intake and composition of the diet of participants that
had both baseline and week six food records are compared in Table 4. Week six includes both
fasting and non-fasting days. The results indicate that, while undertaking IF, the participants
significantly decreased their intake of; energy, protein, carbohydrates, total fat, SFA,
monounsaturated fat, polyunsaturated fat, sugar, fibre, thiamine, vitamin B6, calcium,
magnesium, iron and potassium. Participants significantly increased their %TEI from protein,
from 20% at baseline to 22% during week six. There was no significant difference in
the %TEI from carbohydrate, fat or SFA or in the intake of caffeine, B12, folate, zinc,
selenium and sodium.
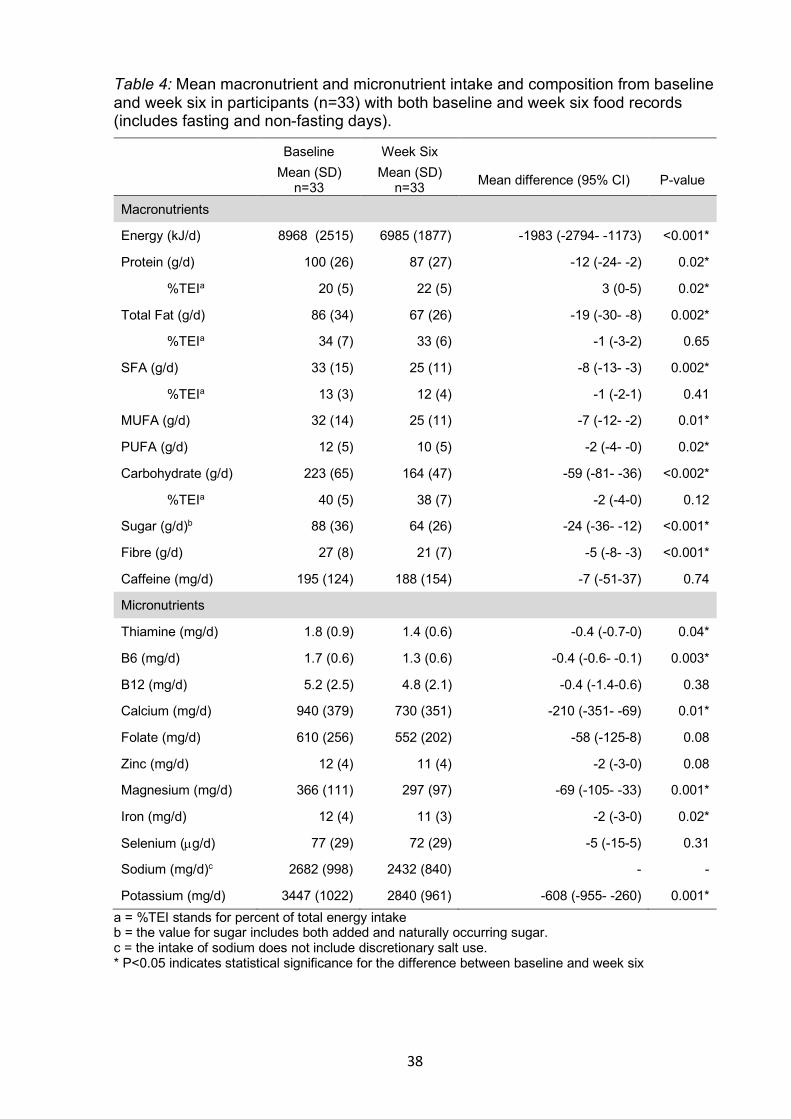
38
Table 4: Mean macronutrient and micronutrient intake and composition from baseline and week six in participants (n=33) with both baseline and week six food records (includes fasting and non-fasting days).
Baseline Week Six
Mean (SD) n=33
Mean (SD) n=33 Mean difference (95% CI) P-value
Macronutrients
Energy (kJ/d) 8968 (2515) 6985 (1877) -1983 (-2794- -1173) <0.001*
Protein (g/d) 100 (26) 87 (27) -12 (-24- -2) 0.02*
%TEIa 20 (5) 22 (5) 3 (0-5) 0.02*
Total Fat (g/d) 86 (34) 67 (26) -19 (-30- -8) 0.002*
%TEIa 34 (7) 33 (6) -1 (-3-2) 0.65
SFA (g/d) 33 (15) 25 (11) -8 (-13- -3) 0.002*
%TEIa 13 (3) 12 (4) -1 (-2-1) 0.41
MUFA (g/d) 32 (14) 25 (11) -7 (-12- -2) 0.01*
PUFA (g/d) 12 (5) 10 (5) -2 (-4- -0) 0.02*
Carbohydrate (g/d) 223 (65) 164 (47) -59 (-81- -36) <0.002*
%TEIa 40 (5) 38 (7) -2 (-4-0) 0.12
Sugar (g/d)b 88 (36) 64 (26) -24 (-36- -12) <0.001*
Fibre (g/d) 27 (8) 21 (7) -5 (-8- -3) <0.001*
Caffeine (mg/d) 195 (124) 188 (154) -7 (-51-37) 0.74
Micronutrients
Thiamine (mg/d) 1.8 (0.9) 1.4 (0.6) -0.4 (-0.7-0) 0.04*
B6 (mg/d) 1.7 (0.6) 1.3 (0.6) -0.4 (-0.6- -0.1) 0.003*
B12 (mg/d) 5.2 (2.5) 4.8 (2.1) -0.4 (-1.4-0.6) 0.38
Calcium (mg/d) 940 (379) 730 (351) -210 (-351- -69) 0.01*
Folate (mg/d) 610 (256) 552 (202) -58 (-125-8) 0.08
Zinc (mg/d) 12 (4) 11 (4) -2 (-3-0) 0.08
Magnesium (mg/d) 366 (111) 297 (97) -69 (-105- -33) 0.001*
Iron (mg/d) 12 (4) 11 (3) -2 (-3-0) 0.02*
Selenium (µg/d) 77 (29) 72 (29) -5 (-15-5) 0.31
Sodium (mg/d)c 2682 (998) 2432 (840) - -
Potassium (mg/d) 3447 (1022) 2840 (961) -608 (-955- -260) 0.001* a = %TEI stands for percent of total energy intake b = the value for sugar includes both added and naturally occurring sugar. c = the intake of sodium does not include discretionary salt use. * P<0.05 indicates statistical significance for the difference between baseline and week six
39
5.11 Non-fasting days at baseline compared to non-fasting days during week six
The baseline dietary intake compared to the week six intake on non-fasting days in
participants who had both baseline and week six food records is shown in Table 5.
Participants significantly decreased their intake of carbohydrate (p=0.03) and sugar (p=0.04).
Additionally, EI decreased by 654 kJ per day in week six compared to baseline. This decrease
is not statistically significant, but it equates to a decrease of 3270 kJ per week (five non-
fasting days per week).
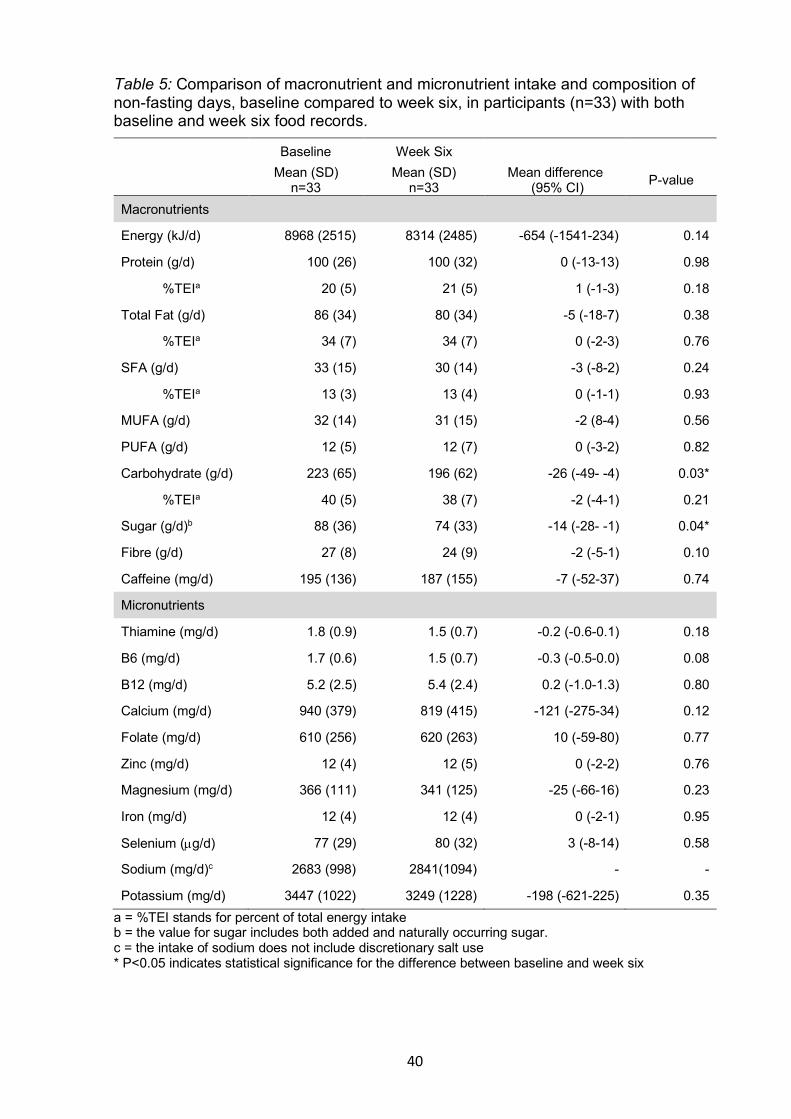
40
Table 5: Comparison of macronutrient and micronutrient intake and composition of non-fasting days, baseline compared to week six, in participants (n=33) with both baseline and week six food records.
Baseline Week Six
Mean (SD) n=33
Mean (SD) n=33
Mean difference (95% CI) P-value
Macronutrients
Energy (kJ/d) 8968 (2515) 8314 (2485) -654 (-1541-234) 0.14
Protein (g/d) 100 (26) 100 (32) 0 (-13-13) 0.98
%TEIa 20 (5) 21 (5) 1 (-1-3) 0.18
Total Fat (g/d) 86 (34) 80 (34) -5 (-18-7) 0.38
%TEIa 34 (7) 34 (7) 0 (-2-3) 0.76
SFA (g/d) 33 (15) 30 (14) -3 (-8-2) 0.24
%TEIa 13 (3) 13 (4) 0 (-1-1) 0.93
MUFA (g/d) 32 (14) 31 (15) -2 (8-4) 0.56
PUFA (g/d) 12 (5) 12 (7) 0 (-3-2) 0.82
Carbohydrate (g/d) 223 (65) 196 (62) -26 (-49- -4) 0.03*
%TEIa 40 (5) 38 (7) -2 (-4-1) 0.21
Sugar (g/d)b 88 (36) 74 (33) -14 (-28- -1) 0.04*
Fibre (g/d) 27 (8) 24 (9) -2 (-5-1) 0.10
Caffeine (mg/d) 195 (136) 187 (155) -7 (-52-37) 0.74
Micronutrients
Thiamine (mg/d) 1.8 (0.9) 1.5 (0.7) -0.2 (-0.6-0.1) 0.18
B6 (mg/d) 1.7 (0.6) 1.5 (0.7) -0.3 (-0.5-0.0) 0.08
B12 (mg/d) 5.2 (2.5) 5.4 (2.4) 0.2 (-1.0-1.3) 0.80
Calcium (mg/d) 940 (379) 819 (415) -121 (-275-34) 0.12
Folate (mg/d) 610 (256) 620 (263) 10 (-59-80) 0.77
Zinc (mg/d) 12 (4) 12 (5) 0 (-2-2) 0.76
Magnesium (mg/d) 366 (111) 341 (125) -25 (-66-16) 0.23
Iron (mg/d) 12 (4) 12 (4) 0 (-2-1) 0.95
Selenium (µg/d) 77 (29) 80 (32) 3 (-8-14) 0.58
Sodium (mg/d)c 2683 (998) 2841(1094) - -
Potassium (mg/d) 3447 (1022) 3249 (1228) -198 (-621-225) 0.35 a = %TEI stands for percent of total energy intake b = the value for sugar includes both added and naturally occurring sugar. c = the intake of sodium does not include discretionary salt use * P<0.05 indicates statistical significance for the difference between baseline and week six
41
5.12 Food and beverages chosen on fasting days
The proportion of participants that chose foods from the top 10 food categories on fasting
days is illustrated in Figure 2. The categories that the majority (68-71%) of participants chose
were; fruit, meat and vegetables. Presented in Table 6 are the most frequent food types
consumed from the top ten food categories on fasting days. For example, in the fruit category
the most popular food item eaten by participants was an apple, which was 38% of all fruit
eaten on fasting days. The most popular categories of food chosen were fruit, meat and
vegetables which were chosen by 71%, 71% and 68% of participants on fasting days. The
main items from these categories were apples, bananas and oranges for fruit; fish, chicken and
beef for meat; and tomatoes, mixed vegetables and onions for vegetables. The food types and
frequency of foods types consumed on fasting days are of interest as they indicate whether
participants are following the meal ideas given to them by the research team.
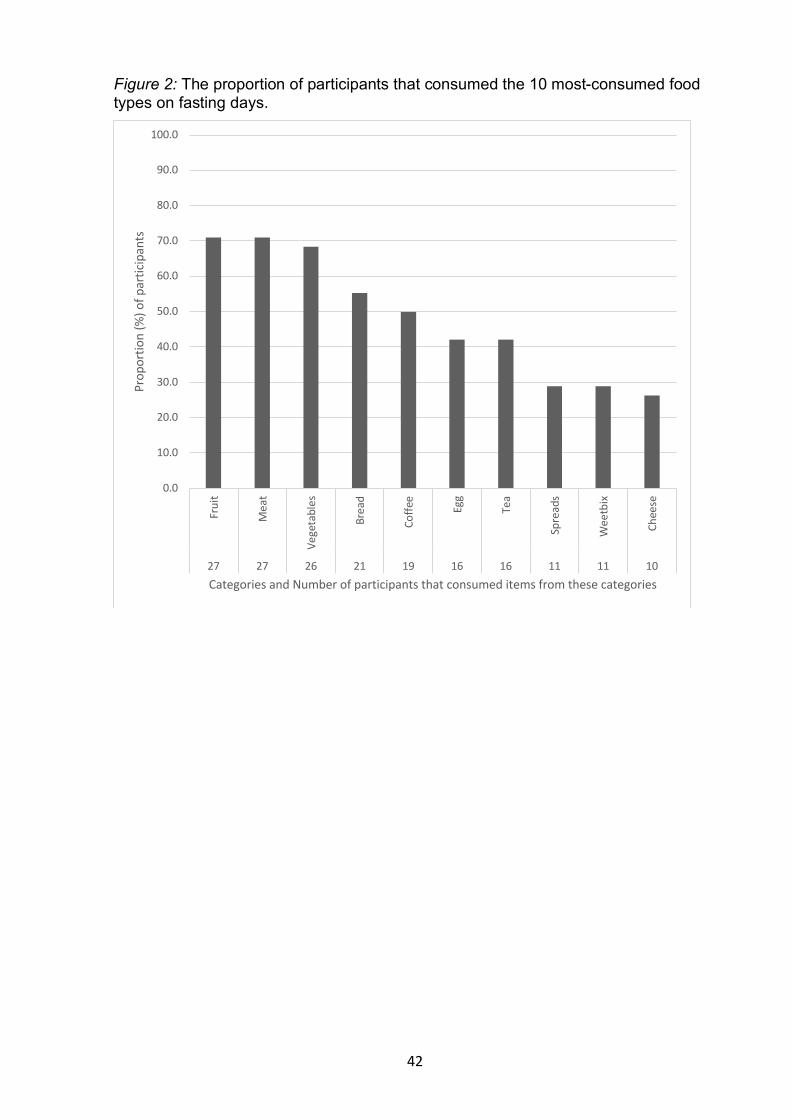
42
Figure 2: The proportion of participants that consumed the 10 most-consumed food types on fasting days.
0.0
10.0
20.0
30.0
40.0
50.0
60.0
70.0
80.0
90.0
100.0
Frui
t
Mea
t
Vege
tabl
es
Brea
d
Coffe
e
Egg
Tea
Spre
ads
Wee
tbix
Chee
se
27 27 26 21 19 16 16 11 11 10
Prop
ortio
n (%
) of p
artic
ipan
ts
Categories and Number of participants that consumed items from these categories

43
Table 6: The most frequent food types consumed from the top 10 food categories on fasting days.
Category Top items % of frequency
Fruit Apple 38 Banana 13 Orange 9 Mandarin 7 Meat Fish (8 tuna) 30 Chicken 30 Beef 23 Pork (5 Ham) 16 Vegetables Tomato 26 Mixed vegetables (e.g. Stir-fry mix) 13 Onion 12 Carrot 9 Bread Multigrain 59 White 22 Whole meal 11 Coffee No milk 48 With milk 39 Café 13 Egg Scrambled 24 Omelet 24 Fried 24 Boiled 18 Poached 12 Tea With milk 52 No milk 40 Herbal 8 Spreads Honey 31 Jam 21 Margarine 21 Marmite 10 Weet-bix 2 biscuits 50 3 biscuits 38 1.5 biscuits 13 Cheese Edam 71
44
6 Discussion
The 5:2 method of intermittent fasting (IF 5:2) demonstrated in this study can meet the
recommended macronutrient composition (32) for protein and total fat intake meanwhile,
carbohydrate was below recommendations and saturated fat (SFA) was above. The intake of
micronutrients varied widely as shown by the minimum and maximum intake being below
and above the recommended daily intake (RDI) and estimated average requirement (EAR) for
both males and females, respectively. On fasting days, the intake of all macronutrients and
micronutrients significantly decreased which was expected, with preferential preservation of
protein intake, reflected by an increase in percent of total energy intake (%TEI) from protein.
Furthermore, compared to baseline, after six weeks of intermittent fasting (IF) the mean total
intake of all macronutrients across the week significantly decreased. However, again
the %TEI from protein was greater after six weeks. The intake of thiamine, vitamin B6,
calcium, magnesium, iron and potassium significantly decreased in week six compared to
baseline. Also, importantly, the total energy intake (EI) of non-fasting days during IF
decreased from baseline intake, even though EI on non-fasting days was ad libitum.
6.1 Macronutrients:
During IF, participants’ mean intake and %TEI from protein during IF was 86 g/d and 22%
respectively, is comparable to the ranges of 70.5-81.1 g/d and 19-23%, reported in studies that
used IF 5:2 (8, 9, 34). When compared with the intake of New Zealand adults (41), where
protein intake was 71 g/d for females, 102 g/d for males, and %TEI was 16.4-16.5%, the
intake during IF was similar, but %TEI of 22% is considerably higher. These comparisons
demonstrate that the protein intake and composition, of participants in the two studies
analysed in this thesis, meet recommendations (32), are similar between studies, but %TEI is
proportionately higher than the average diet of New Zealand adults. The %TEI from fat and
SFA during IF were 33% and 12% respectively, which are within recommendations for fat
45
(25-35 %TEI) but above SFA (<10 %TEI) (32). Both fat and SFA intake are similar to New
Zealand adults, 33.7-33.8% for fat and 13.1% for SFA (41), as well as other studies of IF 5:2
(8, 9, 34) which report ranges of 29-37% and 10-14% for fat and SFA, respectively. Together
this highlights the challenge of limiting SFA across the population.
On fasting days, the intake of all macronutrients significantly decreased, which is expected
due to the energy restriction. However, the %TEI from protein increased significantly from
21% to 25% (p<0.001), fat decreased from 34% to 31% (p=0.07), SFA decreased from 13%
to 11% (p=0.06) and carbohydrate decreased from 39% to 38% (p=0.78). This illustrates that
on fasting days the composition of diet increased in protein, sustained carbohydrate and
decreased in fat. This is a novel finding since other studies (8-11, 34) that have examined IF
5:2, have not compared the diet on fasting days diet to non-fasting days and thus we are
unable to compare our results. Fat is the most energy dense macronutrient (32) therefore, a
reduction of fat intake was likely required to achieve the energy restriction on a fasting day.
Furthermore, the meal ideas provided to participants were designed by the research dietitian
to have a high protein intake, as protein has been shown to have a satiating effect (43), thus
likely contributing to the preferential preservation of %TEI from protein. Displayed in the top
ten categories are three protein sources; meat, eggs and cheese, which reflect the sources of
protein consumed by participants on fasting days.
The mean intake of carbohydrates on a fasting day was 88 g/d, which is significantly lower
than on a non-fasting day where intake was 196 g/d (p<0.001). As carbohydrate sources are
also important sources of fibre (41, 44), this decrease in intake could explain the significant
and concerning decrease in fibre from 24 g/d on a non-fasting day to 14 g/d on a fasting day
(p<0.001). Furthermore, the top dietary sources of total carbohydrates for New Zealand adults
(41) were bread, fruit, pasta and grains and of these, only fruit and bread are in the top
46
categories in this analysis. Additionally, 22% of the bread chosen was white bread which has
less fibre than whole grain therefore, contributing to the decreased intake of fibre (44).
The significant difference in fibre intake observed between baseline and week six is due to the
decreased intake of fibre on fasting days as there was no significant difference observed
between non-fasting days at baseline and week six (Table 5). The fibre intake on fasting days
of 14 g/d, as well as the median intake during IF of 20 g/d, are both below the adequate intake
(AI) for females (25 g/d) and males (30 g/d). The fibre intake reported in other studies that
have used IF 5:2 range from 12.8-19.6 g/d (8, 9, 34) and the ANS reported a fibre intake of
17.5 g/d for females and 22.1 g/d for males (41). Taken together these results suggest that the
fibre intake reported in this study is consistent with other studies as well as being similar to
New Zealand adults. However, there is a heightened risk of inadequate intake overall, with
males at an increased risk due to their higher AI. Therefore, for individuals partaking in this
diet fibre intake should be encouraged, particularly on fasting days. Fibre intake could be
increased without significantly increasing EI by increasing intake of low energy, high fibre
foods such as vegetables and fruit as well as selecting only whole grain carbohydrates.
Adequate fibre intake should be encouraged as fibre is important for bowel function, reducing
the risk of chronic diseases, and maintaining a healthy body weight (32, 44).
The median intake of carbohydrates during IF was 172 g/d, which is comparative to the intake
of 164-180.4 g/d reported in two studies that have used IF 5:2 without a carbohydrate
restriction (8, 34). The %TEI of 39% is lower than the 44-46% reported in those studies, as
well as the AMDR of 45-65% (32). However, the appropriate proportion of carbohydrates is
controversial with weight-loss associated with adherence and overall energy intake, not
carbohydrate intake (45). Wholegrain carbohydrates are an important source of the B group
vitamins, magnesium, calcium, iron, zinc, selenium as well as fibre (46). Thus, low
47
carbohydrate intake is likely contributing to the decreased intake of vitamin B6, calcium,
magnesium, iron and potassium observed on fasting days and in week six. Overall, these
results indicate that the quality and quantity of carbohydrates consumed during IF have an
important influence on micronutrient and fibre intakes.
6.2 Micronutrients:
During IF 5:2 the intakes of calcium, zinc, magnesium and potassium were lower than
recommendations. At least 50% of the study population’s intake was lower than the RDI or
EAR for calcium, as well as having an intake lower than New Zealand adults (Table 2)(41),
indicating a low calcium intake during IF 5:2. The recommended calcium intake can vary
between countries due to differences in methods of setting requirements. However, low
calcium intake is often observed. Calcium is crucial for bone health and therefore, reaching
adequate intake is important (47, 48). Dairy products are a primary source of calcium in the
diet. Only cheese was in the top ten categories on a fasting day, chosen by 26.3% of
participants. Thus, the intake of dairy products on fasting days was poor, and perhaps this was
not adjusted for on non-fasting days leading to an overall low intake of calcium. Fruit, meat
and vegetables were the top three categories chosen on fasting days and are rich sources of
nutrients, including, magnesium, zinc and potassium (32). As the intake of these
micronutrients were low during IF, it indicates that participants were not consuming enough
magnesium, zinc and potassium, regardless of nutrient rich sources being consumed on
fasting days.
There is limited literature reporting the intake of micronutrients during IF 5:2. Two RCTs that
have used IF 5:2 provided participants with a micronutrient supplement (8, 9). Harvie et al.
2013 (9) reported that IF 5:2 indicated deficiencies in magnesium, iron, zinc, calcium, vitamin
A and D. However, this study compared the mean intake of nutrients directly to the RDA
which can overestimate inadequacies (28, 33). Another study, which assessed the adequacy of
48
IF 5:2 using the EAR cutpoint method, found that the proportion at risk for inadequate intake
was greater than 90% for folate, calcium, magnesium, selenium and greater than 25% for
vitamin B6, thiamine and zinc (34). This thesis did not assess adequacy thus, we cannot
directly compare our results. However, the significant decrease of thiamine, vitamin B6,
calcium, magnesium, iron and potassium intake observed in week six, suggest that these
nutrients could be at risk of inadequate intake. As a precaution, taking a micronutrient
supplement while IF could be beneficial until the risk of inadequacy is known.
The median intake of sodium during IF was 2339 mg/d, which is over the suggested daily
target of 2000 mg/d (42). However, this should be interpreted with caution as discretionary
salt use was not measured therefore, actual intake was potentially higher. The sodium intake
of New Zealanders has been reported in excess of 3000 mg/d (49, 50). As sodium intake can
negatively affect health, reducing excess sodium intake is recommended (51, 52). The
majority of sodium consumed is from manufactured foods (53) with bread, processed meats
and sauces the top foods contributing to sodium intake in New Zealand (54). Both bread and
processed meats (ham) were consumed on fasting days, contributing to the sodium intake
reported. Therefore, reduction of these are required to reduce intakes to appropriate levels
6.3 Energy intake:
The EI on non-fasting days during IF decreased by 654 kJ/d when compared to baseline.
Thus, weekly EI was substantially reduced. This is an interesting finding, as participants were
allowed to eat ad libitum therefore, it might be expected that individuals would overeat to
compensate for the fasting day. While this finding is not statistically significant it has the
potential to be clinically significant. This finding is consistent with studies that looked at IF
5:2 (9) and ADF (6) which found that participants ate less than prescribed on non-fasting
days. It is hypothesised that an energy reduction of 418 kJ/d can prevent weight gain (55).
49
Overall, the decrease of 654 kJ/d supports the use of IF as an effective weight gain prevention
strategy.
6.4 Food and beverages chosen on fasting days:
The food and beverages chosen on fasting days are representative of some of the meal ideas
that were provided to participants (Appendix C and D). The breakfast options of toast with
spreads and weetbix were most popular as all three were in the top ten categories. Also, in the
meat category, canned tuna and ham were popular, which also reflect the meal ideas.
Interestingly, coffee and tea were both in the top ten categories which could indicate that
participants may have consumed a high frequency of fluids as a way of filling themselves up
without consuming excess calories. Fluid intake was recorded inconsistently between
participants in this analysis therefore, we were unable to compare the fluid intake of fasting
and non-fasting days to test this hypothesis.
To the best of our knowledge this is the only study that has explored fasting day consumption
when food and beverages are not provided. The foods chosen gave insight as to why the
results in intake and composition were seen. The results show that providing participants with
meal ideas was beneficial as participants utilized them. Therefore, the use of participant
handouts may be a valuable tool in assisting participants adherence to diet protocols.
Additionally, meal ideas could be used to potentially modify a diets intake and composition,
such as providing specific ideas for the preservation of fibre intake. Further study into the
types of foods chosen and the resultant effect on the intake of macronutrients and
micronutrients would be useful to demonstrate the potential risks and benefits of the IF diet.
6.5 Strengths and limitations:
A strength of this study was the rigor of ensuring only food diary data that were complete
were included. All hard copy food records were compared with original entries into
Foodworks (2) as well as a dietary entry protocol was developed (Appendix E) therefore, data
50
quality is a strength. A limitation to this study is that the intake reported relies on the accuracy
of participants’ self-reported intake, which it is known to have inaccuracies. However, all
methods of assessing dietary intake have limitations, as shown in Appendix A. Therefore, the
method chosen was optimal for the study design. Another limitation is that the sample size did
not allow for the EAR cutpoint method or the full probability approach of assessing
nutritional adequacy. The aims of both original studies did not include the assessment of
sodium intake therefore, the methods used limited our ability to conduct statistical
investigations of sodium intake as well as influencing the accuracy of intake reported (Section
4.4). Another limitation is that Foodworks (2) utilizes both New Zealand and Australia food
databases, which is an issue as Australia has mandatory fortification of folic acid and New
Zealand has voluntary fortification (56, 57). Foodworks relies on manufacturers information
to calculate the amount of added folate, which may not be accurate (58). Therefore, the
reported intake of folate should be interpreted with caution.
6.6 Conclusion:
This secondary analysis demonstrates that during IF 5:2, the proportion of energy from
protein increases meanwhile the proportion from carbohydrates is lower than recommended
which may impact fibre and micronutrient intake. Future longer-term studies that focus on
macronutrient and micronutrient intake, composition and adequacy will be important in
determining if there are risks in IF 5:2. In particular, the intake of fibre, thiamine, vitamin B6,
calcium, iron, magnesium, zinc and potassium. Additionally, future studies will ideally
include methods that allow the intake of sodium to be analysed accurately. Studies with a
larger study population and duration are important to allow findings to be generalized to the
wider population. This study shows that IF 5:2 provides a viable alternative to DER to reduce
total EI over a week, facilitating weight loss. In individuals who participate in IF 5:2 the
quality and quantity of carbohydrates should be considered as well as the precautionary intake
of a micronutrient supplement until the micronutrient adequacy of IF 5:2 is determined.
51
7 Application to Practice
There are continuously new approaches to diet in the hopes of finding an effective weight loss
diet, which can therefore make it difficult for dietitians to keep up with the latest diets and the
strengths and limitations of each. As dietitians are evidenced based practitioners it is
important that there is appropriate research into diets so that the evidence is continuously
relevant and up-to-date and thus, dietitians can use this in their practice. The literature review
of this thesis examines the current studies that have utilized multiple versions of the popular
intermittent fasting diet. This provides dietitian’s an overview of what the research into the
diet is to date and the main conclusion, which is irrespective of method intermittent fasting is
comparable to daily energy restriction for weight loss. This is useful as they may have had
patients and clients mention this diet and therefore, they are now more informed about what
the scientific findings are in relation to weight loss.
The results from this thesis, the description of the macronutrient and micronutrient
composition and intake of intermittent fasting, the 5:2 method (IF 5:2), gives greater detail of
the diet itself. It has shown that the diet can be a high protein, moderate fat, low carbohydrate
diet. It has displayed that fibre intake may be an issue as the results from this study as well as
other studies show that fibre intake does not generally meet the adequate intake. The intake of
micronutrients shows that individuals who participate in this diet may struggle to reach
recommended intakes, particularly for calcium, zinc, magnesium and potassium. These
findings can help to guide dietitians with clients who would like to try this form of diet and to
provide some areas in which they may need to focus on. Additionally, this research displayed
that when participants were given meal ideas that they did utilize these and therefore, this
could encourage dietitians to provide these for patients and clients.
52
8 References
1. DansingerML,GleasonJ,GriffithJL,SelkerHP,SchaeferEJ.Comparisonofthe
atkins,ornish,weightwatchers,andzonedietsforweightlossandheartdiseaserisk
reduction:Arandomizedtrial.JAMA.2005;293(1):43-53.
2. XyrisSoftware.FoodWorksAustralia2017[cited2018Nov22].9:[Available
from:https://xyris.com.au/.
3. MMosleyMS.TheFastDietAtriaBooks;2013.
4. CoutinhoSR,HalsetEH,GåsbakkS,RehfeldJF,KulsengB,TrubyH,etal.
Compensatorymechanismsactivatedwithintermittentenergyrestriction:A
randomizedcontroltrial.ClinNutr.2018;37(3):815-23.
5. CatenacciVA,PanZ,OstendorfD,BrannonS,GozanskyWS,MattsonMP,etal.A
randomizedpilotstudycomparingzero-caloriealternate-dayfastingtodailycaloric
restrictioninadultswithobesity.Obesity(SilverSpring,Md).2016;24(9):1874-83.
6. TrepanowskiJF,KroegerCM,BarnoskyA,KlempelMC,BhutaniS,HoddyKK,etal.
EffectofAlternate-DayFastingonWeightLoss,WeightMaintenance,and
CardioprotectionAmongMetabolicallyHealthyObeseAdults:ARandomizedClinical
Trial.JAMAinternalmedicine.2017;177(7):930-8.
7. AshS,ReevesMM,YeoS,MorrisonG,CareyD,CapraS.Effectofintensivedietetic
interventionsonweightandglycaemiccontrolinoverweightmenwithTypeIIdiabetes:
arandomisedtrial.IntJObes.2003;27(7):797-802.
8. HarvieMN,PegingtonM,MattsonMP,FrystykJ,DillonB,EvansG,etal.The
effectsofintermittentorcontinuousenergyrestrictiononweightlossandmetabolic
diseaseriskmarkers:arandomisedtrialinyoungoverweightwomen.IntJObes(Lond).
2011;35(5):714.
9. HarvieM,WrightC,PegingtonM,McMullanD,MitchellE,MartinB,etal.The
effectofintermittentenergyandcarbohydraterestrictionv.dailyenergyrestrictionon
53
weightlossandmetabolicdiseaseriskmarkersinoverweightwomen.BrJNutr.
2013;110(8):1534-47.
10. CarterS,CliftonPM,KeoghJB.Theeffectsofintermittentcomparedtocontinuous
energyrestrictiononglycaemiccontrolintype2diabetes;apragmaticpilottrial.
DiabetesResClinPract.2016;122:106-12.
11. SundførTM,SvendsenM,TonstadS.Effectofintermittentversuscontinuous
energyrestrictiononweightloss,maintenanceandcardiometabolicrisk:Arandomized
1-yeartrial.NutrMetabCardiovascDis.2018;28(7):698-706.
12. TrepanowskiJF,BloomerRJ.Theimpactofreligiousfastingonhumanhealth.
NutrJ.2010;9(1):57.
13. AziziF.Islamicfastingandhealth.AnnNutrMetab.2010;56(4):273-82.
14. DuncanMJ,SmithJT,NarbaizaJ,MueezF,BustleLB,QureshiS,etal.Restricting
feedingtotheactivephaseinmiddle-agedmiceattenuatesadversemetaboliceffectsofa
high-fatdiet.PhysiolBehav.2016;167:1-9.
15. ChaixA,ZarrinparA,MiuP,PandaS.Time-restrictedfeedingisapreventative
andtherapeuticinterventionagainstdiversenutritionalchallenges.CellMetab.
2014;20(6):991-1005.
16. HatoriM,VollmersC,ZarrinparA,DiTacchioL,BushongEA,GillS,etal.Time-
RestrictedFeedingwithoutReducingCaloricIntakePreventsMetabolicDiseasesinMice
FedaHigh-FatDiet.CellMetab.2012;15(6):848-60.
17. VanderWorpHB,HowellsDW,SenaES,PorrittMJ,RewellS,O'CollinsV,etal.
Cananimalmodelsofdiseasereliablyinformhumanstudies?PLoSMed.
2010;7(3):e1000245.
18. RothschildJ,HoddyKK,JambazianP,VaradyKA.Time‐restrictedfeedingand
riskofmetabolicdisease:areviewofhumanandanimalstudies.NutrRev.
2014;72(5):308-18.
54
19. EshghiniaS,MohammadzadehF.Theeffectsofmodifiedalternate-dayfasting
dietonweightlossandCADriskfactorsinoverweightandobesewomen.Journalof
Diabetes&MetabolicDisorders.2013;12(1):4.
20. VaradyKA,BhutaniS,ChurchEC,KlempelMC.Short-termmodifiedalternate-day
fasting:anoveldietarystrategyforweightlossandcardioprotectioninobeseadults.Am
JClinNutr.2009;90(5):1138-43.
21. HeilbronnLK,SmithSR,MartinCK,AntonSD,RavussinE.Alternate-dayfastingin
nonobesesubjects:effectsonbodyweight,bodycomposition,andenergymetabolism.
AmJClinNutr.2005;81(1):69-73.
22. KlempelMC,KroegerCM,VaradyKA.Alternatedayfasting(ADF)withahigh-fat
dietproducessimilarweightlossandcardio-protectionasADFwithalow-fatdiet.
Metabolism.2013;62(1):137-43.
23. MNoakesPC.CSIRO‘TotalWellbeingDiet’:PenguinBooks;2005.
24. KeoghJB,PedersenE,PetersenKS,CliftonPM.Effectsofintermittentcompared
tocontinuousenergyrestrictiononshort-termweightlossandlong-termweightloss
maintenance.ClinObes.2014;4(3):150-6.
25. ByrneNM,SainsburyA,KingNA,HillsAP,WoodRE.Intermittentenergy
restrictionimprovesweightlossefficiencyinobesemen:theMATADORstudy.IntJ
Obes.2018;42(2):129.
26. GreenwayFL.Physiologicaladaptationstoweightlossandfactorsfavouring
weightregain.IntJObes.2015;39:1188.
27. VaradyKA,BhutaniS,KlempelMC,KroegerCM,TrepanowskiJF,HausJM,etal.
Alternatedayfastingforweightlossinnormalweightandoverweightsubjects:a
randomizedcontrolledtrial.NutrJ.2013;12(1):146.
28. GibsonRS.Principlesofnutritionalassessment:Oxforduniversitypress,USA;
2005.
55
29. ThompsonFE,ByersT.Dietaryassessmentresourcemanual.TheJournalof
nutrition.1994;124(suppl_11):2245s-317s.
30. DesrochesS,LapointeA,RattéS,GravelK,LégaréF,TurcotteS.Interventionsto
enhanceadherencetodietaryadviceforpreventingandmanagingchronicdiseasesin
adults.TheCochranedatabaseofsystematicreviews.2013(2):CD008722-CD.
31. BinghamSA,GillC,WelchA,CassidyA,RunswickSA,OakesS,etal.Validationof
dietaryassessmentmethodsintheUKarmofEPICusingweighedrecords,and24-hour
urinarynitrogenandpotassiumandserumvitaminCandcarotenoidsasbiomarkers.Int
JEpidemiol.1997;26(suppl_1):S137-S51.
32. NationalHealthandMedicalResearchCouncil.NutrientReferenceValuesfor
AustraliaandNewZealandIncludingRecommededDietaryIntakesCanberra2006
[Availablefrom:
http://www.moh.govt.nz/NoteBook/nbbooks.nsf/0/FD14C5E898B74265CC2574BE00
7DACF6/$file/n35.pdf.
33. MurphySP,PoosMI.DietaryReferenceIntakes:summaryofapplicationsin
dietaryassessment.PublicHealthNutr.2002;5(6a):843-9.
34. TullyAH.Acomparisonofnutrientintakesamongparticipantsfollowingthree
popularweightlossdiets[ThesisMasterofDietetics]:UniversityofOtago;2016.
35. FoodandAgriculturalOrganization:WorldHealthOrganization:UnitedNations
UniversityExpertconsultation.Humanenergyrequirements.[Internet].2004[cited
2018Nov22].Availablefrom:http://www.fao.org/3/a-y5686e.pdf.
36. CorleyBT,CarrollRW,HallRM,WeatherallM,Parry‐StrongA,KrebsJD.
IntermittentfastinginType2diabetesmellitusandtheriskofhypoglycaemia:a
randomizedcontrolledtrial.DiabetMed.2018;35(5):588-94.
37. SoftwareX.EasyDietDiaryAustraliap.Mobilephoneapplication.
56
38. FoodStandardsAustraliaandNewZealand.AustraliaFood,Supplementand
NutrientDatabase2011-2013[cited201925Feb].Availablefrom:
http://www.foodstandards.gov.au/science/monitoringnutrients/ausnut/ausnutdatafile
s/Pages/foodnutrient.aspx.
39. ConwayR,RobertsonC,DennisB,StamlerJ,ElliottP,GroupIR.Standardised
codingofdietrecords:experiencesfromINTERMAPUK.BrJNutr.2004;91(5):765-71.
40. WelchA,McTaggartA,MulliganA,LubenRN,WalkerN,TKhawK,etal.DINER
(DataIntoNutrientsforEpidemiologicalResearch)-Anewdata-entryprogramfor
nutritionalanalysisintheEPIC-Norfolkcohortandthe7-daydiarymethod2001.1253-
65p.
41. UniversityofOtagoandMinistryofHealth.Afocusonnutrition:Keyfindingsof
the2008/09NewZealandAdultNutritionSurvey.[Internet].Wellington:Ministryof
Health;2011[cited2018Nov21].Availablefrom:
https://www.health.govt.nz/system/files/documents/publications/a-focus-on-
nutrition-v2.pdf.
42. NationalHealthandMedicalResearchCouncilandMinistryofHealth.Australia
andNewZealandNutrientReferenceValuesforSodium[Internet].2017[Available
from:
https://www.nrv.gov.au/sites/default/files/content/resources/2017%20ANZ%20NRV
s%20for%20Sodium%20%28containing%20recommendations%29.pdf.
43. WycherleyTP,MoranLJ,CliftonPM,NoakesM,BrinkworthGD.Effectsofenergy-
restrictedhigh-protein,low-fatcomparedwithstandard-protein,low-fatdiets:ameta-
analysisofrandomizedcontrolledtrials–.AmJClinNutr.2012;96(6):1281-98.
44. MailletJOS,PotterRL,HellerL.PositionoftheAmericanDieteticAssociation.J
AmDietAssoc.2002;102(5):716-26.
57
45. BravataDM,SandersL,HuangJ,KrumholzHM,OlkinI,GardnerCD,etal.Efficacy
andSafetyofLow-CarbohydrateDiets:ASystematicReview.JAmMedAssoc.
2003;289(14):1837-50.
46. MinistryofHealth.EatingandActivityGuidelinesforNewZealandAdults
[Internet].Wellington:MinistryofHealth;2015[Availablefrom:
https://www.health.govt.nz/system/files/documents/publications/eating-activity-
guidelines-for-new-zealand-adults-oct15_0.pdf.
47. JointF,OrganizationWH.Vitaminandmineralrequirementsinhumannutrition.
2005.
48. FlynnA.Theroleofdietarycalciuminbonehealth.ProcNutrSoc.
2003;62(4):851-8.
49. ThomsonC,CollsA.Twenty-fourhoururinarysodiumexcretioninseven
hundredresidentsofOtagoandWaikato.Dunedin:UniversityofOtago.1998.
50. McLeanR,EdmondsJ,WilliamsS,MannJ,SkeaffS.BalancingSodiumand
Potassium:EstimatesofIntakeinaNewZealandAdultPopulationSample.Nutrients.
2015;7(11):5439.
51. AppelLawrenceJ,BrandsMichaelW,DanielsStephenR,KaranjaN,Elmer
PatriciaJ,SacksFrankM.DietaryApproachestoPreventandTreatHypertension:a
scientificstatementfromtheAmericanHeartAssociation.Hypertension.
2006;47(2):296-308.
52. MacgregorGA,SagnellaGA,MarkanduND,SingerDRJ,CappuccioFP.Double-
blindstudyofthreesodiumintakesandlong-termeffectsofsodiumrestrictionin
essentialhypertension.TheLancet.1989;334(8674):1244-7.
53. BrownIJ,TzoulakiI,CandeiasV,ElliottP.Saltintakesaroundtheworld:
implicationsforpublichealth.IntJEpidemiol.2009;38(3):791-813.
58
54. WoodwardE,EylesH,NiMhurchuC.Keyopportunitiesforsodiumreductionin
NewZealandprocessedfoods.AustNZJPublicHealth.2012;36(1):84-9.
55. HillJO,WyattHR,ReedGW,PetersJC.Obesityandtheenvironment:wheredowe
gofromhere?Science.2003;299(5608):853-5.
56. FoodStandardsAustraliaandNewZealand.FolicAcidFortification[Internet].
2016[Availablefrom:
http://www.foodstandards.gov.au/consumer/nutrition/folicmandatory/Pages/default.
aspx.
57. NewZealand(PermittedFortificationofBreadwithFolicAcid)FoodStandard
2012,(2012).
58. RaderJI,WeaverCM,AngyalG.Totalfolateinenrichedcereal-grainproductsin
theUnitedStatesfollowingfortification.FoodChem.2000;70(3):275-89.
59. BlockG.Areviewofvalidationsofdietaryassessmentmethods.AmJEpidemiol.
1982;115(4):492-505.
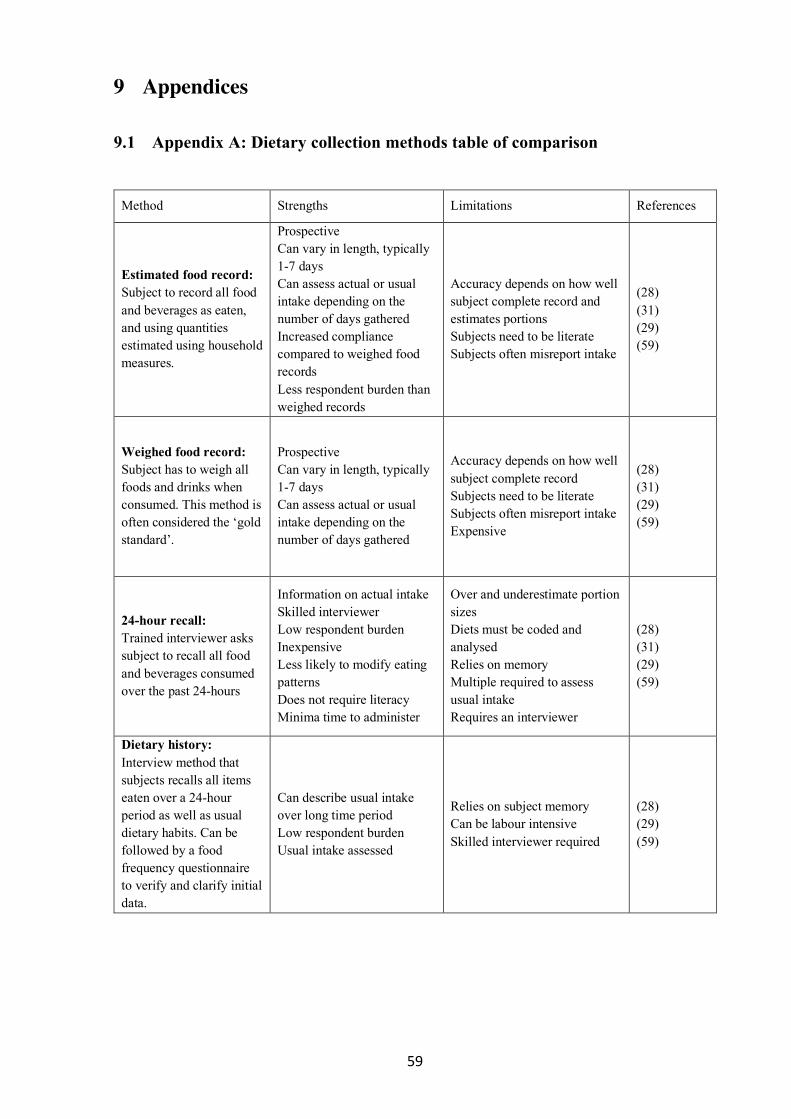
59
9 Appendices
9.1 Appendix A: Dietary collection methods table of comparison
Method Strengths Limitations References
Estimated food record: Subject to record all food and beverages as eaten, and using quantities estimated using household measures.
Prospective Can vary in length, typically 1-7 days Can assess actual or usual intake depending on the number of days gathered Increased compliance compared to weighed food records Less respondent burden than weighed records
Accuracy depends on how well subject complete record and estimates portions Subjects need to be literate Subjects often misreport intake
(28) (31) (29) (59)
Weighed food record: Subject has to weigh all foods and drinks when consumed. This method is often considered the ‘gold standard’.
Prospective Can vary in length, typically 1-7 days Can assess actual or usual intake depending on the number of days gathered
Accuracy depends on how well subject complete record Subjects need to be literate Subjects often misreport intake Expensive
(28) (31) (29) (59)
24-hour recall: Trained interviewer asks subject to recall all food and beverages consumed over the past 24-hours
Information on actual intake Skilled interviewer Low respondent burden Inexpensive Less likely to modify eating patterns Does not require literacy Minima time to administer
Over and underestimate portion sizes Diets must be coded and analysed Relies on memory Multiple required to assess usual intake Requires an interviewer
(28) (31) (29) (59)
Dietary history: Interview method that subjects recalls all items eaten over a 24-hour period as well as usual dietary habits. Can be followed by a food frequency questionnaire to verify and clarify initial data.
Can describe usual intake over long time period Low respondent burden Usual intake assessed
Relies on subject memory Can be labour intensive Skilled interviewer required
(28) (29) (59)
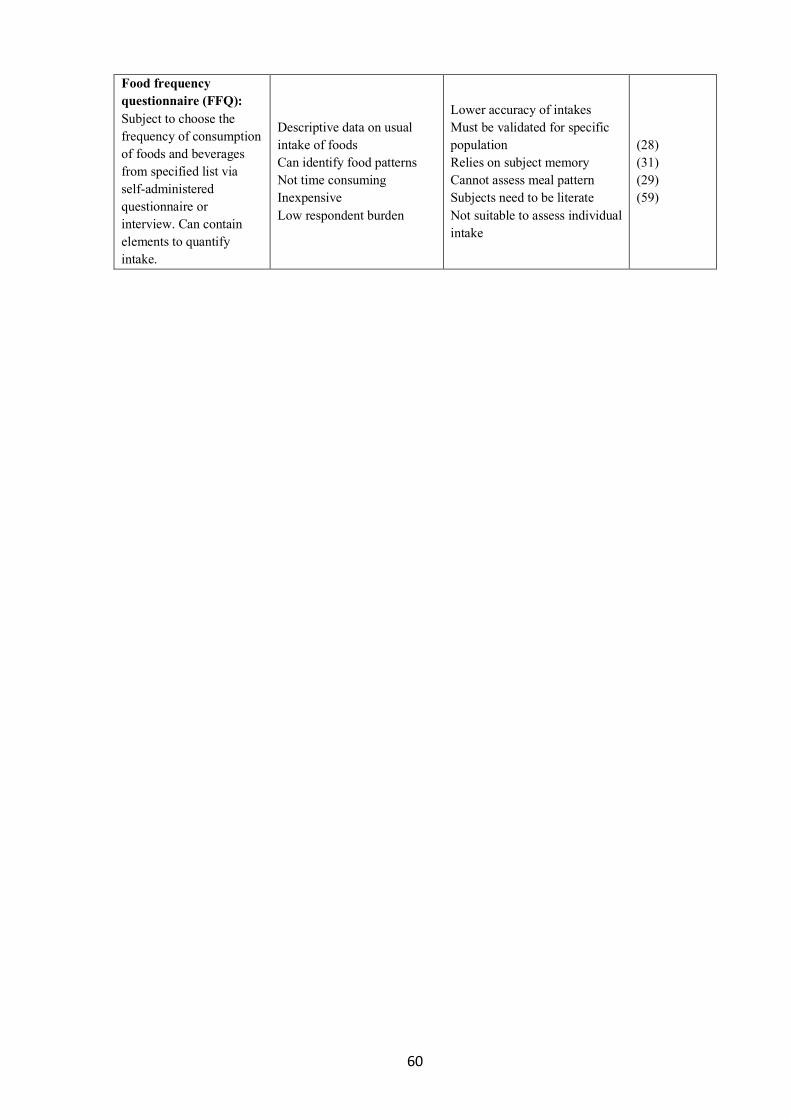
60
Food frequency questionnaire (FFQ): Subject to choose the frequency of consumption of foods and beverages from specified list via self-administered questionnaire or interview. Can contain elements to quantify intake.
Descriptive data on usual intake of foods Can identify food patterns Not time consuming Inexpensive Low respondent burden
Lower accuracy of intakes Must be validated for specific population Relies on subject memory Cannot assess meal pattern Subjects need to be literate Not suitable to assess individual intake
(28) (31) (29) (59)
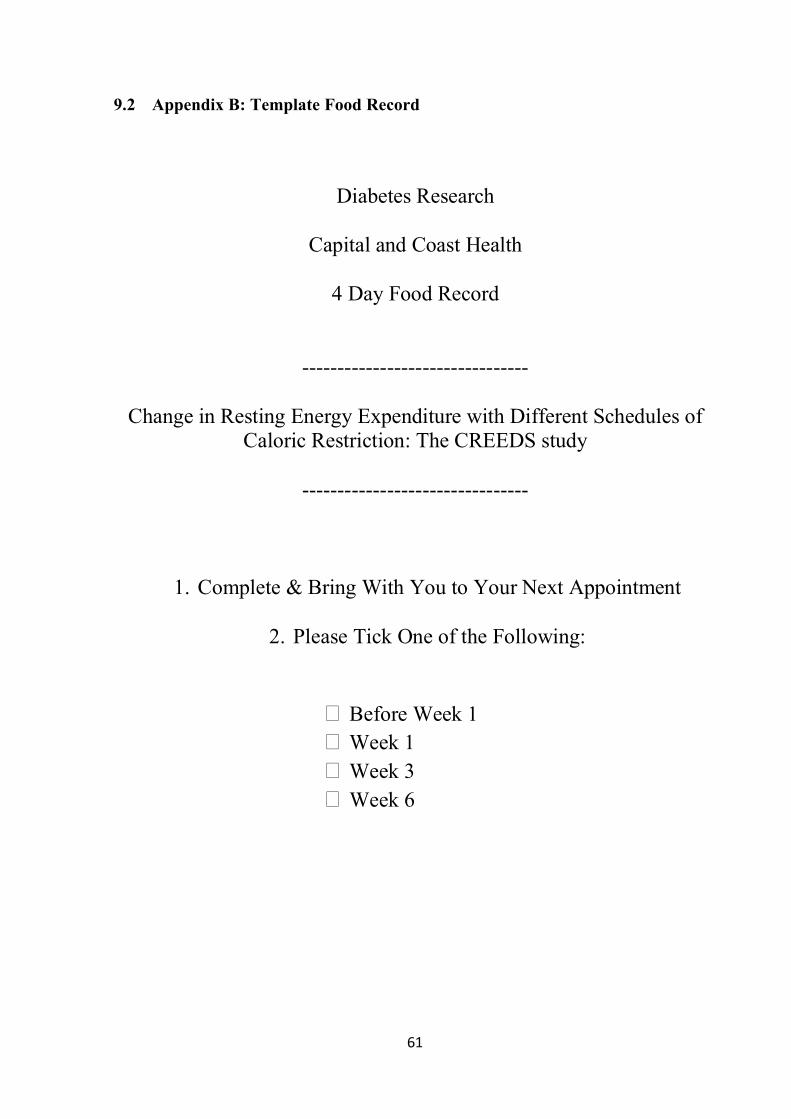
61
9.2 Appendix B: Template Food Record
Diabetes Research
Capital and Coast Health
4 Day Food Record
--------------------------------
Change in Resting Energy Expenditure with Different Schedules of Caloric Restriction: The CREEDS study
--------------------------------
1. Complete & Bring With You to Your Next Appointment
2. Please Tick One of the Following:
� Before Week 1 � Week 1 � Week 3 � Week 6
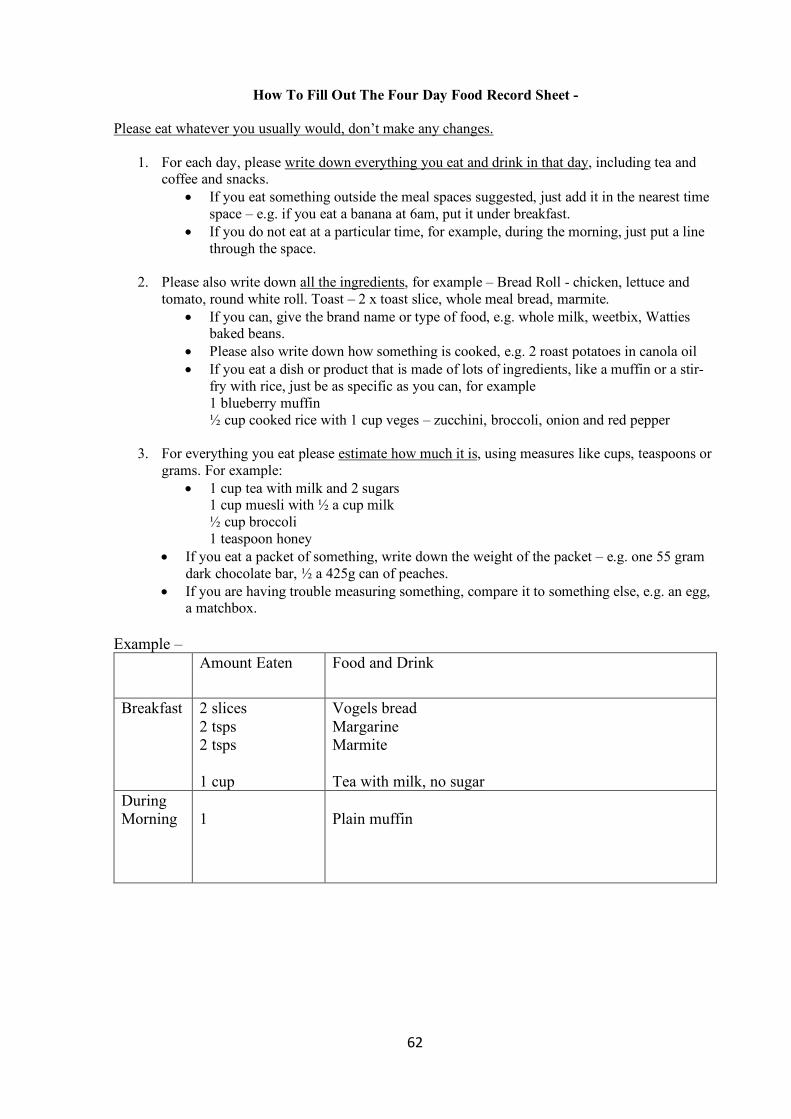
62
How To Fill Out The Four Day Food Record Sheet - Please eat whatever you usually would, don’t make any changes.
1. For each day, please write down everything you eat and drink in that day, including tea and coffee and snacks.
• If you eat something outside the meal spaces suggested, just add it in the nearest time space – e.g. if you eat a banana at 6am, put it under breakfast.
• If you do not eat at a particular time, for example, during the morning, just put a line through the space.
2. Please also write down all the ingredients, for example – Bread Roll - chicken, lettuce and
tomato, round white roll. Toast – 2 x toast slice, whole meal bread, marmite. • If you can, give the brand name or type of food, e.g. whole milk, weetbix, Watties
baked beans. • Please also write down how something is cooked, e.g. 2 roast potatoes in canola oil • If you eat a dish or product that is made of lots of ingredients, like a muffin or a stir-
fry with rice, just be as specific as you can, for example 1 blueberry muffin ½ cup cooked rice with 1 cup veges – zucchini, broccoli, onion and red pepper
3. For everything you eat please estimate how much it is, using measures like cups, teaspoons or grams. For example:
• 1 cup tea with milk and 2 sugars 1 cup muesli with ½ a cup milk ½ cup broccoli 1 teaspoon honey
• If you eat a packet of something, write down the weight of the packet – e.g. one 55 gram dark chocolate bar, ½ a 425g can of peaches.
• If you are having trouble measuring something, compare it to something else, e.g. an egg, a matchbox.
Example –
Amount Eaten Food and Drink
Breakfast 2 slices 2 tsps 2 tsps 1 cup
Vogels bread Margarine Marmite Tea with milk, no sugar
During Morning
1
Plain muffin

63
Day One: Mon / Tues / Wed / Thur / Fri / Sat / Sun (please circle)
Amount Eaten Food and Drink
Breakfast
During Morning
Lunch
During Afternoon
Dinner
Dessert
During Evening

64
Day Two: Mon / Tues / Wed / Thur / Fri / Sat / Sun (please circle)
Amount Eaten Food and Drink
Breakfast
During Morning
Lunch
During Afternoon
Dinner
Dessert
During Evening

65
Day Three: Mon / Tues / Wed / Thur / Fri / Sat / Sun (please circle)
Amount Eaten Food and Drink
Breakfast
During Morning
Lunch
During Afternoon
Dinner
Dessert
During Evening

66
Day Four: Mon / Tues / Wed / Thur / Fri / Sat / Sun (please circle)
Amount Eaten Food and Drink
Breakfast
During Morning
Lunch
During Afternoon
Dinner
Dessert
During Evening
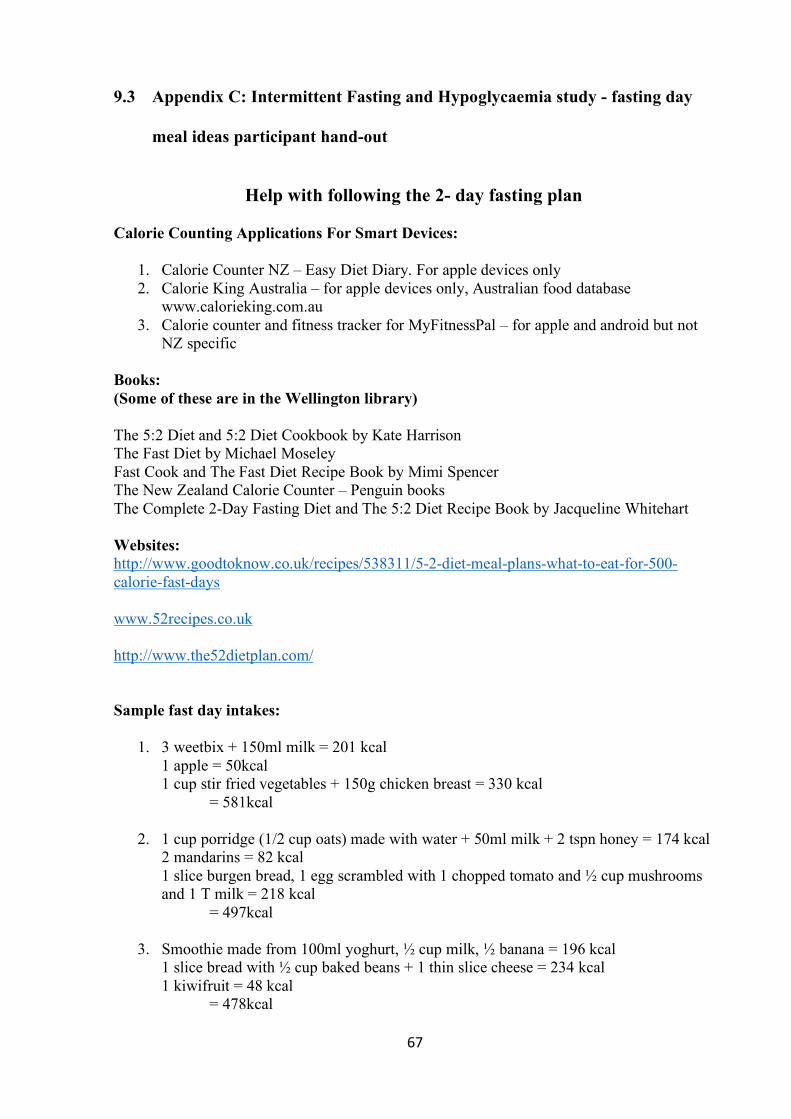
67
9.3 Appendix C: Intermittent Fasting and Hypoglycaemia study - fasting day
meal ideas participant hand-out
Help with following the 2- day fasting plan
Calorie Counting Applications For Smart Devices:
1. Calorie Counter NZ – Easy Diet Diary. For apple devices only 2. Calorie King Australia – for apple devices only, Australian food database
www.calorieking.com.au 3. Calorie counter and fitness tracker for MyFitnessPal – for apple and android but not
NZ specific Books: (Some of these are in the Wellington library) The 5:2 Diet and 5:2 Diet Cookbook by Kate Harrison The Fast Diet by Michael Moseley Fast Cook and The Fast Diet Recipe Book by Mimi Spencer The New Zealand Calorie Counter – Penguin books The Complete 2-Day Fasting Diet and The 5:2 Diet Recipe Book by Jacqueline Whitehart Websites: http://www.goodtoknow.co.uk/recipes/538311/5-2-diet-meal-plans-what-to-eat-for-500-calorie-fast-days www.52recipes.co.uk http://www.the52dietplan.com/ Sample fast day intakes:
1. 3 weetbix + 150ml milk = 201 kcal 1 apple = 50kcal 1 cup stir fried vegetables + 150g chicken breast = 330 kcal = 581kcal
2. 1 cup porridge (1/2 cup oats) made with water + 50ml milk + 2 tspn honey = 174 kcal
2 mandarins = 82 kcal 1 slice burgen bread, 1 egg scrambled with 1 chopped tomato and ½ cup mushrooms and 1 T milk = 218 kcal = 497kcal
3. Smoothie made from 100ml yoghurt, ½ cup milk, ½ banana = 196 kcal
1 slice bread with ½ cup baked beans + 1 thin slice cheese = 234 kcal 1 kiwifruit = 48 kcal = 478kcal
68
4. 2 egg omelette with 1 tablespoon grated cheese, ¼ diced onion and 5 cherry tomatoes = 216kcal 1 orange = 51kcal 1 small tin lite tuna + ½ cup cooked rice + ½ cup cooked frozen vegetables = 235kcal = 502kcal
5. 100g steak + coleslaw (1/2 cup cabbage, 1 tb carrot, 1 tsp oil, 2 tsp vinegar) = 222kcal
1 pear = 53 kcal 2 slices bread, 2 tsp marmite, 2 tsp jam = 229kcal = 504 kcal
6. Pita bread pizza – 1 small pita bread + 2 tsp tomato paste + 50g ham + 2 slices tinned pineapple = 237 kcal Bobby banana = 133 kcal 5 cashew nuts, 5 dried apricots, 1 dessertspoon sunflower seeds = 155 =525kcal
7. 1 slice multigrain bread (sandwich size) 74 kcal 20 g Pams hummus = 45 kcal Watties condensed tomato soup – 1 tin made with water= 105 kcal 1 slice whole grain bread (sandwich size) = 74 kcal 1 cup chopped red pepper = 39 kcal 100g ham steak grilled = 105 kcal 1 cup blueberries = 60 kcal =502 kcal
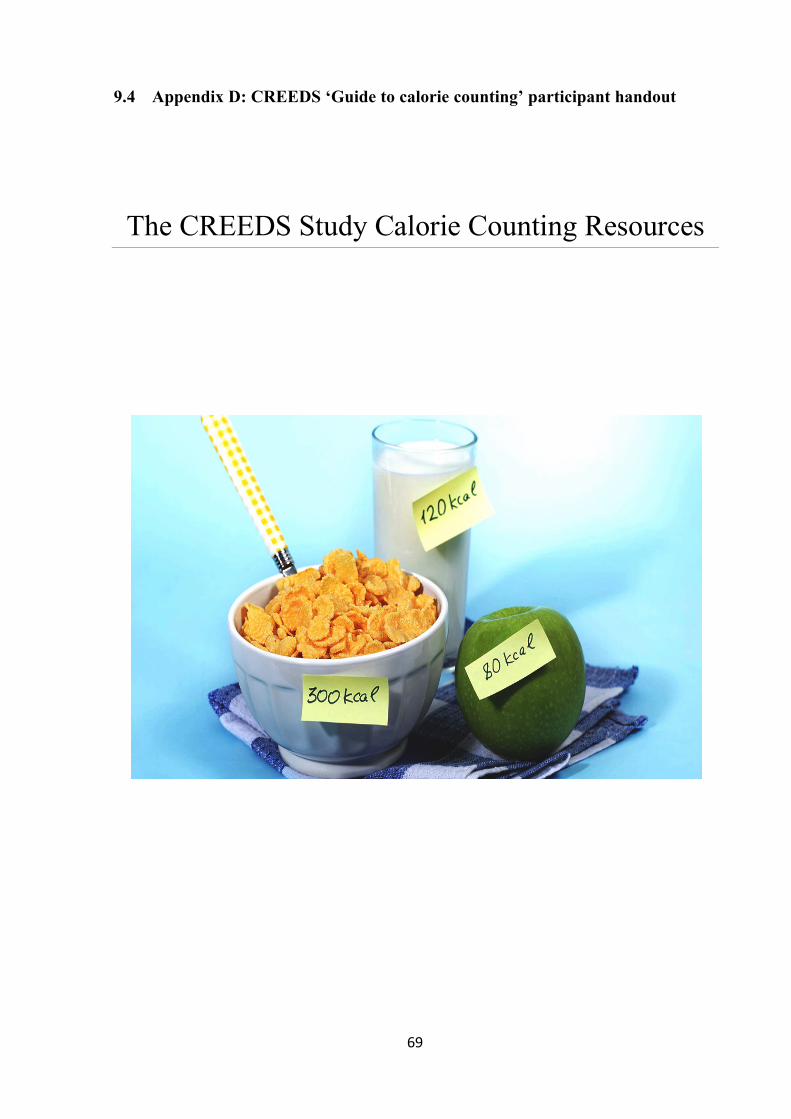
69
9.4 Appendix D: CREEDS ‘Guide to calorie counting’ participant handout
The CREEDS Study Calorie Counting Resources
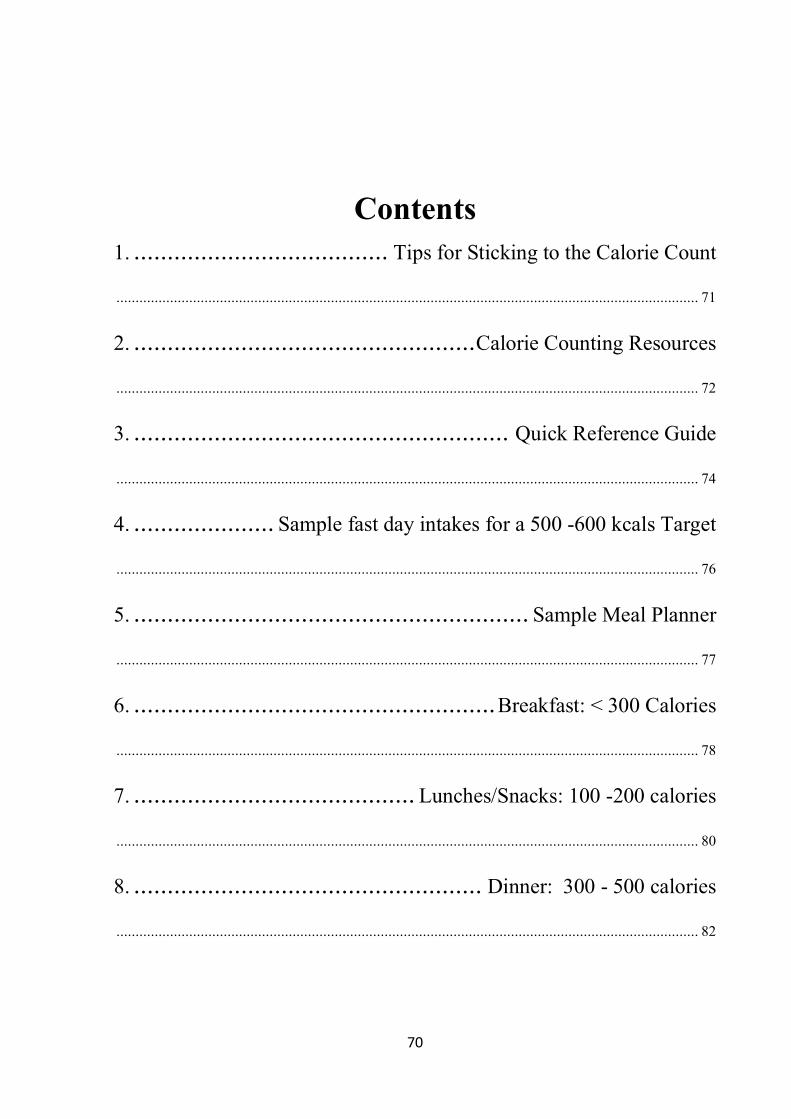
70
Contents 1. ...................................... Tips for Sticking to the Calorie Count
........................................................................................................................................................ 71
2. ................................................... Calorie Counting Resources
........................................................................................................................................................ 72
3. ........................................................ Quick Reference Guide
........................................................................................................................................................ 74
4. ..................... Sample fast day intakes for a 500 -600 kcals Target
........................................................................................................................................................ 76
5. ........................................................... Sample Meal Planner
........................................................................................................................................................ 77
6. ...................................................... Breakfast: < 300 Calories
........................................................................................................................................................ 78
7. .......................................... Lunches/Snacks: 100 -200 calories
........................................................................................................................................................ 80
8. .................................................... Dinner: 300 - 500 calories
........................................................................................................................................................ 82
71
1. Tips for Sticking to the Calorie Count - Keep the range of meals simple and easy to prepare.
- Make a daily reminder.
- Prepare Lunches and Meals in Bulk and Refrigerate/Freeze them where possible.
- Weigh your meal to count easier or check your suvimax portion guide to have an idea of portion size.
- Take care to watch the portion size, divide the portions evenly as per the recipe portion guide.
- Black Coffee, herbal tea & water are all calorie free.
- Watch out for low fat but high sugar alternatives e.g. yoghurts, ice cream etc.
- Protein such as nuts & eggs, vegetables and whole grains can increase your feeling of fullness after a
meal.
- It is easiest to plan your meals at the start of the week and ensure all of your ingredients are in the house for when you need them.
- Anticipated hunger between meals and plan to have a snack available which contains fruit and plain yoghurt or whole bread and one slice of cheese.
- Try not to skip meals and eat slowly to avoid snacking.
- Drink 2L water a day.
- Do not forget how you cooked your meal (boiled, fried…) and add fat or oil to your calorie counting if used in cooking.
- Do not forget to specify if you used milk or sugar in your hot drink.
- Replace butter with margarine and vegetable oil.
- Schedule your meal preparation time once or twice per week.
- It is easier to fast with two. If you have a partner or friend who wants to participate get them to join in, they can attend for a weigh-in at 3 weeks and 6 weeks.
v Measuring Energy in Calories
1. A calorie is also known as a Kilocalorie or Cal or kcal. They are interchangeable. 2. Kilojoules (kJ) are also used to measure energy but it is not the same as a calorie. 3. To convert from Kilojoules to Kilocalories:
Multiply by 0.239 or Divide by 4 E.g. 100 kilojoules is 23.9 calories, 500 kilojoules is 125 calories
v Eating out at Restaurants:
1. Restaurant food is very hard to estimate unless it’s plain or unless the calorie count is listed (e.g. Subway & Pitta Pit).
2. The calorie king website contains some Australian and NZ restaurant outlets. 3. The website of restaurant chains such as Domino’s will contain some of this information too. 4. If you know what you usually order check before you go. 5. Watch the portion sizes in a restaurant when estimating calories.
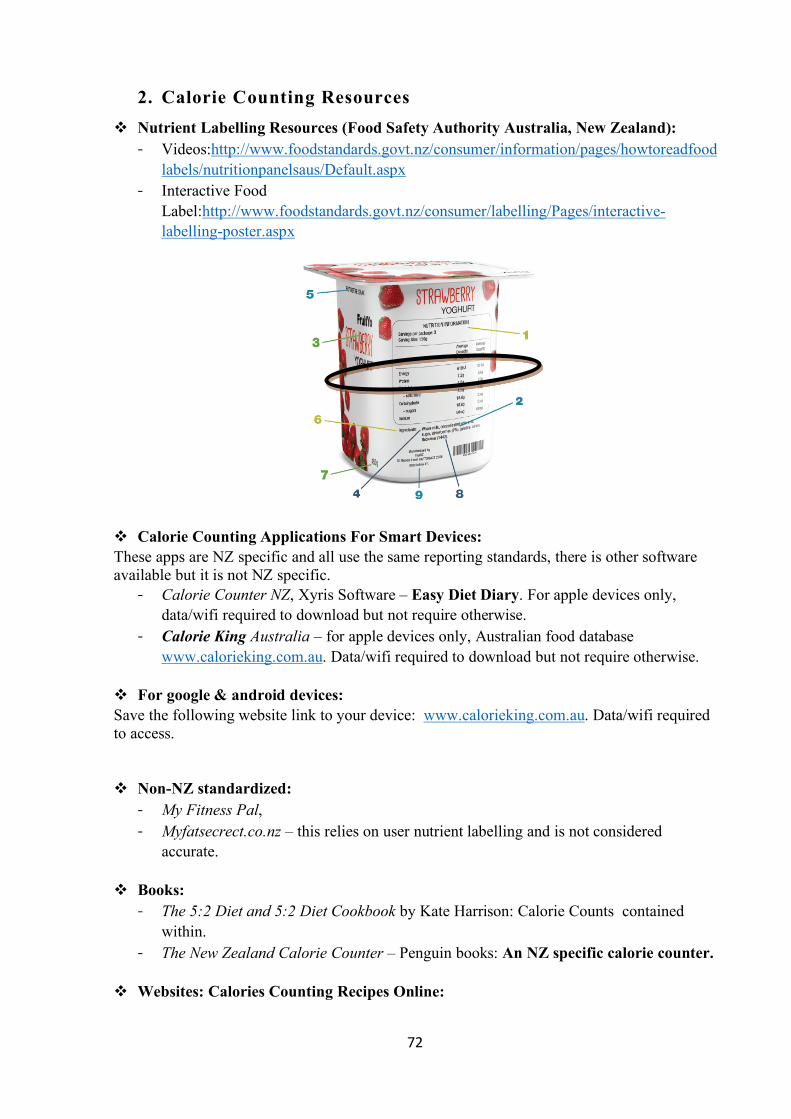
72
2. Calorie Counting Resources v Nutrient Labelling Resources (Food Safety Authority Australia, New Zealand): - Videos:http://www.foodstandards.govt.nz/consumer/information/pages/howtoreadfood
labels/nutritionpanelsaus/Default.aspx - Interactive Food
Label:http://www.foodstandards.govt.nz/consumer/labelling/Pages/interactive-labelling-poster.aspx
v Calorie Counting Applications For Smart Devices: These apps are NZ specific and all use the same reporting standards, there is other software available but it is not NZ specific. - Calorie Counter NZ, Xyris Software – Easy Diet Diary. For apple devices only,
data/wifi required to download but not require otherwise. - Calorie King Australia – for apple devices only, Australian food database
www.calorieking.com.au. Data/wifi required to download but not require otherwise. v For google & android devices: Save the following website link to your device: www.calorieking.com.au. Data/wifi required to access. v Non-NZ standardized: - My Fitness Pal, - Myfatsecrect.co.nz – this relies on user nutrient labelling and is not considered
accurate.
v Books: - The 5:2 Diet and 5:2 Diet Cookbook by Kate Harrison: Calorie Counts contained
within. - The New Zealand Calorie Counter – Penguin books: An NZ specific calorie counter.
v Websites: Calories Counting Recipes Online:

73
- http://www.goodtoknow.co.uk/recipes/538311/5-2-diet-meal-plans-what-to-eat-for-500-calorie-fast-days
- https://www.bbcgoodfood.com/recipes/category/healthy - www.allrecipes.com
- www.calorieking.com.au

74
3. Quick Reference Guide This is for a quick estimate only. Where possible, check using the calorie king app or website as these are more accurate.
Food Weight Quantity Calories Bread White – Med Slice 29g 1 slice 69 White – Thick Slice 37g 1 slice 91 Multigrain Light Bread 37g 1 slice 89 Long White Roll 77g 1 roll (medium) 203 Muffin – sweet with fruit 124g 1 314 Cream Crackers 9g 1 39 Filled Ham Roll 100g 1 288 Bagel 74g 1 167 Croissant 75g 1 large 300 Focaccia 50g 1/8 loaf 127 Spreads Marmite 7g 1 tsp 11 Butter, Margarine 5g 1 tsp 37 Canola Oil 14g 1 tbsp 125 Peanut Butter 13g 1 tbsp 75 Honey 21g 1 tbsp 67 Jam – Berryfruit 16g 1 tbsp 44 Cereals Porridge 260g 1 cup 127 Cornflakes 31g 1 cup 108 Ricies 27g 1 cup 101 Weetbix 17g 1 biscuit 53 Muesli natural 107g 1 cup 320 Muesli toasted, sweetened 110g 1 cup 443 All-Bran 60g 1 cup 161 Pasta & Rice Rice, white, boiled 144g 1 cup 23 Soaghetti (canned in sauce) 268g 1 cup 161 Baked Beans 283g 1 cup 241 Pasta (Cooked) 148g 1 cup 179 Soup Canned Soup 255g 1 cup 125 Chicken Noodle Soup 275g 1 cup 50 Gravy (homemade) 260g 1cup 257 Vegetables Potato mashed with butter & milk
209g 1 cup 199
Pumpkin, baked 217g 1 cup 100 Broccoli 164g 1 cup 44 Fruits Raw-apple 130g 1 64 Dried-aprocots 35g 10 halves 77 Peaches in canned syrup, drained
208g 1 cup 114
Drinks Milk – standard 258g 1 cup 160 Calcitrim Milk 258g 1 cup 139 Lite Blue Milk 260g 1 cup 153 Just Juice 262g 1 cup 115 Cordial 19g 1 tbsp 23
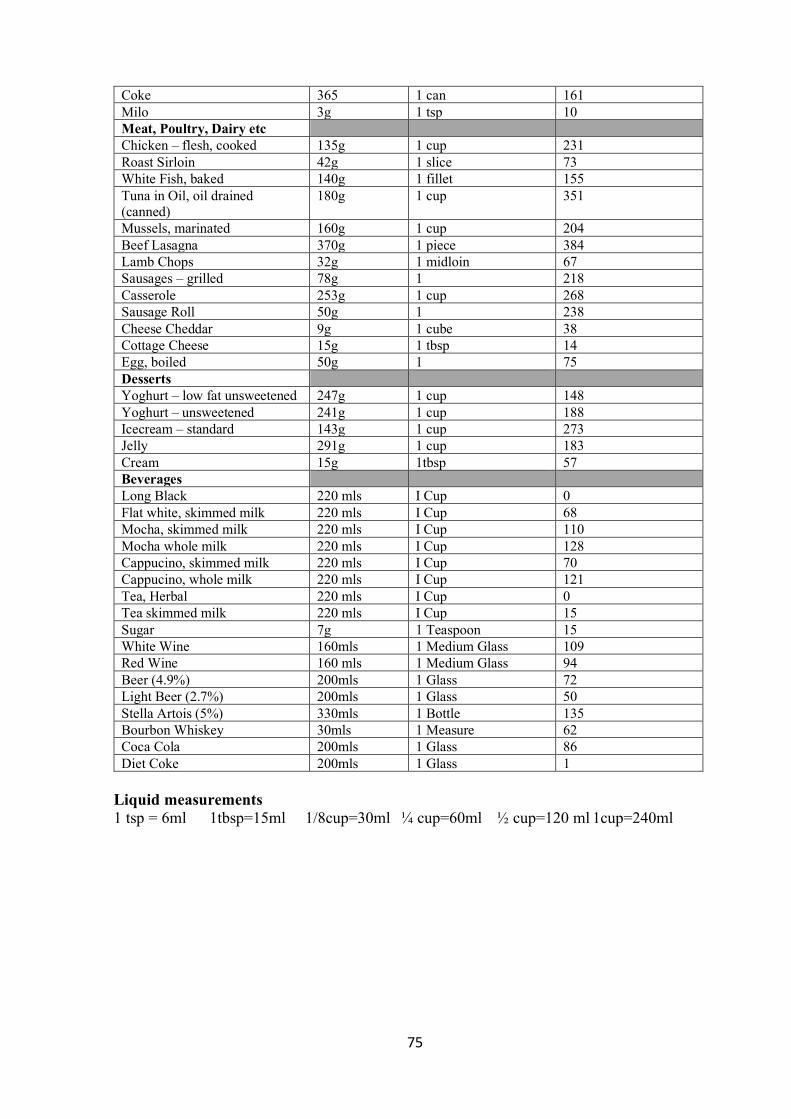
75
Coke 365 1 can 161 Milo 3g 1 tsp 10 Meat, Poultry, Dairy etc Chicken – flesh, cooked 135g 1 cup 231 Roast Sirloin 42g 1 slice 73 White Fish, baked 140g 1 fillet 155 Tuna in Oil, oil drained (canned)
180g 1 cup 351
Mussels, marinated 160g 1 cup 204 Beef Lasagna 370g 1 piece 384 Lamb Chops 32g 1 midloin 67 Sausages – grilled 78g 1 218 Casserole 253g 1 cup 268 Sausage Roll 50g 1 238 Cheese Cheddar 9g 1 cube 38 Cottage Cheese 15g 1 tbsp 14 Egg, boiled 50g 1 75 Desserts Yoghurt – low fat unsweetened 247g 1 cup 148 Yoghurt – unsweetened 241g 1 cup 188 Icecream – standard 143g 1 cup 273 Jelly 291g 1 cup 183 Cream 15g 1tbsp 57 Beverages Long Black 220 mls I Cup 0 Flat white, skimmed milk 220 mls I Cup 68 Mocha, skimmed milk 220 mls I Cup 110 Mocha whole milk 220 mls I Cup 128 Cappucino, skimmed milk 220 mls I Cup 70 Cappucino, whole milk 220 mls I Cup 121 Tea, Herbal 220 mls I Cup 0 Tea skimmed milk 220 mls I Cup 15 Sugar 7g 1 Teaspoon 15 White Wine 160mls 1 Medium Glass 109 Red Wine 160 mls 1 Medium Glass 94 Beer (4.9%) 200mls 1 Glass 72 Light Beer (2.7%) 200mls 1 Glass 50 Stella Artois (5%) 330mls 1 Bottle 135 Bourbon Whiskey 30mls 1 Measure 62 Coca Cola 200mls 1 Glass 86 Diet Coke 200mls 1 Glass 1
Liquid measurements 1 tsp = 6ml 1tbsp=15ml 1/8cup=30ml ¼ cup=60ml ½ cup=120 ml 1cup=240ml
76
4. Sample fast day intakes for a 500 -600 kcals Target Each sample is structured as Light Breakfast, a Main Meal and a Small snack (e.g. fruit)
1. 3 weetbix + 150ml milk = 201 kcal
1 apple = 50kcal 1 cup stir fried vegetables + 150g chicken breast = 330 kcal = 581kcal
2. 1 cup porridge (1/2 cup oats) made with water + 50ml milk + 2 tspn honey = 174 kcal
2 mandarins = 82 kcal 1 slice burgen bread, 1 egg scrambled with 1 chopped tomato and ½ cup mushrooms and 1 T milk = 218 kcal = 497kcal
3. Smoothie made from 100ml yoghurt, ½ cup milk, ½ banana = 196 kcal
1 slice bread with ½ cup baked beans + 1 thin slice cheese = 234 kcal 1 kiwifruit = 48 kcal = 478kcal
4. 2 egg omelette with 1 tablespoon grated cheese, ¼ diced onion and 5 cherry tomatoes = 216kcal 1 orange = 51kcal 1 small tin lite tuna + ½ cup cooked rice + ½ cup cooked frozen vegetables = 235kcal = 502kcal
5. 100g steak + coleslaw (1/2 cup cabbage, 1 tb carrot, 1 tsp oil, 2 tsp vinegar) = 222kcal
1 pear = 53 kcal 2 slices bread, 2 tsp marmite, 2 tsp jam = 229kcal = 504 kcal
6. Pita bread pizza – 1 small pita bread + 2 tsp tomato paste + 50g ham + 2 slices tinned pineapple = 237 kcal Bobby banana (small) = 133 kcal 5 cashew nuts, 5 dried apricots, 1 dessertspoon sunflower seeds = 155 =525kcal
7. 1 slice multigrain bread (sandwich size) 74 kcal 20 g Pams hummus = 45 kcal Watties condensed tomato soup – 1 tin made with water= 105 kcal 1 slice whole grain bread (sandwich size) = 74 kcal 1 cup chopped red pepper = 39 kcal 100g ham steak grilled = 105 kcal 1 cup blueberries = 60 kcal =502 kcal
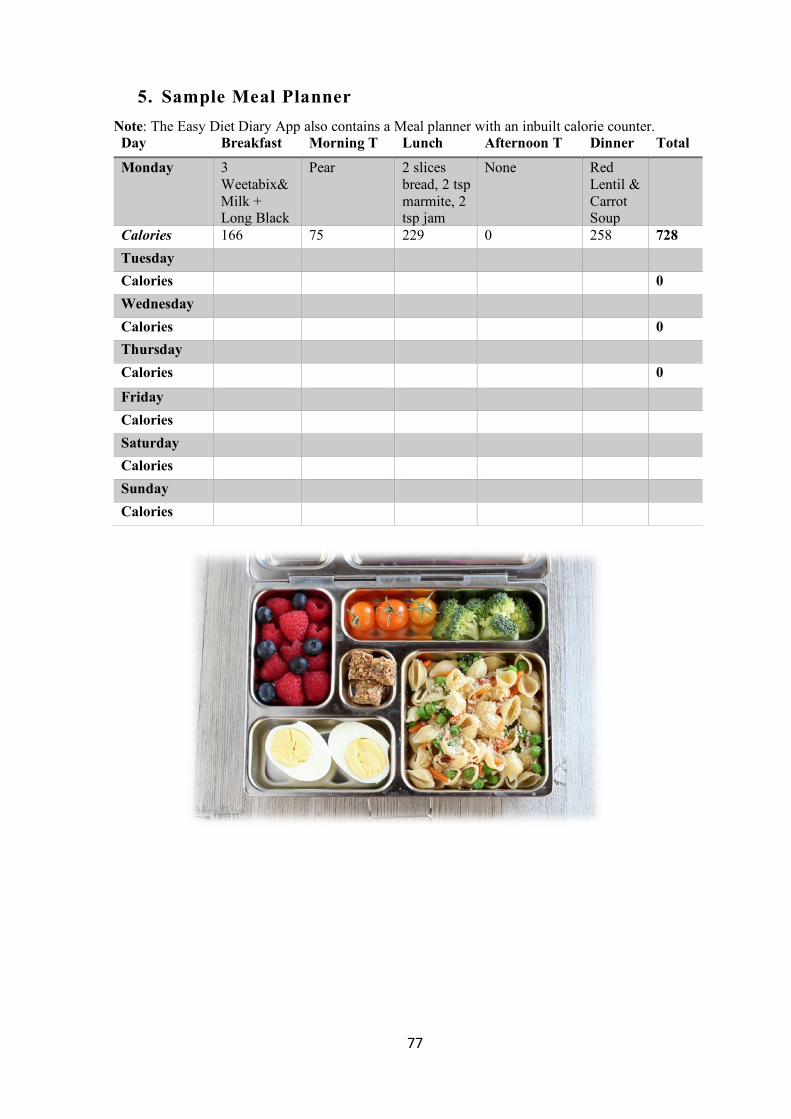
77
5. Sample Meal Planner Note: The Easy Diet Diary App also contains a Meal planner with an inbuilt calorie counter.
Day Breakfast Morning T Lunch Afternoon T Dinner Total
Monday 3 Weetabix& Milk + Long Black
Pear 2 slices bread, 2 tsp marmite, 2 tsp jam
None Red Lentil & Carrot Soup
Calories 166 75 229 0 258 728 Tuesday Calories 0 Wednesday Calories 0 Thursday Calories 0
Friday Calories Saturday Calories Sunday Calories
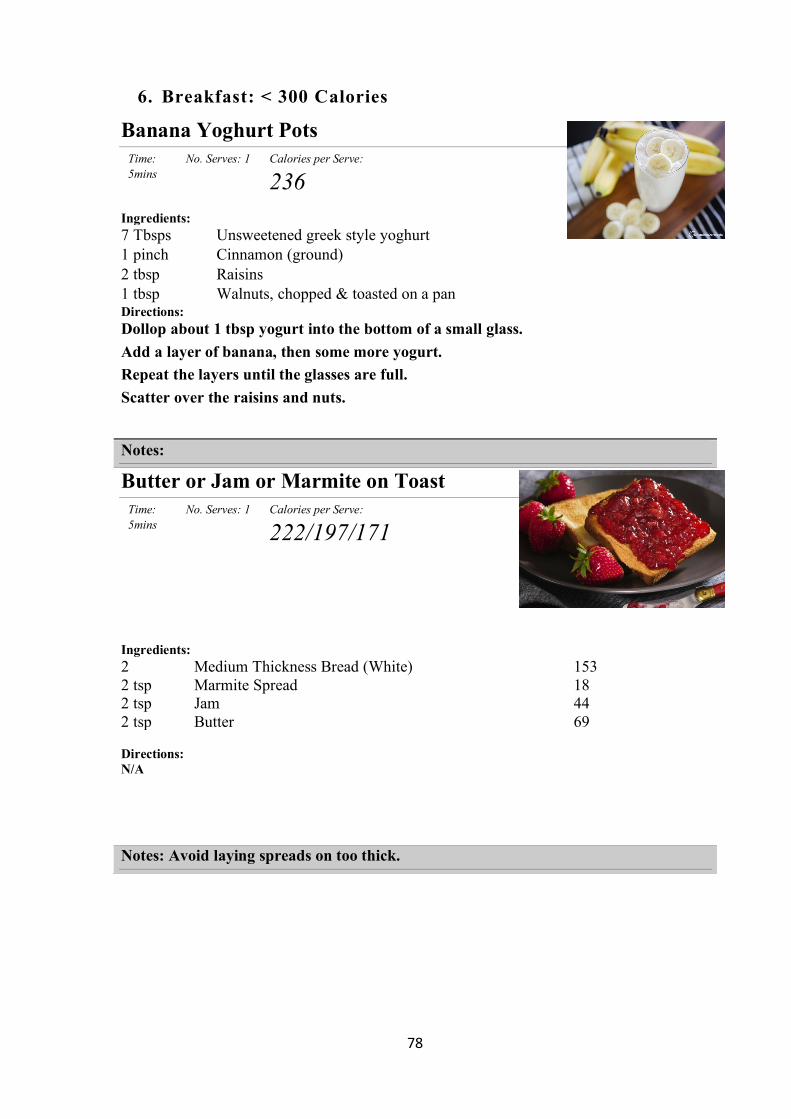
78
6. Breakfast: < 300 Calories
Banana Yoghurt Pots Time: 5mins
No. Serves: 1 Calories per Serve:
236
Ingredients: 7 Tbsps Unsweetened greek style yoghurt 1 pinch Cinnamon (ground) 2 tbsp Raisins 1 tbsp Walnuts, chopped & toasted on a pan Directions: Dollop about 1 tbsp yogurt into the bottom of a small glass. Add a layer of banana, then some more yogurt. Repeat the layers until the glasses are full. Scatter over the raisins and nuts.
Notes: Butter or Jam or Marmite on Toast
Time: 5mins
No. Serves: 1 Calories per Serve:
222/197/171
Ingredients: 2 Medium Thickness Bread (White) 153 2 tsp Marmite Spread 18 2 tsp Jam 44 2 tsp Butter 69 Directions: N/A
Notes: Avoid laying spreads on too thick.
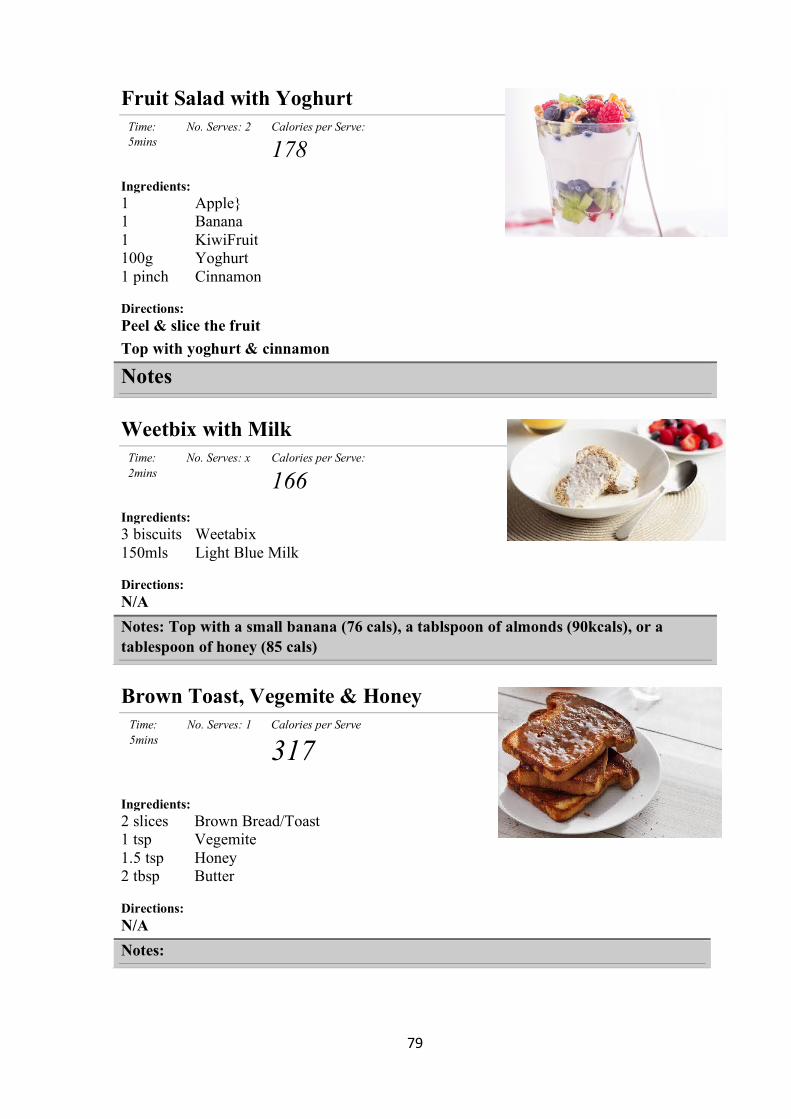
79
Fruit Salad with Yoghurt Time: 5mins
No. Serves: 2 Calories per Serve:
178
Ingredients: 1 Apple} 1 Banana 1 KiwiFruit 100g Yoghurt 1 pinch Cinnamon Directions: Peel & slice the fruit Top with yoghurt & cinnamon
Notes Weetbix with Milk
Time: 2mins
No. Serves: x Calories per Serve:
166
Ingredients: 3 biscuits Weetabix 150mls Light Blue Milk Directions: N/A
Notes: Top with a small banana (76 cals), a tablspoon of almonds (90kcals), or a tablespoon of honey (85 cals)
Brown Toast, Vegemite & Honey
Time: 5mins
No. Serves: 1 Calories per Serve
317
Ingredients: 2 slices Brown Bread/Toast 1 tsp Vegemite 1.5 tsp Honey 2 tbsp Butter Directions: N/A
Notes:

80
7. Lunches/Snacks: 100 -200 calories
Ciabatta Roll & Banana Time: _2_mins
No. Serves: 1 Calories per Serve:
333
Ingredients: 1 Ciabatta Roll (80g) 206 1 tsp Margarine (thin spread) 28 1 Banana – Medium (170g with skin) 99
Notes Roasted Broccoli with Lemon & Garlic
Time: 25mins
No. Serves: 6 Calories per Serve:
47
Ingredients: 2 heads Broccoli 2 tsps Extra Virgin Olive Oil 1 tsp Sea Salt ½ tsp Ground black pepper 1 clove Garlic ½ tsp Lemon juice Directions:
1. Preheat the oven to 200 degrees C (400 degrees F). 2. In a large bowl, toss broccoli florets with the extra virgin olive oil, sea salt,
pepper and garlic. Spread the broccoli out in an even layer on a baking sheet. 3. Bake in the preheated oven until florets are tender enough to pierce the stems
with a fork, 15 to 20 minutes. Remove and transfer to a serving platter. Squeeze lemon juice over the broccoli before serving.
Notes
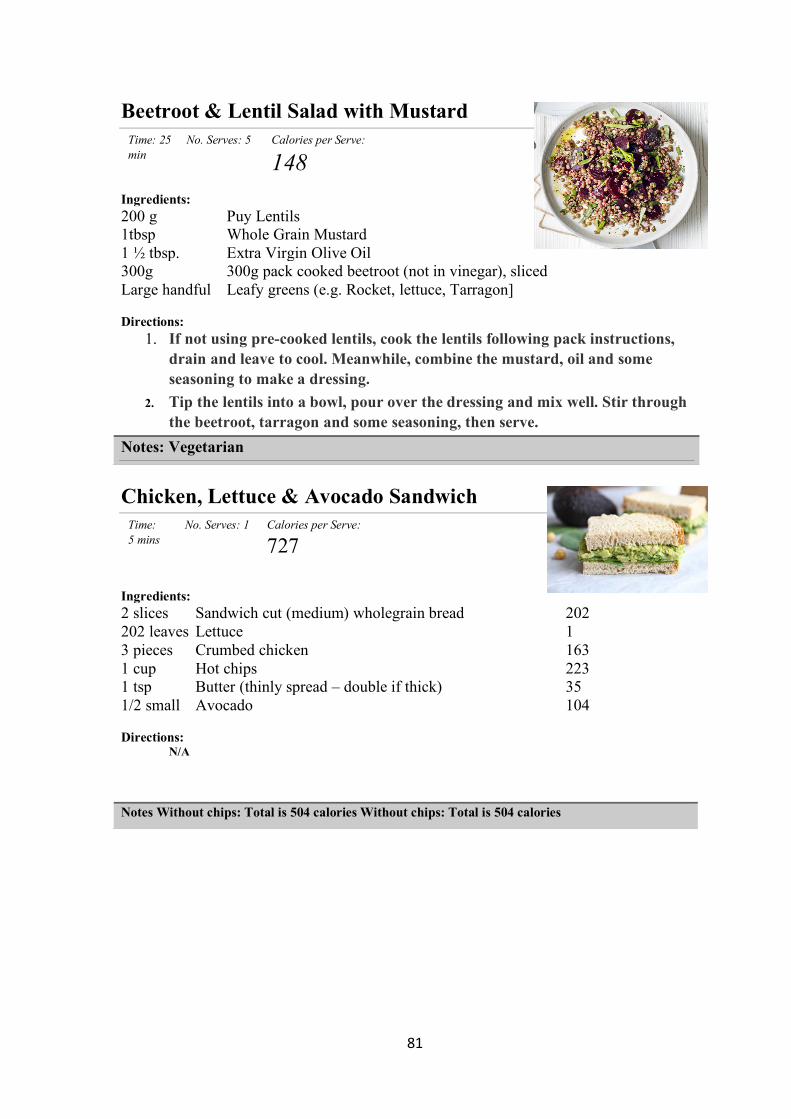
81
Chicken, Lettuce & Avocado Sandwich
Time: 5 mins
No. Serves: 1 Calories per Serve:
727
Ingredients: 2 slices Sandwich cut (medium) wholegrain bread 202 202 leaves Lettuce 1 3 pieces Crumbed chicken 163 1 cup Hot chips 223 1 tsp Butter (thinly spread – double if thick) 35 1/2 small Avocado 104 Directions:
N/A
Notes Without chips: Total is 504 calories Without chips: Total is 504 calories
Beetroot & Lentil Salad with Mustard Time: 25 min
No. Serves: 5 Calories per Serve:
148
Ingredients: 200 g Puy Lentils 1tbsp Whole Grain Mustard 1 ½ tbsp. Extra Virgin Olive Oil 300g 300g pack cooked beetroot (not in vinegar), sliced Large handful Leafy greens (e.g. Rocket, lettuce, Tarragon] Directions:
1. If not using pre-cooked lentils, cook the lentils following pack instructions, drain and leave to cool. Meanwhile, combine the mustard, oil and some seasoning to make a dressing.
2. Tip the lentils into a bowl, pour over the dressing and mix well. Stir through the beetroot, tarragon and some seasoning, then serve.
Notes: Vegetarian
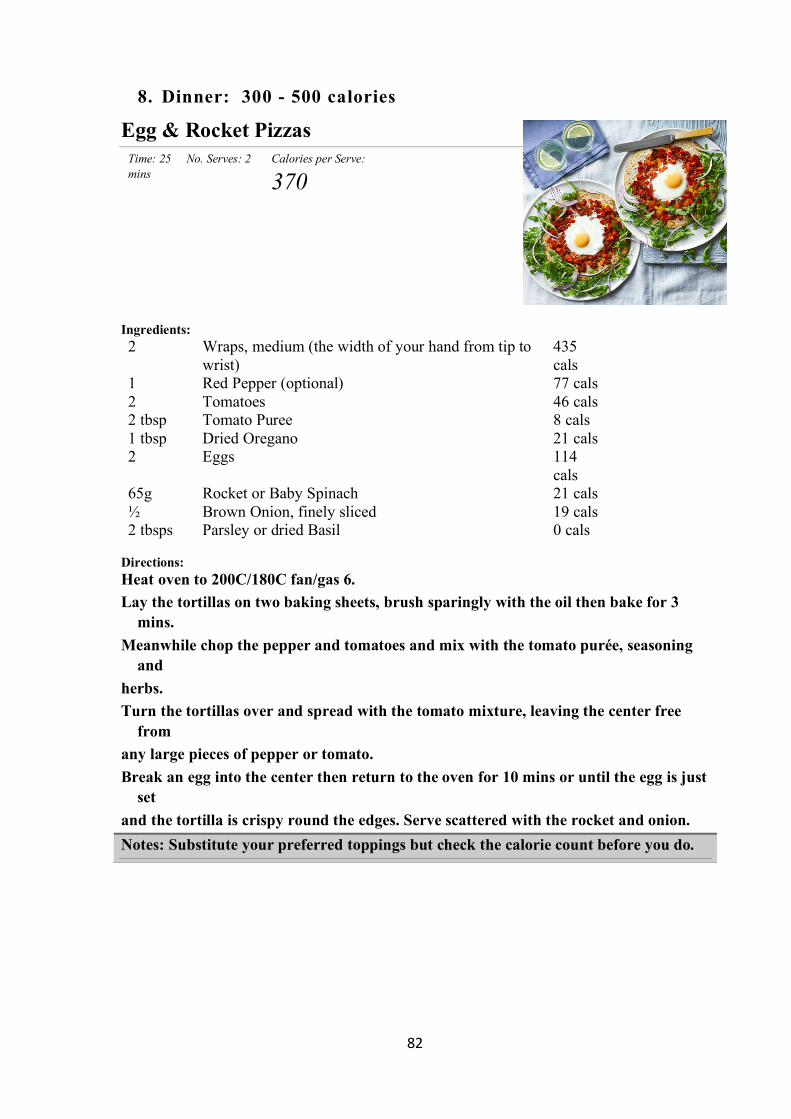
82
8. Dinner: 300 - 500 calories
Egg & Rocket Pizzas Time: 25 mins
No. Serves: 2 Calories per Serve:
370
Ingredients: 2 Wraps, medium (the width of your hand from tip to
wrist) 435 cals
1 Red Pepper (optional) 77 cals 2 Tomatoes 46 cals 2 tbsp Tomato Puree 8 cals 1 tbsp Dried Oregano 21 cals 2 Eggs 114
cals 65g Rocket or Baby Spinach 21 cals ½ Brown Onion, finely sliced 19 cals 2 tbsps Parsley or dried Basil 0 cals
Directions: Heat oven to 200C/180C fan/gas 6. Lay the tortillas on two baking sheets, brush sparingly with the oil then bake for 3
mins. Meanwhile chop the pepper and tomatoes and mix with the tomato purée, seasoning
and herbs. Turn the tortillas over and spread with the tomato mixture, leaving the center free
from any large pieces of pepper or tomato. Break an egg into the center then return to the oven for 10 mins or until the egg is just
set and the tortilla is crispy round the edges. Serve scattered with the rocket and onion. Notes: Substitute your preferred toppings but check the calorie count before you do.
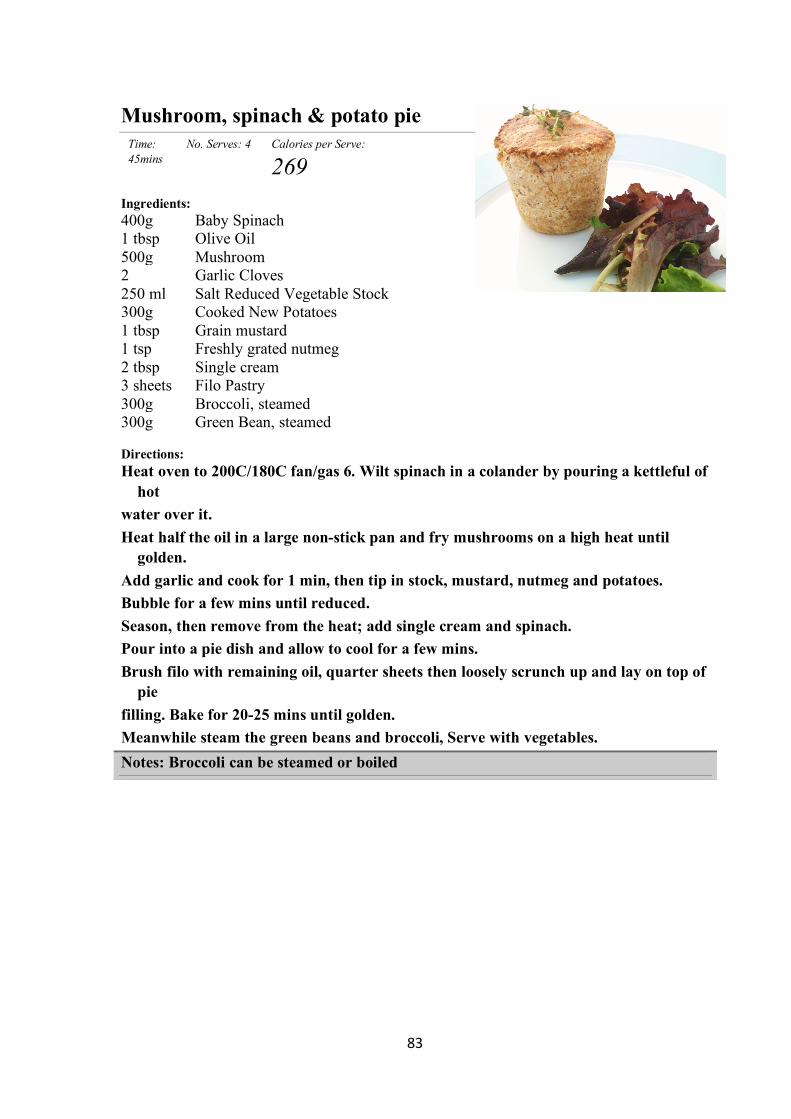
83
Mushroom, spinach & potato pie Time: 45mins
No. Serves: 4 Calories per Serve:
269
Ingredients: 400g Baby Spinach 1 tbsp Olive Oil 500g Mushroom 2 Garlic Cloves 250 ml Salt Reduced Vegetable Stock 300g Cooked New Potatoes 1 tbsp Grain mustard 1 tsp Freshly grated nutmeg 2 tbsp Single cream 3 sheets Filo Pastry 300g Broccoli, steamed 300g Green Bean, steamed Directions: Heat oven to 200C/180C fan/gas 6. Wilt spinach in a colander by pouring a kettleful of
hot water over it. Heat half the oil in a large non-stick pan and fry mushrooms on a high heat until
golden. Add garlic and cook for 1 min, then tip in stock, mustard, nutmeg and potatoes. Bubble for a few mins until reduced. Season, then remove from the heat; add single cream and spinach. Pour into a pie dish and allow to cool for a few mins. Brush filo with remaining oil, quarter sheets then loosely scrunch up and lay on top of
pie filling. Bake for 20-25 mins until golden. Meanwhile steam the green beans and broccoli, Serve with vegetables. Notes: Broccoli can be steamed or boiled
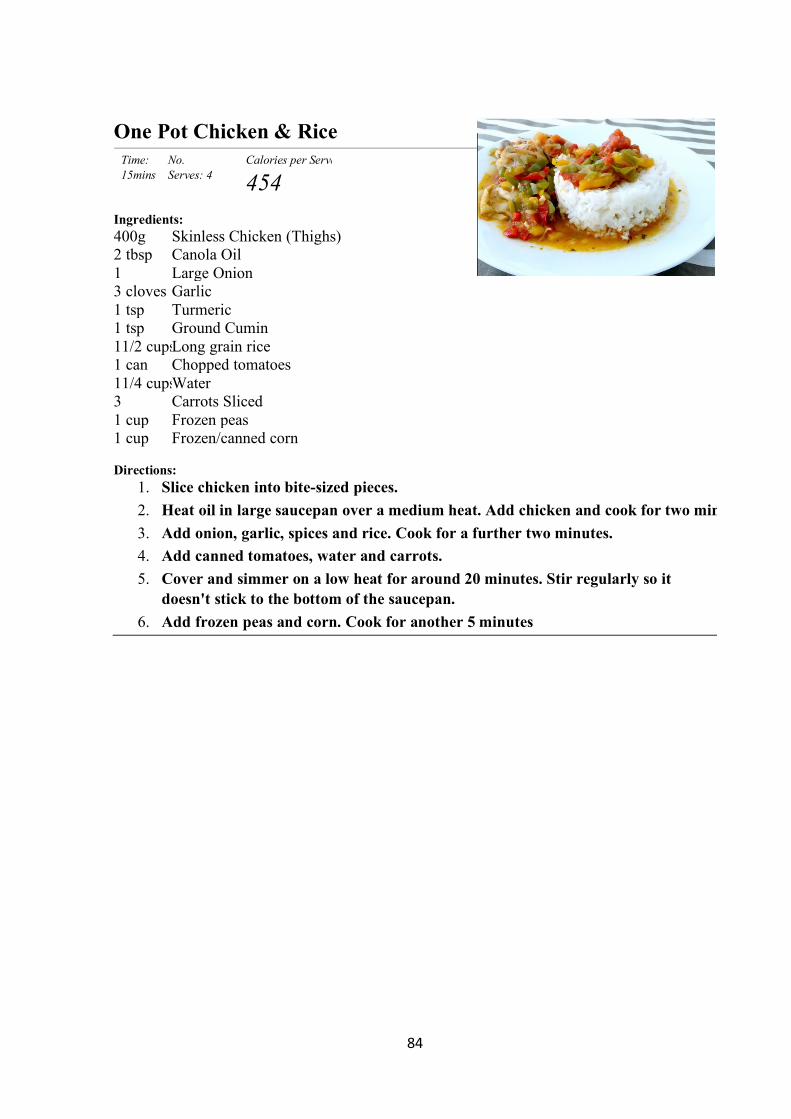
84
One Pot Chicken & Rice Time: 15mins
No. Serves: 4
Calories per Serve:
454
Ingredients: 400g Skinless Chicken (Thighs) 2 tbsp Canola Oil 1 Large Onion 3 cloves Garlic 1 tsp Turmeric 1 tsp Ground Cumin 11/2 cups Long grain rice 1 can Chopped tomatoes 11/4 cups Water 3 Carrots Sliced 1 cup Frozen peas 1 cup Frozen/canned corn Directions:
1. Slice chicken into bite-sized pieces. 2. Heat oil in large saucepan over a medium heat. Add chicken and cook for two minutes. 3. Add onion, garlic, spices and rice. Cook for a further two minutes. 4. Add canned tomatoes, water and carrots. 5. Cover and simmer on a low heat for around 20 minutes. Stir regularly so it
doesn't stick to the bottom of the saucepan. 6. Add frozen peas and corn. Cook for another 5 minutes

85
Pesto Pasta with Chicken
Time: 30mins
No. Serves: 8 Calories per Serve:
328
Ingredients: 440g Bowtie Pasta 1 tsp Olive Oil 2 cloves Garlic 2 Boneless, Skinless Chicken Breasts cut into bite sized pieces 1 tsp Crushed Red Pepper Flakes 1/3 cup Oil-packed sun-dried tomatoes, drained & cut into strips ½ cup Pesto sauce Directions:
1. Bring a large pot of lightly salted water to a boil. Add pasta and cook for 8 to 10 minutes or until al dente; drain.
2. Heat oil in a large skillet over medium heat. Saute garlic until tender, then stir in chicken. Season with red pepper flakes. Cook until chicken is golden, and cooked through.
3. In a large bowl, combine pasta, chicken, sun-dried tomatoes and pesto. Toss to coat evenly.
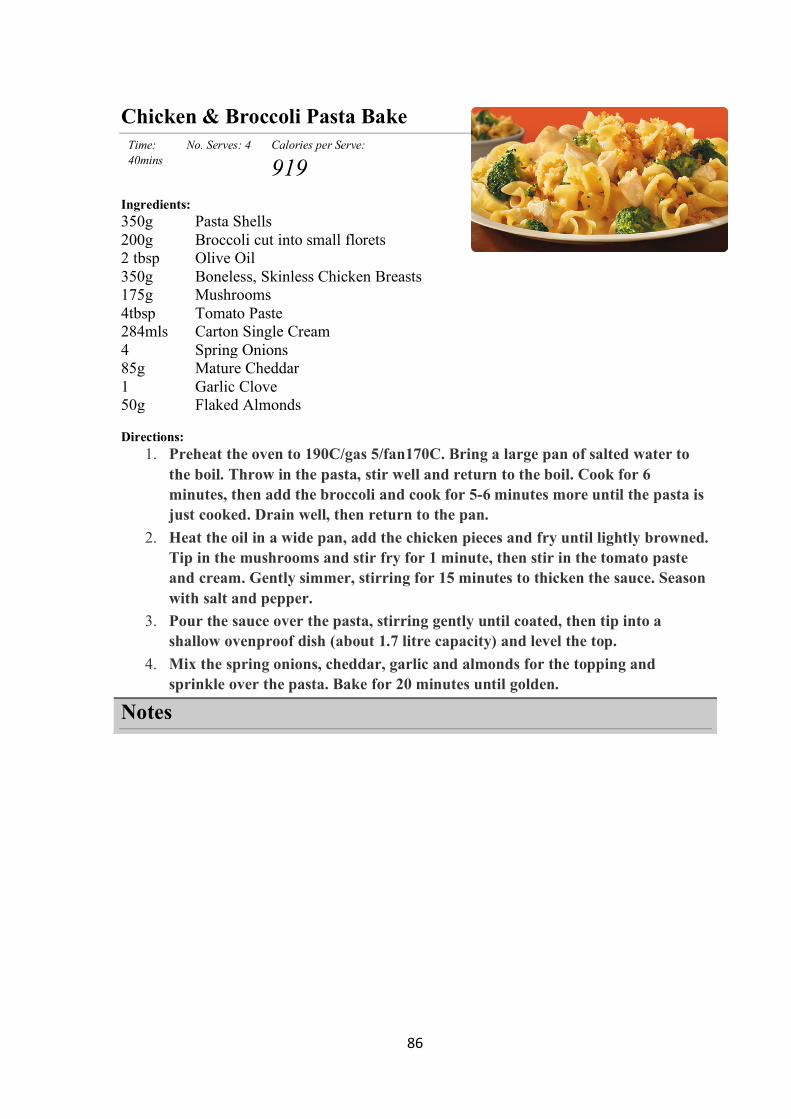
86
Chicken & Broccoli Pasta Bake
Time: 40mins
No. Serves: 4 Calories per Serve:
919
Ingredients: 350g Pasta Shells 200g Broccoli cut into small florets 2 tbsp Olive Oil 350g Boneless, Skinless Chicken Breasts 175g Mushrooms 4tbsp Tomato Paste 284mls Carton Single Cream 4 Spring Onions 85g Mature Cheddar 1 Garlic Clove 50g Flaked Almonds Directions:
1. Preheat the oven to 190C/gas 5/fan170C. Bring a large pan of salted water to the boil. Throw in the pasta, stir well and return to the boil. Cook for 6 minutes, then add the broccoli and cook for 5-6 minutes more until the pasta is just cooked. Drain well, then return to the pan.
2. Heat the oil in a wide pan, add the chicken pieces and fry until lightly browned. Tip in the mushrooms and stir fry for 1 minute, then stir in the tomato paste and cream. Gently simmer, stirring for 15 minutes to thicken the sauce. Season with salt and pepper.
3. Pour the sauce over the pasta, stirring gently until coated, then tip into a shallow ovenproof dish (about 1.7 litre capacity) and level the top.
4. Mix the spring onions, cheddar, garlic and almonds for the topping and sprinkle over the pasta. Bake for 20 minutes until golden.
Notes

87
Red Lentil & Carrot Soup Time: 25mins
No. Serves: 2 Calories per Serve:
258
Ingredients: 1 Onion 2 tsp Olive Oil 3 Garlic Cloves 2 Carrots 85g Red Lentils 1 Salt Reduced Vegetable Stock Cube 1 Sprig Parsley Directions:
1. Put the kettle on to boil while you finely slice the onion. 2. Heat the oil in a medium pan, add the onion and fry for 2 mins while you slice
the garlic and dice the carrots. Add them to the pan, and cook briefly over the heat.
3. Pour in 1 litre of the boiling water from the kettle, stir in the lentils and stock cube, then cover the pan and cook over a medium heat for 15 mins until the lentils are tender.
4. Take off the heat and stir in the parsley. Ladle into bowls, and scatter with extra parsley leaves, if you like
Notes: Parsley is optional and can be replaced with any Pepper, Chili etc
Indian Chickpea & Vegetable Soup Time: 25 mins
No. Serves: 4 Calories per
Serve:200
Ingredients: 1 tbsp Vegetable Oil 122 1 large Onion 48 1 tsp Finely grated fresh ginger 2 1tbsp Garam masala 25 850mls Low Salt vegetable stock 37 2 large Carrots, quartered lengthways and chopped 109 400g can Chickpea drained 425 100g Green Beans, chopped 31 Directions: Heat the oil in a medium saucepan, then add the onion, ginger and garlic. Fry for 2 mins, then add the garam masala, give it 1 min more, then add the stock and
carrots. Simmer for 10 mins, then add the chickpeas. Use a stick blender to whizz the soup a
little. Stir in the beans and simmer for 3 mins. Pack into a flask or, if you’ve got a microwave at work, chill and heat up for lunch. Great with naan bread.

88

89
9.5 Appendix E: Diet entry protocol
Data entry protocol:
Training of participants to fill out food records:
• Write down everything as accurately as possible – especially packet foods, restaurant
meals and include drinks + snacks
• Include all ingredients if possible e.g stir fry; 1c rice, 1c vegetables – carrot, broccoli,
cauliflower, red onion
• Brand names/descriptions – vogel’s, wholegrain bread, calcitrim milk
• Best estimates of measures using cup and spoon measures
• Use weights – either weigh foods if possible, or use package weights or estimate if
confident or compare to something else e.g. an egg, a matchbox
• Take pictures of meal and/or package of food
What was reviewed by research team when participants handed in diet records;
• Completeness of entry – is there was enough information to enter into the database and
checking restaurant meals are complete to the best of their knowledge
• Best estimates of measures – using cup and spoon measures to help with this
• Brand names/descriptions
• Checking for any outlandish entries – eg 100 ml milk in coffee or 20 g steak
• Method of cooking; roast, boil, fry as well as trimming fat of meat
Data entry in Foodworks:
All data was entered into Foodworks 9 (Xyris Software) which utilizes both New Zealand and
Australian food databases. The food records were entered by two separate data enterers for
previous studies. These entries in Foodworks were checked for accuracy by comparing to the
original hard copy diary by the student dietitian conducting thesis. Any discrepancies and
differences in interpretation by student dietitian were documented and data entry protocol was
developed and followed. The following assumptions were made by the student dietitian for the
diet records that were unclear;
• Milk – full fat milk
• Bread - White
• Cheese - Edam
• Tea – with milk (full fat)
90
• Coffee - instant with milk (full fat)
• Flat white/latte/cappuccino – café coffee with full fat milk
• Kiwifruit – gold
• Cucumber – unpeeled, raw
• Rice – white, boiled
• Onions – brown, fried
• Beetroot - canned
• Meat - semi-trimmed
• Chicken breast – skin removed
• Meat – fried or grilled depending on type of meal
• Roasted vegetables – peeled, canola oil added
• Bacon – no added fat
• Potato chips – Bluebird ready salted thick cut
• Muesli – commercial toasted with nuts + dried fruit
• Mashed potato – peeled with milk + butter
• Boiled potato – unpeeled
• Banana - Cavendish
• Porridge – made with water + 0.5 cup whole milk
• Almonds – raw, with skin
Assumptions for serving sizes:
• 0.5 cup whole milk with weet-bix/porridge
• 0.5 cup vegetables (peas, corn, cabbage)
• Salad – garden, no additions, 1 cup
• 1 cup mashed potato/1 medium boiled/roasted potato
• 1 cup rice
• 1 x medium fruit (apple, pear, orange etc)
• Water, tap – 1 x glass
• Porridge – made with water + 0.5 c full fat milk
Differences in interpretation included;
• Coffee, brewed, 0.5% milk – changed to latte, reduced fat milk

91
• ‘steak’ entered as pork – changed to beef
• All meat and vegetables such as peas/beans/corn/eggs entered as cooked option not raw
• Chicken nibbles – entered as chicken bite homemade, altered to chicken wings
• Onion, fried, in dripping – changed to cooked in oil
• Lentils, raw – changed to canned
How food diary entries into Foodworks were checked:
Compared the hard copy diary to the original entry into Foodworks. Any differences in
interpretation, choice of substitution if a food item was not available on Foodworks or error in
entry was highlighted, added to protocol and an alternative was chosen. The top and bottom
10% of each category was also checked for errors in weight entered, once the data had been
exported from Foodworks.