Embed Size (px)
Citation preview
New Brunswick Community Health Assessment Background Report i
The Institute for Health, Health Care Policy, and Aging Research
New Brunswick Community
Health Assessment Background Report
Denise Davis, Dr.P.H., M.P.A.
June 2003

Rutgers Center for State Health Policy, June 2003 ii
New Brunswick Community Health Assessment Background Report iii
Acknowledgements
This report is prepared under contract to New Brunswick Tomorrow with funding from
Johnson & Johnson, a key contributor to the “Healthier New Brunswick 2010” initiative. This
initiative is a collective effort started by Alfred T. Mays, Vice President for Corporate
Contributions and Community Relations at Johnson & Johnson; Jeffrey Vega, President of New
Brunswick Tomorrow; Denise V. Rodgers, Associate Dean for Community Health at Robert Wood
Johnson Medical School; and Joel C. Cantor, Director of Rutgers Center for State Health Policy.
The author wishes to acknowledge the support of these individuals during the development of
this report.
In addition, the author would like to acknowledge the contributions of Mina Silberberg,
Dorothy Gaboda, Joann Donatiello, Yamalis Diaz, Carrie Bogart, and Igda Martinez of Rutgers
Center for State Health Policy in the formation of this report; and Lori Glickman, CSHP
Publications Manager, for assisting with report production. The author acknowledges the
editorial assistance of Amy Montgomery.

Rutgers Center for State Health Policy, June 2003 iv
New Brunswick Community Health Assessment Background Report v
Table of Contents
Executive Summary ...................................................................................................................... vii
Introduction .................................................................................................................................... 1
Overview of the City of New Brunswick......................................................................................... 2
Impressive Profile........................................................................................................................ 2
Disturbing Trends........................................................................................................................ 3
Economics................................................................................................................................... 3
Housing........................................................................................................................................ 4
Crime........................................................................................................................................... 4
Health .......................................................................................................................................... 4
Environmental Quality ................................................................................................................ 8
Summary of Prior New Brunswick-focused Research Activities.................................................. 10
The Timing of New Brunswick 2010 ............................................................................................. 15
Information-Gathering Phases ...................................................................................................... 17
Dissemination and Products ......................................................................................................... 19
Recommendations......................................................................................................................... 19
Endnotes ....................................................................................................................................... 21

Rutgers Center for State Health Policy, June 2003 vi
New Brunswick Community Health Assessment Background Report vii
New Brunswick Community Health Assessment Background Report
Denise Davis, Dr.P.H., M.P.A.ry
EXECUTIVE SUMMARY
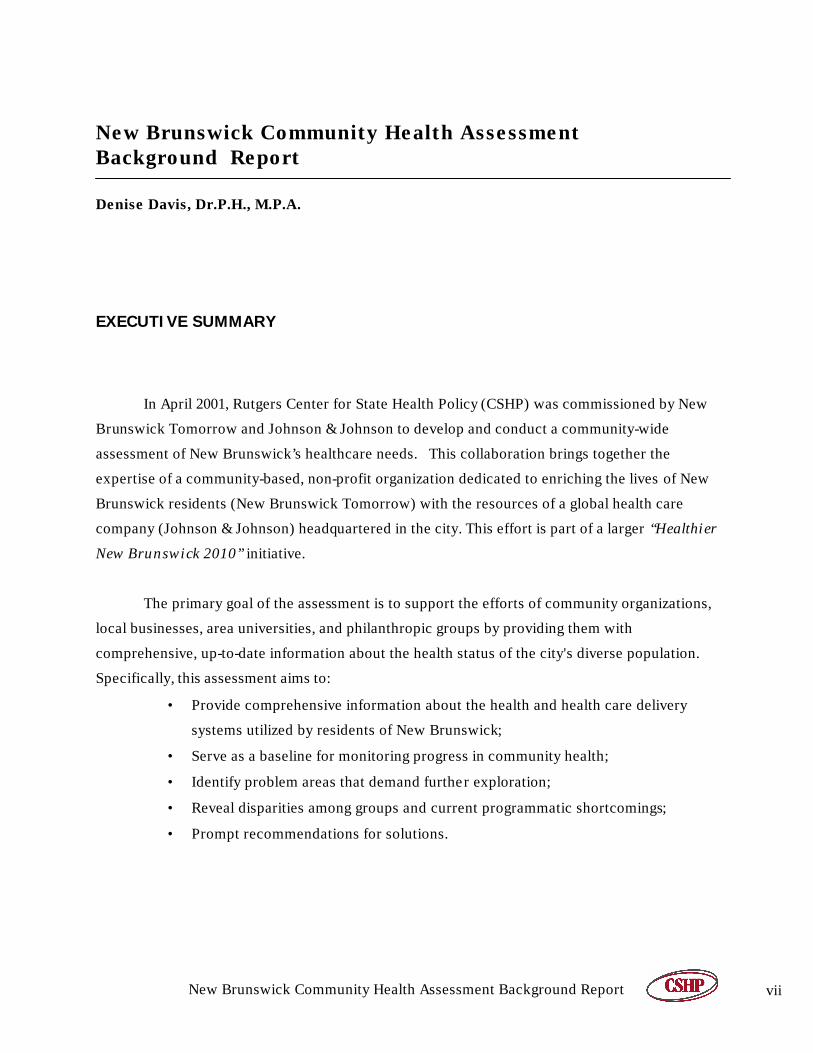
In April 2001, Rutgers Center for State Health Policy (CSHP) was commissioned by New
Brunswick Tomorrow and Johnson & Johnson to develop and conduct a community-wide
assessment of New Brunswick’s healthcare needs. This collaboration brings together the
expertise of a community-based, non-profit organization dedicated to enriching the lives of New
Brunswick residents (New Brunswick Tomorrow) with the resources of a global health care
company (Johnson & Johnson) headquartered in the city. This effort is part of a larger “Healthier
New Brunswick 2010” initiative.
The primary goal of the assessment is to support the efforts of community organizations,
local businesses, area universities, and philanthropic groups by providing them with
comprehensive, up-to-date information about the health status of the city's diverse population.
Specifically, this assessment aims to:
• Provide comprehensive information about the health and health care delivery
systems utilized by residents of New Brunswick;
• Serve as a baseline for monitoring progress in community health;
• Identify problem areas that demand further exploration;
• Reveal disparities among groups and current programmatic shortcomings;
• Prompt recommendations for solutions.
Rutgers Center for State Health Policy, June 2003 viii
The assessment process has five distinct components, including:
1. Review of Prior Studies and Background Information - an examination of prior
studies and additional, relevant background information on the New Brunswick area
and its residents.
2. Key Informant Interviews – conducted with twenty-five representatives from city
agencies, major employers and community organizations.
3. Focus Groups and In-depth Interviews – individual interviews and group discussions
with community professionals and residents with distinct knowledge of local health
problems and concerns.
4. Community Survey – development and implementation of a structured survey
instrument drawing from the background information, key informant interviews,
focus groups, and other identified measures. This instrument will be used to collect
demographic and socioeconomic information, measure population health status and
assess the prevalence of specific health problems.
5. Small-Area Analysis of Health Information from Community Survey –health data
collected during the survey process will be used to identify specific patterns in health
care indicators exhibited by various community groups. Physical and mental health
conditions will be mapped by neighborhood and/or census tract and compared to
available resources throughout the community.
This report presents an overview of the city of New Brunswick and selected data about
its residents. It describes the analytic components of the health assessment project, including
interviews, focus groups, and previous, pertinent studies that will be incorporated into the
analysis, as well as enumerates expected deliverables and dissemination activities.

New Brunswick Community Health Assessment Background Report ix

New Brunswick Community Health Assessment Background Report 1
New Brunswick Community Health Assessment Background Report Denise Davis, Dr.P.H., M.P.A.
Introduction
In April 2001, Rutgers Center for State Health Policy was commissioned by New
Brunswick Tomorrow and Johnson & Johnson to develop and conduct a community-wide
assessment of New Brunswick’s healthcare needs. This collaboration brings together the
expertise of a community-based, non-profit organization dedicated to enriching the lives of New
Brunswick residents (New Brunswick Tomorrow) with the resources of a global health care
company (Johnson & Johnson) headquartered in the city. This effort is part of a larger “Healthier
New Brunswick 2010”initiative.
The primary goal of the assessment is to support the efforts of community organizations,
local businesses, area universities, and philanthropic groups, by providing them with
comprehensive, up-to-date information about the health status of the city's diverse population.
Specifically, this assessment aims to:
• Provide comprehensive information about the health and health care delivery systems
utilized by residents of New Brunswick;
• Serve as a baseline for monitoring progress in the improvement of community health;
• Identify problem areas that demand further exploration;
• Reveal disparities among groups;
• Reveal current programmatic shortcomings;
• Prompt recommendations for solutions.
To this end, Johnson & Johnson asked CSHP and the Robert Wood Johnson Medical
School (RWJMS) to collaborate with local groups to develop the New Brunswick Community
Health Assessment (NBCHA). Thus, community members will be actively engaged in this
process, working alongside the assessment team to identify and understand problems, prioritize
community concerns, assess health needs, and develop programmatic solutions.
Rutgers Center for State Health Policy, June 2003 2
This collaborative investigative approach is critical to the success of the project and to
the long-term improvement of the community's health profile. Fostering the involvement of local
groups will provide stakeholders with invaluable insights into their community's needs as they
help to develop and implement workable solutions.
This Background Report presents an overview of the city of New Brunswick and selected
data about its residents. It describes the analytic components of the health assessment project,
including interviews, focus groups, and previous, pertinent studies that will be incorporated into
the analysis. Finally, it enumerates expected deliverables and dissemination activities.
Overview of the City of New Brunswick
Impressive Profile
New Brunswick is the Middlesex County seat and is located in the east central part of the
state on the Raritan River, approximately 30 miles west of New York City. With a population of
approximately 48,573 people, New Brunswick is considered a small city, yet it has enviable, "big
city" resources. Known as the "Health Care City," New Brunswick is home to Johnson &
Johnson; Rutgers, The State University of New Jersey; the Robert Wood Johnson Medical School;
and two major teaching hospitals. New Brunswick is also home to an impressive list of major,
private sector employers, including Bristol Myers Squibb, Amerada Hess, Merrill Lynch, Seimens,
and Sears & Roebuck. Goods produced in this town include pharmaceuticals, medical supplies,
machinery, clothing, rubber, and electronics. 1
New Brunswick's residents represent various racial and ethnic backgrounds.2 Much of
the population's diversity results from a mix of immigrant groups coming to the city over the
years. For example, in the last ten years, the number of people of Hispanic origin has increased
substantially, while the number of Whites has declined. Today, Whites make up less than half of
the city’s population (about 36.2%). Together, Hispanics (28.9%) and African-Americans (17.1%)
make up just under half of the total New Brunswick population with the balance consisting of
other ethnic groups. 3 New Brunswick is also a relatively young community. People aged 25 to
34 represent the largest segment of residents,4 while population numbers are equally divided
between men and women.
New Brunswick Community Health Assessment Background Report 3
Disturbing Trends
It is unfortunate that even with an abundance of large employers and health care
providers, New Brunswick has a disproportionate share of health and social problems and a
sizable percentage of low-income residents. Although numbers vary by ethnic and racial group,
the city's poor, who include many high school dropouts, suffer high rates of violence, disease,
and death. Many low-income residents live in inadequate housing located in unsafe
neighborhoods, are unemployed or underemployed, and lack adequate access to basic health
care.
The following five subsections provide a more detailed picture of New Brunswick's "dual
nature" -- poverty amidst wealth, underemployment amidst economic opportunity, persistent
health problems amidst world-class health care resources.
Economics
Many city residents live below the U.S. federal poverty level. At first glance, it appears
that the percentage of people living below the poverty line in Middlesex County (6.5 %)is not
alarming, as it is still below the state average of 8.8% (at the time of this report). However,
historically, the percentage of people within the city of New Brunswick who live below the
poverty line has been higher than all of the townships that make up Middlesex County.
Alarmingly, New Brunswick has ten times more impoverished residents than some Middlesex
County towns. Children under the age of 18 represent more than half of the total number of the
city's low-income residents.5
Despite a thriving business community, unemployment in New Brunswick is high (6.5%),
compared to both Middlesex County (3.7%) and the State of New Jersey (4.2%).6 What's more,
recent data from an annual resident opinion survey conducted in New Brunswick suggest that
the employment problem may be more serious than the above figures indicate. In the survey,
10% of respondents reported being unemployed. This finding represented no change from the
previous two years of data on this measure.7
Rutgers Center for State Health Policy, June 2003 4
Housing
Middlesex County's housing stock is relatively old, with 77% of structures built prior to
1979. However, on this measure as well, New Brunswick eclipses the rest of the county with
91.6% of city structures built before 1979. 8 As evidenced by town building permits spanning
previous years, very little new construction has occurred in this city in recent times. In some
cases, the city's success in attracting new businesses has only exacerbated the housing crunch.
New companies and higher income residents moving to the city have displaced many of the city's
low-income residents. Fortunately, the city is beginning to address this issue with a new
downtown revitalization initiative.
With the commencement of revitalization efforts in 2000 as part of the HOPE VI program,
decaying housing projects in New Brunswick are being replaced with low-rise housing and other
building rehab activities. Forty new construction permits were granted in 2000 for this project as
compared to previous years when virtually no permits were issued in the city.9 Given the
percentage of aged building stock in New Brunswick, however, it will take some time to replace
and update existing structures, and to mitigate fully the displacement of low-income residents
and businesses.
Crime
Similar to other counties in the state of New Jersey, the level of crime has decreased in
Middlesex County in recent years. In 2000, the crime rate per 1,000 countywide was 26.5%
compared to 27.8% in 1999. Although rates have also decreased in New Brunswick to 61.7% from
71.6% in 1999, the city clearly suffers a higher crime rate (at nearly 62% per 1,000) than the county
as a whole and all other townships within Middlesex.10
Health
In a survey conducted of Middlesex County residents, numerous troubling health
conditions were reported for residents of Greater New Brunswick. For example, New
Brunswick residents are more likely to suffer from arthritis, high blood pressure, asthma, eye
problems, heart disease, diabetes, mental health problems, obesity, and substance abuse. 11
Residents in New Brunswick were also reported in previous studies to be less likely to have
New Brunswick Community Health Assessment Background Report 5
0
50
100
150
200
250
300
New
Bru
nsw
ick
Mal
es
NJ
Mal
es
New
Bru
nsw
ick
Fem
ales
NJ
Fem
ales
Black
White
health insurance than those in the state overall. A health survey completed in 1996 found nearly
half (46%) of New Brunswick's Hispanic population and more than one-third (37%) of its poor
have no health insurance. 12
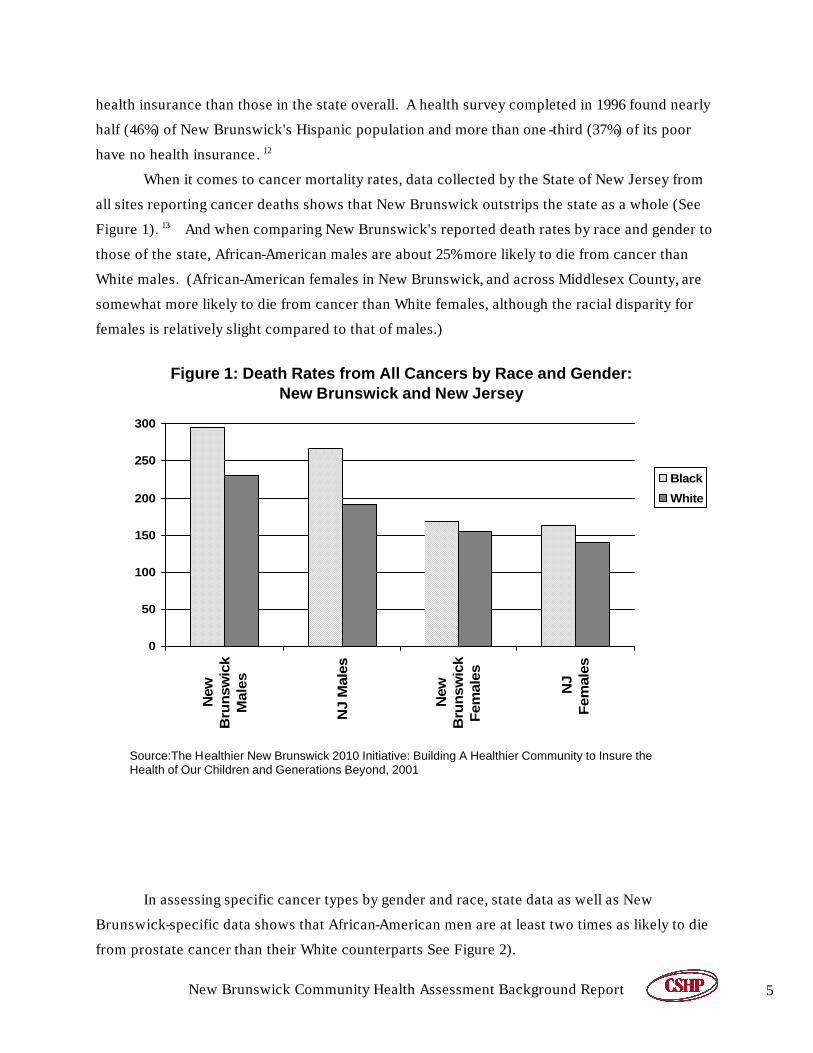
When it comes to cancer mortality rates, data collected by the State of New Jersey from
all sites reporting cancer deaths shows that New Brunswick outstrips the state as a whole (See
Figure 1). 13 And when comparing New Brunswick's reported death rates by race and gender to
those of the state, African-American males are about 25% more likely to die from cancer than
White males. (African-American females in New Brunswick, and across Middlesex County, are
somewhat more likely to die from cancer than White females, although the racial disparity for
females is relatively slight compared to that of males.)
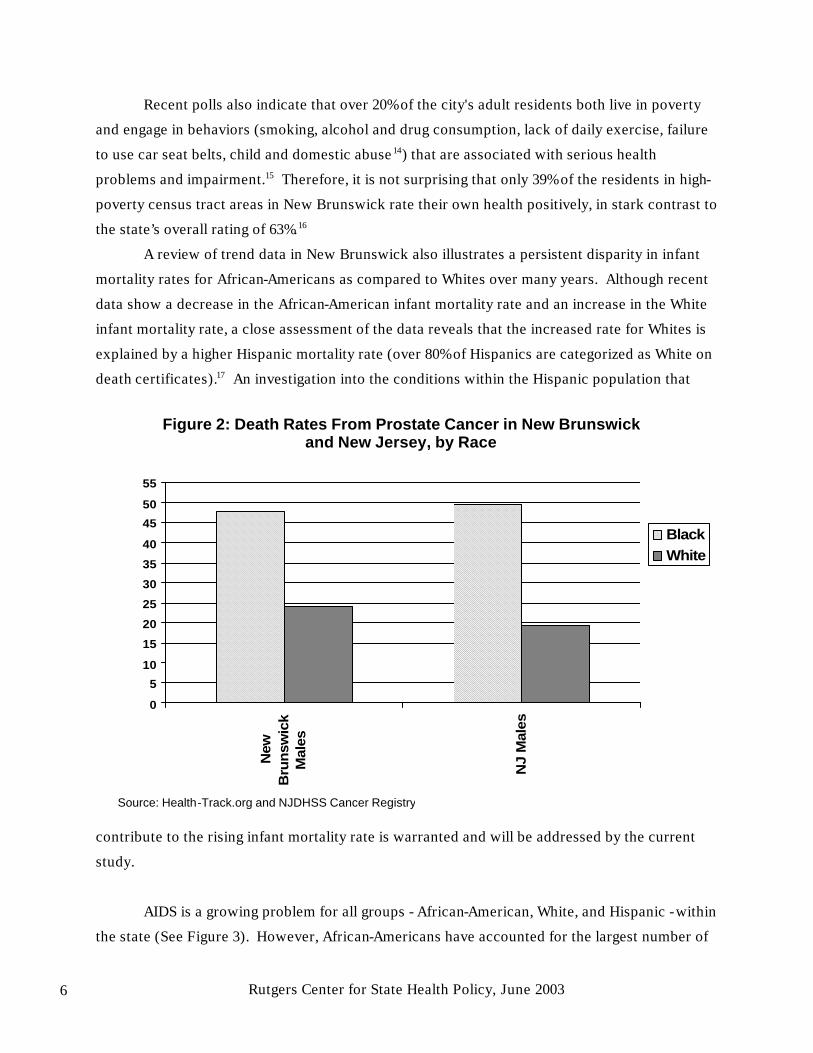
In assessing specific cancer types by gender and race, state data as well as New
Brunswick-specific data shows that African-American men are at least two times as likely to die
from prostate cancer than their White counterparts See Figure 2).
Source:The Healthier New Brunswick 2010 Initiative: Building A Healthier Community to Insure the Health of Our Children and Generations Beyond, 2001
Figure 1: Death Rates from All Cancers by Race and Gender: New Brunswick and New Jersey
Rutgers Center for State Health Policy, June 2003 6
Recent polls also indicate that over 20% of the city's adult residents both live in poverty
and engage in behaviors (smoking, alcohol and drug consumption, lack of daily exercise, failure
to use car seat belts, child and domestic abuse14) that are associated with serious health
problems and impairment.15 Therefore, it is not surprising that only 39% of the residents in high-
poverty census tract areas in New Brunswick rate their own health positively, in stark contrast to
the state’s overall rating of 63%.16
A review of trend data in New Brunswick also illustrates a persistent disparity in infant
mortality rates for African-Americans as compared to Whites over many years. Although recent
data show a decrease in the African-American infant mortality rate and an increase in the White
infant mortality rate, a close assessment of the data reveals that the increased rate for Whites is
explained by a higher Hispanic mortality rate (over 80% of Hispanics are categorized as White on
death certificates).17 An investigation into the conditions within the Hispanic population that
contribute to the rising infant mortality rate is warranted and will be addressed by the current
study.
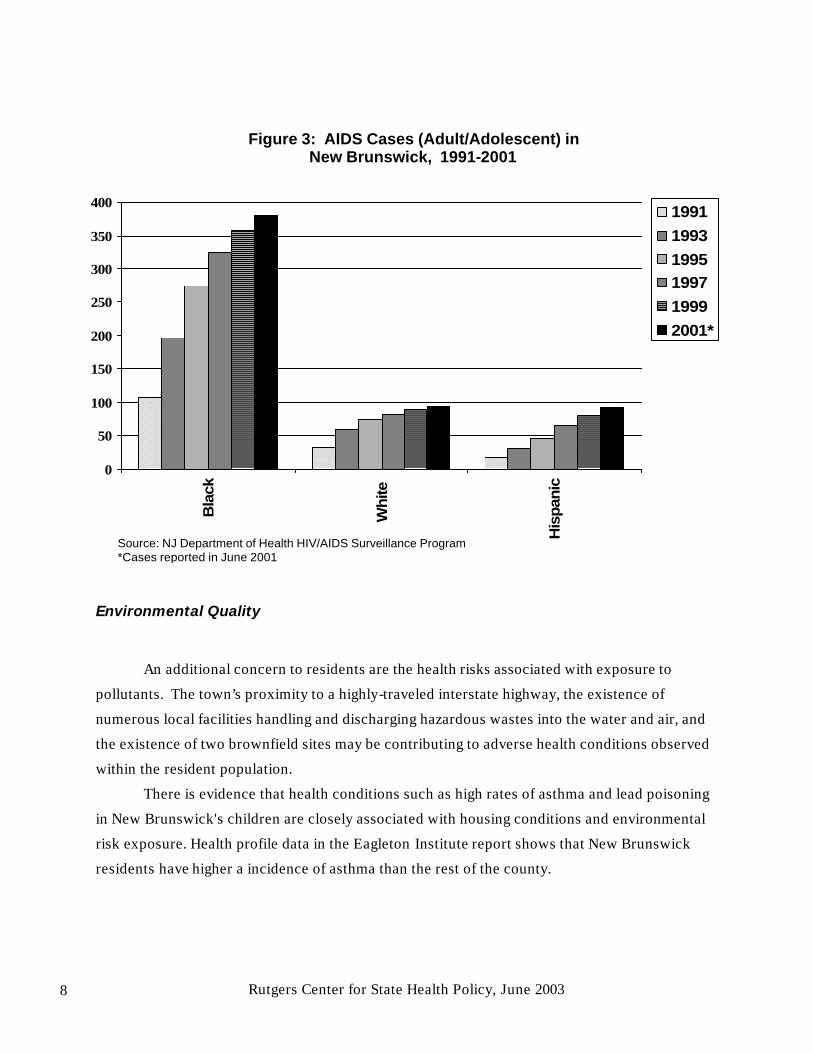
AIDS is a growing problem for all groups - African-American, White, and Hispanic - within
the state (See Figure 3). However, African-Americans have accounted for the largest number of
0
5
10
15
20
25
30
35
40
45
50
55
New
Bru
nsw
ick
Mal
es
NJ
Mal
esBlackWhite
Figure 2: Death Rates From Prostate Cancer in New Brunswick and New Jersey, by Race
Source: Health-Track.org and NJDHSS Cancer Registry
New Brunswick Community Health Assessment Background Report 7
cases since 1991. Data from the NJ Division of AIDS Prevention and Control as reported in 1999
shows that 85% of adults and 100% of children living with AIDS in New Brunswick are African-
American or Hispanic. Forty-four percent of men and 38% of women living with HIV/AIDS in New
Brunswick were exposed to the virus through injection drug use. Although recent surveillance
data suggests that the epidemic is decreasing across all groups in New Brunswick, African-
Americans are still almost five times more likely to be infected with HIV than Whites, and more
than twice as likely as Hispanics to be HIV-infected. 18
Many additional health problems exist in New Brunswick,although there is little
consistent data about them. According to the Eagleton Institute’s Center for Public Interest
Polling, which conducts a biannual survey of New Brunswick residents, issues that distinguish
the city from the rest of the county include:
• More reports of dental and asthma problems;
• Fewer health screenings for hypertension, diabetes, breast cancer, and prostate cancer;
• Greater tendency to use clinics or community health centers;
• Somewhat greater tendency to be covered by Medicaid and Medicare;
• Fewer reported dental visits within the last year, particularly among poor and Latino
residents
• More children taken to emergency rooms when sick
• More reported problems with housing (e.g., overcrowding, drugs, crime, noise, lead paint
chips, heat, water)
• Lifestyle and day care noted more often as barriers to obtaining health care and
information about health services.
Rutgers Center for State Health Policy, June 2003 8
Environmental Quality
An additional concern to residents are the health risks associated with exposure to
pollutants. The town’s proximity to a highly-traveled interstate highway, the existence of
numerous local facilities handling and discharging hazardous wastes into the water and air, and
the existence of two brownfield sites may be contributing to adverse health conditions observed
within the resident population.
There is evidence that health conditions such as high rates of asthma and lead poisoning
in New Brunswick's children are closely associated with housing conditions and environmental
risk exposure. Health profile data in the Eagleton Institute report shows that New Brunswick
residents have higher a incidence of asthma than the rest of the county.
0
50
100
150
200
250
300
350
400B
lack
Wh
ite
His
pan
ic
199119931995199719992001*
Figure 3: AIDS Cases (Adult/Adolescent) in New Brunswick, 1991-2001
Source: NJ Department of Health HIV/AIDS Surveillance Program *Cases reported in June 2001
New Brunswick Community Health Assessment Background Report 9
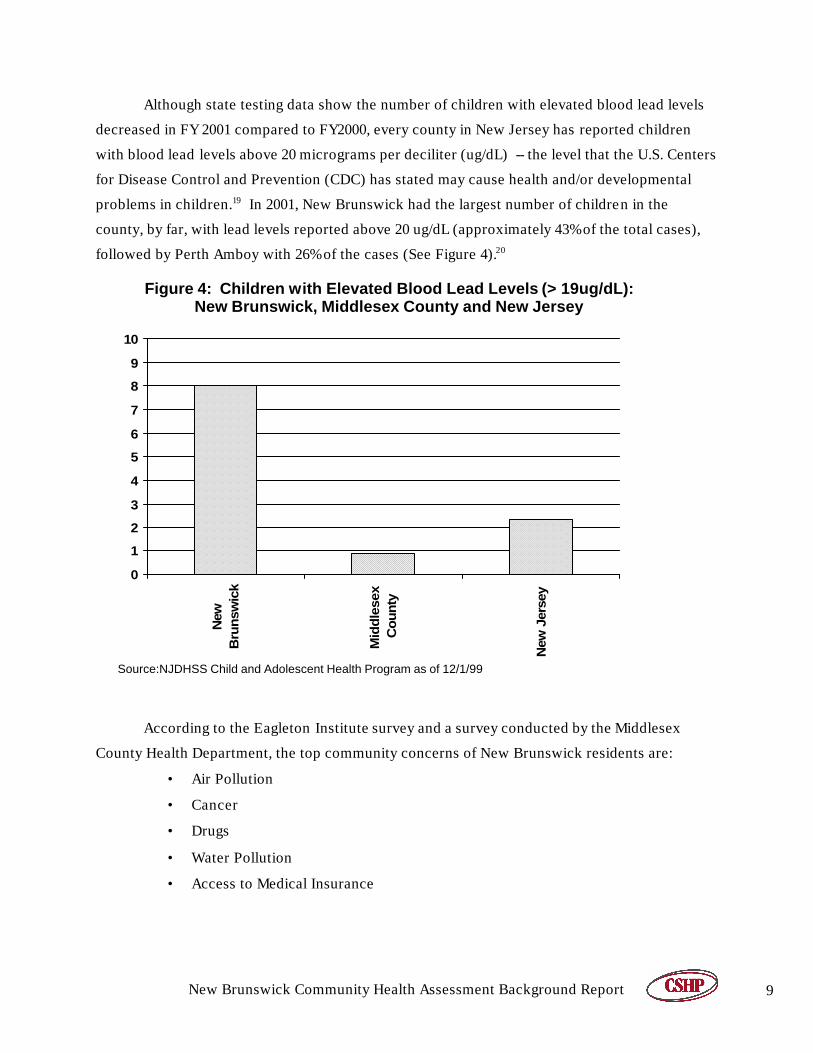
Although state testing data show the number of children with elevated blood lead levels
decreased in FY 2001 compared to FY2000, every county in New Jersey has reported children
with blood lead levels above 20 micrograms per deciliter (ug/dL) -- the level that the U.S. Centers
for Disease Control and Prevention (CDC) has stated may cause health and/or developmental
problems in children.19 In 2001, New Brunswick had the largest number of children in the
county, by far, with lead levels reported above 20 ug/dL (approximately 43% of the total cases),
followed by Perth Amboy with 26% of the cases (See Figure 4).20
According to the Eagleton Institute survey and a survey conducted by the Middlesex
County Health Department, the top community concerns of New Brunswick residents are:
• Air Pollution
• Cancer
• Drugs
• Water Pollution
• Access to Medical Insurance
0
1
2
3
4
5
6
7
8
9
10
New
Bru
nsw
ick
Mid
dle
sex
Cou
nty
New
Jer
sey
Figure 4: Children with Elevated Blood Lead Levels (> 19ug/dL): New Brunswick, Middlesex County and New Jersey
Source:NJDHSS Child and Adolescent Health Program as of 12/1/99
Rutgers Center for State Health Policy, June 2003 10
Summary of Prior New Brunswick-focused Research Activities
In order to derive more reliable measures of health issues in New Brunswick and develop
more effective interventions, this new assessment will draw upon valuable, albeit diverse,
information already gathered in previous studies. These include studies by the state, the county,
a research institute that did a baseline study for area hospitals, and a health institute within
Rutgers University, as well as prior studies that have included profiles or survey data about New
Brunswick. These reports represent a rich archive of data, given that, over the past nine years,
New Brunswick has served as the focus for many community health assessments and perception
surveys, and more recently the city been part of a stepped-up effort by Middlesex County to
measure the health status of the county population.
All of these studies, to varying degrees and in a variety of ways, have identified problems,
prioritized resident health concerns, and provided information on key health indicators. By
analyzing and integrating the findings from these disparate sources, this assessment will be able
to provide local level data in a number of health areas where none currently exists. This effort
should also lead to a new, more comprehensive list of priorities and effective interventions to
address critical health and social issues.
The following are brief descriptions of particularly useful, previously -conducted studies:
The 2000 Middlesex County Community Health Profile and Community Health
Survey for the City of New Brunswick, conducted by the Middlesex County Public Health
Department, provides a profile of Middlesex County (using 1990 census data), including lists of
organizations, doctors, and dentists, along with data concerning companies, housing complexes,
and transportation. This document provides health statistics from multiple sources and survey
information based on a "convenience" sample of 161 Middlesex county residents who responded
to a survey distributed by health workers.
The 2001 Community Health Needs Assessment for Middlesex County, also
conducted by the Middlesex County Public Health Department, provides data at the county level
focusing on specific health conditions, health behaviors, access to health care services, and
social and physical factors affecting health. Although not comprehensive, it does compile
resident survey information on key health indicators and residents’ top health concerns.
Statistics from Middlesex County, the State of New Jersey, and the United States are compared
to the national “Healthy People 2010” objectives.
The Regional Perinatal and Pediatric Plan (2001-2003) was produced by the Central
New Jersey Maternal and Child Health Consortium (CNJMCHC) to guide all Consortium
New Brunswick Community Health Assessment Background Report 11
programs and member agencies in developing, coordinating, and evaluating services for pregnant
women, infants, children, and adolescents. The plan contains needs assessment data from
member counties; descriptions of perinatal and pediatric services; an assortment of pediatric,
neonatal, and adolescent data; and provider and service information for participating counties.
The data comes from a variety of sources including the New Jersey Department of Health and the
Senior Services’ Electronic Birth Certificate Program (EBC). It is noteworthy that New
Brunswick-specific statistics in this report include children with elevated blood lead levels, high
infant and neo-natal mortality, and low and very low birth weight. It also discusses quality of
perinatal care and the impacts of parental substance abuse, and it breaks down the data by race
(See Figures 5 through 8).
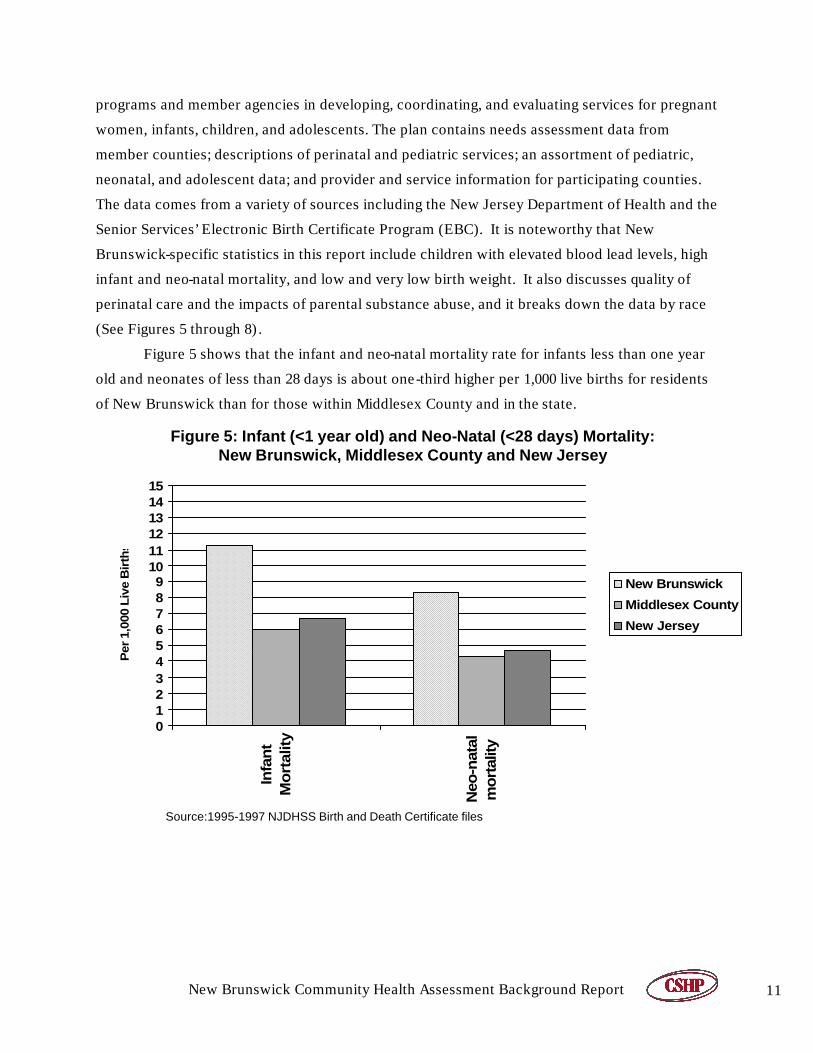
Figure 5 shows that the infant and neo-natal mortality rate for infants less than one year
old and neonates of less than 28 days is about one-third higher per 1,000 live births for residents
of New Brunswick than for those within Middlesex County and in the state.
0123456789
101112131415
Infa
nt
Mo
rtal
ity
Neo
-nat
alm
ort
ality
Per
1,0
00 L
ive
Bir
ths
New Brunswick
Middlesex County
New Jersey
Figure 5: Infant (<1 year old) and Neo-Natal (<28 days) Mortality: New Brunswick, Middlesex County and New Jersey
Source:1995-1997 NJDHSS Birth and Death Certificate files
Rutgers Center for State Health Policy, June 2003 12
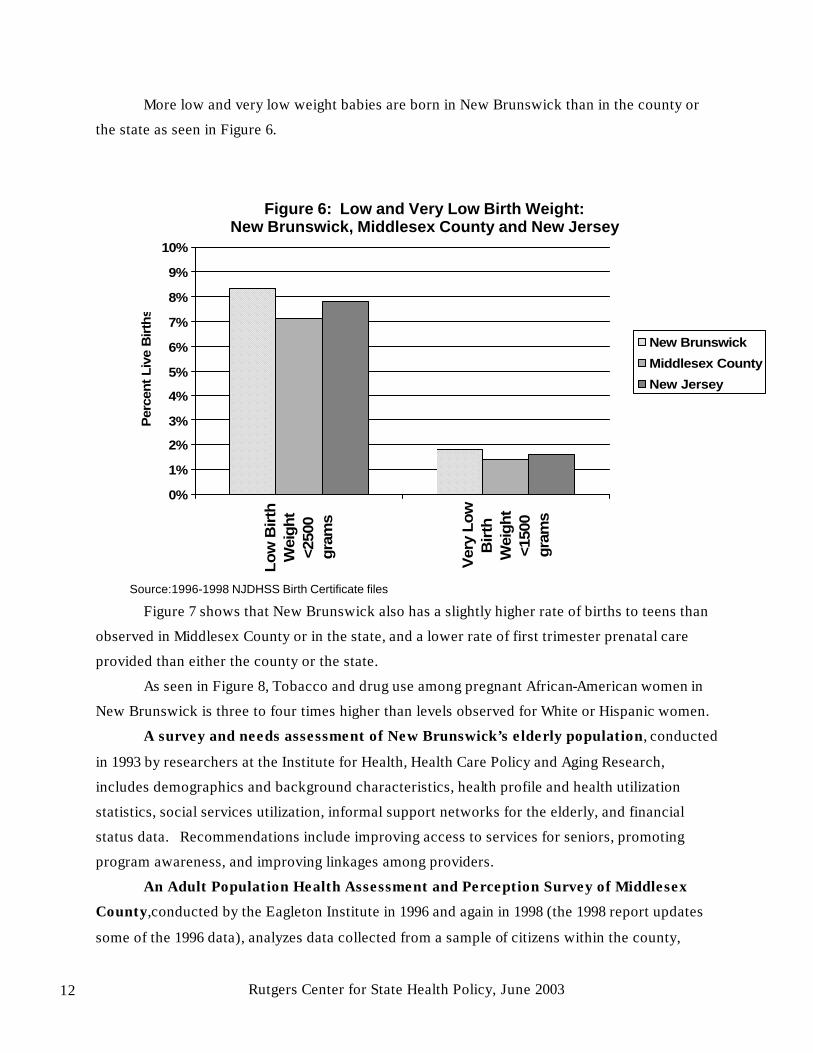
More low and very low weight babies are born in New Brunswick than in the county or
the state as seen in Figure 6.
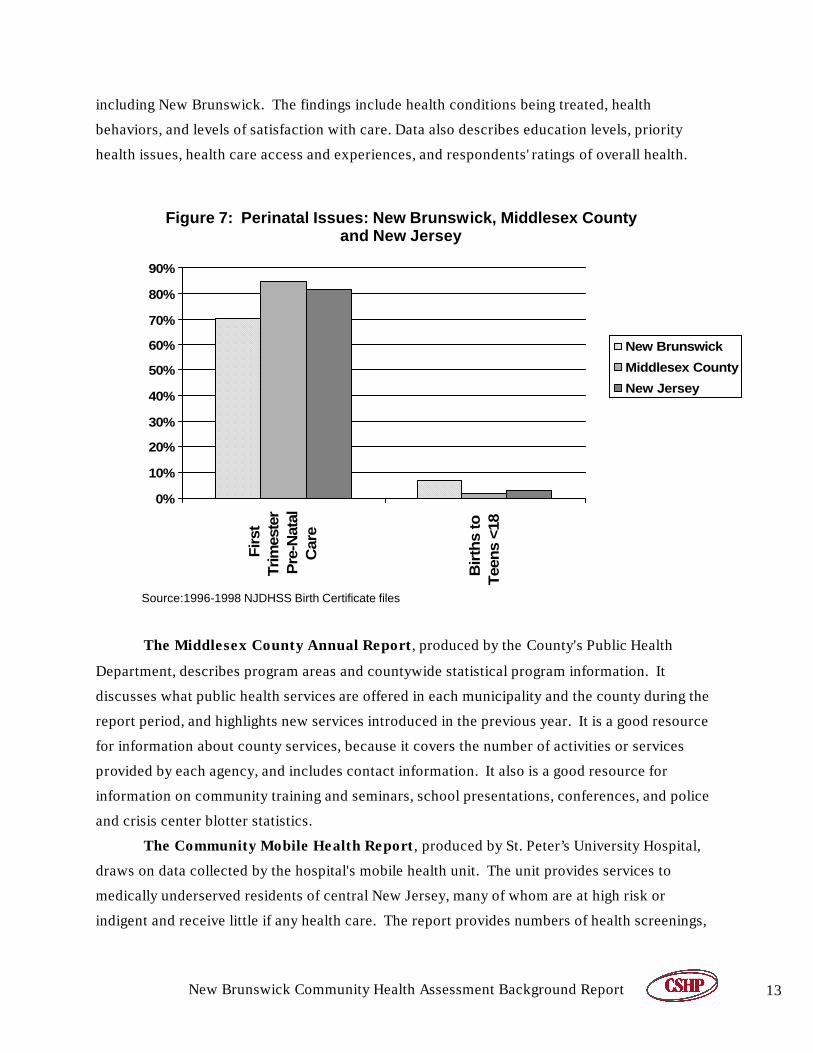
Figure 7 shows that New Brunswick also has a slightly higher rate of births to teens than
observed in Middlesex County or in the state, and a lower rate of first trimester prenatal care
provided than either the county or the state.
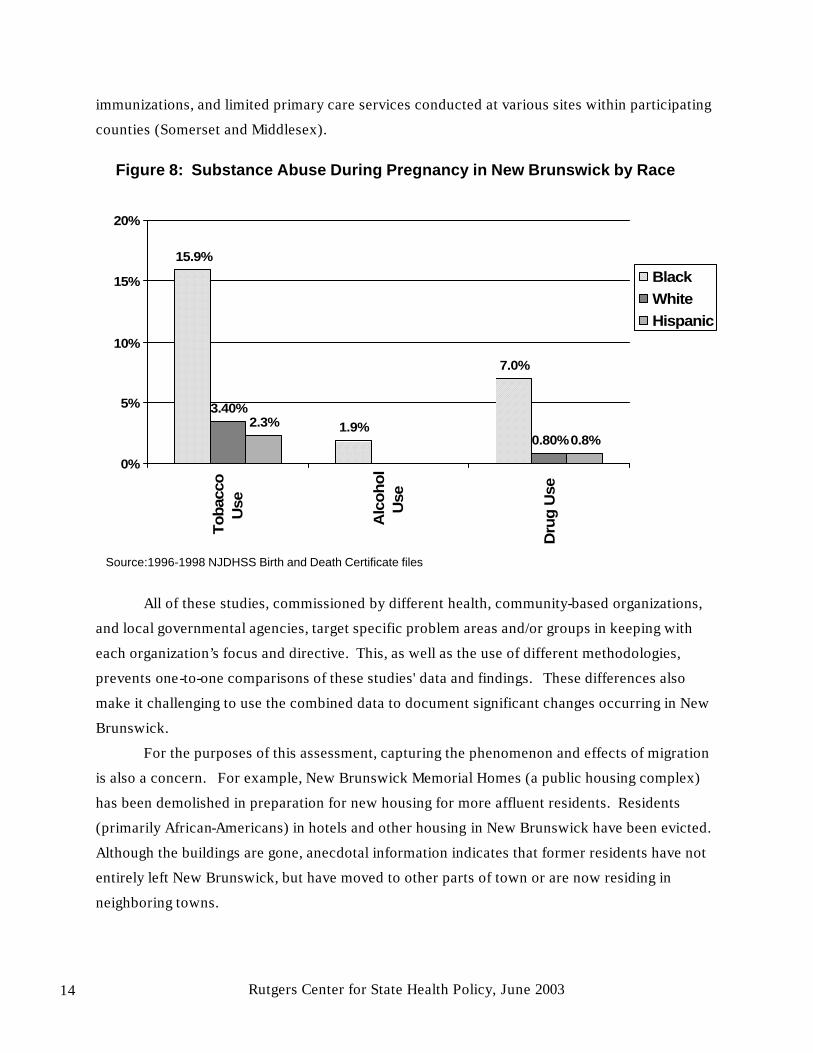
As seen in Figure 8, Tobacco and drug use among pregnant African-American women in
New Brunswick is three to four times higher than levels observed for White or Hispanic women.
A survey and needs assessment of New Brunswick’s elderly population, conducted
in 1993 by researchers at the Institute for Health, Health Care Policy and Aging Research,
includes demographics and background characteristics, health profile and health utilization
statistics, social services utilization, informal support networks for the elderly, and financial
status data. Recommendations include improving access to services for seniors, promoting
program awareness, and improving linkages among providers.
An Adult Population Health Assessment and Perception Survey of Middlesex
County,conducted by the Eagleton Institute in 1996 and again in 1998 (the 1998 report updates
some of the 1996 data), analyzes data collected from a sample of citizens within the county,
0%
1%
2%
3%
4%
5%
6%
7%
8%
9%
10%
Lo
w B
irth
Wei
ght
<250
0gr
ams
Ver
y L
ow
Bir
thW
eigh
t<1
500
gram
s
Per
cen
t L
ive
Bir
ths
New Brunswick
Middlesex County
New Jersey
Figure 6: Low and Very Low Birth Weight: New Brunswick, Middlesex County and New Jersey
Source:1996-1998 NJDHSS Birth Certificate files
New Brunswick Community Health Assessment Background Report 13
including New Brunswick. The findings include health conditions being treated, health
behaviors, and levels of satisfaction with care. Data also describes education levels, priority
health issues, health care access and experiences, and respondents' ratings of overall health.
The Middlesex County Annual Report, produced by the County's Public Health
Department, describes program areas and countywide statistical program information. It
discusses what public health services are offered in each municipality and the county during the
report period, and highlights new services introduced in the previous year. It is a good resource
for information about county services, because it covers the number of activities or services
provided by each agency, and includes contact information. It also is a good resource for
information on community training and seminars, school presentations, conferences, and police
and crisis center blotter statistics.
The Community Mobile Health Report, produced by St. Peter’s University Hospital,
draws on data collected by the hospital's mobile health unit. The unit provides services to
medically underserved residents of central New Jersey, many of whom are at high risk or
indigent and receive little if any health care. The report provides numbers of health screenings,
0%
10%
20%
30%
40%
50%
60%
70%
80%
90%Fi
rst
Trim
este
rP
re-N
atal
Car
e
Bir
ths
toTe
ens
<18
New Brunswick
Middlesex County
New Jersey
Figure 7: Perinatal Issues: New Brunswick, Middlesex County and New Jersey
Source:1996-1998 NJDHSS Birth Certificate files
Rutgers Center for State Health Policy, June 2003 14
15.9%
1.9%
7.0%
0.80%2.3%
0.8%
3.40%
0%
5%
10%
15%
20%To
bacc
oU
se
Alc
oh
ol
Use
Dru
g U
se
BlackWhiteHispanic
Source:1996-1998 NJDHSS Birth and Death Certificate files
Figure 8: Substance Abuse During Pregnancy in New Brunswick by Race
immunizations, and limited primary care services conducted at various sites within participating
counties (Somerset and Middlesex).
All of these studies, commissioned by different health, community-based organizations,
and local governmental agencies, target specific problem areas and/or groups in keeping with
each organization’s focus and directive. This, as well as the use of different methodologies,
prevents one-to-one comparisons of these studies' data and findings. These differences also
make it challenging to use the combined data to document significant changes occurring in New
Brunswick.
For the purposes of this assessment, capturing the phenomenon and effects of migration
is also a concern. For example, New Brunswick Memorial Homes (a public housing complex)
has been demolished in preparation for new housing for more affluent residents. Residents
(primarily African-Americans) in hotels and other housing in New Brunswick have been evicted.
Although the buildings are gone, anecdotal information indicates that former residents have not
entirely left New Brunswick, but have moved to other parts of town or are now residing in
neighboring towns.
New Brunswick Community Health Assessment Background Report 15
The fluid in- and out-migration of the Latino population is equally difficult to track,
however one way to assess the extent of immigrant migration is to calculate student mobility.
Current student mobility data for New Brunswick are as follows:
• Overall : 24.42%, compared with the state
• High school: 30.6%, compared with state rate of 12.3%
• Middle/elementary schools: 22.15%, compared to the state rate of 14.3%.
All of the challenges cited above, however, are well worth tackling. There is a clear need
for a new assessment initiative that synthesizes key information from previous studies, and
combines it with data from other important sources (e.g., interviews, hospital discharge data,
Middlesex County Health statistics, and HIV/AIDS surveillance data). The issue of migration, for
example, will be addressed by building in appropriate survey questions and using qualitative
methods, specifically focus groups and in-depth interviews, to answer questions about target
populations.
From these effort to capture and/or meld disparate data from various sources, the project
team aims to produce more accurate baseline information about resident health, trend data for
certain indicators, and priority areas upon which to focus. Ultimately, researchers and
stakeholders should be able to recommend targeted interventions that promise a better quality of
life specifically for at-risk populations.
The Timing of New Brunswick 2010
This could not be a more opportune time to take stock of the health of New Brunswick
residents. As this overview makes clear, New Brunswick's citizens are shouldering more than
their share of health and social problems. But New Brunswick is not a stagnant community. It is
a vibrant environment with an expanding business sector and local officials who are motivated to
promote improvements for all citizens.
The city is currently undergoing a physical and social transformation associated with a
downtown economic revitalization project that has attracted new businesses, restaurants,
housing development, and theatres. In 1999 within the public sector, the city Division of
Consumer Development rehabilitated 120 homes, and Middlesex County invested over $75
million in three major construction projects downtown21. The private sector has also increased
its investments in downtown New Brunswick in recent years, and polling data of city residents
shows that, since the mid-90s, New Brunswick residents increasingly see the city as a better and
safer place to live.22
Rutgers Center for State Health Policy, June 2003 16
Recent health care program expansions at the state level have also provided New
Brunswick with new opportunities. Enrollment of previously uninsured children in NJ KidCare
has grown, and former Governor Christine Whitman created NJ FamilyCare to subsidize health
coverage for modest-income parents.
State financing of home and community-based long-term care services also was greatly
expanded for low-income elders through Senior Initiatives, and a newly developed initiative,
called Senior Gold, extends the state’s Pharmacy Assistance for the Aged and Disabled program
to a larger, modest-income population.
It bears repeating that all of these activities are occurring at a time when the city must
contend with a large influx of illegal immigrant families and an outmigration of African-American
and Latino minority groups. (Note: see New Brunswick Revitalization Process Executive
Summary) And as noted earlier, there is a potential, serious downside of revitalization that
cannot be ignored, namely the displacement of the poor and the elimination of affordable
housing, already at a premium in this city.
Against this backdrop and despite attempts in the past decade to address the needs of the
citizenry, policymakers, program planners, and practitioners have become increasingly
concerned that existing services are not meeting the growing problems of urban life.23 A critical
aspect of the “Healthier New Brunswick 2010” initiative -- and one that will directly influence
the success of the recommended interventions -- is its emphasis on bringing together and
engaging community members in identifying and understanding the range of residents’ problems
and their interactions.
As noted at the outset of this report, the goals of this assessment are to:
• Engage community and health care leadership not only in developing avenues for
health improvement but also in ensuring community ownership of this process
and its results;
• Assemble qualitative and quantitative information about the health and health
care of the residents of New Brunswick;
• Assess barriers to and existing (but perhaps untapped) assets for improving
health;
• Provide a resource for educating policymakers, community leaders, providers,
and researchers.
There is no question that community involvement will help to ensure consensus on the
priority areas, validation of the information that should be collected, the data collection
New Brunswick Community Health Assessment Background Report 17
mechanisms to use, how information should be interpreted, and to whom and in what manner
the data is released.
One specific way that the community will guide the analytic work is through the
subcommittee of community representatives from New Brunswick Tomorrow’s Community
Health Advisory Group (CHAG). At the outset of the project, this group will assist the
assessment team in establishing priorities, providing advice on what should be asked, and
identifying respondents. After the data collection phase is completed, the advisory group will
assist the team by reviewing initial findings, providing advice on interpretation, helping to
disseminate findings, and identifying program and policy implications of the assessment that can
be translated into solutions.
Information-Gathering Phases
The assessment methodology has five components:
1. Review of Prior Studies and Background Information – Prior studies, including
information about the local economy and other relevant issues, will be used to develop a
base of existing knowledge. Background data on related issues (e.g. housing, social
service programs, immigration, etc.) will be compiled along with other policy-relevant
information about New Brunswick health organizations.
2. Key Informant Interviews –Senior members of the assessment team have already
conducted approximately 25 one-hour interviews with representatives from community
organizations, advocacy group leaders, representatives of ma jor employers, public health
officials, and other city officials.
3. Focus Groups and In-depth Interviews - Group discussions and individual interviews have
been conducted in neutal venues, such as community centers. Health care and academic
settings that could bias the selection of participants or the viewpoints expressed were
avoided. Individual interviews included professionals with direct knowledge of local
health problems and concerns, such as school nurses, visiting nurse service managers,
primary care physicians, and staff (social workers, nutritionists, etc.). Trained facilitators
led the interviews/groups, and participation was confidential. Where possible, local
residents were employed and trained as group facilitators and interviewers. About 12
focus groups and 7 individual semi-structured interviews were conducted in total.
Rutgers Center for State Health Policy, June 2003 18
Working with the Data Advisory Group (DAG), the most vulnerable populations for this
component of the study were identified. Groups/interviews were conducted in English
and Spanish. Each group was ethnically homogeneous to maximize our ability to draw
out issues relevant to the group.
4. Community Survey - A structured survey drawing from all of the qualitative research
components will be developed to measure health status, health-related and care-seeking
behaviors, insurance coverage, access to care, social and long-term services, and other
priority issues. This instrument will assess the prevalence of specific health problems
(e.g., asthma and diabetes); health insurance coverage; reasons that eligible populations
may not enroll in public coverage programs; access to health, social, and long-term care
services; satisfaction with services; and other high priority issues that emerge from the
qualitative components of the assessment. The survey will also collect demographic and
socioeconomic information. Trained interviewers, who will include local residents, will
conduct interviews with approximately 600 local families in English and Spanish. Most
interviews will be conducted by telephone, but about 10% of interviews will be conducted
in-person to cover families without telephones. Especially vulnerable populations (e.g.,
low-income and/or minority) will be over-sampled. Many of the survey questions will be
drawn from the Center for State Health Policy NJ Family Health Survey (NJFHS), which
will enable some comparisons of New Brunswick to statewide totals and other urban
areas. However, it is more important to customize the New Brunswick survey to the
issues identified as important by the DAG and through the qualitative components of the
assessment, than to guarantee comparability to the NJFHS.
5. Small-Area Analysis of Health Information from Community Survey – Analysis of health
data for areas within New Brunswick will be used to identify patterns in health care
indicators exhibited by various community groups. Reported physical and mental health
conditions will be mapped by neighborhood and/or census tract, and compared to
available resources throughout the community. These factors can also be compared to
reported knowledge of community resources and difficulties in accessing services. Since
much of the content of the community survey will be similar to the 2001 New Jersey
Family Health Survey, information about health conditions in New Brunswick can be
compared to the rest of the state. All small area analysis of health conditions will be
New Brunswick Community Health Assessment Background Report 19
conducted in a manner that protects the identities of individuals with rare and sensitive
conditions.
Dissemination and Products
Upon completion of each component of the assessment, results will be produced. This
information will be assembled and disseminated to community organizations. Multiple vehicles
for dissemination will be used such as the development of summary reports, chartbooks, and
issue briefs. Other venues to disseminate findings will be explored such as team member
presentations, web-publishable versions of project reports, professional journal publications, and
testimony to public officials, funders, and other interested parties.
Recommendations
It is hoped that the collaborative environment established by the New Brunswick
Community Health Assessment will be extended past the life of the initiative. The NBCHA will
provide informational resources to all participants that should prove useful in achieving the
ultimate goal -- designing, implementing, and improving health programs for New Brunswick
residents. Collaboration should also stimulate discussions among health leaders about how to
efficiently use existing resources and where additional aid and emphasis is required. Information
uncovered as a result of this assessment will be:
• Shared with all assessment partners and presented to the Data Advisory
Committee of the CHAG;
• Prioritized based on the extent of the problem noting existing resources and
future planned efforts;
• Used for integrated improvements in ongoing program and service delivery
efforts;
• Disseminated widely to multiple individuals, groups, and organizations as
required.

Rutgers Center for State Health Policy, June 2003 20
New Brunswick Community Health Assessment Background Report 21
Endnotes
Endnotes
1 1999 Geographic Reference Report, ERI Economic Research Institute,1998 2 U.S. Census, 2000 (www.newbrunswick.com/economicdev/demographics.asp) 3 Center for Public Interest Polling, 2000, p. 47; Appendix B8 4 Profile of General Demographic Characteristics for New Brunswick City, Middlesex County
2000, U.S. Census Bureau, Census 2000 5 Http:// www.wnjpin.state.us/Labor Market Information. U.S. Bureau of the Census 2001.
Small Area Income and Poverty Estimates Program. Estimated number and percentage for Poor…17 and Estimated Medican Household.
6 Http:// www.wnjpin.state.us/Labor Market Information. New Jersey Labor Force Estimates
for 2001 by County; 2001 Annual Average Labor Force Estimates by Municipality. ; New Jersey Current Population Estimates Http:// www.wnjpin.state.us
7 Center for Public Interest Polling, 2000, p. 57-59 8 U.S. Bureau of theCensus, 1990, U.S. Department of Commerce County and City Data Book
1994. 9 http://www.wnjpin.state.nj.us/OneStopCar…LaborMarketInformation/lmi18/bpann00.htm. 10 Uniform Crime Report State of New Jersey, 2000 11 Community Health Needs Assessment for New Brunswick ; Center for Public Interest Polling,
1998. 12 Center for Public Interest Polling, 1998. Middlesex County : Adult Population Health
Assessment and Perception Survey. 13 NJ Cancer Resource Site Reports 1998 14 Kids Count New Jersey 2000. State and County Profiles of Child Wellbeing ; New Jersey
DHSS (1999). Annual Statistical Perspective, New Jersey Drug and Alcohol Abuse Treatment. 15 Middlesex County Public Health Department, 2001. Community Health Needs Assessment
for New Brunswick ; Center for Public Interest Polling, 1998. 16 Center for Public Interest Polling, 1996a 17 Central New Jersey Maternal and Child Health Consortium, Oct.2001, CNJMCHC CQI and
Rutgers Center for State Health Policy, June 2003 22
Data Report 1999-2000. 18 New Jersey Department of Health and Senior Services, HIV/AIDS Surveillance Program,
reported cases June 2001. 19 New Jersey DHSS (2001) Childhood Lead Poisoning in New Jersey, Annual Report Fiscal
2001. 20 Lead Program–Annual Report 2001. Middlesex County Public Health Department 21 State of the City Address, Mayor James M. Cahill, January 11, 2000
22 Center for Public Interest Polling, 2000 23 Molinaro Associates, 1993; Center for Public Interest Polling, 1992, 1996a, 1996b, 1996c,
1996d; 2000; Williams & Fallon, 1996; University Health System of New Jersey, 1993