Embed Size (px)
Citation preview
THE INSIDE PUBLIC ACCOUNTING FINANCIAL AND OPERATIONAL REPORT CARD
2021
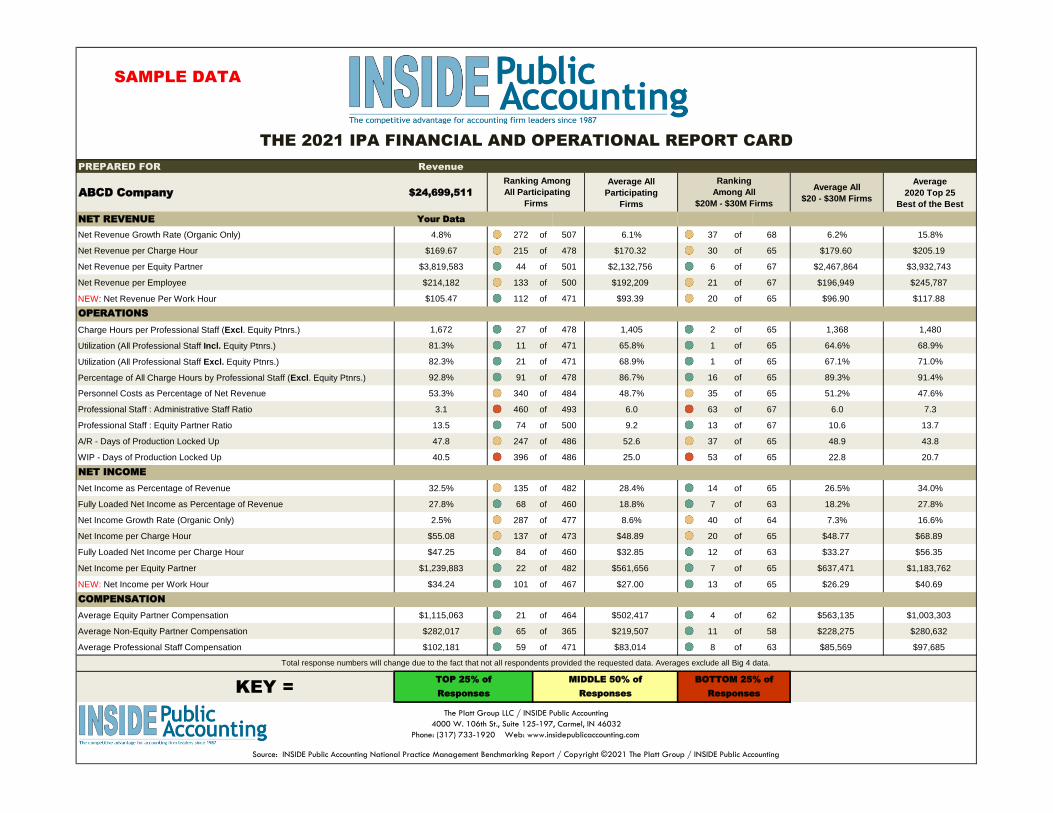
PREPARED FOR Revenue
ABCD Company $24,699,511
Average All
Participating
Firms
Average All
$20 - $30M Firms
Average
2020 Top 25
Best of the Best
NET REVENUE Your Data
Net Revenue Growth Rate (Organic Only) 4.8% 272 of 507 6.1% 37 of 68 6.2% 15.8%
Net Revenue per Charge Hour $169.67 215 of 478 $170.32 30 of 65 $179.60 $205.19
Net Revenue per Equity Partner $3,819,583 44 of 501 $2,132,756 6 of 67 $2,467,864 $3,932,743
Net Revenue per Employee $214,182 133 of 500 $192,209 21 of 67 $196,949 $245,787
NEW: Net Revenue Per Work Hour $105.47 112 of 471 $93.39 20 of 65 $96.90 $117.88
Charge Hours per Professional Staff (Excl. Equity Ptnrs.) 1,672 27 of 478 1,405 2 of 65 1,368 1,480
Utilization (All Professional Staff Incl. Equity Ptnrs.) 81.3% 11 of 471 65.8% 1 of 65 64.6% 68.9%
Utilization (All Professional Staff Excl. Equity Ptnrs.) 82.3% 21 of 471 68.9% 1 of 65 67.1% 71.0%
Percentage of All Charge Hours by Professional Staff (Excl. Equity Ptnrs.) 92.8% 91 of 478 86.7% 16 of 65 89.3% 91.4%
Personnel Costs as Percentage of Net Revenue 53.3% 340 of 484 48.7% 35 of 65 51.2% 47.6%
Professional Staff : Administrative Staff Ratio 3.1 460 of 493 6.0 63 of 67 6.0 7.3
Professional Staff : Equity Partner Ratio 13.5 74 of 500 9.2 13 of 67 10.6 13.7
A/R - Days of Production Locked Up 47.8 247 of 486 52.6 37 of 65 48.9 43.8
WIP - Days of Production Locked Up 40.5 396 of 486 25.0 53 of 65 22.8 20.7
Net Income as Percentage of Revenue 32.5% 135 of 482 28.4% 14 of 65 26.5% 34.0%
Fully Loaded Net Income as Percentage of Revenue 27.8% 68 of 460 18.8% 7 of 63 18.2% 27.8%
Net Income Growth Rate (Organic Only) 2.5% 287 of 477 8.6% 40 of 64 7.3% 16.6%
Net Income per Charge Hour $55.08 137 of 473 $48.89 20 of 65 $48.77 $68.89
Fully Loaded Net Income per Charge Hour $47.25 84 of 460 $32.85 12 of 63 $33.27 $56.35
Net Income per Equity Partner $1,239,883 22 of 482 $561,656 7 of 65 $637,471 $1,183,762
NEW: Net Income per Work Hour $34.24 101 of 467 $27.00 13 of 65 $26.29 $40.69
Average Equity Partner Compensation $1,115,063 21 of 464 $502,417 4 of 62 $563,135 $1,003,303
Average Non-Equity Partner Compensation $282,017 65 of 365 $219,507 11 of 58 $228,275 $280,632
Average Professional Staff Compensation $102,181 59 of 471 $83,014 8 of 63 $85,569 $97,685
KEY =
Ranking
Among All
$20M - $30M Firms
MIDDLE 50% of
Responses
BOTTOM 25% of
Responses
TOP 25% of
Responses
Total response numbers will change due to the fact that not all respondents provided the requested data. Averages exclude all Big 4 data.
Ranking Among
All Participating
Firms
The Platt Group LLC / INSIDE Public Accounting
4000 W. 106th St., Suite 125-197, Carmel, IN 46032
Phone: (317) 733-1920 Web: www.insidepublicaccounting.com
Source: INSIDE Public Accounting National Practice Management Benchmarking Report / Copyright ©2021 The Platt Group / INSIDE Public Accounting
OPERATIONS
NET INCOME
COMPENSATION
THE 2021 IPA FINANCIAL AND OPERATIONAL REPORT CARD
SAMPLE DATA
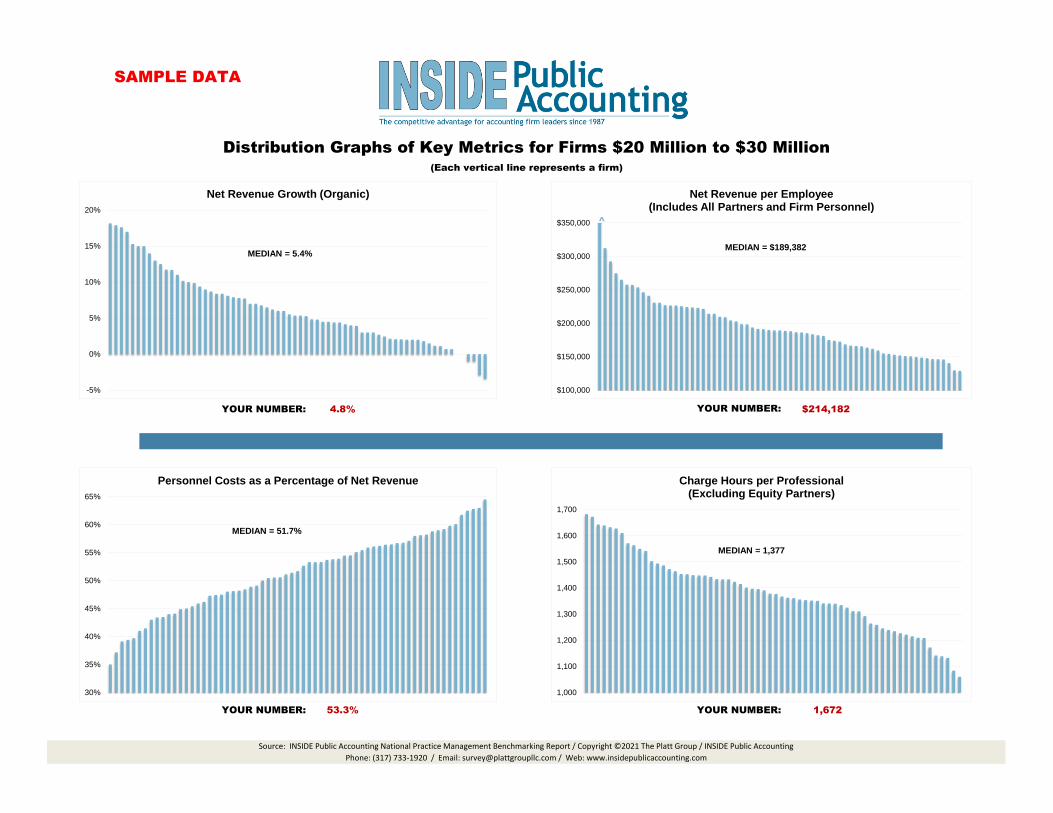
YOUR NUMBER: 4.8% $214,182
YOUR NUMBER: 53.3% 1,672YOUR NUMBER:
YOUR NUMBER:
Distribution Graphs of Key Metrics for Firms $20 Million to $30 Million(Each vertical line represents a firm)
Source: INSIDE Public Accounting National Practice Management Benchmarking Report / Copyright ©2021 The Platt Group / INSIDE Public Accounting
Phone: (317) 733-1920 / Email: [email protected] / Web: www.insidepublicaccounting.com
-5%
0%
5%
10%
15%
20%
Net Revenue Growth (Organic)
MEDIAN = 5.4%
$100,000
$150,000
$200,000
$250,000
$300,000
$350,000
Net Revenue per Employee (Includes All Partners and Firm Personnel)
^
MEDIAN = $189,382
30%
35%
40%
45%
50%
55%
60%
65%
Personnel Costs as a Percentage of Net Revenue
MEDIAN = 51.7%
1,000
1,100
1,200
1,300
1,400
1,500
1,600
1,700
Charge Hours per Professional (Excluding Equity Partners)
MEDIAN = 1,377
SAMPLE DATA
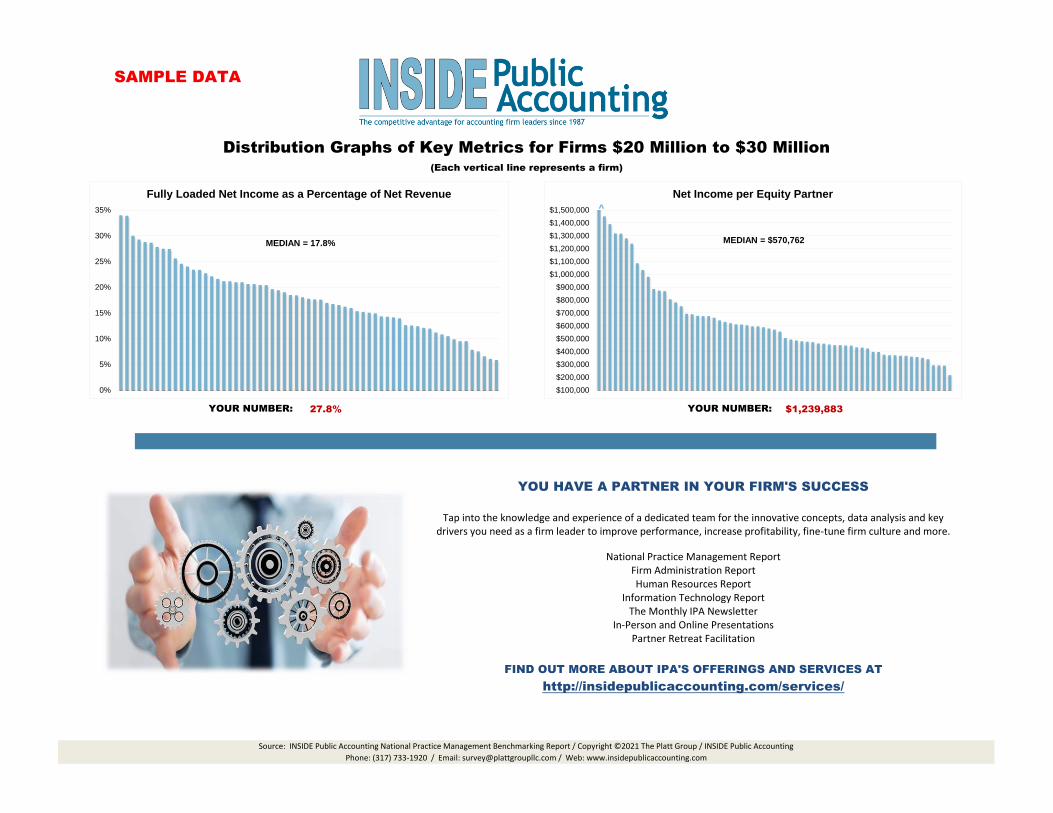
27.8% $1,239,883YOUR NUMBER:
Distribution Graphs of Key Metrics for Firms $20 Million to $30 Million(Each vertical line represents a firm)
Source: INSIDE Public Accounting National Practice Management Benchmarking Report / Copyright ©2021 The Platt Group / INSIDE Public Accounting
Phone: (317) 733-1920 / Email: [email protected] / Web: www.insidepublicaccounting.com
YOUR NUMBER:
0%
5%
10%
15%
20%
25%
30%
35%
Fully Loaded Net Income as a Percentage of Net Revenue
MEDIAN = 17.8%MEDIAN = $727,273
$100,000
$200,000
$300,000
$400,000
$500,000
$600,000
$700,000
$800,000
$900,000
$1,000,000
$1,100,000
$1,200,000
$1,300,000
$1,400,000
$1,500,000
Net Income per Equity Partner
^
MEDIAN = $570,762
YOU HAVE A PARTNER IN YOUR FIRM'S SUCCESS
Tap into the knowledge and experience of a dedicated team for the innovative concepts, data analysis and key drivers you need as a firm leader to improve performance, increase profitability, fine-tune firm culture and more.
National Practice Management ReportFirm Administration ReportHuman Resources Report
Information Technology ReportThe Monthly IPA Newsletter
In-Person and Online Presentations Partner Retreat Facilitation
FIND OUT MORE ABOUT IPA'S OFFERINGS AND SERVICES AT
http://insidepublicaccounting.com/services/
SAMPLE DATA
Name
Firm
Mailing Address
City State
Zip Phone
Association
Email Address
AmountDue:
Payment:Check Visa MasterCard Amex
Card #
Exp. Date Security Code
Name
Billing Address
City State
Zip
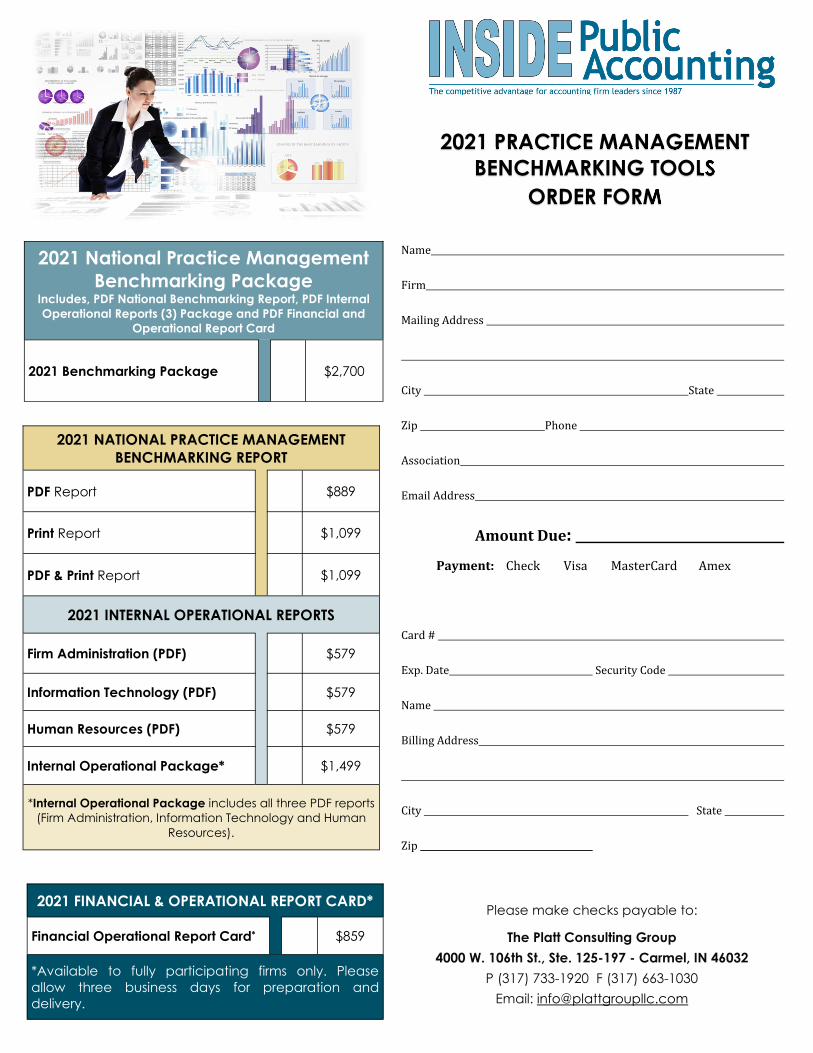
2021 NATIONAL PRACTICE MANAGEMENT BENCHMARKING REPORT
PDF Report $889
Print Report $1,099
PDF & Print Report $1,099
2021 INTERNAL OPERATIONAL REPORTS
Firm Administration (PDF) $579
Information Technology (PDF) $579
Human Resources (PDF) $579
Internal Operational Package* $1,499
*Internal Operational Package includes all three PDF reports(Firm Administration, Information Technology and Human
Resources).
Please make checks payable to:
The Platt Consulting Group 4000 W. 106th St., Ste. 125-197 - Carmel, IN 46032
P (317) 733-1920 F (317) 663-1030 Email: [email protected]
2021 FINANCIAL & OPERATIONAL REPORT CARD*
Financial Operational Report Card* $859
*Available to fully participating firms only. Pleaseallow three business days for preparation anddelivery.
2021 PRACTICE MANAGEMENT BENCHMARKING TOOLS
ORDER FORM
2021 National Practice Management Benchmarking Package
Includes, PDF National Benchmarking Report, PDF Internal Operational Reports (3) Package and PDF Financial and
Operational Report Card
2021 Benchmarking Package $2,700