Embed Size (px)
Citation preview
ARTICLE IN PRESS
0166-4972/$ - se
doi:10.1016/j.te
�CorrespondE-mail addr
(A. Garcia).
Technovation 28 (2008) 739–757
www.elsevier.com/locate/technovation
The innovative activity of foreign subsidiaries in the SpanishInnovation System: An evaluation of their impact from a sectoral
taxonomy approach
Jose Moleroa,�, Antonio Garciab
aInstituto Complutense de Estudios Internacionales, Universidad Complutense de Madrid, Campus de Somosaguas, Finca Mas Ferre,
Edificio A, E 28223 Pozuelo de Alarcon, Madrid, SpainbFacultad de Ciencias Economicas y Empresariales, Universidad de Sevilla, Avda. Ramon y Cajal, 1, 41018 Sevilla, Spain
Abstract
The aim of this paper is to contribute to a better understanding of the impact multinational enterprises (MNEs) innovative strategies
have on the countries they localised their activities, particularly the so-called ‘‘intermediate countries’’. By using micro-data of the 2003
Spanish Innovation Survey we investigate the situation in the manufacturing sector. A new perspective of that impact arises from the
elaboration of a sectoral taxonomy of sectors by combining their revealed technological advantage with the evolution of their
technological position in the world during 1993–2003, using for both purposes data of patents granted by the USPTO. We found MNEs
subsidiaries show noticeable coincidences with domestic enterprises, after controlling most important fixed effects, in the way they
organise their innovative activities. The importance of belonging to a group is absolutely clear and discriminates sharply between the
relationships of the firms with the system and the impact they produce. As far as factors are concerned, the crucial role of size and some
related aspects (notably, capability of integrating inner and outer sources of knowledge and human resources and funds availability)
must be underlined. However, factors, which have to do more with the organisation of innovation more directly are less significant to
differentiate the possible impact for the innovation system. The importance of sectoral categories reach in many estimations validate the
taxonomy proposed as a way of better understanding the relationships of MNEs with the Spanish Innovation System.
r 2008 Elsevier Ltd. All rights reserved.
Keywords: Innovation; Multinational companies; Intermediate countries; Sectoral taxonomies; Spain
1. Introduction
Innovation has experienced a remarkable change inrecent years as a consequence of a number of factorsincluding the advance of science and technology and theincreasing globalisation of a number of markets andactivities. The growing heterogeneity of sources affectingthe process of firms’ innovation has led to the knowledgecreated out of the companies themselves achieving greaterimportance, and therefore to the central role to be playedby the capacity of integrating inner and outer sources oftechnological capabilities with other competitive forces.
e front matter r 2008 Elsevier Ltd. All rights reserved.
chnovation.2008.03.005
ing author. Tel.: +3491 394 3222; fax: +34 91 394 2487.
esses: [email protected] (J. Molero), [email protected]
Similarly, the acceleration of internationalisation at mosteconomic and social levels has increased the necessity forexploiting firms’ advantages at international (sometimesworld) level and seeking new competitive (technological)assets in a multinational framework.In such a process, multinational enterprises (MNEs) are
a major player insofar as they can extend strategies able toexploit new advantages internationally (Cantwell andMolero, 2003). In this transformation, the consequencesaffect not only MNEs themselves but economies andsystems of innovation of both the country where theheadquarters are located and the one where the affiliate islocated. Nevertheless, most of the research has beendevoted either to analysing the impact on North–Southrelations of new MNE activities or the implications forinter-developed-country relations. So far, cases of what can
ARTICLE IN PRESSJ. Molero, A. Garcia / Technovation 28 (2008) 739–757740
be called ‘‘intermediate countries’’ have received much lessattention, probably because their particular situationmakes it more difficult to draw up a hypothesis adequateto their specific nature; it can be the case of the role ofsubsidiaries and the intensity and direction of spillovers.
The aim of this paper is to contribute to a betterunderstanding of the situation of those countries byexamining a relevant case study: the Spanish manufactur-ing sector in recent years. To carry out this task, we shallinvestigate the innovative behaviour of MNEs subsidiariesin Spain using micro-data of the 2003 Innovation Survey.In the comparison, especial attention will be given to therelevance of the fact of belonging to a group of nationaland international companies. Moreover, as the literaturehas recently emphasised (Cantwell and Molero, 2003;Narula, 2004; Sadowsky and Sadowski-Rasters, 2006;Balcet and Evangelista, 2005; Alvarez and Molero, 2004),sector of activity is probably a central factor for encoura-ging or otherwise the consolidation of ‘‘virtuous circles’’;so, the analysis will consider sectoral specificities byconstructing a sectoral typology using revealed technologyadvantages (RTAs) calculations.
The paper is organised in the following way. The nextsection will be devoted to the exploration of availabletheory and recent evidence enabling us to formulate someresearch guidelines. In the third one, a summary of mostoutstanding features of the presence of MNEs in theSpanish Innovation Organisation is shown. In the fourth,statistical data and methodology of empirical analysis willbe explained. The fifth section will present and debate theresults and, finally, in the sixth, we shall summarise themain conclusions.
2. Theory and evidence
The starting point is the evolution of the intensiveinteraction between transformations in innovation, as aprocess of applying new ideas to the production andconsumption of the economy and its internationalisation asa growing tendency of obtaining economic value on aworldwide scale. As far as innovation is concerned, themost remarkable fact has been the increasing complexityand heterogeneity of organising innovative activities; thecontinuing need for cross-fertilising technologies, thegrowing trend of associated costs, accelerated obsolescenceand the importance of combining firm and externalknowledge, either public or tacit. These are amongthe most outstanding features of the current pattern ofcreating or adopting technologies. As a result, fewer andfewer firms can find all the inputs and assets they need inthe immediate environment. In other words, NationalSystems of Innovation are less ‘‘national’’ because theyincorporate more cross-country elements and actors.
With regard to internationalisation, the accelerationwe have witnessed has implied not just a fast growth ofinternational commerce, direct investment and so on, buthas brought qualitative transformations as well. Socio-
political changes (the most noticeable one being theopening up of former socialist economies to the interna-tional scenario) and the incredibly rapid incorporation of ahuge number of service activities, makes the approximationto global markets a near reality in a number of sectorswhile in others it is increasing the transnational characterof economic competitiveness. Therefore, all activities needtoday a more international organisation to take fulladvantage of new markets and possibilities, including theobtaining of technological inputs and innovative assets;this is what lies behind the concept of internationalisation of
innovation used both by academic researchers and publicadministrations (Archibugi and Michie, 1995; EuropeanCommission, 1998; OECD, 1997; Patel and Pavitt, 1992).
2.1. Theoretical considerations on relationships MNEs and
National Innovation Systems (NIS)
In that context, the singularity of MNEs comes from thefact they already have an international structure and atradition in coping with different socioeconomic environ-ments. However, the capacity for adjusting to the newconditions is neither automatic nor cost-free; in fact, acritical competitive factor of those enterprises today isprecisely the acquisition of those capabilities (Cantwell andMolero, 2003; Narula, 2004). To do so, different ways ofcreating international networks have been followed (Ernstand Kim, 2002) to the extent that some authors speakabout alliance capitalism (Dunning, 1997). Castellani andZanfei (2006) underline that MNEs use both internal andexternal networks; the former consist of the cluster ofsubsidiaries and affiliates while the external side is formedby the interaction firms of the group maintain with localfirms and institutions of the hosting countries. For thepurpose of this paper, the central issue to consider is therelationships of those networks with National Systems ofInnovations of countries not characterised by being part ofthe bulk of the new international innovative cluster. Thereare a number of theoretical considerations, which illumi-nate our empirical research. We shall group them in threeanalytical drivers: (a) factors supporting technological
decentralisation, (b) factors attracting different technologi-
cal subsidiaries and (c) effects on host systems of innovation.
2.1.1. Factors supporting technological decentralisation
To enter into this discussion it is still useful to follow thearguments summarised by Granstrand et al. (1993). Theygrouped decentralising factors into those of demand andsupply. The simplest demand factor has to do with theclassic supporting technological activity, which has to becarried out to sustain foreign productive activities ofMNEs. It is a consequence of the specific and appliedcharacter of technologies, which make them practicallyimpossible to implement without some adaptation tasks.Secondly, and more comprehensively, there is a ‘‘natural’’evolution of the activity of those subsidiaries that increas-ingly incorporates several mechanisms to take into account
ARTICLE IN PRESSJ. Molero, A. Garcia / Technovation 28 (2008) 739–757 741
aspects of local markets, such as different tastes, traditions,regulations, etc. This second kind of technological taskusually involves more intensive technological activities(including R&D) and a deeper relationship with localinnovative firms and institutions. In third place they putgovernments’ demands, either as a prerequisite to authorisea direct investment or as a deliberate policy for encoura-ging the externalities of foreign direct investment (FDI)presence.
The first two arguments constitute the core of whatrecent literature classifies as MNEs’ strategies to exploit
home base advantages of the firms, created at home butneeding more and more international exploitation torecover the investment and take full advantage of theirpossibilities. Other authors name this strategy as market
seeking or competence exploiting (Balcet and Evangelista,2005; Cantwell and Molero, 2003; Cantwell and Mudambi,2001; Castellani and Zanfei, 2006; Kuemmerle, 1999;Narula, 2004; Patel and Vega, 1999; Pearce, 1999).
One critical feature of the recent changes formerlyexplained, is the increasing presence of technologicalstrategies more based upon supply factors. Granstrandet al. (1993) mentioned two different kinds of factors.Firstly, the possible existence of lower costs for technolo-gical inputs, including wages of highly trained personnel,or higher productivity of innovative tasks; India is today aperfect example of this case for many information andcommunication technologies (ICT) activities. Secondly, itis the necessity of having access to a broad range ofknowledge and skills, needed for the current innovativeprocesses. By performing these other strategies, MNEs canincrease home-based advantages (Kuemmerle, 1999); otherways of referring to the same process is to call it asset
seeking or competence seeking strategies.There are other nuances to add to those general factors.
Thus, the evolutionary theory of innovation has underlineda number of features which must be considered inanalysing the internationalisation of innovation; in otherwords, conditions for technology internationalisationdepend not only on sectoral, regional or country char-acteristics, but also on intrinsic features of R&D and firms(Meyer-Krahmer and Reguer, 2000; Patel and Pavitt, 1992;Von Zedtwitz and Gassman, 2005). In line with thisargument, an outstanding feature has to do with the tacitand sticky character of technological knowledge, whichmeans for its appropriation it is necessary to be near to itand to catch it through direct interchange and experience(Cantwell and Mudambi, 2001). To be able to obtain thepositive effects of local advantages, subsidiaries frequentlyhave to specialise their activity in technological fieldssimilar to dominant ones in local specialisation (Cantwelland Glac, 2004; Cantwell and Molero, 2003).
Although there are different situations, it is by no meansrare to find examples in which MNEs still concentrate thecentral elements of their technological competence in thecountry of origin, while most of their decentralisation hasto do with other complementary, albeit very important,
knowledge and skills (Cantwell and Glac, 2004; Cantwelland Molero, 2003). A very specific case arises when we faceexamples of world mandates; subsidiaries which receive themandate for creating world competencies in a specific area;in these cases, a combination of firms and local advantagesis needed to create a virtuous circle which reinforces thatmandate for the subsidiary; among local attracting factorsthe literature gives especial importance to the availabilityof qualified human resources and research infrastructures(Cantwell and Molero, 2003; Castellani and Zanfei, 2006;Pearce, 1999; Simoes, 2003).
2.1.2. Attracting factors
From the point of view of hosting countries, the mainissue to debate is about the capacity they have to attractthat new wave of MNEs’ technological activities. As ageneral approach we must take into consideration the factthat decentralisation of R&D and innovative activities ishighly concentrated in few countries, so far belonging tothe triadic countries although recent trends show theincreasing presence of some less developed countries(LDCs); examples can be found in Asia (China and Indiaas paradigmatic cases) or in Eastern Europe (UNCTAD,2005).As far as HBE (home base exploiting—market or
competence exploiting) strategies are concerned, there aremore traditional factors still operating: that is the case ofthe size and growth of the market, favourable legislation,etc. However, it is more relevant for us to explore moredeeply the knowledge of factors stimulating the location ofmore complex technological activities of foreign firms,oriented to a growing HBE (home base augmenting—asset
or competence seeking).In broad terms, two factors have been pointed out as
critical for attracting intensive innovative tasks: theavailability of qualified and abundant human resourcesand the existence of adequate research facilities (Cantwelland Mudambi, 2001; Cantwell and Molero, 2003).Qualified human capital, in turn, refers to education andtraining systems which have interiorised the new demandsof innovative enterprises: flexible curricula with significantcommand of foreign languages, interdisciplinary pro-grammes, continuing education and lifelong trainingamong the most important ones. In this respect Irelandin Europe and India within LDCs are good examples ofpositive influence.Research facilities refer to a complex public-private
structure. The public one has to do with public researchcentres and universities; different studies (Cantwell andIanmarino, 2003; Elder, 2003; European Commission,1998; Khanna and Singh, 2004; Meyer-Krahmer andReguer, 2000) demonstrate that the existence of high-quality basic and academic research is one of the mostdeterminant factors for attracting R&D from non-European MNEs locating their technological activities indifferent European regions. In fact, on analysing the caseof European MNEs migrating to USA it has been shown
ARTICLE IN PRESSJ. Molero, A. Garcia / Technovation 28 (2008) 739–757742
that it is the lack of that type of research—at least inquantity and quality required for the current way ofinnovating—which pushes a significant number of firms tolook for that in the USA. In other words, basic researchplays a renewed role for innovating at the top world level atit is the lack of it in Europe which constitutes a majorhindrance (Dosi et al., 2006; Pavitt, 2001).
Private facilities refer to the existence of a significantnumber of firms carrying out high-technology innovativetasks. The agglomeration effect is behind this issue andrefers to spontaneous and systematic concentration overtime and attracting other players (Cantwell and Molero,2003; European Commission, 1998; Sojvel and Zander,1995). Other works have shown that the higher the level ofdevelopment of national systems of innovation the greateris the integration of MNE R&D and its proximity to HBAtypes of innovative tasks (Cantwell, 2005; Molero, 2002).
2.1.3. Effects on host countries
As previously explained, most available research hasconsidered either less developed countries, where thehypothesis of MNEs superiority can be reasonablysustained, or highly developed countries belonging to the‘‘triadic’’ cluster, where there can be established a relativelybalanced interchange between origin and host economieswith reciprocal effects. Nevertheless, if we move tocountries which in terms of Investment Development Path
can be located in the third or fourth stage (Narula, 1996),available evidence is much less abundant.
Concentrating the attention on technological activities,the situation in most countries can be defined asasymmetric. Certainly, a majority of these economies arenot included among those where MNEs locate a significantactivity of R&D, especially if it is oriented to creating newcompetences and corporate skills. Nevertheless that rela-tively scarcely important R&D represents a crucial portionof domestic technological activity. In dynamic terms thisfactor introduces a non-negligible uncertainty into thefuture of subsidiaries’ R&D; it can grow if domesticattracting conditions evolve in a virtuous direction inwhich the quantity and quality of foreign R&D grows andso does the integration with the domestic system ofinnovation. However, it can also decrease in the event ofthose conditions generating a vicious circle that losesdynamic technological advantages. A reasonable hypoth-esis advanced by Cantwell and Glac (2004) is that MNEfacilities located in intermediate countries will very rarelymodify the basic technological pattern of those firms, albeitthey can contribute significantly to the creation of specificcapabilities enriching complementary skills.
A much less investigated topic of relevance for hostcountries is the crowding out effect MNEs’ activity canproduce on local economies. One related question has todo with mergers and acquisitions (M&A). Although thereis a long tradition of studying different effects of M&A,there is a lack of systematic effort to identify the impact oninnovation, manly if we refer to cross-border M&A.
Recent research has demonstrated that access to technol-ogy is a factor which is behind a growing number of thoseoperations, however, only more recent empirical researchhas directly addressed the impact M&As have ontechnological behaviour and innovation in the resultingcompany (Cassiman et al., 2005). Empirical argumentshave developed, such as the relationship between R&Dscale economies and the increase of R&D (Cohen andLevinthal, 1989) or the influence of rationalisation effort toreduce it (Scherer, 1984). To generalise the post-M&Aactivity is so difficult to a great extent because ofdifferences in previous technological behaviour and cap-abilities of the actors (Seth, 1990), the of post-M&Adynamics and the great difference due to sectoral variety(Anand and Delios, 2002).The former notwithstanding, the specific issue of cross-
border acquisitions has been much less investigated, whilefor us it is the most concrete aspect dealing with MNEimpact on host economies. There are studies which insiston the fact that cross-border M&As have among theirdeterminants the increase in acquiring firms’ technologicalpossibilities (Anand and Delios, 2002; Anand and Kogut,1997; Harzing, 1999), although they do not differentiateclearly between increasing basic capabilities (which corre-spond to HBA strategies) or a broader exploitation ofexisting capabilities. Just a few studies establish conditionsfor the clarification, thus Cantwell and Mudambi (2001)assert that in the case where the resulting company has acompetence creating mandate, the final result probably willbe the increase in R&D expenditures; the opposite wouldhappen where that mandate does not exist at all.Two theoretical discussions can be added: the investiga-
tion about spillovers and the elaboration of taxonomies.Regarding spillovers, there is a wide literature analysingthe extent and sign of effects of inward investment in hosteconomies (Alvarez and Molero, 2005). Insofar as thisresearch does not deal directly with spillovers, we shall justmention a few aspects to bear in mind arising from theconsideration of the technological content of the firms.Particularly interesting is the contraposition of those
arguments in favour of the importance of the technologicalgap between foreign and local enterprises as a source for acatch up dynamic, with others asserting that the higher thedomestic absorptive capacities the higher the expectedbenefits from inward FDI (Blomstrom and Kokko, 1998;Cantwell, 1989; Castellani and Zanfei, 2006; Narula, 2005).In spite of this investigation being carried out at a sectorallevel, some of our findings differentiated by technologicalcategories can throw some collateral light on the spilloverdebate.Precisely due to our categorical perspective, former
taxonomic contributions are of particular interest to makethe diversity of cases comprehensible. From them, we canunderline some especially oriented to better understandingthe relationship with host economies. Just to mention afew, we can distinguish two kinds: one group of casesaccording to the importance of demand and supply
ARTICLE IN PRESSJ. Molero, A. Garcia / Technovation 28 (2008) 739–757 743
pushing factors; thus we can have subsidiaries whichexploit already acquired technological capacities in foreignmarkets as tactical organisation versus those others whichseek new assets to increase group capabilities as a strategicdecision (Cantwell, 2005; Kuemmerle, 1999; Narula, 2003;Pearce, 1999). The interaction with host economies andpolicy implications are significantly different in both cases.The second group consists of typologies which combinepushing factors in origin with attracting ones in destinationeconomies (Meyer-Krahmer and Reguer, 2000; Moleroand Buesa, 1993; Patel and Vega, 1999). This way ofclassifying subsidiaries gives more importance to theproximity to local economies and absorptive capabilities,making for a deeper insight into the probable impact.
2.2. Some complementary evidence to start from
As said before, there is not much research takingintermediate countries as case studies. However, amongthe latest available literature we can find some results toframe our own research. Thus, some studies focus attentionon the quantification of the phenomena of technologycreation decentralisation and to do so, they basically useinformation of R&D and patenting activities. The former istoday easier to follow thanks to the AFA/FATS databasecreated by OECD about MNC R&D activities in thirdcountries. Also with the same information we can observethe importance of MNE R&D activity in many developedand Eastern European manufacturing systems.
There is a longer tradition in using patents of the largestmultinational groups (MNGs) to measure innovationdecentralisation (Archibugi and Michie, 1995; Cantwelland Janne, 1999; Patel, 1995; Patel and Pavitt, 1991).A brief summary of their findings can be made on thefollowing points: In spite of being a growing process,technology creation internationalisation has not achievedsuch a development as to eliminate the central role ofmother houses’ countries of origin. European enterpriseshave a more international R&D than their American andJapanese counterparts; furthermore, in some small Eur-opean countries and the UK their MNEs create as muchtechnology outside as inside. Countries selected tolocate outsourced R&D are highly developed ones withimportant levels of innovative activities; some authors callit ‘‘triadisation’’ instead of globalisation (Patel, 1995),although the former reference to the arising of new actorsfrom LDCs has to be considered here (UNCTAD, 2005).
Recent research confirms some findings regarding therelation MNEs have with local economies. Both indeveloping countries such as India or in developed onessuch as Belgium, R&D activity carried out by MNEs islikely to happen in sectors in which host economies showtechnological advantages and human capital (Cincerra,2005; Kumman and Aggarwald, 2005; Teirlinck, 2005). Asfar as the quality of the research is concerned, home base
augmenting strategies confirm their superior integrationwith domestic firms and institutions in Germany (Molero,
2002). This strategy is carried out preferably in sectors inwhich host economies have technological advantages(Balcet and Evangelista, 2005). An interesting comparisonwith local firms has been for the Netherlands, distinguish-ing between ‘‘real innovation’’ (when products or processesare new to the market) from ‘‘imitation’’ (when theinnovation consists of a new product or process for thefirm); in both cases foreign subsidiaries are more activethan local non-innovative ones, but the comparison withlocal innovative firms shows a less clear differentiation(Sadowsky and Sadowski-Rasters, 2006).Summing up the available knowledge and adding the
results of previous research on the Spanish situation(Molero, 2000, 2002), we can expect that innovativeactivity of MNEs in this country will respond to thefollowing research guidelines:
1.
More than an extreme separated case, their behaviourwill have a considerable number of similarities with thedomestic firms. A great number of differences arising ina first comparison with domestic companies are due tostructural factors, such as the fact of belonging to agroup, size and sectoral distribution. In fact, combining‘‘size’’ and ‘‘belonging to a group’’ characteristics wecan assume MNEs are more likely to efficiently combineinner and outer sources of knowledge.2.
Looking at the individual behaviour, we expect that interms of resources and results in a broad sense, MNEsubsidiaries would show higher parameters, particularlyin more technology-intensive sectors. Nevertheless,when we consider ‘‘belonging to a group’’ as a signalof network organisation, it can be expected thatdifferences are more clearly manifested between inde-pendent companies (ICs) and those belonging to agroup, regardless of the nationality of the mother house.However, other signs of integration with local firms andinstitutions would be weaker for foreign MNEs.3.
The interaction with local firms and institutions will begreater in those sectors in which the Spanish economyhas reached a particular level of technological speciali-sation in the international scenario. If, according tosome literature, intermediate countries can offer com-plementary technological inputs to enrich the centralinnovative capacities of MNEs, we expect this will bemore likely to happen in those sectors.2.3. General description of MNEs’ position in Spanish
innovative activity
Although the antecedents of the presence of foreign firmin the Spanish industrialisation process go back to the mid-XIX century, in a modern meaning it was the 1960s whenwe witnessed a fast entrance growth, after the liberalisationof the formerly very restricted Spanish legislation in 1959(Molero, 2005). Attracting factors in that period were thoseclassically corresponding to the second and third stages ofthe Investment Development Path described by Dunning
ARTICLE IN PRESSJ. Molero, A. Garcia / Technovation 28 (2008) 739–757744
and Narula (1996): important growth rates of the domesticmarket (combined with already existing barriers to trade),low local costs (mostly wages), favourable legislation forrepatriation of profits and absence of industrial conflicts(as a consequence of the ruling dictatorship).
After a period of relative stagnation of incoming FDI inthe 1970s, deriving from the international economic crisisand the Spanish political transition, the 1980s and 1990switnessed a period of very fast growth of inward FDI,equally pushed by the entry of Spain into the EuropeanCommunity. This new wave meant qualitative changes aswell. Among the most significant we can mention the newstrategies of MNEs with regard to international marketsand the dominant role of services. More recently, newfactors came into play as is the case of the growing numberof delocalisation decisions.
The overall balance of that process reflects a remarkableposition of FDI in many economic sectors, particularly inmedium-high- and high-technological manufacturing ones(Alvarez and Molero, 2005). The last available data fromthe Encuesta de Estrategias Empresariales (EntrepreneurialStrategies Survey), corresponding to 2001, allow us give ageneral picture of the situation:
�
Ta
Sel
Sec
To
Ma
Ser
Fo
Tex
Pap
Ch
Pha
Ru
Me
Ele
Offi
Ele
Ele
Mo
Oth
Oth
Sou
The number of firms with a majority of foreign capitalreaches 41.1% of all companies over 200 of employees.
� In the group of less than 200 employees the presence ismuch lower: 8.6%.
� There is also a non-negligible proportion of firms with aforeign share below 50%.
� Sectors with the most remarkable foreign presenceare: chemicals, rubber and plastics, vehicles, electrical
ble 1
ected indicators of the presence of MNEs in the Spanish Innovative System
tor Innovative MNEs (2004)
Number % Ov
innov
tal 2170 4.24
nufacturing 971 5.87
vices 1185 4.99
od beverages and tobacco 94 4.63
tiles 19 2.48
er and paper products 29 7.99
emicals 169 17.86
rmaceuticals 46 29.49
bber and plastics 115 14.90
chanical machinery and equipment 148 9.54
ctrical machinery 46 10.65
ce machinery and computers 5 18.52
ctronic equipment 27 14.59
ctronic components 13 14.77
tor vehicles 86 19.91
er transport material 18 6.79
er transport equipment 12 18.18
rce: Spanish Innovation Survey (2004) and Spanish R&D Statistics (2005).
machinery and electronics and other transport material.On the contrary in most traditional manufactures theweight of foreign firms is much lower with somesignificant exceptions such as food and beverages,furniture and paper and paper products.
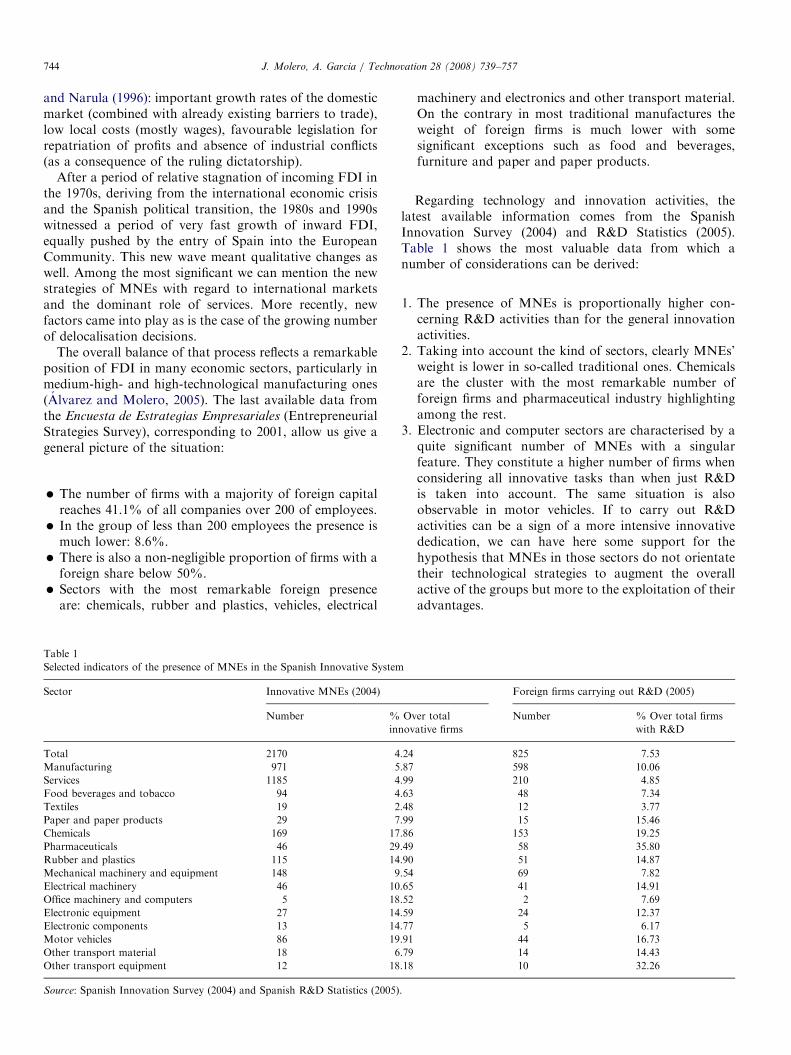
Regarding technology and innovation activities, thelatest available information comes from the SpanishInnovation Survey (2004) and R&D Statistics (2005).Table 1 shows the most valuable data from which anumber of considerations can be derived:
1.
The presence of MNEs is proportionally higher con-cerning R&D activities than for the general innovationactivities.2.
Taking into account the kind of sectors, clearly MNEs’weight is lower in so-called traditional ones. Chemicalsare the cluster with the most remarkable number offoreign firms and pharmaceutical industry highlightingamong the rest.3.
Electronic and computer sectors are characterised by aquite significant number of MNEs with a singularfeature. They constitute a higher number of firms whenconsidering all innovative tasks than when just R&Dis taken into account. The same situation is alsoobservable in motor vehicles. If to carry out R&Dactivities can be a sign of a more intensive innovativededication, we can have here some support for thehypothesis that MNEs in those sectors do not orientatetheir technological strategies to augment the overallactive of the groups but more to the exploitation of theiradvantages.Foreign firms carrying out R&D (2005)
er total
ative firms
Number % Over total firms
with R&D
825 7.53
598 10.06
210 4.85
48 7.34
12 3.77
15 15.46
153 19.25
58 35.80
51 14.87
69 7.82
41 14.91
2 7.69
24 12.37
5 6.17
44 16.73
14 14.43
10 32.26
ARTICLE IN PRESSJ. Molero, A. Garcia / Technovation 28 (2008) 739–757 745
4.
For other transport material and equipment and part ofmachinery, the situation is the opposite: MNEs are morerepresented as far as R&D is concerned.With the necessary caution, we can suggest the followinghypothesis to understand MNEs behaviour: in sectors inwhich Spanish manufacturing has technology advantages(see next section), as is the case of several machinery,chemicals and many traditional sectors, MNEs tend to beproportionally more active in R&D, suggesting someorientation to the exploitation of local capabilities andassets; moreover this activity contributes to reinforceSpanish international specialisation. On the contrary, insectors with technological disadvantages, MNEs behave ina more passive way, developing fewer R&D tasks, and donot constitute a source for the positive modification of theinternational position of those cases.
To finish this summary we have to mention theinformation gathered by OECD in the AFA database.According to the latest available data Spain is one of theWest European countries in which the R&D activity ofMNEs has a heavy weight in all national R&D activity(42.6%): it is only in Ireland where they have a heavierpresence. Interestingly enough, in the decade 1985–1996that percentage decreased a little, as was the case ofAustralia and Canada. In the rest of Western countries,MNEs increased their participation in domestic R&Defforts.
3. Statistical data and methodology
To carry out the investigation, we had the advantage ofthe recent availability of micro- (anonymous) data of theSpanish Innovation Survey 2003; it is called the PITECpanel (Panel de Innovacion Tecnologica, see: www.techno-ciencia.es). Due to the manipulation of the original surveydata, the information of this panel cannot be compared inabsolute terms with data directly derived from theinnovation survey used in the former section. These dataare of a great statistic validity insofar as an expert groupcoordinated by the Spanish National Statistics Institutehas, on the one hand, drawn up a permanent sample offirms with the intention of creating a stable panel ofdata and, on the other, it has controlled the statisticalsignificance of the anonymous data vis-a-vis the originalmicro-data. This information allows us to separate firmsaccording to their independent feature (ICs) or belongingto a group, including the country of origin of themotherhouse of the cluster. If the headquarters is locatedin Spain, we can assume most of them can be expected tobehave as Spanish multinationals, following some interna-tional literature (Balcet and Evangelista, 2005). Never-theless, as it is not possible to confirm this multinationalcharacter of the group we shall call them ‘‘national groups(NGs)’’ versus ‘‘multinational groups (MNGs)’’. Using theoriginal variables of the panel we have calculated someadditional ones that are listed in Table A1 of Appendix A.
After these calculi, we work with variables listed in TableB2 of Appendix B.Furthermore, we can also group companies in different
categories of sectors. To this end we have developed ataxonomy of sectors coming from the systematic compar-ison both of RTAs of each sector of activity and itspercentage evolution rate between two periods 1993–1998and 1999–2003 using data of patents granted by theUSPTO by priority year at the national level by sector ofeconomic activity (NACE class derived through concor-dance with International Patent Classification). RTAs fora sector of a country is calculated as follows: RTAij ¼
(Pij/Pwj)/(PTi/PTw) where i is the country, j the sector, w theworld total for j sector, T is the total of the country and Tw
is the absolute world total. All referred to a period of time.We thus have two classification axes, the vertical onefor RTA (upper) or disadvantage (lower) and anotherfor worldwide evolution (positive to the right-hand sideand negative to the left one); for technical details, seeAppendix A). A note of caution has to be introduced inthese types of classifications because it is not the same to befar from the crossing point of the two axes than to be nearit. However, we understand it is valid for a first approach,irrespectively the possibility of further qualifications.This exercise allows us to classify each NACE sector in
one of the following four categories: Sector Type 1, withRTA advantages in dynamic sectors, named as ‘‘Dynamic
specialisation’’; it is the best of the cases insofar as thespecialisation of the Spanish economy fits perfectly withthe international technological dynamic. Sector Type 2,with RTA disadvantages in sectors in retreat, named as‘‘Retreat’’; it is a residual case also with positive aspects.Sector Type 3, with RTA disadvantages in dynamicsectors, named as ‘‘Lost opportunity’’. It is the worstpossibility because the Spanish economy has not been ableto adapt to the international dynamism. Finally, SectorType 4 includes RTA advantages in sectors in retreat,named as ‘‘Stationary specialisation’’; this also reflects aless favourable position insofar as it shows the Spanishspecialisation is produced in internationally less dynamicsectors. Classification of PITEC sectoral definition isshown in Table B3 of Appendix B.Our research method is based on the systematic
comparison of the innovative behaviour of foreign andnational firms, distinguishing within nationals two clusters:ICs and domestic enterprises which are members of agroup (NGs); this allows us to evaluate the differentiatedimpact on the Spanish Innovation System of foreignenterprises as compared to domestic ones.The method proposed is the following: the first stage will
consist of a systematic comparison of the groups from asimple exploratory perspective to throw light upon someimportant aspects of the comparison in order to guidefurther steps. This exploratory phase will be tackled thoughthe analysis of the distribution of a number of variablesamong the three categories of firms: MNGs, NGs and ICs.The aim is to cast light on some differences, which can
ARTICLE IN PRESS
Table 2
Direct comparisons of the three groups of firms
Compared variables Significant w2 MNGs versus ICs MNGs versus NGs
Sectoral taxonomy Yes More at lost opportunities and stationary specialisation
Innovation inside the firm Yes More
Innovation in cooperation Yes More Less
Types of innovation No
New product to the market No
Inner R&D Yes Less
External R&D expenditures Yes More Less
Expenditures in machines and equipment Yes More Less
External knowledge purchasing Yes More Less
Training expenditures Yes More Less
Expenditures for introducing innovations Yes Less
Carrying out cooperation Yes More Less
Coop with other group firms Yes More
Coop with clients Yes More Less
Coop with suppliers Yes Less
Coop with competitors Yes More Less
Coop with consultants Yes More Less
Coop with R&D firms Yes More Less
Coop with universities Yes More Less
Coop with public research centres Yes More Less
Coop with technological centres Yes Less
Source: Own elaboration with PITEC data.
J. Molero, A. Garcia / Technovation 28 (2008) 739–757746
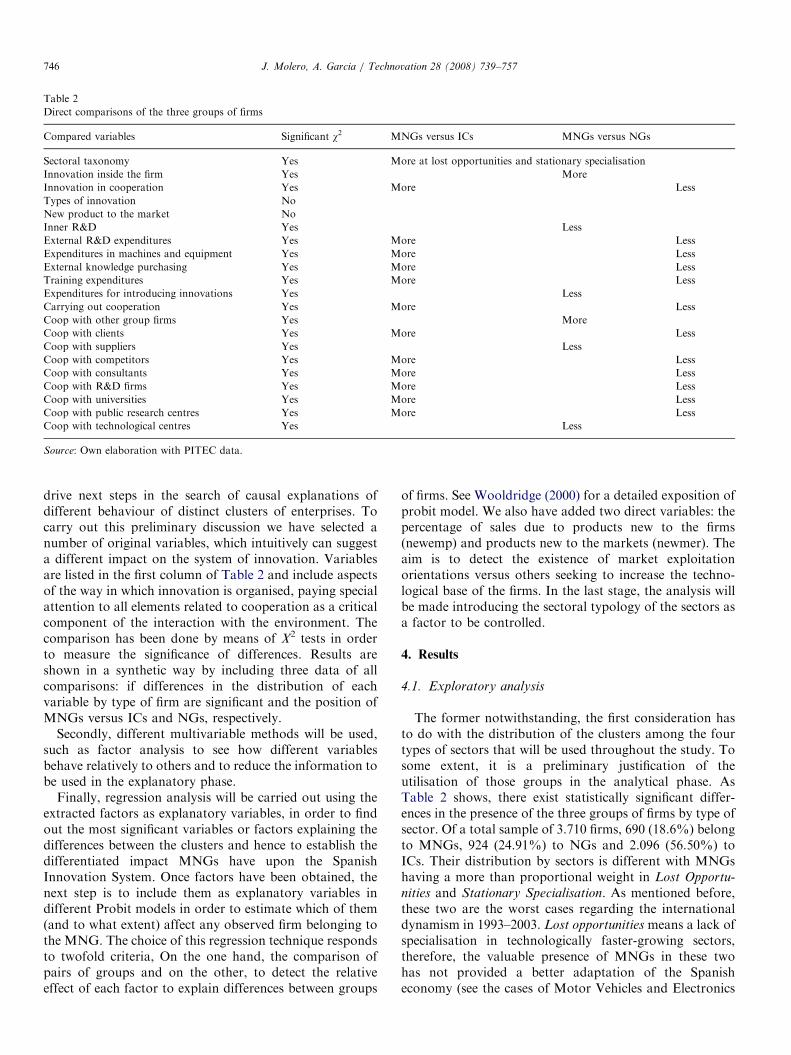
drive next steps in the search of causal explanations ofdifferent behaviour of distinct clusters of enterprises. Tocarry out this preliminary discussion we have selected anumber of original variables, which intuitively can suggesta different impact on the system of innovation. Variablesare listed in the first column of Table 2 and include aspectsof the way in which innovation is organised, paying specialattention to all elements related to cooperation as a criticalcomponent of the interaction with the environment. Thecomparison has been done by means of X2 tests in orderto measure the significance of differences. Results areshown in a synthetic way by including three data of allcomparisons: if differences in the distribution of eachvariable by type of firm are significant and the position ofMNGs versus ICs and NGs, respectively.
Secondly, different multivariable methods will be used,such as factor analysis to see how different variablesbehave relatively to others and to reduce the information tobe used in the explanatory phase.
Finally, regression analysis will be carried out using theextracted factors as explanatory variables, in order to findout the most significant variables or factors explaining thedifferences between the clusters and hence to establish thedifferentiated impact MNGs have upon the SpanishInnovation System. Once factors have been obtained, thenext step is to include them as explanatory variables indifferent Probit models in order to estimate which of them(and to what extent) affect any observed firm belonging tothe MNG. The choice of this regression technique respondsto twofold criteria, On the one hand, the comparison ofpairs of groups and on the other, to detect the relativeeffect of each factor to explain differences between groups
of firms. See Wooldridge (2000) for a detailed exposition ofprobit model. We also have added two direct variables: thepercentage of sales due to products new to the firms(newemp) and products new to the markets (newmer). Theaim is to detect the existence of market exploitationorientations versus others seeking to increase the techno-logical base of the firms. In the last stage, the analysis willbe made introducing the sectoral typology of the sectors asa factor to be controlled.
4. Results
4.1. Exploratory analysis
The former notwithstanding, the first consideration hasto do with the distribution of the clusters among the fourtypes of sectors that will be used throughout the study. Tosome extent, it is a preliminary justification of theutilisation of those groups in the analytical phase. AsTable 2 shows, there exist statistically significant differ-ences in the presence of the three groups of firms by type ofsector. Of a total sample of 3.710 firms, 690 (18.6%) belongto MNGs, 924 (24.91%) to NGs and 2.096 (56.50%) toICs. Their distribution by sectors is different with MNGshaving a more than proportional weight in Lost Opportu-
nities and Stationary Specialisation. As mentioned before,these two are the worst cases regarding the internationaldynamism in 1993–2003. Lost opportunities means a lack ofspecialisation in technologically faster-growing sectors,therefore, the valuable presence of MNGs in these twohas not provided a better adaptation of the Spanisheconomy (see the cases of Motor Vehicles and Electronics
ARTICLE IN PRESSJ. Molero, A. Garcia / Technovation 28 (2008) 739–757 747
mentioned above). The relevant presence of MNGs inStationary Specialisation sectors means they have takenadvantage of the local strengths irrespective of the worldsituation, probably driven by local opportunities andcapabilities (chemicals and most traditional sectors canbe examples).
The next group of comparisons refers to several variablesregarding inner versus outer innovative activities. As ageneral rule we can underline the fact that MNGs tend tocarry out more activities with external institutions andincorporate more outer sources of knowledge than ICs.Nevertheless, they tend to perform those activities to alesser extent than NGs; in other words, the descriptiveanalysis points to a higher interaction with the nationalsystems than ICs and a lower one than NGs.
To delve deeper into this topic a number of comparisonshave been calculated for all kinds of cooperative activities.The findings are quite clear: both for the general issue ofcooperation and for most of its types, MNGs are moreactive than ICs and less than NGs. The only exceptions arecooperation with suppliers and technological centres–inboth cases MNGs cooperate less than ICs and NGs- andcooperation with other firms of the group that show higherperformances of MNGs than the two types of nationalcompanies.
4.2. Factor analysis
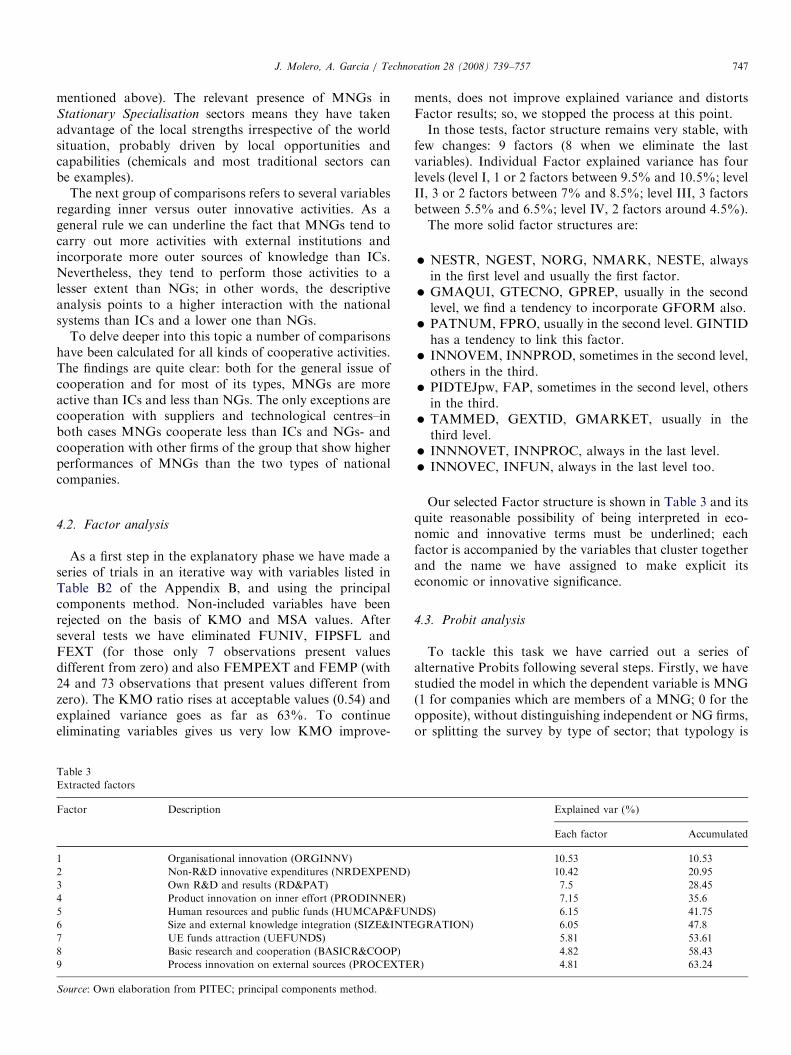
As a first step in the explanatory phase we have made aseries of trials in an iterative way with variables listed inTable B2 of the Appendix B, and using the principalcomponents method. Non-included variables have beenrejected on the basis of KMO and MSA values. Afterseveral tests we have eliminated FUNIV, FIPSFL andFEXT (for those only 7 observations present valuesdifferent from zero) and also FEMPEXT and FEMP (with24 and 73 observations that present values different fromzero). The KMO ratio rises at acceptable values (0.54) andexplained variance goes as far as 63%. To continueeliminating variables gives us very low KMO improve-
Table 3
Extracted factors
Factor Description
1 Organisational innovation (ORGINNV)
2 Non-R&D innovative expenditures (NRDEXPEND)
3 Own R&D and results (RD&PAT)
4 Product innovation on inner effort (PRODINNER)
5 Human resources and public funds (HUMCAP&FUN
6 Size and external knowledge integration (SIZE&INTE
7 UE funds attraction (UEFUNDS)
8 Basic research and cooperation (BASICR&COOP)
9 Process innovation on external sources (PROCEXTE
Source: Own elaboration from PITEC; principal components method.
ments, does not improve explained variance and distortsFactor results; so, we stopped the process at this point.In those tests, factor structure remains very stable, with
few changes: 9 factors (8 when we eliminate the lastvariables). Individual Factor explained variance has fourlevels (level I, 1 or 2 factors between 9.5% and 10.5%; levelII, 3 or 2 factors between 7% and 8.5%; level III, 3 factorsbetween 5.5% and 6.5%; level IV, 2 factors around 4.5%).The more solid factor structures are:
�
DS
GR
R)
NESTR, NGEST, NORG, NMARK, NESTE, alwaysin the first level and usually the first factor.
� GMAQUI, GTECNO, GPREP, usually in the secondlevel, we find a tendency to incorporate GFORM also.
� PATNUM, FPRO, usually in the second level. GINTIDhas a tendency to link this factor.
� INNOVEM, INNPROD, sometimes in the second level,others in the third.
� PIDTEJpw, FAP, sometimes in the second level, othersin the third.
� TAMMED, GEXTID, GMARKET, usually in thethird level.
� INNNOVET, INNPROC, always in the last level. � INNOVEC, INFUN, always in the last level too.Our selected Factor structure is shown in Table 3 and itsquite reasonable possibility of being interpreted in eco-nomic and innovative terms must be underlined; eachfactor is accompanied by the variables that cluster togetherand the name we have assigned to make explicit itseconomic or innovative significance.
4.3. Probit analysis
To tackle this task we have carried out a series ofalternative Probits following several steps. Firstly, we havestudied the model in which the dependent variable is MNG(1 for companies which are members of a MNG; 0 for theopposite), without distinguishing independent or NG firms,or splitting the survey by type of sector; that typology is
Explained var (%)
Each factor Accumulated
10.53 10.53
10.42 20.95
7.5 28.45
7.15 35.6
) 6.15 41.75
ATION) 6.05 47.8
5.81 53.61
4.82 58.43
4.81 63.24
ARTICLE IN PRESSJ. Molero, A. Garcia / Technovation 28 (2008) 739–757748
introduced as a potentially explanatory variable. After-wards we have repeated the analysis splitting the survey bysectors, which implies their elimination as an explanatoryvariable.
With the intention of checking whether differences growor decrease depending on the alternative consideration ofICs or firms belonging to a NGs, all former analysis hasbeen made by controlling the sample to eliminate from itfirms of each of the two categories respectively. Lastly, forsimplification, we show just the results of the estimationsafter filtering the sample through those firms who manageto carry out innovations effectively (sample filtered byinnosuc). However, we have repeated the analysis filteringthe sample by firms who perform innovative activities,regardless of whether they implement them (sample filteredby innove).
The correct interpretation of the next tables has to bear inmind the way we have built our models. A high value ofMcFadden R2 points to the existence of great differencesbetween the compared pairs; these differences would be basedon factors directly related to innovative activities of bothclusters of firms. On the contrary, low values of McFaddenR2 would mean the potential differences between groupsdepend upon other factors distinct from those extracted; aswe shall see, on many occasions, it is the case of structuralvariables such as size or the fact of being member of a group.As far as coefficients are concerned, we do not calculatepossible marginal effects but we centre the attention on theirsign and relative magnitude. Through this method we detectwhich factors increase or decrease the probability that we are
Table 4
MNG versus other kinds of firms (analysis for the whole sample)
Dependent variable: MNG
Method: ML—Binary
probit
(QHC) (BHH
Sample: 1 3710 IF INNOSUCC ¼ 1 INNO
2816 2152
Variable Coefficient Prob. Coeffi
C �0.791478 0.0000 �0.46
BASICR_COOP
HUMCAP_FUNDS �0.142766 0.0000
NRDEXPEND 0.156883 0.0001 1.23
ORGINNV 0.07
PROCEXTER 0.07
PRODINNER
RD_PAT 0.116444 0.0000 0.76
SIZE_INTEGR 0.217491 0.0000 0.93
UEFUNDS 0.099692 0.0005 0.77
DYNAMIC �0.226781 0.0017 �0.23
LOST_OPP
RETREAT �0.389816 0.0002 �0.33
NEWEMP �0.003055 0.0020 �0.00
NEWMER
McFadden R2 0.066929 0.21
Probability (LR stat) 0.000000 0.00
Source: Own elaboration.
dealing with an MNG firm and the relative intensity of theinfluence of different significant factors.Generally speaking, we can assert that similarities
predominate over differences because most McFadden R2
has reduced values, although with the remarkable excep-tion of the comparison between MNGs and ICs. Thosesimilarities are higher among firms who implementinnovations effectively (innosuc) because R2 values arelower and the number of significant factors is smaller.These factors have to do more with the size and capacity ofknowledge integration of the firms than with many otherinnovative activities.As was mentioned, the first step is to compare MNG
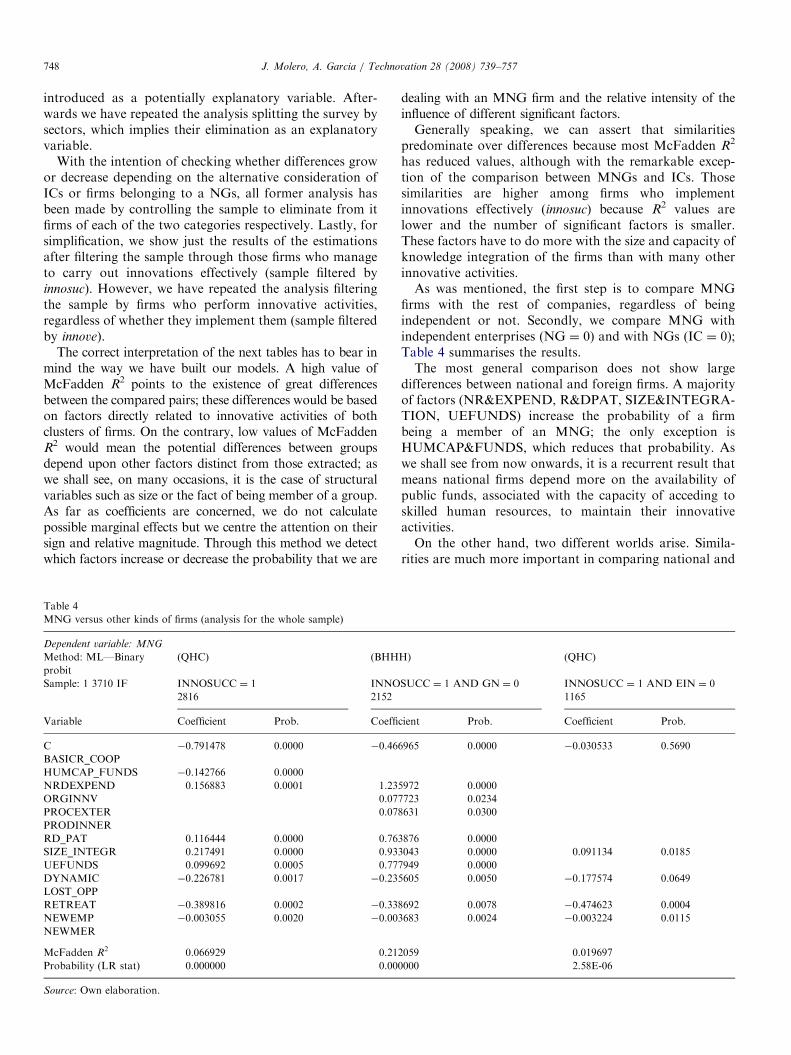
firms with the rest of companies, regardless of beingindependent or not. Secondly, we compare MNG withindependent enterprises (NG ¼ 0) and with NGs (IC ¼ 0);Table 4 summarises the results.The most general comparison does not show large
differences between national and foreign firms. A majorityof factors (NR&EXPEND, R&DPAT, SIZE&INTEGRA-TION, UEFUNDS) increase the probability of a firmbeing a member of an MNG; the only exception isHUMCAP&FUNDS, which reduces that probability. Aswe shall see from now onwards, it is a recurrent result thatmeans national firms depend more on the availability ofpublic funds, associated with the capacity of acceding toskilled human resources, to maintain their innovativeactivities.On the other hand, two different worlds arise. Simila-
rities are much more important in comparing national and
H) (QHC)
SUCC ¼ 1 AND GN ¼ 0 INNOSUCC ¼ 1 AND EIN ¼ 0
1165
cient Prob. Coefficient Prob.
6965 0.0000 �0.030533 0.5690
5972 0.0000
7723 0.0234
8631 0.0300
3876 0.0000
3043 0.0000 0.091134 0.0185
7949 0.0000
5605 0.0050 �0.177574 0.0649
8692 0.0078 �0.474623 0.0004
3683 0.0024 �0.003224 0.0115
2059 0.019697
0000 2.58E-06
ARTICLE IN PRESSJ. Molero, A. Garcia / Technovation 28 (2008) 739–757 749
MNGs: low McFadden R2 and less number of factors.SIZE&INTEGRATION again enhances the probability ofbeing a member of a MNG. On the contrary differencesincrease between ICs and MNGs; most factors aresignificant and generally increase the probability of beinga MNG; McFadden R2 now are up to ten times higher thanin the first comparison. That is to say, lower global valuesare a consequence of the compensation between the higherdifferences with ICs and lower with NGs.
From another perspective, we can assert that size andrelated features of the firms (mainly the capacity forintegrating external knowledge) play a crucial role inexplaining the differences between MNGs and the restof the firms, especially in firms, which effectively implementinnovation. Furthermore some differences arise onincluding in the analysis firms with innovative activities,albeit these differences do not condition the effectivenessof implementing the innovations. This points tostructural differences. However, the fact that newemp hasa negative coefficient (reduces the probability of beingan MNG) indicates that independent firms tend toinnovate more frequently by introducing already existingproducts. Interestingly enough is we find similar valuesof McFadden R2 for the samples filtered by innove
and innosucc, which point to similar differences betweenMNGs and the rest in both cases. On the other hand,significant factors are very similar as well, except thosedirectly related to innovation which usually disappear forinnosucc.
As far as the type of sectors is concerned, given that thereference sector is ‘‘Stationary specialisation’’, the negativesign of the coefficients of those significant ones indicates ahigher presence of MNGs in the reference sector which is
Table 5
MNG versus other kinds of firms (segmented sample by category of sectors)
Dependent variable: MNG
Method: ML—Binary probit (QHC) (QHC)
Sample: 1 3710 IF INNOSUCC ¼ 1 AND
DYNAMIC ¼ 1
INNOSUCC ¼ 1
RETREAT ¼ 1
641 318
Variable Coefficient Prob. Coefficient P
C �1.116322 0.0000 �1.410934 0
BASICR_COOP
HUMCAP_FUNDS �0.595906 0.0000 �0.942977 0
NRDEXPEND
ORGINNV �0.216886 0
PROCEXTER
PRODINNER
RD_PAT 0.250949 0.0164
SIZE_INTEGR 1.086511 0.0000 0.577904 0
UEFUNDS
NEWEMP
NEWMER
McFadden R2 0.10724 0.149648
Probability (LR stat) 0.000000 8.21E-07
Source: Own elaboration.
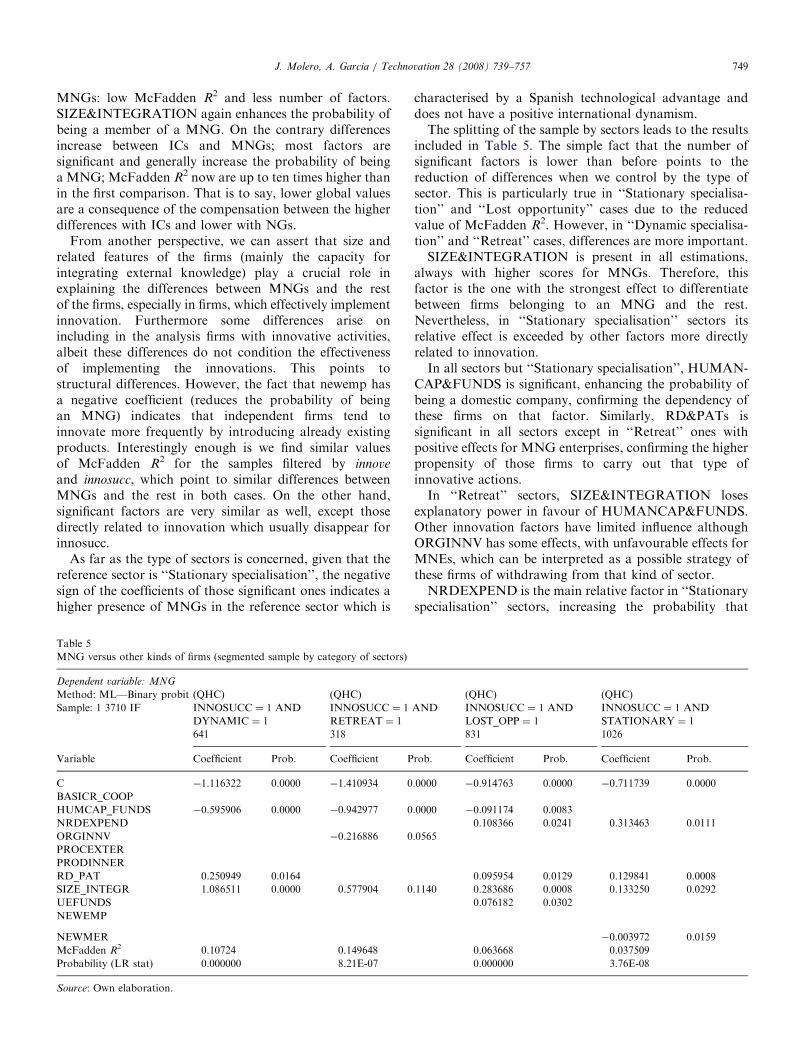
characterised by a Spanish technological advantage anddoes not have a positive international dynamism.The splitting of the sample by sectors leads to the results
included in Table 5. The simple fact that the number ofsignificant factors is lower than before points to thereduction of differences when we control by the type ofsector. This is particularly true in ‘‘Stationary specialisa-tion’’ and ‘‘Lost opportunity’’ cases due to the reducedvalue of McFadden R2. However, in ‘‘Dynamic specialisa-tion’’ and ‘‘Retreat’’ cases, differences are more important.SIZE&INTEGRATION is present in all estimations,
always with higher scores for MNGs. Therefore, thisfactor is the one with the strongest effect to differentiatebetween firms belonging to an MNG and the rest.Nevertheless, in ‘‘Stationary specialisation’’ sectors itsrelative effect is exceeded by other factors more directlyrelated to innovation.In all sectors but ‘‘Stationary specialisation’’, HUMAN-
CAP&FUNDS is significant, enhancing the probability ofbeing a domestic company, confirming the dependency ofthese firms on that factor. Similarly, RD&PATs issignificant in all sectors except in ‘‘Retreat’’ ones withpositive effects for MNG enterprises, confirming the higherpropensity of those firms to carry out that type ofinnovative actions.In ‘‘Retreat’’ sectors, SIZE&INTEGRATION loses
explanatory power in favour of HUMANCAP&FUNDS.Other innovation factors have limited influence althoughORGINNV has some effects, with unfavourable effects forMNEs, which can be interpreted as a possible strategy ofthese firms of withdrawing from that kind of sector.NRDEXPEND is the main relative factor in ‘‘Stationary
specialisation’’ sectors, increasing the probability that
(QHC) (QHC)
AND INNOSUCC ¼ 1 AND
LOST_OPP ¼ 1
INNOSUCC ¼ 1 AND
STATIONARY ¼ 1
831 1026
rob. Coefficient Prob. Coefficient Prob.
.0000 �0.914763 0.0000 �0.711739 0.0000
.0000 �0.091174 0.0083
0.108366 0.0241 0.313463 0.0111
.0565
0.095954 0.0129 0.129841 0.0008
.1140 0.283686 0.0008 0.133250 0.0292
0.076182 0.0302
�0.003972 0.0159
0.063668 0.037509
0.000000 3.76E-08
ARTICLE IN PRESSJ. Molero, A. Garcia / Technovation 28 (2008) 739–757750
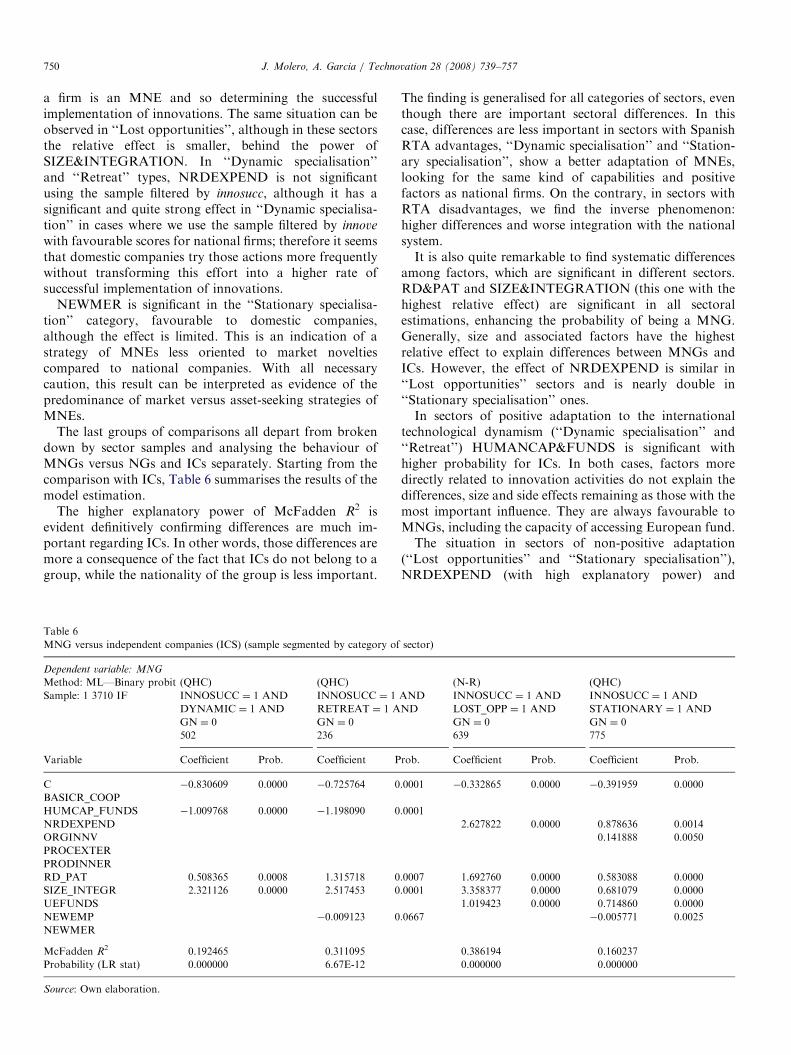
a firm is an MNE and so determining the successfulimplementation of innovations. The same situation can beobserved in ‘‘Lost opportunities’’, although in these sectorsthe relative effect is smaller, behind the power ofSIZE&INTEGRATION. In ‘‘Dynamic specialisation’’and ‘‘Retreat’’ types, NRDEXPEND is not significantusing the sample filtered by innosucc, although it has asignificant and quite strong effect in ‘‘Dynamic specialisa-tion’’ in cases where we use the sample filtered by innove
with favourable scores for national firms; therefore it seemsthat domestic companies try those actions more frequentlywithout transforming this effort into a higher rate ofsuccessful implementation of innovations.
NEWMER is significant in the ‘‘Stationary specialisa-tion’’ category, favourable to domestic companies,although the effect is limited. This is an indication of astrategy of MNEs less oriented to market noveltiescompared to national companies. With all necessarycaution, this result can be interpreted as evidence of thepredominance of market versus asset-seeking strategies ofMNEs.
The last groups of comparisons all depart from brokendown by sector samples and analysing the behaviour ofMNGs versus NGs and ICs separately. Starting from thecomparison with ICs, Table 6 summarises the results of themodel estimation.
The higher explanatory power of McFadden R2 isevident definitively confirming differences are much im-portant regarding ICs. In other words, those differences aremore a consequence of the fact that ICs do not belong to agroup, while the nationality of the group is less important.
Table 6
MNG versus independent companies (ICS) (sample segmented by category of
Dependent variable: MNG
Method: ML—Binary probit (QHC) (QHC)
Sample: 1 3710 IF INNOSUCC ¼ 1 AND
DYNAMIC ¼ 1 AND
GN ¼ 0
INNOSUCC ¼ 1
RETREAT ¼ 1 A
GN ¼ 0
502 236
Variable Coefficient Prob. Coefficient P
C �0.830609 0.0000 �0.725764 0
BASICR_COOP
HUMCAP_FUNDS �1.009768 0.0000 �1.198090 0
NRDEXPEND
ORGINNV
PROCEXTER
PRODINNER
RD_PAT 0.508365 0.0008 1.315718 0
SIZE_INTEGR 2.321126 0.0000 2.517453 0
UEFUNDS
NEWEMP �0.009123 0
NEWMER
McFadden R2 0.192465 0.311095
Probability (LR stat) 0.000000 6.67E-12
Source: Own elaboration.
The finding is generalised for all categories of sectors, eventhough there are important sectoral differences. In thiscase, differences are less important in sectors with SpanishRTA advantages, ‘‘Dynamic specialisation’’ and ‘‘Station-ary specialisation’’, show a better adaptation of MNEs,looking for the same kind of capabilities and positivefactors as national firms. On the contrary, in sectors withRTA disadvantages, we find the inverse phenomenon:higher differences and worse integration with the nationalsystem.It is also quite remarkable to find systematic differences
among factors, which are significant in different sectors.RD&PAT and SIZE&INTEGRATION (this one with thehighest relative effect) are significant in all sectoralestimations, enhancing the probability of being a MNG.Generally, size and associated factors have the highestrelative effect to explain differences between MNGs andICs. However, the effect of NRDEXPEND is similar in‘‘Lost opportunities’’ sectors and is nearly double in‘‘Stationary specialisation’’ ones.In sectors of positive adaptation to the international
technological dynamism (‘‘Dynamic specialisation’’ and‘‘Retreat’’) HUMANCAP&FUNDS is significant withhigher probability for ICs. In both cases, factors moredirectly related to innovation activities do not explain thedifferences, size and side effects remaining as those with themost important influence. They are always favourable toMNGs, including the capacity of accessing European fund.The situation in sectors of non-positive adaptation
(‘‘Lost opportunities’’ and ‘‘Stationary specialisation’’),NRDEXPEND (with high explanatory power) and
sector)
(N-R) (QHC)
AND
ND
INNOSUCC ¼ 1 AND
LOST_OPP ¼ 1 AND
GN ¼ 0
INNOSUCC ¼ 1 AND
STATIONARY ¼ 1 AND
GN ¼ 0
639 775
rob. Coefficient Prob. Coefficient Prob.
.0001 �0.332865 0.0000 �0.391959 0.0000
.0001
2.627822 0.0000 0.878636 0.0014
0.141888 0.0050
.0007 1.692760 0.0000 0.583088 0.0000
.0001 3.358377 0.0000 0.681079 0.0000
1.019423 0.0000 0.714860 0.0000
.0667 �0.005771 0.0025
0.386194 0.160237
0.000000 0.000000
ARTICLE IN PRESS
Table 7
MNG versus national groups (NG) (sample segmented by categories of sector)
Dependent variable: MNG
Method: ML—Binary probit (QHC) (QHC) (QHC) (QHC)
Sample: 1 3710 IF INNOSUCC ¼ 1 AND
DYNAMIC ¼ 1 AND
EIN ¼ 0
INNOSUCC ¼ 1 AND
RETREAT ¼ 1 AND
EIN ¼ 0
INNOSUCC ¼ 1 AND
LOST_OPP ¼ 1 AND
EIN ¼ 0
INNOSUCC ¼ 1 AND
STATIONARY ¼ 1 AND
EIN ¼ 0
225 114 352 474
Variable Coefficient Prob. Coefficient Prob. Coefficient Prob. Coefficient Prob.
C �0.371003 0.0000 �0.756132 0.0000 �0.197679 0.0106
BASICR_COOP
HUMCAP_FUNDS �0.371019 0.0148 �0.631986 0.0054
NRDEXPEND
ORGINNV �0.331722 0.0172
PROCEXTER
PRODINNER 0.242548 0.0252
RD_PAT
SIZE_INTEGR 0.463311 0.0396
UEFUNDS
NEWEMP
NEWMER
McFadden R2 0.041764 0.105255 0.010669 0.018438
Probability(LR stat) 0.002693 0.000806 0.022911 0.357268
Source: Own elaboration.
J. Molero, A. Garcia / Technovation 28 (2008) 739–757 751
UEFUNDS are significant, always favourable to MNGs.In ‘‘Stationary specialisation’’ sectors ORGINNV is alsosignificant. In fact, in the model for ‘‘Stationary specialisa-tion’’, factors related to innovation are over those relatedto the size and favourable to MNGs. The suggestedinterpretation is that the more important innovativeactivities of MNEs in those sectors, maintain and reinforcethe international position of Spanish manufacturing,notwithstanding the lesser international dynamism. More-over, the presence of NEWEMP in these sectors, favour-able to ICs, support the hypothesis that these enterprisesbehave by imitating already existing innovations.
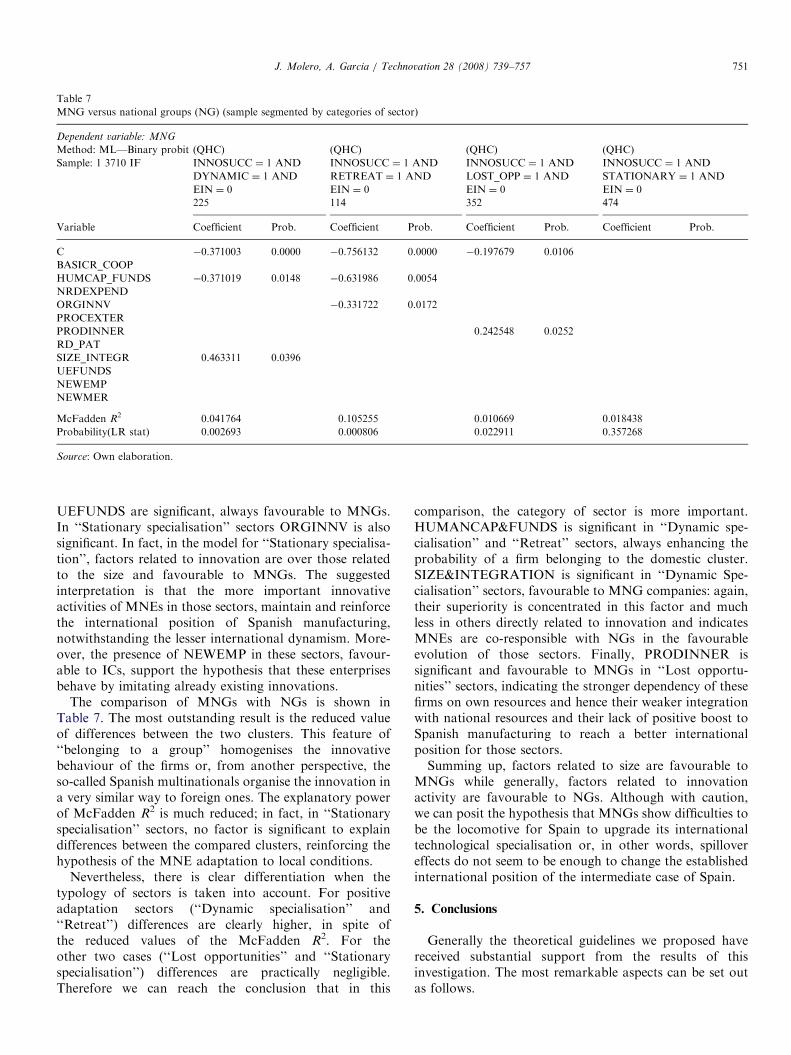
The comparison of MNGs with NGs is shown inTable 7. The most outstanding result is the reduced valueof differences between the two clusters. This feature of‘‘belonging to a group’’ homogenises the innovativebehaviour of the firms or, from another perspective, theso-called Spanish multinationals organise the innovation ina very similar way to foreign ones. The explanatory powerof McFadden R2 is much reduced; in fact, in ‘‘Stationaryspecialisation’’ sectors, no factor is significant to explaindifferences between the compared clusters, reinforcing thehypothesis of the MNE adaptation to local conditions.
Nevertheless, there is clear differentiation when thetypology of sectors is taken into account. For positiveadaptation sectors (‘‘Dynamic specialisation’’ and‘‘Retreat’’) differences are clearly higher, in spite ofthe reduced values of the McFadden R2. For theother two cases (‘‘Lost opportunities’’ and ‘‘Stationaryspecialisation’’) differences are practically negligible.Therefore we can reach the conclusion that in this
comparison, the category of sector is more important.HUMANCAP&FUNDS is significant in ‘‘Dynamic spe-cialisation’’ and ‘‘Retreat’’ sectors, always enhancing theprobability of a firm belonging to the domestic cluster.SIZE&INTEGRATION is significant in ‘‘Dynamic Spe-cialisation’’ sectors, favourable to MNG companies: again,their superiority is concentrated in this factor and muchless in others directly related to innovation and indicatesMNEs are co-responsible with NGs in the favourableevolution of those sectors. Finally, PRODINNER issignificant and favourable to MNGs in ‘‘Lost opportu-nities’’ sectors, indicating the stronger dependency of thesefirms on own resources and hence their weaker integrationwith national resources and their lack of positive boost toSpanish manufacturing to reach a better internationalposition for those sectors.Summing up, factors related to size are favourable to
MNGs while generally, factors related to innovationactivity are favourable to NGs. Although with caution,we can posit the hypothesis that MNGs show difficulties tobe the locomotive for Spain to upgrade its internationaltechnological specialisation or, in other words, spillovereffects do not seem to be enough to change the establishedinternational position of the intermediate case of Spain.
5. Conclusions
Generally the theoretical guidelines we proposed havereceived substantial support from the results of thisinvestigation. The most remarkable aspects can be set outas follows.
ARTICLE IN PRESSJ. Molero, A. Garcia / Technovation 28 (2008) 739–757752
First of all, the idea that MNE subsidiaries shownoticeable coincidences with domestic enterprises in theway those clusters organise their innovative activities,after controlling most important fixed effects, is fullyconfirmed in this investigation. The importance of belong-ing to a group is absolutely clear as a feature, whichdiscriminates sharply between the relationships of thefirms with the system in which they operate and, therefore,the impact they produce. In other words the strongsimilarity existing between ‘‘Spanish multinationals’’(NGs) and ‘‘foreign multinationals’’ (MNGs) can bestated, while differences with regard to independentinnovative domestic companies (ICs) are much moresignificant. Several policy recommendations can be ex-tracted from here: generally speaking we should supportactions in favour of the creation and consolidation ofgroups. That can be carried out through a number ofmeasures such as the promotion of inter firms collabora-tion or the strengthening of clusters and networks ofcompanies. Moreover, it would be also positive toencourage the outward internationalisation of Spanishfirms, including their innovative activities.
As far as factors explaining differences are concerned,the crucial role of size and some aspects related must beunderlined. It is the case of the capability of integratinginner and outer sources of knowledge and the availabilityof human resources and funds. However, factors that haveto do more with the organisation of innovation in a broadsense are less significant to differentiate the possible impactfor the innovation system.
The importance sectoral categories reach in manyestimations validate the taxonomy proposed as a way ofbetter understanding the relationships of MNEs withthe Spanish Innovation System. Among the results wecan underline the following: on comparing MNGs withICs, sector qualifies the intensity of the differencesaccording to RTAs the differences being less where positiveadvantages exist and the adaptation of MNEs to thesystem is higher. In ‘‘Stationary specialisation’’ sectors (bythe way the most important for the Spanish economy inabsolute terms) differences are much smaller and evendisappear when the comparison is made with NGs.Differences increase substantially in sectors with technolo-gical disadvantages.
Independent firms tend to innovate more often throughthe adoption of already existing products and processes,especially in ‘‘Stationary specialisation’’ sectors. MNEsmaintain an adaptive behaviour; with a closer integrationin sectors with technological advantages. If we add theevidence obtained in Table 1, in which MNEs show a lesserR&D presence in these sectors, as compared with theirgeneral innovative presence, the ‘‘passive’’ role of theiractivity can be suggested as a cause of the difficulties ofSpanish manufacturing in creating technological advan-tages in some of the most internationally dynamic sectors.
With all those considerations in mind, we can assert thatit is not reasonable to expect MNEs strategies will
substantially change the Spanish technological internatio-nalisation pattern in the short run; actually they are coresponsible for the present situation in close collaborationwith local enterprises. Differences in the work have notbeen enough to push crucial sectors to a better interna-tional position, from ‘‘Lost opportunities’’ to ‘‘Dynamicspecialisation’’. In spite of the proven fact that absolutepresence of MNEs has contributed positively to modify theproductive pattern of Spanish manufacturing (Molero,2005) it does not seem to be the case for technologicalinnovation specialisation.To a great extent this can be underlined as a
representative feature of the so-called intermediatecountries. In spite of their relative capacity for attractingFDI, just in few cases the innovative activity MNEscarry out is oriented to the substantial modificationof the strategic competitive position. As we saw, it is afact that the integration of MNEs with the nationalssystem is worse in sectors with negative RTAs, andtherefore the influence to modify the international positionof sectors named as ‘‘lost opportunities’’ is reducedor null; this is a passive adaptation. To change thissituation, Spain (and more generally other intermediatecountries) can orientate some policy measures in thefollowing direction.First, to increase national capabilities by, for example,
upgrading of University research and training capacitiesor fostering the consolidation of new RTAs that inthe Spanish case can be around new energy sourcesand some biotech industries. Second, changing themandate of the attraction policy from quantity (moreFDI), to quality (higher R&D activities). This can bedone through different instruments such as the stimulationof more active participation of MNEs in national andregional R&D&I programmes. Thirdly, by upgradingthe technological and competitive level of national SMEs;this will allow them to participate in a more profitable wayin MNEs activities and subcontracts; furthermore it canhelp also to eliminate one of the causes of recentdelocalisation decisions, precisely based on the lack ofqualified domestic suppliers. As a complementary recom-mendation, policies oriented to increase the participationof SMEs in networks and international programmes wouldbe welcome.
Acknowledgments
This paper is a result of the European Project Inequality,
mechanism, effects and policies [INEQ] (CIT5-029093).Preliminary versions of this paper have been presented totwo international congresses after being selected by thereferees: ‘‘SPRU 40th Anniversary Conference: The Futureof Science, Technology and Innovation Policy’’, 11–13September 2006 and ‘‘Four decades of InternationalBusiness at Reading’’, 16–17 April 2007. Our thanks toall participants in the debates for their criticisms and
ARTICLE IN PRESSJ. Molero, A. Garcia / Technovation 28 (2008) 739–757 753
comments. We acknowledge to Professor Barry Readmanfrom the Universidad Complutense de Madrid for a fulllinguistic revision of our final version of this work.
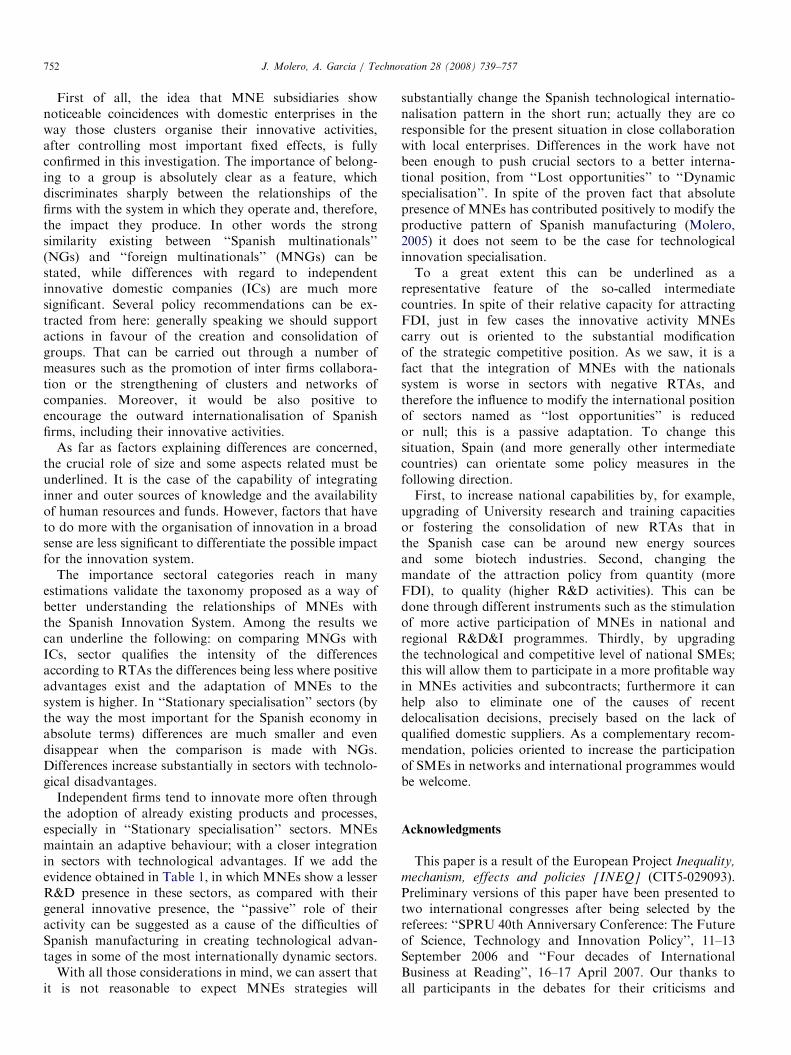
Appendix A. Sectoral classification
Two criteria have been combined: the position of thesector in the Spanish economy according to its RTA andthe international dynamism of the sector in terms of itspercentage in world total patents. The source has been theUS patent office and the period selected 1993–2003, dividedinto two sub-periods. 1993–1998 and 1999–2003. Patentshave been obtained at two-digit level of NACE classifica-tion as provided by Eurostat. RTA has been calculated forthe sub-period 1999–2003 while the technological dyna-mism of the sectors has been estimated through thedifference between the percentages each sector has in total
Table A1
Sectoral classification
Lost opportunities sectors
Tanning, dressing of leather; manufacture of luggage
Manufacture of fabricated metal products, except machinery and equipment
Manufacture of office machinery and computers
Manufacture of electric motors, generators and transformers
Manufacture of accumulators, primary cells and primary batteries
Manufacture of lighting equipment and electric lamps
Manufacture of electrical equipment n.e.c.
Manufacture of electronic valves and tubes and other electronic components
Manufacture of television and radio transmitters and apparatus for line teleph
and line telegraphy
Manufacture of television and radio receivers, sound or video recording or
reproducing apparatus and associated goods
Manufacture of industrial process control equipment
Manufacture of optical instruments, photographic equipment
Manufacture of watches and clocks
Manufacture of motor vehicles, trailers and semi-trailers
Manufacture of other transport equipment
Manufacture of furniture; manufacturing n.e.c.
Retreat sectors
Manufacture of tobacco products
Manufacture of wood and of products of wood and cork, except furniture;
manufacture of articles of straw and plaiting materials
Manufacture of other non-metallic mineral products
Manufacture of medical and surgical equipment and orthopaedic appliances
Manufacture of instruments and appliances for measuring, checking, testing,
navigating and other purposes, except industrial process control equipment
Source: Own elaboration.
patents in the second period compared with the samepercentage in the first one.Combining the two criteria we arrive at a typology with
four cases: (1) sectors with RTA 41 and an increase of itspercentage in world patents between the two periods(Dynamic Specialisation); (2) sectors with RTAo1 anda decreasing participation in total patenting (Retreat);(3) sectors with RTA 41 and a decreasing participation inworld technological dynamism (Stationary Specialisation)and (4) sectors with RTAo1 and an increasing participa-tion in total patents (Lost Opportunities) (see Table A1).
Appendix B
Calculated variables, variables, correspondences ofPITEC sectoral classification and RTA-dynamism sectoraltypology are presented in Tables B1–B3, respectively.
Dynamic specialisation sectors
Manufacture of textiles
Manufacture of wearing apparel; dressing; dyeing of fur
Manufacture of basic metals
Manufacture of machinery for the production and use of
mechanical power, except aircraft, vehicle and cycle engines
Manufacture of other general purpose machinery
Manufacture of agricultural and forestry machinery
Manufacture of machine-tools (split into DK2941, DK2942 and
DK2943 in NACE Rev.1.1)
Manufacture of other special purpose machinery
ony Manufacture of domestic appliances n.e.c.
Manufacture of electricity distribution and control apparatus,
manufacture of insulated wire and cable
Stationary specialisation sectors
Manufacture of food products and beverages
Manufacture of pulp, paper and paper products
Publishing, printing, reproduction of recorded media
Manufacture of coke, refined petroleum products and nuclear fuel
Manufacture of basic chemicals
Manufacture of pesticides and other agro-chemical products
Manufacture of paints, varnishes and similar coatings, printing ink
and mastics
Manufacture of pharmaceuticals, medicinal chemicals and
botanical products
Manufacture of soap, detergents, cleaning, polishing
Manufacture of other chemical products
Manufacture of man-made fibres
Manufacture of rubber and plastic products
Manufacture of weapons and ammunition

ARTICLE IN PRESS
Table B1
Calculated variables
Variable Calculus from PITEC variables and description
EGTINN (GTINN/CIFMED� 100) Innovation effort
GTINNpw (GTINN/TAMMED) Expenditure in innovation per worker
PIDTEJCpw (PIDTEJ/TAMMED� 100) R&D staff per 100 workers.
PGINTID (GINTID/GTINN� 100) % Internal R&D expenditure
PGEXTID (GEXTID/GTINN� 100) % External R&D expenditure
PGID (PGINTID+PGEXTID) % R&D expenditure
PGMAQUI (GMAQUI/GTINN� 100) % Expenditure in acquisition of machines, equipment and software
PGTECNO (GTECNO/GTINN� 100) % Expenditure in acquisition of external know-how
PGPREP (GPREP/GTINN� 100) % Expenditure in preparation for production/distribution.
PGFORM (GFORM/GTINN� 100) % Expenditure in training
PGMARKET (GMARKET/GTINN� 100) % Expenditure in introduction of innovations
FPRO (F1) Own funds
FEMP (F2+F3+F4) Funds from other firms
FEMPEXT (F11+F12) Funds from other foreign firms
FAP (F5+F6+F7+F8) Funds from AAPPs
FUNI (F9+F15) University funds
FIPSFL (F10+F16) Funds from IPSFLs
Source: Own elaboration from PITEC.
Table B2
Variables
Name Description
TAMMED Average number of workers in the sphere of activity to which the firm belongs
CIFMED Average figure of businesses in the sphere of activity to which the firm belongs
EXPMED Average export volume in the sphere of activity to which the firm belongs
INVMED Average gross investment in material goods in sphere of activity it belongs to
INNOVE Carries out innovation activities
INNOVEM Innovation developed by firm or group
INNOVEC Innovation developer in cooperation with other firms or institutions
INNOVET Innovation developer by other firms or institutions
INNPROD Innovation products from (t�2) to t
INNPROC Innovation process from (t�2) to t
GINTID Figure for internal R&D expenditure
GEXTID Figure for external R&D expenditure
GMAQUI Figure for expenditure on acquisition of machinery, equipment and software
GTECNO Figure for expenditure on acquisition of external know-how
GPREP Figure for expenditure on product/distribution preparation
GFORM Figure for expenditure on training
GMARKET Figure for expenditure on introduction of innovations
EGTINN Innovation effort
PIDTEJpw EJC staff in R&D per 100 workers
INFUN Basic or fundamental research
INAPL Applied research
DESTEC Technological development
FPRO Own funds
FEMP Other firms’ funds
FEMPEXT Funds from other foreign firms
FAP AAPP funds
FUNI University funds
FIPSFL IPSFL funds
FUE EU program funds
FEXT Other funds from abroad
COOPERA Cooperated from (t-2) a t with other firms
PAT Request for patents
PATNUM Number of requests for patents
PATOEPM OEPM patents
PATEPO EPO patents
PATUSPTO USPTO patents
PATPCT PCT patents
PATINT International patents (outside OEPM)
J. Molero, A. Garcia / Technovation 28 (2008) 739–757754
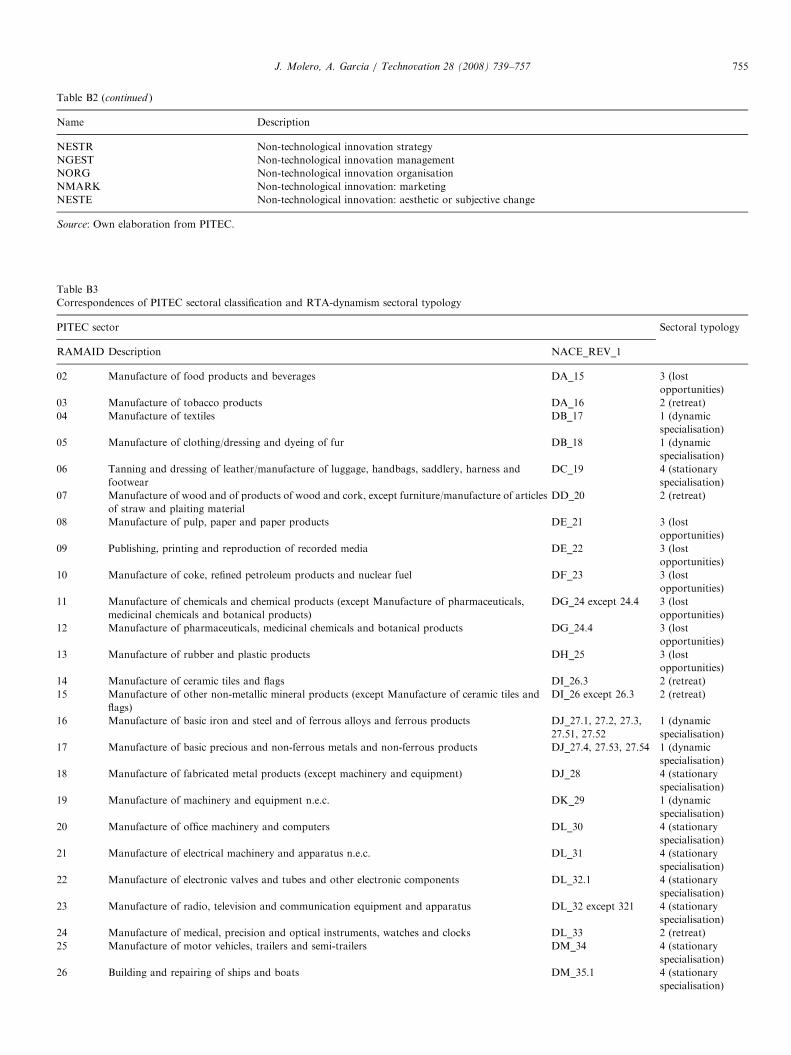
ARTICLE IN PRESS
Table B2 (continued )
Name Description
NESTR Non-technological innovation strategy
NGEST Non-technological innovation management
NORG Non-technological innovation organisation
NMARK Non-technological innovation: marketing
NESTE Non-technological innovation: aesthetic or subjective change
Source: Own elaboration from PITEC.
Table B3
Correspondences of PITEC sectoral classification and RTA-dynamism sectoral typology
PITEC sector Sectoral typology
RAMAID Description NACE_REV_1
02 Manufacture of food products and beverages DA_15 3 (lost
opportunities)
03 Manufacture of tobacco products DA_16 2 (retreat)
04 Manufacture of textiles DB_17 1 (dynamic
specialisation)
05 Manufacture of clothing/dressing and dyeing of fur DB_18 1 (dynamic
specialisation)
06 Tanning and dressing of leather/manufacture of luggage, handbags, saddlery, harness and
footwear
DC_19 4 (stationary
specialisation)
07 Manufacture of wood and of products of wood and cork, except furniture/manufacture of articles
of straw and plaiting material
DD_20 2 (retreat)
08 Manufacture of pulp, paper and paper products DE_21 3 (lost
opportunities)
09 Publishing, printing and reproduction of recorded media DE_22 3 (lost
opportunities)
10 Manufacture of coke, refined petroleum products and nuclear fuel DF_23 3 (lost
opportunities)
11 Manufacture of chemicals and chemical products (except Manufacture of pharmaceuticals,
medicinal chemicals and botanical products)
DG_24 except 24.4 3 (lost
opportunities)
12 Manufacture of pharmaceuticals, medicinal chemicals and botanical products DG_24.4 3 (lost
opportunities)
13 Manufacture of rubber and plastic products DH_25 3 (lost
opportunities)
14 Manufacture of ceramic tiles and flags DI_26.3 2 (retreat)
15 Manufacture of other non-metallic mineral products (except Manufacture of ceramic tiles and
flags)
DI_26 except 26.3 2 (retreat)
16 Manufacture of basic iron and steel and of ferrous alloys and ferrous products DJ_27.1, 27.2, 27.3,
27.51, 27.52
1 (dynamic
specialisation)
17 Manufacture of basic precious and non-ferrous metals and non-ferrous products DJ_27.4, 27.53, 27.54 1 (dynamic
specialisation)
18 Manufacture of fabricated metal products (except machinery and equipment) DJ_28 4 (stationary
specialisation)
19 Manufacture of machinery and equipment n.e.c. DK_29 1 (dynamic
specialisation)
20 Manufacture of office machinery and computers DL_30 4 (stationary
specialisation)
21 Manufacture of electrical machinery and apparatus n.e.c. DL_31 4 (stationary
specialisation)
22 Manufacture of electronic valves and tubes and other electronic components DL_32.1 4 (stationary
specialisation)
23 Manufacture of radio, television and communication equipment and apparatus DL_32 except 321 4 (stationary
specialisation)
24 Manufacture of medical, precision and optical instruments, watches and clocks DL_33 2 (retreat)
25 Manufacture of motor vehicles, trailers and semi-trailers DM_34 4 (stationary
specialisation)
26 Building and repairing of ships and boats DM_35.1 4 (stationary
specialisation)
J. Molero, A. Garcia / Technovation 28 (2008) 739–757 755
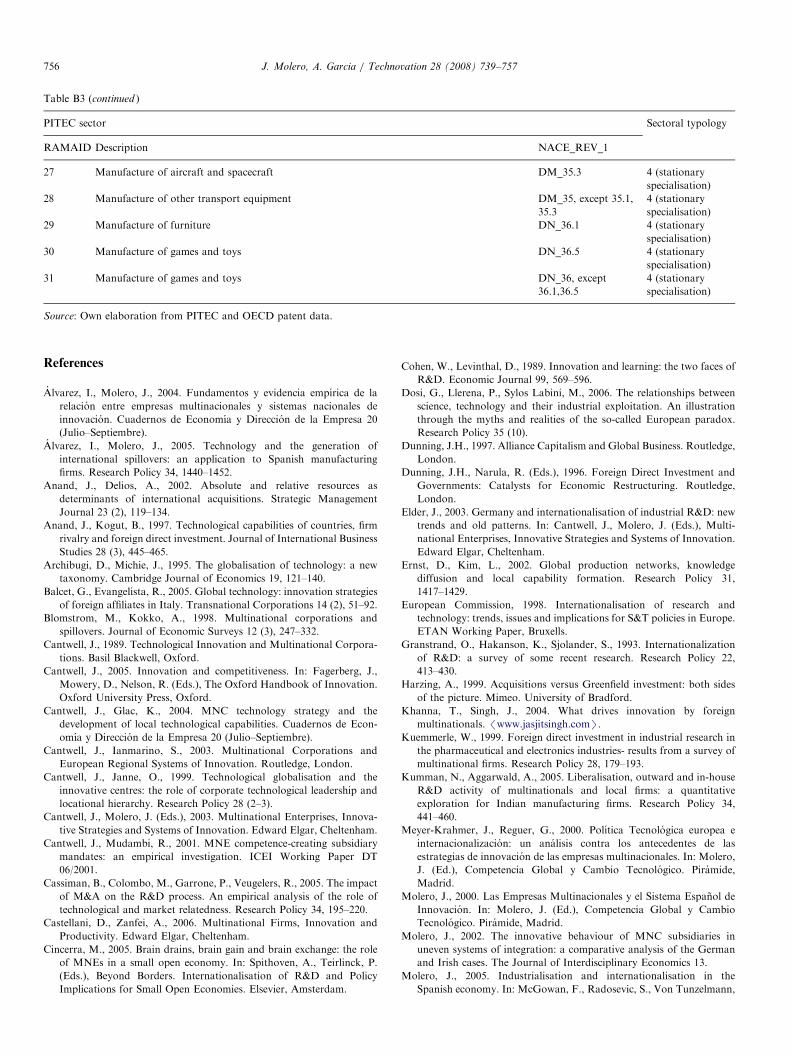
ARTICLE IN PRESS
Table B3 (continued )
PITEC sector Sectoral typology
RAMAID Description NACE_REV_1
27 Manufacture of aircraft and spacecraft DM_35.3 4 (stationary
specialisation)
28 Manufacture of other transport equipment DM_35, except 35.1,
35.3
4 (stationary
specialisation)
29 Manufacture of furniture DN_36.1 4 (stationary
specialisation)
30 Manufacture of games and toys DN_36.5 4 (stationary
specialisation)
31 Manufacture of games and toys DN_36, except
36.1,36.5
4 (stationary
specialisation)
Source: Own elaboration from PITEC and OECD patent data.
J. Molero, A. Garcia / Technovation 28 (2008) 739–757756
References
Alvarez, I., Molero, J., 2004. Fundamentos y evidencia empırica de la
relacion entre empresas multinacionales y sistemas nacionales de
innovacion. Cuadernos de Economıa y Direccion de la Empresa 20
(Julio–Septiembre).
Alvarez, I., Molero, J., 2005. Technology and the generation of
international spillovers: an application to Spanish manufacturing
firms. Research Policy 34, 1440–1452.
Anand, J., Delios, A., 2002. Absolute and relative resources as
determinants of international acquisitions. Strategic Management
Journal 23 (2), 119–134.
Anand, J., Kogut, B., 1997. Technological capabilities of countries, firm
rivalry and foreign direct investment. Journal of International Business
Studies 28 (3), 445–465.
Archibugi, D., Michie, J., 1995. The globalisation of technology: a new
taxonomy. Cambridge Journal of Economics 19, 121–140.
Balcet, G., Evangelista, R., 2005. Global technology: innovation strategies
of foreign affiliates in Italy. Transnational Corporations 14 (2), 51–92.
Blomstrom, M., Kokko, A., 1998. Multinational corporations and
spillovers. Journal of Economic Surveys 12 (3), 247–332.
Cantwell, J., 1989. Technological Innovation and Multinational Corpora-
tions. Basil Blackwell, Oxford.
Cantwell, J., 2005. Innovation and competitiveness. In: Fagerberg, J.,
Mowery, D., Nelson, R. (Eds.), The Oxford Handbook of Innovation.
Oxford University Press, Oxford.
Cantwell, J., Glac, K., 2004. MNC technology strategy and the
development of local technological capabilities. Cuadernos de Econ-
omıa y Direccion de la Empresa 20 (Julio–Septiembre).
Cantwell, J., Ianmarino, S., 2003. Multinational Corporations and
European Regional Systems of Innovation. Routledge, London.
Cantwell, J., Janne, O., 1999. Technological globalisation and the
innovative centres: the role of corporate technological leadership and
locational hierarchy. Research Policy 28 (2–3).
Cantwell, J., Molero, J. (Eds.), 2003. Multinational Enterprises, Innova-
tive Strategies and Systems of Innovation. Edward Elgar, Cheltenham.
Cantwell, J., Mudambi, R., 2001. MNE competence-creating subsidiary
mandates: an empirical investigation. ICEI Working Paper DT
06/2001.
Cassiman, B., Colombo, M., Garrone, P., Veugelers, R., 2005. The impact
of M&A on the R&D process. An empirical analysis of the role of
technological and market relatedness. Research Policy 34, 195–220.
Castellani, D., Zanfei, A., 2006. Multinational Firms, Innovation and
Productivity. Edward Elgar, Cheltenham.
Cincerra, M., 2005. Brain drains, brain gain and brain exchange: the role
of MNEs in a small open economy. In: Spithoven, A., Teirlinck, P.
(Eds.), Beyond Borders. Internationalisation of R&D and Policy
Implications for Small Open Economies. Elsevier, Amsterdam.
Cohen, W., Levinthal, D., 1989. Innovation and learning: the two faces of
R&D. Economic Journal 99, 569–596.
Dosi, G., Llerena, P., Sylos Labini, M., 2006. The relationships between
science, technology and their industrial exploitation. An illustration
through the myths and realities of the so-called European paradox.
Research Policy 35 (10).
Dunning, J.H., 1997. Alliance Capitalism and Global Business. Routledge,
London.
Dunning, J.H., Narula, R. (Eds.), 1996. Foreign Direct Investment and
Governments: Catalysts for Economic Restructuring. Routledge,
London.
Elder, J., 2003. Germany and internationalisation of industrial R&D: new
trends and old patterns. In: Cantwell, J., Molero, J. (Eds.), Multi-
national Enterprises, Innovative Strategies and Systems of Innovation.
Edward Elgar, Cheltenham.
Ernst, D., Kim, L., 2002. Global production networks, knowledge
diffusion and local capability formation. Research Policy 31,
1417–1429.
European Commission, 1998. Internationalisation of research and
technology: trends, issues and implications for S&T policies in Europe.
ETAN Working Paper, Bruxells.
Granstrand, O., Hakanson, K., Sjolander, S., 1993. Internationalization
of R&D: a survey of some recent research. Research Policy 22,
413–430.
Harzing, A., 1999. Acquisitions versus Greenfield investment: both sides
of the picture. Mimeo. University of Bradford.
Khanna, T., Singh, J., 2004. What drives innovation by foreign
multinationals. /www.jasjitsingh.comS.
Kuemmerle, W., 1999. Foreign direct investment in industrial research in
the pharmaceutical and electronics industries- results from a survey of
multinational firms. Research Policy 28, 179–193.
Kumman, N., Aggarwald, A., 2005. Liberalisation, outward and in-house
R&D activity of multinationals and local firms: a quantitative
exploration for Indian manufacturing firms. Research Policy 34,
441–460.
Meyer-Krahmer, J., Reguer, G., 2000. Polıtica Tecnologica europea e
internacionalizacion: un analisis contra los antecedentes de las
estrategias de innovacion de las empresas multinacionales. In: Molero,
J. (Ed.), Competencia Global y Cambio Tecnologico. Piramide,
Madrid.
Molero, J., 2000. Las Empresas Multinacionales y el Sistema Espanol de
Innovacion. In: Molero, J. (Ed.), Competencia Global y Cambio
Tecnologico. Piramide, Madrid.
Molero, J., 2002. The innovative behaviour of MNC subsidiaries in
uneven systems of integration: a comparative analysis of the German
and Irish cases. The Journal of Interdisciplinary Economics 13.
Molero, J., 2005. Industrialisation and internationalisation in the
Spanish economy. In: McGowan, F., Radosevic, S., Von Tunzelmann,
ARTICLE IN PRESSJ. Molero, A. Garcia / Technovation 28 (2008) 739–757 757
N. (Eds.), The Emerging Industrial Structure of the Wider Europe.
Routledge, London.
Molero, J., Buesa, M., 1993. Multinational companies and technological
change: basic traits and taxonomy of the behaviour of German
industrial companies in Spain. Research Policy 22, 265–278.
Narula, R., 1996. Multinational Investment and Economic Structure.
Routledge, London.
Narula, R., 2003. Globalization and Technology. Polity Press, Cambridge.
Narula, R., 2004. Understanding absorptive capacities in an ‘‘innovation
system’’ context: consequences for economic and employment growth.
MERIT—Infonomics Memorandum Series, 2004-003, Maastricht.
Narula, R., 2005. Globalisation of innovation. In: Fagerberg, J., Mowery,
D., Nelson, R. (Eds.), The Oxford Handbook of Innovation. Oxford
University Press, Oxford.
OECD, 1997. Internationalisation of Industrial R&D: Patterns and
Trends. Group of National Experts on Science and Technology
Indicators. OCDE, Paris.
Patel, P., 1995. The localised production of global technology. Cambridge
Journal of Economics 19, 141–153.
Patel, P., Pavitt, K., 1991. Large firms in the production of the world’s
technology: an important case of ‘‘non-globalisation. Journal of
International Business Studies 22, 1–22.
Patel, P., Pavitt, K., 1992. The innovative performance of the world’s
largest firms: some new evidence. The Economics of Innovation and
New Technology 2, 77–95.
Patel, P., Vega, M., 1999. Patterns of internalisation corporate technology:
location vs. home countries advantages. Research Policy 28, 145–155.
Pavitt, K., 2001. Public policies to support basic research: what can the
rest of the world learn from US theory and practice? (and what they
should not learn). Industrial & Corporate Change 10, 761–779.
Pearce, R., 1999. Decentralised R&D and strategic competitiveness:
globalised approaches to generation and use of technology in
multinational enterprises (MNEs). Research Policy 28, 157–178.
Sadowsky, B.M., Sadowski-Rasters, G., 2006. On the innovativeness of
foreign affiliates: evidence from companies in The Netherlands.
Research Policy 35, 447–462.
Scherer, F.M., 1984. Innovation and Growth: Schumpeterian Perspec-
tives. MIT Press, Cambridge, MA.
Seth, A., 1990. Value creation in acquisitions: a re-examination
of performance issues. Strategic Management Journal 11 (2),
99–115.
Simoes, V.C., 2003. Networks and learning processes: a case study of the
automotive industry, in Portugal. In: Cantwell, J., Molero, J. (Eds.),
Multinational Enterprises, Innovative Strategies and Systems of
Innovation. Edward Elgar, Cheltenham.
Sojvel, O., Zander, I., 1995. Organization of the dynamic multina-
tional enterprise. The home-based and heterarchical MNE.
International Studies of Management and Organization 25 (1–2),
17–38.
Teirlinck, P., 2005. Location and agglomeration of foreign R&D activities
in a small open economy. In: Spithoven, A., Teirlinck, P. (Eds.),
Beyond Borders. Internationalisation of R&D and Policy Implications
for Small Open Economies. Elsevier, Amsterdam.
UNCTAD, 2005. World Investment Report, 2005. United Nations,
New York and Geneve.
Von Zedtwitz, M., Gassman, O., 2005. Market versus technology drive in
R&D internationalisation: four different patterns of managing
research and development. Research Policy 31, 569–588.
Wooldridge, J.M., 2000. Introductory Econometrics. A Modern Ap-
proach. Thomson Learning, South-Western.


![MULTI-SECTORAL NUTRITION IMPLEMENTATION PLAN… · [multi-sectoral nutrition implementation plan, results framework & ] ... also goes to the world bank, ... [multi-sectoral nutrition](https://img.pdfslide.us/doc/110x75/5b0d161f7f8b9a2f788d3170/multi-sectoral-nutrition-implementation-plan-multi-sectoral-nutrition-implementation.jpg)