Embed Size (px)
Citation preview
THE INFORMATION QUALITY OF DERIVATIVE DISCLOSURES IN CORPORATE ANNUAL REPORTS OF AUSTRALIAN FIRMS IN THE
EXTRACTIVE INDUSTRIES
Mohamat Sabri Hassan B.Ac (Hons.) (Universiti Kebangsaan Malaysia),
M.Social Science (Southampton)
A dissertation submitted for the degree of Doctor of Philosophy within the School of Accountancy at Queensland University of Technology
2004

ii
Keywords: Disclosure quality; transparency; disclosure index; financial instruments;
derivative instruments; market value; extractives industries.

iii
ABSTRACT
Recent events in the business world have focused attention on the importance of high
quality financial reporting. Of particular interest is where the collapse of prominent
companies such as Baring Plc. was due to the company’s involvement with derivative
instruments. In Australia, some derivative instruments are not recognised in the
balance sheet. However, the Australian accounting standard AASB 1033 Presentation
and Disclosure of Financial Instruments requires extensive disclosures to overcome
the lack of guidance with regard to the recognition and measurement. Therefore,
AASB 1033 may be regarded as a high quality disclosure standard.
This thesis investigates the transparency or information quality of derivative
disclosures of Australian firms in the extractive industries using 1998 to 2001
financial reports. The extractive industries play a major role in the Australian
economy, where they generated exports worth more than A$30billion in 2000 to 2002
(Department of Foreign Affairs and Trade, 2003a and 2003b). Further, firms in the
extractive industries extensively use derivative instruments for hedging purposes
(Berkman, Bradbury, Hancock and Innes, 1997). The objective of this study is, first,
to examine the relationship between the transparency or disclosure quality of
derivative information and firm characteristics. Second, this study investigates the
value relevance of derivative disclosures in particularly hedge information, net fair
value information and risk information. Quality is measured based on a disclosure
index developed from AASB 1033 Presentation and Disclosure of Financial
Instruments. A finding of concern is that the majority of firms in this study provide
less than complete information and therefore enforcement power is required to ensure
compliance (Kothari, 2000)
Prior studies have related disclosure quality of accounting information with firm
characteristics but no attempt has been made to relate those characteristics with the
disclosure quality of derivative instruments. The current study contributes to the
literature by examining the relationship between firm characteristics and the quality of
derivative disclosures. Firm characteristics investigated are size, profitability, price-
iv
earnings ratio, market-to-book ratio, research and development activity, auditor, debt-
to-equity ratio and type of extractive firm. This study finds that the variables, firm
size, price-earnings and debt-to-equity ratios are associated with the disclosure quality
of derivative information. To a lesser extent, the variables, market-to-book ratio and
profitability, are also associated with disclosure quality.
High disclosure quality has been argued to lead to a reduction in the cost of debt
(Sengupta, 1998) and equity (Botosan, 1997), resulting in higher security prices
(Miller and Bahnson, 2002). The results of this study indicate that high quality
derivative information, as represented by the disclosure index, is value relevant.
Market participants do consider hedge information and risk information components
as important for decision-making. However, examining the specific information
disclosed in the financial statements indicate that some of the disclosed information
such as the unrealised gain or loss on financial assets and liabilities and off-balance
sheet derivative financial instruments are not significant.
These results contribute to the value relevance literature as this study focuses on the
extractive industries which have been neglected in the literature. This study provides
important information for standard setters and regulators for future directions in
developing accounting standards and is particularly relevant for the impending
adoption of International Accounting Standards.
v
Table of Contents
Page
ABSTRACT ......................................................................................................................................... III ACKNOWLEDGEMENTS ...............................................................................................................XII CHAPTER 1 INTRODUCTION .....................................................................................................1
1.1 PURPOSE OF THE STUDY.........................................................................................................1 1.2 PRIOR RESEARCH AND THE MAIN FINDINGS OF THE THESIS...................................................3 1.3 MOTIVATION..........................................................................................................................6 1.4 PLAN OF THESIS .....................................................................................................................9
CHAPTER 2 INSTITUTIONAL BACKGROUND .....................................................................12 2.1 RISK MANAGEMENT.............................................................................................................12
2.1.1 To Hedge or Not to Hedge?............................................................................................14 2.2 INTERNATIONAL ACCOUNTING PRACTICES ..........................................................................16
2.2.1 Financial Accounting Standard Board ...........................................................................17 2.2.1.1 SFAS 133 Accounting for Derivative Instruments and Hedging Activities. ............................ 19
2.2.2 International Accounting Standards Board ....................................................................20 2.2.2.1 IAS 32 Financial Instruments: Disclosure and Presentation..................................................... 20 2.2.2.2 IAS 39: Financial Instruments: Recognition and Measurement ............................................... 22
2.2.3 Accounting for Financial Instruments in Australia ........................................................23 2.2.3.1 AASB 1033 Presentation and Disclosure of Financial Instruments ......................................... 23
2.3 FAIR VALUE ACCOUNTING...................................................................................................31 2.4 STUDIES OF ACCOUNTING PRACTICES IN AUSTRALIA ..........................................................35 2.5 RISK MANAGEMENT PRACTICES IN THE EXTRACTIVE INDUSTRIES ......................................37 2.6 SUMMARY............................................................................................................................39
CHAPTER 3 LITERATURE REVIEW: DISCLOSURE QUALITY........................................41 3.1 DISCLOSURE QUALITY: THE DEFINITIONS ...........................................................................42 3.2 DISCLOSURE QUALITY: REGULATION, ENFORCEMENT AND COMPLIANCE...........................44 3.3 STUDIES ON DISCLOSURE QUALITY .....................................................................................46
3.3.1 Disclosure Quality of Accounting Standards..................................................................46 3.3.2 Disclosure Quality of Accounting Information and the Impact on Firms.......................48
3.3.2.1 Disclosure Quality and Firms Characteristics .......................................................................... 48 3.3.2.2 Disclosure Quality of Specific Information.............................................................................. 52
3.3.3 Disclosure Quality of Accounting Information and Benefits to the Investors.................54 3.3.4 Disclosure Quality of Derivative Information ................................................................57
3.4 SUMMARY............................................................................................................................59 CHAPTER 4 LITERATURE REVIEW: DERIVATIVE DISCLOSURES AND VALUE RELEVANCE STUDIES.....................................................................................................................60
4.1 DISCLOSURE QUALITY OF ACCOUNTING INFORMATION AND INVESTORS’ DECISIONS .........60 4.2 DISCLOSURE AND CAPITAL MARKETS RESEARCH................................................................62
4.2.1 Capital Markets Research ..............................................................................................62 4.2.2 Relevance and Reliability of Accounting Information and Capital Markets Research...65 4.2.3 Value Relevance Studies .................................................................................................68
4.2.3.1 Other Value Relevance Studies ................................................................................................ 69 4.2.3.2 Research on Value Relevance in Australia............................................................................... 70
4.3 VALUE RELEVANCE OF FINANCIAL INSTRUMENTS...............................................................73 4.3.1 Studies on Value Relevance of Fair Value Disclosures..................................................73 4.3.2 Studies on Value Relevance of Derivative Financial Instruments Disclosures ..............76
4.4 SUMMARY............................................................................................................................78 CHAPTER 5 RESEARCH QUESTIONS.....................................................................................79
5.1 DISCLOSURE QUALITY OF DERIVATIVE INFORMATION AND FIRM CHARACTERISTICS .........81
vi
5.1.1 Size..................................................................................................................................83 5.1.2 High Performance Firms................................................................................................84 5.1.3 Auditor............................................................................................................................85 5.1.4 Type of Firm in the Extractive Industries. ......................................................................85
5.2 VALUE RELEVANCE OF DERIVATIVE DISCLOSURES .............................................................86 5.2.1 Disclosure Quality and the Market Value of Firms........................................................86 5.2.2 Value Relevance of Disclosure of Hedges of Anticipated Transactions .........................88 5.2.3 Value Relevance of Fair Value Disclosures ...................................................................91
5.3 SUMMARY............................................................................................................................92 CHAPTER 6 RESEARCH DESIGN, DATA COLLECTION AND DESCRIPTIVE STATISTICS ...................................................................................................................................93
6.1 DATA SELECTION AND TEST PERIOD....................................................................................93 6.2 SPECIFICATION OF VARIABLES AND MODEL DEVELOPMENT................................................98
6.2.1 Disclosure Quality and Firm Characteristics (Firm Characteristics Model) ................99 6.2.1.1 Variables .................................................................................................................................. 99 6.2.1.2 Regression Model................................................................................................................... 107
6.2.2 Value Relevance of Derivative Disclosures (Market Value Model) .............................108 6.2.2.1 Dependent Variable................................................................................................................ 112 6.2.2.2 Independent Variables............................................................................................................ 112
6.2.3 Incremental Explanatory Power of the Net Fair Value and the Unrealised Gain or Loss on Financial Instruments Beyond the Book Value of Financial and Non-Financial Instruments and Earnings Valued at Historical Cost .....................................................................................126
6.2.3.1 Incremental Explanatory Power of Net Fair Value................................................................. 126 6.2.3.2 Incremental Explanatory Power of the Unrealised Gain or Loss on Financial Instruments ... 128
6.3 ESTIMATION PROCEDURES .................................................................................................130 6.4 DESCRIPTIVE STATISTICS ...................................................................................................132
6.4.1 Firm Characteristics Model .........................................................................................132 6.4.2 Market Value Models....................................................................................................135
6.4.2.1 Value Relevance of Disclosure Quality.................................................................................. 135 6.4.2.2 Value Relevance of Hedge Transaction, Net Fair Value and the Unrealised Gain or Loss on Financial Instruments ............................................................................................................................. 136
6.5 SUMMARY..........................................................................................................................136 CHAPTER 7 RESULTS: DISCLOSURE QUALITY AND FIRM CHARACTERISTICS...138
7.1 DIAGNOSTIC TESTS ............................................................................................................138 7.1.1 Normality Test ..............................................................................................................139 7.1.2 Autocorrelation Test .....................................................................................................139 7.1.3 Heteroscedasticity Test.................................................................................................140 7.1.4 Multicollinearity Test ...................................................................................................141
7.2 DESCRIPTIVE RESULTS.......................................................................................................143 7.2.1 Firms’ Disclosure Scores .............................................................................................143 7.2.2 Disclosure Components ................................................................................................145
7.3 VALIDITY OF THE DISCLOSURE QUALITY SCORE (DISCLOSURE INDEX).............................148 7.4 MULTIPLE REGRESSION RESULTS ......................................................................................153
7.4.1 Standard Regression Procedures..................................................................................153 7.4.2 Sensitivity Analyses.......................................................................................................155
7.4.2.1 Ranked Regression................................................................................................................. 155 7.4.2.2 Profit Vs Loss Making Firms ................................................................................................. 157
7.5 DISCUSSION AND ANALYSIS...............................................................................................160 7.5.1 Disclosure Quality ........................................................................................................160 7.5.2 Comparison with Prior Studies ....................................................................................162
7.6 SUMMARY..........................................................................................................................166 CHAPTER 8 RESULTS: VALUE RELEVANCE OF DERIVATIVE DISCLOSURES .......168
8.1 DIAGNOSTIC TESTS ............................................................................................................169 8.1.1 Normality Tests.............................................................................................................169 8.1.2 Autocorrelation Tests ...................................................................................................170 8.1.3 Heteroscedasticity Tests ...............................................................................................170 8.1.4 Multicollinearity Test ...................................................................................................171
8.2 MULTIPLE REGRESSION RESULTS ......................................................................................176
vii
8.2.1 Disclosure Quality of Derivative Information and the Market Value of Firms ............176 8.2.2 Value Relevance of Hedge Disclosures ........................................................................179 8.2.3 Value Relevance of Net Fair Value Disclosures...........................................................180 8.2.4 Value Relevance of the Unrealised Gain or Loss of Financial Instruments .................183
8.3 INCREMENTAL EXPLANATORY POWER OF NET FAIR VALUE AND THE UNREALISED GAIN OR LOSS OF FINANCIAL INSTRUMENTS ..................................................................................................186 8.4 DISCUSSION OF THE RESULTS.............................................................................................189
8.4.1 Disclosure Quality of Derivative Information and the Market Value of Firms ............191 8.4.2 Value Relevance of Hedge Disclosures ........................................................................192 8.4.3 Value Relevance and the Incremental Explanatory Power of Net Fair Value Disclosure and the Unrealised Gain or Loss of Financial Instruments........................................................192
8.5 SUMMARY..........................................................................................................................195 CHAPTER 9 SUMMARY AND CONCLUSIONS ....................................................................196
9.1 SUMMARY..........................................................................................................................196 9.1.1 Firm Characteristics Model .........................................................................................196 9.1.2 Market Value Model .....................................................................................................199
9.2 CONTRIBUTIONS OF THE STUDY .........................................................................................202 9.3 LIMITATIONS......................................................................................................................203 9.4 DIRECTIONS FOR FUTURE RESEARCH.................................................................................205
APPENDIX A: AUSTRALIAN FIRMS IN THE EXTRACTIVE INDUSTRIES LISTED ON THE ASX IN 1998 TO 2001 ..............................................................................................................206 APPENDIX B: FIRM CHARACTERISTICS MODEL YEAR-BY-YEAR AND AVERAGE FOUR YEARS ANALYSES..............................................................................................................218 APPENDIX C: RESULTS ON MARKET VALUE MODEL FOR YEAR-BY-YEAR ANALYSIS..............................................................................................................................................................223 APPENDIX D: FURTHER TEST.....................................................................................................230 APPENDIX E: FIRM CHARACTERISTICS MODEL ESTIMATION WITHOUT THE OUTLIERS (REFINED DATA)........................................................................................................247 APPENDIX F: RESULTS ON MARKET VALUE MODEL FOR FULL DATA........................252 REFERENCES ...................................................................................................................................262

viii
Table of Tables and Figure
Page
TABLE 2.1: FASB FINANCIAL INSTRUMENTS ACCOUNTING PRONOUNCEMENTS ....................................18 TABLE 2.2: SUMMARY OF DEVELOPMENT OF ACCOUNTING PRONOUNCEMENTS RELATED TO FINANCIAL
INSTRUMENTS IN AUSTRALIA ........................................................................................................24 TABLE 2.3: AASB 1033 VS RELATED FASB AND IAS STANDARDS..............................................28 TABLE 6.1: THE USE OF DERIVATIVE FINANCIAL INSTRUMENTS FOR HEDGING PURPOSES.....................97 TABLE 6.2: SUMMARY OF DATA SELECTION PROCEDURE .......................................................................98 TABLE 6.3: COMPONENTS OF DERIVATIVE DISCLOSURE INDEX ............................................................101 TABLE 6.4: SUMMARY OF INDEPENDENT VARIABLES EMPLOYED IN THE MARKET VALUE MODELS ....113 TABLE 6.5: DESCRIPTIVE STATISTICS AND CORRELATION MATRIX: FIRM CHARACTERISTICS MODEL .134 TABLE 6.6: DESCRIPTIVE STATISTICS: VALUE RELEVANCE OF DISCLOSURE QUALITY (N=253) ...........135 TABLE 6.7: DESCRIPTIVE STATISTICS: VALUE RELEVANCE OF HEDGE TRANSACTION, NET FAIR VALUE
AND UNREALISED GAIN OR LOSS ON FINANCIAL INSTRUMENTS. (N=253)...................................137 TABLE 7.1: CORRELATION COEFFICIENTS BETWEEN VARIABLES ..........................................................142 TABLE 7.2: NUMBER OF FIRMS THAT REPORT ALL INFORMATION REQUIRED BY AASB 1033 (100%
DISCLOSURE) ...............................................................................................................................143 TABLE 7.3: DISCLOSURE QUALITY OF FIRMS IN THE AUSTRALIAN EXTRACTIVE INDUSTRIES..............144 TABLE 7.4: DESCRIPTIVE STATISTICS OF DISCLOSURE COMPONENTS (POOLED SAMPLE) .....................145 TABLE 7.5: MEAN DISCLOSURE COMPONENTS OF USER FIRMS FOR THE PERIOD 1998 TO 2001 ...........147 TABLE 7.6: CORRELATION COEFFICIENTS BETWEEN VARIABLES ..........................................................151 TABLE 7.7: DISCLOSURE QUALITY OF DERIVATIVE INFORMATION OF EXTRACTIVE FIRMS ..................152 TABLE 7.8 :RESULTS OF REGRESSION ANALYSIS OF THE ASSOCIATION BETWEEN DISCLOSURE
TRANSPARENCY AND FIRMS CHARACTERISTICS (N=260) ............................................................154 TABLE 7.9: RESULTS OF REGRESSION ANALYSIS OF THE ASSOCIATION BETWEEN DISCLOSURE
TRANSPARENCY AND FIRMS CHARACTERISTICS: RANKED TRANSFORMATION (N=260)..............156 TABLE 7.10: RESULTS OF REGRESSION ANALYSIS OF THE ASSOCIATION BETWEEN DISCLOSURE
TRANSPARENCY AND FIRMS CHARACTERISTICS. (N=260) ...........................................................158 TABLE 7.11: RESULTS OF REGRESSION ANALYSIS OF THE ASSOCIATION BETWEEN DISCLOSURE
TRANSPARENCY AND FIRMS CHARACTERISTICS. .........................................................................159 TABLE 7.12: RESULTS ON THE ASSOCIATION BETWEEN DISCLOSURE QUALITY AND FIRM
CHARACTERISTICS.......................................................................................................................163 TABLE 8.1:NORMALITY TEST OF VALUE RELEVANCE MODELS ............................................................169 TABLE 8.2: CORRELATION COEFFICIENTS BETWEEN VARIABLES ..........................................................171 TABLE 8.3: CORRELATION COEFFICIENTS BETWEEN VARIABLES: VALUE RELEVANCE OF HEDGE
DISCLOSURES ..............................................................................................................................173 TABLE 8.4: CORRELATION COEFFICIENTS BETWEEN VARIABLES: VALUE RELEVANCE OF NET FAIR
VALUE.........................................................................................................................................174 TABLE 8.5: CORRELATION COEFFICIENTS BETWEEN VARIABLES: VALUE RELEVANCE OF UNREALISED
GAIN OR LOSS OF FINANCIAL INSTRUMENTS ...............................................................................175 TABLE 8.6: THE ASSOCIATION BETWEEN INFORMATION QUALITY OF DERIVATIVE DISCLOSURES AND
THE MARKET VALUE OF FIRMS (N=253)1 ....................................................................................177 TABLE 8.7: THE ASSOCIATION BETWEEN HEDGE DISCLOSURE AND MARKET VALUE OF THE FIRMS
(N=253)1......................................................................................................................................180 TABLE 8.8: THE ASSOCIATION BETWEEN NET FAIR VALUE AND MARKET VALUE (N=253)..................182 TABLE 8.9: THE ASSOCIATION BETWEEN THE MARKET VALUE OF FIRMS AND THE DIFFERENCE
BETWEEN NET FAIR VALUE AND BOOK VALUE OF FINANCIAL INSTRUMENTS (N=253)1.............184 TABLE 8.10: THE INCREMENTAL EXPLANATORY POWER OF NET FAIR VALUE BEYOND THE BOOK VALUE
OF FINANCIAL AND NON-FINANCIAL INSTRUMENTS AND EARNINGS VALUED AT THE HISTORICAL COST............................................................................................................................................187
TABLE 8.11: THE INCREMENTAL EXPLANATORY POWER OF UNREALISED GAIN OR LOSS OF FINANCIAL INSTRUMENTS BEYOND THE BOOK VALUE OF FINANCIAL AND NON-FINANCIAL INSTRUMENTS AND EARNINGS VALUED AT THE HISTORICAL COST (N=253)..............................................................188
TABLE 8.12: SUMMARY OF RESULTS OF VALUE RELEVANCE MODELS .................................................190 TABLE A 1: LISTED AUSTRALIAN FIRMS IN THE EXTRACTIVE INDUSTRIES ...........................................207 TABLE A 2: LIST OF DATA FIRMS IN THE STUDY...................................................................................215
ix
TABLE A 3: COMPONENTS OF DERIVATIVE DISCLOSURE INDEX FOR BHP BILLITON (2001).................217 TABLE B 1: THE ASSOCIATION BETWEEN FIRMS CHARACTERISTICS AND DISCLOSURE QUALITY ON A
YEAR-BY-YEAR BASIS AND AN AVERAGE OF FOUR YEARS DATA (N=65) ..................................220 TABLE B 2: RESULTS OF REGRESSION ANALYSIS OF THE ASSOCIATION BETWEEN DISCLOSURE
TRANSPARENCY AND FIRMS CHARACTERISTICS: RANKED TRANSFORMATION YEAR-BY-YEAR BASIS AND AN AVERAGE OF FOUR YEARS DATA (N=65).............................................................222
TABLE C 1: THE ASSOCIATION BETWEEN THE INFORMATION QUALITY OF DERIVATIVES DISCLOSURES
AND THE MARKET VALUE OF THE FIRMS: YEAR-BY-YEAR ANALYSIS ........................................225 TABLE C 2: THE ASSOCIATION BETWEEN HEDGE DISCLOSURES AND THE MARKET VALUE OF THE FIRMS:
YEAR-BY-YEAR ANALYSIS..........................................................................................................226 TABLE C 3:THE ASSOCIATION BETWEEN NET FAIR VALUE AND MARKET VALUE: YEAR-BY-YEAR
ANALYSIS ....................................................................................................................................227 TABLE C 4: THE ASSOCIATION BETWEEN THE MARKET VALUE OF FIRMS AND THE DIFFERENCE BETWEEN
NET FAIR VALUE AND BOOK VALUE OF FINANCIAL INSTRUMENTS (UNREALISED GAIN OR LOSS)....................................................................................................................................................228
TABLE D 1: THE ASSOCIATION BETWEEN INFORMATION QUALITY OF DERIVATIVE DISCLOSURES AND
THE MARKET VALUE OF THE FIRMS (N=156)1 .............................................................................232 TABLE D 2: THE ASSOCIATION BETWEEN HEDGE DISCLOSURE AND THE MARKET VALUE OF THE FIRMS
(N=156)1......................................................................................................................................233 TABLE D 3: THE ASSOCIATION BETWEEN NET FAIR VALUE AND MARKET VALUE (N=156).................234 TABLE D 4: THEASSOCIATION BETWEEN THE MARKET VALUE OF FIRMS AND THE DIFFERENCE BETWEEN
NET FAIR VALUE AND BOOK VALUE OF FINANCIAL INSTRUMENTS (N=156) ..............................235 TABLE D 5:THE ASSOCIATION BETWEEN THE INFORMATION QUALITY OF DERIVATIVES DISCLOSURES
AND THE MARKET VALUE OF THE FIRMS: YEAR-BY-YEAR ANALYSIS ........................................236 TABLE D 6: THE ASSOCIATION BETWEEN HEDGE DISCLOSURES AND THE MARKET VALUE OF THE FIRMS:
YEAR-BY-YEAR ANALYSIS..........................................................................................................238 TABLE D 7: THE ASSOCIATION BETWEEN NET FAIR VALUE AND MARKET VALUE: YEAR-BY-YEAR
ANALYSIS ....................................................................................................................................239 TABLE D 8: THE ASSOCIATION BETWEEN THE MARKET VALUE OF FIRMS AND THE DIFFERENCE
BETWEEN NET FAIR VALUE AND BOOK VALUE OF FINANCIAL INSTRUMENTS ............................240 TABLE D 9: INCREMENTAL EXPLANATORY POWER OF NET FAIR VALUE BEYOND THE BOOK VALUE OF
FINANCIAL AND NON-FINANCIAL INSTRUMENTS AND EARNINGS VALUED AT THE HISTORICAL COST............................................................................................................................................242
TABLE D 10: INCREMENTAL EXPLANATORY POWER OF UNREALISED GAIN OR LOSS ON FINANCIAL INSTRUMENTS BEYOND THE BOOK VALUE OF FINANCIAL AND NON-FINANCIAL INSTRUMENTS AND EARNINGS VALUED AT THE HISTORICAL COST............................................................................243
TABLE E 1: RESULTS OF REGRESSION ANALYSIS OF THE ASSOCIATION BETWEEN DISCLOSURE
TRANSPARENCY AND FIRMS CHARACTERISTICS (N=254) ............................................................248 TABLE E 2: THE ASSOCIATION BETWEEN FIRMS CHARACTERISTICS AND DISCLOSURE QUALITY ON A
YEAR-BY-YEAR BASIS AND AN AVERAGE OF FOUR YEARS DATA ..............................................249 TABLE E 3: RESULTS OF REGRESSION ANALYSIS OF THE ASSOCIATION BETWEEN DISCLOSURE
TRANSPARENCY AND FIRMS CHARACTERISTICS: RANKED TRANSFORMATION (N=254)..............250 TABLE E 4: REFINED DATA: ASSOCIATION BETWEEN DISCLOSURE TRANSPARENCY AND FIRMS
CHARACTERISTICS: RANKED TRANSFORMATION YEAR-BY-YEAR BASIS AND AN AVERAGE OF FOUR YEARS DATA .....................................................................................................................251
TABLE F 1: THE ASSOCIATION BETWEEN INFORMATION QUALITY OF DERIVATIVE DISCLOSURES AND
THE MARKET VALUE OF THE FIRMS (N=260)1 .............................................................................253 TABLE F 2: THE ASSOCIATION BETWEEN INFORMATION QUALITY OF DERIVATIVE DISCLOSURES AND
THE MARKET VALUE OF THE FIRMS – RANKED BASED ON LARGE AND SMALL (N=128) .............254 TABLE F 3: THE ASSOCIATION BETWEEN INFORMATION QUALITY OF DERIVATIVE DISCLOSURES AND
THE MARKET VALUE OF THE LARGE AND SMALL FIRMS .............................................................255 TABLE F 4: THE ASSOCIATION BETWEEN INFORMATION QUALITY OF DERIVATIVES DISCLOSURES AND
MARKET VALUE OF THE FIRMS: YEAR-BY-YEAR ANALYSIS (N=65) ...........................................256

x
TABLE F 5: THE ASSOCIATION BETWEEN HEDGE DISCLOSURE AND MARKET VALUE OF THE FIRMS: YEAR-BY-YEAR ANALYSIS (N=65)..............................................................................................257
TABLE F 6: THE ASSOCIATION BETWEEN NET FAIR VALUE AND MARKET VALUE: YEAR-BY-YEAR ANALYSIS (N=65) ........................................................................................................................258
TABLE F 7: THE ASSOCIATION BETWEEN MARKET VALUE OF FIRMS AND DIFFERENCE BETWEEN NET FAIR VALUE AND BOOK VALUE OF FINANCIAL INSTRUMENTS (N=65) ........................................259
TABLE F 8: INCREMENTAL EXPLANATORY POWER OF NET FAIR VALUE BEYOND BOOK VALUE OF FINANCIAL AND NON-FINANCIAL INSTRUMENTS AND EARNINGS VALUED AT HISTORICAL COST....................................................................................................................................................260
TABLE F 9: INCREMENTAL EXPLANATORY POWER OF UNRECOGNISED GAIN OR LOSS BEYOND BOOK VALUE OF FINANCIAL AND NON-FINANCIAL INSTRUMENTS AND EARNINGS VALUED AT HISTORICAL COST .......................................................................................................................261
FIGURE 5.1: DIAGRAM ILLUSTRATING THE RESEARCH QUESTIONS.........................................................80

xi
THE STATEMENT OF ORIGINAL AUTHORSHIP
“The work contained in this thesis has not been previously submitted for a degree or diploma at any other higher education institution. To the best of my knowledge and belief, the thesis contains no material previously published or written by another person except where due reference is made” Signed : ______________________________ Date : _____________________________

xii
ACKNOWLEDGEMENTS
I am deeply indebted to my supervisor, Dr. Majella Percy, for her excellent direction
and support provided to me throughout all stages of this dissertation. I am also very
grateful to my associate supervisor, Prof. Roger Willett, for his helpful comments and
support.
I would like to acknowledge Universiti Kebangsaan Malaysia and the Malaysian
Government for their moral support and assistance with a scholarship to undertake
study leave to do my Doctorate at the Queensland University of Technology. I would
also like to acknowledge the advice and support provided to me by Prof. Greg Clinch,
Assoc. Prof. Jenny Goodwin, Helen Kang, Christine Tan, Suzanna Yuen, Wilson
Tong and participants at AFAANZ 2003 in Brisbane, Doctorate Business Students
Symposium at the Queensland University of Technology and the APJAE Symposium
2004 in Kuala Lumpur.
I am particularly indebted to my fellow PhD students, Eko Suwardi, Steve Su,
Victoria Clout, Chun-Wei Huang and Teruyo Omura for their insightful comments
and support offered to me over this long process. I also would like to thank Danielle
Horton for providing me with some of the share price data.
Finally, I wish to express my appreciation for the encouragement and support of my
wife Anida Sidek, my children Muhammad Ameer Zharfan, Hanis Afifah, Hanis
Nadhirah, Hanis Aqilah Aiman and Muhammad Ammar Zhakwan. To my parents
Hassan Mat and Siti Fatimah Bidin and parents in-law Sidek Abd Rashid and Mariam
Marzuki, I would not be here without their love and support.
Chapter 1: Introduction
1
CHAPTER 1 INTRODUCTION
1.1 Purpose of the Study The objective of this study is, first to examine the relationship between the
transparency, or disclosure quality, of derivative information and firm characteristics.
Second, this study investigates the value relevance of derivative disclosures in
particular hedge information, net fair value information and risk information.
Derivative financial instruments are financial instruments whose value is derived from
the value of the underlying asset, liability, interest rate, index, or a hedge. Most of
these instruments, such as interest rate swaps and option contracts, are executory
contracts1 and require either no initial cash outlay or only a small initial outlay
(Johnson and Swieringa, 1996; Wilson and Smith, 1997).
Firms use derivative financial instruments to manage (hedge) exposure to foreign
exchange risk, interest rate risk and commodity price changes. However, due to their
nature, these instruments are not recognised as assets and liabilities in the balance
sheet and nor is the unrealised gain or loss recorded in the income statement.
Nevertheless, information about them (voluntary and mandatory) is disclosed in the
notes to the financial statements to enhance financial statement users’ understanding
of the significance of these derivative financial instruments and the associated risks.
To examine the significance of recognised and unrecognised financial information in
decision-making, researchers examine the quality of the information. The U.S.
1 A contract under which the obligations of both parties to the contract are so far unperformed and the failure of either to complete performance would constitute a material breach excusing the performance of the other (U.S. Department of Justice, 1998).
Chapter 1: Introduction
2
Security Exchange Commission (SEC) assesses the quality of financial statements of
cross-listed firms (non-U.S. firms listed on U.S. exchanges) based on three criteria:
transparency, comparability and full disclosure. However, the existing research in this
area investigates the quality of the information directly by studying the comparability
of non-U.S. Generally Accepted Accounting Principles (GAAP) to U.S. GAAP and
thus measuring indirectly the transparency of disclosures (Pownall and Schipper,
1999).
Prior studies indicate that disclosure quality (referred to in some studies as disclosure
level) is related to firm characteristics. This association has been linked to explanatory
variables from the research on agency costs, political costs, corporate governance and
information asymmetry (Ahmed and Courtis, 1999). Several studies investigate the
quality of accounting information based on the impact of corporate disclosure
practices and the usefulness of the information in decision-making. These studies
measure quality of disclosure based on the perception of the users, such as financial
analysts, shareholders, creditors and researchers, on the accounting numbers, and the
association of accounting information with share prices. In the association studies,
researchers examine the value relevance of accounting information, where value
relevance refers to the information being related to equity value.
A disclosure index is used in this thesis as a measure of disclosure quality. Five
categories of information required by AASB 1033 Presentation and Disclosure of
Financial Instruments are used to develop the index. These are disclosures of
accounting policy, hedges of anticipated transaction, risk information, net fair value
information and commodity contracts which are regarded as financial instruments. A

Chapter 1: Introduction
3
score is given for each item disclosed in each category. To make each category add
equally to the disclosure index, the score category is divided by the number of items
in each component of the index.
This study addresses the questions of whether the disclosure quality of derivative
information is related to specific firm characteristics and whether this quality is
perceived as an important factor in firm valuation (i.e. value relevant). This study
adds to the literature on the disclosure quality of derivative information in the
specialised setting of firms in the extractive industries.
The next section discusses prior research and the main findings of this thesis. Section
1.3 describes the motivation for this study. The structure of the thesis is outlined in
section 1.4.
1.2 Prior Research and the Main Findings of the Thesis
Prior studies indicate that disclosure quality is associated with certain firm
characteristics. Studies, dating back to 1971, have been providing evidence that a)
size of the firms (Singhvi and Desai, 1971; Firth, 1979; Cooke, 1989 and 1991;
Wallace, Naser and Mora, 1994; Ahmed and Nicholls, 1994; Riahi-Belkaoui, 2001;
Ali, Ahmed and Henry, 2003), b) auditor (Singhvi and Desai, 1971; Ahmed and
Nicholls, 1994; Wallace and Naser, 1995) and c) performance of the firm (Ali et al.,
2003) are positively related to disclosure quality. However, specific to the oil and gas
industries, Malone, Fries and Jones (1993) indicate that there is no association
between the size of the firm and auditor choice (Big 5 or Non-big 5) and disclosure
quality.

Chapter 1: Introduction
4
There is no direct evidence available on the association between disclosure quality
and the market value of the firm. Lang, Ready and Yetman (2003) and Gelb and
Zarowin (2002) provide indirect evidence on the association between disclosure
quality and share prices. Lang et al. (2003) provide evidence on the association
between disclosure quality and share prices based on the association between
accounting data (earnings) and share price. Gelb and Zarowin (2003) provide
evidence that the corporate level of disclosure is associated with share prices since
high disclosure firms have higher earnings response coefficients than low disclosure
firms.
The value relevance of financial instruments has been examined in the U.S. These
studies examine the value relevance of fair value under different accounting
standards. Barth (1994), Eccher, Ramesh and Thiagarajan (1996), Barth, Beaver and
Landsman (1996) and Park, Park and Ro (1999) provide evidence on the value
relevance of banks’ fair value disclosures under SFAS 107 Disclosures about Fair
Value of Financial Instruments. Simko (1999), on the other hand, extends the research
to non-financial firms. Venkatachalam (1996) extends these studies by examining the
implications of fair value disclosures under SFAS 119 Disclosure about Derivative
Financial Instruments and Fair Value of Financial Instruments. Mixed results are
reported.
The results of the current study indicate that the quality of derivative disclosures
among firms in the extractive industries has increased since the accounting standard,
AASB 1033 Presentation and Disclosure of Financial Instruments, was applicable.

Chapter 1: Introduction
5
However, firms still use discretion in the disclosure of derivative information,
especially in relation to net fair value. Overall, the multivariate analysis indicates that
larger firms tend to provide transparent derivative information within the extractive
industries. These findings hold for both the ranked regression technique and the
average of four years’ data (see Appendix B). Other variables significantly related to
derivative disclosure quality include the price-earnings ratio, profitability, market-to-
book ratio and the debt-to-equity ratio (leverage).
The multiple regression results from the market value models indicate that market
participants regard derivative information as value relevant. However, when
comparing net fair value information with other derivative information components,
i.e. hedge information and risk information components, the net fair value information
component is not value relevant. The incremental explanatory power of net fair value
and the unrealised gain or loss of financial instruments is very low compared to the
incremental explanatory power of the book value of financial and non-financial
instruments and earnings valued at historical costs. Nevertheless, the incremental
explanatory power of net fair value and the unrealised gain or loss on financial
instruments beyond book value of financial and non-financial instruments and
earnings valued at historical costs has increased from 1998 to 2001. However, the
opposite direction is reported for the incremental explanatory power of book value of
financial and non-financial instruments and earnings valued at historical cost. To a
limited extent, net fair value of financial instruments is value relevant. However, the
unrealised gain or loss of financial liabilities and off-balance sheet derivative financial
instruments are recorded as value relevant in the year-by-year analysis (see Table C 4
Appendix C).

Chapter 1: Introduction
6
1.3 Motivation Recent events in the business world, for example, the collapse of prominent
companies such as Enron, HIH Insurance and Barings Plc. have focused attention on
the importance of high quality financial reporting. Of relevance to this study is where
the collapses were due to the involvement of the company with derivative
instruments. In Australia some derivative instruments are not recognised in the
balance sheet. Therefore, extensive disclosures are required to ensure financial
statement users are aware of the significance of these instruments to an entity’s
financial position. The first motivating factor of this study is the limited research on
derivative disclosures in Australia. Prior studies have examined the quality of
accounting information in general, but only a limited number provide evidence on
derivative disclosures in Australia. The finance literature provides evidence on the
association between the use of derivatives and firm characteristics (e.g. Berkman,
Bradbury, Hancock and Innes, 2002; Nguyen and Faff, 2002). No attempt has been
made to examine the relationship between the disclosure quality of derivatives and
firm characteristics. The few Australian studies on derivative disclosures have been
surveys of accounting practice before the implementation of the AASB 1033
Presentation and Disclosure financial Instruments, for example Hancock (1994),
Berkman, Bradbury, Hancock and Innes (1997), Chalmers and Godfrey (2000) and
Chalmers (2001). The current study provides evidence of the association between
disclosure quality of derivative information and firm characteristics.
The second source of motivation justifies selecting firms in the extractive industries.
Prior studies have indicated that firms in the extractive industries extensively use

Chapter 1: Introduction
7
derivative instruments for hedging purposes (Berkman, Bradbury, Hancock and Innes,
1997) as compared to other industries. This is because of the significant exploration
and production risks inherent in the extractive industries2. Also derivatives are used
by extractive firms to underwrite and protect revenue. Moreover, Chalmers (2001) has
indicated that prior to AASB 1033 these firms provided information in their annual
reports. Therefore, it is relevant to examine the association between disclosure
practice and firm characteristics and the importance of the information in firm
valuation. Perhaps the most important factor is that these industries play a significant
role in the Australian economy, where they generate exports worth more than $30
billion in 2000 to 2002 and represent approximately 25% of the listed companies on
the Australian Stock Exchange (ASX). Therefore, examining this specific industry
may affect inferences regarding the value relevance of accounting information
(Simko, 1999).
The third motivating factor is that fair value accounting and hedge disclosures have
become significant topics of study in the U.S. since the Statement of Financial
Accounting Standards No 107 (SFAS 107) Disclosures about Fair Values of
Financial Instruments and SFAS 119 Disclosure about Derivative Financial
Instruments and Fair Value of Financial Instruments issued in 1991 and 1994,
respectively. However, the findings of these studies were based on samples from
banking industries in the U.S. and may not represent other industries and jurisdictions.
The reliability of these disclosures is questionable because fair value is based on
subjective estimates with potential for significant measurement error (Simko, 1999).
Therefore, research on the value relevance of derivative financial instruments, in
2 Includes oil, gas and mining industries, as per the IASC (2000). Please refer to section 2.5 chapter 2.

Chapter 1: Introduction
8
particular fair value disclosures and hedge disclosures, in the context of the extractive
industries in Australia will provide useful information on this complex area for both
Australian and international standard setters.
The fourth source of motivation is the impending harmonisation of accounting
standards. In 2005 Australia is expected to adopt most of the accounting standards
issued by the International Accounting Standards Board3. This includes IAS 39
Financial Instruments: Recognition and Measurement. The standard deals with
recognition and measurement of financial instruments at fair value. Given the fact that
ED 59 Financial Instruments, issued by AASB, has been rejected due to the
recognition and measurement issues, results from this study will provide evidence on
the readiness of Australian firms and investors to adopt IAS 39, i.e. to move towards a
fair value accounting regime.
The fifth source of motivation is that most regression models adopted in previous
value relevance studies (such as Barth 1994; Venkatachalam, 1996) are based on the
balance sheet model4. In this study the value relevance models are developed based on
the Ohlson (1995) model. The model provides a direct link between accounting
amounts and firm value, which is absent from other models (Barth, 2000). Results
from this study provide evidence on the robustness of prior results within this
methodology.
3 The International Accounting Standards Committee (IASC) became the International Accounting Standard Board (IASB) in 2001. 4 Where market value of equity represented by the market value of assets minus market value of liabilities.
Chapter 1: Introduction
9
1.4 Plan of Thesis
This thesis is structured in the following way. The following chapter describes the
institutional background surrounding financial reporting of derivative instruments in
Australia. The chapter begins by explaining the motivation for firms to use derivative
instruments. The comparative practices of accounting for financial instruments
between the U.S. and the IASC are then reviewed. This is followed by a discussion of
accounting for financial instruments in Australia. The discussion is based on the
disclosure and presentation of financial instruments required by the AASB 1033. One
important issue which has been investigated in the U.S. is the value relevance of fair
value required by various standards issued by the Financial Accounting Standard
Board (FASB). Surveys of Australian accounting practice are also discussed. Finally,
the chapter discusses the risk management practices in the extractive industries,
providing background evidence of the importance of derivatives for this industry. This
evidence indicates that studies on disclosure practice in this industry are important for
the economy.
Chapters three and four review prior studies on disclosure quality and value
relevance. Chapter three examines the association between disclosure quality and firm
characteristics. Studies investigating the quality of accounting information are
reviewed. The chapter begins by reviewing studies that examine disclosure quality in
different ways. Several studies indicate that to ensure high quality disclosures of
mandatory information, enforcement is an important issue. Selected empirical studies
are then reviewed as evidence of the association between disclosure quality

Chapter 1: Introduction
10
(disclosure level) and firm characteristics. Two Australian studies that have examined
the quality of derivative disclosures are also reviewed.
Chapter four discusses prior research on the value relevance of financial instruments.
The review provides a basis for understanding the benefits of disclosure to capital
market participants and firms. This chapter describes how capital market research has
emerged in accounting and how researchers use capital market data to explain the
relevance and reliability of financial statement information. Studies examining the
value relevance of financial instruments in the U.S., especially the fair value of
financial instruments, are reviewed. This helps to explain the need for extending value
relevance studies in other jurisdictions.
Chapter five describes the research questions developed based on the Australian
institutional environment and the prior literature. This study proposes questions that
relate to the disclosure quality of derivative information to the size of the firm,
performance of the firm, auditor, type of the extractive firm (limited liability or no-
liability firm), leverage and growth opportunities. Five research questions are
proposed that relate to the value relevance of derivative disclosures in firm valuation.
Chapter six describes the research methods and data collection procedures adopted.
Two main models are developed based on research questions presented in chapter
five. These are the firm characteristics model and market value model. Results on the
firm characteristics model are presented in chapter seven. Chapter seven provides
evidence that the quality of derivative disclosures has increased. The higher quality

Chapter 1: Introduction
11
derivative disclosures are associated with larger firms, performance of the firms and
high leverage firms.
Chapter eight presents the results of the market value model. The results indicate that
market participants regard disclosure quality as value relevant. However, the net fair
value information component is not significant, whereas the hedge information and
risk information components are value relevant. Also significant, to a limited extent,
is the net fair value of financial instruments. However, the incremental explanatory
power of net fair value and the unrealised gain or loss on financial instruments beyond
the book value of financial and non-financial instruments and earnings valued at
historical cost is very low. Nevertheless, the incremental explanatory power of net fair
value and the unrealised gain or loss on financial instruments has increased from 1998
to 2001.
Chapter nine provides some concluding comments. The chapter discusses the
contributions of the thesis to the literature, the limitations of the study and some
potential avenues for future research.
Chapter 2: Institutional Background
12
CHAPTER 2 INSTITUTIONAL BACKGROUND This chapter describes the institutional background surrounding financial instruments,
particularly derivative instruments. The organisation of this chapter is as follows. The
following section provides the institutional background, focusing on the current
situation for financial reporting of derivative instruments. Section 2.1 provides
background on the risks attached to the use of financial instruments and how firms
can manage their exposure to risks. Subsection 2.1.1 discusses whether firms should
use derivative instruments to hedge their exposure. Section 2.2 describes the
accounting standards issued by both the Financial Accounting Standards Board
(FASB) and the International Accounting Standard Board (IASB). This is followed by
a discussion of the accounting standard on derivative disclosures issued by the
Australian Accounting Standards Board (AASB). Section 2.3 describes fair value
accounting and section 2.4 presents research on derivative instruments in Australia.
Section 2.5 discusses risk management practices commonly used in the extractive
industries. Section 2.6 summarises the chapter.
2.1 Risk Management
Financial instruments5 expose firms to financial, economic and operational risks.
Changes in market conditions or the financial position of the parties to the financial
instruments or transactions expose firms to financial and economic risks. These risks
5 AASB 1033 defines a financial instrument as any contract that gives rise to both a financial asset of one entity and a financial liability or equity instrument of another entity.
Chapter 2: Institutional Background
13
are credit risk6, interest rate risk7, foreign exchange risk8, market risk9 and liquidity
risk10. Firms generally use the most common and practical methods to reduce or
eliminate the risks. These include limiting the exposure to both individual
counterparties and the number of specific instruments held, or through hedging the
risks with sophisticated instruments such as forward contracts or swaps. Operational
risks include fraud, failure to collect the amount due and human error (Sarwal, 1989).
These risks can be reduced through internal control. The focus of this section is on the
financial and economic risks, whereby derivative instruments are used to reduce these
risks.
Banks and financial institutions first introduced derivative instruments to help firms
manage their exposure to these risks. It has been documented in the U.S. that
derivatives are used by large corporations to reduce their exposure to a variety of risks
(Géczy, Minton and Schrand, 1997). Competition among banks and financial
institutions led to the development of innovative derivative instruments. To enable
firms to better manage the risks and uncertainties, financial institutions in particular,
have developed a variety of complex financial instruments (Scott, 1997). These
innovative instruments are based on four basic derivative instruments, including
forward contracts, future contracts, options and swaps. A recent market survey by the
International Swaps and Derivatives Association (ISDA) indicates that the global
6 The risk that a borrower will not able to meet its obligations. The risk can be classified into country risk, industry risk, counterparty risk, settlement risk and transfer risk. 7 The risk of loss through mismatching the interest bases of assets and liabilities. The risk can be classified further into net interest risk, spread risk and basis risk 8 The risk of loss as a result of an unfavourable movement in exchange rates. 9 The risk of loss resulting from changes in the market value of negotiable instruments due to factors other than interest and exchange rates. 10 The risk can be classified as cash liquidity or market liquidity. Cash liquidity is the risk of loss resulting from the inability to meet financial obligations as they arise, due to a lack of liquid resources. Market liquidity refers to the risk of loss from not being quickly able to sell financial instruments at full market value, when required.
Chapter 2: Institutional Background
14
over-the-counter (OTC) derivatives volumes increased by 8.14% in 2000. The volume
globally totalled US$63.009 trillion at year-end 2000. According to Mr. Thomas K.
Montag, the vice-chairman of the ISDA, this is due to the continuing growth in
interest rates and currency products that influence managers to use the most effective
tools to manage potentially adverse economic movements (ISDA, 2002).
2.1.1 To Hedge or Not to Hedge?
Exposure to the risks can cause earnings volatility (Nance, Smith and Smithson, 1993;
and Pincus and Rajgopal, 2002) and financial managers can manage the risks in
several ways. They can either do nothing, or alternatively they can hedge the risks.
Managers can hedge the exposure internally or externally (Hassan, 1994, p. 11;
Hassan, Mohd Saleh and Ismail, 1996; 1998). Internal hedging requires firms to use a
variety of in-house options such as matching techniques, intercompany netting
systems, pricing considerations and asset and liability management. On the other
hand, external hedging requires firms to use a variety of hedging products, such as
forward contracts, swaps and futures contracts11, available in the market to minimise
or offset the risk.
Previous studies have examined the motivation for firms to purchase hedging
instruments. These include the perception that hedging can increase firm value, by
reducing expected taxes, expected costs of financial distress or other agency costs
(Nance et al., 1993). Guay (1999) indicates that firms use derivatives to hedge the
entity risks. Perhaps by hedging managers are able to present the true earnings
11 These instruments are known as derivative financial instruments.

Chapter 2: Institutional Background
15
capacity of the firms since hedging reduces factors that are outside of managerial
control (DaDalt, Gay and Nam, 2001). However, Koonce, McAnally and Mercer
(2000) indicate that investors are less willing to invest in a company that uses
derivatives as they judge derivatives as riskier than non-derivatives.
Under certain circumstances hedging firm risk increases a firm’s value (Nance et al.,
1993). The value of the firm increases by reducing expected taxes, the costs
associated with financial distress and agency costs. Koonce et al. (2000) conduct three
experimental studies to provide evidence on risk. They document that investors do
consider traditional risk factors, i.e. probabilities and outcomes, when judging the risk
of financial items. However, investors put greater weight on loss probabilities and loss
outcomes than on gain probabilities and gain outcomes.
Barnes (2001) indicates that two factors motivating firms to hedge the risks are: a)
maximisation of shareholder value and b) maximisation of managerial utility. Prior
studies investigate three issues that are associated with corporate risk management
within the shareholder maximisation hypotheses. These are financial distress,
investment policy and taxation. Managerial risk aversion and signalling managerial
skills are two variables that are associated with corporate risk management within the
managerial utility maximisation hypothesis.
Tufano (1996) extends research by Smith and Stulz (1985), Stulz (1984, 1990),
DeMarzo and Duffie (1995), Nance et al. (1993), Lessard (1990) and Breeden and
Viswanathan (1996) (in Tufano, 1996) in the gold mining industry. He found that the
predictions of shareholder maximisation hypothesis are not well supported by the
Chapter 2: Institutional Background
16
data. However, Tufano found that firms whose managers own more stock options
manage less gold price risk and those firms whose managers have more wealth
invested in common stock manage more gold price risk (managerial utility
maximisation hypothesis).
Géczy, Minton and Schrand (1997) extend previous studies by examining the use of
currency derivatives of firms that have ex ante exposure to foreign exchange-rate risk.
They found that firms with greater growth opportunities and tighter financial
constraints are more likely to use currency derivatives. Further, they found that firm
characteristics were related to the costs of implementing a specific derivatives
strategy. They also provide evidence that the benefits of using currency derivatives
are related to the general decision to use currency derivatives and the specific choice
between the various types of currency instruments.
2.2 International Accounting Practices
Investors have been alerted to the importance of transparent financial reporting of risk
and uncertainty as recent significant losses experienced by prominent companies, such
as Barings Plc., Proctor and Gamble and Gibson Greeting, resulted from the
inappropriate use of derivatives. Since then, financial reporting has witnessed an
increase in the disclosure of risk information by U.S. and U.K. companies. Most
accounting standard setters (especially in the U.S.), the International Accounting
Standard Board (IASB) and those in the U.K. have been forced to respond by
requiring more disclosures. The following subsections discuss the development of the
Chapter 2: Institutional Background
17
respective accounting standard issued by the Financial Accounting Standard Board
(FASB) and the IASB.
2.2.1 Financial Accounting Standard Board
The Financial Accounting Standards Board (FASB) in the United States has issued
seven accounting pronouncements pertaining to financial instruments since 1990.
Compared to other accounting standards boards, the FASB is more advanced in
regulating the accounting treatment for derivative instruments, even though the
approach employed has been piecemeal (Blankley and Scroeder, 2000). However, the
development of the regulation for derivative instruments (SFAS 133 Accounting for
Derivative Instruments and Hedging Activities) took the FASB 10 years.
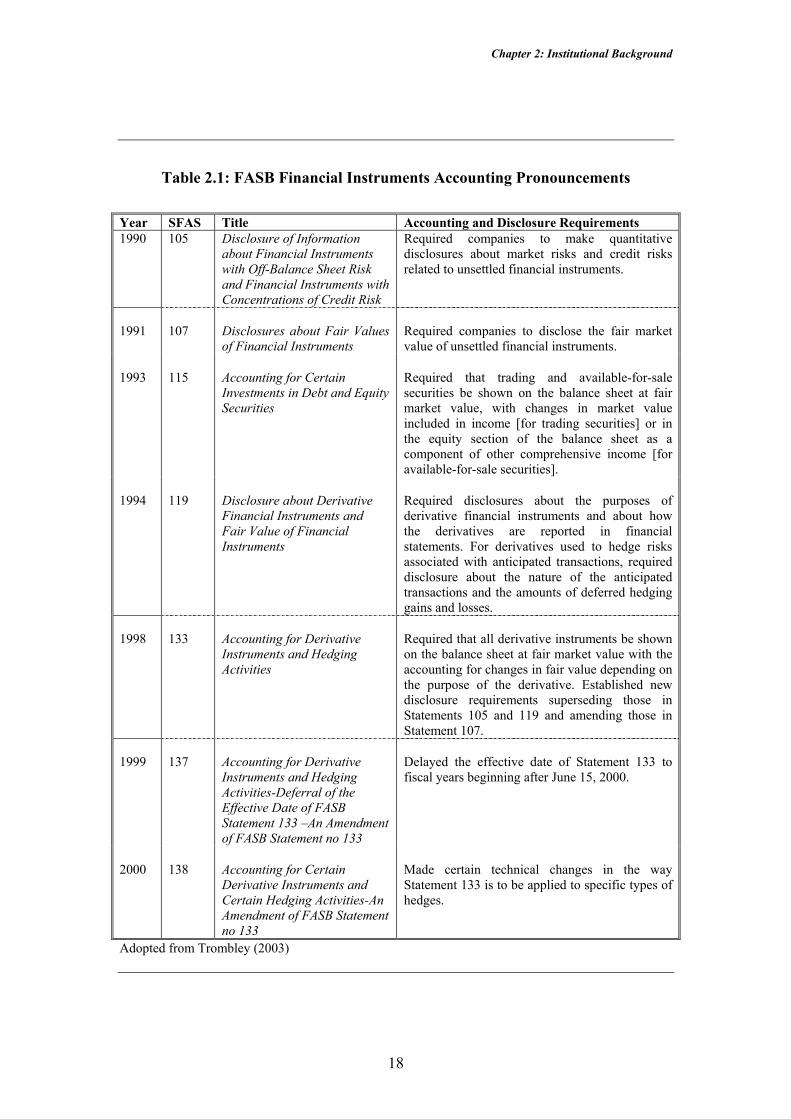
Table 2.1 summarises the progress of the FASB financial instruments accounting
pronouncements. Prior to the issuance of SFAS 133, the FASB has issued SFAS 119
Disclosure about Derivative Financial Instruments and Fair Value of Financial
Instruments, to improve the previous standards12. In 1998 the FASB issued SFAS
133. However, its implementation was deferred until 2000. The standard requires all
derivative instruments to be shown on the balance sheet at fair market value.
Nevertheless, the FASB issued SFAS 138 as an amendment to SFAS 133, wherein
certain technical changes from SFAS 133 are introduced.
12 Summary of this standard is presented in Table 2.3.
Chapter 2: Institutional Background
18
Table 2.1: FASB Financial Instruments Accounting Pronouncements Year SFAS Title Accounting and Disclosure Requirements 1990 105 Disclosure of Information
about Financial Instruments with Off-Balance Sheet Risk and Financial Instruments with Concentrations of Credit Risk
Required companies to make quantitative disclosures about market risks and credit risks related to unsettled financial instruments.
1991
107
Disclosures about Fair Values of Financial Instruments
Required companies to disclose the fair market value of unsettled financial instruments.
1993
115
Accounting for Certain Investments in Debt and Equity Securities
Required that trading and available-for-sale securities be shown on the balance sheet at fair market value, with changes in market value included in income [for trading securities] or in the equity section of the balance sheet as a component of other comprehensive income [for available-for-sale securities].
1994
119
Disclosure about Derivative Financial Instruments and Fair Value of Financial Instruments
Required disclosures about the purposes of derivative financial instruments and about how the derivatives are reported in financial statements. For derivatives used to hedge risks associated with anticipated transactions, required disclosure about the nature of the anticipated transactions and the amounts of deferred hedging gains and losses.
1998
133
Accounting for Derivative Instruments and Hedging Activities
Required that all derivative instruments be shown on the balance sheet at fair market value with the accounting for changes in fair value depending on the purpose of the derivative. Established new disclosure requirements superseding those in Statements 105 and 119 and amending those in Statement 107.
1999
137
Accounting for Derivative Instruments and Hedging Activities-Deferral of the Effective Date of FASB Statement 133 –An Amendment of FASB Statement no 133
Delayed the effective date of Statement 133 to fiscal years beginning after June 15, 2000.
2000
138
Accounting for Certain Derivative Instruments and Certain Hedging Activities-An Amendment of FASB Statement no 133
Made certain technical changes in the way Statement 133 is to be applied to specific types of hedges.
Adopted from Trombley (2003)
Chapter 2: Institutional Background
19
2.2.1.1 SFAS 133 Accounting for Derivative Instruments and Hedging Activities.
This standard requires that all derivative instruments are to be measured at fair value
and recognised in the statement of financial position either as assets or liabilities. The
derivatives can be designated into three types of exposures: fair value exposure, cash
flow exposure and exposure to changes in the value of net investment in a foreign
operation (Trombley, 2003, p.34), if certain conditions are met13. The derivatives are
to be accounted for in the financial statements based on their intended use and their
resulting designation14. The gain or loss for a fair value hedge15 is recognised in
earnings in the period of change together with the offsetting loss or gain on the
hedged item attributable to the risk being hedged. The treatment also applies to a
derivative designated as a hedge of the foreign currency exposure of an unrecognised
firm commitment or available for sale security.
The total gain or loss for a cash flow hedge16 has to be separated into the effective and
ineffective portions. The effective portion of the gain or loss is initially reported as a
component of other comprehensive income and subsequently reclassified as an
earnings component when the forecasted transaction affects earnings. However, the
ineffective portion will immediately be reported in the earnings component. This
treatment also applies to a derivative designated as a hedge of the foreign currency
exposure of a foreign-currency-denominated forecasted transaction.
13 The conditions where hedge accounting is allowed relate to: a) the nature of the hedged risk (interest rate risks, price risks, foreign currency exchange risks and credit risks), b) the hedge effectiveness and c) documentation. 14 The intended use or designation refers to the purpose of the hedging. The results from the designation is the gain or loss that can off-set the loss or gain from the hedged item. 15 Refers to derivatives designated as hedging the exposure to changes in the fair value of a recognised asset, liability or an unrecognised firm commitment. 16 A derivative designated as hedging the exposure to variable cash flows of a forecasted transaction.
Chapter 2: Institutional Background
20
The gain or loss for a foreign currency hedge on foreign currency exposure of a net
investment in a foreign operation is to be reported in other comprehensive income as
part of the cumulative translation adjustment. The gain or loss for a derivative not
designated as a hedging instrument is recognised in earnings in the period of change.
2.2.2 International Accounting Standards Board
2.2.2.1 IAS 32 Financial Instruments: Disclosure and Presentation IAS 32 was approved by the International Accounting Standards Committee (IASC)17
Board in March 1995 to deal with the disclosure and presentation of financial
instruments. This standard was the result of a joint project with the Canadian Institute
of Chartered Accountants. The standard was amended twice, (once in 1998 and again
in 2000) to be consistent with IAS 39 Financial Instrument: Measurement and
Recognition, issued after IAS 32 and to eliminate any disclosure requirements made
redundant by IAS 39. Basically, IAS 32 deals with the: a) classification of financial
instruments as liabilities or equity, by the issuers, and the classification of related
interest, dividends and gain or loss, b) offsetting of financial assets and financial
liabilities and c) disclosure of information about financial instruments.
The standard requires:
the issuer of a financial instrument to classify the instrument (or its component parts) as a liability or as equity in accordance with the substance of the contractual arrangement on initial recognition and the definitions of a financial liability and an equity instrument.
17 The IASC became the International Accounting Standard Board (IASB) in 2001.
Chapter 2: Institutional Background
21
The instrument is classified as a financial liability when the issuer is obliged to deliver
cash or another financial asset to another party. The classification continues until the
financial instrument is removed from the enterprise’s balance sheet. As an example, a
company issues a mandatory redemption preferred share for a fixed amount at a fixed
date. Since there is a contract that obliges the issuer to redeem the instrument at the
predetermined amount and date, the instrument must be reported as a financial
liability.
However, when the issuer issues a financial instrument that contains both a liability
and equity element, the standard requires a separate presentation of the instrument’s
components on the issuer’s balance sheet. A convertible bond is an example of such a
financial instrument.
The standard also requires the enterprise to present a financial asset and a financial
liability on a net basis when it:
i.has a legally enforceable right to set off the recognised amounts; and
ii.intends either to settle on a net basis, or to realise the asset and
settle the liability simultaneously. The standard requires firms to disclose: a) risk management policies, including the
policy for hedging each major type of forecasted transaction (paragraph 43A, IAS 32),
b) terms, conditions and accounting policies for each class of financial asset, financial
liability and equity instruments, both recognised and unrecognised (paragraph 47), c)
interest rate risk exposure (paragraph 56), d) credit risk exposure (paragraph 66), e)
fair value of each class of financial assets and liabilities, recognised and unrecognised
Chapter 2: Institutional Background
22
(paragraph 77) and f) financial assets carried at an amount in excess of fair value
(paragraph 88).
2.2.2.2 IAS 39: Financial Instruments: Recognition and Measurement
The second phase of the joint project between the IASC and the Canadian Institute of
Chartered Accountants addresses the issues of recognition, de-recognition,
measurement and hedge accounting. As a result, IAS 39 was issued in December
1998. The standard addresses the issues of recognition and measurement only. The
standard requires: a) all financial assets and financial liabilities, including derivatives,
to be recognised on the balance sheet and measured at cost (which is the fair value of
the consideration given or received to acquire the financial asset or liability), b)
subsequent to initial recognition, all financial assets should be re-measured at fair
value (except for loans and receivables originated by the enterprise, other mixed
maturity investments and financial assets whose fair value cannot be reliably
measured), c) most financial liabilities (except for derivatives and liabilities held for
trading which should be remeasured to fair value) be measured at their original
recorded amount less principal repayments and amortisation and d) those financial
assets and liabilities that are remeasured to fair value, a firm has the option to either: i)
recognise the entire adjustment in net profit or loss for the period, or ii) recognise
changes in fair value (the period only) of financial assets and liabilities held for
trading in net profit or loss, and for non-trading instruments, the change in value is
reported in equity until the financial asset is sold, at which time the realised gain or
loss is reported in net profit or loss.
Chapter 2: Institutional Background
23
2.2.3 Accounting for Financial Instruments in Australia
2.2.3.1 AASB 1033 Presentation and Disclosure of Financial Instruments
AASB 1033 Presentation and Disclosure of Financial Instruments was issued in 1996
and developed based on ED 65 Presentation and Disclosure of Financial Instruments.
The predecessor of ED 65, ED 59 Financial Instruments, was released in March 1993.
However, ED 59, which attempted to introduce recognition and measurement rules for
financial instruments in addition to disclosure requirements, was withdrawn.
Extensive lobbying against the recognition and measurement of financial instruments
caused the Australian standard setters to defer the recognition and measurement issue
until an equivalent international standard was issued.
All publicly listed companies in Australia, which issue or hold financial instruments,
should comply with the requirements of AASB 1033. The standard focuses only on
the presentation and disclosure of financial instruments. AASB 1033 was
subsequently amended in 1999 to include the requirement of converting financial
instruments to achieve greater harmonisation with the international standard, IAS 32
Financial Instruments: Disclosure and Presentation, which was amended to reflect
the issuance of IAS 3918 as discussed in a previous subsection. Table 2.2 presents a
summary of the development of accounting standards for financial instruments in
Australia.
18 With the move to full harmonisation in 2005, it is planned that Australia will adopt the requirements of IAS 39 Financial Instruments: Recognition and Measurement issued in 1999.
Chapter 2: Institutional Background
24
Table 2.2: Summary of Development of Accounting Pronouncements Related to Financial Instruments in Australia
Date
issued Pronouncement Title Application
Because AASB 1033 does not specify rules for the recognition and measurement of
financial instruments, its disclosure requirements are extensive. These disclosures are
expected to enhance financial statement users’ understanding of the significance of
recognised and unrecognised financial instruments to an entity’s financial position,
financial performance and cash flows. They should also assist investors in assessing
19 Instead of settlement through physical receipt or delivery of a commodity, commodity-linked financial instruments require settlement through cash payments that are determined according to a formula contained in the contract. 20 Converting financial instruments are financial instruments that mandatorily convert to equity instruments of the issuer.
Chapter 2: Institutional Background
25
the amounts, timing and certainty of future cash flows associated with those
instruments (AASB 1033, paragraph 5.1.1).
Many derivative financial instruments are not recognised as assets and liabilities in the
balance sheet and the unrealised gain or loss on these instruments is not recorded in
the income statement. Therefore, firms are required to disclose information related to
the instruments. This includes the objectives of holding or issuing derivative financial
instruments (paragraph 5.3). The disclosure will help users understand why entities
use derivatives (by explaining the risks attached to the entity) and what they want to
achieve by the use of the derivatives. In addition, firms are required to disclose
information about hedge activities if they use financial instruments to manage risk
associated with anticipated future transactions. Paragraph 5.8 requires firms to
disclose:
a) a description of the anticipated transactions, including the period of time until they are expected to occur,
b) a description of the hedging instruments,
c) the amount of any deferred or unrecognised gain or loss21 and
the expected timing of recognition as revenue or expense.
The amount included in paragraph (c) includes all accrued gains and losses on hedge
instruments. The unrealised gain or loss may result from the difference between the
net fair value and the historical cost of financial instruments. The net fair value
amount must be disclosed in accordance with paragraph 5.6 AASB 1033. This
21 The amount includes all accrued gains or losses on financial instruments designated as hedges of anticipated transactions. The accrued gain or loss may be unrealised (as a results of carrying the hedging instrument at net fair value) but recorded in the statement of financial position, or it may be unrecognised (if the instrument is carried at cost), or it may be realised. However, the accrued gain or loss has not been recognised in the calculation of net profit or loss pending completion of hedging transaction (paragraph 5.8.2 AASB 1033).

Chapter 2: Institutional Background
26
information permits the users of an entity’s financial report to understand the nature
and effects of hedges of anticipated future transactions.
Disclosure of net fair value is not restricted to the recognised financial assets and
liabilities. It also applies to unrecognised derivative financial instruments, which are
normally used for hedging or managing risks. Paragraph 5.6 AASB 1033 requires
firms to disclose:
a) the aggregate net fair value as at the reporting date, showing separately the aggregate net fair value of those financial assets or financial liabilities which are not readily traded on organised markets in standardised form,
b) the method or methods adopted in determining net fair
value, and
c) any significant assumptions made in determining net fair value.
Further, the standard requires more information when one or more financial assets are
recognised at an amount in excess of their net fair value. Paragraph 5.7 of AASB 1033
requires firms to disclose:
a) the carrying amount and the net fair value of either the individual assets or appropriate groupings of those individual assets, and
b) the reasons for not reducing the carrying amount, including the
nature of the evidence that provides the basis for management’s belief that the carrying amount will be recovered.
In addition to the above, firms are also required to disclose terms, conditions, the
accounting policies adopted (paragraph 5.2), interest rate risk (paragraph 5.4), credit
risk (paragraph 5.5) and also commodity contracts which are regarded as financial
instruments (paragraph 5.9). Paragraph 5.2 will help users understand the effect of
instruments on the amount, timing and certainty of future cash flows. Paragraphs 5.4
and 5.5 will help users understand the risks to which the entity is exposed and thus the
effect of these risks on future profits.
Chapter 2: Institutional Background
27
For the purposes of this study, AASB 1033 is assumed to be a “high quality”
disclosure standard. This is a reasonable claim because of the extensive nature of the
disclosure requirements, designed to overcome the lack of guidance with regard to
recognition and measurement. Therefore, firms that prepare their annual reports based
on this standard, are said to provide “high quality” derivative information.
Correspondingly, failure to comply with this standard would suggest that derivative
disclosures are of low quality. Table 2.3 compares the disclosure requirements of
AASB 1033 with related FASB and IASB standards.
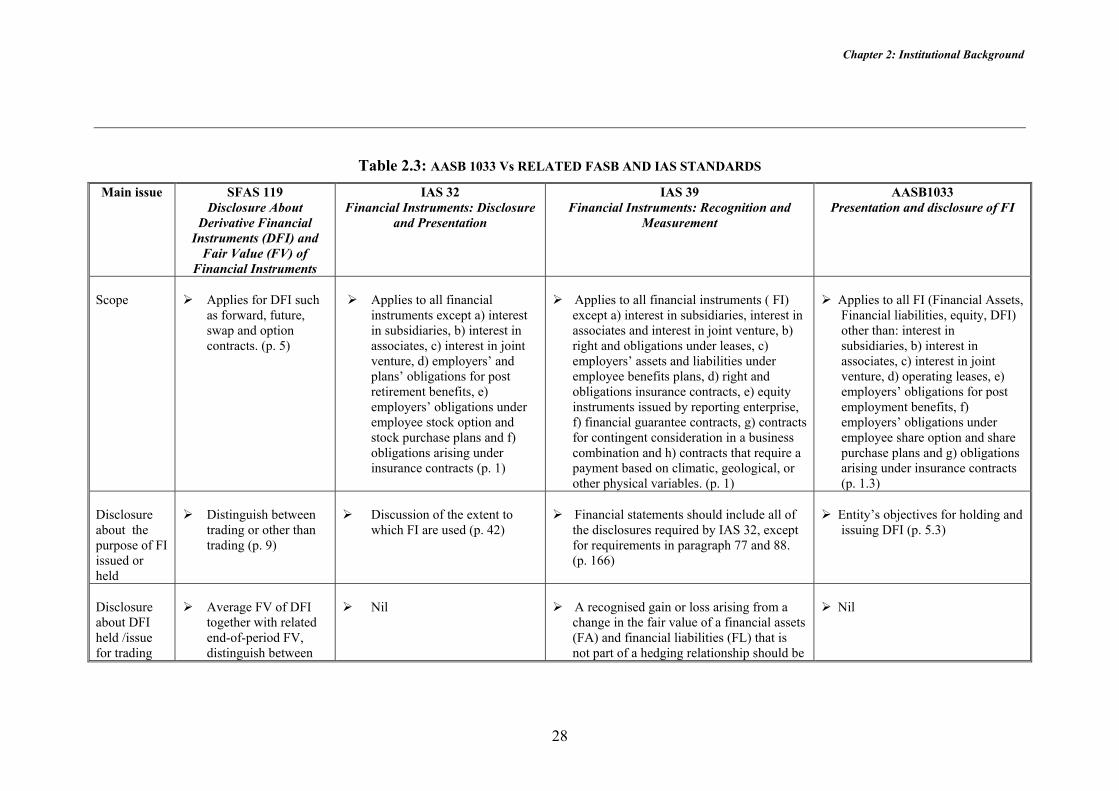
Chapter 2: Institutional Background
28
Table 2.3: AASB 1033 Vs RELATED FASB AND IAS STANDARDS
Main issue SFAS 119 Disclosure About
Derivative Financial Instruments (DFI) and
Fair Value (FV) of Financial Instruments
IAS 32 Financial Instruments: Disclosure
and Presentation
IAS 39 Financial Instruments: Recognition and
Measurement
AASB1033 Presentation and disclosure of FI
Scope
Applies for DFI such
as forward, future, swap and option contracts. (p. 5)
Applies to all financial
instruments except a) interest in subsidiaries, b) interest in associates, c) interest in joint venture, d) employers’ and plans’ obligations for post retirement benefits, e) employers’ obligations under employee stock option and stock purchase plans and f) obligations arising under insurance contracts (p. 1)
Applies to all financial instruments ( FI)
except a) interest in subsidiaries, interest in associates and interest in joint venture, b) right and obligations under leases, c) employers’ assets and liabilities under employee benefits plans, d) right and obligations insurance contracts, e) equity instruments issued by reporting enterprise, f) financial guarantee contracts, g) contracts for contingent consideration in a business combination and h) contracts that require a payment based on climatic, geological, or other physical variables. (p. 1)
Applies to all FI (Financial Assets,
Financial liabilities, equity, DFI) other than: interest in subsidiaries, b) interest in associates, c) interest in joint venture, d) operating leases, e) employers’ obligations for post employment benefits, f) employers’ obligations under employee share option and share purchase plans and g) obligations arising under insurance contracts (p. 1.3)
Disclosure about the purpose of FI issued or held
Distinguish between
trading or other than trading (p. 9)
Discussion of the extent to
which FI are used (p. 42)
Financial statements should include all of
the disclosures required by IAS 32, except for requirements in paragraph 77 and 88. (p. 166)
Entity’s objectives for holding and
issuing DFI (p. 5.3)
Disclosure about DFI held /issue for trading
Average FV of DFI
together with related end-of-period FV, distinguish between
Nil
A recognised gain or loss arising from a
change in the fair value of a financial assets (FA) and financial liabilities (FL) that is not part of a hedging relationship should be
Nil
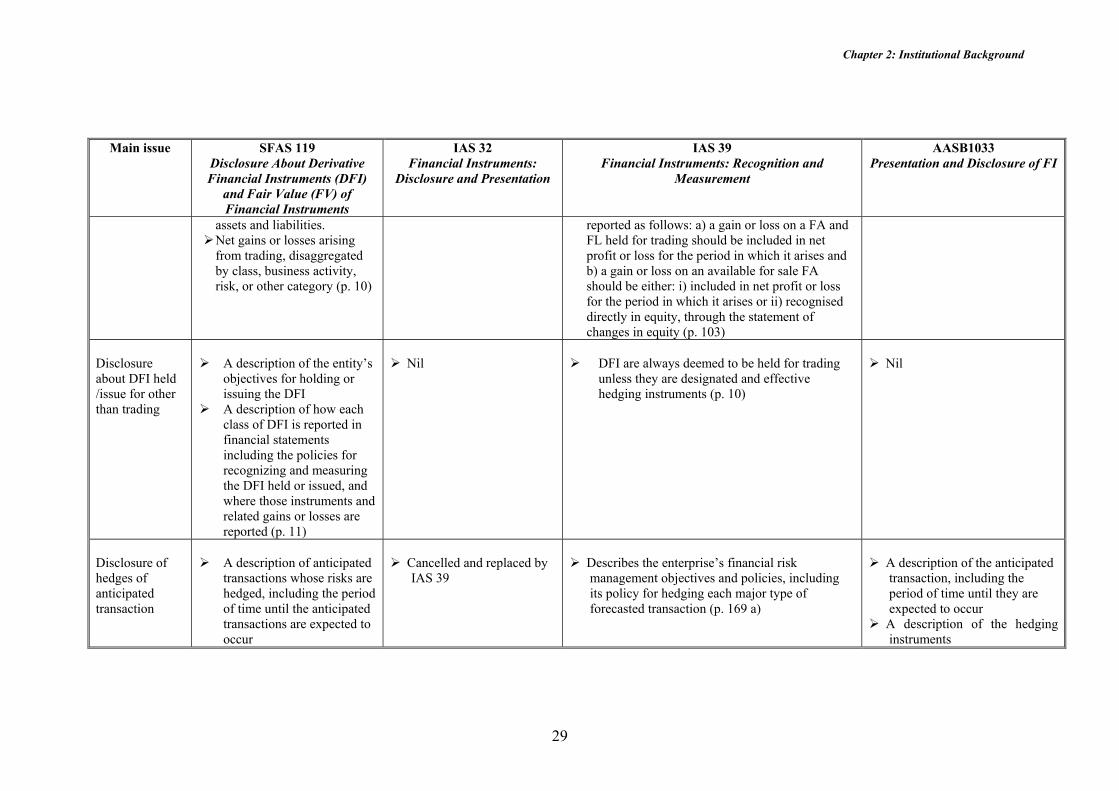
Chapter 2: Institutional Background
29
Main issue SFAS 119
Disclosure About Derivative Financial Instruments (DFI)
and Fair Value (FV) of Financial Instruments
IAS 32 Financial Instruments:
Disclosure and Presentation
IAS 39 Financial Instruments: Recognition and
Measurement
AASB1033 Presentation and Disclosure of FI
assets and liabilities. Net gains or losses arising from trading, disaggregated by class, business activity, risk, or other category (p. 10)
reported as follows: a) a gain or loss on a FA and FL held for trading should be included in net profit or loss for the period in which it arises and b) a gain or loss on an available for sale FA should be either: i) included in net profit or loss for the period in which it arises or ii) recognised directly in equity, through the statement of changes in equity (p. 103)
Disclosure about DFI held /issue for other than trading
A description of the entity’s
objectives for holding or issuing the DFI
A description of how each class of DFI is reported in financial statements including the policies for recognizing and measuring the DFI held or issued, and where those instruments and related gains or losses are reported (p. 11)
Nil
DFI are always deemed to be held for trading
unless they are designated and effective hedging instruments (p. 10)
Nil
Disclosure of hedges of anticipated transaction
A description of anticipated
transactions whose risks are hedged, including the period of time until the anticipated transactions are expected to occur
Cancelled and replaced by
IAS 39
Describes the enterprise’s financial risk
management objectives and policies, including its policy for hedging each major type of forecasted transaction (p. 169 a)
A description of the anticipated
transaction, including the period of time until they are expected to occur
A description of the hedging instruments

Chapter 2: Institutional Background
30
Main issue
SFAS 119 Disclosure About Derivative Financial Instruments (DFI)
and Fair Value (FV) of Financial Instruments
IAS 32 Financial Instruments:
Disclosure and Presentation
IAS 39 Financial Instruments: Recognition and Measurement
AASB1033 Presentation and Disclosure of
FI
Description of classes of
DFI used to hedge anticipated transaction
Amount of hedging gains or losses explicitly deferred,
A description of the transaction or other events that result in the recognition in earnings of gains or losses deferred by hedge accounting (p. 11)
Disclose separately for designated fair value hedges, cash flow hedges and hedges of a net investment: i) a description of the hedge, ii) a description of the financial instruments designated as hedging instruments for the hedge and their fair values at the balance sheet date and iii) the nature of the risks being hedged
The amount of any deferred
or unrecognised gain or loss and the expected timing of recognition as revenue or expense (p. 5.8)
Net FV disclosure
Average FV of DFI
together with related end-of-period FV, distinguish between assets and liabilities (p.10)
For each class of FA
and FL, both recognised and unrecognised, an enterprise should disclose information about fair value (p. 77)
The FI are measured at cost, which is the fair value
of the consideration given or received (p. 66) After initial recognition, an enterprise should
measure FI, including derivatives that are assets, at their fair values, without any deduction for transaction costs that it may incur on sale or other type of disposal (p. 69).
After initial recognition, an enterprise should measure liabilities held for trading and derivatives that are liabilities at fair value, except for a derivative liability that is linked to and that must be settled by the delivery of an unquoted equity instrument whose fair value cannot be reliably measured, which should be measured at cost (p. 93)
The aggregate NFV as at the
reporting date, showing separately the aggregate NFV of those financial assets (FA) or financial liabilities (FL) which are not readily traded in organised markets in a standardised form
the method or methods adopted in determining NFV
any significant assumptions made in determining NFV (p. 5.6)

Chapter 2: Institutional Background
31
2.3 Fair Value Accounting
Fair value accounting22 has become the preferred option of accounting for financial
instruments as opposed to historical cost. The major reasons for this preference are: a)
cost is not relevant or understandable, b) the practicality in measuring financial
instruments at fair value, c) fair value eliminates issues which arise from using the
cost method, d) fair value is not overly different to the current practice and e) the
benefits of fair value are obtainable at a reasonable cost (Hancock, 1996). As a result
the FASB has issued SFAS 107 Disclosures about Fair Value of Financial
Instruments which requires firms to disclose the fair value of financial instruments. A
move to fair value appears to be due to the belief that market-based information is the
most relevant financial data for financial statement users. The standard was amended
by SFAS 119 Disclosure about Derivatives Financial Instruments and Fair Value of
Financial Instruments. However, these standards failed to provide adequate fair value
information and the disclosure about derivatives has not been uniform (Feay and
Abdullah, 2001). Therefore, the FASB 133 was issued to overcome these issues. The
disclosure of fair value information is expected to provide more useful information for
users to assess the effects of derivative transactions (Rasch and Wilson, 1998).
However, critics of fair value accounting are concerned that fair value may be less
reliable than historical costs since managers may use their discretion to manipulate the
information (Ahmad, 2000). As a result investors could be reluctant to base valuation
decisions on these subjective estimates (Barth, 1994). Another concern is that fair
22 AASB 1033 defines fair value as the amount for which an asset could be exchanged, or liability settled, between knowledgeable, willing parties in an arm’s length transaction. The term ‘fair value’ is used interchangeably with mark-to-market, market value-based and market value accounting.
Chapter 2: Institutional Background
32
values may increase the volatility of income as compared to historical costs (Barth,
Landsman and Wahlen, 1995; Feay and Abdullah, 2001). For example, in Australia
ED 59 was criticised by the banking industries who opposed market value
measurement method. The banks were concerned that market value may increase the
volatility of earnings (Hancock, 1996).
The FASB in the U.S. and the IASB are ahead of the AASB in requiring firms to
measure financial instruments based on fair value (Chalmers and Godfrey, 2000).
Nevertheless, the net fair value23 disclosures required by the AASB reduce the gap
between the Australian and international jurisdictions. The reason for these disclosure
requirements is the net fair value is relevant to financial statement users. Net fair
value:
reflects the judgement of financial markets as to the present value of expected
future cash flows relating to an instrument,
permits the comparison of financial instruments having substantially the same
economic characteristics, and
provides a neutral basis for assessing management’s stewardship by indicating the
effect of its decisions to buy, sell or hold financial assets and to incur, maintain or
discharge financial liabilities (AASB 1033 paragraph 5.6.1).
Disclosure of net fair value is not restricted to the recognised financial assets and
liabilities, it also applies to unrecognised derivative financial instruments, which are
normally used for hedging or managing risks. The AASB 1033 allows management to
23 Para 7 of AASB 1033 defines net fair value as, the fair value of asset (liability) after deducting (adding) costs expected to be incurred were the asset (liability) to be exchanged (settled).

Chapter 2: Institutional Background
33
use their discretion in the assumptions made in determining the valuation method as
described in paragraph 5.6. Hence, the reliability of net fair value remains
questionable.
The issue of fair value accounting is the lack of specific definition of the term ‘fair
value’, especially when the capital markets are not perfect and complete (Bradbury,
2000). For example, IAS 39 Financial Instruments: Recognition and Measurement,
paragraph 8 and AASB 1033 paragraph 7, refer to fair value as the amount for which
an asset could be exchanged, or a liability settled, between knowledgeable, willing
parties in an arm’s length transaction. However, the FASB defines fair value as the
price at which the asset could be sold or liability could be settled. Hence, the first
approach is based on a user’s perspective rather than the seller’s perspective, which is
adopted by the FASB (Bradbury, 2000).
Barth and Landsman (1995) indicate that fair value can be measured based on: a)
value in use24, b) entry value25, c) exit value26 or d) value to the entity (combination of
measures). Value in use has the potential to provide more information than market
prices if an imperfect market exists (Barth and Landsman, 1995). However, the value
is very subjective and subject to potential manipulation (Bradbury, 2000). The FASB
has adopted exit price as the measure of fair value, while the Australian Accounting
Research Foundation (AARF) supports the value to the entity measurement. However,
the exit value and value to the entity may not be material, in an active and liquid
market, because the entry price and exit price will converge (Bradbury, 2000).
24 IAS 36 Impairment of Assets defines value in use as the present value of estimated future cash flows expected to arise from the continuing use of an asset and from its disposal at the end of its life. 25 This refers to purchase price. 26 This refers to the price at which the asset could be sold or liability could be settled.

Chapter 2: Institutional Background
34
A recent study by Deloitte Touche Tohmatsu (2000) indicates that there is no clear
consensus for a move to fair value accounting for all financial instruments in
Australia. However, Fargher (2001) indicates that managers of financial institutions
are not unanimously opposed to the use of fair value accounting for all financial
instruments. This is contradictory to their counterparts in the U.S. who are opposed to
the application of fair value accounting across the board to financial instruments
(Smith, 2000). However, the final decision of whether to move or not to move to fair
value accounting should take into consideration the users’ perspective. A recent study
on the views of two groups of financial statement user by Tan, Tower, Hancock and
Taplin (2003) indicate that there is no evidence on the agreement among Australian
investors as to the usefulness of fair value accounting for financial instruments.
However, they acknowledge that this might be due to the limitation of a small sample
size.
Australian firms have accepted the requirement to make quantitative disclosures
concerning the fair values of derivative instruments. However, the quality of these
disclosures is less than satisfactory. Based on their study of the accounting practices
among Australia’s largest 500 firms, Chalmers and Godfrey (2000) report that the
major weaknesses are the lack of accounting policy disclosures relating to specific
types of instruments and incompleteness in fair value disclosures. These hinder the
understandability, comparability and consistency of derivative instruments
information.

Chapter 2: Institutional Background
35
Fair value accounting and hedge disclosure have become considerable topics of study
in the U.S. since the Statement of Financial Accounting Standards No 107 (SFAS
107) Disclosures about Fair Values of Financial Instruments and SFAS 119
Disclosure about Derivative Financial Instruments and Fair Value of Financial
Instruments were issued in 1991 and 1995, respectively. However, the findings of this
research are based on banking industries in the U.S. and may not represent other
industries and jurisdictions. For example, the study by Cornett, Rezaee and Tehranian
(1996) provides evidence that market participants view the announcements of fair
value accounting as detrimental to the value of commercial banks. Moreover the
reliability of these disclosures is questionable because the fair value is based on the
subjective estimates with potential for significant measurement error (Simko, 1999).
Therefore, research on the value relevance of derivative financial instruments, in
particular fair value disclosures and hedge disclosures, in the context of the extractive
industries in Australia will provide useful information on this complex area for both
Australian and international standard setters.
2.4 Studies of Accounting Practices in Australia Research on financial instruments in Australia is still at an early stage and much of it
normative. Hancock (1994), Berkman et al. (1997), Chalmers and Godfrey (2000) and
Chalmers (2001) are such examples. Berkman et al. (1997) describe the reporting
requirements and practices for derivative financial instruments in New Zealand and
Australia. By examining the 1994 annual reports of 116 New Zealand companies and
the 1995 annual reports of 200 Australian listed companies, they provide evidence
Chapter 2: Institutional Background
36
that the disclosure of information about financial derivatives by Australian companies
is less detailed than New Zealand companies.
Chalmers and Godfrey (2000) explore the disparity between the derivative
instruments accounting treatments encouraged by the standard (AASB 1033 issued in
1996) and firms’ current accounting practices based on the 30 June 1998 financial
statements of Australia’s largest 500 firms. The study extended previous survey
research by identifying firms’ derivative accounting policies and approaches to fair
value determination. The study indicates that the quality of the disclosures is less than
satisfactory.
Chalmers (2001) examines Australian firms’ derivative instruments disclosures over
three phases, prior to the release of AASB 1033. This study analyses a firm’s response
to information demands in a changing regulatory environment from 1992 to 1998.
Chalmers used a voluntary reporting disclosure index to capture derivative
disclosures. Firms were found to be responsive to quasi-contractual disclosure
regulation. The release of ED 65 Disclosure and Presentation of Financial
Instruments, combined with the increased probability of the development of a
standard, has been found to be influential in achieving enhanced reporting of
derivative instruments.

Chapter 2: Institutional Background
37
2.5 Risk Management Practices in the Extractive Industries
Extractive industries are defined by the IASC27 as:
“those industries involved in finding and removing wasting natural resources located in or near the earth’s crust”
These industries are involved in finding and removing natural resources that cannot
be replaced such as sand, coal, oil, natural gas, sulphur, etc. The definition limits the
activities by excluding extraction of minerals from seawater or from the air (IASC
Steering Committee on Extractive Industries, 2000, paragraph 1.5).
Firms involved in the extractive industries may be involved in upstream activities,
downstream activities, or both. In upstream activities, firms are exploring, finding,
acquiring and developing resources (mineral reserves) up to the point the reserves are
capable of being sold or used. Firms involved in refining, processing, marketing and
distributing of petroleum, natural gas or mined mineral are classified as being engaged
in downstream activities. However, in certain cases firms may be involved in both
activities. These firms are referred to as integrated enterprises.
The uniqueness of the extractive industries, compared to other industries is the
exposure to potential exploration and production risks, and this is especially so for
upstream activities. Firms in the extractive industries are faced with exploration risks
when funds are spent to acquire the resources (mineral reserves) which may result in
no commercially recoverable reserves. At the same time, these firms are exposed to
the high risks of production. Production risks are the risk that the quantities produced
may be different to those estimated quantities. Beside these risks, extractive firms are
27 IASC released an “Issues Paper” on the extractive industries for comment in 2000.
Chapter 2: Institutional Background
38
also exposed to the volatility of commodity prices. These risks can cause earning
volatility, which leads firms to engage in risk management.
Firms may enter into hedging transactions to fix the selling price of their resources
and to protect against price fluctuations. This may take place before the resource is
produced. The three most commonly used hedging instruments are forward sales,
options and gold loans (IASC Steering Committee of Extractive Industries, 2000). In
forward sales, firms have to commit to deliver a fixed quantity of a commodity at a
fixed price on a specific date. Options allow firms to purchase a put or sell a call to
establish a minimum price while retaining the ability to participate if prices rise.
Firms may borrow gold and subsequently repay the loan in ounces of gold from future
production.
Two studies that examine the risk management practices in the extractive industries
are documented in Tufano (1996) and Pincus and Rajgopal (2002). Tufano (1996)
examines risk management practices in the gold mining industry. He documents that
firms whose managers own more stock options managed less gold price risks, and
those firms whose managers have more wealth invested in common stock manage
more gold risk. Further, Tufano documents that firm risk management levels appear to
be higher for firms with smaller outside block holdings and lower cash balances, and
whose senior financial managers have shorter job tenures. However, the study
concludes that the initial predictions of shareholder maximisation hypothesis is not
well supported by the data.

Chapter 2: Institutional Background
39
Pincus and Rajgopal (2002) examine the relation between hedging with derivatives
and discretionary accrual choices, and with income smoothing within oil and gas
firms. They identify two types of industry-specific risks that affect the volatility of
earnings. The risks are fluctuation in oil prices and the firm’s drilling success, which
require different risk management policies. Their study examines whether
discretionary accrual choices and hedging with derivative instruments are used as
substitute mechanisms to mitigate the impact of oil price and exploration risks on
earnings volatility. They report that the extent of smoothing with abnormal accruals is
not a significant determinant of the amount of hedging. However, the extent of
hedging is a significant determinant of the extent of smoothing with abnormal
accruals. This indicates that the more managers hedge with derivatives the less they
smooth earnings with abnormal accruals.
2.6 Summary This chapter provides background information related to derivative instruments. Firms
use derivatives either for investment or to hedge potential risks, especially in the
extractive industries where firms are exposed to exploration and production risks.
Because of the risks attached to the instruments, and due to significant losses
experienced recently by prominent companies, accounting standard setters have been
forced to require more disclosures related to derivatives. As AASB 1033 does not
specify rules for the recognition and measurement of financial instruments, its
disclosure requirements are extensive. These disclosures are expected to enhance
financial statement users’ understanding of the significance of recognised and
Chapter 2: Institutional Background
40
unrecognised financial instruments to an entity’s financial position, financial
performance and cash flows.
The two chapters that follow review the prior literature on the disclosure quality of
accounting information and the value relevance of financial instruments. Chapter
three discusses literature on the association between disclosure quality and firm
characteristics, and chapter four summarises the literature on value relevance studies.
Both Australian and international studies, particularly U.S. studies, are discussed.
Chapter 3: Literature Review: Disclosure Quality
41
CHAPTER 3 LITERATURE REVIEW: DISCLOSURE QUALITY
This chapter presents a review of the literature that relates to the research questions
discussed in chapter five. This review provides a basis for understanding the area of
research on disclosure quality. The organisation of this section is as follows. The
literature review begins with a discussion of corporate disclosure quality. This section
presents the differences between definitions of disclosure quality used in prior studies.
This is followed by section 3.2 which describes research discussing the importance of
enforcement power in ensuring a high level of compliance with accounting standards.
Subsection 3.3.1 discusses the research on attributes of high quality accounting
standards, especially when comparing foreign Generally Accepted Accounting
Principles (GAAP) to U.S.-GAAP. Subsection 3.3.2.1 discusses the quality of
accounting information disclosed in the financial statements. This subsection presents
research on the association between corporate disclosure and firm characteristics
based on disclosure indices and analyst ratings. Subsection 3.3.2.2 reviews previous
studies focusing on disclosure quality of environmental information and other
accounting information, respectively.
Subsection 3.3.3 discusses research on disclosure quality of accounting information
and investor decisions. Subsection 3.3.4 provides evidence on the descriptive results
of the disclosure quality of derivative information. This subsection indicates the
opportunity for a contribution of this thesis. Section 3.4 provides a summary of this
chapter.

Chapter 3: Literature Review: Disclosure Quality
42
3.1 Disclosure Quality: The Definitions
The annual report is one of the channels available for firms to report their financial
performance. However concern about the usefulness of financial information has
caused pressure groups to lobby accounting standard setters to require greater detail
and more extensive information especially concerning derivative financial instruments
so that high quality accounting standards are produced. High quality standards should
lead to high quality financial reports and as a result investors’ confidence in the
credibility of financial reporting is enhanced (Levitt, 1998). Therefore, firms that
comply with the standards would be expected to produce high quality accounting
information.
The term “quality” has been used interchangeably with the term “transparency”.
Because the concepts of quality and transparency are elusive (Kothari, 2000),
different interpretations have been placed on the meaning of high quality financial
information. Ball, Robin and Wu (2002), Ball, Kothari and Robin (2000) and Lang,
Raedy and Yetman (2003) assess quality based on the timeliness28 of the recognition
of economic income in accounting income. Bradshaw, Richardson and Sloan (1999)
examine quality based on the level of accruals, while Lang et al. (2003) look for
evidence of earnings management and of a higher association of earnings with share
price.
28 Ball et al. (2000) define timeliness as the extent to which current-period accounting income incorporates current-period economic income. This definition is consistent with Lang et al. (2003) and Ball et al. (2002).

Chapter 3: Literature Review: Disclosure Quality
43
Pownall and Schipper (1999) refer to financial statements as being of high quality if
they possess three attributes: transparency, full disclosure and comparability.29
Transparent financial statements are statements that “reveal the events, transactions,
judgments and estimates underlying the statements and their implications” (Pownall
and Schipper, 1999, p. 262). Transparency allows users to see the results and
implications of the decisions, judgments and estimates of statement preparers. Full
disclosure relates to the provision of all information necessary for decision-making,
thereby providing reasonable assurance that investors are not misled. Finally,
comparability means that similar transactions and events are accounted for in the
same manner, both cross-sectionally among firms and over time for a given firm.
Most literature on disclosure quality uses either a disclosure index or disclosure
ratings produced by the Financial Analysts Federation (FAF), the Association for
Investment Management Research (AIMR) and the Center for International Financial
Analysis and Research (CIFAR) to measure disclosure quality as defined by Pownall
and Schipper (1999). This research is discussed in subsection 3.3.2.1.
While these views of quality focus on the financial statements as a whole, the
definition of Pownall and Schipper (1999) can be readily adapted to individual
disclosures within the financial statements. For this reason, their interpretation of
quality is used in this study. That is, this study defines financial information as being
of high quality when it possesses the attributes of transparency, full disclosure and
comparability.
29 Different definitions of accounting quality abound because, as Ball et al. (2002) claim, quality is an elusive concept especially where there are a great number of uses of accounting information.

Chapter 3: Literature Review: Disclosure Quality
44
3.2 Disclosure Quality: Regulation, Enforcement and Compliance
Financial statements are the principal means through which financial information is
communicated to investors, lenders, suppliers, customers, employees, government and
the public. Users of the statements require comprehensive information for their
decisions. Financial statements are prepared and presented according to the objectives
of financial reporting, i.e. usefulness for decision-making.
Financial information is recognised in the financial statements if it meets the
definition of an element of the financial statements, for example an asset, and satisfies
the criteria for recognition. Disclosure of information about the items in financial
statements and their measures are detailed where required in the notes to the financial
statements. Although there is some concern of potential disclosure overload,
nevertheless greater disclosure reduces information asymmetry (Hope, 2003a).
Accounting information is presented based on accounting standards issued by
accounting standards bodies. In Australia there are several parties involved in
regulating30 the accounting standards. These include the Australian Securities
Commission, the Australian Accounting Standards Board (AASB), the Australian
Accounting Research Foundation (AARF) and the Australian Stock Exchange (ASX).
Prior to the establishment of the AASB (which replaced the Accounting Standards
Review Board in 1991), Australian accounting and financial reporting was regulated
by professional bodies such as the Institute of Chartered Accountants in Australia
30 Taylor and Turley (1986, p. 1) define regulation as the imposition of constraints upon the preparation, content and form of external financial reports by bodies other than the preparers of the reports, or the organisations and individuals for which the reports are prepared.

Chapter 3: Literature Review: Disclosure Quality
45
(ICAA), the Australian Society of Certified Practicing Accountants (CPA) and the
AARF (Whittred, Zimmer and Taylor, 2000, p. 3). However, these bodies did not
have the required legal power to enforce the compliance of companies with the
standards (Whittred et al., 2000, pp. 4). According to Hope (2003a) “…without
adequate enforcement the standards will be inconsequential, and will remain on
paper”. To ensure the high quality of information being presented, both the quality of
accounting standards and the enforcement of the regulations must exist (Kothari,
2000). Hope (2003a) provides evidence that the U.S., the U.K. and Canada have the
highest enforcement score. Australia is tenth on the list of 22 countries. Hope also
provides evidence that enforcement disclosure scores are positively related with
enforcement. This indicates that enforcement encourages managers to follow the
accounting standards and therefore, high quality accounting information is presented.
Enforcement power is essential to ensure better compliance. Therefore, in this case
the AASB and any standards approved by it have been granted statutory force by the
Corporations Law and the Australian Securities and Investment Commission (ASIC)
Act. Compliance with accounting standards will assist in the comparability of
accounting information. Existing research has studied the extent of compliance within
an international and local setting. Tai, Au-Yeung, Kwok and Lau (1990) and Ahmed
and Nicholls (1994) examine compliance within the local setting. Both studies
provide evidence that the level of compliance of mandatory disclosure in developing
countries (i.e. Hong Kong and Bangladesh respectively) is low. Lack of enforcement
mechanisms is one of the reasons non-compliance occurs. Similar arguments may
apply in the case of the international setting where Tower, Hancock and Taplin (1999)
and Taplin, Tower and Hancock (2002) report that the extent of compliance with the
Chapter 3: Literature Review: Disclosure Quality
46
International Accounting Standards (IAS) in six Asia-Pacific Countries varies, with
Australian companies recorded the highest level compliance score. The International
Accounting Standards Board (IASB) does not have enforcement powers to ensure
firms in these countries comply with its requirements. The IASB has to rely on the
individual countries’ enforcement mechanisms, which apparently do not exist or are
very weak in most of these countries. Bradshaw and Miller (2002) investigate the
level of compliance among non-U.S. firms adopting U.S. GAAP. They provide
evidence that the level of compliance among these firms is lower than U.S. firms.
Failure to comply with the requirements of the standards indicates that the quality of
information disclosed in the annual reports is low.
3.3 Studies on Disclosure Quality
3.3.1 Disclosure Quality of Accounting Standards Studies on the comparability of accounting standards have been extensively
documented in the U.S. These studies examine the quality of annual reports of foreign
firms listing on the U.S. exchanges. Currently, foreign firms have to reconcile
earnings and book value of owners’ equity to U.S. GAAP. This is to ensure a similar
quality of reporting as that required by U.S. reporting standards.
These studies examine quality based on attributes31 of comparability and indirectly
transparency and full disclosure (Pownall and Schipper, 1999). Amir, Harris and
Venuti (1993), Barth and Clinch (1996) and Harris and Muller (1999) provide mixed
results when they compare the quality of non-U.S. GAAP to U.S. GAAP firm 31 Pownall and Schipper (1999) refer to comparability, transparency, and full disclosure as attributes of financial reports rather than the standards per se.

Chapter 3: Literature Review: Disclosure Quality
47
disclosures. The analysis was based on information provided on Form 20-F. Amir et
al. (1993) provide evidence that approximately one-third of the reconciliations
examined reported no material differences between non-U.S. GAAP and U.S. GAAP
income. This indicates that non-U.S. GAAP income is comparable to U.S. GAAP
income.
Barth and Clinch (1996) provide evidence that the line-item adjustments from U.K.,
Australian and Canadian GAAP to U.S. GAAP are non-comparable. The largest
single line item difference recorded is goodwill for the U.K. firms averaging –7
percent of U.S. GAAP net income and –20 percent of U.S. GAAP shareholders’
equity. However, Harris and Muller (1999) provide evidence of relatively small mean
differences, after deleting several influential observations, between IAS and U.S.
GAAP net income and shareholders equity. The mean differences are 0.28 percent
and 0.21 percent of IAS shareholders’ equity, respectively.
Ball, Robin and Wu (2002) investigate the interaction between the accounting
standards under which financial statements are prepared and the incentives of
managers and auditors who prepare them of four Asian countries, i.e. Hong Kong,
Malaysia, Singapore and Thailand. They indicate that although these countries adopt
high quality (high transparency) accounting standards, external factors such as
political influence may force preparers to produce low quality transparency32 financial
statements. Therefore, they hypothesise that the demand for transparent accounting is
higher in countries, which are more market-oriented than countries that are more
politicised, planning-oriented institutions or with more extensive family or other 32 The authors interpret transparency in the financial statements as the timely incorporation of economic income. They give particular emphasis to the incorporation of economic losses or negative economic income when measuring transparency.

Chapter 3: Literature Review: Disclosure Quality
48
networks. The results indicate that the hypothesis, that the reporting information in
these countries generally lacks transparency, is supported.
Lang et al. (2003) compare the quality of earnings of cross-listed non-U.S. firms on
U.S. exchanges with a sample of non-cross-listed firms. The quality of earnings was
assessed based on the existence of evidence of earnings management, timely
recognition of losses and the association between share prices and earnings. They
provide evidence that cross-listed firms report high quality earnings since they appear
to be less aggressive in earnings management, exhibit timely recognition of losses and
whose earnings are more highly associated with share price.
3.3.2 Disclosure Quality of Accounting Information and the Impact on Firms
3.3.2.1 Disclosure Quality and Firms Characteristics
Prior research examines the usefulness of financial information by investigating the
extent of firms’ disclosures and the quality of accounting information disclosed in
annual reports. Studies that relate the level of disclosure to firm characteristics include
Firth (1979), Cooke (1989, 1991and 1992), Imhoff (1992), Malone, Fries and Jones
(1993), Singhvi and Desai (1971), Heflin, Shaw and Wild (2001) and Wallace and
Naser (1995). These studies provide evidence of the association between disclosure
level and firm characteristics such as firm size, listing status, firm auditor, scope of
business, risk of trading and industry type. Most studies in this area use a disclosure
index to measure disclosure level or disclosure quality.

Chapter 3: Literature Review: Disclosure Quality
49
Singhvi and Desai (1971) provide evidence on the association between the quality of
corporate disclosure and firm characteristics. Annual reports of 100 listed and 55
unlisted firms were examined. The quality of corporate disclosure was measured by
the disclosure index, which represents adequate corporate disclosure. The explanatory
variables represent size, number of stockholders, listing status, CPA firms, rate of
return and earnings margin. The results indicate that size, listing status, number of
stockholders and type of CPA are positively related to disclosure quality. However,
the multivariate analysis indicated that only listing status and earnings margin are
significant at p < 0.01and 0.05 < p < 0.10, respectively.
Firth (1979) has developed a disclosure index to investigate the impact of size, stock
market listing and auditors on voluntary disclosure in the U.K. Voluntary items were
weighted using a five point scale based on the importance of the items to financial
analysts. The disclosure index, based on 48 items and their weightings, for each of the
sample companies was developed. The study found that firms that listed on stock
exchanges made greater disclosure than unlisted firms. Further, larger firms provide
greater disclosure than small firms no matter whether the companies were listed or
not. In contrast to the findings of other studies, Firth reported that auditors had little
influence on the levels of disclosure.
Cooke (1989, 1992) investigates the association between disclosure quality of
national annual reports and firm characteristics. In Cooke (1989), results on the
association between the quality of annual reports of Swedish companies and firm
characteristics were presented. Unlike the above studies, this study used a
dichotomous procedure in developing a disclosure index. The study employed a step-
wise approach to investigate the association between the extent of disclosure and firm

Chapter 3: Literature Review: Disclosure Quality
50
characteristics, namely quotation status, parent company relationship, annual sales,
total assets as a proxy for size and number of shareholders. The results indicate that
firm size and listing status are significantly related to the level of disclosure.
Cooke (1992) examines the impact of size, stock market listing and industry type on
disclosure in the annual reports of Japanese listed companies. He uses a similar
approach to Cooke (1989). However, instead of using a step-wise technique the study
used factor analyses and the principal factors as regressors to resolve multicollinearity
issues in the size variables. Manufacturing companies were found to disclose more
information than non-manufacturing companies. However, there was no significant
difference in mandatory disclosures between these companies. Also, significantly
related to level of disclosure, were multiple listed firms and firm size.
Unlike the above studies, Imhoff (1992) employed analysts’ judgments of accounting
quality issued by the Financial Analysts Federation33 (FAF) as the basis for relative
quality measures. The study investigates the association between differences in
judgements among security analysts and firm characteristics. The results indicate that
firms that were judged by analysts as producing high quality accounting had more
predictable earnings, more accurate earnings forecasts, smaller annual earnings
forecast revisions after first-quarter results were announced, a lower likelihood of a
bad-news annual earnings announcement, larger firm size, lower debt-to-equity ratios
and had more a stable relation between changes in sales and changes in operating
income over time.
33 Detailed discussion on procedures undertaken by FAF can be found in Sengupta (1998, p. 462).
Chapter 3: Literature Review: Disclosure Quality
51
Wallace and Naser (1995) investigate the association between firm characteristics and
mandatory disclosures of Hong Kong firms. Both mandatory and voluntary disclosure
items were identified, with a total of 30 items contained in the disclosure index. The
underlying criterion for scoring firm annual reports was comprehensiveness and
therefore, a higher score was awarded for greater detail of information disclosed. To
estimate the relationship between comprehensiveness of mandatory disclosure and
firm characteristics ranked and unranked estimation procedures were performed.
However, the conclusions were based on the ranked OLS, as the results were more
robust. The results indicate that total assets, profit margin, auditor and scope of
business contribute to the understanding of variation in the disclosure index.
Malone et al. (1993) examine the association between the extent of corporate
disclosure with characteristics of firms in the oil and gas industry. The study used a
disclosure index, which was weighted by the industry analysts. Analysts were asked
to weight 129 items according to the importance of each item in the investment
decision. The disclosure index was represented by the total actual score as a
percentage of total possible score. The step-wise procedure was employed to examine
the association between the extent of disclosure and firm characteristics. The results
indicate that firms with high debt-to-equity ratios, firms listed on a major stock
exchange and firms with a greater number of shareholders disclose more financial
information.

Chapter 3: Literature Review: Disclosure Quality
52
3.3.2.2 Disclosure Quality of Specific Information
While studies in the previous subsection examine the disclosure quality of overall
accounting information, several studies have examined disclosure quality for
particular accounting information, such as environmental disclosures. Other studies
have examined the association between disclosure, earnings management and
corporate restructuring. Fekrat, Inclan and Petroni (1996), Choi (1999) and Jaffar,
Mohd Iskandar and Muhammad (2002) examine the disclosure quality of corporate
environmental disclosures.
Jaffar et al. (2002) measure quality based on two indicators. The first indicator is
based on specific categories such as environmental policy, product and service. The
second indicator measures quality based on the location of the information in the
annual report. In addition, they also examine the quality of disclosure based on the
number of pages used to report the environmental information. The study examines
the relationship between quality and quantity of environmental disclosures and
environmental performance, company size and financial performance. The results
indicate that companies that performed badly in terms of environmental performance
provided detailed information in important locations in the annual report in order to
reduce political costs. Further, the researchers provide evidence that large and poor-
environmental performance firms tend to provide large volumes of environmental
information in the annual report.
Based on a similar approach, Choi (1999) investigates the relationship between
quality and quantity of disclosure and corporate characteristics. Content analysis was
used to develop three categories of information. These categories were economic
Chapter 3: Literature Review: Disclosure Quality
53
factors, pollution abatement and other general information. A score ranging from 0 to
3 was given for each item in each category based on the quantitative and qualitative
information provided in the financial statements. As an alternative, an ordinal scale, a
score between 0 and 3, was developed for an individual firm as an overall measure for
the evaluation of disclosure. Finally, the amount of disclosure per company was
measured by the number of lines in the section. Firms were divided into high-profile
industries and low-profile industries. Choi reports that: a) firms in high profile
industries disclose systematically greater quantities of information than their
counterparts in lower profile industries, b) corporate size is found to be positively
associated with the propensity to disclose and finally, c) when the analysis is confined
to the discloser group, financial leverage and corporate age emerged as significant
variables.
Lobo and Zhou (2001) examine the relationship between disclosure quality and
earnings management. This study was motivated by two streams of research that
identify the relationship between: a) information asymmetry and disclosure quality
and b) earnings management and information asymmetry. The authors contribute to
the literature by successfully predicting the relationship between disclosure quality
and earnings management. Corporate disclosure was measured based on the ratings
published by the Association for Investment Management and Research (AIMR),
while discretionary accruals from the modified Jones model were used to measure
earnings management. The results indicate that corporate disclosure was negatively
associated with earnings management.
Chapter 3: Literature Review: Disclosure Quality
54
Bens (2002) examines the quality of information voluntarily disclosed about corporate
restructuring. The disclosure measures were based on the scores of the FASB
Emerging Issues Task Force (EITF) 94-3 requirements. Six independent variables
were chosen to regress on disclosure quality. These are financial performance, CEO
changes, increased monitoring, proprietary costs, regulatory action and additional
control variables that may affect disclosure. Bens indicates that: a) the disclosure
levels increased dramatically as a result of the SEC targeted corporate restructuring
for greater scrutiny, b) the level of disclosure is lower when the restructuring is
preceded by a routine CEO change and c) increases in shareholder monitoring is
associated with higher disclosure levels.
3.3.3 Disclosure Quality of Accounting Information and Benefits to the Investors
Investors require firms to disclose high quality information in order to make economic
decisions. Greater disclosure is assumed to enhance investor’s welfare and therefore,
will attract investors to trade more aggressively. Managers are claimed to have better
information about the economic performance of the firm and incentives exist for
managers to withhold value-relevant unfavourable information (Sengupta, 1998).
Failure to meet investors’ and creditors’ information needs would have a huge impact
on firms. Investors and creditors may take actions that are disadvantageous to firms
such as increasing the cost of capital or to some extent reducing their market
participation. Lack of information may cause market participants to seek other
investment opportunities reducing the firm’s share price. Even though investors may
invest in a low quality disclosing company, they might require comparatively higher
rates of return which could lead to a higher cost of capital and lower share price
Chapter 3: Literature Review: Disclosure Quality
55
(Miller, 2001). As a result firms may find it difficult to grow and remain competitive
(Jenkins, 1994). Nevertheless, increased disclosure may benefit some investors more
than others, as well as increase the price efficiency of some firms more than others
(Price, 1998). For example, informed traders benefit more by the release of public
information. This is because they can purchase more concentrated private information
(Lundholm, 1991 in Price 1998).
Several studies investigate the effect of disclosure quality and practices on investors.
The quality of corporate disclosure can be measured by examining the timeliness,
detail and clarity of information (Sengupta, 1998). Prior studies measure corporate
disclosure quality based on the corporate disclosure practices measured by the
Financial Analysts Federation (such as Sengupta, 1998; Heflin, Shaw and Wild, 2001)
and the Association for Investment Management and Research (Bushee and Noe,
2000; Price, 1998). Both organisations evaluate disclosure quality along with different
disclosure categories: annual reports, quarterly reports and informal communication
such as public releases or discussions. In a different approach Botosan (1997)
developed a disclosure index to represent disclosure levels.
Price (1998) examines the response of informed or institutional investors on financial
statement disclosure. This study provides evidence that informed investors make
greater use of accounting disclosures to form more precise earnings expectations.
Bushee and Noe (2000) investigate whether a firm’s disclosure practices affect the
composition of institutional ownership and stock return volatility. They provide
evidence that institutional investors are attracted to firms with greater disclosure.

Chapter 3: Literature Review: Disclosure Quality
56
Further, they report that there was no net impact of disclosure practices on return
volatility.
Heflin, Shaw and Wild (2001) examine the relationship between disclosure quality,
the risk of informed trading and market liquidity. They provide evidence that higher
quality disclosures reduce the risk of informed trading and enhance market liquidity,
as firms with high quality disclosures lead to smaller information asymmetry spread
components.
Sengupta (1998) provides evidence on the association between disclosure quality and
the cost of debt. Sengupta argues that lenders and underwriters look at corporate
disclosure to assess the degree of detail and clarity in the annual and quarterly reports,
the management discussion with financial analysts and the frequency of press releases
to calculate the default risk. Therefore, a firm’s cost of issuing debt is related to the
quality of its disclosures. Overall, a firm’s disclosure quality was obtained from
reports published by the FAF. Three groups of control variables include: issue
characteristics, market conditions and issuer characteristics. The results indicate that
the disclosure score is associated with the cost of debt, i.e. the highest disclosure score
firm incurred the lower cost of debt. This is because timely and detailed disclosures
may reduce the perception of default risk which leads to a lower cost of debt. This
indicates that lenders and underwriters consider firms’ disclosure quality in their
default risk estimates.
Botosan (1997) develops a disclosure index to measure the disclosure level of
manufacturing companies. In the study she directly examines the association between
firm’s voluntary disclosure levels and the cost of equity capital. She argues that since
Chapter 3: Literature Review: Disclosure Quality
57
cost of equity capital is difficult to obtain, prior research has adopted an indirect
approach by investigating the impact of disclosure on variables that are expected to be
positively related to the cost of debt. Five categories of voluntary information were
included in the disclosure index. These were background information, summary of
historical results, key non-financial statistics, projected information and management
discussion and analysis. Results from this study indicate that greater disclosure is
associated with a lower cost of equity capital for firms that attract a low analyst
following. However, there is no evidence of such association for firms with a high
analyst following.
3.3.4 Disclosure Quality of Derivative Information While the majority of studies discussed in previous sections examine the quality of all
financial information disclosed in the annual reports or other media, limited studies
have documented disclosure quality with regard to specific information, particularly
financial instruments. Two Australian studies on the quality of derivative disclosure
have been conducted by Chalmers and Godfrey (2000) and Chalmers (2001).
However, neither of these studies examine the benefits of derivative disclosure to the
firms and investors. Chalmers and Godfrey (2000) explore the disparity between the
accounting treatments of derivative instruments encouraged by the standard (AASB
1033 issued in 1996) and firms’ current accounting practices based on the 30 June
1998 financial statements of Australia’s largest 500 firms. This study extends
previous survey research by identifying firms’ derivative accounting policies and
approaches to fair value determination. The study indicates that the quality of the
disclosures were less than satisfactory. The major weaknesses were:
Chapter 3: Literature Review: Disclosure Quality
58
The lack of accounting policy disclosures relating to specific types of
instruments and incompleteness in fair value disclosures;
Variability in the information contained in the notes, both across firms and
within firms. These factors hinder the understandability, comparability and
consistency of derivative instruments information.
The limited variation in firms’ derivative instruments accounting policies, with
most sample firms employing hedge accounting techniques.
The study also suggests that firms had accepted the requirement to make quantitative
disclosures concerning the fair values of derivative instruments. However, disclosures
concerning fair value determination vary in detail and clarity.
Chalmers (2001) examines Australian firms’ derivative instruments disclosures over
three phases, namely a pure voluntary disclosure phase, a coercive voluntary
disclosure phase and a mandatory reporting period. The study examines the firms’
response to information demands in a changing regulatory environment from 1992 to
1998. Chalmers used a voluntary reporting disclosure index to capture derivative
disclosures. The index was constructed using the disclosures suggested in the
Australian Society of Corporate Treasurer's Industry Statement34 and ED65:
Presentation and Disclosure of Financial Instruments. The results indicate that firms
were responsive to quasi-contractual disclosure regulation since the number of firms
registering a positive voluntary reporting disclosure index increases from phase to
phase. The release of ED 65, combined with the increased probability of the
34 The industry statement was issued in March 1995 and requested firms to include information on derivatives in their financial statements.
Chapter 3: Literature Review: Disclosure Quality
59
development of an AASB standard on this issue, has been found to be influential in
achieving enhanced reporting of derivative instruments.
3.4 Summary Chapter three discusses prior studies on disclosure quality. The chapter begins by
presenting different views of disclosure quality in the literature. The elusiveness of
the concept “quality” results in varying definitions of “quality” (Ball et al. 2002). This
chapter has discussed prior studies that provide evidence of the relationship between
high quality accounting information and a high degree of enforcement. Generally, the
studies indicate that without adequate enforcement the standard is treated as voluntary
by managers (Hope, 2003a). While prior studies that compare the quality of financial
statements of firms cross-listed in the U.S. have provided mixed evidence, some
studies indicate that the quality of financial statements of firms in some countries is
not as high as expected even though they have adopted high quality accounting
standards. The low quality of financial statements in these countries is due to external
factors, such as political influence. Some studies have investigated the association
between disclosure quality and firm characteristics. These studies provide evidence
that high disclosure quality accounting information is positively related to variables
such as size of the firms, profitability and listing status. While prior studies presented
in this chapter investigate the effect of disclosure quality on the firms, the following
chapter provides a review of prior studies that investigate the effect of disclosure on
market participants. These studies are known as value relevance studies.

Chapter 4: Literature Review: Derivative Disclosures and Value Relevance Studies
60
CHAPTER 4 LITERATURE REVIEW: DERIVATIVE DISCLOSURES AND VALUE RELEVANCE STUDIES
While chapter three discusses prior studies on disclosure quality and the association
with firm characteristics, this chapter presents literature on the benefits of disclosure
to capital markets, especially to investors. This review provides a basis for
understanding the area of research on the value relevance of derivative instruments.
Research questions related to the value relevance of derivative disclosures are
discussed in chapter five.
This chapter is organised as follows. Section 4.1 relates the effect of disclosure quality
to the decision-making of investors. To investigate this effect researchers use capital
markets data. Section 4.2 discusses prior studies on capital markets research and value
relevance studies. The specific studies on value relevance of financial instruments are
discussed in section 4.3. Section 4.4 concludes the chapter.
4.1 Disclosure Quality of Accounting Information and Investors’ Decisions Chapter 3 discusses the benefits of high quality information on both firms and
investors. Sengupta (1998), Botosan (1997) and Botosan and Plumlee (2002) provide
evidence that firms providing high quality information incur lower costs of debt and
equity capital. High quality information reduces the uncertainty faced by investors
and creditors (Miller and Bahnson, 2002) and this increases their confidence in the
financial information provided by firms, leading to increased investment in these
Chapter 4: Literature Review: Derivative Disclosures and Value Relevance Studies
61
firms (as found in Price, 1998; Bushee and Noe, 2000). As a result firms will
experience higher security prices.
While subsection 3.3.3 provided evidence on the effect of high quality information to
both firms and users, limited studies have examined the association between high
quality information and share prices. Lang, Ready and Yetman (2003), Eccher and
Healy (2000) and Gelb and Zarowin (2002) are among the researchers who
investigate the association between accounting quality and share prices. Lang et al.
(2003) provide evidence that cross-listed firms, compared to non-cross-listed firms,
have higher accounting quality as their accounting data are more highly associated
with price.
Eccher and Healy (2000) investigate the usefulness of IAS standards in the People’s
Republic of China. They measure the usefulness of accounting information based on
the relevance of earnings and accruals for predicting future cash flows and the relation
of earnings and accruals to contemporaneous stock price changes. The research
question is motivated by the weak findings of previous studies comparing IAS
standards and foreign standards, and due to the unique opportunity to examine similar
issues in China. The results indicate that the information produced using IAS
standards is no more useful than information prepared using Chinese standards. This
is because: a) there is no difference in the explanatory power of IAS and Chinese
accruals for future cash flows, b) international investors value IAS and Chinese
earnings and accruals in an equivalent manner and c) domestic investors value
earnings based on domestic standards differently to IAS earnings.
Chapter 4: Literature Review: Derivative Disclosures and Value Relevance Studies
62
Perhaps the study of Gelb and Zarowin (2002) is of more relevance to the current
study since this examines the association between the level of corporate disclosures
and stock prices. In their study, firms are grouped into two groups based on the
disclosure quality of the firms; i.e. high for a disclosure rating above the industry
median or low for a disclosure rating below the industry median. This study
compares the groups based on the association between current stock returns and future
earnings changes. In this case a stronger relationship between current returns and
future earnings are expected from high disclosure firms. They hypothesise that high
disclosure firms have higher earnings response coefficients (ERCs). Their results
indicate that high disclosure firms have significantly higher future ERCs (i.e. greater
price informativeness) than low disclosure firms.
The main idea in the above discussion is how researchers infer the importance of
accounting information by relating this to share price. These kinds of studies are
known as capital markets research. The following section discusses in more detail
capital markets research.
4.2 Disclosure and Capital Markets Research
4.2.1 Capital Markets Research
Capital markets research emerged in the accounting literature in the late 1960’s after
considerable doubt had been expressed about the usefulness of historical cost
accounting numbers to convey a firm’s financial health. This research uses security
prices to infer whether information in accounting reports is useful to market
participants (Brown and Howieson, 1998). Ball and Brown (1968) and Beaver (1968)
Chapter 4: Literature Review: Derivative Disclosures and Value Relevance Studies
63
are the pioneers in capital markets research in accounting (Kothari, 2001). Both
studies examine the effect of accounting announcements on share prices. Ball and
Brown (1968) found that accounting earnings (accounting information recognised in
the financial statements) is part of the information used in forming share prices
(Brennan, 1991). According to Kothari there are three concurrent developments that
helped them (Ball and Brown, 1968; Beaver, 1968) to develop empirical capital
markets research in accounting. These are: a) positive economic theory, b) the
efficient market hypothesis and the capital asset pricing model (CAPM), as well as c)
the event study methodology.
Kothari (2001) classifies the demand for capital markets research in accounting into
four areas, namely: a) fundamental analysis and valuation, b) tests of capital markets
efficiency, c) the role of accounting in contracts and in the political process and d)
disclosure regulation. Capital markets data is used: a) to help fundamental analysis
researchers in identifying mispriced securities, b) to examine market efficiency based
on event studies and cross-sectional tests of return predictability, c) to predict how the
use of accounting numbers in compensation and debt contracts and in the political
process affects a firm’s accounting choices (positive accounting theory) and d) to help
ascertain whether the objectives of standards issued by accounting standard bodies are
served and to explain the possibility of harmonising the standards (Kothari, 2001).
Capital markets research in accounting has been developed based on the efficient
market hypothesis (EMH) and the capital asset pricing model (CAPM)35. According
35 The CAPM identifies factors, such as future cash flows and a firm’s risk, that affect the share prices of the firms. It predicts that the expected rate of return of a security is increasing in the covariance risk of its cash flows. The CAPM along with the EMH facilitated the estimation of the firm-specific return component.
Chapter 4: Literature Review: Derivative Disclosures and Value Relevance Studies
64
to Brown (1994) the market is efficient with respect to information if the set of market
prices is exactly the same whether or not it is conditioned on the information. Hence
the efficiency refers to how the information is portrayed in the firm’s share prices.
There are three forms of efficiencies: weak form, semi-strong form and strong form.
In the weak form of efficiency, investors cannot depend on historical data to earn
returns other than those that are to be expected given the investment risk (abnormal
returns). In the semi-strong form of efficiency investors cannot expect to earn
abnormal returns by analysing publicly available information. In the strong form of
efficiency investors cannot expect to earn abnormal returns by analysing information
from any source. To investigate whether accounting information affects a firm’s
share price, the share price can be compared immediately before and after information
is released to the public. This is the first approach of capital markets research in
accounting. Changes in share prices are used as an objective to infer the usefulness to
market participants of accounting information published in the annual reports (Brown,
1994 and Kothari, 2001).
Capital markets research can also help ascertain whether accounting standard bodies’
stated objectives are served. Capital markets research may explain whether financial
statement numbers prepared in accordance with a new standard convey new
information to the capital markets, and whether the accounting numbers are highly
associated with contemporaneous stock returns and prices. The rapid globalisation of
capital, product and labour markets has created a strong demand for international
accounting standards. Research in international accounting using capital markets data
can inform the standard setters in their deliberations on the development of
harmonised international accounting standards. Brown and Howieson (1998) indicate
Chapter 4: Literature Review: Derivative Disclosures and Value Relevance Studies
65
that there are five research areas where capital markets research could lead to better
informed decision in the standards arena especially in Australia. These areas are
corporate regulation, international harmonisation, research and development, goodwill
accounting and equity accounting. Value relevance studies fall within this context.
4.2.2 Relevance and Reliability of Accounting Information and Capital Markets Research
Statement of Accounting Concepts 3 (SAC 3) Qualitative Characteristics of
Financial Information identifies relevance and reliability as the primary qualitative
characteristics which financial information should possess in order to be the subject of
general purpose financial reporting (paragraph 7). However, paragraph 7 cautions
that the Statement does not rank either characteristic above the other. Nevertheless,
studies on the qualitative characteristics that determine the usefulness of information
indicate that the concept of relevance appears to have emerged as the primary
qualitative characteristic, followed by reliability (Stanga, 1980).
Relevant information must have value in assisting users in making decisions. SAC 3
Paragraph 8 defines financial information to be relevant as follows:
For financial information to be relevant it must have value in terms of assisting users in making and evaluating decisions about the allocation of scarce resources and in assessing the rendering of accountability by preparers. If information is to assist users in making decisions about the allocation of scarce resources, it must assist them in making predictions about future situations and in forming expectations, and/or it must play a confirmatory role in respect of their past evaluations.
The information is relevant to a decision maker if he or she can use the information in
determining alternative courses of action. Without such knowledge he/she might take
Chapter 4: Literature Review: Derivative Disclosures and Value Relevance Studies
66
a different decision that might cause a different outcome. The information must help
decision-makers to evaluate the past or present events, which have occurred in the
organisation, and help them to predict future events, before making their decisions.
Relevant information should provide feedback to confirm or to correct past
evaluations conducted by the users.
Ideally, relevant information about assets or liabilities disclosed in the financial
statements can be used to measure future cash flows generated from each asset or
liability. However, due to the uncertain nature of future events, this qualitative
characteristic is not a sufficient condition for usefulness. Therefore, relevant
information depends on how reliable the information is in terms of its measurement
and sources.
The financial statement users depend upon the reliability of information when making
their decisions. To be reliable, the information must represent the economic
conditions or events to which it relates. According to SAC 3 paragraph 16:
The reliability of financial information will be determined by the degree of correspondence between what that information conveys to users and the underlying transactions and events that have occurred and been measured and displayed. Reliable information will, without bias or undue error, faithfully represent those transactions and events.
Such information will enhance the users’ confidence in making decisions because it is
free from error or bias toward particular people.
Stanga (1980) suggests that the financial accounting concepts of relevance and
reliability are complementary rather than conflicting in nature. An increase in
Chapter 4: Literature Review: Derivative Disclosures and Value Relevance Studies
67
relevance tends to be associated with an increase in reliability and vice versa. Duchac
(1998), in his study on the effectiveness36 of footnote disclosures of end-user interest
rate derivatives, identifies three criteria37 for the disclosure to be effective. These are:
a) the disclosure must have a reasonable purpose, b) the disclosure should not overlap
with an existing disclosure and c) sufficient demand must exist for the disclosed
information. Beside these, one important factor that must be considered is the
relevance38 of the disclosed information.
To examine the relevance and reliability of financial statement information39, capital
markets data is required. Ball and Brown (1968) and Beaver (1968) assert that capital
markets efficiency provides justification for selecting the behaviour of security prices
as an operational test of usefulness of information in financial statements. In the area
of capital markets research in accounting, researchers examine the relevance and
reliability of information to inform the standard setters regarding the effects of the
selection of rules on accounting numbers and their relation to firm values. Researchers
tend to adopt an investor perspective as investors represent a large class of financial
statement users (Barth, 2000).
36 Usefulness and effectiveness of footnote disclosures is critical because too much information disclosed will burden the management with the costs of generating and presenting this information. 37 He uses these criteria as a framework to evaluate the footnote. 38 Based on Hudack and McAllister (1994), relevance is much more frequently cited by the FASB in developing disclosure type accounting standards. 39 The information recognised and disclosed is based on the requirements of the respective accounting standards.

Chapter 4: Literature Review: Derivative Disclosures and Value Relevance Studies
68
4.2.3 Value Relevance Studies
Value relevance studies examine the relevance and reliability of information
recognised and disclosed in the financial statements required by the accounting
standards. These studies are an empirical operationalisation of the criteria, relevance
and reliability. Information can be value relevant if it reflects the relevance of
information to investors in valuing the firm, and it is measured reliably enough to be
reflected in share prices (Barth, Beaver and Landsman, 2001). Because of the
difficulty involved in testing relevance and reliability separately, the researchers use a
joint test of relevance and reliability. These are known as value relevance tests (Barth
et al., 2001).
Holthausen and Watts (2001) classify value relevance studies into three categories.
These are:
• Relative association studies: – These compare the association between stock
market values and alternative bottom-line measures. These studies usually test
for differences in the R squared (R2) of regressions using different bottom line
accounting numbers.
• Incremental association studies: – These investigate whether the accounting
number of interest is helpful in explaining value or return (over long windows)
given other specified variables. The accounting number is typically deemed to
be value relevant if its estimated regression coefficient is significantly
different from zero (e.g. Eccher, 1996; Barth, 1994; Barth et al. 1996)
• Marginal information content studies:– These investigate whether a particular
accounting number adds to the information set available to investors. These
studies typically use an event methodology to determine if the release of

Chapter 4: Literature Review: Derivative Disclosures and Value Relevance Studies
69
accounting numbers is associated with value changes. Price reactions are
considered evidence of value relevance.
The majority (94%) of value relevance studies are in the form of the first and second
types of studies (Holthausen and Watts, 2001). These studies are normally motivated
by standard setting problems. Many value relevance studies focus on fair value
disclosures. These studies relate: a) fair value to pensions and other postretirement
obligations (OPEB) (e.g. Amir, 1993 and Barth, 1991), b) fair values of debt and
equity securities held by banks and insurance companies (e.g. Barth, 1994), c) fair
value estimates of bank loans (Barth et al. 1996, Eccher et al., 1996 and Nelson, 1996)
and d) fair value estimates of derivatives (e.g. Venkatachalam, 1996). These value
relevance studies also address the issue of non-financial intangible assets. Most of
these studies relate the relevance and reliability of information with equity valuation.
Barth (1994), Barth et al. (1996), Eccher et al. (1996) and Nelson (1996) are a few
examples of studies which use both (reliable and relevant) characteristics in
examining the statistical relation between the disclosure of financial instruments
information and stock prices. They claim that if there is a significant correlation
between share prices and disclosed information then the information is value relevant.
This notion of value relevance is a combination of reliability and relevance, because
relevant information is not useful in making decisions if it is not reliable. The
following subsections provide empirical research related to these studies.
4.2.3.1 Other Value Relevance Studies
Other value relevance studies include Amir and Lev (1996) and Hughes (2000). Amir
and Lev (1996) investigate the value relevance of financial and non-financial
Chapter 4: Literature Review: Derivative Disclosures and Value Relevance Studies
70
information in the wireless communications industry. They provide evidence that
financial and non-financial information are complementary to each other; i.e. on a
stand alone basis financial information is largely irrelevant for firm valuation,
however, some of the variables do contribute to the explanation of stock prices when
they are combined with non-financial information. The results indicate that for certain
events investors rely on non-financial information when making decisions.
Hughes (2000) examines the relation between the market value of equity and non-
financial pollution measures; i.e. sulfur dioxide emissions that capture firms’ exposure
to future environmental liabilities. The results indicate that a non-financial pollution
proxy is value relevant for high polluting utilities targeted by Phase One of the 1990
Clean Air Act Amendments (CAAA). However, there is no significant relation
between the relative pollution of utilities that are not targeted by Phase One emissions
and their share prices. Further, the study also provides evidence that for the targeted
utilities, the value relevance of the non-financial pollution proxy: a) increases in
response to the passage of the stringent 1990 CAAA environmental legislation and b)
then declines as the market subsequently reduces estimated compliance costs in
response to changing economic and technological factors.
4.2.3.2 Research on Value Relevance in Australia
Research on value relevance in Australia has been documented in the area of
superannuation and intangible assets. Ang, Gallery and Sidhu (1999) investigate the
value relevance of superannuation disclosures required under AASB 1028 Accounting
for Employee Entitlements. The paper extends U.S. research in three ways: a) it
Chapter 4: Literature Review: Derivative Disclosures and Value Relevance Studies
71
provides an opportunity to confirm or refute the claims of ED 53 Accounting for
Employee Entitlements lobbyists with respect to the relevance of superannuation
related information, b) it addresses the question of whether disclosure of
superannuation assets and liabilities are valued in a similar fashion to other assets and
liabilities and c) it examines the relative value relevance of accrued versus vested
benefit measures of superannuation liabilities.
The results of Ang et al. (1999) indicate that the Australian market participants: a)
value the disclosures of superannuation assets and liabilities, b) place higher weight
on the superannuation items, which is contrary to the U.S. evidence and c) do not
value superannuation related disclosures to be value relevant when the sample is
widened to include all complying firms in the Top 200. The results also indicate that
the accrued benefits measure of superannuation liabilities does not provide higher
explanatory power relative to the vested benefits measure. Their findings indicate that
the U.S. evidence does not necessarily generalise to an Australian setting. These
findings provide support for the idea of the current study in an Australian setting.
Barth and Clinch (1998) investigate whether relevance, reliability and timeliness of
Australian asset revaluations differ across types of assets: tangible and intangible. The
study also investigates whether they differ if the valuation amount is determined by
the Board of Directors or an independent appraiser. Their study examines the
association between different types of revalued assets and share prices, as well as the
non market based estimates of firm value.

Chapter 4: Literature Review: Derivative Disclosures and Value Relevance Studies
72
Overall, the study indicates that revalued financial, tangible and intangible assets are
value relevant. As expected they find that revalued investments are consistently
significant in their association with share prices, except for investments of non-
financial firms in associated companies. Their findings for revalued intangible assets
contradict the view that the estimates are unreliable. However, the findings regarding
property, plant and equipment are less consistent. While the revalued aggregate
property, plant and equipment is significantly positively associated with share prices
for firms in all three industries, the revalued plant and equipment is value relevant for
mining firms, insignificantly related to share price for non-financial firms and is
negatively and significantly related to share price for financial firms. There is little
evidence to indicate that director and independent appraiser-based valuations are
viewed differently by investors. This indicates that directors’ private information
enhances value estimates despite their potential incentives to act in their own self-
interest.
Smith, Percy and Richardson (2001) investigate the value relevance of Australian and
Canadian firms’ decision to selectively capitalise research and development (R&D)
costs. The study attempts to answer two research questions. Does the market place: a)
a value on capitalised R&D and b) a higher value on the current year R&D
expenditures of capitalisers than those of expensers? They observe that the capitalised
development costs are valued by the market and this indicates that the act of
capitalising provides information to the market.
Godfrey and Koh (2001) extend the above studies by investigating whether the
capitalisation of R&D, other identifiable intangibles as a group and unidentifiable
intangible assets (goodwill) affects the market value of equity of Australian
Chapter 4: Literature Review: Derivative Disclosures and Value Relevance Studies
73
companies. They find that capitalised intangible assets, as a whole, provides
information that is relevant for investors. The significance of this finding is that the
two different categories of intangibles (goodwill and other identifiable intangible
assets) provide relevant valuation information incremental to other balance sheet
items. Hence this study provides new evidence supporting accounting regulation that
permits capitalisation of both identifiable and unidentifiable assets, and separate
disclosure of two different categories of intangibles.
4.3 Value Relevance of Financial Instruments40
4.3.1 Studies on Value Relevance of Fair Value Disclosures
While there are a limited numbers of value relevance studies in Australia, many
studies on value relevance of accounting information have been conducted in the U.S.
over the last decade. The number has increase dramatically in the late 1990s41. Most
of the studies address the empirical relation between accounting numbers and share
market values either with or without drawing standard-setting inferences.
Barth (1994) investigates how disclosed fair value estimates of banks’ investment
securities and securities gains and losses (based on those estimates) are reflected in
share prices in comparison with historical costs. The sample comprises the U.S. banks
whose financial statement data are available on the 1990 Compustat Annual Bank
Tape. The data was collected for the period 1971-1990. Using measurement error and
earnings capitalisation models, Barth reports that: 40 Financial instruments consist of primary instruments (such as cash, receivable, investment, payable) and derivative financial instruments (such as swaps and options). Derivatives are normally used for hedging of risks. 41 See Holthausen and Watts (2001) for a comprehensive summary of this research.

Chapter 4: Literature Review: Derivative Disclosures and Value Relevance Studies
74
Fair value estimates of investment securities provide significant explanatory
power beyond that provided by historical costs;
Historical costs provide no significant explanatory power incremental to fair
value;
Fair values of investment securities are found to have less measurement error
than historical costs vis-a-vis the amount reflected in share prices; and
Fair values securities gains or losses have no significant incremental
explanatory power.
Eccher et al. (1996) examines the value relevance of fair value data disclosed under
SFAS 107 Disclosures about Fair Value of Financial Instruments by banks42 for the
years 1992 and 1993. The study focused on fair values of all the major components
whether on- and off-balance sheet. The sample comprises 296 bank holding
companies for the fiscal year 1992 and 328 for 1993. Eccher et al. hypothesise that:
The fair values of securities are not incrementally value-relevant over and
above their historical cost values;
The fair values disclosures for financial instruments other than securities are
not incrementally value relevant over and above their historical cost values;
The fair values of market related off-balance sheet items are not value relevant
over and above their notional values;
The fair values of securities are not incrementally value relevant over and
above their historical cost values and other disclosures in the historical cost
financial statements;
42 SFAS 107: Disclosures about Fair Value of Financial Instruments requires banks to disclose fair value estimates for all financial instruments, both recognised (such as banks’ loan portfolios, deposits, and borrowings) and off-balance sheet items (such as interest rate swaps, commitments, and derivative contracts).
Chapter 4: Literature Review: Derivative Disclosures and Value Relevance Studies
75
The fair value disclosures for financial instruments other than securities are
not incrementally value relevant over and above their historical cost values
and other disclosures in the historical cost financial statements; and
The notional values of off-balance sheet instruments are not incrementally
value relevant over and above the other disclosures in the historical cost
financial statements.
The findings of the Eccher et al. study are:
The fair values of investment securities are value relevant;
The fair value of net loans has a weaker association with market-to-book ratio
than does the fair value of securities;
The off-balance sheet instruments are value relevant in limited settings, and
the fair value of deposits is not significant; and
All three hypotheses on incremental explanatory power for fair values are
rejected at conventional levels for 1992. Hence this indicates that the fair value
and notional value disclosures are each incrementally value relevant.
However, in 1993 the results are contrasting for some fair value disclosures.
Barth et al. (1996) examine the value relevance of banks’ fair value disclosures under
the SFAS 107. Additional variables, to those used by Eccher et al. (1996) and Nelson
(1996), such as non-performing loans and interest sensitive assets and liabilities, are
included. The study is conducted on a sample of 136 banks over the period 1992 and
1993. The results indicate that fair value estimates of loans, securities and long-term
debt provide significant explanatory power for bank share prices beyond that provided
by book values. The finding is stronger when additional variables are included.

Chapter 4: Literature Review: Derivative Disclosures and Value Relevance Studies
76
Unlike prior studies under SFAS 107, which combine all securities into one class,
Park, Park and Ro (1999) examine whether the intent-based fair value disclosures by
security type under SFAS 115 Accounting for Certain Investments in Debt and Equity
Securities explain the value relevance of bank equity. Their findings are consistent
with the hypotheses and with the view of SFAS 115 on the relevance and usefulness
of the fair value disclosures to investors.
While those studies examine the value relevance of fair value on banks and financial
institutions, Simko (1999) examines the fair value of financial instruments of non-
financial firms under SFAS 107. He concludes that SFAS 107 liability disclosures for
1993 and 1995 are significantly associated with equity values. However financial
instrument assets and related derivatives do not have incremental explanatory power.
This is due to the lack of economic significance of fair value and book value
differences typical in the case of non-financial firms.
4.3.2 Studies on Value Relevance of Derivative Financial Instruments Disclosures
Value relevance studies that address questions relating to derivative financial
instruments disclosures include Venkatachalam (1996), Schrand (1997) and Wong
(2000). These studies differ in methodology employed and samples used. While
Venkatachalam measures the direct association between firm value and the use of
derivative financial instruments in a traditional framework, Schrand measures the
association in the nominal contracting literature. Venkatachalam extends research on
SFAS 107 by examining the implications of fair value disclosures under SFAS 119
Chapter 4: Literature Review: Derivative Disclosures and Value Relevance Studies
77
Disclosure about Derivative Financial Instruments and Fair Value of Financial
Instruments. The objective of his study is to investigate whether the disclosures
relating to derivative financial instruments used for purposes other than trading are
useful to investors in equity valuation. Findings of this research suggest that the fair
value estimates for derivatives help explain cross-sectional variation in bank share
prices. Further, the fair values have incremental explanatory power over and above
the notional amounts of derivatives.
Schrand (1997) examines the association between stock-price sensitivity to
unexpected changes in interest rates and the use of interest rate derivative instruments
for a sample of savings and loan association (S&Ls) firms. Using nominal contracting
hypothesis Schrand provides evidence that off-balance sheet derivative activities are
positively associated with lower stock-price interest rate sensitivity.
Wong (2000) investigates whether the quantitative disclosures about notional amount
and fair value of foreign exchange derivatives are associated with the information
used by investors to assess the sensitivity of equity returns to currency fluctuations.
The results are mixed and only weakly consistent with predictions for both the
association and usefulness tests. The evidence suggests that neither aggregated nor
disaggregated fair value disclosures complement notional amount in assessing
currency risk exposure. The study also indicates that the usefulness of accounting
disclosures for assessing firms’ overall currency exposures is limited and additional
disclosures are potentially useful.
Chapter 4: Literature Review: Derivative Disclosures and Value Relevance Studies
78
4.4 Summary
This chapter discusses prior studies on the value relevance of financial instruments
and other value relevance studies. This study uses capital markets data to indicate
whether the accounting information is relevant and reliable. While this current study
is the first study investigating the value relevance of derivative financial instruments
information in Australia, most studies on the value relevance of financial instruments
have been documented in the U.S. The studies focus on the value relevance of fair
value under different accounting pronouncements. Prior studies provide evidence that
the fair value of various financial instruments is value relevant and provides
incremental explanatory power above historical costs. The next chapter develops
research questions from the preceding literature chapters and the institutional
background chapter.
Chapter 5: Research Questions
79
CHAPTER 5 RESEARCH QUESTIONS
Chapter five describes the research questions developed to investigate firstly, the
association between the disclosure quality of derivative disclosures and firm
characteristics and secondly, the value relevance of derivative disclosures. Four
research questions were developed to investigate the association between disclosure
quality and firm characteristics and two research questions are developed to examine
the value relevance of disclosure quality (research questions 5(a) and 5(b)). Given the
fact that prior research provides evidence that disclosed items, especially derivative
financial instruments are not value relevant, two more research questions (research
questions 6 and 7) are developed to investigate the value relevance of hedge
disclosures, which include the unrealised gain or loss and the off-balance sheet
derivative financial instruments.
Prior U.S. studies indicate the value relevance of fair value information. However, the
results of these studies are based on banking industries in the U.S. Therefore, the
results from these studies might not represent other industries and jurisdictions.
Research question 8 is developed to provide evidence on the value relevance of net
fair value disclosures in the extractive industries in Australia. Figure 5.1 presents the
diagram illustrating research questions used in this study. Section 5.1 discusses the
research questions related to disclosure transparency measured by a disclosure index.
Research questions related to the value relevance of derivative disclosures are
discussed in section 5.2. Section 5.3 summarises the chapter.
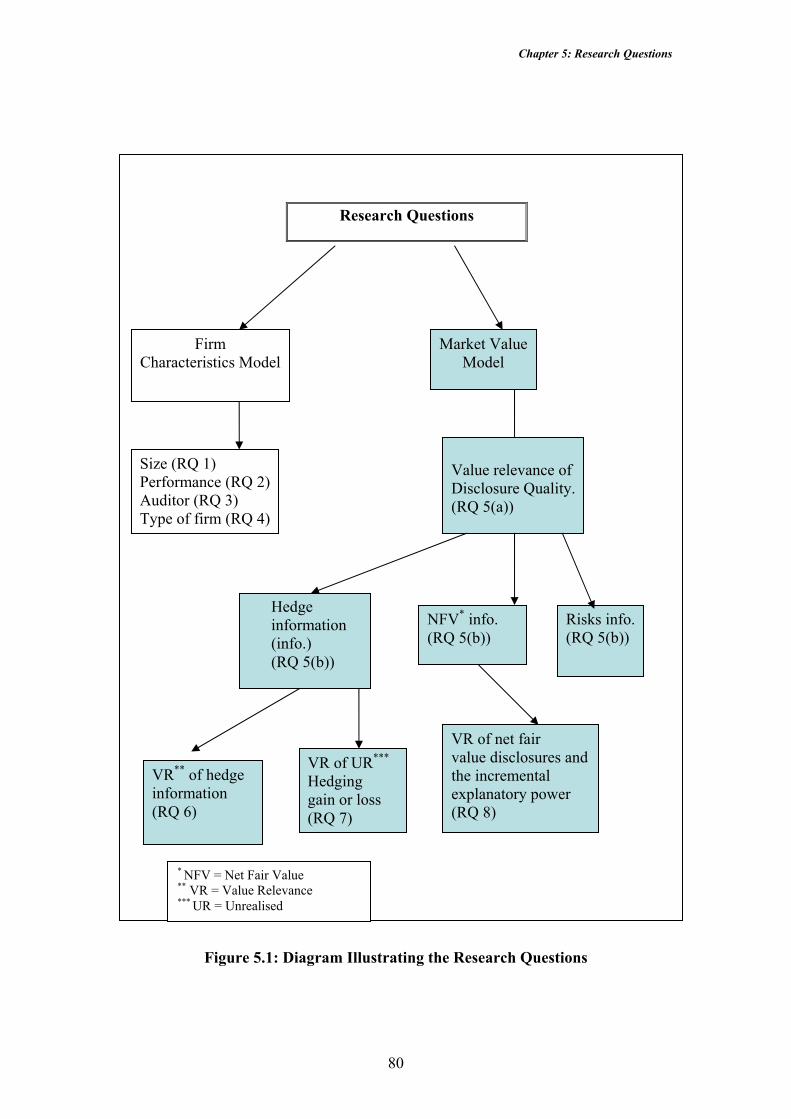
Chapter 5: Research Questions
80
Figure 5.1: Diagram Illustrating the Research Questions
Firm Characteristics Model
Research Questions
Market Value Model
Value relevance of Disclosure Quality. (RQ 5(a))
NFV* info. (RQ 5(b))
Risks info. (RQ 5(b))
Hedge information (info.) (RQ 5(b))
VR** of hedge information (RQ 6)
VR of UR***
Hedging gain or loss (RQ 7)
VR of net fair value disclosures and the incremental explanatory power (RQ 8)
Size (RQ 1) Performance (RQ 2) Auditor (RQ 3) Type of firm (RQ 4)
* NFV = Net Fair Value ** VR = Value Relevance *** UR = Unrealised

Chapter 5: Research Questions
81
5.1 Disclosure Quality of Derivative Information and Firm Characteristics
This research aims to examine the association between the information quality of
derivative disclosures and firm characteristics. Prior Australian studies have examined
the relationship between the use of derivatives and firm characteristics. However, no
attempt has been made to examine the relationship between disclosure quality and
firm characteristics. Berkman, Bradbury, Hancock and Innes (2002) and Nguyen and
Faff (2002), for example, examine the relationship between firm characteristics and
derivative use. Both studies indicate that firm size and leverage contribute to
derivative usage. In addition, Nguyen and Faff (2002) indicate that liquidity43 is also
associated with usage. These findings are consistent with prior studies in the U.S.
such as Nance, Smith and Smithson (1993) and Smith and Stulz (1985).
Géczy, Minton and Schrand (1997) provide evidence that the characteristics of firms
contribute to the decision to use derivative instruments. They indicate that the firms
more likely to use currency derivatives are: a) firms with the greatest economies of
scale in implementing and maintaining a risk management program, b) firms that have
currency exposure resulting from foreign operations and c) firms that have relatively
higher levels of foreign-denominated debt.
Users of financial statements employ several techniques when evaluating accounting
information. Among these techniques they may include an assessment of the quality
of the information (Imhoff, 1992). Prior studies have measured quality based on the
corporate disclosure practices measured by the Financial Analysts Federation (FAF)
43 Berkman et al. (2002) reported that less liquid industrial firms tend to use derivatives.

Chapter 5: Research Questions
82
and the Association for Investment Management and Research (AIMR) or a self-
constructed disclosure index developed based on voluntary and/or mandatory
disclosures. These studies have examined the relationship between corporate
disclosure practices and firm characteristics.
The Australian Accounting Standards Board (AASB) is responsible for developing
and promulgating approved standards. Once an AASB standard becomes an
applicable accounting standard firms are expected to comply with its requirements.
The Corporations Law and the Australian Securities and Investment Commission
(ASIC) Act have granted statutory force to the AASB standards. This legal power
should ensure firms’ compliance with the standards, and this should lead to high
quality accounting information being reported. This statutory force indicates that
AASB standards are stringent disclosure standards. For the purposes of this study,
AASB 1033 is assumed to be a “high quality” disclosure standard. This is reasonable
because the extensive nature of its disclosure requirements is designed to overcome
the lack of guidance with regards to recognition and measurement. Thus, firms that
prepare their annual report based on this standard are said to provide “high quality”
derivative information. Therefore, it can be argued that the disclosures required by
AASB 1033 are of high quality and firms that hedge externally are expected to
disclose all the information required by the standard. In other words, the financial
statements reveal the events, transactions, judgements and estimation44 of derivative
instruments so that investors can make better decisions.
44 Pownall and Schipper (1999) defined these as transparency, which is often termed “disclosure quality”.

Chapter 5: Research Questions
83
The following research questions are developed based on prior research that has
explored the quality of other disclosures in financial statements (Firth, 1979; Cooke,
1989, 1991 and 1992; Imhoff, 1992; Malone, Fries and Jones, 1993; Singhvi and
Desai, 1971; Ahmed and Nicholls, 1994; Wallace, Naser and Mora, 1994; Wallace
and Naser, 1995). These studies provide evidence on the association between
corporate disclosure practices and firm characteristics such as size, leverage,
profitability, listing status, external auditor, scope of business and industry type.
Researchers use several theories to explain these characteristics in relation to
corporate disclosure practices. These theories include agency costs45, political
costs46,47, proprietary costs, corporate governance and information asymmetry
(Ahmed and Courtis, 1999).
5.1.1 Size
Firm size is one of the characteristics that has been extensively related to disclosure
policy. There are many reasons why large firms might disclose more information
(Cooke 1991). Singhvi and Desai (1971) indicate that larger firms are expected to
provide more transparent information as they incur lower costs of accumulating
detailed information, they have more marketable securities and they have greater ease
of financing. Cooke (1989) suggests that a further incentive for greater transparency
is to reduce political costs. Cooke (1989, 1991), Firth (1979), Singhvi and Desai
(1971), Wallace et al. (1994), Wallace and Naser (1995), Ahmed and Nicholls (1994),
45 Agency costs comprise monitoring expenditures by the principal, the bonding expenditures by the agent and the residual loss (Jensen and Meckling, 1976). 46 Whittred, Zimmer and Taylor (2000, p. 43) define political costs as “the ability of the government and its regulatory agencies or other interest groups to effect wealth redistributions between claimants in the firm or between the firm and other sectors of its industry or the economy”. 47 Watt and Zimmerman (1986) contended that the management’s choice of accounting methods might be influenced by political costs.

Chapter 5: Research Questions
84
Riahi-Belkaoui (2001) and Ali, Ahmed and Henry (2003) provide evidence that firm
size is positively associated with disclosure level. With respect to the oil and gas
industry, however, Malone et al. (1993) reports that there is no association between
size and disclosure quality. However, in this study, it is expected that large firms will
provide high quality derivative information because they use derivatives extensively,
there are economies of scale associated with disclosure and they may be subject to
political and monitoring costs48. This leads to the first research question:
Research Question 1: Do larger firms in the extractive industries provide more transparent derivative disclosures in their financial statements than smaller firms?
5.1.2 High Performance Firms
The performance of firms has also been identified as a factor affecting disclosure
quality. A profitable firm may provide more detailed information to communicate
good news to investors in order to improve firm value (Ali et al., 2003) and to boost
management compensation (Wallace et al., 1994). However, while Ali et al. (2003)
provide evidence of a positive relationship between profitability and compliance level,
Wallace and Naser (1995) identify a negative relationship between these variables.
Therefore the second research question is:
Research Question 2: Do higher performance firms in the extractive industries provide more transparent derivative disclosures in their financial statements than lower performing firms?
48 According to Jensen and Meckling (1976), the costs are not restricted to measuring or observing the behaviour of the agent, but also include the efforts of the principal to control the behaviour of the agent through budget restrictions, compensation policies, operating rules etc.
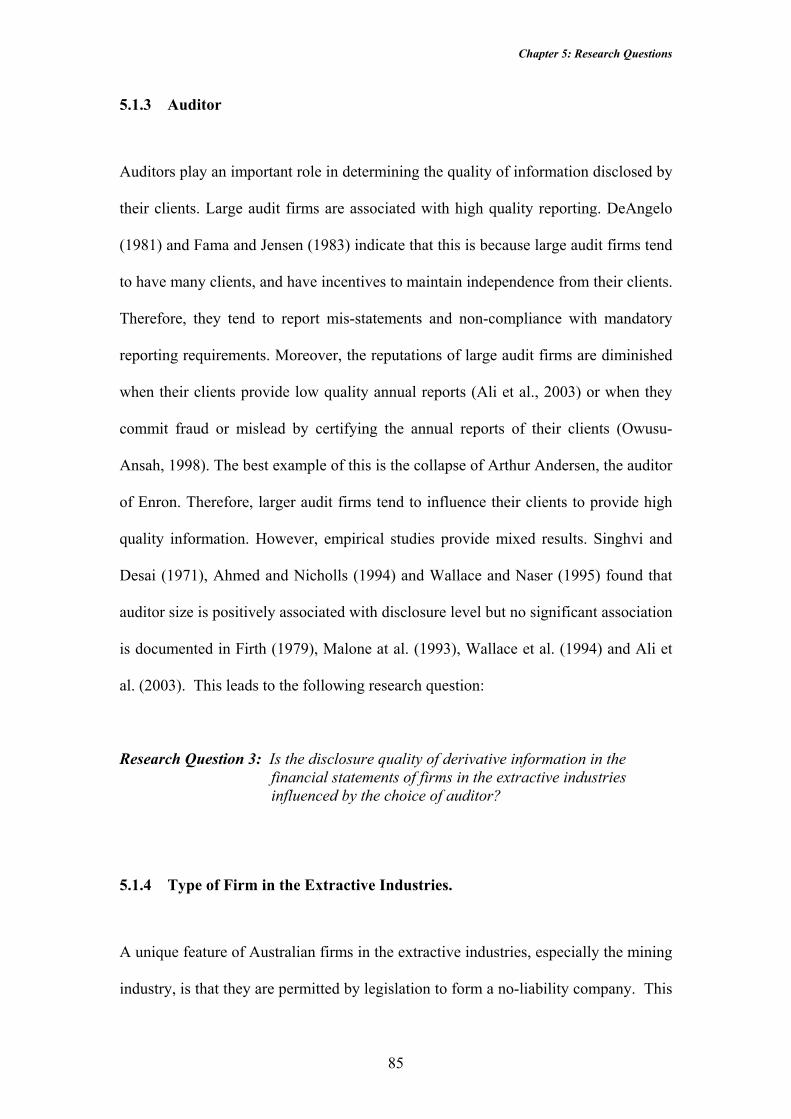
Chapter 5: Research Questions
85
5.1.3 Auditor
Auditors play an important role in determining the quality of information disclosed by
their clients. Large audit firms are associated with high quality reporting. DeAngelo
(1981) and Fama and Jensen (1983) indicate that this is because large audit firms tend
to have many clients, and have incentives to maintain independence from their clients.
Therefore, they tend to report mis-statements and non-compliance with mandatory
reporting requirements. Moreover, the reputations of large audit firms are diminished
when their clients provide low quality annual reports (Ali et al., 2003) or when they
commit fraud or mislead by certifying the annual reports of their clients (Owusu-
Ansah, 1998). The best example of this is the collapse of Arthur Andersen, the auditor
of Enron. Therefore, larger audit firms tend to influence their clients to provide high
quality information. However, empirical studies provide mixed results. Singhvi and
Desai (1971), Ahmed and Nicholls (1994) and Wallace and Naser (1995) found that
auditor size is positively associated with disclosure level but no significant association
is documented in Firth (1979), Malone at al. (1993), Wallace et al. (1994) and Ali et
al. (2003). This leads to the following research question:
Research Question 3: Is the disclosure quality of derivative information in the financial statements of firms in the extractive industries influenced by the choice of auditor?
5.1.4 Type of Firm in the Extractive Industries.
A unique feature of Australian firms in the extractive industries, especially the mining
industry, is that they are permitted by legislation to form a no-liability company. This

Chapter 5: Research Questions
86
is due to the uncertain or speculative nature of the industry, especially in the
exploration phase. In a no-liability company, shareholders are not legally liable to
pay any calls, either while the company is a going concern or in its winding up (Ford,
1986). Therefore, it is expected that disclosure transparency may differ between no-
liability firms and limited liability firms. Further, no-liability firms tend to be smaller
firms, and because they tend not to have reached the production phase, they are also
less likely to be profitable. As a result, they may be reluctant to provide transparent
information due to: a) the high cost of accumulating detailed information, b) the fact
that they may feel that the disclosure could endanger their competitive position
(Singhvi and Desai, 1971) and c) they are not subject to political costs (Cooke, 1989).
The above leads to the following research question:
Research Question 4: Do no-liability companies in the extractive industries have less transparent derivative disclosures in their financial statements than limited liability firms?
5.2 Value Relevance of Derivative Disclosures
5.2.1 Disclosure Quality and the Market Value of Firms Koonce, McAnally and Mercer (2000) indicate that the share price of firms that
externally hedge is higher than for other firms. Firms are motivated to hedge as
hedging is a useful indicator of managerial quality. DaDalt, Gay and Nam (2001)
indicate that hedging could present shareholders with a more informative picture of a
firm’s true earnings capacity. Therefore, it is expected that more transparent
disclosures will have an impact on the share prices of the firms.
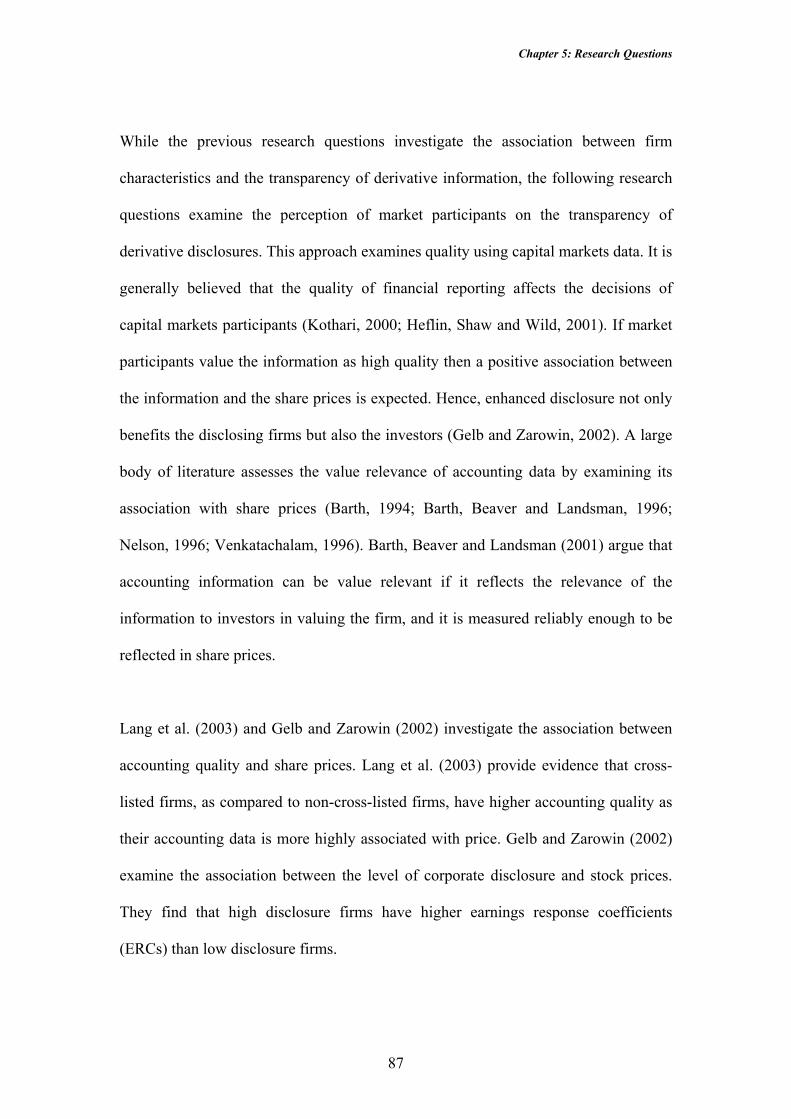
Chapter 5: Research Questions
87
While the previous research questions investigate the association between firm
characteristics and the transparency of derivative information, the following research
questions examine the perception of market participants on the transparency of
derivative disclosures. This approach examines quality using capital markets data. It is
generally believed that the quality of financial reporting affects the decisions of
capital markets participants (Kothari, 2000; Heflin, Shaw and Wild, 2001). If market
participants value the information as high quality then a positive association between
the information and the share prices is expected. Hence, enhanced disclosure not only
benefits the disclosing firms but also the investors (Gelb and Zarowin, 2002). A large
body of literature assesses the value relevance of accounting data by examining its
association with share prices (Barth, 1994; Barth, Beaver and Landsman, 1996;
Nelson, 1996; Venkatachalam, 1996). Barth, Beaver and Landsman (2001) argue that
accounting information can be value relevant if it reflects the relevance of the
information to investors in valuing the firm, and it is measured reliably enough to be
reflected in share prices.
Lang et al. (2003) and Gelb and Zarowin (2002) investigate the association between
accounting quality and share prices. Lang et al. (2003) provide evidence that cross-
listed firms, as compared to non-cross-listed firms, have higher accounting quality as
their accounting data is more highly associated with price. Gelb and Zarowin (2002)
examine the association between the level of corporate disclosure and stock prices.
They find that high disclosure firms have higher earnings response coefficients
(ERCs) than low disclosure firms.
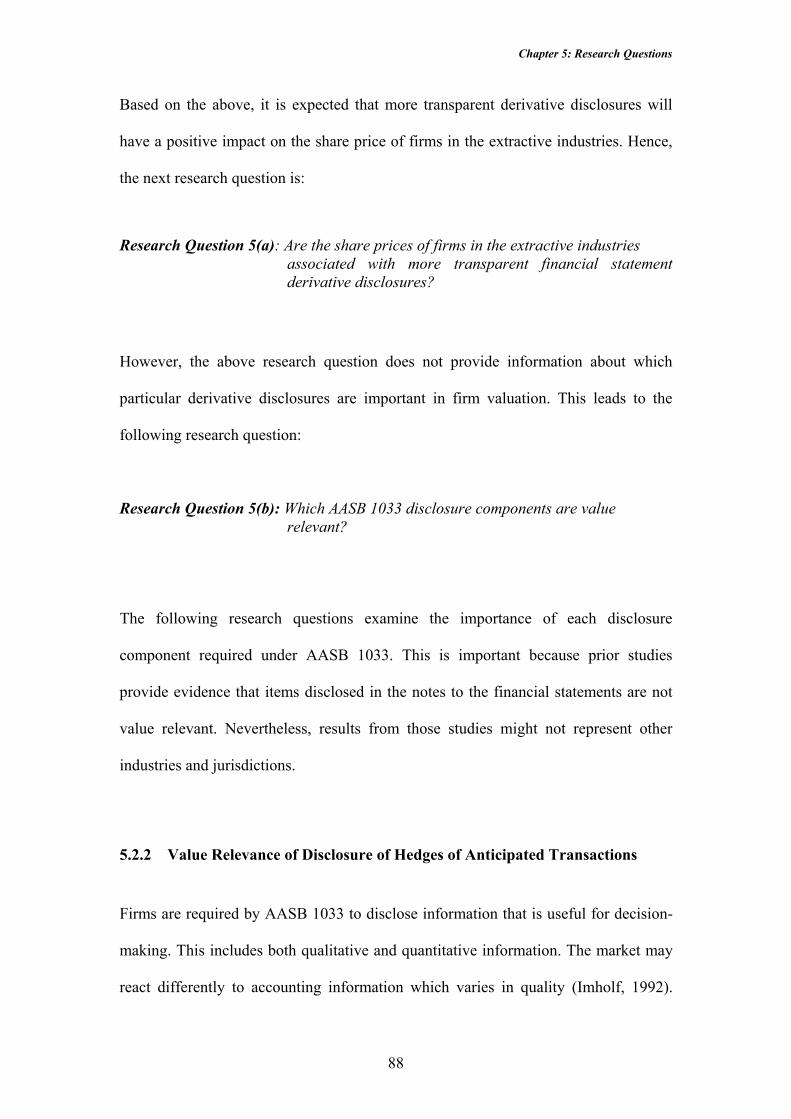
Chapter 5: Research Questions
88
Based on the above, it is expected that more transparent derivative disclosures will
have a positive impact on the share price of firms in the extractive industries. Hence,
the next research question is:
Research Question 5(a): Are the share prices of firms in the extractive industries associated with more transparent financial statement derivative disclosures?
However, the above research question does not provide information about which
particular derivative disclosures are important in firm valuation. This leads to the
following research question:
Research Question 5(b): Which AASB 1033 disclosure components are value relevant?
The following research questions examine the importance of each disclosure
component required under AASB 1033. This is important because prior studies
provide evidence that items disclosed in the notes to the financial statements are not
value relevant. Nevertheless, results from those studies might not represent other
industries and jurisdictions.
5.2.2 Value Relevance of Disclosure of Hedges of Anticipated Transactions
Firms are required by AASB 1033 to disclose information that is useful for decision-
making. This includes both qualitative and quantitative information. The market may
react differently to accounting information which varies in quality (Imholf, 1992).

Chapter 5: Research Questions
89
Because of subjectivity, it is very difficult to determine whether qualitative
information is of higher quality than quantitative information, or vice versa. For
example, in some cases financial statement users are more interested in qualitative
information (such as forward looking information) rather than quantitative
information (such as earnings forecasts) since users may have their own ability to
determine the quantitative amounts.
Paragraph 5.8 AASB 1033 requires firms to disclose: a) a description of the
anticipated transactions, including the period of time until they are expected to occur,
b) a description of the hedging instruments and c) the amount of any deferred or
unrecognised gain or loss49 and the expected timing of recognition as revenue or
expense. This information permits the users of an entity’s financial report to
understand the nature and effect of hedges of anticipated future transactions. The
research question is:
Research Question 6: Do the share prices of extractive industries firms reflect the information that firms hedge their exposure to the risks from anticipated transactions?
The issue of whether the disclosed items are considered as important as recognised
items has been examined by previous researchers. Davis-Friday, Folami, Liu and
Mittelstaedt (1999) define recognition as any amount that has been recorded and
included in the total of the income statement or balance sheet. On the other hand,
disclosure is any information (qualitative or quantitative in nature) that is contained in
the notes to the financial statements that is not recognised in the income statement or
49 The unrecognised gain or loss may result from the difference between net fair value and the historical cost of financial instruments. The amount includes all accrued gains and losses on hedge instruments.
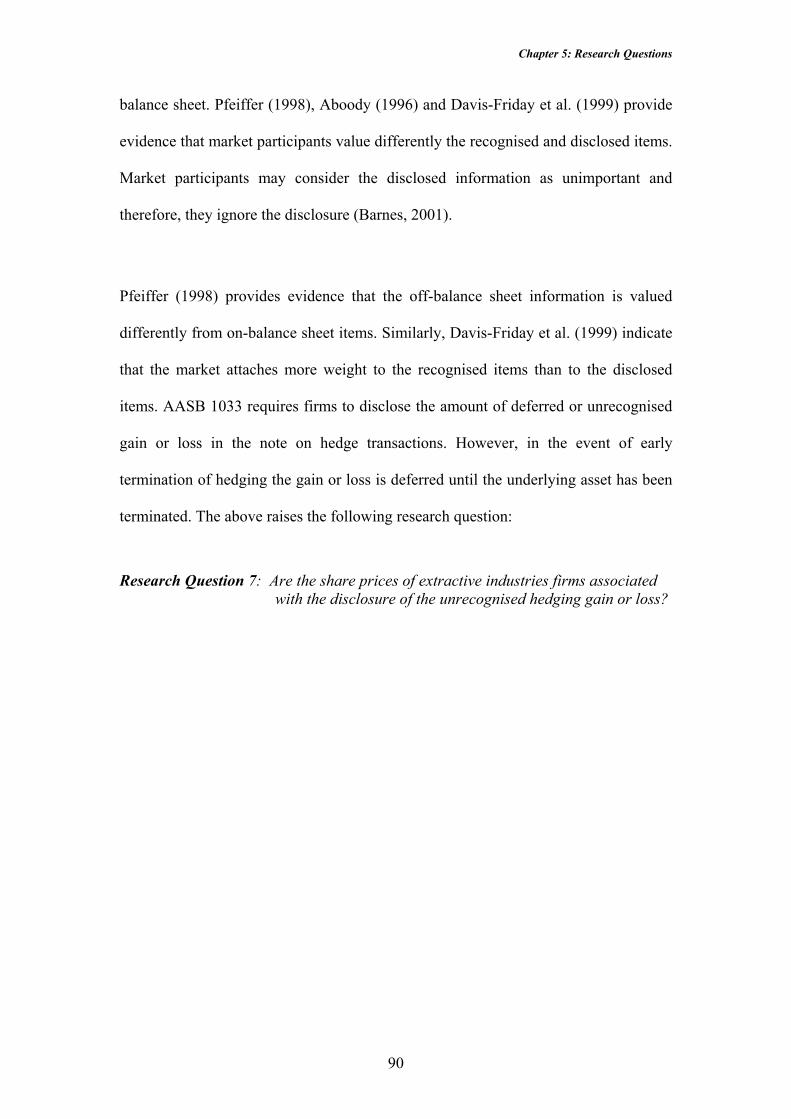
Chapter 5: Research Questions
90
balance sheet. Pfeiffer (1998), Aboody (1996) and Davis-Friday et al. (1999) provide
evidence that market participants value differently the recognised and disclosed items.
Market participants may consider the disclosed information as unimportant and
therefore, they ignore the disclosure (Barnes, 2001).
Pfeiffer (1998) provides evidence that the off-balance sheet information is valued
differently from on-balance sheet items. Similarly, Davis-Friday et al. (1999) indicate
that the market attaches more weight to the recognised items than to the disclosed
items. AASB 1033 requires firms to disclose the amount of deferred or unrecognised
gain or loss in the note on hedge transactions. However, in the event of early
termination of hedging the gain or loss is deferred until the underlying asset has been
terminated. The above raises the following research question:
Research Question 7: Are the share prices of extractive industries firms associated with the disclosure of the unrecognised hedging gain or loss?
Chapter 5: Research Questions
91
5.2.3 Value Relevance of Fair Value Disclosures
Fair value accounting50 has become the preferred option of accounting for financial
instruments as opposed to historical cost. A move to fair value is believed to be due to
the belief that market-based information is the most relevant financial data for
financial statement users. The disclosure of fair value information is expected to
provide more useful information for users to assess the effects of derivative
transactions (Rasch and Wilson, 1998).
Prior research has investigated the usefulness of fair value information based on the
relevance and reliability of the information recognised and disclosed in the financial
statements required by the accounting standards. Most value relevance studies
examine the value relevance of fair value information (for example Barth, 1994;
Eccher et al., 1996; Nelson, 1996; Venkatachalam, 1999). Barth (1994) and Barth et
al. (1996) provide evidence that the fair value estimates provide significant
explanatory power beyond the historical costs. However, Eccher et al. (1996) reject
the hypotheses on the incremental explanatory power of fair value. Therefore, the next
research question is:
Research Question 8: Are the net fair value disclosures value relevant and do they provide incremental information over book values for firms in the extractive industries?
50 AASB 1033 defines fair value as the amount for which an asset could be exchanged, or liability settled, between knowledgeable, and willing parties in an arm’s length transaction. The term ‘fair value’ is used interchangeably with mark-to-market, market value-based and market value accounting.
Chapter 5: Research Questions
92
5.3 Summary This chapter has developed the research questions which draw on both the Australian
institutional environment and prior studies in the areas of disclosure quality and value
relevance research. Because this study focuses on a specific issue, derivative
disclosures, the research questions on firm characteristics are developed based on
prior research that has explored the quality of other disclosures in financial
statements. The current study examines the association between the quality of
derivative information disclosed according to AASB 1033 and firm size, type,
profitability, growth opportunities, leverage and auditor. The value relevance research
questions are based on prior research that has explored the value relevance of fair
values as compared to historical accounting for derivative disclosures. The next
chapter details the research method and data collection procedures used to test these
research questions and presents descriptive statistics.

Chapter 6: Research Design, Data Collection and Descriptive Statistics
93
CHAPTER 6 RESEARCH DESIGN, DATA COLLECTION AND DESCRIPTIVE STATISTICS
This chapter outlines the data selection process, research methodology undertaken and
model development in the testing of the research questions developed in chapter five.
Data selection procedures and the period of the study are discussed in section 6.1.
Section 6.2 deals with the specification of the variables used in this study and the
model development. Section 6.3 discusses the estimation procedures, while section
6.4 presents the descriptive statistics. Section 6.5 summarises the chapter.
6.1 Data Selection and Test Period The main source of information for this study is the annual reports of all listed
companies in the extractive industries51. These industries play a significant role in the
Australian economy, where they generate exports worth more than $30 billion in 2000
to 2002 (Department of Foreign Affairs and Trade, 2003a; 2003b). They represent
25% of the listed companies on the Australian Stock Exchange (ASX).
Approximately 27% of the companies are no-liability firms.
All extractive industries firms (354 firms) listed on the ASX for the years between
1998 to 2001 were initially selected. Firms were contacted and asked to provide
annual reports for each year. However, in some cases the annual reports were
downloaded from corporate websites or the Annual Report Collection (Connect 4).
51 According to Deegan (2002) the extractive industries refer to firms which engage in the search for natural substances of commercial value such as minerals, oil and natural gas.
Chapter 6: Research Design, Data Collection and Descriptive Statistics
94
Eighty nine firms were excluded because they did not respond to the request and their
annual reports were not available from Connect 4. Further, the data size was reduced
to 149 firms by excluding: a) foreign listed firms, b) newly listed/delisted firms, c)
mining servicing firms, d) firms that have been dormant/under receivership etc. and e)
firms with missing data. 12 firms were eliminated for regression analysis purposes
because of the unavailability of share price data. Therefore, the number of firms
available for this study is 13752.
The annual reports of the firms were manually searched to identify whether these
firms are users of derivative instruments. First, the note on the statement of
accounting policies was examined. This statement provides details of the significant
accounting policies adopted for the financial year. Firms provide information about
the objectives of holding or issuing derivative financial instruments or hedging
activities in this note. Further, in the event that firms fail to indicate their hedging
behaviour in the note on accounting policies, the note on financial instruments was
examined. This manual search concentrated on the terms of hedging instruments,
derivative instruments, forward contracts, foreign currency contracts, futures
contracts, swap agreements and rate swaps. The following are two examples of
accounting policy notes, which indicate the user status:
52 Summary of data selection is presented in Table 6.2.

Chapter 6: Research Design, Data Collection and Descriptive Statistics
95
Westralian Sand Limited Annual Report 1998
Note 1 Statement of Significant Accounting Policies s) Derivative financial instruments (Other than foreign currency and commodity hedging)
The economic entity enters into consumer price index swap contracts and interest rate swap agreements to manage financial risk.
QCT Resources Limited Annual Report 1999 1. Statement of Accounting Policies
Derivatives
Derivatives transactions are entered into solely to hedge foreign exchange risks, within limit set by the Board of Directors.
The note on financial instruments is another source of information. This note provides
detailed information on each class of financial instruments, including derivative
instruments. A firm is identified as a user if there is information disclosed with regard
to hedging instruments, derivative instruments, forward contracts, foreign currency
contracts, futures contracts, swap agreements and interest rate swaps. The following is
the note on the financial instruments of 1998 annual reports of Westralian Sands
Limited, which indicates the firm is a user of derivative instruments. The note
describes information about: a) the anticipated transaction that exposed the company
to the risk, b) hedging instruments and c) the amount of any deferred or unrecognised
gain or loss53.
53 The amount includes all accrued gains or losses on financial instruments designated as hedges of anticipated transactions. The accrued gain or loss may be unrealised (as a results of carrying the hedging instrument at net fair value) but recorded in the statement of financial position, or it may be unrecognised (if the instrument is carried at cost), or it may be realised. However, the accrued gain or

Chapter 6: Research Design, Data Collection and Descriptive Statistics
96
Westralian Sands Limited Note 26 Financial Instruments
a) Foreign Exchange Hedging of Revenues The sales revenue of the economic entity is predominantly dominated in United States dollars. In order to protect against adverse exchange rate movements, a proportion of future anticipated sales revenue has been sold forward utilising either forward foreign exchange contract or foreign exchange options.
b) Forward Foreign Exchange Contracts
The table below details outstanding forward contracts to sell US Dollars, and buy Australian dollars as at balance date:
Maturity Sell US
Dollars Buy Australian
Dollars 1998 US$M 1998 A$M Not later than 1 year 16.9 22.8 Later than 1 year but not later than 2 years
6 10.5
The mark to market loss relating to these contracts at 31 December 1998 is A$13.8m (1997 Nil) and is included in provision for loss on currency forward contracts and options.
Table 6.1 presents details on the use of derivative instruments among the 137 firms,
classified by size and type of firm. Column 4 Panel A shows that 56 firms in the
sample are listed as Top 500 Australian companies54 and the majority of these are
limited liability companies. In all years, 44 (78%) firms disclose their use of
derivatives. While only two firms specifically disclose that they do not use
loss has not been recognised in the calculation of net profit or loss pending completion of hedging transaction (paragraph 5.8.2 AASB 1033). 54 These firms are among 94 extractive industries firms in the Top 500 Public Companies listed in the Business Review Weekly (BRW) or Annual Report Collection (Connect 4).

Chapter 6: Research Design, Data Collection and Descriptive Statistics
97
derivatives, ten (18%) firms make no specific reference to derivative financial
instruments. The majority of those making no disclosures are no-liability firms.
Table 6.1: The Use of Derivative Financial Instruments for Hedging Purposes
Limited Liability Firm No Liability Firm Total Status 1998 1999 2000 2001 1998 1999 2000 2001 1998 1999 2000 2001
Panel A: Firms from the Top 500 Companies Listed in BRW/Connect 4 (n = 56)
User 35 35 35 35 9 9 9 9 44 44 44 44 Unknown 3 3 3 3 7 7 7 7 10 10 10 10 Non-user 1 1 1 1 1 1 1 1 2 2 2 2 Total 39 39 39 39 17 17 17 17 56 56 56 56 Panel B: Firms from outside the Top 500 companies (n = 81)
User 3 5 8 8 18 16 13 13 21 21 21 21 Unknown 4 4 20 31 47 45 30 17 51 49 50 48 Non-user 0 0 4 5 9 11 6 7 9 11 10 12 Total 7 9 32 44 74 72 49 37 81 81 81 81
Column 4 Panel B of Table 6.1 indicates that 81 firms in the data are outside the Top
500 companies, i.e. they are smaller companies. However, only 21 of these firms
disclose that they use derivative instruments, with the majority of these smaller firms
being no-liability firms. It is evident that there is a sharp decline in the total number of
no-liability companies during the four year period. Further, the majority of the non-
top 500 firms make no disclosures about their use of derivative financial instruments.
Given that these companies are small companies, it can be safely assumed that these
60 firms do not use derivatives. In total, the number of firms that use derivative
financial instruments in this study is 65 firms for each of the years. Only 12 firms
from the top 500 are excluded, 2 being non-users and 10 unknown. Table 6.2
summarises the data selection procedure for the final data of 65 firms.
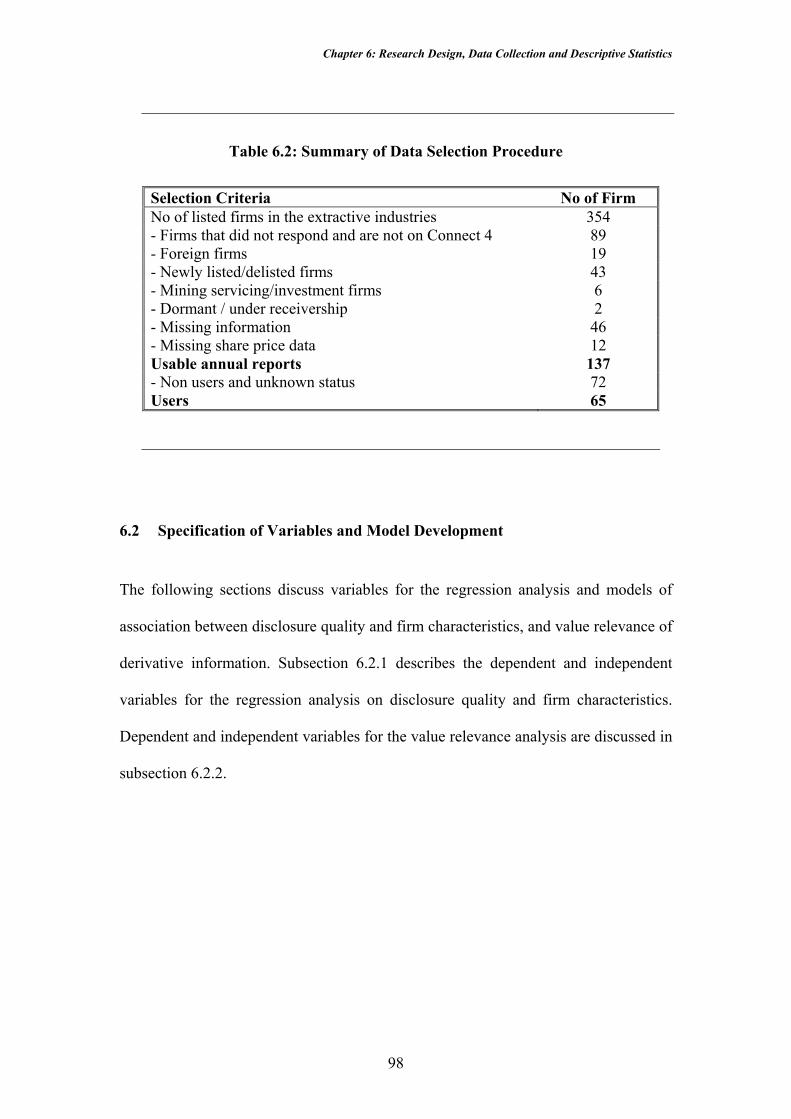
Chapter 6: Research Design, Data Collection and Descriptive Statistics
98
Table 6.2: Summary of Data Selection Procedure
Selection Criteria No of Firm No of listed firms in the extractive industries 354 - Firms that did not respond and are not on Connect 4 89 - Foreign firms 19 - Newly listed/delisted firms 43 - Mining servicing/investment firms 6 - Dormant / under receivership 2 - Missing information 46 - Missing share price data 12 Usable annual reports 137 - Non users and unknown status 72 Users 65
6.2 Specification of Variables and Model Development
The following sections discuss variables for the regression analysis and models of
association between disclosure quality and firm characteristics, and value relevance of
derivative information. Subsection 6.2.1 describes the dependent and independent
variables for the regression analysis on disclosure quality and firm characteristics.
Dependent and independent variables for the value relevance analysis are discussed in
subsection 6.2.2.
Chapter 6: Research Design, Data Collection and Descriptive Statistics
99
6.2.1 Disclosure Quality and Firm Characteristics (Firm Characteristics Model)
6.2.1.1 Variables a) Dependent Variable
The dependent variable for the first part of this study is disclosure transparency,
which is termed “disclosure quality”. A number of previous studies rely on corporate
disclosure quality as measured by users such as the Financial Analysts Federation
(Imhoff, 1992; Sengupta, 1998; Riahi-Belkaoui, 2001; Heflin et al., 2001; Shaw,
2002), the Association for Investment Management Research (Lang and Lundholm,
1993; Lang et al., 2003; Lobo and Zhou, 2001; Bushee and Noe, 2000; Price, 1998;
Botosan and Plumlee, 2003) and the Center for International Financial Analysis and
Research (Hope, 2003a and 2003b). However, these studies examine disclosure
quality based on all the information disclosed in the annual reports and other media.
Other studies measure disclosure quality based on a self-constructed disclosure index.
These include Cooke (1989, 1991 and 1992), Malone et al. (1993), Wallace (1988),
Wallace, Naser and Mora (1994), Botosan (1997), Tower, Hancock and Taplin
(1999), Chalmers (2001), Taplin, Tower and Hancock (2002) and Ali et al. (2003). In
these studies researchers employ either a weighted or a unweighted index (Marston
and Shrives, 1991). A weighted index requires a survey to be conducted so that
financial statement users can rate disclosure items listed by the researchers in order of
importance. The unweighted index is less subjective than the weighted index. In this
case, researchers adopt a dichotomous procedure where a score of one is given for
disclosed items and zero otherwise. Therefore, the index assumes that each of the
items of disclosure is equally important (Cooke, 1991).

Chapter 6: Research Design, Data Collection and Descriptive Statistics
100
The current study develops an unweighted index for derivative disclosures to
represent disclosure quality based on the information in the financial statements and
notes to the financial statements. This thesis acknowledges that annual reports are not
the only source of corporate reporting. However, focusing on this source will not
reduce the quality of information disclosure since it is generally believed that the
annual report is one of the most important sources of corporate information (Botosan,
1997). As well, these derivative disclosures have been audited. The index is
developed based on the AASB 1033 requirements. As AASB 1033 does not specify
rules for the recognition and measurement of financial instruments, its disclosure
requirements are extensive. Therefore, compliance with the accounting standard is
assumed to provide high quality disclosures. Five categories of information are
identified55. These are policy information, hedges of anticipated future transactions,
risk information, net fair value information and commodity contracts regarded as
financial instruments. A score of one is given for each item based on the detailed
information provided, both qualitative and quantitative, while a score of zero is
allocated if firms failed to provide any information required. Table 6.3 documents the
attributes of the disclosure index.56
55 The disclosures of these items are required by AASB 1033. However, there is no theory on the items to be included in the disclosure index, and the number of items in the index have varied from one research study to another (Marston and Shrives, 1991; Wallace and Naser, 1995). 56 A score two is given for paragraphs 5.2(b), 5.6(a), 5.6(b), 5.8(a) and 5.8(c) since these paragraphs require two information.

Chapter 6: Research Design, Data Collection and Descriptive Statistics
101
Table 6.3: Components of Derivative Disclosure Index Reference Score Policy Information
Accounting policies and method adopted Para 5.2 (a) 1 a) Extent and nature of the underlying financial instruments, b)
including significant terms and conditions that may affect the amount, timing and uncertainty of future cash flows.
Para 5.2 (b) 2
Objectives for holding or issuing derivative financial instruments Para 5.3 1 Component score of policy information 4 Hedges of Anticipated Transactions
a) A description of the anticipated transaction and b) including the period of time until they are expected to occur.
Para 5.8 (a) 2
A description of the hedging instruments. Para 5.8 (b) 1 a) Amount of any deferred or unrecognised gain or loss and b)
the expected timing of recognition as revenue or expense. Para 5.8 (c) 2
Component score of hedges of anticipated transactions 5 Risk Information
Contractual repricing or maturity dates for interest rate risk Para 5.4 (a) 1 Effective interest rates or weighted average Para 5.4 (b) 1 The maximum amount of credit risk exposure at reporting date Para 5.5 (a) 1
Component score of risk information 3 Net Fair Value Information
a) The aggregate net fair value as at the reporting date and b) showing separately the aggregate net fair value of those financial assets or financial liabilities which are not readily traded on organised markets in a standardised form.
Para 5.6 (a) 2
The method or methods adopted in determining net fair value. Para 5.6 (b) 1 Any significant assumptions made in determining net fair value. Para 5.6 (c) 1 The carrying amount and the net fair value of either the
individual asset or appropriate groupings of those individual assets.
Para 5.7 (a) 1
a) The reasons for not reducing the carrying amount and b) including the nature of the evidence that provides the basis for management’s belief that the carrying amount will be recovered.
Para 5.7 (b) 2
Component score of net fair value information 7 Commodity Contracts Information
Contract for commodity gold Para 5.9 (a) 1 Component score of commodity contracts information 1
To develop the index the notes to the financial statements are examined. First, the
note containing the statement of accounting policies is examined57. Basically, firms
disclose the objectives for holding or issuing derivative financial instruments in this
note. In the event that firms fail to indicate their hedging behaviour in this note, the
note on financial instruments is examined. The search concentrates on the terms of 57 This statement provides details of the significant accounting policies adopted for the financial year.

Chapter 6: Research Design, Data Collection and Descriptive Statistics
102
hedging instruments, derivative instruments, forward contracts, foreign currency
contracts, futures contracts, swap agreements and rate swaps. There are three
possibilities with disclosures. The entities either: a) disclose that they hedge the risk
internally or externally, b) disclose that they do not hedge, or c) disclose nothing
about hedging.
After identifying the hedging behaviour of firms, the next step is to capture
information about hedge disclosures and net fair values of financial assets, financial
liabilities and derivative financial instruments. This information is disclosed in the
note on financial instruments. The followings are example of notes of financial
instruments taken from Consolidated Rutile Limited 1999 Annual Report and
Centennial Coal Company Limited 2001 Annual Report, respectively:
Consolidated Rutile Limited, 1999 Annual Report
Note 27 Financial Instruments
a) Off-balance sheet derivative instruments The parent entity is party to financial instruments with off-balance sheet risk in the normal course of business in order to hedge exposure to fluctuations in foreign exchange rates and interest risk. Hedging of foreign currencies is effected through a combination of forward contracts and options. Exposure to interest rate fluctuations is managed through interest rate swaps and options. i) Foreign exchange hedging of revenues The company’s sales revenue is predominantly denominated in United States dollars. In order to protect against adverse exchange rate movements a proportion of future anticipated sales revenue has been sold forward utilising either forward exchange contracts or foreign exchange options.
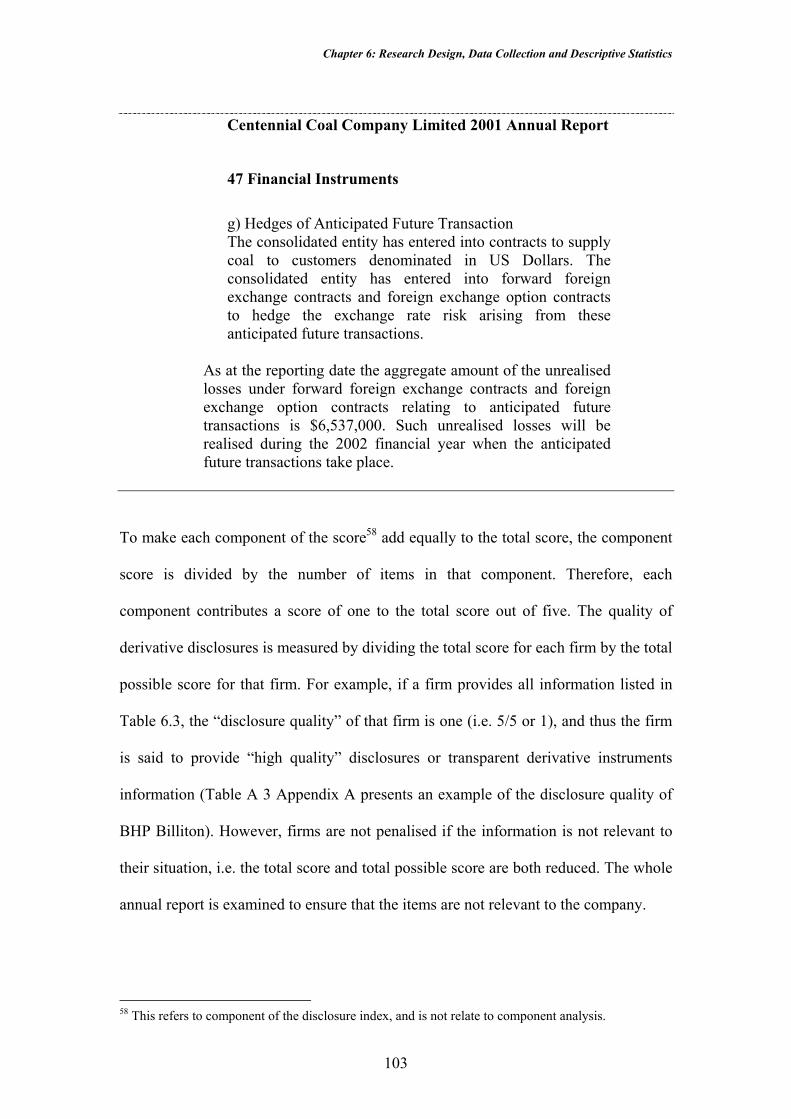
Chapter 6: Research Design, Data Collection and Descriptive Statistics
103
Centennial Coal Company Limited 2001 Annual Report
47 Financial Instruments
g) Hedges of Anticipated Future Transaction The consolidated entity has entered into contracts to supply coal to customers denominated in US Dollars. The consolidated entity has entered into forward foreign exchange contracts and foreign exchange option contracts to hedge the exchange rate risk arising from these anticipated future transactions.
As at the reporting date the aggregate amount of the unrealised losses under forward foreign exchange contracts and foreign exchange option contracts relating to anticipated future transactions is $6,537,000. Such unrealised losses will be realised during the 2002 financial year when the anticipated future transactions take place.
To make each component of the score58 add equally to the total score, the component
score is divided by the number of items in that component. Therefore, each
component contributes a score of one to the total score out of five. The quality of
derivative disclosures is measured by dividing the total score for each firm by the total
possible score for that firm. For example, if a firm provides all information listed in
Table 6.3, the “disclosure quality” of that firm is one (i.e. 5/5 or 1), and thus the firm
is said to provide “high quality” disclosures or transparent derivative instruments
information (Table A 3 Appendix A presents an example of the disclosure quality of
BHP Billiton). However, firms are not penalised if the information is not relevant to
their situation, i.e. the total score and total possible score are both reduced. The whole
annual report is examined to ensure that the items are not relevant to the company.
58 This refers to component of the disclosure index, and is not relate to component analysis.

Chapter 6: Research Design, Data Collection and Descriptive Statistics
104
b) Independent Variables
i) Size of the Firm
Size of the firm is one of the characteristics that have been found to be consistently
related to disclosure policy. Several studies use the sum of book value of debt and
market value of common equity (as in Knoff, Nam and Thornton, 2002) and net sales
(Stanga, 1976; Cooke, 1989; Wallace et al., 1994) as a proxy for size. However, the
current study defines size as the log of total assets, which represents SIZE. This is
because the measure “total assets” is the least affected by market fluctuations in the
oil and gas industry (Malone, Fries and Jones, 1993). Asset size has been used in
studies by Singhvi and Desai (1971), Firth (1979), Wallace (1988), Cooke (1989),
Imhoff (1992) and Malone et al. (1993).
ii) Performance
Performance of the firms has also been identified as a factor impacting disclosure
quality. High performance is measured by two variables: profitability (PROFIT) and
price-earnings ratio (PE). The former measures current performance while the latter
provides a measure of the market’s perception of a firm’s expected future
performance. Profitability is determined by dividing earnings before tax by total
assets. This is consistent with prior studies such as Ali et al. (2003) and Wallace et al.
(1994). The PE ratio is derived by dividing price by earnings before extraordinary
items per share.
Chapter 6: Research Design, Data Collection and Descriptive Statistics
105
iii) Type of Firm in the Extractive Industries
Australian company law has an optional provision allowing mining industry firms to
form a company as a no-liability firm (NL). As at 2001, 27% of listed firms in the
extractive industries are no-liability firms. The majority of these firms are small
firms. Table 6.1 indicates that in 1998, out of the total 137 firms, 91 are identified as
no-liability firms, and this number reduces to 54 in 2001 with the majority of these
firms outside the Top 500 companies (i.e. small firms). Out of these, 26 firms and 22
firms use derivatives in 1998 and 2001, respectively. Whether the firm is a no-liability
firm or a limited liability firm is indicated by TYPE. The measure of TYPE is a
dichotomous variable of one to represent no-liability firm, and zero otherwise. Cooke
(1989) and Wallace and Naser (1995) indicate that type of industry may affect the
level of disclosure. However, since this study examines disclosure within one
industry, comparing one type of firm (no-liability firm) with another type of firm
(limited liability firm) in this industry, will provide evidence of whether the type of
firm will impact on the information provided.
iv) Auditor
The auditor plays a major role in clients’ disclosure policies and practices. To
examine this association the variable AUDIT is used to distinguish between the use of
a Big 5 (or Big 6) auditor and a smaller audit firm. About 53 of the total 65 firms in
1998 are audited by Big 5 (Big 6) audit firms, and the number increases to 56 firms in

Chapter 6: Research Design, Data Collection and Descriptive Statistics
106
2001. As in prior studies a dichotomous variable is used with a score of one given to a
Big 5 (Big 6) firm, and zero otherwise.
v) Control Variables
Three control variables that have been found in prior research to be associated with
the quality or extent of disclosure are also included. Two variables are used to
measure growth opportunities and one variable is used as a proxy for leverage. First,
market-to-book ratio (MTB), which measures the market value of the firm divided by
the book value of tangible assets. This variable provides a measure of the market’s
perceptions of the value of the firm relative to assets-in-place, with a high value
suggesting growth opportunities (Smith and Watts, 1992; Gaver and Gaver, 1993).
Growth firms are expected to disclose more information as these firms have greater
information asymmetry and agency costs (Eng and Mark, 2003). However, Eng and
Mak (2003) find no significant relationship between disclosure and growth
opportunities, which is represented by a factor score of growth variables (market-to-
book value of assets, market-to-book value of equity and price-earnings ratio).
Second, a dichotomous variable indicating whether or not the firm engages in
research and development activities (R&D) is used; i.e. one for firm that is involved
in R&D, zero otherwise. R&D activities are an indication that the firm is likely to
grow in the future (Gaver and Gaver, 1993; Percy, 2000; Clinch, 1991).
To identify whether firms in the extractive industries engage in R&D activities, notes
to the financial statements of each firm are examined. Firms disclose their R&D
activities either in: a) the note on accounting policies, b) the note on operating
income, c) the note on income tax or d) the note on intangibles or non-current assets.

Chapter 6: Research Design, Data Collection and Descriptive Statistics
107
An example of a firm that disclosed R&D activities in the note on income tax is taken
from Centennial Coal Company Limited in 2001. This firm is coded as one. Further,
some firms may use R&D syndicates for financing R&D. These firms are also coded
as one. An example of a firm that uses R&D syndicates is Energy Equity Corporation
Limited. Through out 1998 to 2000, there are 21 firms that use derivative instruments
and which are also involved in R&D, and this number reduces to 20 firms in 2001.
The other control variable is leverage, which is measured as debt divided by the book
value of common equity. Firms with high leverage are expected to reduce disclosure
as leverage controls the free cash flow problem, and as in Jensen (1986), the agency
costs of debt are controlled through restrictive debt covenants in debt agreements
rather than increased disclosure of information in financial reports (Eng and Mak,
2003). Several prior studies such as Hossain and Adams (1995) and Ali et al. (2003)
provide evidence that leverage is not significantly related to disclosure. However,
Ahmed and Courtis (1999) indicate that leverage is positive and significantly related
to disclosure levels, especially when it is proxied by the debt-to-equity ratio and the
debt-to-total asset ratio. Specific to the oil and gas industry, Malone et al. (1993)
indicate that firms with high debt-to-equity ratios disclose greater financial
information than firms with low debt-to-equity ratios.
6.2.1.2 Regression Model
Equation 6.1 examines the association between the information quality of disclosures
of derivative instruments and firm characteristics. Firm characteristics are represented
by: firm size (SIZE); profitability (PROFIT); price-earnings ratio (PE); market-to-
book ratio (MTB); type of firm in the extractive industries (TYPE); type of auditor
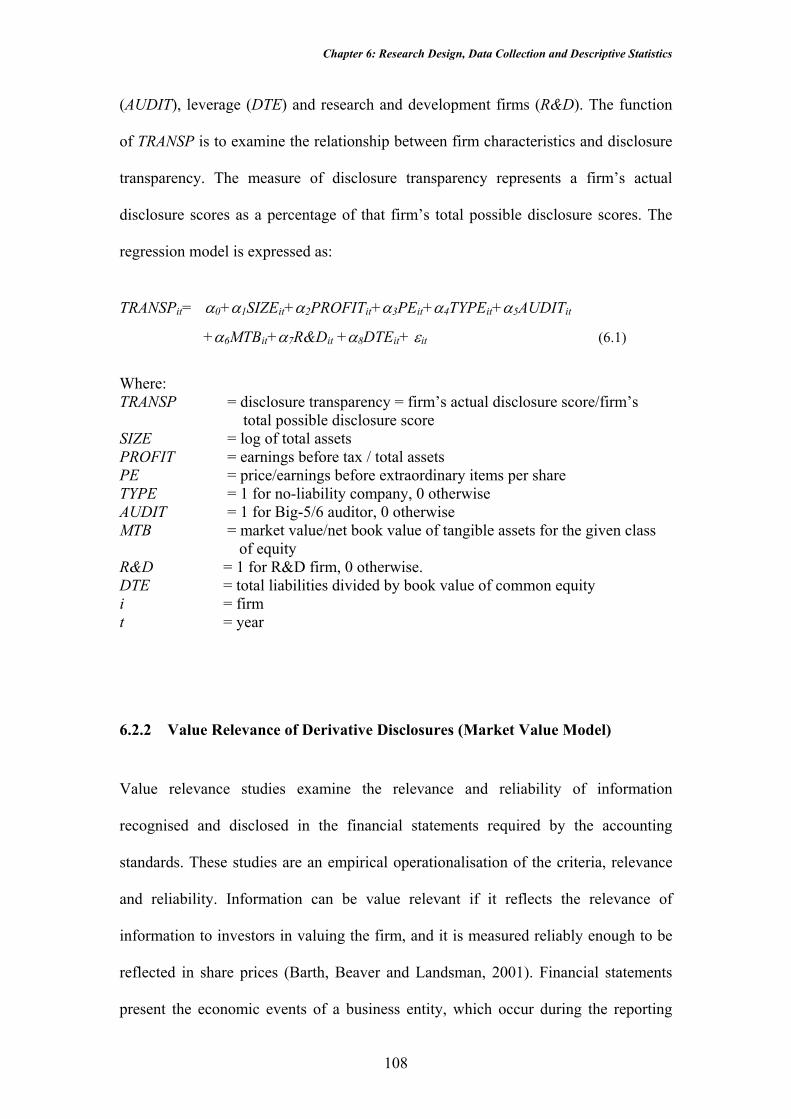
Chapter 6: Research Design, Data Collection and Descriptive Statistics
108
(AUDIT), leverage (DTE) and research and development firms (R&D). The function
of TRANSP is to examine the relationship between firm characteristics and disclosure
transparency. The measure of disclosure transparency represents a firm’s actual
disclosure scores as a percentage of that firm’s total possible disclosure scores. The
regression model is expressed as:
TRANSPit= α0+α1SIZEit+α2PROFITit+α3PEit+α4TYPEit+α5AUDITit
+α6MTBit+α7R&Dit +α8DTEit+ εit (6.1)
Where: TRANSP = disclosure transparency = firm’s actual disclosure score/firm’s
total possible disclosure score SIZE = log of total assets PROFIT = earnings before tax / total assets PE = price/earnings before extraordinary items per share TYPE = 1 for no-liability company, 0 otherwise AUDIT = 1 for Big-5/6 auditor, 0 otherwise MTB = market value/net book value of tangible assets for the given class
of equity R&D = 1 for R&D firm, 0 otherwise. DTE = total liabilities divided by book value of common equity i = firm t = year
6.2.2 Value Relevance of Derivative Disclosures (Market Value Model) Value relevance studies examine the relevance and reliability of information
recognised and disclosed in the financial statements required by the accounting
standards. These studies are an empirical operationalisation of the criteria, relevance
and reliability. Information can be value relevant if it reflects the relevance of
information to investors in valuing the firm, and it is measured reliably enough to be
reflected in share prices (Barth, Beaver and Landsman, 2001). Financial statements
present the economic events of a business entity, which occur during the reporting
Chapter 6: Research Design, Data Collection and Descriptive Statistics
109
period, and hence, the information may be value relevant to investors. Unlike
managers, shareholders and investors have limited access to this information, and
therefore, the disclosed information, such as hedge and net fair value information,
may be of value relevance to them.
To test whether the hedge disclosures and net fair value of financial assets (FA),
financial liabilities (FL) and derivative financial instruments are useful in equity
valuation, this study employs valuation models. There are a few valuation models
being used in capital markets research, including the dividend-discounting model, the
earnings capitalisation model and the residual income model. The balance sheet
model is quite popular in value-relevance studies, i.e. disclosure regulation research
(Kothari, 2001).
Unlike most previous research in value relevance, this study develops the models
based on Ohlson (1995)59. Ohlson’s model provides a direct link between accounting
amounts and firm value which is absent from other models (Barth, 2000). More
importantly, the model specifies how to estimate firm value from accounting amounts
rather than relying on market prices, permitting researchers to specify tests relating to
perceived mispricing of shares and providing a link between financial analysis and
valuation (Barth, 2000).
Ohlson expresses firm value as book value, plus discounted future expected abnormal
earnings. The model is derived based on two primary assumptions: a) the relation
59 Simko (1999) also developed a valuation model based on Feltham and Ohlson (1995).

Chapter 6: Research Design, Data Collection and Descriptive Statistics
110
between value and expected future earnings: i.e. ( )
+
+∑∞
=Ε≡
ττ
τ r
tdttP
11 60 and b) the clean
surplus relation (change in book value to equal earnings minus net dividends61). The
model is:
(6A)
where: Pt = the market value (price) of the firm’s equity at date t yt = net book value at date t Rf = the risk-free rate plus 1 Et [.] = the expected value operator conditioned on the date t information xa = abnormal earnings define as xt – (Rf – 1) yt-1
Adding the third assumption related to information dynamic, i.e. the time series
behaviour of abnormal earnings, Ohlson derives:
ttttt vdxkykP 2)()1( αϕ +−+−= (6B)
where: k = (Rf –1)α1= (Rf –1)ω/ (Rf –ω) φ = Rf/(Rf-1) v = information other than abnormal earnings xt = earnings for the period (t-1, t) dt = net dividend paid at date t ω and α are known parameters between zero and one.
Equation (6B) indicates that the valuation model can be viewed as a weighted average
of earnings and book value. The equation provides a better understanding of the
relative valuation implications of book value and net income in valuation (Barth,
2000). Therefore, the framework for examining the cross-sectional relation between 60 Where Pt is the price of the firm’s equity at time t, Et[dt+τ] is the expected dividends paid at time t+τ conditional on time t information and r is the discount rate that is assumed to be constant. 61 tttt dxyy −+= −1 , where y denotes book value of current year (t) and the previous year (t-1).
[ ]attftt xRyP τ
τ
τ+
∞
=
− Ε+= ∑1

Chapter 6: Research Design, Data Collection and Descriptive Statistics
111
firm value and hedge disclosures, and net fair value information is based on equation
(6B). Equation (6B) is cited as the theoretical foundation for studies between share
price, book value (and its components) and earnings (and its components) (Easton,
1999 and Ota, 2001), also known as the price model. The linear regression is:
Pit = α0 + α1bit+ α2xit +εit (6C) where, Pit is share price at year end t for firm i, bit is book value of equity at year end
t for firm i and xit is earnings for year t available to firm i’s common shareholders.
To investigate the value relevance of derivative disclosures, models are developed
from Equation 6C. In order to examine how the model behaves within this data, the
following model is estimated.
itititti EBVMV εααα +++= 210 (6D)
where:
MV = market value of firms’ common equity measured three months following the financial year
BV = book value of equity at year end E = earnings for year available to firm’s common shareholders I = firm t = year However, since the model violates the normality and equal variance assumptions, log
transformation is applied on the market value. The new model is specified below.
Pit = α0 + α1BVit+ α2Eit +εit (6.2)
Variable definitions: P = natural log market value of firms’ common equity measured three
months following the financial year BV = book value of equity at year end E = earnings for year available to firm’s common shareholders i = firm t = year
Chapter 6: Research Design, Data Collection and Descriptive Statistics
112
The log model satisfies the normality assumption. However, this model suffers from
heteroscedasticity therefore, White’s Heteroscedasticity Corrected Statistics (White,
1980) were employed.
6.2.2.1 Dependent Variable
Market value is represented by the number of outstanding shares multiplied by the
firm’s share price at the last trading day of the three months following the end of the
firm year. This date is chosen to ensure that the information is in the public domain
(Barth et al., 1996; Nelson, 1996). The share prices were obtained from the share
prices database of the University of Queensland Business School and The Australian
newspaper.
6.2.2.2 Independent Variables
To examine the value relevance of derivative disclosures, a number of valuation
models are developed based on Ohlson (1995). Two basic independent variables of
Ohlson (1995) are book value of equity and earnings. As the models were developed
additional variables added. These variables are classified into two groups. The first
group examines the association between disclosure quality of derivative information
and market value. The second group is included to examine the association between
market value and specific items required to be disclosed; for example, a hedge of an
anticipated transaction and net fair value. Table 6.4 summarises the independent
variables employed in the market value models. These variables are discussed below.
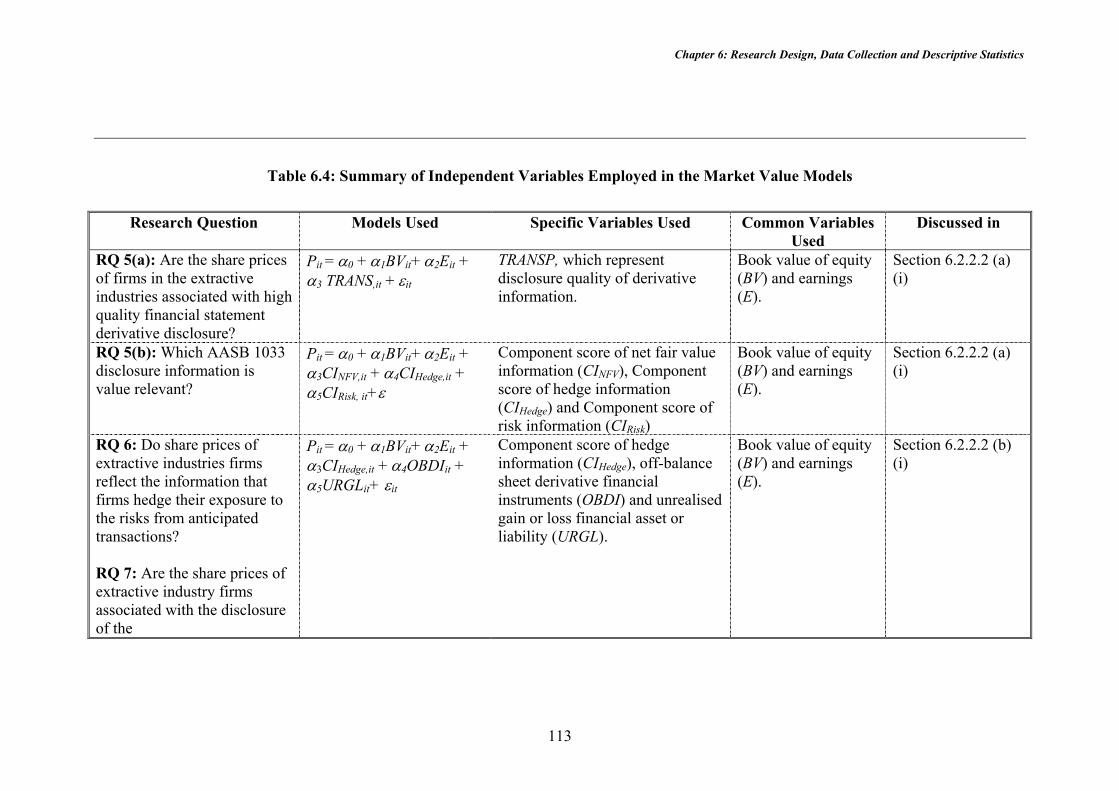
Chapter 6: Research Design, Data Collection and Descriptive Statistics
113
Table 6.4: Summary of Independent Variables Employed in the Market Value Models
Research Question Models Used Specific Variables Used Common Variables Used
Discussed in
RQ 5(a): Are the share prices of firms in the extractive industries associated with high quality financial statement derivative disclosure?
Pit = α0 + α1BVit+ α2Eit + α3 TRANS,it + εit
TRANSP, which represent disclosure quality of derivative information.
Book value of equity (BV) and earnings (E).
Section 6.2.2.2 (a) (i)
RQ 5(b): Which AASB 1033 disclosure information is value relevant?
Pit = α0 + α1BVit+ α2Eit + α3CINFV,it + α4CIHedge,it + α5CIRisk, it+ε
Component score of net fair value information (CINFV), Component score of hedge information (CIHedge) and Component score of risk information (CIRisk)
Book value of equity (BV) and earnings (E).
Section 6.2.2.2 (a) (i)
RQ 6: Do share prices of extractive industries firms reflect the information that firms hedge their exposure to the risks from anticipated transactions? RQ 7: Are the share prices of extractive industry firms associated with the disclosure of the
Pit = α0 + α1BVit+ α2Eit + α3CIHedge,it + α4OBDIit + α5URGLit+ εit
Component score of hedge information (CIHedge), off-balance sheet derivative financial instruments (OBDI) and unrealised gain or loss financial asset or liability (URGL).
Book value of equity (BV) and earnings (E).
Section 6.2.2.2 (b) (i)
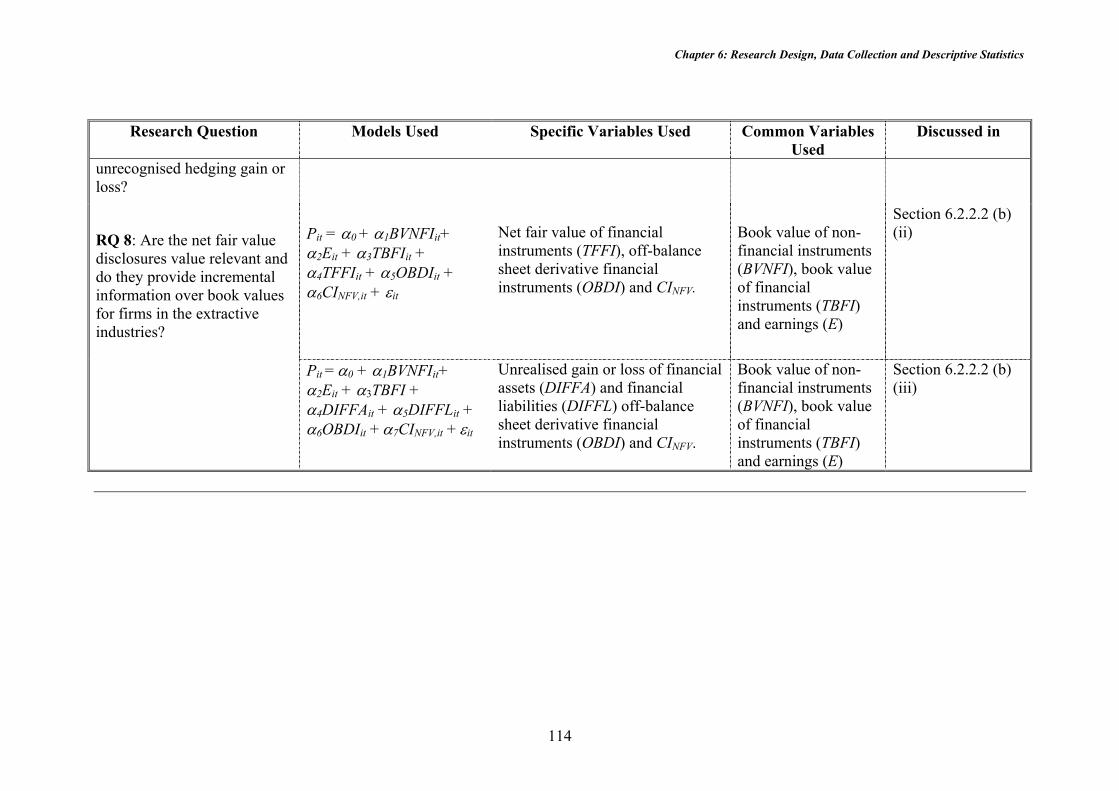
Chapter 6: Research Design, Data Collection and Descriptive Statistics
114
Research Question Models Used Specific Variables Used Common Variables Used
Discussed in
unrecognised hedging gain or loss?
RQ 8: Are the net fair value disclosures value relevant and do they provide incremental information over book values for firms in the extractive industries?
Pit = α0 + α1BVNFIit+ α2Eit + α3TBFIit + α4TFFIit + α5OBDIit + α6CINFV,it + εit
Net fair value of financial instruments (TFFI), off-balance sheet derivative financial instruments (OBDI) and CINFV.
Book value of non-financial instruments (BVNFI), book value of financial instruments (TBFI) and earnings (E)
Section 6.2.2.2 (b) (ii)
Pit = α0 + α1BVNFIit+ α2Eit + α3TBFI + α4DIFFAit + α5DIFFLit + α6OBDIit + α7CINFV,it + εit
Unrealised gain or loss of financial assets (DIFFA) and financial liabilities (DIFFL) off-balance sheet derivative financial instruments (OBDI) and CINFV.
Book value of non-financial instruments (BVNFI), book value of financial instruments (TBFI) and earnings (E)
Section 6.2.2.2 (b) (iii)
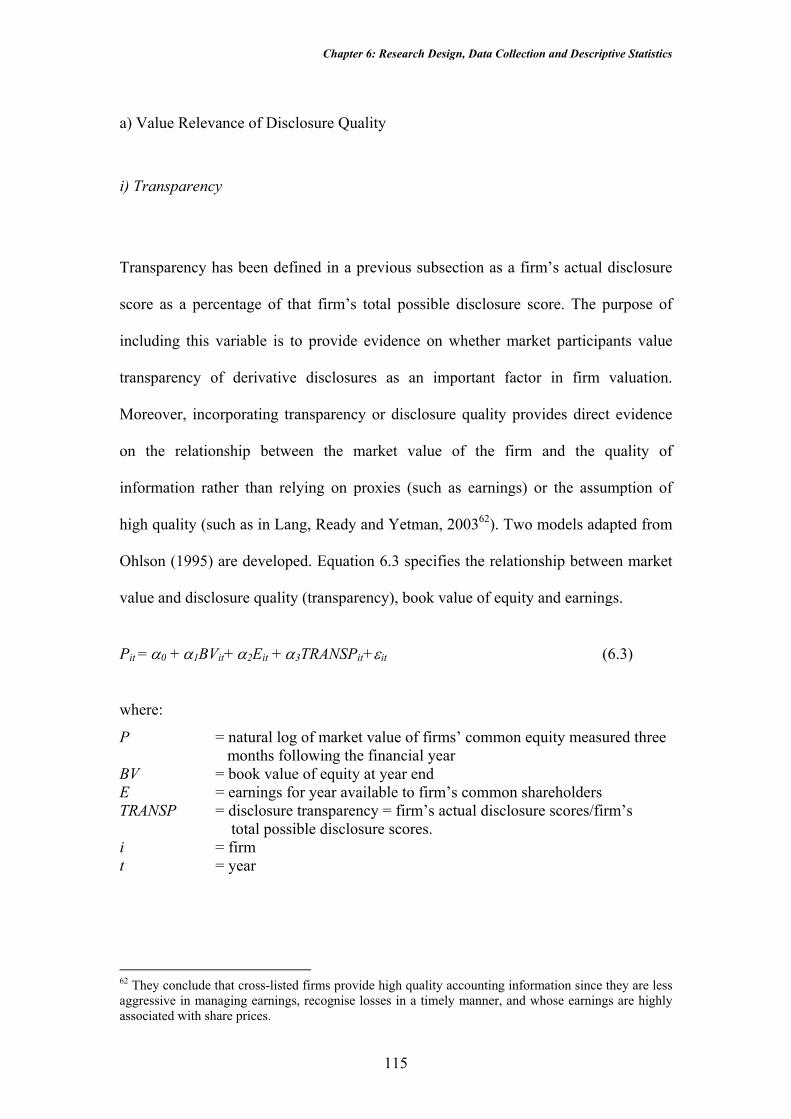
Chapter 6: Research Design, Data Collection and Descriptive Statistics
115
a) Value Relevance of Disclosure Quality
i) Transparency
Transparency has been defined in a previous subsection as a firm’s actual disclosure
score as a percentage of that firm’s total possible disclosure score. The purpose of
including this variable is to provide evidence on whether market participants value
transparency of derivative disclosures as an important factor in firm valuation.
Moreover, incorporating transparency or disclosure quality provides direct evidence
on the relationship between the market value of the firm and the quality of
information rather than relying on proxies (such as earnings) or the assumption of
high quality (such as in Lang, Ready and Yetman, 200362). Two models adapted from
Ohlson (1995) are developed. Equation 6.3 specifies the relationship between market
value and disclosure quality (transparency), book value of equity and earnings.
Pit = α0 + α1BVit+ α2Eit + α3TRANSPit+εit (6.3)
where:
P = natural log of market value of firms’ common equity measured three months following the financial year
BV = book value of equity at year end E = earnings for year available to firm’s common shareholders TRANSP = disclosure transparency = firm’s actual disclosure scores/firm’s
total possible disclosure scores. i = firm t = year
62 They conclude that cross-listed firms provide high quality accounting information since they are less aggressive in managing earnings, recognise losses in a timely manner, and whose earnings are highly associated with share prices.
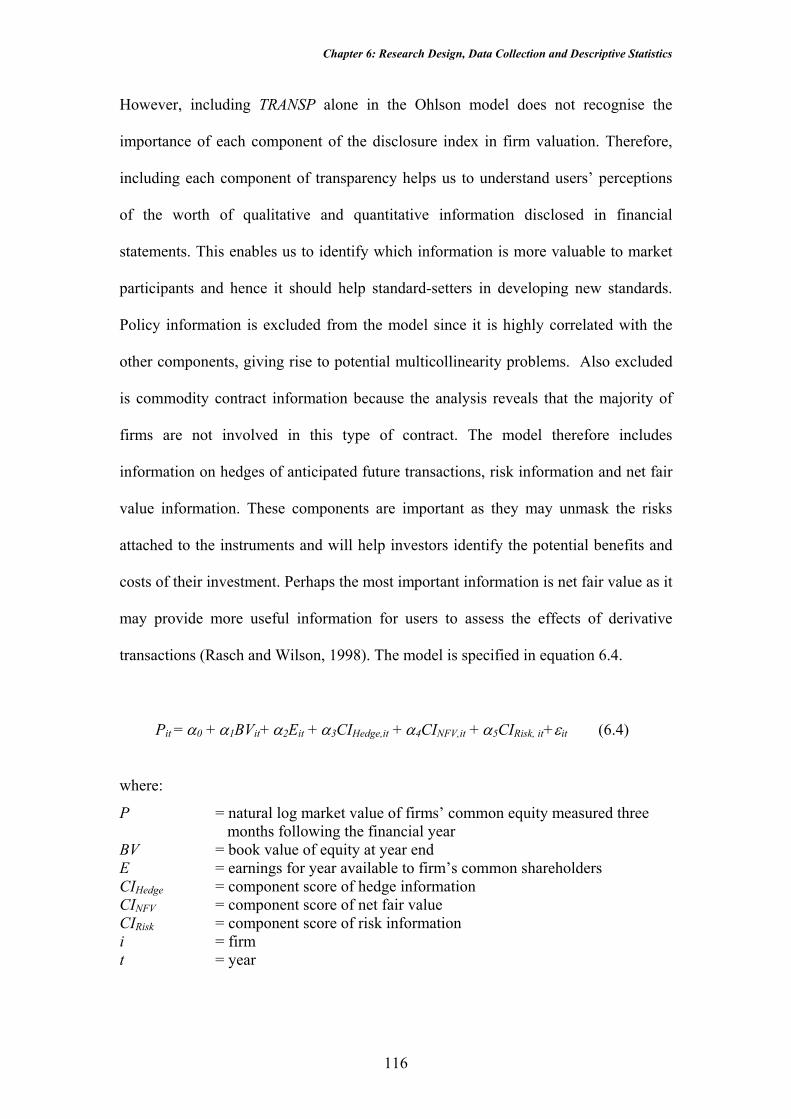
Chapter 6: Research Design, Data Collection and Descriptive Statistics
116
However, including TRANSP alone in the Ohlson model does not recognise the
importance of each component of the disclosure index in firm valuation. Therefore,
including each component of transparency helps us to understand users’ perceptions
of the worth of qualitative and quantitative information disclosed in financial
statements. This enables us to identify which information is more valuable to market
participants and hence it should help standard-setters in developing new standards.
Policy information is excluded from the model since it is highly correlated with the
other components, giving rise to potential multicollinearity problems. Also excluded
is commodity contract information because the analysis reveals that the majority of
firms are not involved in this type of contract. The model therefore includes
information on hedges of anticipated future transactions, risk information and net fair
value information. These components are important as they may unmask the risks
attached to the instruments and will help investors identify the potential benefits and
costs of their investment. Perhaps the most important information is net fair value as it
may provide more useful information for users to assess the effects of derivative
transactions (Rasch and Wilson, 1998). The model is specified in equation 6.4.
Pit = α0 + α1BVit+ α2Eit + α3CIHedge,it + α4CINFV,it + α5CIRisk, it+εit (6.4)
where:
P = natural log market value of firms’ common equity measured three months following the financial year
BV = book value of equity at year end E = earnings for year available to firm’s common shareholders CIHedge = component score of hedge information CINFV = component score of net fair value CIRisk = component score of risk information i = firm t = year
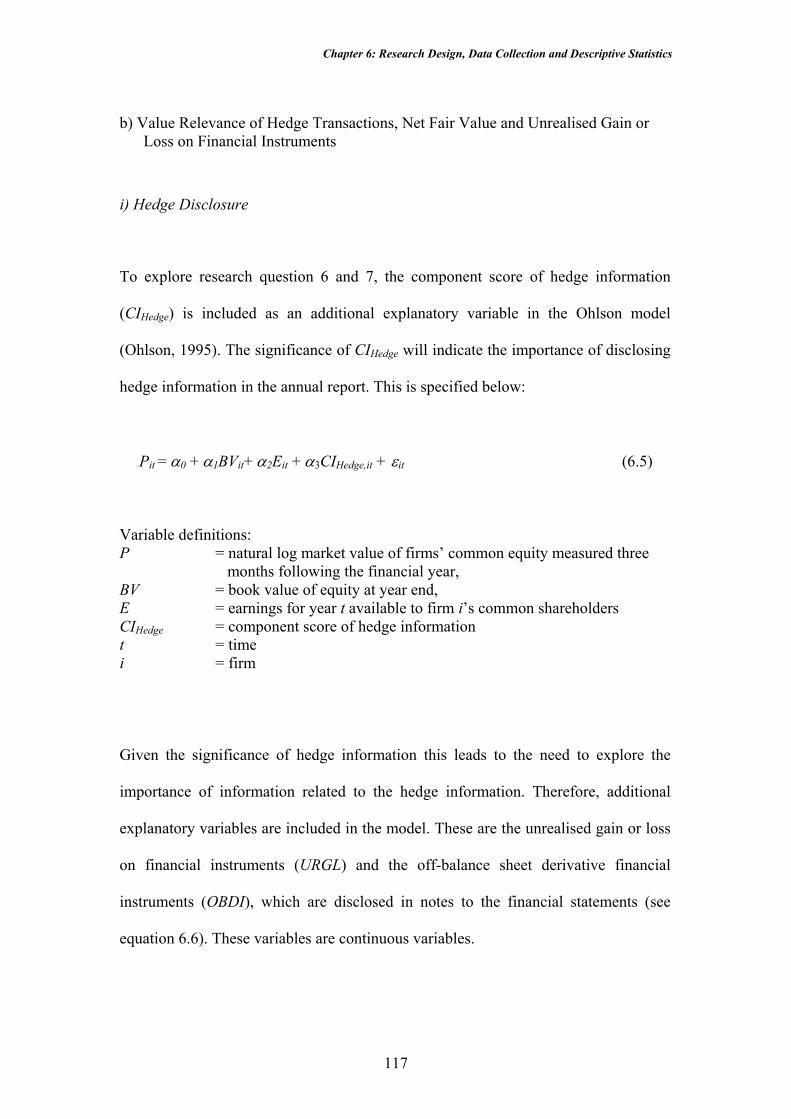
Chapter 6: Research Design, Data Collection and Descriptive Statistics
117
b) Value Relevance of Hedge Transactions, Net Fair Value and Unrealised Gain or
Loss on Financial Instruments
i) Hedge Disclosure
To explore research question 6 and 7, the component score of hedge information
(CIHedge) is included as an additional explanatory variable in the Ohlson model
(Ohlson, 1995). The significance of CIHedge will indicate the importance of disclosing
hedge information in the annual report. This is specified below:
Pit = α0 + α1BVit+ α2Eit + α3CIHedge,it + εit (6.5) Variable definitions: P = natural log market value of firms’ common equity measured three
months following the financial year, BV = book value of equity at year end, E = earnings for year t available to firm i’s common shareholders CIHedge = component score of hedge information t = time i = firm
Given the significance of hedge information this leads to the need to explore the
importance of information related to the hedge information. Therefore, additional
explanatory variables are included in the model. These are the unrealised gain or loss
on financial instruments (URGL) and the off-balance sheet derivative financial
instruments (OBDI), which are disclosed in notes to the financial statements (see
equation 6.6). These variables are continuous variables.

Chapter 6: Research Design, Data Collection and Descriptive Statistics
118
Firms that hedge their exposure describe their rationale for hedging and provide a
description of the derivative instruments used for hedging. This is disclosed in the
note on financial instruments. Firms may hedge to mitigate losses from the
anticipated transactions such as future commodity production, future expenditure in
foreign currency, fluctuations in interest rates and currency prices and future sales
revenue. Basically, the anticipated transactions can be grouped into: commodity
production, interest rate fluctuations and currency fluctuations. The instruments used
to hedge the anticipated transactions are normally based on the types of exposure.
These instruments are interest rate contracts (swaps, futures and forward), foreign
exchange contracts (forward and options) and commodity contracts (forward and
options). The following note on financial instruments was taken from Consolidated
Rutile Limited, 1999 annual report.
Note 27 Financial Instruments
a) Off-balance sheet derivative instruments The parent entity is party to financial instruments with off-balance sheet risk in the normal course of business in order to hedge exposure to fluctuations in foreign exchange rates and interest risk. Hedging of foreign currencies is effected through a combination of forward contracts and options. Exposure to interest rate fluctuations is managed through interest rate swaps and options. ii) Foreign exchange hedging of revenues
The company’s sales revenue is predominantly denominated in United States dollars. In order to protect against adverse exchange rate movements a proportion of future anticipated sales revenue has been sold forward utilising either forward exchange contracts or foreign exchange options.

Chapter 6: Research Design, Data Collection and Descriptive Statistics
119
A considerable number of firms who hedge their exposure to risks did not disclose the
amounts of deferred or unrecognised gain or loss, even though it is a requirement to
disclose this amount according to AASB 1033. This might be due to the fact that the
firms did not hold derivatives at the balance sheet date.
The relationship between market value and hedge information is specified in equation
6.6. Including OBDI in the equation will provide evidence on the significance of
derivative instruments in firm valuation. Including CIHedge might provide evidence of
whether the qualitative information is considered as important as quantitative
information (book value of equity, earnings, off-balance sheet derivative financial
instruments and unrealised gain or loss of financial assets and liability). This is of
particular interest because paragraph 5.8 AASB 1033 requires firms to disclose both
qualitative and quantitative information. The component score (CIHedge) is included to
represent this requirement.
Pit = α0 + α1BVit+ α2Eit + α3CIHedge,it + α4OBDIit + α5URGL it+ εit (6.6) Variable definitions: P = natural log market value of firms’ common equity measured three
months following the financial year, BV = book value of equity at year end, E = earnings for year t available to firm i’s common shareholders CIHedge = component score of hedge information URGL = unrealised gain or loss of financial assets and financial OBDI = off-balance sheet derivative financial instruments t = time i = firm

Chapter 6: Research Design, Data Collection and Descriptive Statistics
120
ii) Net Fair Value
Paragraph 7 AASB 1033 defines net fair value as the fair value after deducting
(adding) costs expected to be incurred where the asset (liability) is to be exchanged
(settled). Firms disclose the net fair value in the note on financial instruments.
However, some firms disclose the net fair value in another note. For example,
Auridiam Limited did not disclose the net fair value for investments in the note on
financial instruments. However, the firm discloses the net fair value of investment in
the note on investments.
To explore research question 8, the net fair value information is included in the
Ohlson model. The significance of the net fair value information indicates the
importance of disclosing net fair value information in the corporate annual report.
This model is specified in equation 6.7.
Pit = α0 + α1BVit+ α2Eit + α3CINFV,it + εit (6.7) Variable definitions: P = natural log market value of firms’ common equity measured three
months following the financial year BV = book value of equity at year end, E = earnings for year t available to firm i’s common shareholders CINFV = component score of net fair value t = time i = firm Analogously to hedge information, the significance of CINFV indicates the possibility
of exploring the importance of detailed information required by paragraph 5.6 AASB
1033. To investigate the value relevance and explanatory power of net fair value,
equation 6.7 is expanded. The book value of equity (BV) is separated into the book
value of financial instruments (TBFI) and the book value of non-financial instruments
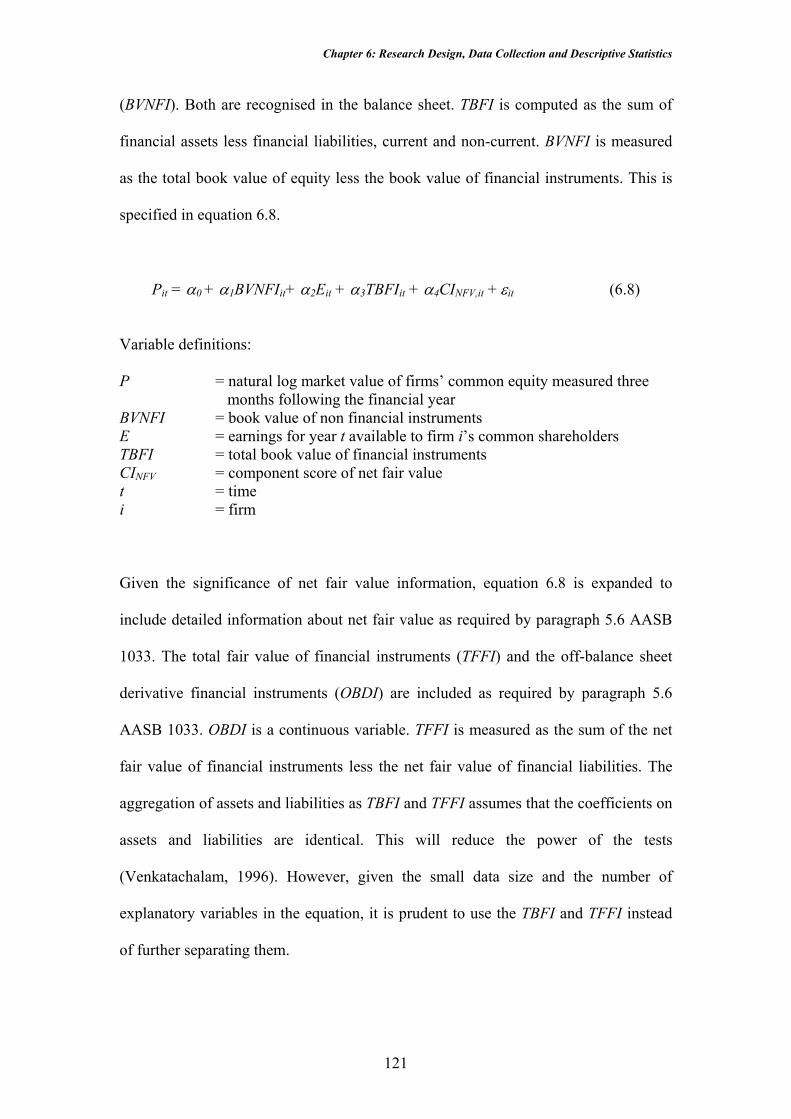
Chapter 6: Research Design, Data Collection and Descriptive Statistics
121
(BVNFI). Both are recognised in the balance sheet. TBFI is computed as the sum of
financial assets less financial liabilities, current and non-current. BVNFI is measured
as the total book value of equity less the book value of financial instruments. This is
specified in equation 6.8.
Pit = α0 + α1BVNFIit+ α2Eit + α3TBFIit + α4CINFV,it + εit (6.8) Variable definitions: P = natural log market value of firms’ common equity measured three
months following the financial year BVNFI = book value of non financial instruments E = earnings for year t available to firm i’s common shareholders TBFI = total book value of financial instruments CINFV = component score of net fair value t = time i = firm
Given the significance of net fair value information, equation 6.8 is expanded to
include detailed information about net fair value as required by paragraph 5.6 AASB
1033. The total fair value of financial instruments (TFFI) and the off-balance sheet
derivative financial instruments (OBDI) are included as required by paragraph 5.6
AASB 1033. OBDI is a continuous variable. TFFI is measured as the sum of the net
fair value of financial instruments less the net fair value of financial liabilities. The
aggregation of assets and liabilities as TBFI and TFFI assumes that the coefficients on
assets and liabilities are identical. This will reduce the power of the tests
(Venkatachalam, 1996). However, given the small data size and the number of
explanatory variables in the equation, it is prudent to use the TBFI and TFFI instead
of further separating them.

Chapter 6: Research Design, Data Collection and Descriptive Statistics
122
Equation 6.9 is used to estimate the importance and the explanatory power of net fair
value information. A significant value for coefficients α4, α5, α7 and α8 will indicate
the value relevance of net fair value information in this model. A positive coefficient
being significantly different from zero would provide evidence of the incremental
explanatory power of AASB 1033 net fair value conditional on other included
explanatory variables63 (Barth, 1994; Venkatachalam, 1996; Simko, 1999).
Pit = α0 + α1BVNFIit+ α2Eit + α3TBFIit + α4TFFIit + α5OBDIit + α6CINFV,it + εit (6.9) Variable definitions: P = natural log market value of firms’ common equity measured three
months following the financial year BVNFI = book value of non financial instruments E = earnings for year t available to firm i’s common shareholders TBFI = total book value of financial instruments TFFI = net fair value of financial instruments OBDI = off-balance sheet derivative financial instruments CINFV = component score of net fair value t = time i = firm Multicollinearity could be a problem when estimating equation 6.9 since TBFI and
TFFI64 are correlated (Barth, 1994). Therefore, TBFI is dropped from the equation so
that the explanatory power of TFFI without such effects can be estimated65. The
following model is used to estimate the explanatory power of net fair value and off-
balance sheet derivative financial instruments incremental to the book value of non-
financial instruments and earnings:
63 An alternative to this approach is discussed in subsection 6.2.3. 64 TFFI equals to TBFI plus the unrealised gain or loss (URGL). According to Barth (1994) equation 6.9 is econometrically equivalent to Pit = α0 + α1BVNFIit+ α2Eit + γ3TBFIit + α4URGLit + α5OBDIit + α6CINFV,it + α7FVTFFIit + α8FVOBDI it + εit , where γ3 = α3 + α4. In the following subsection, the estimation based on this equation is employed. This procedure may overcome the multicollinearity between TFFI and TBFI. 65 Table 8.4 Chapter 8 reports that the pairwise correlation between TBFI and TFFI is 0.9985. This indicates that the variables are highly correlated.

Chapter 6: Research Design, Data Collection and Descriptive Statistics
123
Pit = α0 + α1BVNFIit+ α2Eit + α3TFFIit + α4OBDIit + α5CINFV,it + εit (6.10) Variable definitions: P = natural log market value of firms’ common equity measured three
months following the financial year BVNFI = book value of non financial instruments E = earnings for year t available to firm i’s common shareholders TFFI = net fair value of financial instruments OBDI = off-balance sheet derivative financial instruments CINFV = component score of net fair value t = time i = firm iii) Unrealised Gain or Loss on Financial Instruments
As discussed in the previous section, TBFI and TFFI might be correlated since TFFI
is equal to TBFI plus the unrealised gain or loss (URGL). Therefore, an alternative
model is developed in this section which focused on the URGL on financial
instruments, which is a continuous variable. To obtained this information, the note on
financial instruments is examined. The following note, which taken from the 2001
annual report of Centennial Coal Company Limited is a good example.
47 Financial Instruments
g) Hedges of Anticipated Future Transaction The consolidated entity has entered into contracts to supply coal to customers denominated in US Dollars. The consolidated entity has entered into forward foreign exchange contracts and foreign exchange option contracts to hedge the exchange rate risk arising from these anticipated future transactions. As at the reporting date the aggregate amount of the unrealised losses under forward foreign exchange contracts and foreign exchange option contracts relating to anticipated future transactions is $6,537,000. Such unrealised losses will be realised during the 2002 financial year when the anticipated future transactions take place.
Chapter 6: Research Design, Data Collection and Descriptive Statistics
124
Fair value accounting is not mandatory for Australian firms. However, the accounting
standard setting body recognises the relevance of fair values to financial statement
users. The first steps have been taken by the AASB to require firms to disclose the net
fair value of financial instruments. Paragraph 5.6 AASB 1033 requires firms to disclose
the aggregate amount of the net fair value, the method(s) adopted in determining the net
fair value and the assumptions made in determining the net fair value. As long as the
financial assets or financial liabilities, including the underlying assets or liabilities, have
not been disposed of or settled, the difference between net fair value and the carrying
value need not be recognised in the balance sheet. Surprisingly there were some firms
that recognised the unrealised gain or loss as an asset or liability. Central Norseman
Gold Company and Austral Coal Limited defer hedging gains and losses as assets and
liabilities. This action may relate to the characteristics of the firms, such as the size of
the firms.
To investigate the value relevance and the explanatory power of unrealised gain or
loss, the unrealised gain or loss of financial instruments (URGL), total book value of
financial instruments (TBFI), book value of non-financial instruments (BVNFI) and
earnings (E) are included in the model. Following Simko (1999), the URGL is
separated into broad class of financial instruments: URGL of financial assets
(DIFFA), URGL of financial liabilities (DIFFL) and off-balance sheet derivative
financial instruments (OBDI). This is specified in equation 6.11. A significant value
of α4, α5 and α6 indicate the value relevance of the unrealised gain or loss and a
coefficient significantly different from zero would provide evidence of incremental
Chapter 6: Research Design, Data Collection and Descriptive Statistics
125
explanatory power of URGL conditional on other included explanatory variables
(Barth, 1994; Venkatachalam, 1996; Simko, 1999).
Pit = α0 + α1BVNFIit+ α2Eit + α3TBFI + α4DIFFAit + α5DIFFLit + α6OBDIit
+ α7CINFV,it + εit (6.11) Analogous to equation 6.10, TBFI is excluded from the model to examine the
explanatory power of the unrealised gain or loss on financial instruments beyond the
book value of non-financial instruments and earnings66. Any positive significance of
α3, α4 and α5 will indicate the explanatory power of URGL beyond other variables.
This is specified in equation 6.12.
Pit = α0 + α1BVNFIit+ α2Eit + α3DIFFAit + α4DIFFLit + α5OBDIit
+ α6CINFV,it + εit (6.12) Variable definitions: P = natural log market value of firms’ common equity measured three
months following the financial year BVNFI = book value of non financial instruments E = earnings for year t available to firm i’s common shareholders TBFI = total book value of financial instruments OBDI = off-balance sheet derivative financial instruments DIFFA = difference between net fair value of financial assets and book
value of financial assets. DIFFL = difference between net fair value of financial liabilities and book
value of financial liabilities. CINFV = component score of net fair value t = time i = firm
66 Table 8.5 Chapter 8 reports that TBFI is highly correlated with BVNFI.

Chapter 6: Research Design, Data Collection and Descriptive Statistics
126
6.2.3 Incremental Explanatory Power of the Net Fair Value and the Unrealised Gain or Loss on Financial Instruments Beyond the Book Value of Financial and Non-Financial Instruments and Earnings Valued at Historical Cost
An alternative approach to the above discussion on the incremental explanatory power
of variables, the adjusted R squared (R2) of equations 6.9 and 6.11 are compared with
the adjusted R2 of equations without the net fair value and the unrealised gain or loss
on financial instruments and the component score net fair value information. This
approach has been used in Collins, Maydew and Weiss (1997), Graham and King
(2000) and Li-Chin, Chao-Shin and Pyung-Sik (2001). The procedure permits
assessing whether the net fair value and the unrealised gain or loss of financial assets,
financial liabilities, or off-balance sheet derivative financial instruments are value
relevant and provide explanatory power in explaining firm share price beyond the
book value of financial and non-financial instruments and earnings valued at historical
cost.
6.2.3.1 Incremental Explanatory Power of Net Fair Value To examine the explanatory power of the net fair value, beyond the book value and
earnings, the adjusted R2 of the equation which includes all variables as well as the
net fair value information is compared with the equation 6.14 which excludes the net
fair value; i.e. the remaining variables are book value variables. The equation that
examines the value relevance of the net fair value information is specified in equation
6.9.
Pit = α0 + α1BVNFIit+ α2Eit + α3TBFIit + α4TFFIit + α5OBDIit + α6CINFV,it + εit (6.9)

Chapter 6: Research Design, Data Collection and Descriptive Statistics
127
Examining the relative and the incremental explanatory power of net fair value
beyond the book value of financial and non-financial instruments and earnings valued
at historical cost requires two additional equations. Equation 6.13 expresses price as a
function of net fair value alone, and equation 6.14 expresses price as a function of
book value and earnings.
Pit = α0 + α1TFFIit + α2OBDIit + α3CINFV,it + ε it (6.13)
Pit = α0 + α1BVNFIit+ α2Eit + α3TBFIit + εit (6.14) Variable definitions: P = natural log market value of firms’ common equity measured three
months following the financial year BVNFI = book value of non financial instruments E = earnings for year t available to firm i’s common shareholders TBFI = total book value of financial instruments OBDI = off-balance sheet derivative financial instruments TFFI = net fair value of financial instruments CINFV = component score of net fair value t = time i = firm Following Graham and King (2000), the incremental explanatory power is defined as
the difference between the adjusted R2 of equation 6.9 over equations 6.13 and 6.14.
The explanatory power is defined as below:
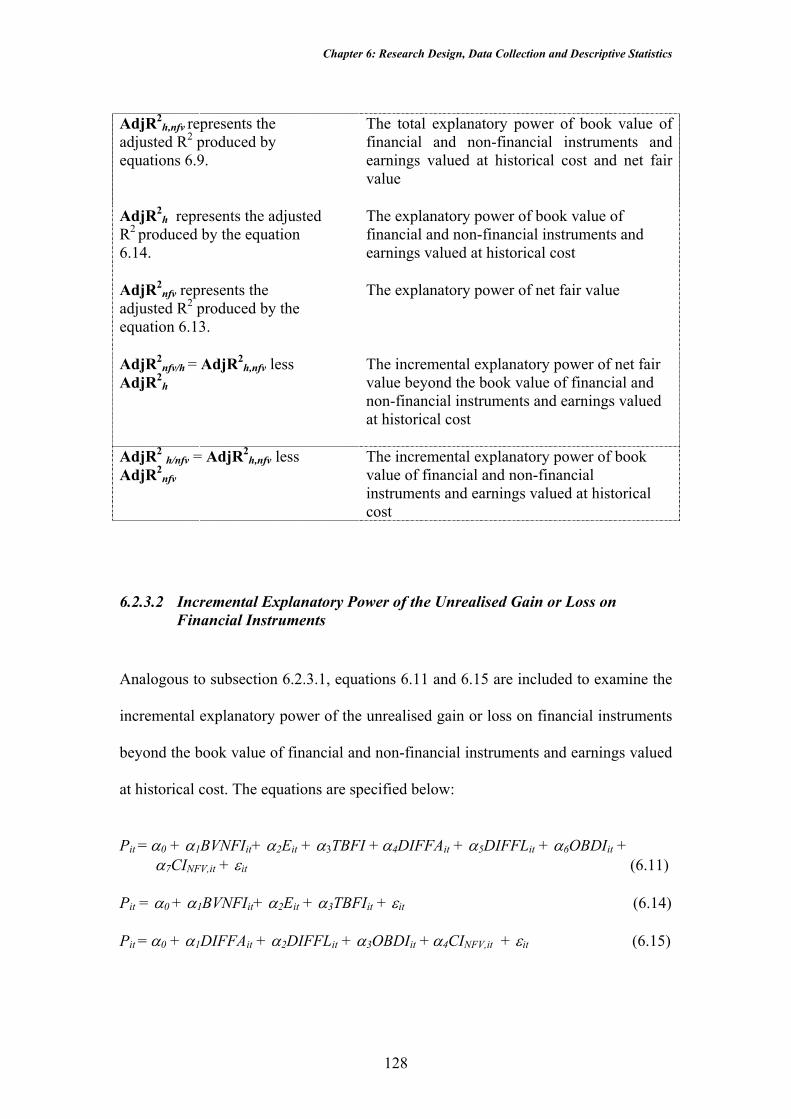
Chapter 6: Research Design, Data Collection and Descriptive Statistics
128
AdjR2
h,nfv represents the adjusted R2 produced by equations 6.9.
The total explanatory power of book value of financial and non-financial instruments and earnings valued at historical cost and net fair value
AdjR2h represents the adjusted
R2 produced by the equation 6.14.
The explanatory power of book value of financial and non-financial instruments and earnings valued at historical cost
AdjR2nfv represents the
adjusted R2 produced by the equation 6.13.
The explanatory power of net fair value
AdjR2nfv/h = AdjR2
h,nfv less AdjR2
h
The incremental explanatory power of net fair value beyond the book value of financial and non-financial instruments and earnings valued at historical cost
AdjR2 h/nfv = AdjR2h,nfv less
AdjR2nfv
The incremental explanatory power of book value of financial and non-financial instruments and earnings valued at historical cost
6.2.3.2 Incremental Explanatory Power of the Unrealised Gain or Loss on Financial Instruments
Analogous to subsection 6.2.3.1, equations 6.11 and 6.15 are included to examine the
incremental explanatory power of the unrealised gain or loss on financial instruments
beyond the book value of financial and non-financial instruments and earnings valued
at historical cost. The equations are specified below:
Pit = α0 + α1BVNFIit+ α2Eit + α3TBFI + α4DIFFAit + α5DIFFLit + α6OBDIit +
α7CINFV,it + εit (6.11)
Pit = α0 + α1BVNFIit+ α2Eit + α3TBFIit + εit (6.14) Pit = α0 + α1DIFFAit + α2DIFFLit + α3OBDIit + α4CINFV,it + εit (6.15)
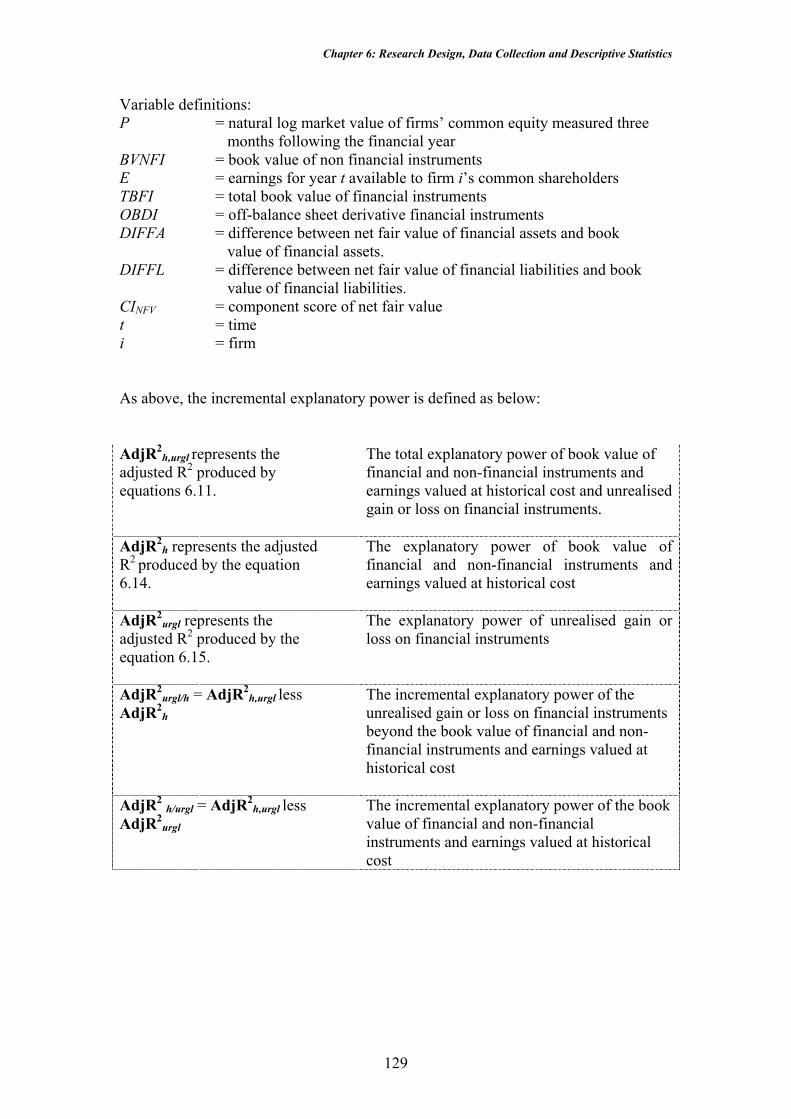
Chapter 6: Research Design, Data Collection and Descriptive Statistics
129
Variable definitions: P = natural log market value of firms’ common equity measured three
months following the financial year BVNFI = book value of non financial instruments E = earnings for year t available to firm i’s common shareholders TBFI = total book value of financial instruments OBDI = off-balance sheet derivative financial instruments DIFFA = difference between net fair value of financial assets and book
value of financial assets. DIFFL = difference between net fair value of financial liabilities and book
value of financial liabilities. CINFV = component score of net fair value t = time i = firm As above, the incremental explanatory power is defined as below: AdjR2
h,urgl represents the adjusted R2 produced by equations 6.11.
The total explanatory power of book value of financial and non-financial instruments and earnings valued at historical cost and unrealised gain or loss on financial instruments.
AdjR2h represents the adjusted
R2 produced by the equation 6.14.
The explanatory power of book value of financial and non-financial instruments and earnings valued at historical cost
AdjR2urgl represents the
adjusted R2 produced by the equation 6.15.
The explanatory power of unrealised gain or loss on financial instruments
AdjR2urgl/h = AdjR2
h,urgl less AdjR2
h The incremental explanatory power of the unrealised gain or loss on financial instruments beyond the book value of financial and non-financial instruments and earnings valued at historical cost
AdjR2 h/urgl = AdjR2h,urgl less
AdjR2urgl
The incremental explanatory power of the book value of financial and non-financial instruments and earnings valued at historical cost

Chapter 6: Research Design, Data Collection and Descriptive Statistics
130
6.3 Estimation Procedures
The above models are estimated using Eviews 4.0, PcGive 1.0 and SPSS 11.5
statistical packages. The models are estimated based on pooled data. This study
employs multiple regression analysis to estimate the association between disclosure
quality of derivative information and firm characteristics (firm characteristic model)
and the value relevance of derivative information (market value models). The multiple
regression technique is performed, which focuses on the significance of the
independent variables in explaining disclosure quality and market value.
The ranked regression procedure is also performed on the firm characteristics model
as an alternative approach to the other techniques. This procedure is also performed in
Lang and Lundholm (1993), Wallace et al. (1994), Owusu-Ansah (1998) and Ali et al.
(2003). The rank transformation is a simple procedure where the continuous variables
are replaced with their rank. The smallest observation is ranked as 1 and continued to
rank n for the largest. In the case of ties the average ranks are assigned.
The analyses on market value models is performed on the undeflated variables since
Barth and Kallapur (1996) indicate that deflation has unpredictable effects of
coefficient bias, heteroscedasticity and estimation efficiency. Heteroscedasticity
occurred in all value relevance estimations and therefore, the White (1980)
heteroscedasticity-consistent standard errors in addition to the heteroscedasticity and
autocorrelation consistent (HAC) standard error67 (in case both heteroscedasticity and
67 Also known as Newey-West standard errors.
Chapter 6: Research Design, Data Collection and Descriptive Statistics
131
autocorrelation occur) are employed. These are consistent with Barth (1994), Barth et
al. (1996), Eccher et al. (1996) and Nelson (1996).
Nevertheless, prior studies also indicate that heteroscedasticity can be reduced by: a)
dividing all variables with the number of outstanding shares and b) including a scale
proxy, such as the number of outstanding shares, as an independent variable (Barth
and Kallapur, 1996). However, none of these were able to overcome or reduce the
heteroscedasticity. Therefore, the results of the estimation were based on the White’s
corrected regression and the Newey-West standard errors.
In addition to the above, two regression analyses are performed to examine the
incremental explanatory power of net fair value and unrealised gain or loss on
financial instruments beyond the book value of financial and non-financial
instruments and earnings valued at historical cost. These procedures are commonly
used in value relevance studies (for example, Collins, Maydew and Weiss, 1997;
Graham and King, 2000; Li-Chin, Chao-Shin and Pyung-Sik, 2001). The focus of this
analysis is on the adjusted R2 of each equation. However, the approach used by Barth
(1994), Eccher et al. (1996), Venkatachalam (1996) and Simko (1999) in interpreting
the incremental explanatory power of variables are also employed. This approach
examines whether the coefficient of the independent variables are significantly
positive and significantly different from zero.
Regression analysis is also performed on yearly data for all models (firm
characteristics model and market value models) so any potential for the effect of time
can be identified. In addition to that, the procedure reduced autocorrelation that
occurred in the above models. Results for year-by-year and average four year are
Chapter 6: Research Design, Data Collection and Descriptive Statistics
132
reported in Appendix B. Diagnostic tests are also performed on each model to ensure
valid conclusions are made based on the multiple regression results. These tests are
normality tests, autocorrelation tests, heteroscedasticity tests and multicollinearity
tests. Results on these tests are presented alongside the results in Chapters 7 and 8.
6.4 Descriptive Statistics
6.4.1 Firm Characteristics Model
Table 6.5 reports the descriptive statistics of dependent and independent variables of
equation 6.1. For the dependent variable, the average transparency is 88.71% for the
pooled data. Examining each year reveals that the average transparency increased
from 86.29% in 1998 to 90.23% in 2001. This indicates that the overall level of
derivative disclosures among firms in the extractive industries has increased for each
year and moving towards greater compliance with the AASB 1033 disclosure
requirements. The level of variation among firms across the period of study is
reducing, as indicated by the standard deviation, reducing from 0.1137 in 1998 to
0.0772 in 2001.
Because of the variability in the level of total assets between firms, the size variable is
transformed into its natural log in order to normalise the distribution.68 Table 6.5
shows that there is little variability in the means for size, profitability, leverage (debt-
to-equity ratio) and research and development over the period of study. The means of
the price-earnings ratio and market-to-book ratio are more variable, with positive
means in two years and negative in two years. The proportion of limited liability firms
68 The largest firm is BHP Billiton Ltd. with total assets amounting $37,082million, and the smallest firm is Kalrez Energy Ltd. with total assets amounting $0.97million.

Chapter 6: Research Design, Data Collection and Descriptive Statistics
133
increases over the period from 58% to 66% while in all years more than 80% of firms
use a Big five or Big six auditor.
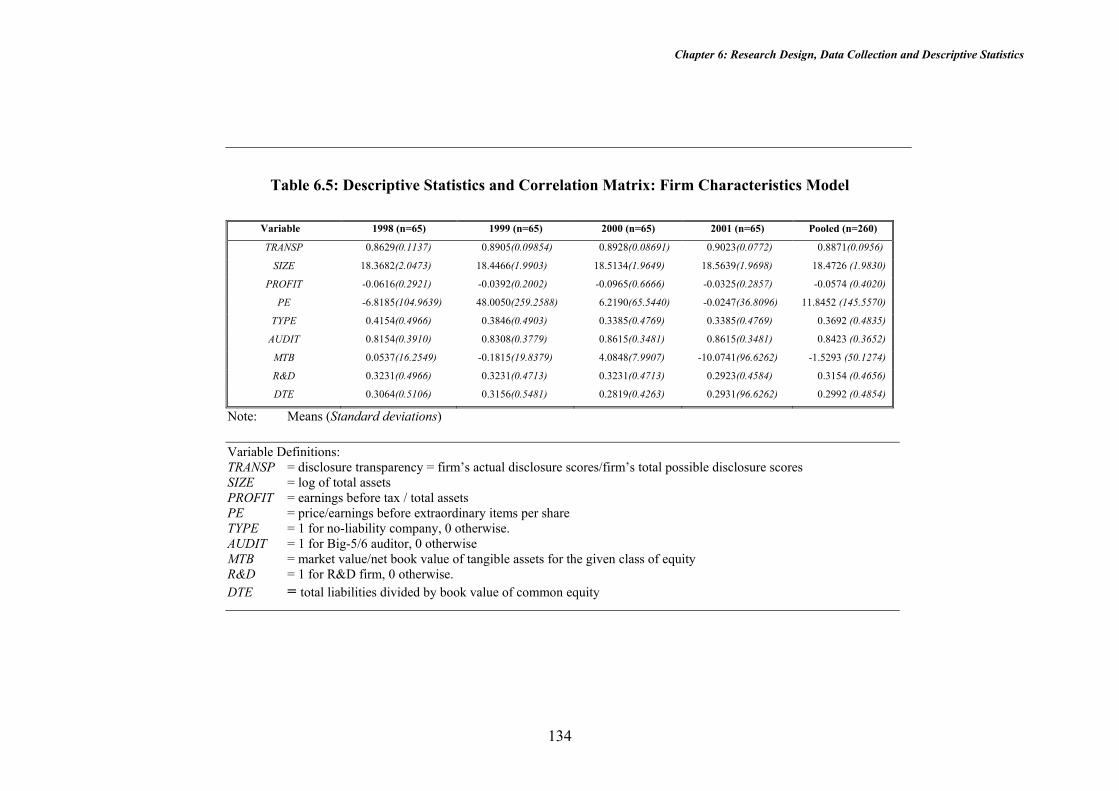
Chapter 6: Research Design, Data Collection and Descriptive Statistics
134
Table 6.5: Descriptive Statistics and Correlation Matrix: Firm Characteristics Model
Variable 1998 (n=65) 1999 (n=65) 2000 (n=65) 2001 (n=65) Pooled (n=260)
TRANSP 0.8629(0.1137) 0.8905(0.09854) 0.8928(0.08691) 0.9023(0.0772) 0.8871(0.0956)
SIZE 18.3682(2.0473) 18.4466(1.9903) 18.5134(1.9649) 18.5639(1.9698) 18.4726 (1.9830)
PROFIT -0.0616(0.2921) -0.0392(0.2002) -0.0965(0.6666) -0.0325(0.2857) -0.0574 (0.4020)
PE -6.8185(104.9639) 48.0050(259.2588) 6.2190(65.5440) -0.0247(36.8096) 11.8452 (145.5570)
TYPE 0.4154(0.4966) 0.3846(0.4903) 0.3385(0.4769) 0.3385(0.4769) 0.3692 (0.4835)
AUDIT 0.8154(0.3910) 0.8308(0.3779) 0.8615(0.3481) 0.8615(0.3481) 0.8423 (0.3652)
MTB 0.0537(16.2549) -0.1815(19.8379) 4.0848(7.9907) -10.0741(96.6262) -1.5293 (50.1274)
R&D 0.3231(0.4966) 0.3231(0.4713) 0.3231(0.4713) 0.2923(0.4584) 0.3154 (0.4656)
DTE 0.3064(0.5106) 0.3156(0.5481) 0.2819(0.4263) 0.2931(96.6262) 0.2992 (0.4854)
Note: Means (Standard deviations)
Variable Definitions: TRANSP = disclosure transparency = firm’s actual disclosure scores/firm’s total possible disclosure scores SIZE = log of total assets PROFIT = earnings before tax / total assets PE = price/earnings before extraordinary items per share TYPE = 1 for no-liability company, 0 otherwise. AUDIT = 1 for Big-5/6 auditor, 0 otherwise MTB = market value/net book value of tangible assets for the given class of equity R&D = 1 for R&D firm, 0 otherwise. DTE = total liabilities divided by book value of common equity
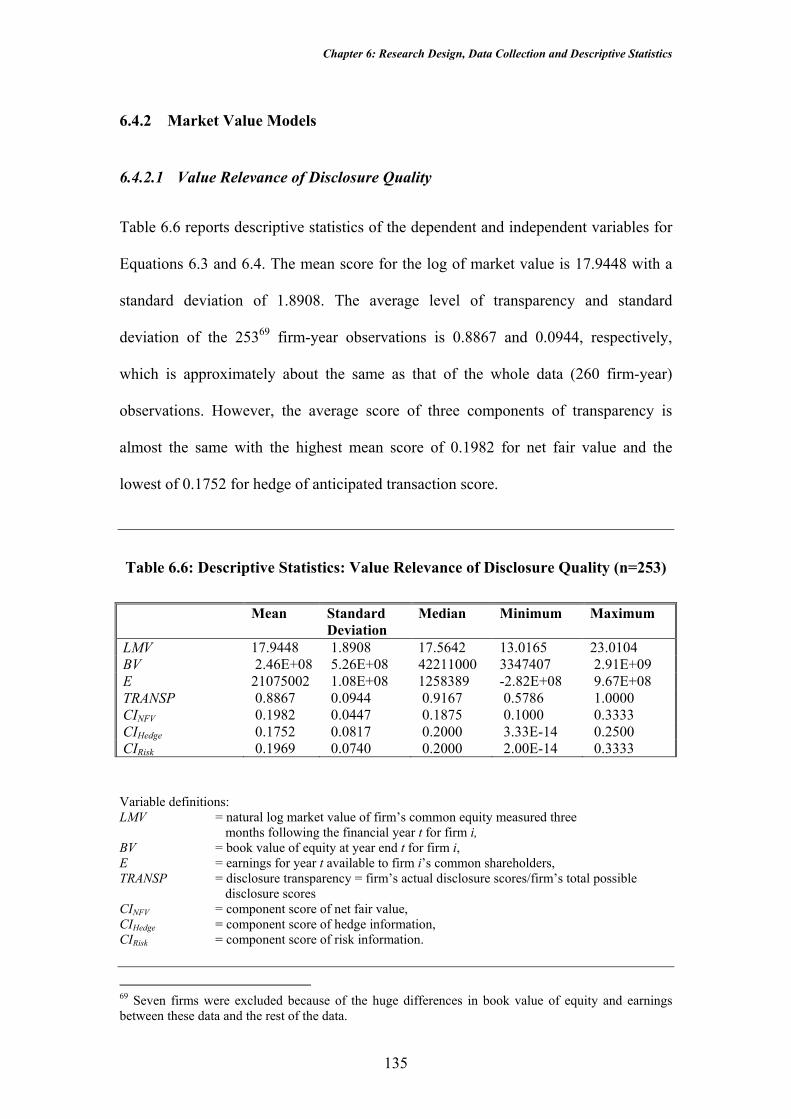
Chapter 6: Research Design, Data Collection and Descriptive Statistics
135
6.4.2 Market Value Models
6.4.2.1 Value Relevance of Disclosure Quality
Table 6.6 reports descriptive statistics of the dependent and independent variables for
Equations 6.3 and 6.4. The mean score for the log of market value is 17.9448 with a
standard deviation of 1.8908. The average level of transparency and standard
deviation of the 25369 firm-year observations is 0.8867 and 0.0944, respectively,
which is approximately about the same as that of the whole data (260 firm-year)
observations. However, the average score of three components of transparency is
almost the same with the highest mean score of 0.1982 for net fair value and the
lowest of 0.1752 for hedge of anticipated transaction score.
Table 6.6: Descriptive Statistics: Value Relevance of Disclosure Quality (n=253)
Mean Standard Deviation
Median Minimum Maximum
LMV 17.9448 1.8908 17.5642 13.0165 23.0104 BV 2.46E+08 5.26E+08 42211000 3347407 2.91E+09 E 21075002 1.08E+08 1258389 -2.82E+08 9.67E+08 TRANSP 0.8867 0.0944 0.9167 0.5786 1.0000 CINFV 0.1982 0.0447 0.1875 0.1000 0.3333 CIHedge 0.1752 0.0817 0.2000 3.33E-14 0.2500 CIRisk 0.1969 0.0740 0.2000 2.00E-14 0.3333
Variable definitions: LMV = natural log market value of firm’s common equity measured three
months following the financial year t for firm i, BV = book value of equity at year end t for firm i, E = earnings for year t available to firm i’s common shareholders, TRANSP = disclosure transparency = firm’s actual disclosure scores/firm’s total possible
disclosure scores CINFV = component score of net fair value, CIHedge = component score of hedge information, CIRisk = component score of risk information.
69 Seven firms were excluded because of the huge differences in book value of equity and earnings between these data and the rest of the data.
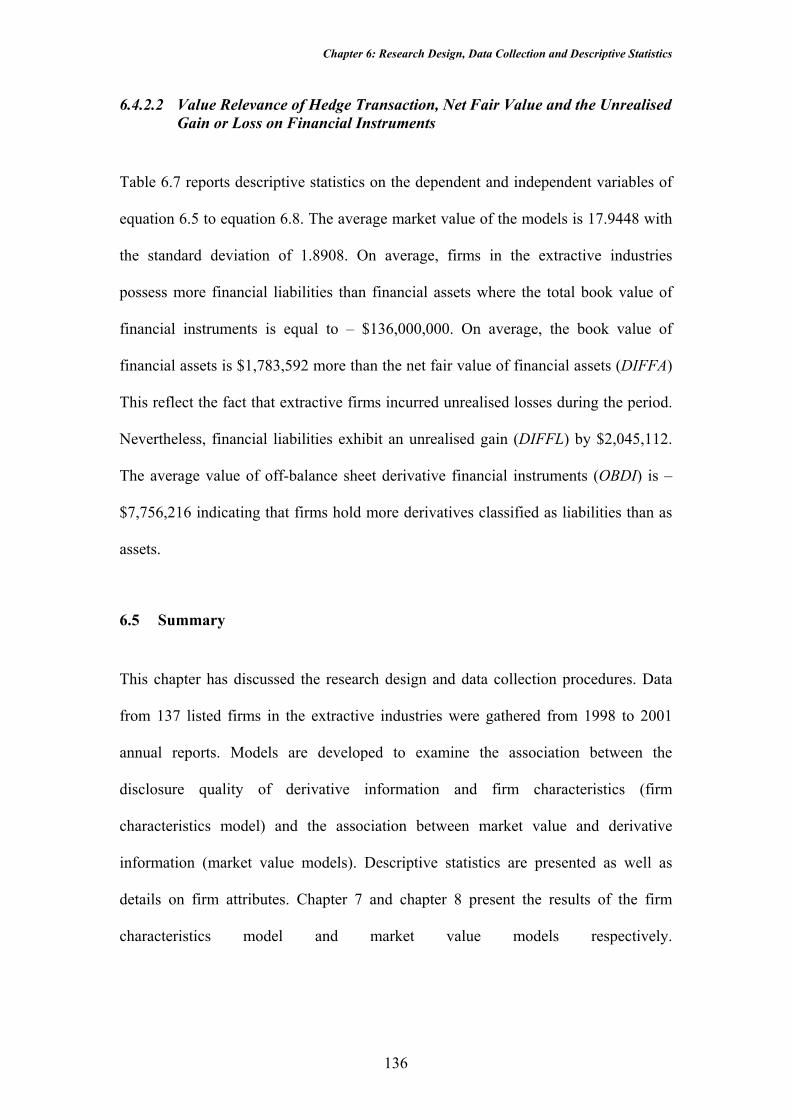
Chapter 6: Research Design, Data Collection and Descriptive Statistics
136
6.4.2.2 Value Relevance of Hedge Transaction, Net Fair Value and the Unrealised Gain or Loss on Financial Instruments
Table 6.7 reports descriptive statistics on the dependent and independent variables of
equation 6.5 to equation 6.8. The average market value of the models is 17.9448 with
the standard deviation of 1.8908. On average, firms in the extractive industries
possess more financial liabilities than financial assets where the total book value of
financial instruments is equal to – $136,000,000. On average, the book value of
financial assets is $1,783,592 more than the net fair value of financial assets (DIFFA)
This reflect the fact that extractive firms incurred unrealised losses during the period.
Nevertheless, financial liabilities exhibit an unrealised gain (DIFFL) by $2,045,112.
The average value of off-balance sheet derivative financial instruments (OBDI) is –
$7,756,216 indicating that firms hold more derivatives classified as liabilities than as
assets.
6.5 Summary This chapter has discussed the research design and data collection procedures. Data
from 137 listed firms in the extractive industries were gathered from 1998 to 2001
annual reports. Models are developed to examine the association between the
disclosure quality of derivative information and firm characteristics (firm
characteristics model) and the association between market value and derivative
information (market value models). Descriptive statistics are presented as well as
details on firm attributes. Chapter 7 and chapter 8 present the results of the firm
characteristics model and market value models respectively.

Chapter 6: Research Design, Data Collection and Descriptive Statistics
137
Table 6.7: Descriptive Statistics: Value Relevance of Hedge Transaction, Net Fair Value and Unrealised Gain or Loss on Financial Instruments. (n=253)
Mean Standard
Deviation Median Minimum Maximum
LMV 17.9448 1.8908 17.5642 13.0165 23.0104 BV 2.46E+08 5.26E+08 42211000 3347407 2.91E+09 BVNFI 3.82E+08 9.09E+08 49358000 -25295000 5.37E+09 E 21075002 1.08E+08 1258389 -2.82E+08 9.67E+08 URGL -7626599 1.17E+08 0.0000 -9.14E+08 7.15E+08 CINFV 0.1982 0.0447 0.1982 0.1000 0.3333 CIHedge 0.1752 0.0817 0.2000 3.33E-14 0.2500 OBDI -7756216 1.13E+08 0.0000 -9.11E+08 6.69E+08 TBFI -1.36E+08 4.14E+08 -2627925 -2.56E+09 3.08E+08 TFFI -1.36E+08 4.16E+08 -2627925 -2.56E+09 3.08E+08 DIFFA -1783592 18739352 0.0000 -2.12E+08 -1.53E+08 DIFFL -2045112 17539292 0.0000 -1.53E+08 1.07E+08
Variable definitions: LMV = natural log market value of firm’s common equity measured three
months following the financial year t for firm i, BV = book value of equity at year end t for firm i, E = earnings for year t available to firm i’s common shareholders, BVNFI = book value of non financial instruments CINFV = component score of net fair value, CIHedge = component score of hedge information, TBFI = total book value of financial instruments TFFI = net fair value of financial instruments OBDI = off-balance sheet derivative financial instruments URGL = unrealised gain or loss of financial asset and financial liability DIFFA = difference between net fair value of financial assets and book
value of financial assets. DIFFL = difference between net fair value of financial liabilities and book
value of financial liabilities. t = time i = firm

Chapter 7: Results: Disclosure Quality and Firm Characteristics
138
CHAPTER 7 RESULTS: DISCLOSURE QUALITY AND FIRM CHARACTERISTICS
Chapter five developed research questions and chapter six presented research models
that relate disclosure quality with firm characteristics. In this chapter, the results of the
multiple regression analyses that relate disclosure quality and firm characteristics are
presented. Overall, the results support prior studies that size of the firm, price-
earnings ratio and debt-to-equity ratio do play an important role in determining the
quality of information disclosed by the firms. However, in certain cases market-to-
book ratio and profitability of the firms also may lead firms to provide more
transparent information.
Section 7.1 explains the diagnostic tests performed. Section 7.2 presents the
descriptive results. Section 7.3 discusses validity of the disclosure index. Multiple
regression results are discussed in section 7.4. Section 7.5 discusses and analyses the
findings and section 7.6 summarises and concludes the chapter.
7.1 Diagnostic Tests
Several diagnostic tests, such as normality tests, autocorrelation tests,
heteroscedasticity tests and multicollinearity tests, are performed to ensure valid
conclusions are drawn based on the multiple regression results. If the tests are not
satisfied then corrective procedures are performed.

Chapter 7: Results: Disclosure Quality and Firm Characteristics
139
7.1.1 Normality Test The normality test using Jarque-Bera statistics and graphical analysis are performed
on the residuals of all the models. The Jarque-Bera statistics measure the difference of
the skewness and kurtosis of the series as opposed to those from a normal distribution.
The reported probability is the probability that the Jarque-Bera statistics exceeds the
observed value under the null hypothesis of the normal distribution. A probability
with a small value indicates the rejection of the null hypothesis. Skewness is a
measure of asymmetry of the distribution of the series around its mean. If the series is
normally distributed the skewness is zero. A positive skewness means the distribution
has a long right tail and a negative skewness indicates that the distribution has a long
left tail. Kurtosis measures the flatness or peakedness of the distribution of the series.
The kurtosis for a series with a normal distribution is 3. If the kurtosis exceeds (lower)
than 3, it indicates that the distribution is peaked (flat) relative to the normal. The
skewness and kurtosis presented by Eviews 4.0 is –0.6450 and 3.4169 respectively.
The Jarque-Bera statistics is significant at p < 0.01.
7.1.2 Autocorrelation Test Classical linear regression assumes that the disturbances (errors) are not correlated
with each other and have the same variance (Kennedy, 1998, p. 43). Disturbances are
autocorrelated when the covariances and correlations between different disturbances
are not zero. The Durbin-Watson statistic (d) is used to test for autocorrelation. As a
guideline, the Durbin-Watson statistics has provided a lower limit dL and an upper
limit dU for a decision regarding the presence of positive and negative correlation
(Gujarati, 1999). If a d value falls in between dU (the highest value of d which is
Chapter 7: Results: Disclosure Quality and Firm Characteristics
140
below 2) and 4-dU, the null hypothesis of no positive or negative autocorrelation can
be accepted70. Kennedy (1998) indicates that the closer d is to 2.0, the more
confidence there can be of no autocorrelation in the disturbances. The Durbin-Watson
statistic (d) on the main model indicates that autocorrelation is not a concern since d is
very close to 2 (d = 1.9801). As the Durbin-Watson statistic has a few disadvantages
(Thomas, 1997, p. 304) the Breusch-Godfrey serial correlation LM test is also
performed. The test indicates that there is no serial correlation in the residuals.
7.1.3 Heteroscedasticity Test Classical linear regression model (CLRM) assumes that the disturbances are
spherical; where they have the same variance. However, if this is not the case the
disturbances are said to exhibit heteroscedasticity, or unequal variances (Kennedy,
1998). Hence, this can lead to misleading conclusions (Gujarati, 1999, p. 349). Two
tests are performed to test for unequal variances. These are the residual plots produced
by the SPSS 11.5 and the White heteroscedasticity test (White, 1980) reported by
Eviews 4.0 statistical packages. Both tests indicate that there is unequal variance in
the model. The White’s test indicates that the null hypothesis that the errors exhibit
homoskedasticity is rejected at p < 0.05. Therefore, the White’s Heteroscedasticity
Corrected Regression71 is employed.
70 Refer to Gujarati (1999, p. 389) for a detailed discussion. 71 Throughout this thesis the White’s heteroscedasticity corrected regression is used interchangeably with the White’s heteroscedasticity corrected standard errors.
Chapter 7: Results: Disclosure Quality and Firm Characteristics
141
7.1.4 Multicollinearity Test Multicollinearity occurs when there is a linear relationship between independent
variables. Kennedy (1998, p 187) suggests the use of a correlation matrix and
condition index to detect multicollinearity. Table 7.1 presents a correlation matrix
between the independent variables. Kennedy suggests that a high value (about 0.8 or
0.9) for correlation coefficients indicates high correlation between the variables. Table
7.1 indicates that while the size variable is correlated with a number of the other
variables, only two coefficients exceed 0.6. This suggests that multicollinearity is
unlikely to be a problem. To confirm this finding the variance inflation factors (VIF)
are examined using SPSS 11.5. The highest VIF is 3.275 for size followed by 1.746
for type of the firm. VIF being less than 10 confirms that there is no need to be
concerned about the correlation between the independent variables. In addition to the
above tests, the matrix plots are also examined. The matrix plots produced by Eviews
4.0 indicate that multicollinearity is not a major concern.
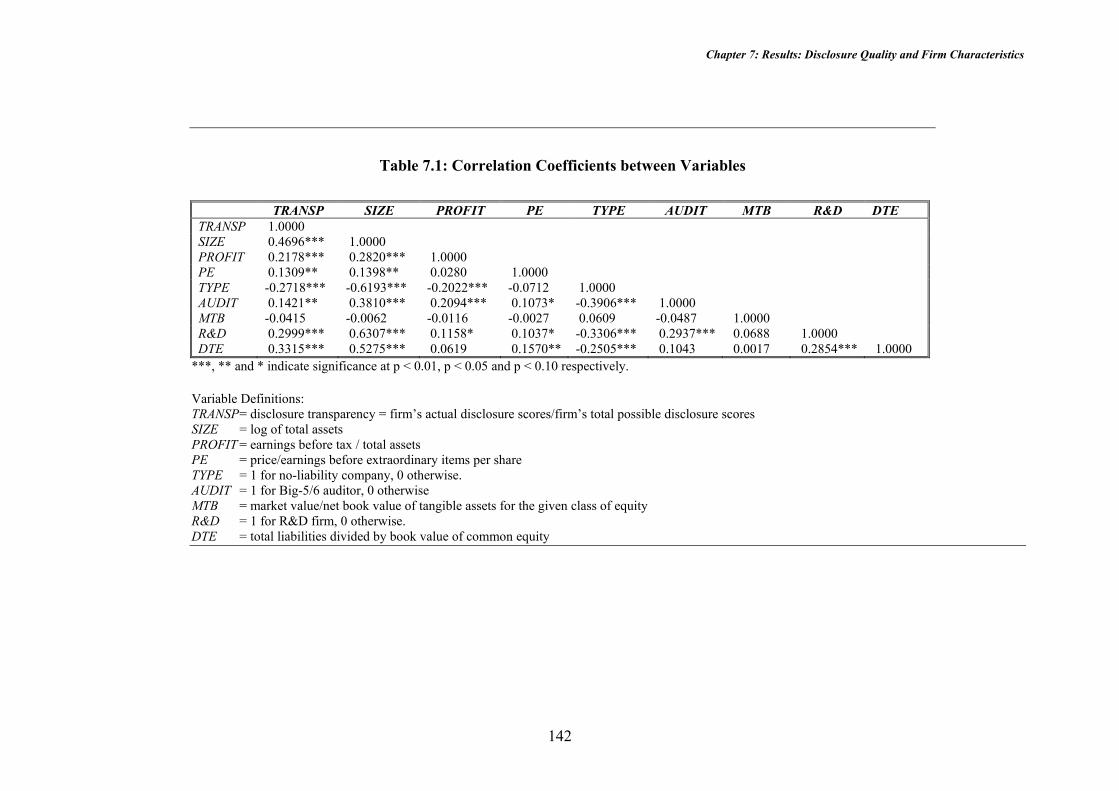
Chapter 7: Results: Disclosure Quality and Firm Characteristics
142
Table 7.1: Correlation Coefficients between Variables
TRANSP SIZE PROFIT PE TYPE AUDIT MTB R&D DTE TRANSP 1.0000 SIZE 0.4696*** 1.0000 PROFIT 0.2178*** 0.2820*** 1.0000 PE 0.1309** 0.1398** 0.0280 1.0000 TYPE -0.2718*** -0.6193*** -0.2022*** -0.0712 1.0000 AUDIT 0.1421** 0.3810*** 0.2094*** 0.1073* -0.3906*** 1.0000 MTB -0.0415 -0.0062 -0.0116 -0.0027 0.0609 -0.0487 1.0000 R&D 0.2999*** 0.6307*** 0.1158* 0.1037* -0.3306*** 0.2937*** 0.0688 1.0000 DTE 0.3315*** 0.5275*** 0.0619 0.1570** -0.2505*** 0.1043 0.0017 0.2854*** 1.0000
***, ** and * indicate significance at p < 0.01, p < 0.05 and p < 0.10 respectively. Variable Definitions: TRANSP = disclosure transparency = firm’s actual disclosure scores/firm’s total possible disclosure scores SIZE = log of total assets PROFIT = earnings before tax / total assets PE = price/earnings before extraordinary items per share TYPE = 1 for no-liability company, 0 otherwise. AUDIT = 1 for Big-5/6 auditor, 0 otherwise MTB = market value/net book value of tangible assets for the given class of equity R&D = 1 for R&D firm, 0 otherwise. DTE = total liabilities divided by book value of common equity

Chapter 7: Results: Disclosure Quality and Firm Characteristics
143
7.2 Descriptive Results
7.2.1 Firms’ Disclosure Scores
Table 7.2 reports the numbers of firms in the extractive industries that disclose all
information required by the accounting standard, AASB 1033. Column 3 panel A
reports that the number of firms reporting all required information in the Top 500
decreased from 11 firms in 1998 to 8 firms in 2001. Panel B indicates that in 1998 no
non-Top 500 firms using derivatives provided high quality derivative information.
However, the number of non-Top 500 firms with high quality disclosures increased to
one firm in 1999 and 2000, and two firms in 2001.
Table 7.2: Number of Firms that Report all Information Required by AASB 1033 (100% disclosure)
Year Full Sample User sample*
Panel A: Top 500 Companies Listed in BRW/Connect 4 (n=56) (n=44) 1998 12 11 1999 15 14 2000 10 9 2001 9 8
Panel B: Non-Top 500 Companies (n=81) (n=21) 1998 1 0 1999 7 1 2000 7 1 2001 5 2
Total 137 65 * This refers to the firms that use derivatives for hedging purposes.

Chapter 7: Results: Disclosure Quality and Firm Characteristics
144
Table 7.3 reports the number of Australian firms in the extractives industries
classified according to the quality of their derivative disclosures. The number of firms
in the user-sample providing high quality information is indicated in column 7, Panel
A. In 1998 there are 11 firms disclosing 100% of information about financial
instruments. The number increases to 15 in 1999, but decreased to 10 in 2000. The
majority of firms providing high quality derivative information are limited liability
firms. However, the number of limited liability firms producing high quality
information decreased from 10 in 1998 to 8 in 2001. However, there was an increase
in the number of firms providing 90% to 99% of this information. The number
increased from 20 (1998) to 31 (2001) for the full sample. The majority of these firms
are limited liability firms (Column 6, Panel B).
Table 7.3: Disclosure Quality of Firms in the Australian Extractive Industries
Year < 30% 30%-49% 50%-69% 70%-89% 90%-99% 100% Panel A: User sample (n=65) 1998 0 0 7 27 20 11 1999 0 0 4 25 21 15 2000 0 0 3 25 27 10 2001 0 0 1 23 31 10 Panel B: Limited liability firms in user sample 1998 (n=38) 0 0 1 13 14 10 1999 (n=40) 0 0 1 15 13 11 2000 (n=43) 0 0 2 14 19 8 2001 (n=43) 0 0 0 13 22 8 Panel C: No-liability firms in user sample 1998 (n=27) 0 0 6 14 6 1 1999 (n=25) 0 0 3 10 8 4 2000 (n=22) 0 0 1 11 8 2 2001 (n=22) 0 0 1 10 9 2

Chapter 7: Results: Disclosure Quality and Firm Characteristics
145
7.2.2 Disclosure Components
As discussed in the previous section each component of the disclosure index plays an
important role in determining the quality of derivative disclosures. Table 7.4 reports
descriptive statistics for each disclosure component for the pooled sample (65 times 4
years). Panel A reports the statistics for the user sample. The mean for each disclosure
component (Panel A) indicates that user firms disclose almost all information with
regard to policy information (99.62%). However, they do withhold some information
in relation to hedges of anticipated transactions (76.72%), risk information (81.09%),
net fair value information (81.30%) and commodity contracts information (36.54%).
Information about commodity contracts is relevant to only a limited number of
extractive firms using commodity instruments, such as gold forward contracts, to
hedge their risk.
Table 7.4: Descriptive Statistics of Disclosure Components (Pooled Sample)
Mean Standard Deviation
Median Minimum Maximum
Panel A: User Sample (n=260) Policy Information 0.9962 0.0620 1.0000 0.0000 1.0000 Hedges of Anticipated Transactions 0.7672 0.3490 1.0000 0.0000 1.0000 Risk Information 0.8109 0.2840 1.0000 0.0000 1.0000 Net Fair Value Information 0.8130 0.1404 0.7500 0.5000 1.0000 Commodity Contracts Information 0.3654 0.4825 0.0000 0.0000 1.0000 Panel B: Limited liability firms in User Sample (n=168) Policy Information 1.0000 0.0000 1.0000 1.0000 1.0000 Hedges of Anticipated Transactions 0.8508 0.2539 1.0000 0.0000 1.0000 Risk Information 0.8571 0.2542 1.0000 0.0000 1.0000 Net Fair Value Information 0.8187 0.1388 0.7500 0.5000 1.0000 Commodity Contracts Information 0.4405 0.4979 0.0000 0.0000 1.0000 Panel C: No-liability firms in User Sample (n=92) Policy Information 0.9891 0.1043 1.0000 0.0000 1.0000 Hedges of Anticipated Transactions 0.6145 0.4380 0.8000 0.0000 1.0000 Risk Information 0.7264 0.3160 0.6667 0.0000 1.0000 Net Fair Value Information 0.8028 0.1435 0.7500 0.5000 1.0000 Commodity Contracts Information 0.2283 0.4220 0.0000 0.0000 1.0000
Chapter 7: Results: Disclosure Quality and Firm Characteristics
146
A comparison of Panel B and Panel C indicates that no-liability firms make fewer
disclosures than limited liability firms especially of information about hedges of
anticipated transactions and risk information. Panel C indicates that the mean for
hedges of anticipated transactions is 0.6145 compared to 0.8508 for limited liability
firms (Panel B). The mean for risk information for no-liability firms is 0.7264 as
compared to 0.8571 for limited liability firms.
Further investigation of each component reveals that some firms failed to disclose
detailed information about the expected timing of recognition of any deferred or
unrecognised gain or loss as a revenue or expense, the aggregate net fair value and
carrying amount and the net fair value of either the individual asset or appropriate
grouping of those individual assets. It is also recorded that some firms did not disclose
their reasons for not reducing the carrying amount to net fair value. As a consequence
they did not provide any information about their evidence for management’s belief
that the carrying amount will be recovered.
Table 7.5 reports the trend in disclosing derivative information among user firms over
the period of the study. Panel A indicates that policy information as required by
paragraph 5.2 (a), (b) and paragraph 5.3 AASB 1033 is fully disclosed in all years
except 1998. Further, there is a steady increase over the four year period in the
disclosure transparency of hedges of anticipated transactions and risk information.
Panel B reports that the mean of the disclosure score for hedges of anticipated
transactions and risk information for limited liability firms increased from 85.31%
(1998) to 89.92% (2001) and 84.21% (1998) to 87.60% (2001) respectively. A similar
trend was documented for no-liability firms.
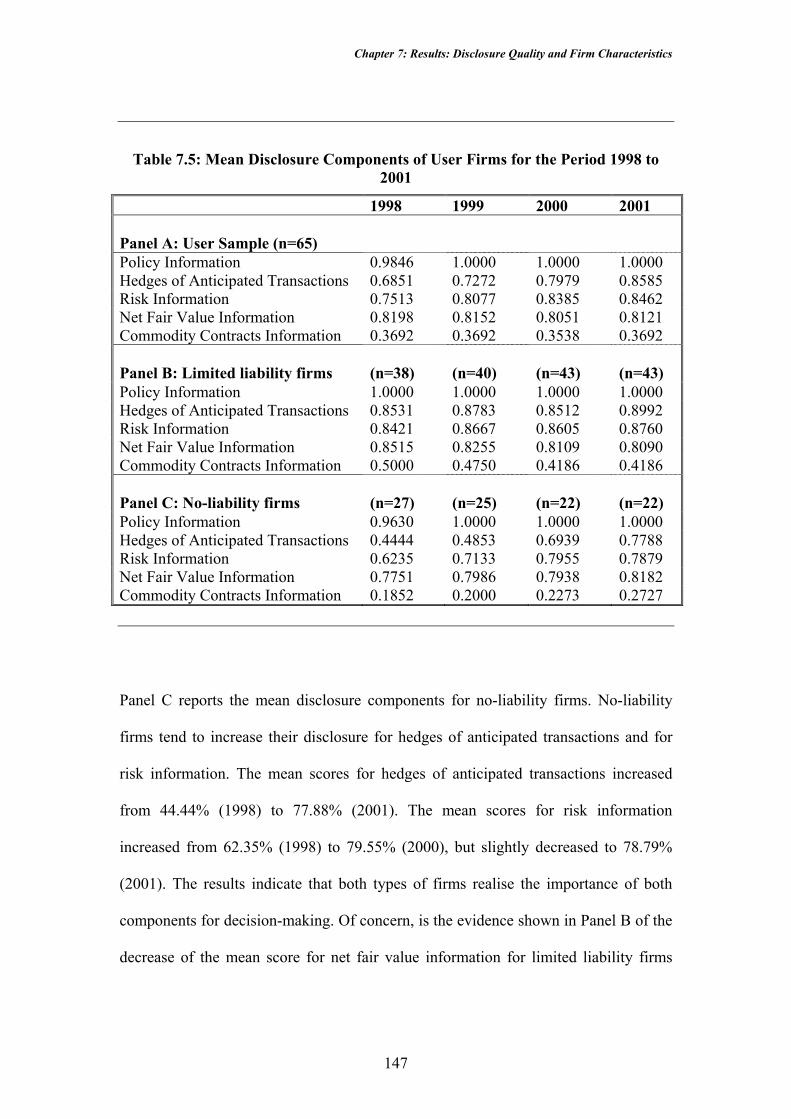
Chapter 7: Results: Disclosure Quality and Firm Characteristics
147
Table 7.5: Mean Disclosure Components of User Firms for the Period 1998 to 2001
1998 1999 2000 2001 Panel A: User Sample (n=65)
Policy Information 0.9846 1.0000 1.0000 1.0000 Hedges of Anticipated Transactions 0.6851 0.7272 0.7979 0.8585 Risk Information 0.7513 0.8077 0.8385 0.8462 Net Fair Value Information 0.8198 0.8152 0.8051 0.8121 Commodity Contracts Information 0.3692 0.3692 0.3538 0.3692 Panel B: Limited liability firms
(n=38)
(n=40)
(n=43)
(n=43)
Policy Information 1.0000 1.0000 1.0000 1.0000 Hedges of Anticipated Transactions 0.8531 0.8783 0.8512 0.8992 Risk Information 0.8421 0.8667 0.8605 0.8760 Net Fair Value Information 0.8515 0.8255 0.8109 0.8090 Commodity Contracts Information 0.5000 0.4750 0.4186 0.4186 Panel C: No-liability firms
(n=27)
(n=25)
(n=22)
(n=22)
Policy Information 0.9630 1.0000 1.0000 1.0000 Hedges of Anticipated Transactions 0.4444 0.4853 0.6939 0.7788 Risk Information 0.6235 0.7133 0.7955 0.7879 Net Fair Value Information 0.7751 0.7986 0.7938 0.8182 Commodity Contracts Information 0.1852 0.2000 0.2273 0.2727
Panel C reports the mean disclosure components for no-liability firms. No-liability
firms tend to increase their disclosure for hedges of anticipated transactions and for
risk information. The mean scores for hedges of anticipated transactions increased
from 44.44% (1998) to 77.88% (2001). The mean scores for risk information
increased from 62.35% (1998) to 79.55% (2000), but slightly decreased to 78.79%
(2001). The results indicate that both types of firms realise the importance of both
components for decision-making. Of concern, is the evidence shown in Panel B of the
decrease of the mean score for net fair value information for limited liability firms
Chapter 7: Results: Disclosure Quality and Firm Characteristics
148
from 85.15% (1998) to 80.90% (2001). However, there is no consistent pattern in the
trend for no-liability firms.
7.3 Validity of the Disclosure Quality Score (Disclosure Index) Research on disclosure quality based on a disclosure index has been criticised because
of validity and reliability issues. This is because the usefulness of the index depends
on the items included in the index (Marston and Shrives, 1991) and the fact that the
selection of the items is very subjective (Botosan, 1997). Marston and Shrives (1991)
considered an index to be valid if the index has any meaning as a measure of
information disclosure. They report that most researchers adapt and change the
existing indices to meet their own objectives and therefore the index is valid in the
particular research environment of interest only.
Botosan (1997) had used several procedures to examine reliability and validity of her
disclosure index. She compared the correlation between the disclosure index and firm
characteristics (i.e. firm size, exchange status, audit firm size and leverage) identified
to be associated with the firms disclosure level in prior research. If her index
successfully measures disclosure levels it should be correlated with these
characteristics. She also examines: a) the correlation between her disclosure index and
the annual report of disclosure scores assigned by the Association of Investment and
Management Research (AIMR) and b) the correlation between components of the
disclosure index, the number of Wall Street Journal (WSJ) articles written about the
firm during 1990 and the number of financial analysts following the firm during the
year. In addition to the above, she also calculated the Cronbach’s coefficient alpha to
Chapter 7: Results: Disclosure Quality and Firm Characteristics
149
assess the degree to which the correlation among the categories of the disclosure
index is attenuated due to random error.
Botosan concluded that the validity of her disclosure index was supported as there is a
correlation between: a) the disclosure index and size, leverage and exchange listing
status, b) the disclosure index and the score assigned by the AIMR, c) the components
of the disclosure index, number of analysts following the firm and the number of WSJ
articles. Additionally, the Cronbach’s coefficient alpha is satisfied.
To validate the disclosure quality, this thesis examines: a) the correlation between
each component, b) the correlation between disclosure quality and firm characteristics
and c) the disclosure score of firms in the extractive industries which received either
gold, silver or bronze awards from the Australasian Reporting Awards Inc. (ARA).
The ARA is an independent not-for-profit organisation comprised of the professional
bodies and individuals with the objectives:
i) to promote excellence in reporting through the publication of informative and factual reports,
ii) to encourage effective communication of financial and
business information,
iii) to create public awareness of valid and objective measures of performance and to promote a better understanding of the results achieved, and
iv) to create public awareness of the purposes of enterprises,
how they function and their achievements.
Chapter 7: Results: Disclosure Quality and Firm Characteristics
150
The ARA published criteria reflect the general reporting principles of the Global
Reporting Initiatives (GRI)72. The ARA general criteria apply to all reporting entities.
The criteria components are: a) overview/objectives/highlight, b) review of operations
or activities and c) details and analyses of performance and financial affairs, which
include financial statements and related notes and statistical summaries (ARA, 2003).
Table 7.6 presents the correlation coefficients among the variables. Panel A presents
the correlations between disclosure components index. Panel A Table 7.6 indicates
that hedges of anticipated transactions are positively and significantly correlated with
the other variables at p < 0.01 and p < 0.05, while the risk component is positively and
significantly related with the net fair value component at p < 0.01. Panel B presents
the correlation coefficients between firm characteristics and disclosure quality. Panel
B indicates that size, audit and leverage (DTE) are positively correlated with
disclosure quality at p < 0.01, p < 0.05 and p < 0.01 respectively. This is consistent
with the findings of Botosan (1997) and Ahmed and Courtis (1999).
72 Nine elements for best practice reporting are outlined by the GRI are a CEO statement, concise presentation of key indicators, profile of the entity, policies, organisation and management systems, stakeholder relationships, management performance, operational performance, product performance and sustainability overview.

Chapter 7: Results: Disclosure Quality and Firm Characteristics
151
Table 7.6: Correlation Coefficients between Variables
Panel A: Correlation Coefficients between Disclosure Components Index TRANSP POLICY HEDGE RISK NFV COMMODITY
TRANSP 1.000 POLICY 0.143** 1.000 HEDGE 0.467*** 0.137** 1.000 RISK 0.819*** -0.041 0.199*** 1.000 NFV 0.542*** -0.083 0.235*** 0.276*** 1.000 COMMODITY 0.252*** 0.047 0.350*** 0.084 0.062 1.000 Panel B: Correlation Coefficients between Variables
TRANSP SIZE AUDIT DTE TRANSP 1.0000 SIZE 0.4696*** 1.0000 AUDIT 0.1421** 0.3810*** 1.0000 DTE 0.3315*** 0.5275*** 0.1043 1.0000
***, ** and * indicate significance at p < 0.01, p < 0.05 and p < 0.10 respectively.
Variable Definitions: TRANSP = disclosure transparency = firm’s actual disclosure scores/firm’s total possible
disclosure scores POLICY = policy information component HEDGE = hedge of anticipated transaction component RISK = risk information component NFV = net fair value component COMMODITY = commodity component SIZE = log of total assets AUDIT = 1 for Big-5/6 auditor, 0 otherwise DTE = total liabilities divided by book value of common equity
In 2002 nine firms in the extractive industries were awarded by the ARA for their
high quality 2001 annual reports (Annual Reports Partner, 2002). Three were awarded
with the gold award, one with silver and five were awarded with bronze award. Table
7.7 presents the disclosure quality score for these companies for 1998 to 2001. As
there is no record available for previous years, the comparison is based on the
recipients for 2002. The results indicate that the disclosure score of these companies
are consistent with the award given, where these companies provided quality
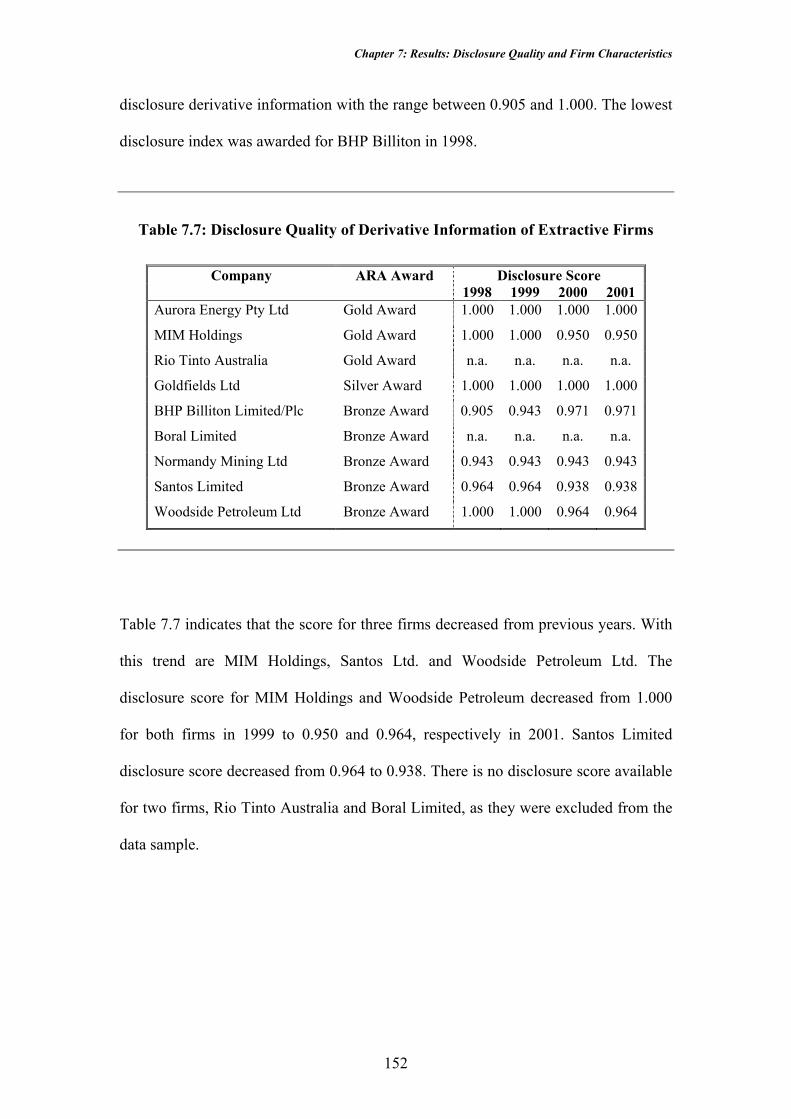
Chapter 7: Results: Disclosure Quality and Firm Characteristics
152
disclosure derivative information with the range between 0.905 and 1.000. The lowest
disclosure index was awarded for BHP Billiton in 1998.
Table 7.7: Disclosure Quality of Derivative Information of Extractive Firms
Company ARA Award Disclosure Score
1998 1999 2000 2001 Aurora Energy Pty Ltd Gold Award 1.000 1.000 1.000 1.000
MIM Holdings Gold Award 1.000 1.000 0.950 0.950
Rio Tinto Australia Gold Award n.a. n.a. n.a. n.a. Goldfields Ltd Silver Award 1.000 1.000 1.000 1.000
BHP Billiton Limited/Plc Bronze Award 0.905 0.943 0.971 0.971
Boral Limited Bronze Award n.a. n.a. n.a. n.a. Normandy Mining Ltd Bronze Award 0.943 0.943 0.943 0.943
Santos Limited Bronze Award 0.964 0.964 0.938 0.938
Woodside Petroleum Ltd Bronze Award 1.000 1.000 0.964 0.964
Table 7.7 indicates that the score for three firms decreased from previous years. With
this trend are MIM Holdings, Santos Ltd. and Woodside Petroleum Ltd. The
disclosure score for MIM Holdings and Woodside Petroleum decreased from 1.000
for both firms in 1999 to 0.950 and 0.964, respectively in 2001. Santos Limited
disclosure score decreased from 0.964 to 0.938. There is no disclosure score available
for two firms, Rio Tinto Australia and Boral Limited, as they were excluded from the
data sample.
Chapter 7: Results: Disclosure Quality and Firm Characteristics
153
7.4 Multiple Regression Results
7.4.1 Standard Regression Procedures
Table 7.8 presents the results of the regression analysis of the association between
disclosure transparency and firm characteristics73. As predicted, firm size is
significantly positively related to disclosure quality (p < 0.001). This indicates that
large firms tend to provide more transparent information as compared to small firms.
This is consistent with the work undertaken by Singhvi and Desai (1971), Firth
(1979), Wallace et al. (1994), Wallace and Naser (1995), Riahi-Belkaoui (2001), Ali
et al. (2003) and Cooke (1989, 1991). Also significant are two of the control
variables; debt-to-equity ratio (p = 0.0212) and market-to-book ratio (p = 0.0021)74.
However, market-to-book ratio is negatively related to the disclosure quality of
derivative information.
The coefficients estimated for profitability and price-earnings ratio are positively and
significant at p < 0.05. However, the coefficient estimates for research and
development, firm type and auditor are not significant. While the measure of auditor
is not only insignificant but negatively associated with transparency, this may be due
to lack of variability in this variable. The insignificance of auditor is consistent with
Ali et al. (2003), Firth (1979), Malone at al. (1993) and Wallace et al. (1994).
73 Since heteroscedasticity is present, the results presented are based on the White’s heteroscedasticity-corrected standard errors. 74 The results are consistent for the estimation without the outliers. Results are presented in Table E 1, Appendix E.
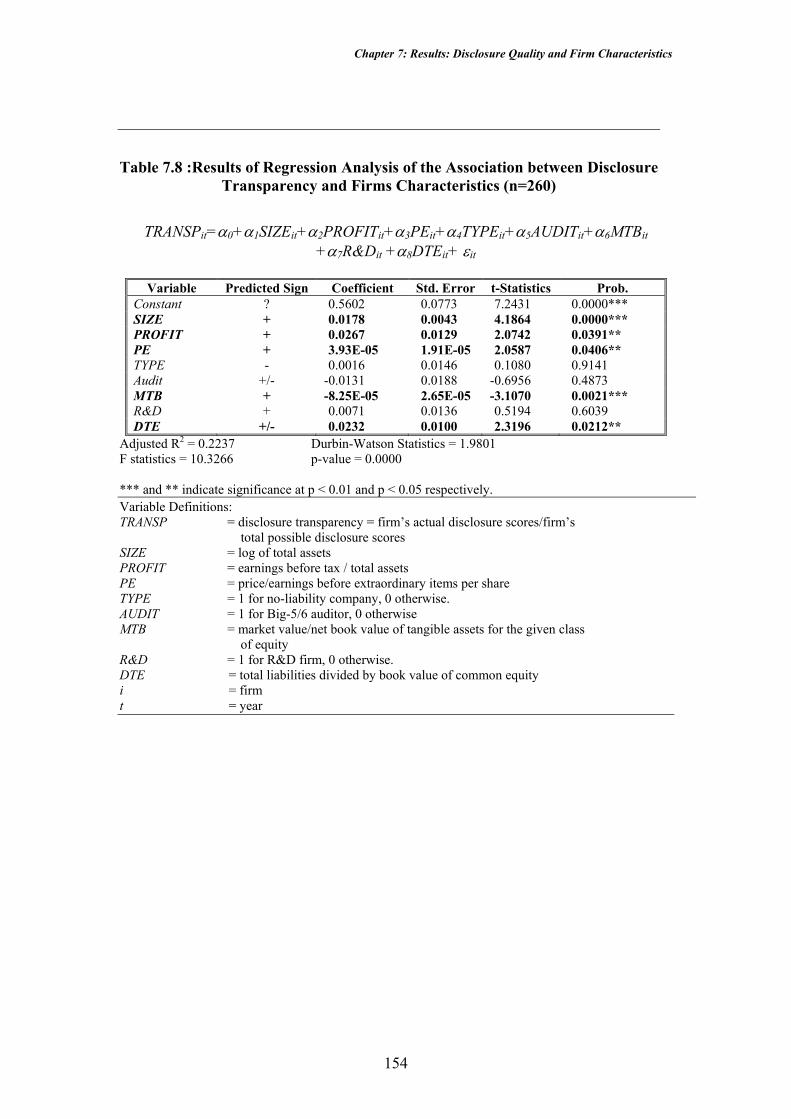
Chapter 7: Results: Disclosure Quality and Firm Characteristics
154
Table 7.8 :Results of Regression Analysis of the Association between Disclosure Transparency and Firms Characteristics (n=260)
TRANSPit=α0+α1SIZEit+α2PROFITit+α3PEit+α4TYPEit+α5AUDITit+α6MTBit
+α7R&Dit +α8DTEit+ εit
Variable Predicted Sign Coefficient Std. Error t-Statistics Prob. Constant ? 0.5602 0.0773 7.2431 0.0000*** SIZE + 0.0178 0.0043 4.1864 0.0000*** PROFIT + 0.0267 0.0129 2.0742 0.0391** PE + 3.93E-05 1.91E-05 2.0587 0.0406** TYPE - 0.0016 0.0146 0.1080 0.9141 Audit +/- -0.0131 0.0188 -0.6956 0.4873 MTB + -8.25E-05 2.65E-05 -3.1070 0.0021*** R&D + 0.0071 0.0136 0.5194 0.6039 DTE +/- 0.0232 0.0100 2.3196 0.0212**
Adjusted R2 = 0.2237 Durbin-Watson Statistics = 1.9801 F statistics = 10.3266 p-value = 0.0000 *** and ** indicate significance at p < 0.01 and p < 0.05 respectively. Variable Definitions: TRANSP = disclosure transparency = firm’s actual disclosure scores/firm’s total possible disclosure scores SIZE = log of total assets PROFIT = earnings before tax / total assets PE = price/earnings before extraordinary items per share TYPE = 1 for no-liability company, 0 otherwise. AUDIT = 1 for Big-5/6 auditor, 0 otherwise MTB = market value/net book value of tangible assets for the given class of equity R&D = 1 for R&D firm, 0 otherwise. DTE = total liabilities divided by book value of common equity i = firm t = year

Chapter 7: Results: Disclosure Quality and Firm Characteristics
155
7.4.2 Sensitivity Analyses
7.4.2.1 Ranked Regression
In addition to the above standard regression, the ranked regression procedure, as in
Lang and Lundholm (1993), Wallace, Naser and Mora (1994), Wallace and Naser
(1995), Owusu-Ansah (1998) and Ali, Ahmed and Henry (2003), is performed. The
procedure is an alternative approach to other robust techniques and a powerful method
for data with monotonic and non-linear relations (Iman and Conover, 1979; Lang and
Lundholm, 1993; Wallace et al., 1994). The approach has also been suggested by
Bollen and Jackman (1990) to mitigate the effect of influential observations. Kane and
Meade (1997) indicate that this technique is considered robust to mitigate problems
associated with skewed distributions and negative values.
The rank transformation is a simple procedure where the continuous variables are
replaced with their rank. It also treats all observations (i.e. influential or not) equally
(Owusu-Ansah, 1998). The smallest observation is ranked as 1 and continued to rank
n for the largest. In the case of ties the average ranks are assigned.
Table 7.9 shows that leverage, size and price-earnings ratios are positively related to
transparency and are highly significant at p < 0.00175. Results that differ to those
presented earlier in Table 7.8 relate to market-to-book ratio and profitability, which
are no longer significant. However the explanatory power of this model increases
from 22.37% to 32.98%. This is contrary to the findings of Owusu-Ansah (1998) and 75 The results are based on the White’s Heteroscedasticity-Consistent Standard Errors, and are consistent with the results of estimation with the outliers excluded. Results with the outliers excluded are presented in Table E 3 Appendix E. Six observations were eliminated because of a large discrepancy between these observations and the rest of the sample.

Chapter 7: Results: Disclosure Quality and Firm Characteristics
156
Wallace et al. (1994), where both studies report the weaker explanatory power for the
rank regression procedure.
Table 7.9: Results of Regression Analysis of the Association between Disclosure Transparency and Firms Characteristics: Ranked Transformation (n=260)
RTRANSPit=α0+α1RSIZEit+α2RPROFITit+α3RPEit+α4TYPEit+α5AUDITit
+α6RMTBit+α7R&Dit +α8RDTEit+ εit
Variable Predicted Sign Coefficient Std. Error t-Statistics Prob
Constant ? 28.3921 19.7543 1.4373 0.1519 RSIZE + 0.3394 0.1007 3.3720 0.0009*** RPROFIT + 0.0457 0.0672 0.6805 0.4968 RPE + 0.2168 0.0625 3.4682 0.0006*** TYPE - 16.2860 11.5022 1.4159 0.1580 Audit +/- 12.4352 12.5933 -0.9874 0.3244 RMTB + -0.0584 0.0480 -1.2170 0.2248 R&D + -9.1751 10.5397 -0.8705 0.3848 RDTE +/- 0.2953 0.0727 4.0610 0.0001***
Adjusted R2 = 0.3298 Durbin-Watson Statistics = 2.0311 F statistics = 16.9348 p-value = 0.0000 *** indicates significance at p < 0.01.
Variable Definitions: RTRANSP = rank of disclosure (transparency) RSIZE = rank of total assets (in thousands) RPROFIT = rank of profitability RPE = rank of price/earnings ratio TYPE = 1 for no-liability company, 0 otherwise. AUDIT = 1 for Big-5/6 auditor, 0 otherwise RMTB = rank of market-to-book ratio R&D = 1 for R&D firm, 0 otherwise. RDTE = rank of total liabilities divided by book value of common equity i = firm t = year
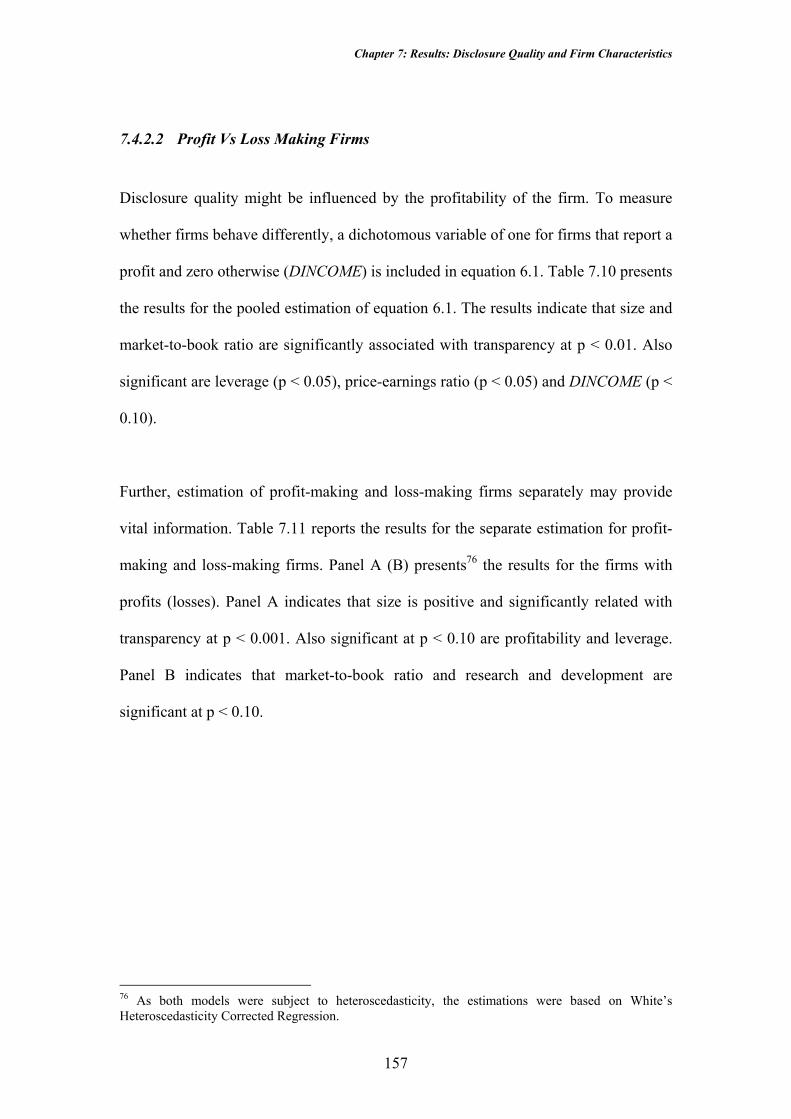
Chapter 7: Results: Disclosure Quality and Firm Characteristics
157
7.4.2.2 Profit Vs Loss Making Firms
Disclosure quality might be influenced by the profitability of the firm. To measure
whether firms behave differently, a dichotomous variable of one for firms that report a
profit and zero otherwise (DINCOME) is included in equation 6.1. Table 7.10 presents
the results for the pooled estimation of equation 6.1. The results indicate that size and
market-to-book ratio are significantly associated with transparency at p < 0.01. Also
significant are leverage (p < 0.05), price-earnings ratio (p < 0.05) and DINCOME (p <
0.10).
Further, estimation of profit-making and loss-making firms separately may provide
vital information. Table 7.11 reports the results for the separate estimation for profit-
making and loss-making firms. Panel A (B) presents76 the results for the firms with
profits (losses). Panel A indicates that size is positive and significantly related with
transparency at p < 0.001. Also significant at p < 0.10 are profitability and leverage.
Panel B indicates that market-to-book ratio and research and development are
significant at p < 0.10.
76 As both models were subject to heteroscedasticity, the estimations were based on White’s Heteroscedasticity Corrected Regression.
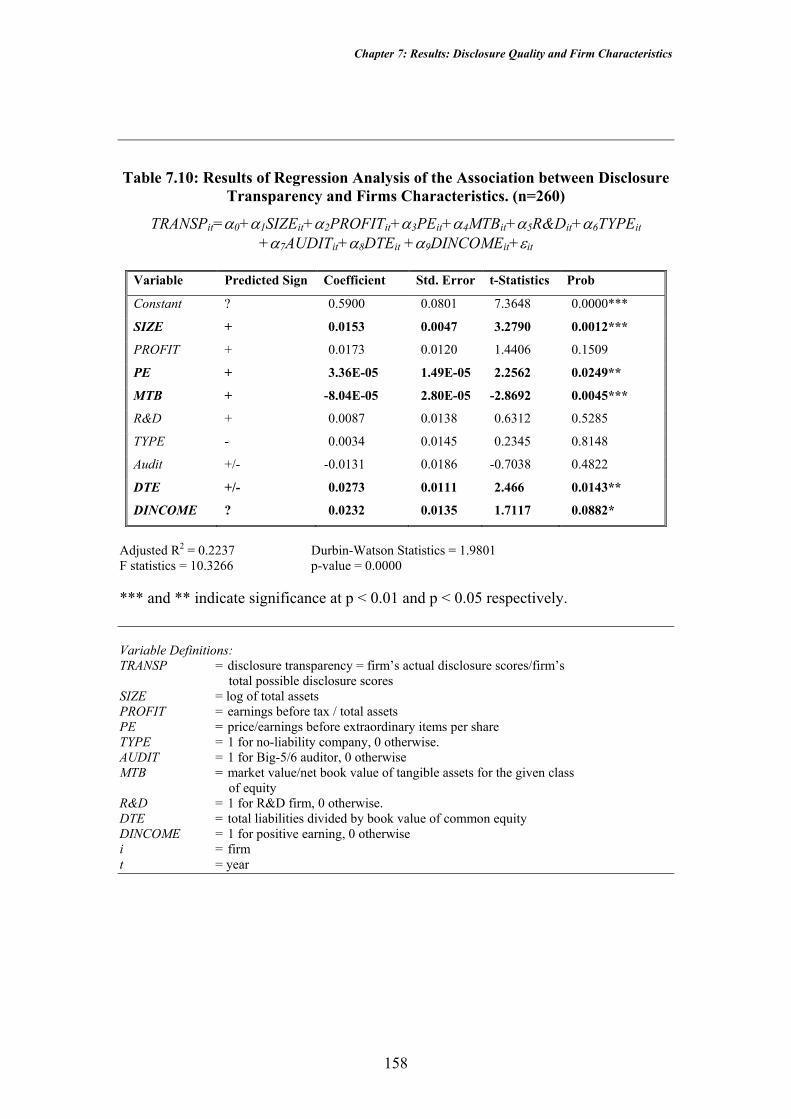
Chapter 7: Results: Disclosure Quality and Firm Characteristics
158
Table 7.10: Results of Regression Analysis of the Association between Disclosure Transparency and Firms Characteristics. (n=260)
TRANSPit=α0+α1SIZEit+α2PROFITit+α3PEit+α4MTBit+α5R&Dit+α6TYPEit
+α7AUDITit+α8DTEit +α9DINCOMEit+εit
Variable Predicted Sign Coefficient Std. Error t-Statistics Prob
Constant ? 0.5900 0.0801 7.3648 0.0000***
SIZE + 0.0153 0.0047 3.2790 0.0012***
PROFIT + 0.0173 0.0120 1.4406 0.1509
PE + 3.36E-05 1.49E-05 2.2562 0.0249**
MTB + -8.04E-05 2.80E-05 -2.8692 0.0045***
R&D + 0.0087 0.0138 0.6312 0.5285
TYPE - 0.0034 0.0145 0.2345 0.8148
Audit +/- -0.0131 0.0186 -0.7038 0.4822
DTE +/- 0.0273 0.0111 2.466 0.0143**
DINCOME ? 0.0232 0.0135 1.7117 0.0882*
Adjusted R2 = 0.2237 Durbin-Watson Statistics = 1.9801 F statistics = 10.3266 p-value = 0.0000 *** and ** indicate significance at p < 0.01 and p < 0.05 respectively.
Variable Definitions: TRANSP = disclosure transparency = firm’s actual disclosure scores/firm’s total possible disclosure scores SIZE = log of total assets PROFIT = earnings before tax / total assets PE = price/earnings before extraordinary items per share TYPE = 1 for no-liability company, 0 otherwise. AUDIT = 1 for Big-5/6 auditor, 0 otherwise MTB = market value/net book value of tangible assets for the given class of equity R&D = 1 for R&D firm, 0 otherwise. DTE = total liabilities divided by book value of common equity DINCOME = 1 for positive earning, 0 otherwise i = firm t = year

Chapter 7: Results: Disclosure Quality and Firm Characteristics
159
Table 7.11: Results of Regression Analysis of the Association between Disclosure Transparency and Firms Characteristics.
TRANSPit=α0+α1SIZEit+α2PROFITit+α3PEit+α4MTBit+α5R&Dit+α6TYPEit+α7AUDITit +α8DTEit +εit
Variable Predicted Sign Coefficient Std. Error t-Statistics Prob Panel A: Profitable Firms (n=145) Constant ? 0.5848 0.0862 6.7838 0.0000*** SIZE + 0.0189 0.0045 4.225 0.0000*** PROFIT + -0.1055 0.0604 -1.7486 0.0826* PE + -1.30E-06 2.80E-05 -0.0463 0.9631 MTB + -3.51E-05 2.83E-05 -1.2387 0.2176 R&D + -0.0196 0.0151 -1.3021 0.1951 TYPE - 0.0131 0.0210 0.6235 0.5340 Audit +/- -0.0311 0.0203 -1.5363 0.1268 DTE +/- 0.0239 0.0129 1.8521 0.0662* Adj. R2= 0.1684 DW Stat. 1.7984 F Stat. = 4.6452 Prob. = 0.0000 Panel B: Loss-Making Firms (n=115) Constant ? 0.6235 0.1772 3.5189 0.0006*** SIZE + 0.0128 0.0106 1.2103 0.2288 PROFIT + 0.0201 0.0131 1.5323 0.1284 PE + 2.36E-05 2.36E-05 1.0026 0.3184 MTB + -0.0005 0.0003 -1.6869 0.0946* R&D + 0.0527 0.0281 1.8769 0.0633* TYPE - 0.0035 0.0219 0.1616 0.8719 Audit +/- -0.0075 0.0260 -0.2904 0.7721 DTE +/- 0.0235 0.0264 0.8896 0.3757 Adj. R2= 0.1636 DW Stat. 1.7343 F Stat.= 3.7880 Prob. = 0.0006
***, ** and * indicate significance at p < 0.01, p < 0.05 and p < 0.10 respectively. A regression analysis without the outliers also was run, however this does not change the conclusion on SIZE.
Variable definitions: SIZE = natural log of total assets (in thousand). PROFIT = profitability. PE = price-to-earnings ratio. MTB = market-to-book ratio. R&D = 1 for R&D firm, 0 otherwise. TYPE = 1 for no-liability company, 0 otherwise. AUDIT = 1 for Big5/6 auditor, 0 otherwise. DTE = total liabilities divided by book value of common equity i = firm t = year
Chapter 7: Results: Disclosure Quality and Firm Characteristics
160
7.5 Discussion and Analysis
7.5.1 Disclosure Quality
Chalmers (2001) provides evidence on the increase in the number of firms disclosing
information about derivatives between 1992 and 1998. She indicates that both the ED
65 Disclosure and Presentation of Financial Instruments and the probability of the
development of a standard, i.e. AASB 1033, influenced firms to enhance their
reporting on derivatives. This thesis provides similar evidence in the extractive
industries. However, the number of firms disclosing all information as required by
paragraph 5.2 to 5.9 has reduced from 11 in 1998 to 10 in 2001 (panel A Table 7.3),
but this was followed by an increase in the number of firms providing 90% to 99%
information (20 in 1998 to 31 in 2001). The majority of these firms are Top 500 firms.
Non-Top 500 firms tend to be small firms, which may not be exposed to risk, or may
experience small exposure to risk, therefore these firms may use in-house techniques
to reduce or overcome risk.
The reduction in the number of firms that report high quality information can be
explained by the fact that firms have simplified their disclosures, such as providing
aggregate or net amount of net fair values instead of previously expanded information.
In addition to that, some firms tended to ignore “other” requirements that relate to the
various sub-sections. For example, paragraph 5.7 requires firms, where one or more
financial assets are recognised at an amount in excess of their net fair value, to
disclose: a) the carrying amount and the net fair value of either an individual or group
of assets, b) the reasons for not reducing the carrying amount and c) the nature or
basis for the belief that the carrying amount will be recovered. The majority of the
Chapter 7: Results: Disclosure Quality and Firm Characteristics
161
firms failed to disclose the basis for their belief that the carrying amount of financial
assets will be recovered and therefore, their disclosure quality is less than firms that
disclose all the requirements.
However, the most important finding is that even though the disclosure is mandatory,
the majority of firms provide less than full information (50%-99%). Therefore, it is
necessary for the standard setters or regulators to use their enforcement powers to
ensure better compliance (Kothari, 2000).
This study found among limited liability and no-liability firms that the level of
disclosure varies significantly. No-liability firms tend to disclose less information,
especially on hedges of anticipated transactions and risk information (Table 7.4 and
Table 7.5). The rationale for this could be that no-liability firms incur higher relative
costs of accumulating detailed information about hedges of anticipated transactions,
risk information, net fair value and commodity contracts information. Alternatively,
increased disclosure could endanger their competitive position.
While fair value is relevant for financial statement users to assess the effect of
derivative transactions (Rasch and Wilson, 1998), the disclosure of this component is
less transparent than the policy information component (Table 7.4). These firms may
be unwilling to move to fair value accounting, as reported in Delloitte Touche
Tohmatsu (2000), or disclosing net fair value may require them to incur additional
costs of accumulating net fair value information.

Chapter 7: Results: Disclosure Quality and Firm Characteristics
162
Firms continue to use their discretion in the disclosure of certain information, in
particular, net fair value information, even though this is required by AASB 1033.
Therefore, as in Chalmers and Godfrey (2000), this lack of disclosure may hinder the
understandability, comparability and consistency, of the disclosures and hence the
quality of derivative disclosures among firms in the extractive industries
The idea of requiring firms to disclose risk information and net fair value information
is to aid financial statement users in understanding the effects of interest rate risk and
credit risk on firms’ cash flows. Failure to disclose such information may cause
financial statement users to underestimate the risk to which the entity is exposed and
thus the potential gain or loss. Detailed information on hedges of anticipated
transactions would enable users of financial statements to understand the nature and
effect of a hedge on future transactions.
7.5.2 Comparison with Prior Studies
Prior studies have provided evidence on the association between disclosure quality of
other information in the annual report and firm characteristics. Based on these studies,
the firm characteristics model was developed to provide answers to four research
questions developed in chapter five. Table 7.12 presents a summary of the findings of
prior studies and the current study.

Chapter 7: Results: Disclosure Quality and Firm Characteristics
163
Table 7.12: Results on the Association between Disclosure Quality and Firm Characteristics.
Prior Studies Current Study
Firm
Characteristics Significant Not Significant
Size Singhvi and Desai (1971), Firth (1979), Imhoff (1992), Wallace et al. (1994), Wallace and Naser (1995), Riahi-Belkaoui (2001), Ali et al. (2003), Ahmed and Nicholls (1994) and Cooke (1989, 1991)
Malone et al. (1993) Pooled data: Positive and significant at p < 0.001
Ranked regression: Positive and significant at p < 0.001
Performance
Wallace and Naser (1995) and Ali et al. (2003)
nil
Pooled data: Profitability is positive and significant at p < 0.05. Price-earnings ratio is positive and significant at p < 0.05. Ranked regression: Ranked PE is positive and significant at p < 0.001
Type of firm in the industries
n.a.
n.a.
Not significant in any of the analyses
Auditor
Singhvi and Desai (1971), Ahmed and Nicholls (1994) and Wallace and Naser (1995)
Firth (1979), Malone at al. (1993), Wallace et al. (1994) and Ali et al. (2003).
Not significant in any of the analyses
Market-to-book ratio
n.a.
Eng and Mak (2003)
Pooled: Negative and significant at p < 0.001 Ranked regression: Not significant
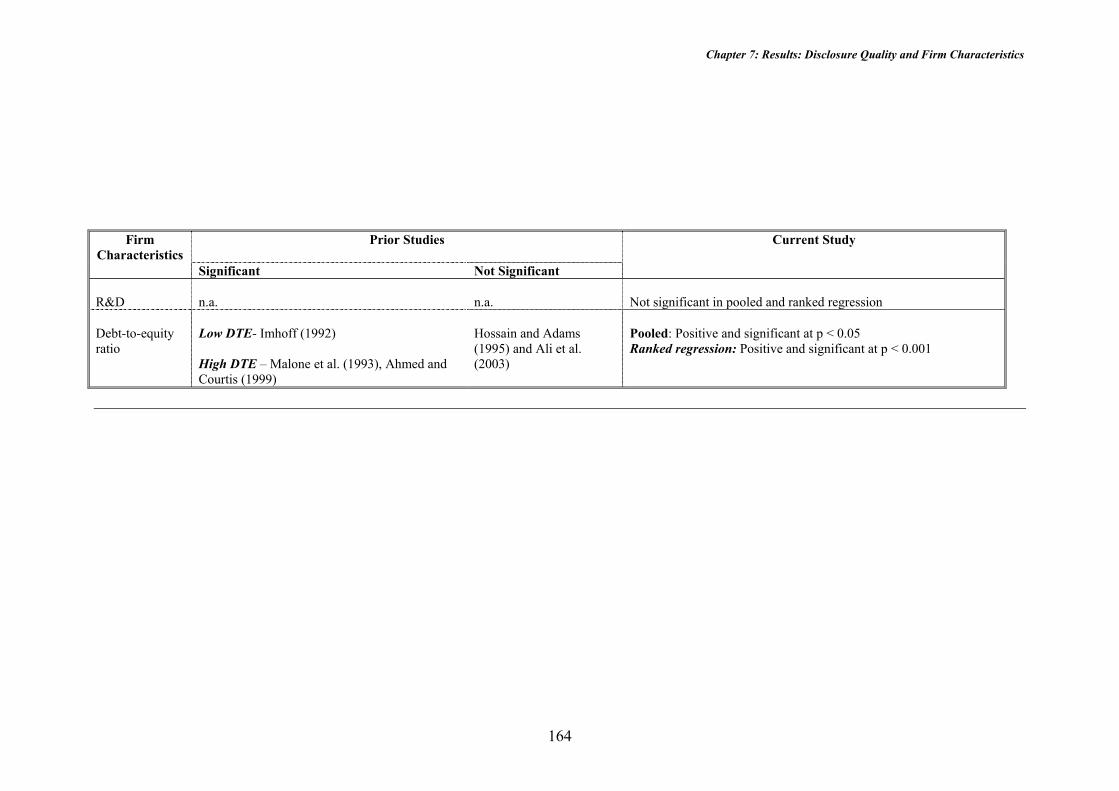
Chapter 7: Results: Disclosure Quality and Firm Characteristics
164
Prior Studies Current Study
Firm Characteristics
Significant Not Significant R&D
n.a.
n.a.
Not significant in pooled and ranked regression
Debt-to-equity ratio
Low DTE- Imhoff (1992) High DTE – Malone et al. (1993), Ahmed and Courtis (1999)
Hossain and Adams (1995) and Ali et al. (2003)
Pooled: Positive and significant at p < 0.05 Ranked regression: Positive and significant at p < 0.001
Chapter 7: Results: Disclosure Quality and Firm Characteristics
165
Table 7.12 indicates that size, performance (represented by profitability and PE ratio)
and leverage are positively and significantly related to disclosure quality of derivative
instruments. Market-to-book ratio is negatively and significantly related to disclosure
quality. Large firms are expected to provide transparent information to reduce
political costs (Cooke, 1989). As the majority of large firms in the extractive
industries use derivatives, and are exposed to various risks, providing transparent
information (by complying with the AASB 1033 requirement) assists investors to
better understand the risks attached to the instruments. Furthermore, large firms may
incur a lower cost of accumulating information and therefore, are able to provide
detailed information about derivative instruments.
Similar to Wallace and Naser (1995) and Ali et al. (2003), the current study provides
evidence that profitability and the PE ratio are positively and significantly related to
high quality derivative information. By providing detailed derivative information,
high performance firms indicate the positive effects of derivative instruments on
improving their net income. As high quality information will lead to higher share
prices (Miller and Bahnson, 2002), this will boost management compensation
(Wallace et al., 1995) such as a higher salary or maximisation of their bonus.
Furthermore, as high profitability firms are subject to political and monitoring costs,
providing detailed information will limit these costs. These firms also have higher
disclosure levels since they have the resources to pay the cost of increased disclosure.
Two of the control variables used in this study are significantly related to the
disclosure quality of derivative information. These are market-to-book and debt-to-
equity ratios. However, market-to-book ratio is negatively related to disclosure
Chapter 7: Results: Disclosure Quality and Firm Characteristics
166
quality. The results indicate that high growth firms tend to withhold some information
about derivatives. This will reduce the information about the risk attached to the
instruments, enabling them to remain competitive. This study found that debt-to-
equity ratio is positive and significantly related to disclosure quality. This result is
consistent with Malone et al. (1993).
However, only size and profitability are significant in the average of four years’ data
analysis (Table B 1 Appendix B). The significant results for the pooled data might be
influenced by a particular year. The year-by-year analysis presented in Table B 1
Appendix B indicates that size is significant in 2000 and 2001, and profitability is
only significant in 2000. That may be due to the reaction over the re-issuance of
AASB 1033 in 199977. As larger firms and firms with higher profitability may be
subject to political costs and monitoring costs, they may provide more transparent
information, especially immediately after the issuance of accounting pronouncements.
Since none of these variables are significant in 1998 and 1999, this suggests that the
results in Table 7.8 might be influenced by a particular year (Lang and Lundholm,
1993). Similar results for the estimation without the influential observations (outliers)
on each procedure are documented. These are presented in Table E 1 Appendix E.
7.6 Summary The quality of derivative disclosures among firms in the extractive industries has
increased since the accounting standard AASB 1033 Presentation and Disclosure of
Financial Instruments was applicable. However, firms still use discretion in
77 The results for year-by-year and average four year analyses are presented in Appendix B.
Chapter 7: Results: Disclosure Quality and Firm Characteristics
167
disclosing derivative information, especially in relation to net fair value. What is
concerning is that the majority of firms provide less than full information (50-99%).
Kothari (2000) indicates that regulators need to use their enforcement power to ensure
better compliance. Overall, the multivariate analyses indicate that larger firms tend to
provide more transparent derivative information within the extractive industries.
These findings hold for both the ranked regression technique and the average of four
years’ data (Appendix B). Also significantly related to derivative disclosure quality
are price-earnings and debt-to-equity ratios (leverage). Similar results are obtained for
each procedure using estimation without the influential observations (outliers –
Appendix E). Chapter 8 provides evidence of the association between the quality of
derivative disclosures and share prices and the value relevance of hedge transactions
and net fair value information in particular, the unrealised gain or loss of financial
instruments (URGL) and off-balance sheet derivative financial instruments (OBDI).
Chapter 8: Results: Value Relevance of Derivative Disclosures
168
CHAPTER 8 RESULTS: VALUE RELEVANCE OF DERIVATIVE DISCLOSURES
This chapter presents the results on the association between the market value of firms
and derivative information, such as hedge transactions and net fair value. The results
indicate that in addition to the significance of the book value of equity, market
participants regard: a) the disclosure quality of derivative information as value
relevant, b) hedge information and risk information components are value relevant, c)
qualitative information is as important as quantitative information, d) subject to the
model specification, the net fair value of financial instruments is value relevant and e)
the incremental explanatory power of net fair value and the unrealised gain or loss of
financial instruments beyond book value of financial and non-financial instruments
and earnings valued at historical cost is very low.
The remaining sections of this chapter are organised as follows. Section 8.1 discusses
the diagnostic tests undertaken. Multiple regression results on pooled data are
discussed in section 8.2. Section 8.3 presents the results on the incremental
explanatory power of the net fair value and unrealised gain or loss of financial
instruments. Section 8.4 discusses the results and section 8.5 summarises the chapter.

Chapter 8: Results: Value Relevance of Derivative Disclosures
169
8.1 Diagnostic Tests
Several diagnostic tests, as explained in chapter 7, are performed on each model to
ensure the validity of the results. These tests for are normality, autocorrelation,
heteroscedasticity and multicollinearity.
8.1.1 Normality Tests
The normality tests using Jarque-Bera statistics and graphical analysis, as discussed in
chapter 7 (section 7.1.1), are performed on the residuals of all models. Table 8.1
below presents statistics on skewness, kurtosis and Jarque-Bera for all models. The
table indicates that six of the models (equations 6.3, 6.6, 6.9, 6.10, 6.11 and 6.12)
experience negative skewness and equation 6.4 experiences positive skewness. Table
8.1 indicates that the kurtosis test statistics for all models is less than 3, with the
highest kurtosis being 2.9669 for equation 6.11 and the lowest being 2.4557 for
equation 6.12. The probability of the Jarque-Bera statistics indicates that the series is
normally distributed.
Table 8.1:Normality Test of Value Relevance Models
Equation Skewness Kurtosis Jarque-Bera Stat. Prob 6.3 -0.1001 2.7932 0.8734 0.6462 6.4 0.0218 2.7566 0.6445 0.7245 6.6 -0. 0274 2.5640 2.0356 0.3614 6.9 -0.0495 2.7409 0.8109 0.6667 6.10 -0.0997 2.7137 1.2835 0.5264 6.11 -0.0588 2.9669 0.1574 0.9243 6.12 -0.0872 2.4557 3.4430 0.1788
Chapter 8: Results: Value Relevance of Derivative Disclosures
170
8.1.2 Autocorrelation Tests
Autocorrelation is unlikely to be a problem for all the equations. If there is no serial
correlation, the Durbin-Watson statistic (d) will be around 2. A d value below 2
indicates a positive correlation and a value between 2 and 4 indicates a negative
correlation. The closer a d value is to 2 provides more evidence of the absence of
autocorrelation78. The Durbin-Watson statistics for equations 6.3 to 6.12 are within
the range of 1.8514 (equation 6.4) and 2.1015 (equation 6.10). However, due to the
limitations of Durbin-Watson statistics, the Breusch-Godfrey serial correlation LM
tests were also performed. The test results indicate that autocorrelation is not a major
concern for all equations as the probability estimate is not significant.
8.1.3 Heteroscedasticity Tests
White’s heteroscedasticity test (White, 1980), reported by Eviews 4.0 statistical
package, indicates that heteroscedasticity does exists in the value relevance models.
The null hypothesis of homoscedasticity is rejected at p < 0.001 for equations 6.3 to
6.11. Therefore, White’s heteroscedasticity-corrected regression was performed on
those equations. While other procedures fail to overcome heteroscedasticity, White’s
heteroscedasticity-corrected regression produces adjusted standard errors of the
estimated regression coefficients to allow for correct statistical inferences to be
drawn.
78 Detailed discussion is in subsection 7.1.2.
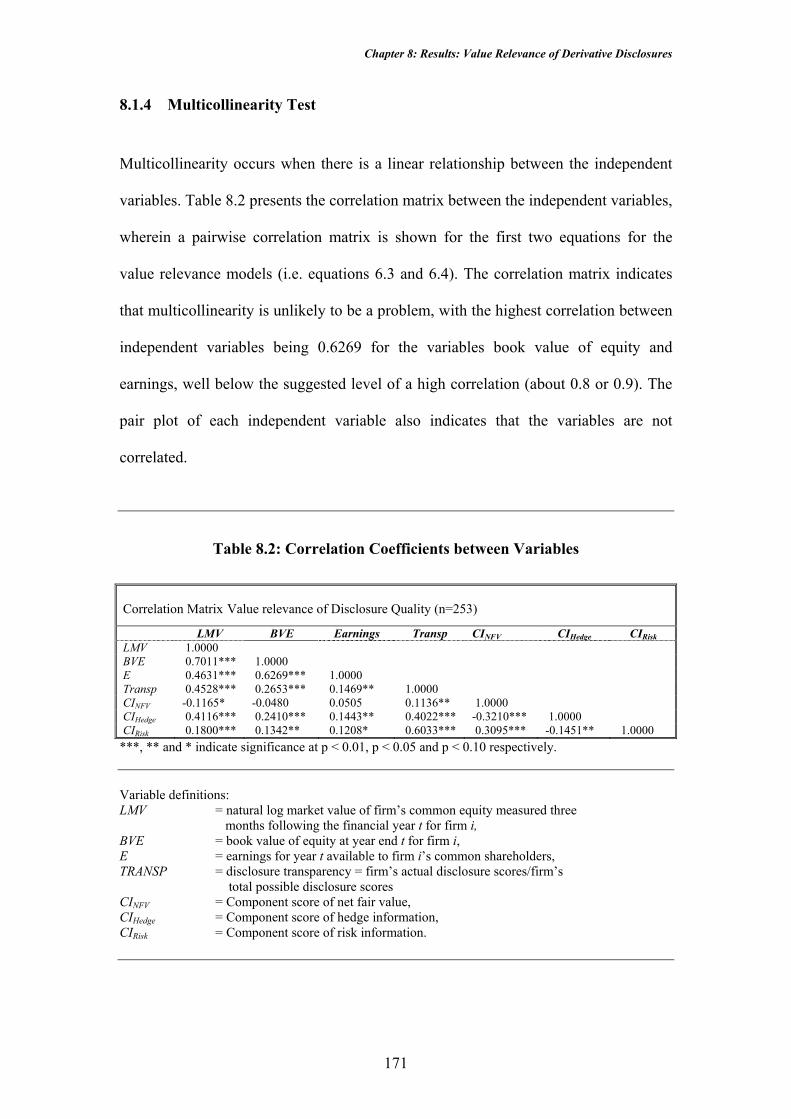
Chapter 8: Results: Value Relevance of Derivative Disclosures
171
8.1.4 Multicollinearity Test
Multicollinearity occurs when there is a linear relationship between the independent
variables. Table 8.2 presents the correlation matrix between the independent variables,
wherein a pairwise correlation matrix is shown for the first two equations for the
value relevance models (i.e. equations 6.3 and 6.4). The correlation matrix indicates
that multicollinearity is unlikely to be a problem, with the highest correlation between
independent variables being 0.6269 for the variables book value of equity and
earnings, well below the suggested level of a high correlation (about 0.8 or 0.9). The
pair plot of each independent variable also indicates that the variables are not
correlated.
Table 8.2: Correlation Coefficients between Variables Correlation Matrix Value relevance of Disclosure Quality (n=253)
LMV BVE Earnings Transp CINFV CIHedge CIRisk LMV 1.0000 BVE 0.7011*** 1.0000 E 0.4631*** 0.6269*** 1.0000 Transp 0.4528*** 0.2653*** 0.1469** 1.0000 CINFV -0.1165* -0.0480 0.0505 0.1136** 1.0000 CIHedge 0.4116*** 0.2410*** 0.1443** 0.4022*** -0.3210*** 1.0000 CIRisk 0.1800*** 0.1342** 0.1208* 0.6033*** 0.3095*** -0.1451** 1.0000
***, ** and * indicate significance at p < 0.01, p < 0.05 and p < 0.10 respectively.
Variable definitions: LMV = natural log market value of firm’s common equity measured three
months following the financial year t for firm i, BVE = book value of equity at year end t for firm i, E = earnings for year t available to firm i’s common shareholders, TRANSP = disclosure transparency = firm’s actual disclosure scores/firm’s
total possible disclosure scores CINFV = Component score of net fair value, CIHedge = Component score of hedge information, CIRisk = Component score of risk information.
Chapter 8: Results: Value Relevance of Derivative Disclosures
172
Multicollinearity does exist for the rest of the value relevance models (equation 6.6 to
equation 6.12). The presence of multicollinearity in these models is revealed in Table
8.3 through to Table 8.5. Table 8.3 presents a correlation matrix for equation 6.6.
Multicollinearity may cause a problem for this model with the highest correlation of
0.9822, between URGL and OBDI.
Several remedial techniques have been suggested for situations such as this, including
dropping the variables, combining the cross-sectional and time series data (pooling
the data) and the use of transformed variables (Gujarati, 2003, p.364). However, the
first and third procedures suggested above are not appropriate as dropping the highly
correlated variable may diminish the objective of this study to examine the value
relevance of each independent variable over the other. Therefore, this study is based
on pooled data incorporating the second suggested technique. Nevertheless, some
researchers such as Ahmad (2000), Bernard (1987) and Board, Rees and Sutcliffe
(1992) acknowledge that multicollinearity does exist ‘naturally’ in capital markets
research, which use accounting numbers as explanatory variables, as the numbers are
‘naturally’ interrelated. In the face of the above arguments the estimation was
conducted with the existence of multicollinearity. In keeping with prior research the
models are tested excluding the highly correlated variables and the results compared
to the models with multicollinearity issues.
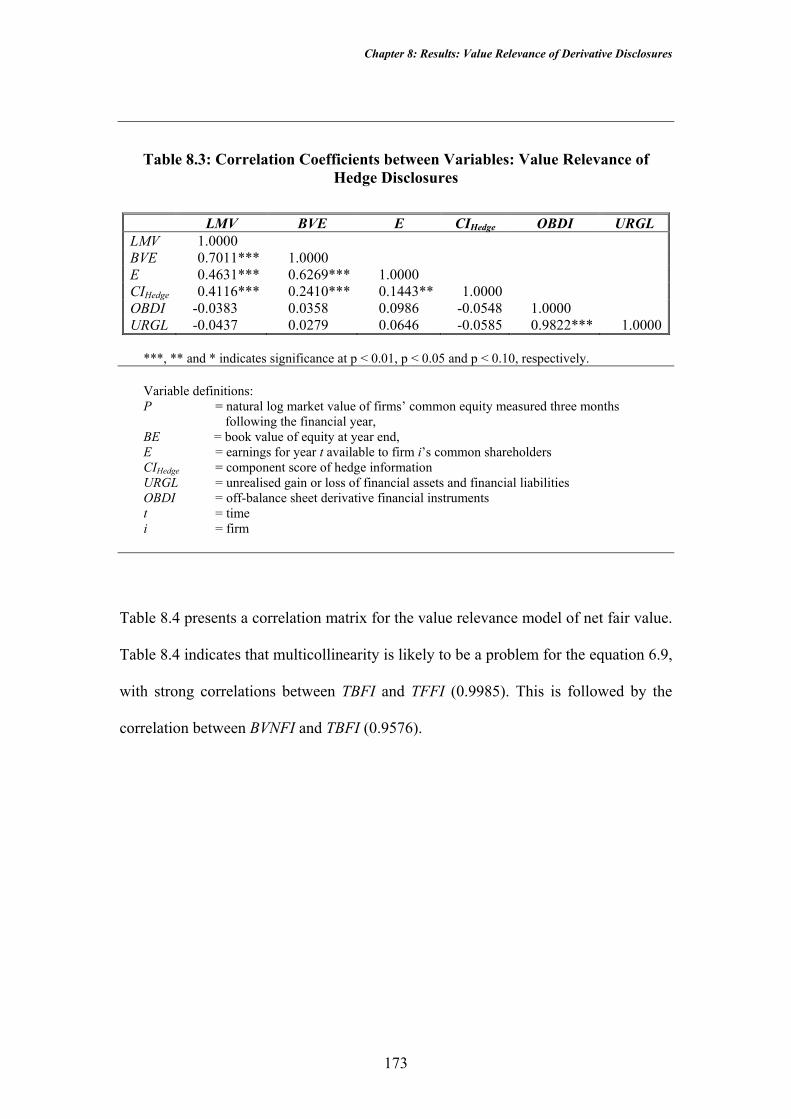
Chapter 8: Results: Value Relevance of Derivative Disclosures
173
Table 8.3: Correlation Coefficients between Variables: Value Relevance of Hedge Disclosures
LMV BVE E CIHedge OBDI URGL
LMV 1.0000 BVE 0.7011*** 1.0000 E 0.4631*** 0.6269*** 1.0000 CIHedge 0.4116*** 0.2410*** 0.1443** 1.0000 OBDI -0.0383 0.0358 0.0986 -0.0548 1.0000 URGL -0.0437 0.0279 0.0646 -0.0585 0.9822*** 1.0000
***, ** and * indicates significance at p < 0.01, p < 0.05 and p < 0.10, respectively.
Variable definitions: P = natural log market value of firms’ common equity measured three months
following the financial year, BE = book value of equity at year end, E = earnings for year t available to firm i’s common shareholders CIHedge = component score of hedge information URGL = unrealised gain or loss of financial assets and financial liabilities OBDI = off-balance sheet derivative financial instruments t = time i = firm
Table 8.4 presents a correlation matrix for the value relevance model of net fair value.
Table 8.4 indicates that multicollinearity is likely to be a problem for the equation 6.9,
with strong correlations between TBFI and TFFI (0.9985). This is followed by the
correlation between BVNFI and TBFI (0.9576).
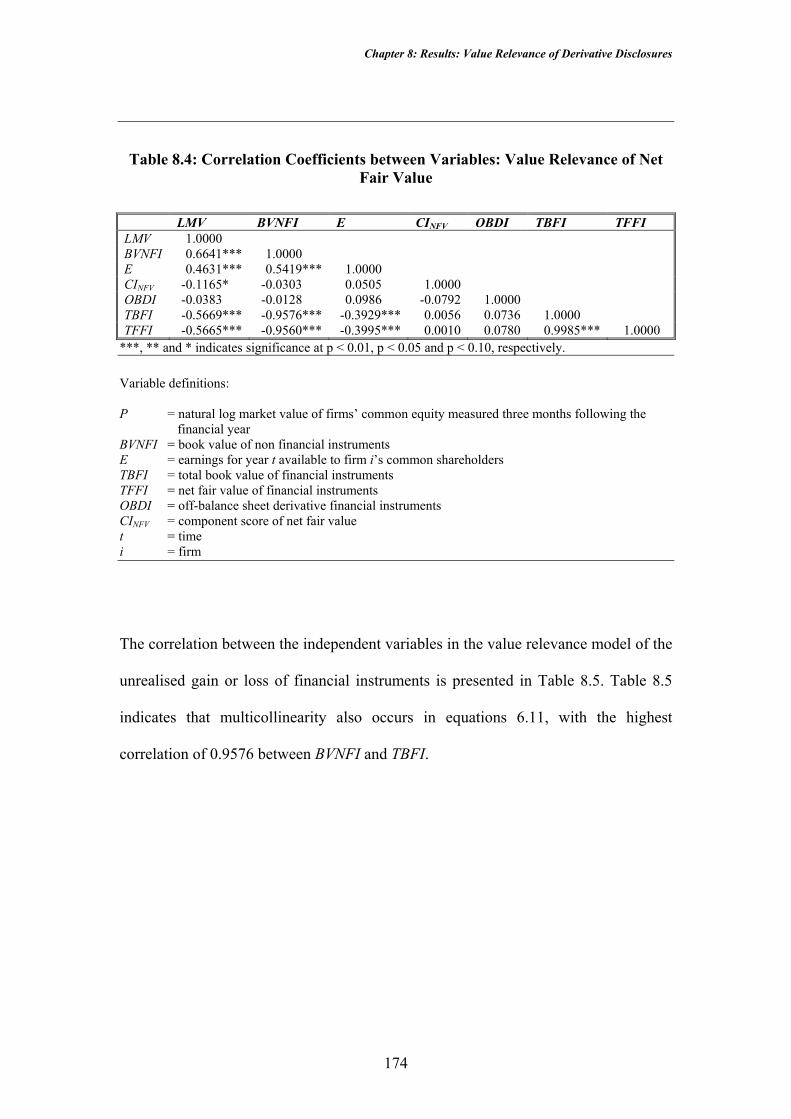
Chapter 8: Results: Value Relevance of Derivative Disclosures
174
Table 8.4: Correlation Coefficients between Variables: Value Relevance of Net Fair Value
LMV BVNFI E CINFV OBDI TBFI TFFI LMV 1.0000 BVNFI 0.6641*** 1.0000 E 0.4631*** 0.5419*** 1.0000 CINFV -0.1165* -0.0303 0.0505 1.0000 OBDI -0.0383 -0.0128 0.0986 -0.0792 1.0000 TBFI -0.5669*** -0.9576*** -0.3929*** 0.0056 0.0736 1.0000 TFFI -0.5665*** -0.9560*** -0.3995*** 0.0010 0.0780 0.9985*** 1.0000
***, ** and * indicates significance at p < 0.01, p < 0.05 and p < 0.10, respectively. Variable definitions: P = natural log market value of firms’ common equity measured three months following the
financial year BVNFI = book value of non financial instruments E = earnings for year t available to firm i’s common shareholders TBFI = total book value of financial instruments TFFI = net fair value of financial instruments OBDI = off-balance sheet derivative financial instruments CINFV = component score of net fair value t = time i = firm
The correlation between the independent variables in the value relevance model of the
unrealised gain or loss of financial instruments is presented in Table 8.5. Table 8.5
indicates that multicollinearity also occurs in equations 6.11, with the highest
correlation of 0.9576 between BVNFI and TBFI.

Chapter 8: Results: Value Relevance of Derivative Disclosures
175
Table 8.5: Correlation Coefficients between Variables: Value Relevance of Unrealised Gain or Loss of Financial Instruments
LMV BVNFI E CINFV OBDI TBFI DIFFA DIFFL
LMV 1.0000 BVNFI 0.6641*** 1.0000 E 0.4631*** 0.5419*** 1.0000 CINFV -0.1165* -0.0303 0.0505 1.0000 OBDI -0.0383 -0.0128 0.0986 -0.0792 1.0000 TBFI -0.5669*** -0.9576*** -0.3929*** 0.0056 0.0736 1.0000 DIFFA -0.2553*** -0.3130*** -0.4285*** -0.0356 -0.0811 0.1891*** 1.0000 DIFFL -0.2251*** -0.2752*** -0.2635*** 0.0702 -0.1999*** 0.1350** 0.2287*** 1.0000
***, ** and * indicates significance at p < 0.01, p < 0.05 and p < 0.10, respectively. Variable definitions: P = natural log market value of firms’ common equity measured three months following the financial year BVNFI = book value of non financial instruments E = earnings for year t available to firm i’s common shareholders TBFI = total book value of financial instruments OBDI = off-balance sheet derivative financial instruments DIFFA = difference between net fair value of financial assets and book value of financial assets. DIFFL = difference between net fair value of financial liabilities and book value of financial liabilities. CINFV = component score of net fair value t = time i = firm
Chapter 8: Results: Value Relevance of Derivative Disclosures
176
8.2 Multiple Regression Results
8.2.1 Disclosure Quality of Derivative Information and the Market Value of Firms
Research questions 5(a) and 5(b) explore the association between the disclosure
quality of derivative information and firms’ share prices. To explore this research
question, two models are developed as specified in equations 6.3 and 6.4. Since both
models are subject to heteroscedasticity, White’s heteroscedasticity-correction is
employed. The results of the regression estimates are reported in Table 8.6. Panel A
shows the results for the first model which estimates the association between the total
disclosure score and firm market value. Book value of equity and TRANSP or
disclosure quality are positive and significantly related to market value at p < 0.01.
These results are based on the estimation without the influential variables because of a
large difference between the book value of equity and earnings between these firms
and the rest of the companies.79
The second model identifies the components of the disclosure index that are the most
valuable to users. Results are reported in Panel B of Table 8.6, which shows that the
book value of equity, the component score of hedge information and the component
score of risk information are positive and significant at p < 0.01. The adjusted R2 of
this model is 56.56%, which is higher than the adjusted R2 of the model presented in
panel A.
79 Estimation on the full sample and winsorizing at 5% provides similar results, where the book value of earnings and transparency are positive and significantly related with market value at p < 0.001. Table F 1 of Appendix F presents the results for the full sample.

Chapter 8: Results: Value Relevance of Derivative Disclosures
177
Table 8.6: The Association between Information Quality of Derivative Disclosures and the Market Value of Firms (n=253)1
Variables Coefficient Std Error T-statistics Prob
Panel A : ititititti TRANSPEBVP εαααα ++++= 3210 (equation 6.3) BV 2.14E-09 2.97E-10 7.1849 0.0000*** E 8.45E-10 1.02E-09 0.8301 0.4073 TRANSP 5.7676 0.8191 7.0415 0.0000*** Constant 12.2883 0.7176 17.1231 0.0000 Adj R2 = 0.5643 DW Statistics = 1.8915 F-statistics = 109.7815 Prob. = 0.0000 Panel B : Pit = α0 + α1BVit+ α2Eit + α3CINFV,it + α4CIHedge,it + α5CIRisk, it+εit (equation 6.4)
BV 2.12E-09 2.71E-10 7.7973 0.0000*** E 6.95E-10 9.33E-10 0.7443 0.4574 CINFV -2.0917 1.8918 -1.1057 0.2699 CIHedge 6.2335 1.0363 6.0151 0.0000*** CIRisk 3.7802 1.1417 3.3111 0.0011*** Constant 15.9886 0.4593 34.8115 0.0000 Adj R2 = 0.5656 DW Statistics = 1.8514 F-statistics = 66.6310 Prob. = 0.0000 *** indicates significance at p < 0.01 1 Results are based on White’s heteroscedasticity-corrected regression Variable definitions: P = natural log market value of firms’ common equity measured three
months following the financial year BV = book value of equity at year end E = earnings for year available to firm’s common shareholders TRANSP = disclosure transparency = firm’s actual disclosure scores/firm’s
total possible disclosure scores CIHedge = component score of hedge information CINFV = component score of net fair value CIRisk = component score of risk information i = firm t = year
Industry specific factors might influence the results on earnings in both models. Firms
in the extractive industries, especially exploration companies, may incur substantial
losses (Henderson and Peirson, 2000, p. 682) and therefore, market participants may
ignore current earnings in firm valuation. This is because the current level of earnings
Chapter 8: Results: Value Relevance of Derivative Disclosures
178
is unlikely to be a useful indication of future performance. Therefore, in this case
investors tend to rely on book values rather than earnings (Collins, Pincus and Xie,
1999). Moreover, within the extractive industries, negative earnings may be more
related to small firms. These firms potentially face a greater likelihood of
encountering financial distress or failure than do larger firms in the industries (Colins,
Maydew and Weiss, 1997).
To investigate this, the sample was ranked into small and large firms based on the top
and bottom 25% of total assets80. The sample leaves out the middle size firms. The
models were re-estimated on 128 firms/years, after eliminating two outliers, one for
each group of the sample (small and large firms). This is because the book value of
equity of these firms is larger than the rest of the sample. The results of equation 6.3
are similar to those in Panel A, Table 8.6 (see Table F 2 in Appendix F). However, the
component score of the net fair value information is no longer significant (Panel B
Table F 2 in Appendix F). In addition to the above procedure, separate analysis on
each group of firms (firms in the top and bottom 25% based on total assets) indicates
that earnings is significant for the bottom 25% firms, but not for the top 25% firms
(Table F 3 in Appendix F). However, for the large firms, the book value of equity and
the component score of risk information are positive and significant at p < 0.001, and
the component score of hedge information and net fair value are negative and
significant at p < 0.10.
80 The range of total assets for the small firms is between A$10,694.72 to A$172,162.00, and A$23,888,934.00 to A$8,335,501,500.00 for the large firms.

Chapter 8: Results: Value Relevance of Derivative Disclosures
179
8.2.2 Value Relevance of Hedge Disclosures Research questions 6 and 7 extend research questions 5(a) and (b), by focusing to the
specific information required by AASB 1033. These research questions raise the issue
of the importance of qualitative/quantitative information and recognised/unrecognised
information. Prior studies provide evidence that the disclosed items, especially the
unrealised gain or loss and off-balance sheet derivative financial instruments (e.g.
Davis-Friday et al., 1999 and Pfeiffer, 1998) are not considered as important in firm
valuation. Therefore, to explore these research questions the component score of
hedge information is included in the Ohlson model. This is specified in equation 6.5.
Table 8.7 reports the multiple regression results on the association between market
value and the disclosure of hedge information and unrealised gain or loss of financial
instruments as required, based on the main model of the value relevance of hedge
disclosure. The results on the multiple regression analysis indicate that the book value
of equity and hedge information is significant at p < 0.01 (Panel A).
Given the significance of hedge information this provides an opportunity to explore
whether detailed information disclosed in annual reports is valued as important. This
is specified in equation 6.6. Results are presented in Panel B Table 8.7. As in Panel A
Table 8.7, the book value of equity and hedge information are significant at p < 0.01.
However, Panel B indicates that none of the disclosed items (unrealised gain or loss of
financial instruments and off-balance sheet derivative financial instruments) is
significant. The adjusted R2 for Panel B is 54.87%.

Chapter 8: Results: Value Relevance of Derivative Disclosures
180
Table 8.7: The Association between Hedge Disclosure and Market Value of the Firms (n=253)1
Variables Coefficient Std Error T-statistics Prob Panel A : Pit = α0 + α1BVit+ α2Eit + α3CIHedge,it + εit (equation 6.5) BV 2.2E-09 2.83E-10 7.7802 0.0000*** E 7.34E-10 9.79E-10 0.7498 0.4541 CIHedge 5.9655 0.9118 6.5424 0.0000*** Constant 16.3436 0.1686 96.9593 0.0000 Adj R2 = 0.5551 Durbin Watson = 1.8949 F-statistics = 103.5550 Prob 0.0000 Panel B: Pit = α0 + α1BVit+ α2Eit + α3CIHedge,it + α4OBDIit + α5URGL it+ εit (equation 6.6) BV 2.19E-09 2.79E-10 7.8558 0.0000*** E 8.72E-10 1.02E-09 0.8557 0.3930 CIHedge 5.8895 0.9191 6.4078 0.0000*** OBDI -1.38E-09 4.01E-09 -0.3431 0.7319 URGL 5.14E-10 3.95E-09 0.1301 0.8966 Constant 16.3491 0.1693 96.5921 0.0000 Adj R2 = 0.5487 Durbin Watson = 1.8876 F-statistics = 62.2852 Prob 0.0000
*** indicates significance at p < 0.01 1 Results are based on White’s Heterosdecasticity Corrected Regression Variable definitions: P = natural log market value of firms’ common equity measured three
months following the financial year, BV = book value of equity at year end, E = earnings for year t available to firm i’s common shareholders CIHedge = component score of hedge information URGL = unrealised gain or loss of financial assets and financial liabilities OBDI = off-balance sheet derivative financial instruments t = time i = firm
8.2.3 Value Relevance of Net Fair Value Disclosures
Research question 8 raises the issue of the importance of net fair value information in
firm valuation. Given that net fair value is relevant for decision-making, the models
were developed in such a way as to provide evidence on the association between the
market value of the firm and net fair value information, and to provide evidence on
the incremental explanatory power of net fair value beyond that of book value. To
Chapter 8: Results: Value Relevance of Derivative Disclosures
181
explore this issue, the component score of net fair value information is included in the
Ohlson model as in equation 6.7. The results indicate that the book value of equity is
positive and significant at p < 0.001 and the net fair value information is negative p <
0.05. The adjusted R2 for this model is 49.39%.
As net fair value information is significant, the next step is to estimate the model that
separates the book value of financial instruments from the book value of non-financial
instruments. This is specified in equation 6.8. The results of these estimations are
presented in Panel A Table 8.8. Panel A indicates that both the book value of non-
financial instruments and the book value of financial instruments are positive and
significant at p < 0.001. However, the net fair value information is negative and
marginally significant at p < 0.10. The adjusted R2 for this model is 49.64%, which is
not overly different from the adjusted R2 of equation 6.7. This suggests that the
estimation of net fair value information is unaffected by the separation of financial
and non-financial instruments. However, separating financial and non-financial
instruments will provide a better understanding of the value relevance of one class
over the other.
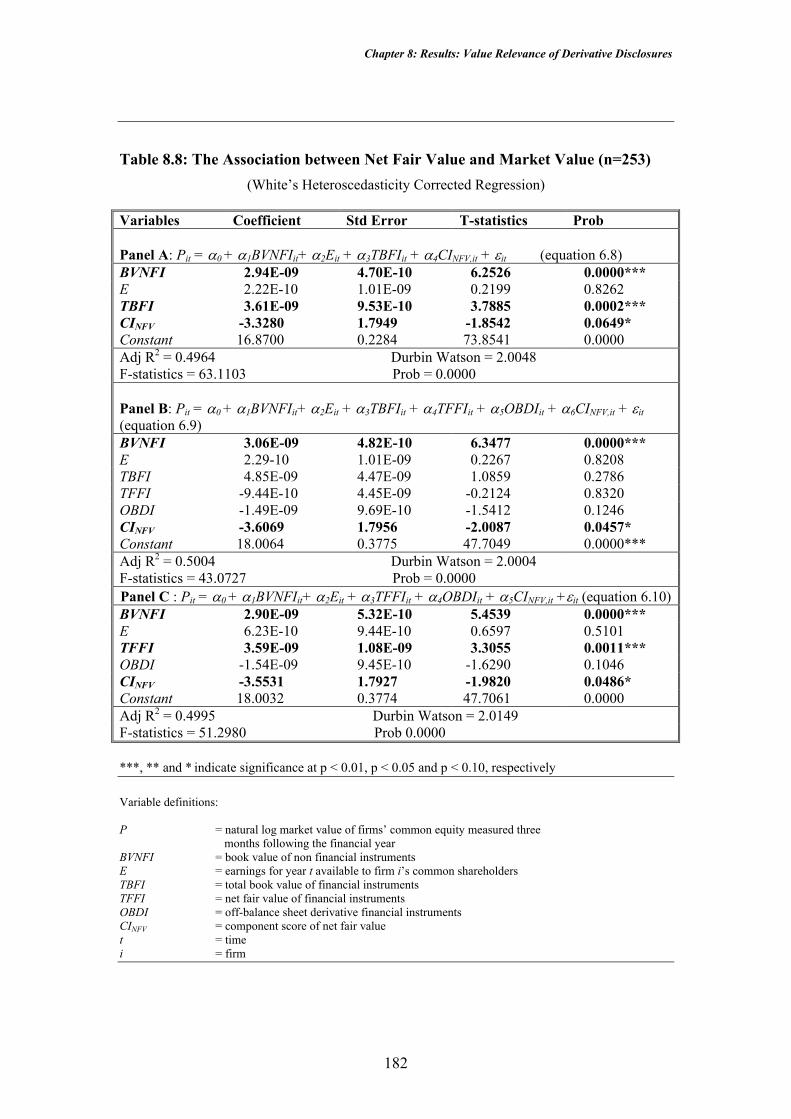
Chapter 8: Results: Value Relevance of Derivative Disclosures
182
Table 8.8: The Association between Net Fair Value and Market Value (n=253) (White’s Heteroscedasticity Corrected Regression)
Variables Coefficient Std Error T-statistics Prob
Panel A: Pit = α0 + α1BVNFIit+ α2Eit + α3TBFIit + α4CINFV,it + εit (equation 6.8) BVNFI 2.94E-09 4.70E-10 6.2526 0.0000*** E 2.22E-10 1.01E-09 0.2199 0.8262 TBFI 3.61E-09 9.53E-10 3.7885 0.0002*** CINFV -3.3280 1.7949 -1.8542 0.0649* Constant 16.8700 0.2284 73.8541 0.0000 Adj R2 = 0.4964 Durbin Watson = 2.0048 F-statistics = 63.1103 Prob = 0.0000
Panel B: Pit = α0 + α1BVNFIit+ α2Eit + α3TBFIit + α4TFFIit + α5OBDIit + α6CINFV,it + εit (equation 6.9) BVNFI 3.06E-09 4.82E-10 6.3477 0.0000*** E 2.29-10 1.01E-09 0.2267 0.8208 TBFI 4.85E-09 4.47E-09 1.0859 0.2786 TFFI -9.44E-10 4.45E-09 -0.2124 0.8320 OBDI -1.49E-09 9.69E-10 -1.5412 0.1246 CINFV -3.6069 1.7956 -2.0087 0.0457* Constant 18.0064 0.3775 47.7049 0.0000*** Adj R2 = 0.5004 Durbin Watson = 2.0004 F-statistics = 43.0727 Prob = 0.0000 Panel C : Pit = α0 + α1BVNFIit+ α2Eit + α3TFFIit + α4OBDIit + α5CINFV,it +εit (equation 6.10)BVNFI 2.90E-09 5.32E-10 5.4539 0.0000*** E 6.23E-10 9.44E-10 0.6597 0.5101 TFFI 3.59E-09 1.08E-09 3.3055 0.0011*** OBDI -1.54E-09 9.45E-10 -1.6290 0.1046 CINFV -3.5531 1.7927 -1.9820 0.0486* Constant 18.0032 0.3774 47.7061 0.0000 Adj R2 = 0.4995 Durbin Watson = 2.0149 F-statistics = 51.2980 Prob 0.0000
***, ** and * indicate significance at p < 0.01, p < 0.05 and p < 0.10, respectively Variable definitions: P = natural log market value of firms’ common equity measured three
months following the financial year BVNFI = book value of non financial instruments E = earnings for year t available to firm i’s common shareholders TBFI = total book value of financial instruments TFFI = net fair value of financial instruments OBDI = off-balance sheet derivative financial instruments CINFV = component score of net fair value t = time i = firm
Chapter 8: Results: Value Relevance of Derivative Disclosures
183
Panel B Table 8.8 provides evidence on the association between net fair value and the
market value of the firm based on the expanded Ohlson model. Panel B indicates that
the book value of non-financial instruments is positive and significantly related to
market value at p < 0.001. However, including net fair value of financial instruments
and OBDI leaded book value of financial instruments to be no longer significant. Also
significant is the component score of net fair value.
Since there is collinearity between TBFI and TFFI, the book value of financial
instruments was excluded from the model. Panel C indicates that dropping TBFI
results in TFFI being positive and significant at p < 0.001. CINFV is also significant at
p < 0.0581.82 The positive value of the net fair value of financial instruments indicates
that the incremental explanatory power of net fair value of financial instruments is
beyond that of the other independent variables included in the model (Barth, 1994;
Venkatachalam, 1996; Simko, 1999).
8.2.4 Value Relevance of the Unrealised Gain or Loss of Financial Instruments
Research question 8 raises the issue of the value relevance of the unrealised gain or
loss, which is measured as the difference between the net fair value and the carrying
value of financial instruments. Table 8.6 presents the multiple regression results on
the association between the unrealised gain or loss on financial assets, financial
liabilities, derivative instruments and the market value of the firm. Panel A Table 8.9
81 In re-estimating the equation by replacing BVNFI with TBFI, the results indicate that earnings and CINFV are significant at p < 0.01. However, the adjusted R2 is 39.68%, which is lower than the adjusted R2 presented in Panel C Table 8.8. Results presented in Panel C provide better results compared to the re-estimation results. 82 Results for year-by-year analysis presented in Table C 3 Appendix C indicate that OBDI is significant in 1999 to 2001. Also significant is TFFI in 1998 and 1999. However, CINFV is not significant in any year.

Chapter 8: Results: Value Relevance of Derivative Disclosures
184
indicates that BVNFI and TBFI are positively significantly related to market value at p
< 0.001. The primary interest of this study is the unrealised gain or loss on financial
assets (DIFFA), financial liabilities (DIFFL) and off-balance sheet derivative
financial instruments (OBDI). Panel A indicates that none of these variables are
significant. Nevertheless, CINFV is significant at p < 0.10. The results indicate that the
unrealised gain or loss on financial instruments is not regarded as value relevant.
Table 8.9: The Association between the Market Value of Firms and the Difference Between Net Fair Value and Book Value of Financial Instruments
(n=253)1
Variables Coefficient Std Error T-statistics Prob Panel A: Pit = α0 + α1BVNFIit+ α2Eit + α3TBFI + α4DIFFAit + α5DIFFLit +
α6OBDIit + α7CINFV,it + εit (equation 6.11) BVNFI 3.53E-09 6.52E-10 5.4103 0.0000*** E 2.14E-10 1.05E-09 0.2031 0.8392 TBFI 4.79E-09 1.28E-09 3.7287 0.0002*** DIFFA 5.54E-09 5.53E-09 1.0018 0.3174 DIFFL 8.69E-09 5.75E-09 1.5107 0.1322 CINFV -3.4493 1.7926 -1.9242 0.0555* OBDI -1.35E-09 1.02E-09 -1.3273 0.1856
Constant 17.9450 0.3816 47.0317 0.0000 Adj R2 = 0.5051 Durbin Watson = 1.9996 F-statistics = 37.7401 Prob = 0.0000 Panel B: Pit = α0 + α1BVNFIit+ α2Eit + α3DIFFAit + α4DIFFLit + α5OBDIit +
α6CINFV,it + εit (equation 6.12)
BVNFI 1.17E-09 1.77E-10 6.6101 0.0000*** E 2.74E-09 1.04E-09 2.6360 0.0089** DIFFA -1.47E-09 3.71E-09 -0.3959 0.6925 DIFFL -3.31E-09 5.11E-09 -0.6478 0.5177 CINFV -4.6758 1.8685 -2.5025 0.0130** OBDI -1.04E-09 1.03E-09 -1.0098 0.3136
Constant 18.3498 0.3852 47.6335 0.0000 Adj R2 = 0.4716 Durbin Watson = 1.9483 F-statistics = 36.5872 Prob = 0.0000
***, ** and * indicate significance at p < 0.01, p < 0.05 and p < 0.10, respectively. 1 Results are based on White’s heteroscedasticity-corrected regression. Variable definitions: P = natural log market value of firms’ common equity measured three
months following the financial year BVNFI = book value of non financial instruments E = earnings for year t available to firm i’s common shareholders TBFI = Total book value of financial instruments OBDI = off-balance sheet derivative financial instruments DIFFA = difference between net fair value of financial assets and book

Chapter 8: Results: Value Relevance of Derivative Disclosures
185
value of financial assets. DIFFL = difference between net fair value of financial liabilities and book
value of financial liabilities. CINFV = component score of net fair value t = time i = firm
Excluding the book value of financial instruments (TBFI) from equation 6.11 (as
specified in equation 6.12) resulted in earnings being significant at p < 0.01 and CINFV
significant at p < 0.05 (Panel B Table 8.9)83. These results indicate that the unrealised
gain or loss on financial assets and financial liabilities is not value relevant and does
not provide incremental explanatory power beyond other including variables (Barth,
1994; Venkatachalam, 1996; Simko, 1999).
83 In re-estimating the equation in Panel B by replacing BVNFI with TBFI, the results indicate that earnings, TBFI and CINFV are significant at p < 0.01. Also significant at p < 0.10 is DIFFL. However, the adjusted R2 is, 40.44%, which is lower than the adjusted R2 presented in Panel B Table 8.9.
Chapter 8: Results: Value Relevance of Derivative Disclosures
186
8.3 Incremental Explanatory Power of Net Fair Value and the Unrealised Gain or Loss of Financial Instruments
To examine the incremental explanatory power of net fair value and the unrealised
gain or loss of financial instruments, the adjusted R2 is examined. Table 8.10 and
Table 8.11 present the results on the adjusted R2 of equations 6.9, 6.11 and 6.13 to
6.15. The explanatory power of the book value of non-financial instruments and
earnings and the explanatory power of net fair value and the unrealised gain or loss on
financial instruments are reported in columns 3 and 4 respectively. The incremental
explanatory power of the book value of non-financial instruments and earnings valued
at historical cost beyond the net fair value and the unrealised gain or loss on financial
instruments are reported in column 5. The incremental explanatory power of net fair
value and the unrealised gain or loss on financial instruments beyond the book value
of non-financial instruments and earnings valued at historical cost are reported in
column 6.
Table 8.10 presents the adjusted R2s of equations 6.9, 6.13 and 6.14 for each year and
for the pooled data. Table 8.10 indicates that the incremental explanatory power of net
fair value above the book value of non-financial instruments and earnings (AdjR2nfv/h)
for the pooled data is very low; i.e. 0.80%, compared to the incremental explanatory
power of book value of non-financial instruments and earnings valued at historical
cost beyond the net fair value, (AdjR2h/nfv) which is 17.41%. Table 8.10 provides
evidence that the incremental explanatory power of the net fair value beyond the book
value of non-financial instruments and earnings at historical costs has increased.
However, the incremental explanatory power of the book value of non-financial
instruments and earnings valued at historical cost beyond the net fair value has

Chapter 8: Results: Value Relevance of Derivative Disclosures
187
reduced. Table 8.10 indicates that in 1998 the AdjR2nfv/h is 1.98% and this increases to
8.34% in 2001, and the AdjR2h/nfv reduces from 27.97% in 1998 to 8.61% in 2001.
Table 8.10: The Incremental Explanatory Power of Net Fair Value beyond the Book Value of Financial and Non-financial Instruments and Earnings Valued at
the Historical Cost
Pit = α0 + α1BVNFIit+ α2Eit + α3TBFI + α4TFFIit + α5OBDIit + α6CINFV,it +εit - AdjR2
h,nfv Pit = α0 + α1TFFIit + α2OBDIit + α3CINFV,it +εit - AdjR2
nfv Pit = α0 + α1BVNFIit+ α2Eit + α3TBFIit + εit - AdjR2
h AdjR2
h,nfv AdjR2h AdjR2
nfv AdjR2nfv/h AdjR2
h/nfv 1998 (n=62) 0.5041 0.4843 0.2244 0.0198 0.2797 1999 (n=63) 0.5616 0.5342 0.3563 0.0274 0.2053 2000 (n=64) 0.4810 0.4174 0.3477 0.0636 0.1333 2001 (n=64) 0.5109 0.4275 0.4248 0.0834 0.0861 Pooled data 0.5004 0.4924 0.3263 0.0080 0.1741
Variable definitions: P = natural log market value of firms’ common equity measured three
months following the financial year BVNFI = book value of non financial instruments E = earnings for year t available to firm i’s common shareholders TBFI = total book value of financial instruments OBDI = off-balance sheet derivative financial instruments TFFI = net fair value of financial instruments CINFV = component score of net fair value t = time i = firm AdjR2
h,nfv = the total explanatory power of book value of non-financial instruments and earnings at historical cost and net fair value
AdjR2h = the explanatory power of book value of non-financial instruments and earnings valued at
historical costs AdjR2
nfv = the explanatory power of net fair value AdjR2
nfv/h = the incremental explanatory power of net fair value AdjR2
h/nfv = the incremental explanatory power of book value of non-financial instruments and earnings valued at historical costs

Chapter 8: Results: Value Relevance of Derivative Disclosures
188
The incremental explanatory power of the unrealised gain or loss of financial
instruments beyond the book value of non-financial instruments and earnings valued
at historical cost (AdjR2urgl/h) is also very low compared to the incremental
explanatory power of the book value of non-financial instruments and earnings valued
at historical cost. Table 8.11 indicates that the AdjR2urgl/h for the pooled data is 1.26%
compared to 40.19% for AdjR2h/urgl. Consistent with the results for net fair value, the
incremental explanatory power of URGL beyond the book value of non-financial
instruments and earnings valued at historical cost increases from 8.03% (1998) to
11.84% (2001). The incremental explanatory power of the book value of non-financial
instruments and earnings valued at historical cost beyond the net fair value decreases
from 32.86% (1998) to 12.82% (2001).
Table 8.11: The Incremental Explanatory Power of Unrealised Gain or Loss of Financial Instruments Beyond the Book Value of Financial and Non-financial
Instruments and Earnings Valued at the Historical Cost (n=253)
Pit = α0 + α1BVNFIit+ α2Eit + α3TBFI + α4DIFFAit + α5DIFFLit + α6OBDIit + α7CINFV,it
+ εit - AdjR2h,urgl
Pit = α0 + α1DIFFAit + α2DIFFLit + α3OBDIit + α4CINFV,it + εit - AdjR2
urgl Pit = α0 + α1BVNFIit+ α2Eit + α3TBFIit + εit - AdjR2
h AdjR2
h,urgl AdjR2h AdjR2
urgl AdjR2urgl/h AdjR2
h/urgl 1998 0.5646 0.4843 0.2360 0.0803 0.3286 1999 0.6753 0.5342 0.3684 0.1411 0.3069 2000 0.5091 0.4174 0.3611 0.0917 0.1480 2001 0.5459 0.4275 0.4177 0.1184 0.1282 Pooled data 0.5050 0.4924 0.1031 0.0126 0.4019
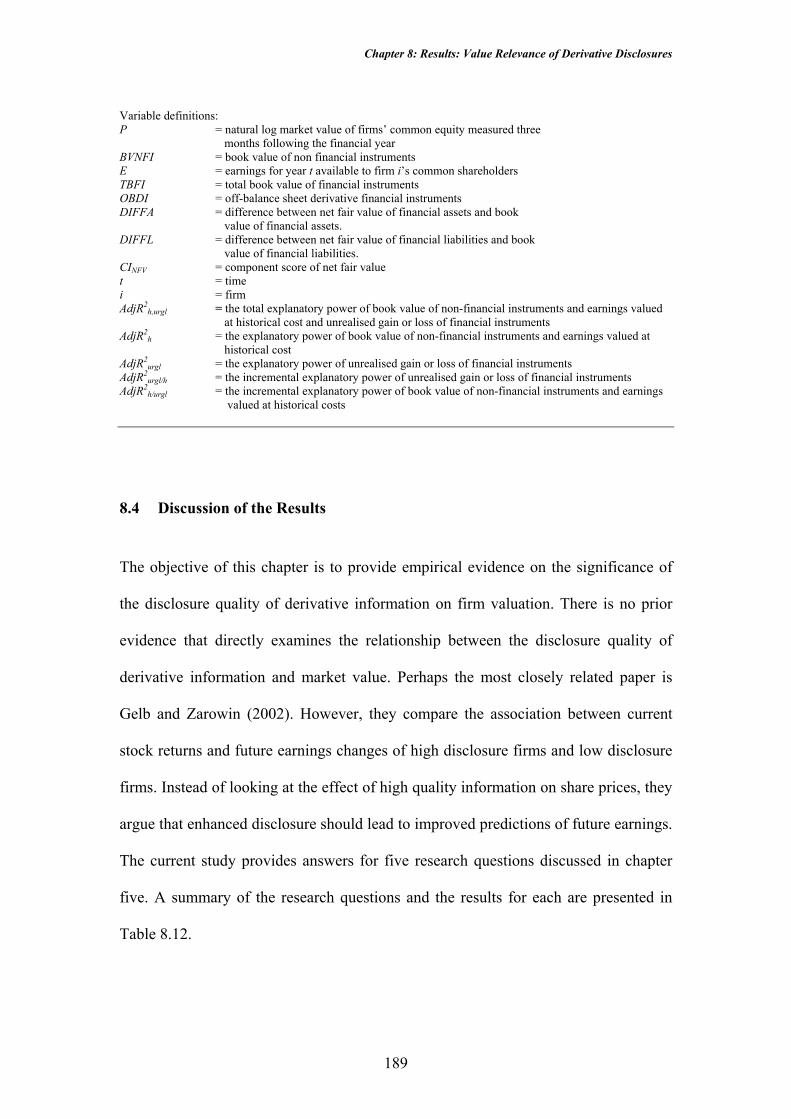
Chapter 8: Results: Value Relevance of Derivative Disclosures
189
Variable definitions: P = natural log market value of firms’ common equity measured three
months following the financial year BVNFI = book value of non financial instruments E = earnings for year t available to firm i’s common shareholders TBFI = total book value of financial instruments OBDI = off-balance sheet derivative financial instruments DIFFA = difference between net fair value of financial assets and book
value of financial assets. DIFFL = difference between net fair value of financial liabilities and book
value of financial liabilities. CINFV = component score of net fair value t = time i = firm AdjR2
h,urgl = the total explanatory power of book value of non-financial instruments and earnings valued at historical cost and unrealised gain or loss of financial instruments
AdjR2h = the explanatory power of book value of non-financial instruments and earnings valued at
historical cost AdjR2
urgl = the explanatory power of unrealised gain or loss of financial instruments AdjR2
urgl/h = the incremental explanatory power of unrealised gain or loss of financial instruments AdjR2
h/urgl = the incremental explanatory power of book value of non-financial instruments and earnings valued at historical costs
8.4 Discussion of the Results
The objective of this chapter is to provide empirical evidence on the significance of
the disclosure quality of derivative information on firm valuation. There is no prior
evidence that directly examines the relationship between the disclosure quality of
derivative information and market value. Perhaps the most closely related paper is
Gelb and Zarowin (2002). However, they compare the association between current
stock returns and future earnings changes of high disclosure firms and low disclosure
firms. Instead of looking at the effect of high quality information on share prices, they
argue that enhanced disclosure should lead to improved predictions of future earnings.
The current study provides answers for five research questions discussed in chapter
five. A summary of the research questions and the results for each are presented in
Table 8.12.
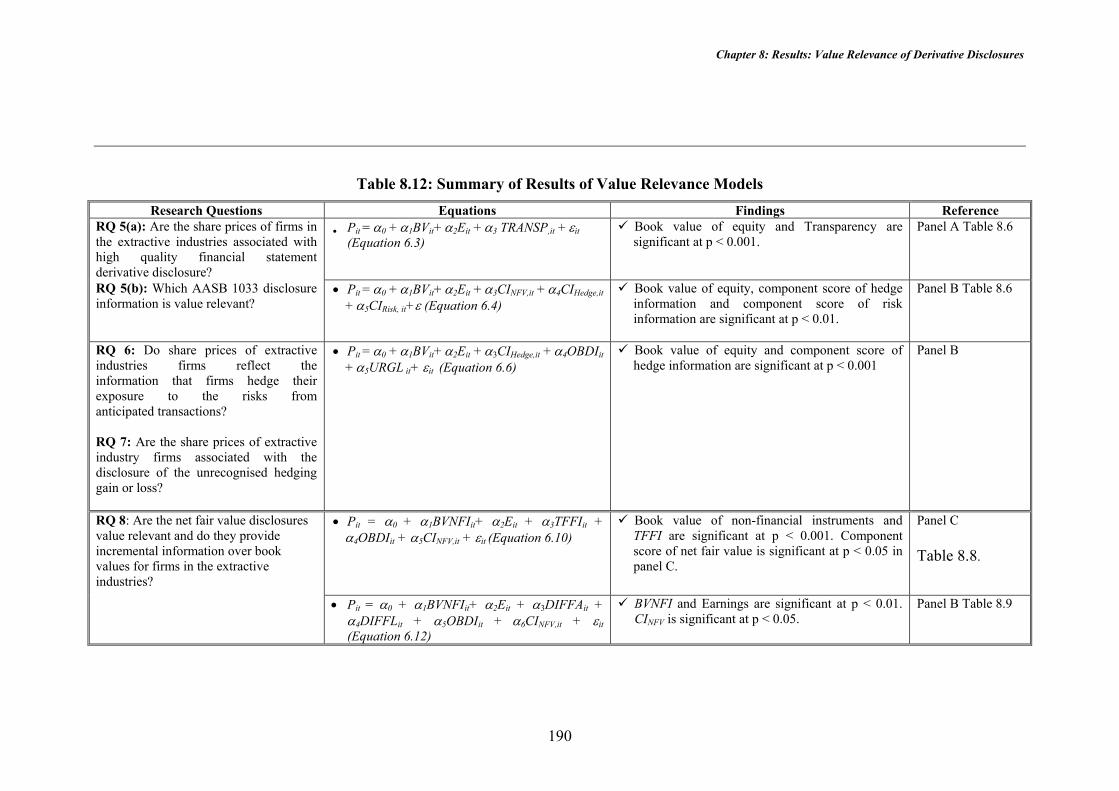
Chapter 8: Results: Value Relevance of Derivative Disclosures
190
Table 8.12: Summary of Results of Value Relevance Models Research Questions Equations Findings Reference
RQ 5(a): Are the share prices of firms in the extractive industries associated with high quality financial statement derivative disclosure?
• Pit = α0 + α1BVit+ α2Eit + α3 TRANSP,it + εit (Equation 6.3)
Book value of equity and Transparency are significant at p < 0.001.
Panel A Table 8.6
RQ 5(b): Which AASB 1033 disclosure information is value relevant?
• Pit = α0 + α1BVit+ α2Eit + α3CINFV,it + α4CIHedge,it + α5CIRisk, it+ε (Equation 6.4)
Book value of equity, component score of hedge information and component score of risk information are significant at p < 0.01.
Panel B Table 8.6
RQ 6: Do share prices of extractive industries firms reflect the information that firms hedge their exposure to the risks from anticipated transactions? RQ 7: Are the share prices of extractive industry firms associated with the disclosure of the unrecognised hedging gain or loss?
• Pit = α0 + α1BVit+ α2Eit + α3CIHedge,it + α4OBDIit + α5URGL it+ εit (Equation 6.6)
Book value of equity and component score of hedge information are significant at p < 0.001
Panel B
• Pit = α0 + α1BVNFIit+ α2Eit + α3TFFIit + α4OBDIit + α5CINFV,it + εit (Equation 6.10)
Book value of non-financial instruments and TFFI are significant at p < 0.001. Component score of net fair value is significant at p < 0.05 in panel C.
Panel C Table 8.8.
RQ 8: Are the net fair value disclosures value relevant and do they provide incremental information over book values for firms in the extractive industries?
• Pit = α0 + α1BVNFIit+ α2Eit + α3DIFFAit + α4DIFFLit + α5OBDIit + α6CINFV,it + εit (Equation 6.12)
BVNFI and Earnings are significant at p < 0.01. CINFV is significant at p < 0.05.
Panel B Table 8.9

Chapter 8: Results: Value Relevance of Derivative Disclosures
191
8.4.1 Disclosure Quality of Derivative Information and the Market Value of Firms
Research question 5(a) examines whether high quality derivative information is
associated with firms’ share prices. Subsection 8.3.1 presents the results for this
research question. Incorporating transparency in the Ohlson model provides evidence
on the significance of book value and transparency at p < 0.001 for both the pooled
data and year-by-year analysis (as in Appendix C). This indicates that market
participants regard the disclosure quality of derivatives as an important factor in
determining market value. This finding supports the general belief that high quality
disclosures (or transparency) benefits the share market (as found in Miller, 2001;
Miller and Bahnson, 2002). Investors are more confident with high quality
information and therefore, they will be satisfied with lower returns as the risk is
reduced, which leads to higher security prices (Miller and Bahnson, 2002). Most
importantly, this study contributes to the literature by providing evidence of the
importance of transparent derivative information as it has been considered as being
value relevant by market participants.
The second model identifies which components of the disclosure index are more
valuable to users (research question 5(b)). Results for the pooled data indicate that
market participants regard the book value of equity, hedge information and risk
information as important for market valuation. This result is important to accounting
standard setters because it indicates that market participants are very selective in
determining the most important derivative information in firm valuation. Most
importantly, in this industry market participants regard net fair value as unimportant
Chapter 8: Results: Value Relevance of Derivative Disclosures
192
for firm valuation. However, only results for the first model are supported by the
results conducted using refined data presented in Table D 1 Appendix D.
8.4.2 Value Relevance of Hedge Disclosures Research questions 6 and 7 raise the issue of the importance of qualitative/quantitative
information and recognised/unrecognised information. To explore these research
questions a model specified in equation 6.6 is developed. Table 8.7 reports the
multiple regression results on the association between market value and disclosure of
hedge information and the unrealised gain or loss of financial instruments. The key
results are summarised in Table 8.12. Results indicate that the book value of equity
and hedge information are the only variables that are positively and significantly
related to market value. Both are significant at p < 0.001. The insignificance of the
unrealised gain or loss on financial instruments and off-balance sheet derivative
financial instruments indicates that none of these items are value relevant. This
finding is consistent with the prior research of Pfeiffer (1998), Aboody (1996) and
Davis-Friday et al. (1999). Hence, this indicates that market participants might ignore
the disclosed information as they consider it unimportant (Barnes, 2001).
8.4.3 Value Relevance and the Incremental Explanatory Power of Net Fair Value Disclosure and the Unrealised Gain or Loss of Financial Instruments
Research question 8 raises the issue of the value-relevance and the incremental
explanatory power of the net fair value and unrealised gain or loss on financial
instruments, measured as the difference between the net fair value and the carrying
Chapter 8: Results: Value Relevance of Derivative Disclosures
193
value of financial instruments. The summary of the results for the value relevance of
the net fair value and the unrealised gain or loss on financial instruments are presented
in Table 8.12. Two models are developed based on Barth (1994) and Simko (1999).
The first model, based on Barth (1994), incorporates the net fair value of financial
instruments in the Ohlson model. However, the second model incorporates the
unrealised gain or loss, which is the difference between the net fair value and the book
value of the financial instruments84.
The results for the first model (equation 6.10) indicate that the book value of non-
financial instruments and net fair value of financial instruments are significant at p <
0.01. Also significant at p < 0.05 is CINFV. However, OBDI is not significant. Results
for the second model (equation 6.12), which based on Simko (1999), provide evidence
that BVNFI and E are significant. CINFV also recorded as significant at p < 0.05.
However, none of the unrealised gain or loss on financial assets (DIFFA) and
financial liabilities (DIFFL) and OBDI are significant.
The inconsistency and insignificance of the net fair value and the unrealised gain or
loss of financial instruments indicates that market participants, especially those related
to firms in the extractive industries, may not be ready or are unwilling to move
towards a net fair value regime. Users may be sceptical of the usefulness of net fair
value in assessing the effects of derivatives. This finding is contrary to the argument
made by Rasch and Wilson (1998). Further, fair value may be less reliable than
historical cost as managers use their discretion in determining fair value (Ahmad,
2000).
84 Simko (1999) used the difference between fair value and book value (URGL) to represent the fair value variable in his model.
Chapter 8: Results: Value Relevance of Derivative Disclosures
194
This result is supported by the low incremental explanatory power of net fair value
and the unrealised gain or loss of financial instruments beyond the book value of non-
financial instruments, book value of financial instruments and earnings valued at
historical costs. The incremental explanatory power of the net fair value and the
unrealised gain or loss on financial instruments beyond the book value of financial
and non-financial instruments and earnings valued at historical cost for the pooled
data is 0.80% and 1.26%, respectively. This is less than the incremental explanatory
power of the book value of financial and non-financial instruments and earnings
valued at historical cost beyond the net fair value and the unrealised gain or loss of
financial instruments which is valued at 17.41% and 40.19%, respectively. Perhaps
the low incremental explanatory power of net fair value is due to the fact that firms
tend to provide net fair values as the carrying value or book value of the instruments.
Therefore, the disclosures of net fair value and unrealised gain or loss on financial
instruments do not provide additional information beyond book value for decision
making. However, the incremental explanatory power of net fair value and the
unrealised gain or loss of financial instruments (book value of financial and non-
financial instruments and earnings valued at historical costs) has increased
(decreased) from 1998 to 2001. This indicates that market participants in the
extractive industries appreciate the importance of net fair value and therefore the
value relevance of net fair value is expected to improve in the future.

Chapter 8: Results: Value Relevance of Derivative Disclosures
195
8.5 Summary Chapter 8 examines the disclosure quality of derivative information based on a capital
markets study. Derivative information is considered as high quality if there is a
significant association between the information and market value. Overall, the
multiple regression results indicate that market participants regard derivative
information as value relevant. This study also found that hedge information and risk
information are regarded as value relevant. Examining the broad class of financial
instruments provides evidence that the net fair value of financial instruments is value
relevant. However, the unrealised gain or loss on financial assets (DIFFA) and
financial liabilities (DIFFL) and off-balance sheet derivative financial instruments are
not significant. However, these items are significant in some years in the year-by-year
analysis as in Table C 2 to Table C 4 in Appendix C. These results are supported by
the low incremental explanatory power of net fair value beyond the book value of
financial and non-financial instruments and earnings valued at historical cost. This
indicates that users are still sceptical about the usefulness of net fair value, contrary to
the results in Rasch and Wilson (1998). The results presented in this chapter indicate
that both firms in the extractive industries and market participants may not be ready
for the impending adoption of IAS 39.
Chapter 9: Summary and Conclusions
196
CHAPTER 9 SUMMARY AND CONCLUSIONS
9.1 Summary
The objective of this study is, first, to examine the relationship between the
transparency or disclosure quality of derivative information and firm characteristics.
Second, this study investigates the value relevance of derivative disclosures in
particular hedge information, net fair value information and risk information. This
study has developed two main models to provide answers for nine research questions.
The first model, the firm characteristics model, was developed to investigate the
relationship between the disclosure quality of derivative information and
characteristics of firms in the extractive industries. The second set of models, the
market value models, provide evidence on the value relevance of the disclosure
quality of derivative information and the value relevance of hedges of anticipated
transactions, net fair value and risk information.
9.1.1 Firm Characteristics Model
The unweighted disclosure index is developed to measure disclosure quality.
Following prior research that has explored the quality of other disclosures in financial
statements, four research questions that examine the association between firm
characteristics and disclosure quality of derivative information are developed. Firm
characteristics are represented by size, high performance firms, type of firm in the
extractive industries and type of auditor. Three control variables, market-to-book
Chapter 9: Summary and Conclusions
197
ratio, research and development activity and debt-to-equity ratio are also included in
the model. Size (represented by the log of total assets), high performance firms
(represented by price-earnings ratio and profitability), research and development (1
for R&D firms, 0 otherwise) and market-to-book ratio are expected to be positively
related to disclosure quality.
The estimation of the model based on pooled data assumes that each firm-year can be
treated as an independent observation. However, as in Lang and Lundholm (1993),
the degree of freedom in calculating the significance levels is overstated if the
independent variables fail to remove autocorrelation in the dependent variables.
Therefore, similar to Lang and Lundholm (1993) the regression analysis is repeated
for each year and an average of four years’ data (Appendix B). In addition to the
above, the ranked regression procedure also is performed. In this technique the
continuous variables are replaced with their rank. The smallest observation is ranked
as 1 and the largest observation is ranked as n. In the case of ties, the average ranks
are assigned.
The results support the following conclusions:
i. The disclosure quality of derivative information among firms in the extractive
industries has increased since the accounting standard, AASB 1033
Presentation and Disclosure of Financial Instruments, was applicable85.
Nevertheless, the number of firms that provide high quality derivative 85 Table 7.3 in chapter 7 provides evidence that the number of firms with a disclosure index between 0.50 and 0.89 has reduced from 34 (1998) to 24 (2001), but the number of firms with a disclosure index between 0.90 and 1.00 has increased from 31 (1998) to 41 (2001).
Chapter 9: Summary and Conclusions
198
information (the disclosure index is 1.00) has dropped marginally. The
majority of firms still use discretion in the disclosure of derivative information
especially with regard to information on hedges of anticipated transactions,
risk information and net fair value information. Of concern is that the majority
of firms provide less than complete information (50-99%). Kothari (2000)
suggests that regulators need to use their enforcement power to ensure
compliance.
ii. Large firms tend to provide high quality accounting information. The results
of this study provide evidence that support the general belief of the association
between larger firms and disclosure quality. The results of the pooled
regression indicate that larger firms in the extractive industries provide higher
quality derivative information then small firms. This finding holds for both the
ranked regression and the average of four years’ data (Appendix B).
iii. The debt-to-equity ratio, measuring leverage, also appears to be associated
with high quality derivative disclosures. The results indicate that high leverage
firms in the extractive industries are more likely to provide detailed
information on derivative instruments. This result is consistent with Ahmed
and Courtis (1999) and particularly with Malone et al. (1993). Malone et al.
(1993) indicate that firms with high leverage (high debt-to-equity ratios) in the
oil and gas industry disclose more extensive financial information than firms
with lower debt-to-equity ratios.
Chapter 9: Summary and Conclusions
199
iv. To a lesser extent, high performance firms and firms with low growth
opportunities (low market-to-book ratio) also provide higher quality derivative
disclosures. Firms with high profitability and price-earnings ratios are more
likely to provide higher quality derivative information, perhaps because they
may be exposed to higher political costs. The negative association between
market-to-book ratio (measuring growth) and disclosure quality indicates that
firms with growth opportunities in the extractive industries tend to disclose
lower quality derivative information. These firms tend to be more secretive as
providing more information could endanger their competitive advantage.
Further, disclosing more information may cause them to incur higher costs of
accumulating information. The significance of performance and growth
opportunities are not consistent in other regression techniques (ranked
regression, year-by-year and average of four years’ data (Appendix B)).
9.1.2 Market Value Model
The second part of this study examines the association between disclosure quality and
market value, and the association between market value and specific disclosures,
namely hedges of anticipated transactions, net fair value information and risk
information. The first market value model examines the association between
transparency or disclosure quality of derivative information and the market value of
firms in the extractive industries. This study develops the models based on Ohlson
(1995). The Ohlson model is modified to include transparency (as measured by the
disclosure index). This is represented by equation 6.3. However, including the
measure of transparency alone may override the importance of each component of the

Chapter 9: Summary and Conclusions
200
disclosure index. Therefore, the model is expanded to include three components of the
disclosure index. These are hedges of anticipated transactions, net fair value
information and risk information. The resultant model is specified in equation 6.4.
The second market value model examines whether: a) qualitative information (hedges
of anticipated transactions) and quantitative information are valued differently by
market participants, and b) net fair value and the unrealised gain or loss on financial
instruments are value relevant and provide incremental explanatory power above
historical cost. To examine the first issue, both qualitative and quantitative
information required by paragraph 5.8 of AASB 1033 are included in the expanded
Ohlson model. The qualitative information is represented by the component score of
hedge information and the quantitative information is represented by the unrealised
gain or loss on financial instruments (URGL) and off-balance sheet derivative
financial instruments (OBDI). The resultant model was specified in equation 6.6.
Prior studies on the value relevance of the fair value of financial instruments have
provided inconclusive results. To examine the value relevance of net fair value and
the unrealised gain or loss on financial instruments, both historical cost and net fair
value information were included in the expanded Ohlson model. Further, the book
value and the net fair value of non-financial instruments are separated from the book
value and the net fair value of financial instruments. Also included in the model are
the off-balance sheet derivative financial instruments (OBDI). This was specified in
equations 6.9 and 6.10. To examine the value relevance and incremental explanatory
power of the unrealised gain or loss on financial instruments (URGL), the URGL was
separated into the URGL of financial assets (DIFFA) and the URGL of financial
liabilities (DIFFL). This was specified in equations 6.11 and 6.12.

Chapter 9: Summary and Conclusions
201
The results of these estimations support the following conclusions:
i. High quality disclosure (transparency) benefits the share market (equation 6.3). In
particular, Australian investors value derivative disclosures as an important factor
in determining the market value of firms in the extractive industries. The market
participants consider net fair value information as less value relevant than hedge
information and risk information (equation 6.4).
ii. The hedge information required by paragraph 5.8 is as important as recognised
items (equation 6.6). The results reveal that hedge information is negatively
related to market value, indicating that the more hedge information disclosed in
the notes to the financial statements the less relevant it is for market valuation.
The unrealised gain or loss on financial instruments and off-balance sheet
financial instruments are not significant for the pooled data, however both are
significant in one of the years in the year-by-year analysis (Table C 2 Appendix
C). This indicates that market participants depend more on the recognised items
than on disclosed items for decisions on market valuation.
iii. To a limited extent, subject to the constraint of the model specification and sample
data, the net fair value of financial instruments, the unrealised gain or loss on
financial liabilities and off-balance sheet derivative financial instruments are value
relevant (Appendix C).

Chapter 9: Summary and Conclusions
202
iv. The incremental explanatory power of net fair value and unrealised gain or loss on
financial instruments beyond the book value of financial and non-financial
instruments and earnings at historical cost is very low. However, the incremental
explanatory power increased from 1998 to 2001, as compared to the incremental
explanatory power of the book value of financial and non-financial instruments
and earnings at historical cost beyond net fair value and unrealised gain or loss on
financial instruments (Tables 8.10 and 8.11 in Chapter 8).
9.2 Contributions of the Study The evidence presented in this study contributes to the literature in several ways. i. There is limited research that relates disclosure quality of derivative information
with firm characteristics. Berkman et al. (2002), Nguyen and Faff (2002), Nance
et al. (1993), Smith and Stulz (1985) and Géczy, Minton and Schrand (1997)
examine the relation between the use of derivatives and firm characteristics.
Hancock (1994), Berkman et al. (1997) and Chalmers (2001) examine the
reporting practices and the quality of voluntary derivative disclosure prior to
AASB 1033. However, no prior studies have identified the characteristics
associated with the disclosure of derivative information. Evidence from this study
has contributed to the literature in this area. The results indicate a positive
association between disclosure quality and the measures of size, leverage, price-
earnings ratio, profitability and market-to-book ratio and these results are
consistent with research on other disclosures.

Chapter 9: Summary and Conclusions
203
ii. The findings of this study also contribute to the value relevance literature. The
existing value relevance studies focus more on the effect of derivative accounting
numbers on the value of banks and financial institutions. Results from the finance
industry may not be relevant to other industries and therefore, this study extends
the existing findings to firms in the extractive industries.
iii. Findings from this study are relevant to standard setters and regulators for future
directions in developing accounting standards related to net fair value. In
particular this research is of relevance when the AASB is re-examining the
standard and considering the adoption of the International Accounting Standards.
Results from this study provide important information on this complex area for
both Australian and international standard setters.
9.3 Limitations
The research evidence presented in this thesis is subject to several limitations.
i. The findings could be biased as the sample is based on those companies
included in the Connect 4 Annual Report Collection Database or those
responding to a request for annual reports.
ii. The sample of firms using derivatives is relatively small and this may have
limited the power of statistical tests. Lack of variability in independent variables
such as type of auditor may also have contributed to the insignificant findings.
Chapter 9: Summary and Conclusions
204
iii. The study looks specifically at derivative disclosures by firms in the extractive
industries which limits the generalisability of the results of this study to a broad
class of information and cross-section of firms. While there are limitations to the
evidence presented, it does support the findings of previous research indicating a
direct association between disclosure quality and firm characteristics.
iv. The disclosure index, which represents disclosure quality or transparency, is
developed based on the information disclosed in the annual reports. However,
the annual reports are not the only source of corporate reporting. Investors and
creditors do consider other media, such as quarterly reports and public releases
or discussions, in making decisions (Healy and Palepu, 2001). However, the
annual report is important as the information used in the disclosure index has
been audited. Therefore, these derivative disclosures have a measure of
credibility not afforded to other forms of organisational communication (Neu,
Warsame and Pedwell, 1998).
v. The disclosure index has been criticised because its usefulness depends on the
items selected for inclusion. Further, assigning a zero score to a company that
does not possess the instruments could give a wrong indication about corporate
disclosure practice. This is because the index fails to differentiate between firms
which do not hold the instruments with firms that hold the instruments but fail to
disclose the information. To overcome this, the index score is converted by
dividing the actual score by the maximum score possible for that particular
company (Marston and Shrives, 1991).

Chapter 9: Summary and Conclusions
205
9.4 Directions for Future Research
i. This study should be extended to other industries to provide regulators with a
clear picture of how Australian firms react to the AASB 1033 disclosure
requirements and how these requirements help investors in decisions-making.
This will assist them to overcome issues related to measurement and
recognition of derivative instruments. Further, results presented by prior non-
Australian studies may not be applicable to Australian firms as the industries
operate in a different institutional environment.
ii. Future research may extend the current study using different research
methods. The capital markets research approach may not provide the actual
reactions of the people involved with these particular issues. Interviewing
managers, investors and auditors may help us understand the level of
acceptance of net fair value among those people. Further, this will help us
understand the importance of disclosure transparency among these stakeholder
groups.

Appendix A
206
APPENDIX A: AUSTRALIAN FIRMS IN THE EXTRACTIVE INDUSTRIES LISTED ON THE ASX IN 1998 TO 2001
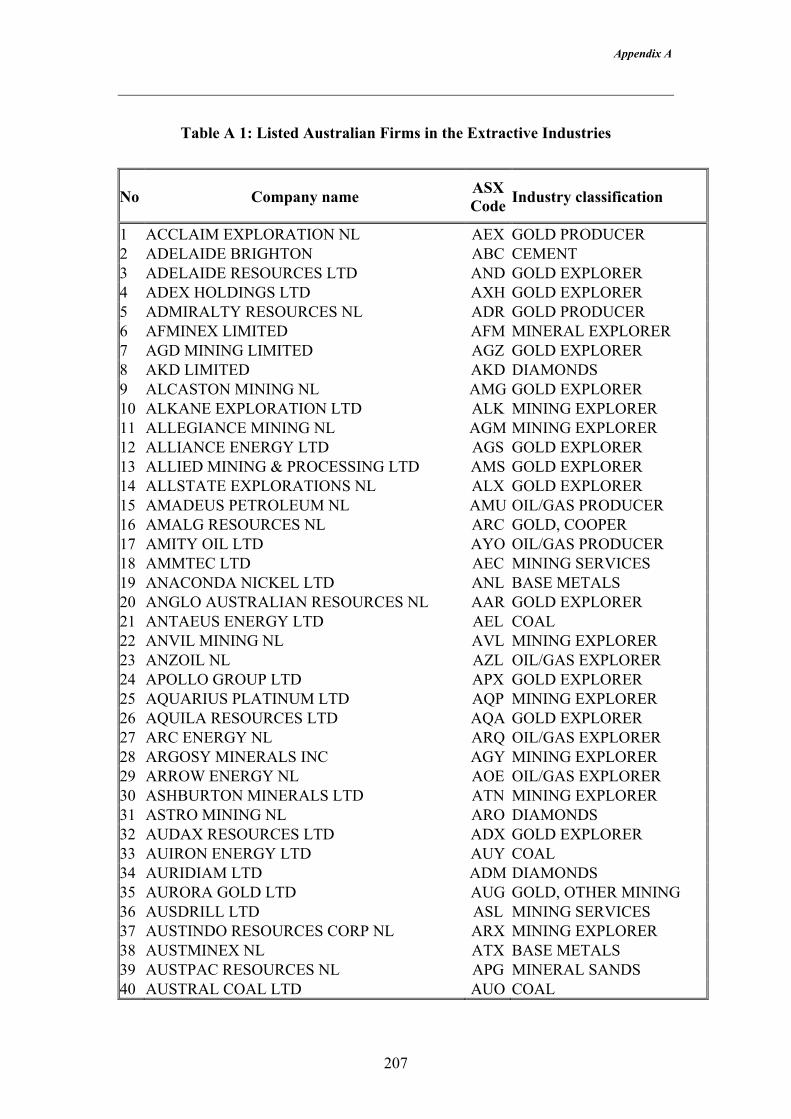
Appendix A
207
Table A 1: Listed Australian Firms in the Extractive Industries
No Company name ASX Code Industry classification
1 ACCLAIM EXPLORATION NL AEX GOLD PRODUCER 2 ADELAIDE BRIGHTON ABC CEMENT 3 ADELAIDE RESOURCES LTD AND GOLD EXPLORER 4 ADEX HOLDINGS LTD AXH GOLD EXPLORER 5 ADMIRALTY RESOURCES NL ADR GOLD PRODUCER 6 AFMINEX LIMITED AFM MINERAL EXPLORER 7 AGD MINING LIMITED AGZ GOLD EXPLORER 8 AKD LIMITED AKD DIAMONDS 9 ALCASTON MINING NL AMG GOLD EXPLORER 10 ALKANE EXPLORATION LTD ALK MINING EXPLORER 11 ALLEGIANCE MINING NL AGM MINING EXPLORER 12 ALLIANCE ENERGY LTD AGS GOLD EXPLORER 13 ALLIED MINING & PROCESSING LTD AMS GOLD EXPLORER 14 ALLSTATE EXPLORATIONS NL ALX GOLD EXPLORER 15 AMADEUS PETROLEUM NL AMU OIL/GAS PRODUCER 16 AMALG RESOURCES NL ARC GOLD, COOPER 17 AMITY OIL LTD AYO OIL/GAS PRODUCER 18 AMMTEC LTD AEC MINING SERVICES 19 ANACONDA NICKEL LTD ANL BASE METALS 20 ANGLO AUSTRALIAN RESOURCES NL AAR GOLD EXPLORER 21 ANTAEUS ENERGY LTD AEL COAL 22 ANVIL MINING NL AVL MINING EXPLORER 23 ANZOIL NL AZL OIL/GAS EXPLORER 24 APOLLO GROUP LTD APX GOLD EXPLORER 25 AQUARIUS PLATINUM LTD AQP MINING EXPLORER 26 AQUILA RESOURCES LTD AQA GOLD EXPLORER 27 ARC ENERGY NL ARQ OIL/GAS EXPLORER 28 ARGOSY MINERALS INC AGY MINING EXPLORER 29 ARROW ENERGY NL AOE OIL/GAS EXPLORER 30 ASHBURTON MINERALS LTD ATN MINING EXPLORER 31 ASTRO MINING NL ARO DIAMONDS 32 AUDAX RESOURCES LTD ADX GOLD EXPLORER 33 AUIRON ENERGY LTD AUY COAL 34 AURIDIAM LTD ADM DIAMONDS 35 AURORA GOLD LTD AUG GOLD, OTHER MINING 36 AUSDRILL LTD ASL MINING SERVICES 37 AUSTINDO RESOURCES CORP NL ARX MINING EXPLORER 38 AUSTMINEX NL ATX BASE METALS 39 AUSTPAC RESOURCES NL APG MINERAL SANDS 40 AUSTRAL COAL LTD AUO COAL
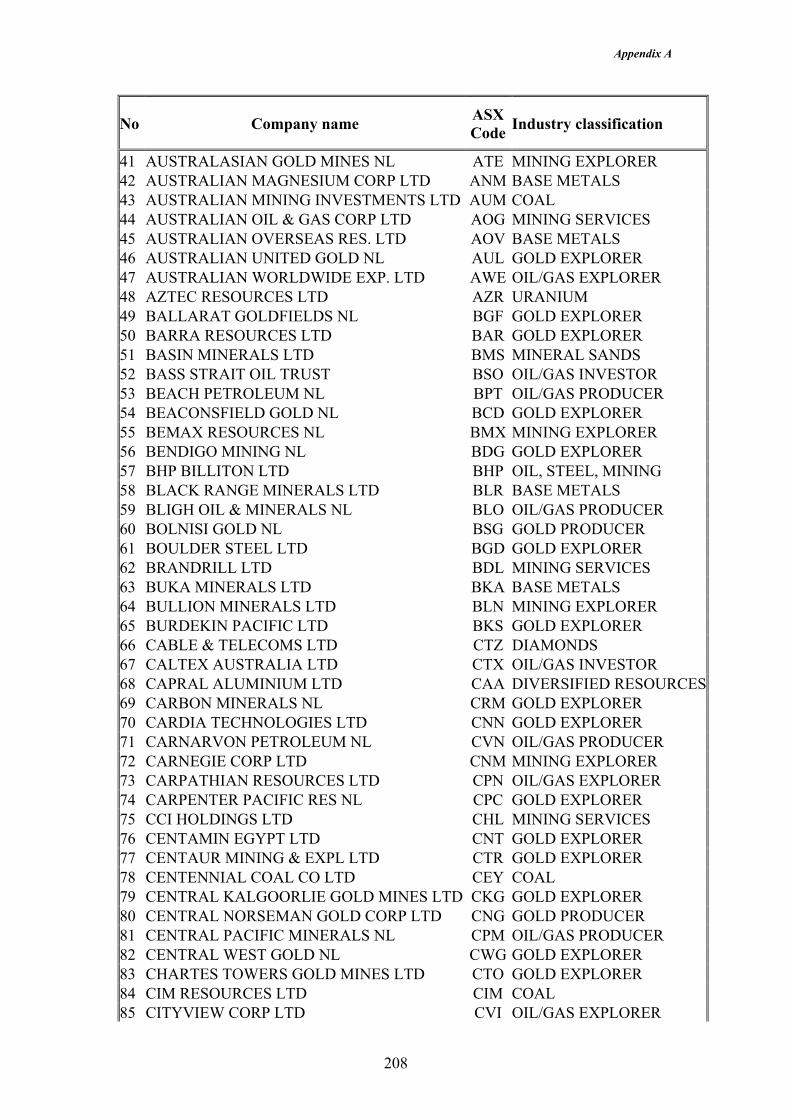
Appendix A
208
No Company name ASX Code Industry classification
41 AUSTRALASIAN GOLD MINES NL ATE MINING EXPLORER 42 AUSTRALIAN MAGNESIUM CORP LTD ANM BASE METALS 43 AUSTRALIAN MINING INVESTMENTS LTD AUM COAL 44 AUSTRALIAN OIL & GAS CORP LTD AOG MINING SERVICES 45 AUSTRALIAN OVERSEAS RES. LTD AOV BASE METALS 46 AUSTRALIAN UNITED GOLD NL AUL GOLD EXPLORER 47 AUSTRALIAN WORLDWIDE EXP. LTD AWE OIL/GAS EXPLORER 48 AZTEC RESOURCES LTD AZR URANIUM 49 BALLARAT GOLDFIELDS NL BGF GOLD EXPLORER 50 BARRA RESOURCES LTD BAR GOLD EXPLORER 51 BASIN MINERALS LTD BMS MINERAL SANDS 52 BASS STRAIT OIL TRUST BSO OIL/GAS INVESTOR 53 BEACH PETROLEUM NL BPT OIL/GAS PRODUCER 54 BEACONSFIELD GOLD NL BCD GOLD EXPLORER 55 BEMAX RESOURCES NL BMX MINING EXPLORER 56 BENDIGO MINING NL BDG GOLD EXPLORER 57 BHP BILLITON LTD BHP OIL, STEEL, MINING 58 BLACK RANGE MINERALS LTD BLR BASE METALS 59 BLIGH OIL & MINERALS NL BLO OIL/GAS PRODUCER 60 BOLNISI GOLD NL BSG GOLD PRODUCER 61 BOULDER STEEL LTD BGD GOLD EXPLORER 62 BRANDRILL LTD BDL MINING SERVICES 63 BUKA MINERALS LTD BKA BASE METALS 64 BULLION MINERALS LTD BLN MINING EXPLORER 65 BURDEKIN PACIFIC LTD BKS GOLD EXPLORER 66 CABLE & TELECOMS LTD CTZ DIAMONDS 67 CALTEX AUSTRALIA LTD CTX OIL/GAS INVESTOR 68 CAPRAL ALUMINIUM LTD CAA DIVERSIFIED RESOURCES69 CARBON MINERALS NL CRM GOLD EXPLORER 70 CARDIA TECHNOLOGIES LTD CNN GOLD EXPLORER 71 CARNARVON PETROLEUM NL CVN OIL/GAS PRODUCER 72 CARNEGIE CORP LTD CNM MINING EXPLORER 73 CARPATHIAN RESOURCES LTD CPN OIL/GAS EXPLORER 74 CARPENTER PACIFIC RES NL CPC GOLD EXPLORER 75 CCI HOLDINGS LTD CHL MINING SERVICES 76 CENTAMIN EGYPT LTD CNT GOLD EXPLORER 77 CENTAUR MINING & EXPL LTD CTR GOLD EXPLORER 78 CENTENNIAL COAL CO LTD CEY COAL 79 CENTRAL KALGOORLIE GOLD MINES LTD CKG GOLD EXPLORER 80 CENTRAL NORSEMAN GOLD CORP LTD CNG GOLD PRODUCER 81 CENTRAL PACIFIC MINERALS NL CPM OIL/GAS PRODUCER 82 CENTRAL WEST GOLD NL CWG GOLD EXPLORER 83 CHARTES TOWERS GOLD MINES LTD CTO GOLD EXPLORER 84 CIM RESOURCES LTD CIM COAL 85 CITYVIEW CORP LTD CVI OIL/GAS EXPLORER

Appendix A
209
No Company name ASX Code Industry classification
86 CLUFF RESOURCES PACIFIC NL CFR MINING EXPLORER 87 COAL & ALLIED INDUSTRIES LTD CAN COAL 88 COBRA RESOURCES LTD CBO GOLD EXPLORER 89 COMET RESOURCES LTD CRL MINING EXPLORER 90 COMPASS RESOURCES NL CMR MINING EXPLORER 91 CONQUEST MINING LTD CQT DIAMONDS 92 CONSOLIDATED BROKEN HILL LTD CBH MINING PRODUCER 93 CONSOLIDATED MINERALS LTD CSM MINING PRODUCER 94 CONSOLIDATED RUTILE LTD CRT MINERAL SANDS 95 CONTINENTAL GOLDFIELDS LTD CVC GOLD EXPLORER 96 COPLEX RESOURCES NL CXR OIL/GAS EXPLORER 97 CROESUS MINING NL CRS GOLD PRODUCER 98 CUE ENERGY RESOURCES LTD CUE OIL/GAS EXPLORER 99 CULLEN RESOURCES LTD CUL GOLD EXPLORER 100 CUMNOCK COAL LTD CMK COAL 101 DALRYMPLE RESOURCES NL DRE GOLD EXPLORER 102 DANAE RESOURCES NL DNS MINING EXPLORER 103 DEEPGREEN MINERALS CORP LTD DGM COAL 104 DELTA GOLD LTD DGD GOLD PRODUCER 105 DIAMOND ROSE NL DRN DIAMONDS 106 DIAMONDS VENTURES NL DDV DIAMONDS 107 DIORO EXPLORATION NL DIO MINING INVESTMENT 108 DOMINION MINING LTD DOM GOLD PRODUCER 109 DRAGON MINING NL DRA GOLD EXPLORER 110 DRILLSEARCH ENERGY LTD DLS OIL/GAS PRODUCER 111 DURBAN ROODEPOORT DEEP LTD DRD GOLD PRODUCER 112 DWYKA DIAMONDS LTD DWY DIAMONDS 113 EAGLE BAY RESOURCES NL EBR OIL/GAS EXPLORER 114 EAST COAST MINERALS NL ECM MINING INVESTMENT 115 EASTERN CORPORATION LTD ECU GOLD EXPLORER 116 EASTERN INTERNATIONAL LTD ESG OIL/GAS EXPLORER 117 EMPEROR MINES LTD EMP GOLD PRODUCER 118 EMPIRE OIL & GAS NL EGO OIL/GAS EXPLORER 119 ENERGY EQUITY CORP LTD EEC OIL/GAS EXPLORER 120 ENERGY RESOURCES OF AUSTRALIA LTD ERA URANIUM 121 EQITX LTD EQX MINING EXPLORER 122 EQUATORIAL MINING LTD EQM MINING EXPLORER 123 EQUIGOLD NL EQI GOLD EXPLORER 124 EQUINOX RESOURCES LTD EQR GOLD EXPLORER 125 EQUS LTD EQS MINING EXPLORER 126 EROMANGA HYDROCARBONS NL ERH OIL/GAS EXPLORER 127 ESMERALDA EXPLORATION LTD ESE GOLD EXPLORER 128 ESPERANCE MINERALS NL ESM MINING PRODUCER 129 ESSENTIAL PETROLEUM RES LTD EPR OIL/GAS EXPLORER 130 EXCO RESOURCES NL EXS MINING EXPLORER

Appendix A
210
No Company name ASX Code Industry classification
131 FIRST AUSTRALIAN RES LTD FAR OIL/GAS EXPLORER 132 FRASER RANGE HOLDING LTD FGR BASE METALS 133 GALLERY GOLD LTD GGN GOLD EXPLORER 134 GATEWAY MINING NL GML MINING EXPLORER 135 GENERAL GOLD RESOURCES NL GGR MINERAL EXPLORER 136 GEORGRAPHE RESOURCES LTD GHR GOLD EXPLORER 137 GIANTS REEF MINING LTD GTM GOLD, OTHER MINING 138 GINDALBIE GOLD NL GBG GOLD EXPLORER 139 GIRALIA RESOURCES NL GIR GOLD EXPLORER 140 GLENGARRY RESOURCES LTD GGY GOLD EXPLORER 141 GME RESOURCES LTD GME GOLD EXPLORER 142 GOLD MINES OF SARDINIA LTD GMS GOLD EXPLORER 143 GOLD PARTNERS LTD GLP GOLD EXPLORER 144 GOLDEN CROSS RESOURCES LTD GCR GOLD EXPLORER 145 GOLDEN DEEPS NL GED GOLD EXPLORER 146 GOLDEN STATE RESOURCES LTD GDN GOLD EXPLORER 147 GOLDEN VALLEY MINES LTD GVM GOLD PRODUCER 148 GOLDFIELDS LTD GLD GOLD PRODUCER 149 GOLDSEARCH LTD GSE GOLD EXPLORER 150 GOLDSTREAM MINING NL GDM GOLD EXPLORER 151 GONDWANA RESOURCES LTD GDA GOLD EXPLORER 152 GRD NL GRD GOLD, INVESTMENT 153 GREATER PACIFIC GOLD LTD GPN GOLD EXPLORER 154 GREENSTONE RESOURCES NL GNR MINING EXPLORER 155 GREENVALE MINING NL GRV BASE METALS 156 GRENFELL RESOURCES LTD GRN MINERAL SANDS 157 GTN RESOURCES LTD GTN MINING PRODUCER 158 GULLEWA LTD GUL GOLD EXPLORER 159 GUTNICK RESOURCES NL GKR GOLD EXPLORER 160 GYMPIE GOLD LTD GYM GOLD PRODUCER 161 HADDINGTON INTERNATIONAL RES LTD HDN MINING EXPLORER 162 HALLMARK CONSOLIDATED LTD HLM GOLD EXPLORER 163 HAMPTON HILL MINING NL HHM GOLD EXPLORER 164 HAOMA MINING NL HAO GOLD PRODUCER 165 HARDMAN RESOURCES NL HDR OIL/GAS EXPLORER 166 HELIX RESOURCES LTD HLX MINING EXPLORER 167 HERALD RESOURCES LTD HER GOLD EXPLORER 168 HERON RESOURCES LTD HRR BASE METALS 169 HILL 50 GOLD NL HFY GOLD PRODUCER 170 HILLCREST RESOURCES LTD HLL GOLD EXPLORER 171 HILLGROVE GOLD NL HGO MINING PRODUCER 172 HOMESTAKE MINING CO HSM GOLD PRODUCER 173 HUDSON RESOURCES LTD HRS MINING PRODUCER 174 ICON ENERGY LTD ICN OIL/GAS EXPLORER 175 IGM GROUP LTD IGM GOLD EXPLORER
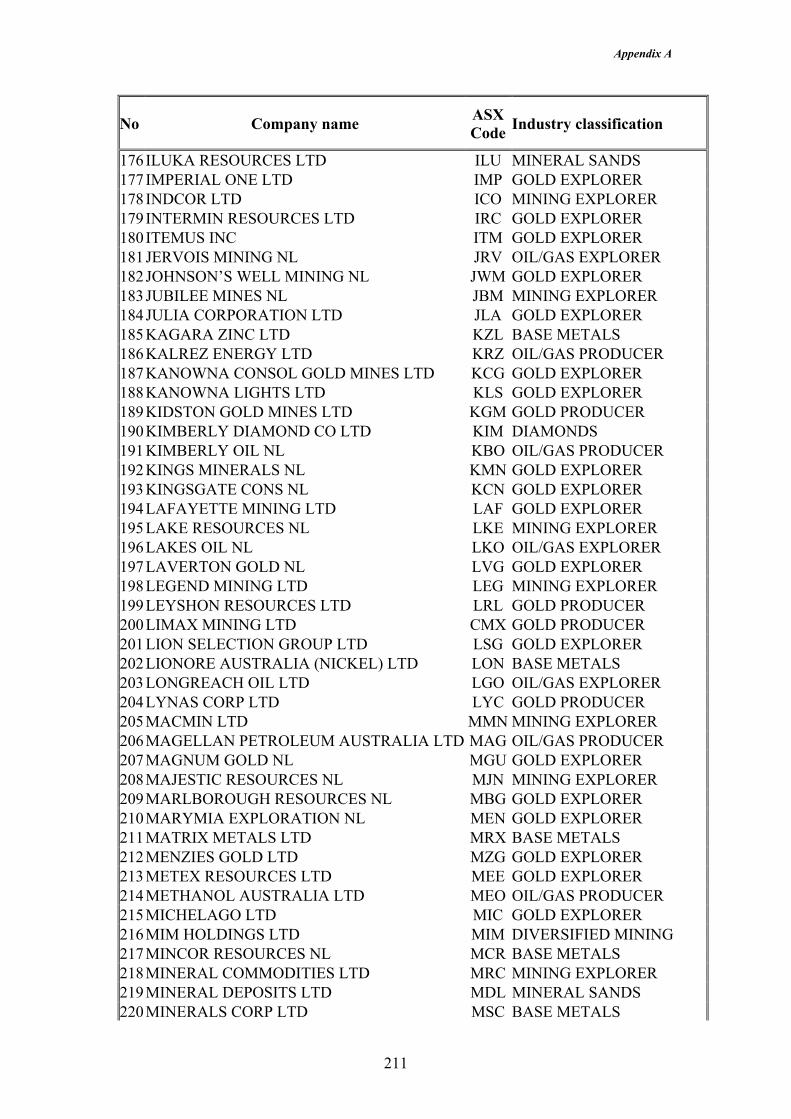
Appendix A
211
No Company name ASX Code Industry classification
176 ILUKA RESOURCES LTD ILU MINERAL SANDS 177 IMPERIAL ONE LTD IMP GOLD EXPLORER 178 INDCOR LTD ICO MINING EXPLORER 179 INTERMIN RESOURCES LTD IRC GOLD EXPLORER 180 ITEMUS INC ITM GOLD EXPLORER 181 JERVOIS MINING NL JRV OIL/GAS EXPLORER 182 JOHNSON’S WELL MINING NL JWM GOLD EXPLORER 183 JUBILEE MINES NL JBM MINING EXPLORER 184 JULIA CORPORATION LTD JLA GOLD EXPLORER 185 KAGARA ZINC LTD KZL BASE METALS 186 KALREZ ENERGY LTD KRZ OIL/GAS PRODUCER 187 KANOWNA CONSOL GOLD MINES LTD KCG GOLD EXPLORER 188 KANOWNA LIGHTS LTD KLS GOLD EXPLORER 189 KIDSTON GOLD MINES LTD KGM GOLD PRODUCER 190 KIMBERLY DIAMOND CO LTD KIM DIAMONDS 191 KIMBERLY OIL NL KBO OIL/GAS PRODUCER 192 KINGS MINERALS NL KMN GOLD EXPLORER 193 KINGSGATE CONS NL KCN GOLD EXPLORER 194 LAFAYETTE MINING LTD LAF GOLD EXPLORER 195 LAKE RESOURCES NL LKE MINING EXPLORER 196 LAKES OIL NL LKO OIL/GAS EXPLORER 197 LAVERTON GOLD NL LVG GOLD EXPLORER 198 LEGEND MINING LTD LEG MINING EXPLORER 199 LEYSHON RESOURCES LTD LRL GOLD PRODUCER 200 LIMAX MINING LTD CMX GOLD PRODUCER 201 LION SELECTION GROUP LTD LSG GOLD EXPLORER 202 LIONORE AUSTRALIA (NICKEL) LTD LON BASE METALS 203 LONGREACH OIL LTD LGO OIL/GAS EXPLORER 204 LYNAS CORP LTD LYC GOLD PRODUCER 205 MACMIN LTD MMN MINING EXPLORER 206 MAGELLAN PETROLEUM AUSTRALIA LTD MAG OIL/GAS PRODUCER 207 MAGNUM GOLD NL MGU GOLD EXPLORER 208 MAJESTIC RESOURCES NL MJN MINING EXPLORER 209 MARLBOROUGH RESOURCES NL MBG GOLD EXPLORER 210 MARYMIA EXPLORATION NL MEN GOLD EXPLORER 211 MATRIX METALS LTD MRX BASE METALS 212 MENZIES GOLD LTD MZG GOLD EXPLORER 213 METEX RESOURCES LTD MEE GOLD EXPLORER 214 METHANOL AUSTRALIA LTD MEO OIL/GAS PRODUCER 215 MICHELAGO LTD MIC GOLD EXPLORER 216 MIM HOLDINGS LTD MIM DIVERSIFIED MINING 217 MINCOR RESOURCES NL MCR BASE METALS 218 MINERAL COMMODITIES LTD MRC MINING EXPLORER 219 MINERAL DEPOSITS LTD MDL MINERAL SANDS 220 MINERALS CORP LTD MSC BASE METALS
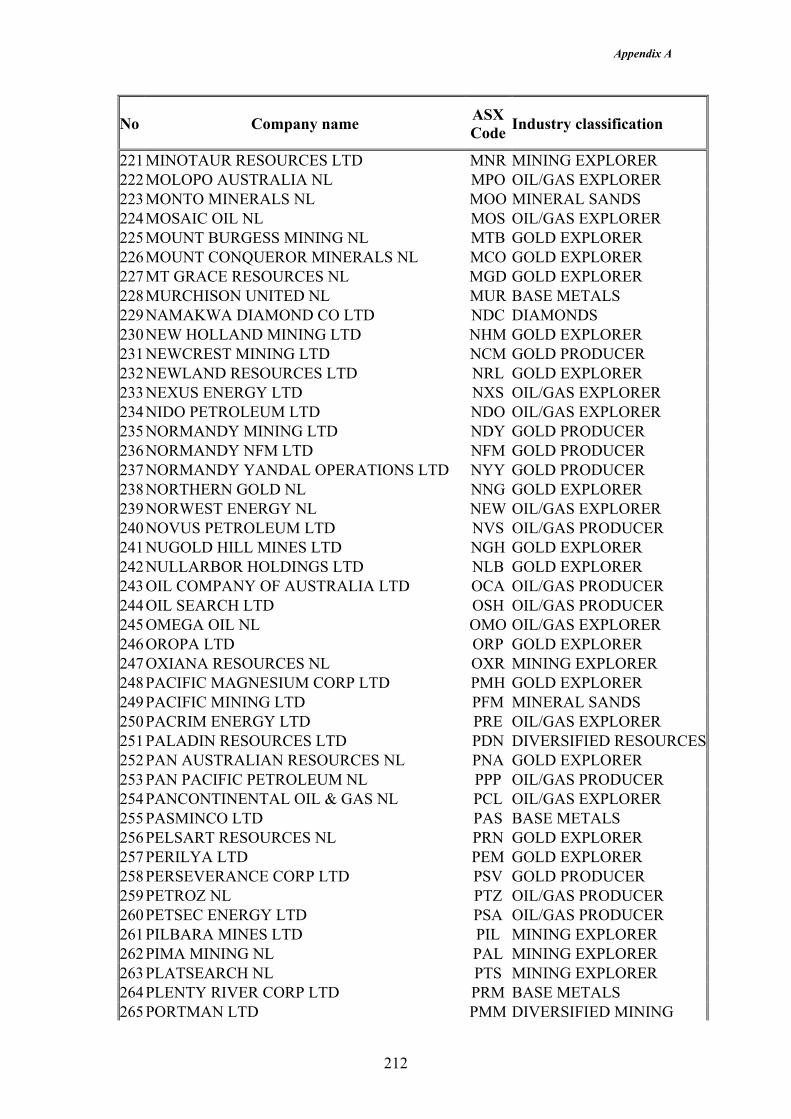
Appendix A
212
No Company name ASX Code Industry classification
221 MINOTAUR RESOURCES LTD MNR MINING EXPLORER 222 MOLOPO AUSTRALIA NL MPO OIL/GAS EXPLORER 223 MONTO MINERALS NL MOO MINERAL SANDS 224 MOSAIC OIL NL MOS OIL/GAS EXPLORER 225 MOUNT BURGESS MINING NL MTB GOLD EXPLORER 226 MOUNT CONQUEROR MINERALS NL MCO GOLD EXPLORER 227 MT GRACE RESOURCES NL MGD GOLD EXPLORER 228 MURCHISON UNITED NL MUR BASE METALS 229 NAMAKWA DIAMOND CO LTD NDC DIAMONDS 230 NEW HOLLAND MINING LTD NHM GOLD EXPLORER 231 NEWCREST MINING LTD NCM GOLD PRODUCER 232 NEWLAND RESOURCES LTD NRL GOLD EXPLORER 233 NEXUS ENERGY LTD NXS OIL/GAS EXPLORER 234 NIDO PETROLEUM LTD NDO OIL/GAS EXPLORER 235 NORMANDY MINING LTD NDY GOLD PRODUCER 236 NORMANDY NFM LTD NFM GOLD PRODUCER 237 NORMANDY YANDAL OPERATIONS LTD NYY GOLD PRODUCER 238 NORTHERN GOLD NL NNG GOLD EXPLORER 239 NORWEST ENERGY NL NEW OIL/GAS EXPLORER 240 NOVUS PETROLEUM LTD NVS OIL/GAS PRODUCER 241 NUGOLD HILL MINES LTD NGH GOLD EXPLORER 242 NULLARBOR HOLDINGS LTD NLB GOLD EXPLORER 243 OIL COMPANY OF AUSTRALIA LTD OCA OIL/GAS PRODUCER 244 OIL SEARCH LTD OSH OIL/GAS PRODUCER 245 OMEGA OIL NL OMO OIL/GAS EXPLORER 246 OROPA LTD ORP GOLD EXPLORER 247 OXIANA RESOURCES NL OXR MINING EXPLORER 248 PACIFIC MAGNESIUM CORP LTD PMH GOLD EXPLORER 249 PACIFIC MINING LTD PFM MINERAL SANDS 250 PACRIM ENERGY LTD PRE OIL/GAS EXPLORER 251 PALADIN RESOURCES LTD PDN DIVERSIFIED RESOURCES252 PAN AUSTRALIAN RESOURCES NL PNA GOLD EXPLORER 253 PAN PACIFIC PETROLEUM NL PPP OIL/GAS PRODUCER 254 PANCONTINENTAL OIL & GAS NL PCL OIL/GAS EXPLORER 255 PASMINCO LTD PAS BASE METALS 256 PELSART RESOURCES NL PRN GOLD EXPLORER 257 PERILYA LTD PEM GOLD EXPLORER 258 PERSEVERANCE CORP LTD PSV GOLD PRODUCER 259 PETROZ NL PTZ OIL/GAS PRODUCER 260 PETSEC ENERGY LTD PSA OIL/GAS PRODUCER 261 PILBARA MINES LTD PIL MINING EXPLORER 262 PIMA MINING NL PAL MINING EXPLORER 263 PLATSEARCH NL PTS MINING EXPLORER 264 PLENTY RIVER CORP LTD PRM BASE METALS 265 PORTMAN LTD PMM DIVERSIFIED MINING
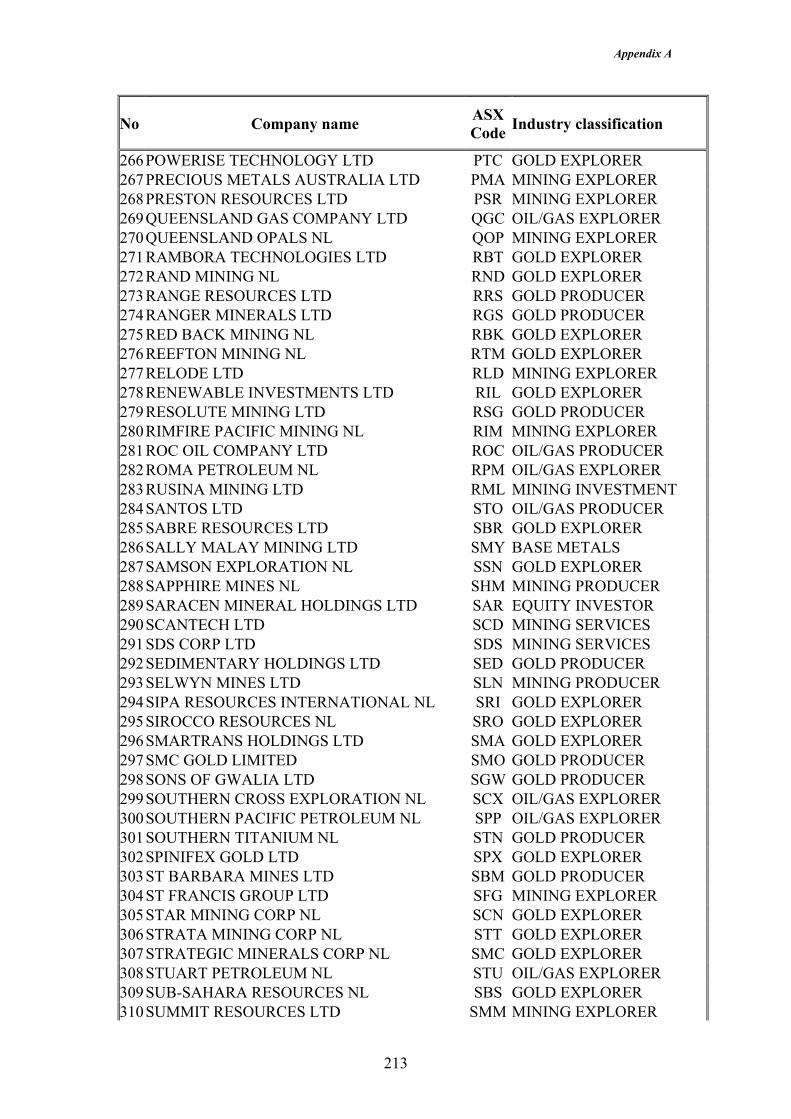
Appendix A
213
No Company name ASX Code Industry classification
266 POWERISE TECHNOLOGY LTD PTC GOLD EXPLORER 267 PRECIOUS METALS AUSTRALIA LTD PMA MINING EXPLORER 268 PRESTON RESOURCES LTD PSR MINING EXPLORER 269 QUEENSLAND GAS COMPANY LTD QGC OIL/GAS EXPLORER 270 QUEENSLAND OPALS NL QOP MINING EXPLORER 271 RAMBORA TECHNOLOGIES LTD RBT GOLD EXPLORER 272 RAND MINING NL RND GOLD EXPLORER 273 RANGE RESOURCES LTD RRS GOLD PRODUCER 274 RANGER MINERALS LTD RGS GOLD PRODUCER 275 RED BACK MINING NL RBK GOLD EXPLORER 276 REEFTON MINING NL RTM GOLD EXPLORER 277 RELODE LTD RLD MINING EXPLORER 278 RENEWABLE INVESTMENTS LTD RIL GOLD EXPLORER 279 RESOLUTE MINING LTD RSG GOLD PRODUCER 280 RIMFIRE PACIFIC MINING NL RIM MINING EXPLORER 281 ROC OIL COMPANY LTD ROC OIL/GAS PRODUCER 282 ROMA PETROLEUM NL RPM OIL/GAS EXPLORER 283 RUSINA MINING LTD RML MINING INVESTMENT 284 SANTOS LTD STO OIL/GAS PRODUCER 285 SABRE RESOURCES LTD SBR GOLD EXPLORER 286 SALLY MALAY MINING LTD SMY BASE METALS 287 SAMSON EXPLORATION NL SSN GOLD EXPLORER 288 SAPPHIRE MINES NL SHM MINING PRODUCER 289 SARACEN MINERAL HOLDINGS LTD SAR EQUITY INVESTOR 290 SCANTECH LTD SCD MINING SERVICES 291 SDS CORP LTD SDS MINING SERVICES 292 SEDIMENTARY HOLDINGS LTD SED GOLD PRODUCER 293 SELWYN MINES LTD SLN MINING PRODUCER 294 SIPA RESOURCES INTERNATIONAL NL SRI GOLD EXPLORER 295 SIROCCO RESOURCES NL SRO GOLD EXPLORER 296 SMARTRANS HOLDINGS LTD SMA GOLD EXPLORER 297 SMC GOLD LIMITED SMO GOLD PRODUCER 298 SONS OF GWALIA LTD SGW GOLD PRODUCER 299 SOUTHERN CROSS EXPLORATION NL SCX OIL/GAS EXPLORER 300 SOUTHERN PACIFIC PETROLEUM NL SPP OIL/GAS EXPLORER 301 SOUTHERN TITANIUM NL STN GOLD PRODUCER 302 SPINIFEX GOLD LTD SPX GOLD EXPLORER 303 ST BARBARA MINES LTD SBM GOLD PRODUCER 304 ST FRANCIS GROUP LTD SFG MINING EXPLORER 305 STAR MINING CORP NL SCN GOLD EXPLORER 306 STRATA MINING CORP NL STT GOLD EXPLORER 307 STRATEGIC MINERALS CORP NL SMC GOLD EXPLORER 308 STUART PETROLEUM NL STU OIL/GAS EXPLORER 309 SUB-SAHARA RESOURCES NL SBS GOLD EXPLORER 310 SUMMIT RESOURCES LTD SMM MINING EXPLORER
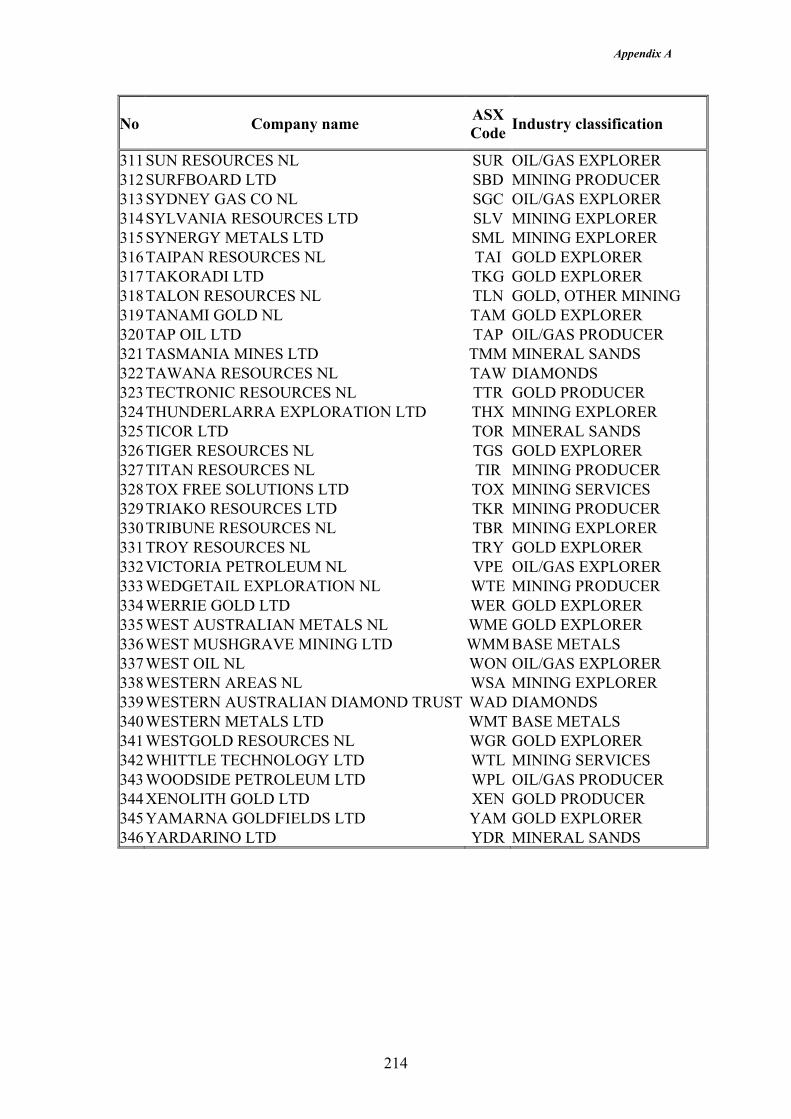
Appendix A
214
No Company name ASX Code Industry classification
311 SUN RESOURCES NL SUR OIL/GAS EXPLORER 312 SURFBOARD LTD SBD MINING PRODUCER 313 SYDNEY GAS CO NL SGC OIL/GAS EXPLORER 314 SYLVANIA RESOURCES LTD SLV MINING EXPLORER 315 SYNERGY METALS LTD SML MINING EXPLORER 316 TAIPAN RESOURCES NL TAI GOLD EXPLORER 317 TAKORADI LTD TKG GOLD EXPLORER 318 TALON RESOURCES NL TLN GOLD, OTHER MINING 319 TANAMI GOLD NL TAM GOLD EXPLORER 320 TAP OIL LTD TAP OIL/GAS PRODUCER 321 TASMANIA MINES LTD TMM MINERAL SANDS 322 TAWANA RESOURCES NL TAW DIAMONDS 323 TECTRONIC RESOURCES NL TTR GOLD PRODUCER 324 THUNDERLARRA EXPLORATION LTD THX MINING EXPLORER 325 TICOR LTD TOR MINERAL SANDS 326 TIGER RESOURCES NL TGS GOLD EXPLORER 327 TITAN RESOURCES NL TIR MINING PRODUCER 328 TOX FREE SOLUTIONS LTD TOX MINING SERVICES 329 TRIAKO RESOURCES LTD TKR MINING PRODUCER 330 TRIBUNE RESOURCES NL TBR MINING EXPLORER 331 TROY RESOURCES NL TRY GOLD EXPLORER 332 VICTORIA PETROLEUM NL VPE OIL/GAS EXPLORER 333 WEDGETAIL EXPLORATION NL WTE MINING PRODUCER 334 WERRIE GOLD LTD WER GOLD EXPLORER 335 WEST AUSTRALIAN METALS NL WME GOLD EXPLORER 336 WEST MUSHGRAVE MINING LTD WMM BASE METALS 337 WEST OIL NL WON OIL/GAS EXPLORER 338 WESTERN AREAS NL WSA MINING EXPLORER 339 WESTERN AUSTRALIAN DIAMOND TRUST WAD DIAMONDS 340 WESTERN METALS LTD WMT BASE METALS 341 WESTGOLD RESOURCES NL WGR GOLD EXPLORER 342 WHITTLE TECHNOLOGY LTD WTL MINING SERVICES 343 WOODSIDE PETROLEUM LTD WPL OIL/GAS PRODUCER 344 XENOLITH GOLD LTD XEN GOLD PRODUCER 345 YAMARNA GOLDFIELDS LTD YAM GOLD EXPLORER 346 YARDARINO LTD YDR MINERAL SANDS

Appendix A
215
Table A 2: List of Data Firms in the Study
No Company name ASX Code Industry classification
1 ADELAIDE RESOURCES LTD AND GOLD EXPLORER 2 AMADEUS PETROLEUM NL AMU OIL/GAS PRODUCER 3 AMALG RESOURCES NL ARC GOLD, COOPER 4 ANACONDA NICKEL LTD ANL BASE METALS 5 ANZOIL NL AZL OIL/GAS EXPLORER 6 ARC ENERGY NL ARQ OIL/GAS EXPLORER 7 AURORA GOLD LTD AUG GOLD, OTHER MINING 8 AUSTRAL COAL LTD AUO COAL 9 BEACH PETROLEUM NL BPT OIL/GAS PRODUCER 10 BHP BILLITON LTD BHP OIL, STEEL, MINING 11 BLIGH OIL & MINERALS NL BLO OIL/GAS PRODUCER 12 BOLNISI GOLD NL BSG GOLD PRODUCER 13 CALTEX AUSTRALIA LTD CTX OIL/GAS INVESTOR 14 CAPRAL ALUMINIUM LTD CAA DIVERSIFIED RESOURCES 15 CENTENNIAL COAL CO LTD CEY COAL 16 COAL & ALLIED INDUSTRIES LTD CAN COAL 17 CONSOLIDATED RUTILE LTD CRT MINERAL SANDS 18 CUMNOCK COAL LTD CMK COAL 19 DELTA GOLD LTD DGD GOLD PRODUCER 20 EMPEROR MINES LTD EMP GOLD PRODUCER 21 ENERGY EQUITY CORP LTD EEC OIL/GAS EXPLORER
22 ENERGY RESOURCES OF AUSTRALIA LTD ERA URANIUM
23 EQUATORIAL MINING LTD EQM MINING EXPLORER 24 EQUIGOLD NL EQI GOLD EXPLORER 25 GIANTS REEF MINING LTD GTM GOLD, OTHER MINING 26 GINDALBIE GOLD NL GBG GOLD EXPLORER 27 GOLD MINES OF SARDINIA LTD GMS GOLD EXPLORER 28 GOLDFIELDS LTD GLD GOLD PRODUCER 29 GYMPIE GOLD LTD GYM GOLD PRODUCER 30 HAOMA MINING NL HAO GOLD PRODUCER 31 HILL 50 GOLD NL HFY GOLD PRODUCER 32 ILUKA RESOURCES LTD ILU MINERAL SANDS 33 JUBILEE MINES NL JBM MINING EXPLORER 34 KALREZ ENERGY LTD KRZ OIL/GAS PRODUCER 35 KIDSTON GOLD MINES LTD KGM GOLD PRODUCER 36 KINGSGATE CONS NL KCN GOLD EXPLORER 37 LEYSHON RESOURCES LTD LRL GOLD PRODUCER 38 MAJESTIC RESOURCES NL MJN MINING EXPLORER 39 MARLBOROUGH RESOURCES NL MBG GOLD EXPLORER 40 MIM HOLDINGS LTD MIM DIVERSIFIED MINING
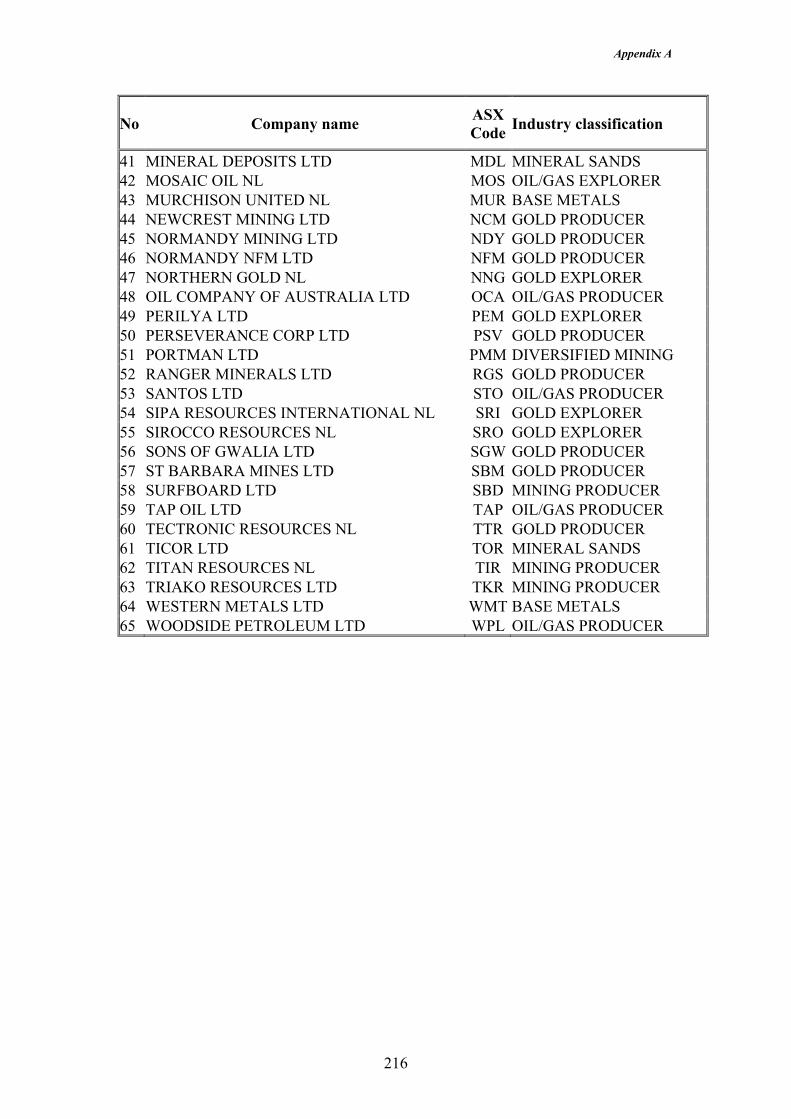
Appendix A
216
No Company name ASX Code Industry classification
41 MINERAL DEPOSITS LTD MDL MINERAL SANDS 42 MOSAIC OIL NL MOS OIL/GAS EXPLORER 43 MURCHISON UNITED NL MUR BASE METALS 44 NEWCREST MINING LTD NCM GOLD PRODUCER 45 NORMANDY MINING LTD NDY GOLD PRODUCER 46 NORMANDY NFM LTD NFM GOLD PRODUCER 47 NORTHERN GOLD NL NNG GOLD EXPLORER 48 OIL COMPANY OF AUSTRALIA LTD OCA OIL/GAS PRODUCER 49 PERILYA LTD PEM GOLD EXPLORER 50 PERSEVERANCE CORP LTD PSV GOLD PRODUCER 51 PORTMAN LTD PMM DIVERSIFIED MINING 52 RANGER MINERALS LTD RGS GOLD PRODUCER 53 SANTOS LTD STO OIL/GAS PRODUCER 54 SIPA RESOURCES INTERNATIONAL NL SRI GOLD EXPLORER 55 SIROCCO RESOURCES NL SRO GOLD EXPLORER 56 SONS OF GWALIA LTD SGW GOLD PRODUCER 57 ST BARBARA MINES LTD SBM GOLD PRODUCER 58 SURFBOARD LTD SBD MINING PRODUCER 59 TAP OIL LTD TAP OIL/GAS PRODUCER 60 TECTRONIC RESOURCES NL TTR GOLD PRODUCER 61 TICOR LTD TOR MINERAL SANDS 62 TITAN RESOURCES NL TIR MINING PRODUCER 63 TRIAKO RESOURCES LTD TKR MINING PRODUCER 64 WESTERN METALS LTD WMT BASE METALS 65 WOODSIDE PETROLEUM LTD WPL OIL/GAS PRODUCER

Appendix A
217
Table A 3: Components of Derivative Disclosure Index for BHP Billiton (2001) Possible
score BHP Score
Total Score
Policy Information Accounting policies and method adopted 1 1 a) Extent and nature of the underlying financial instruments, b)
including significant terms and conditions that may affect the amount, timing and uncertainty of future cash flows.
2 2
Objectives for holding or issuing derivative financial instruments 1 1 Component score of policy information 4 4 1 Hedges of Anticipated Transactions
a) A description of the anticipated transaction, b) including the period of time until they are expected to occur.
1 1
1 1
A description of the hedging instruments. 1 1 a) Amount of any deferred or unrecognised gain or loss and b) the expected timing of recognition as revenue or expense.
1 1
1 1
Component score of hedges of anticipated transactions 5 5 1 Risk Information
Contractual repricing or maturity dates for interest rate risk 1 1 Effective interest rates or weighted average 1 1 The maximum amount of credit risk exposure at reporting date 1 1
Component score of risk information 3 3 1 Net Fair Value Information
a) The aggregate net fair value as at the reporting date, b) showing separately the aggregate net fair value of those financial
assets or financial liabilities which are not readily traded on organised markets in standardised form.
1 1
1 1
The method or methods adopted in determining net fair value. 1 1 Any significant assumptions made in determining net fair value. 1 1 The carrying amount and the net fair value of either the individual
asset or appropriate groupings of those individual assets. 1 1
a) The reasons for not reducing the carrying amount, b) including the nature of the evidence that provides the basis for
management’s belief that the carrying amount will be recovered.
1 1
1 0
Component score of net fair value information 7 6 0.857143 Commodity Contracts Information
Contract for commodity gold 1 1 Component score of commodity contracts information 1 1 1
Transparency/Disclosure Quality = BHP’s Total Score/Total Possible Score = 4.857143/5 = 0.9714

Appendix B
218
APPENDIX B: FIRM CHARACTERISTICS MODEL YEAR-BY-YEAR AND AVERAGE FOUR YEARS ANALYSES

Appendix B
219
1. Year-by-Year and Average Four Years
1.1 Pooled Data
Time might influence the behaviour of all the variables and therefore might affect the
above results. The preceding analysis assumes that each firm-year can be treated as an
independent observation. However, the degree of freedom in calculating the
significance levels is overstated if the independent variables fail to remove
autocorrelation in the dependent variable (Lang and Lundholm, 1993). Therefore, the
regression analysis was repeated for each year and using four years average data.86
Table B 1 reports the regression results of the relationship between disclosure quality
and firm characteristics for 1998 to 2001 and for average data. Table B 1 indicates
that size is only significant in 2000 and 2001 at p = 0.05 and p < 0.001, respectively.
Size is also significant at p = 0.05 when the average data is used. Also significant is
profitability at p = 0.05 in 2000 and at p = 0.10 for average data. However, none of
the variables are significant in 1998 and 199987,88.
86 A similar approach was used in Lang and Lundholm (1993). 87 Except for 1998, there is no heteroscedasticity present in year-by-year and average regression analysis. The results for 1998 were based on White’s Heteroscedasticity Corrected Regression. 88 Results for the estimation without outliers are presented in Table E 2 Appendix E.
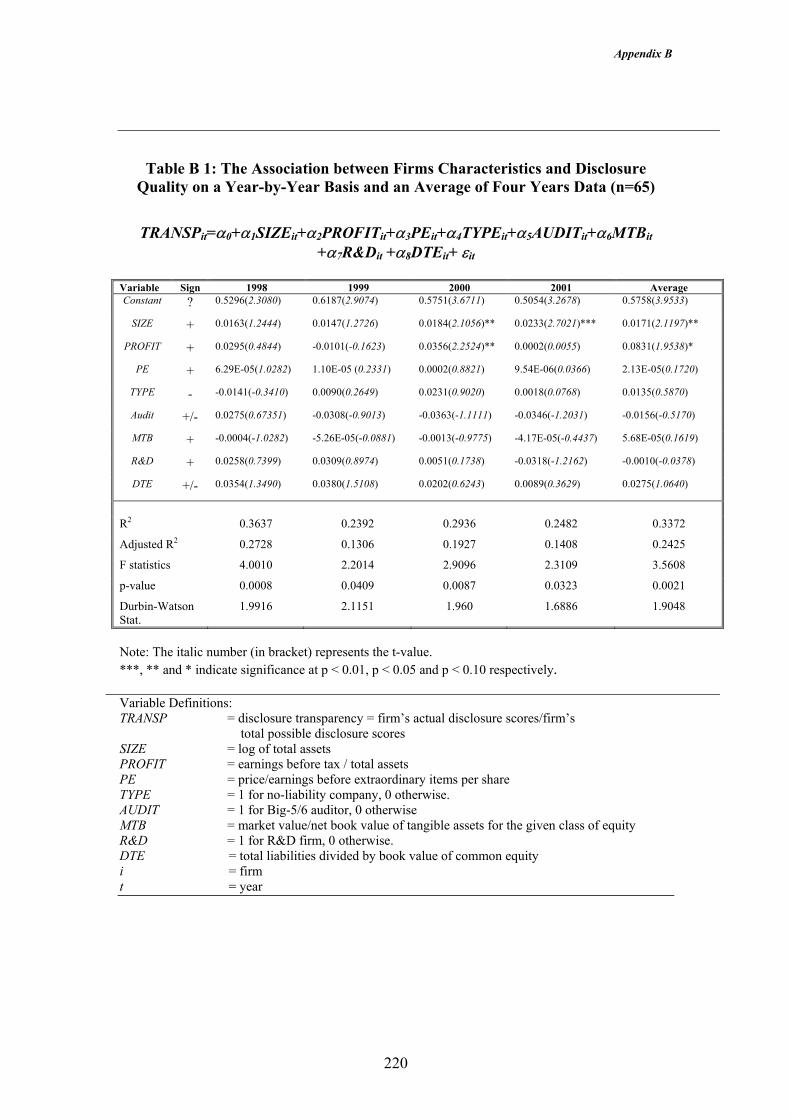
Appendix B
220
Table B 1: The Association between Firms Characteristics and Disclosure Quality on a Year-by-Year Basis and an Average of Four Years Data (n=65)
TRANSPit=α0+α1SIZEit+α2PROFITit+α3PEit+α4TYPEit+α5AUDITit+α6MTBit
+α7R&Dit +α8DTEit+ εit
Variable Sign 1998 1999 2000 2001 Average Constant ? 0.5296(2.3080) 0.6187(2.9074) 0.5751(3.6711) 0.5054(3.2678) 0.5758(3.9533)
SIZE + 0.0163(1.2444) 0.0147(1.2726) 0.0184(2.1056)** 0.0233(2.7021)*** 0.0171(2.1197)**
PROFIT + 0.0295(0.4844) -0.0101(-0.1623) 0.0356(2.2524)** 0.0002(0.0055) 0.0831(1.9538)*
PE + 6.29E-05(1.0282) 1.10E-05 (0.2331) 0.0002(0.8821) 9.54E-06(0.0366) 2.13E-05(0.1720)
TYPE - -0.0141(-0.3410) 0.0090(0.2649) 0.0231(0.9020) 0.0018(0.0768) 0.0135(0.5870)
Audit +/- 0.0275(0.67351) -0.0308(-0.9013) -0.0363(-1.1111) -0.0346(-1.2031) -0.0156(-0.5170)
MTB + -0.0004(-1.0282) -5.26E-05(-0.0881) -0.0013(-0.9775) -4.17E-05(-0.4437) 5.68E-05(0.1619)
R&D + 0.0258(0.7399) 0.0309(0.8974) 0.0051(0.1738) -0.0318(-1.2162) -0.0010(-0.0378)
DTE +/- 0.0354(1.3490) 0.0380(1.5108) 0.0202(0.6243) 0.0089(0.3629) 0.0275(1.0640)
R2 0.3637 0.2392 0.2936 0.2482 0.3372
Adjusted R2 0.2728 0.1306 0.1927 0.1408 0.2425
F statistics 4.0010 2.2014 2.9096 2.3109 3.5608
p-value 0.0008 0.0409 0.0087 0.0323 0.0021
Durbin-Watson Stat.
1.9916 2.1151 1.960 1.6886 1.9048
Note: The italic number (in bracket) represents the t-value. ***, ** and * indicate significance at p < 0.01, p < 0.05 and p < 0.10 respectively.
Variable Definitions: TRANSP = disclosure transparency = firm’s actual disclosure scores/firm’s total possible disclosure scores SIZE = log of total assets PROFIT = earnings before tax / total assets PE = price/earnings before extraordinary items per share TYPE = 1 for no-liability company, 0 otherwise. AUDIT = 1 for Big-5/6 auditor, 0 otherwise MTB = market value/net book value of tangible assets for the given class of equity R&D = 1 for R&D firm, 0 otherwise. DTE = total liabilities divided by book value of common equity i = firm t = year
Appendix B
221
1.2 Rank Transformation Procedure
Table B 2 shows the results of ranked regressions for the year-by-year and average
data. The table indicates that leverage is positively significant at p < 0.05 (for 1999,
2000 and 2001) and at p < 0.10 (1998 and average data). A departure from previous
results in Table B 1 is that the price-earnings ratio and R&D are documented as being
significantly related to transparency. The price-earnings ratio is positive and
significantly related to transparency at p < 0.05 for 1998 and at p = 0.01 for 2000 and
for the average data. However, R&D is negatively related to transparency at p =
0.0631 in 2001. Consistent with the findings presented earlier in Table B 1, size is not
significant in 1998 to 200089.
89 The model is re-estimated with the outliers excluded, and the results are consistent with the full sample for 1999 and 2001. Also documented as significant are size (p = 0.096) in 1998, and type (p = 0.10) and market-to-book ratio (p = 0.10) in 2000. Please refer to Table E 4 Appendix E.

Appendix B
222
Table B 2: Results of Regression Analysis of the Association between Disclosure Transparency and Firms Characteristics: Ranked Transformation Year-by-Year
Basis and an Average of Four Years Data (n=65)
RTRANSPit=α0+α1RSIZEit+α2RPROFITit+α3RPEit+α4TYPEit+α5AUDITit
+α6RMTBit+α7R&Dit +α8RDTEit+ εit
Variable Sign 1998 1999 2000 2001 Average
Constant ? -1.6311(-0.1513) 11.3338(1.0231) -0.3126(-0.0327) 12.2362(1.3574) -0.3448(-0.0401)
RSIZE + 0.3489(1.5457) 0.3441(1.3742) 0.3082(1.4997) 0.5289(2.5131)** 0.4950(2.4063)**
RPROFIT + 0.0651(0.5202) 0.0449(0.3207) 0.1007(0.7465) -0.1327(-0.8845) -0.1118(-0.8609)
RPE + 0.2538(2.2119)** 0.1295(0.9058) 0.4025(3.1028)*** 0.1262(09221) 0.3289(2.9072)***
TYPE - 4.5127(0.6987) 7.3515(1.1111) 8.4531(1.5461) -1.9163(-0.3543) 4.3767(0.8670)
Audit +/- 4.3953(0.8124) -8.4463(-1.3260) 0.2320(0.0358) -6.6545(-0.9327) -1.1674(-0.1891)
RMTB + -0.0546(-0.5281) -0.0501(-0.4307) -0.1632(-1.5469) 0.1154(1.0071) 0.0914(0.8493)
R&D + -1.7565(-0.3421) 1.2673(0.2052) -5.0549(-0.8653) -11.4372(-1.8960)* -6.4618(-1.1869)
RDTE +/- 0.2880(1.9988)* 0.3026(2.0738)** 0.3180(2.2104)** 0.2861(2.1446)** 0.2498(1.9579)*
Adjusted R2 0.3988 0.2047 0.3248 0.2804 0.3831 F statistics 6.3065 3.0590 4.8482 4.1170 5.9673 p-value 0.0000 0.0063 0.0001 0.0006 0.0000 Durbin-Watson Stat.
2.0934 2.0785 1.8453 1.8655 2.0722
Note: The italic number (in bracket) represents the t-value.
***, ** and * indicate significance at p < 0.01, p < 0.05 and p < 0.10 respectively.
Variable Definitions: RTRANSP = rank of disclosure (transparency) RSIZE = rank of total assets (in thousands) RPROFIT = rank of profitability RPE = rank of price/earnings ratio TYPE = 1 for no-liability company, 0 otherwise. AUDIT = 1 for Big-5/6 auditor, 0 otherwise RMTB = rank of market-to-book ratio R&D = 1 for R&D firm, 0 otherwise. RDTE = rank of total liabilities divided by book value of common equity i = firm t = year

Appendix C
223
APPENDIX C: RESULTS ON MARKET VALUE MODEL FOR YEAR-BY-YEAR ANALYSIS
Appendix C
224
1. Results of the Year-By-Year Analysis
The evidence reported previously in section 8.2 in chapter 8 indicates that the
significance of derivative disclosures varies for the pooled data. Hence, equations 6.3
to 6.12 are re-estimated on a year-by-year basis. Table C 1 presents the results for
equations 6.3 and 6.4. Panel A indicates that the disclosure quality of derivative
information is positive and significant at p < 0.01 in 1998, 2000 and 2001 and at p <
0.05 in 1999. These significant results indicate that market participants consider the
quality of derivative information as an important factor in firm valuation. However,
the only component that is consistently significant for each of the four years is hedge
information. Panel B also indicates that the net fair value component is significant at p
< 0.10 in 2001. The risk component also significant at p < 0.05 in 2000 and at p <
0.01 in 2001.
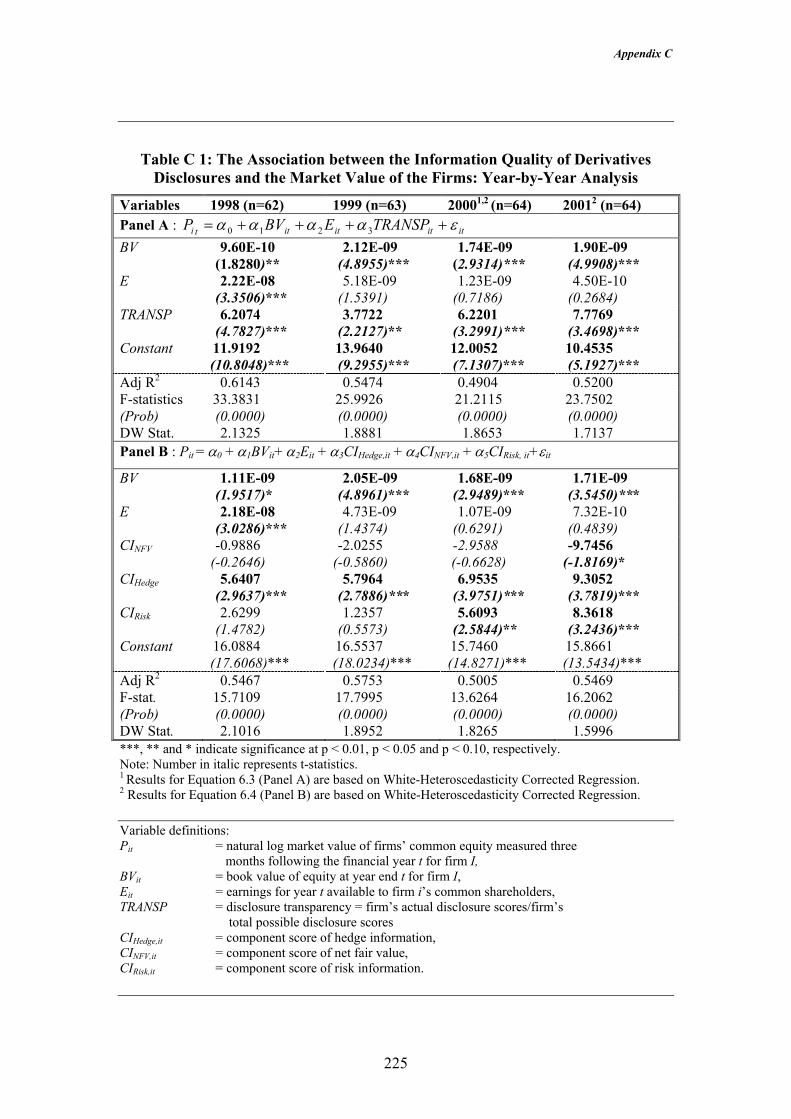
Appendix C
225
Table C 1: The Association between the Information Quality of Derivatives Disclosures and the Market Value of the Firms: Year-by-Year Analysis
Variables 1998 (n=62) 1999 (n=63) 20001,2 (n=64) 20012 (n=64) Panel A : ititititti TRANSPEBVP εαααα ++++= 3210 BV 9.60E-10
(1.8280)** 2.12E-09
(4.8955)*** 1.74E-09
(2.9314)*** 1.90E-09
(4.9908)*** E 2.22E-08
(3.3506)*** 5.18E-09
(1.5391) 1.23E-09
(0.7186) 4.50E-10
(0.2684) TRANSP 6.2074
(4.7827)*** 3.7722
(2.2127)** 6.2201
(3.2991)*** 7.7769
(3.4698)*** Constant 11.9192
(10.8048)*** 13.9640 (9.2955)***
12.0052 (7.1307)***
10.4535 (5.1927)***
Adj R2 0.6143 0.5474 0.4904 0.5200 F-statistics (Prob)
33.3831 (0.0000)
25.9926 (0.0000)
21.2115 (0.0000)
23.7502 (0.0000)
DW Stat. 2.1325 1.8881 1.8653 1.7137 Panel B : Pit = α0 + α1BVit+ α2Eit + α3CIHedge,it + α4CINFV,it + α5CIRisk, it+εit
BV 1.11E-09 (1.9517)*
2.05E-09 (4.8961)***
1.68E-09 (2.9489)***
1.71E-09 (3.5450)***
E 2.18E-08 (3.0286)***
4.73E-09 (1.4374)
1.07E-09 (0.6291)
7.32E-10 (0.4839)
CINFV -0.9886 (-0.2646)
-2.0255 (-0.5860)
-2.9588 (-0.6628)
-9.7456 (-1.8169)*
CIHedge 5.6407 (2.9637)***
5.7964 (2.7886)***
6.9535 (3.9751)***
9.3052 (3.7819)***
CIRisk 2.6299 (1.4782)
1.2357 (0.5573)
5.6093 (2.5844)**
8.3618 (3.2436)***
Constant 16.0884 (17.6068)***
16.5537 (18.0234)***
15.7460 (14.8271)***
15.8661 (13.5434)***
Adj R2 0.5467 0.5753 0.5005 0.5469 F-stat. (Prob)
15.7109 (0.0000)
17.7995 (0.0000)
13.6264 (0.0000)
16.2062 (0.0000)
DW Stat. 2.1016 1.8952 1.8265 1.5996 ***, ** and * indicate significance at p < 0.01, p < 0.05 and p < 0.10, respectively. Note: Number in italic represents t-statistics. 1 Results for Equation 6.3 (Panel A) are based on White-Heteroscedasticity Corrected Regression. 2 Results for Equation 6.4 (Panel B) are based on White-Heteroscedasticity Corrected Regression. Variable definitions: Pit = natural log market value of firms’ common equity measured three
months following the financial year t for firm I, BVit = book value of equity at year end t for firm I, Eit = earnings for year t available to firm i’s common shareholders, TRANSP = disclosure transparency = firm’s actual disclosure scores/firm’s
total possible disclosure scores CIHedge,it = component score of hedge information, CINFV,it = component score of net fair value, CIRisk,it = component score of risk information.
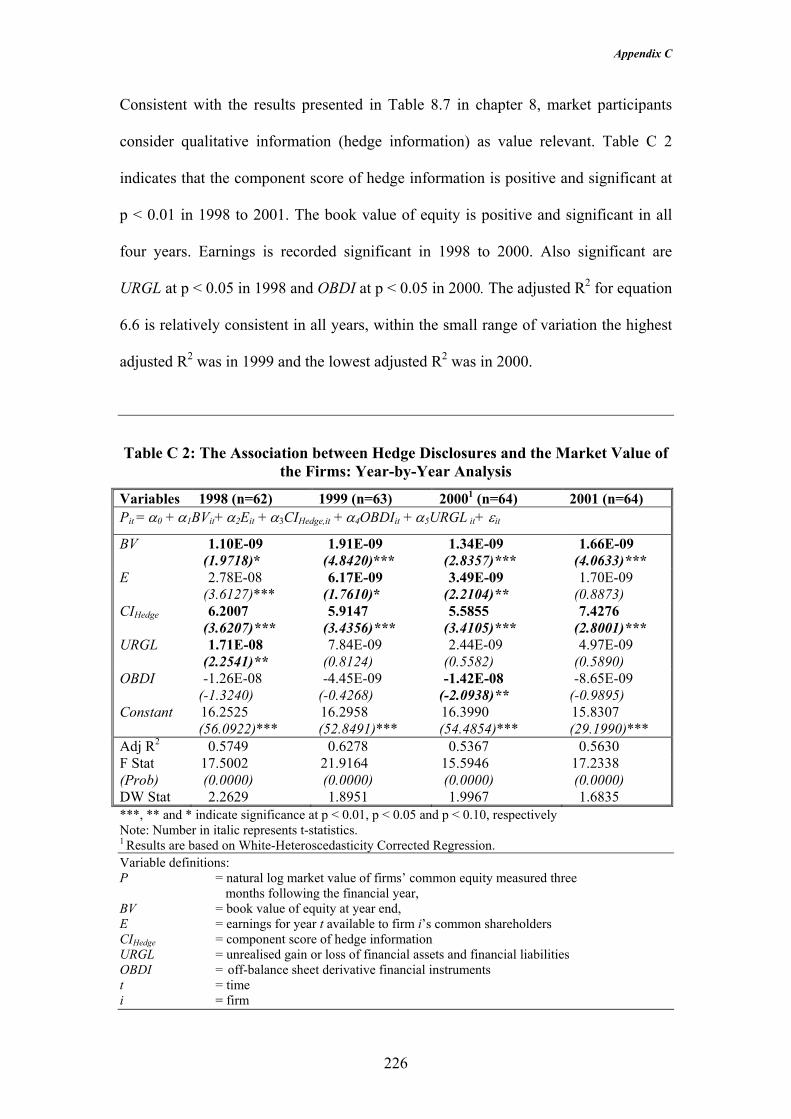
Appendix C
226
Consistent with the results presented in Table 8.7 in chapter 8, market participants
consider qualitative information (hedge information) as value relevant. Table C 2
indicates that the component score of hedge information is positive and significant at
p < 0.01 in 1998 to 2001. The book value of equity is positive and significant in all
four years. Earnings is recorded significant in 1998 to 2000. Also significant are
URGL at p < 0.05 in 1998 and OBDI at p < 0.05 in 2000. The adjusted R2 for equation
6.6 is relatively consistent in all years, within the small range of variation the highest
adjusted R2 was in 1999 and the lowest adjusted R2 was in 2000.
Table C 2: The Association between Hedge Disclosures and the Market Value of the Firms: Year-by-Year Analysis
Variables 1998 (n=62) 1999 (n=63) 20001 (n=64) 2001 (n=64)
Pit = α0 + α1BVit+ α2Eit + α3CIHedge,it + α4OBDIit + α5URGL it+ εit
BV 1.10E-09 (1.9718)*
1.91E-09 (4.8420)***
1.34E-09 (2.8357)***
1.66E-09 (4.0633)***
E 2.78E-08 (3.6127)***
6.17E-09 (1.7610)*
3.49E-09 (2.2104)**
1.70E-09 (0.8873)
CIHedge 6.2007 (3.6207)***
5.9147 (3.4356)***
5.5855 (3.4105)***
7.4276 (2.8001)***
URGL 1.71E-08 (2.2541)**
7.84E-09 (0.8124)
2.44E-09 (0.5582)
4.97E-09 (0.5890)
OBDI -1.26E-08 (-1.3240)
-4.45E-09 (-0.4268)
-1.42E-08 (-2.0938)**
-8.65E-09 (-0.9895)
Constant 16.2525 (56.0922)***
16.2958 (52.8491)***
16.3990 (54.4854)***
15.8307 (29.1990)***
Adj R2 0.5749 0.6278 0.5367 0.5630 F Stat (Prob)
17.5002 (0.0000)
21.9164 (0.0000)
15.5946 (0.0000)
17.2338 (0.0000)
DW Stat 2.2629 1.8951 1.9967 1.6835 ***, ** and * indicate significance at p < 0.01, p < 0.05 and p < 0.10, respectively Note: Number in italic represents t-statistics. 1 Results are based on White-Heteroscedasticity Corrected Regression. Variable definitions: P = natural log market value of firms’ common equity measured three
months following the financial year, BV = book value of equity at year end, E = earnings for year t available to firm i’s common shareholders CIHedge = component score of hedge information URGL = unrealised gain or loss of financial assets and financial liabilities OBDI = off-balance sheet derivative financial instruments t = time i = firm

Appendix C
227
Table C 3 provides evidence on the value relevance of the net fair value of financial
instruments and off-balance sheet derivative financial instruments. The results are
based on the estimation without the TBFI since the variable is correlated with TFFI.
Table C 3 indicates that BVNFI is significant in all years at p < 0.001 in 1998 and
1999, and at p < 0.10 in 2000 and 2001. Also recorded as significant are earnings
(1998 and 2000), TFFI in 1998 and 1999 and OBDI in 1999 to 2001.
Table C 3:The Association between Net Fair Value and Market Value: Year-by-Year Analysis
Variables 19981 (n=62) 1999 (n=63) 2000 (n=64) 20011 (n=64) Pit = α0 + α1BVNFIit+ α2Eit + α3TFFIit + α4OBDIit + α5CINFV,it +εit
BVNFI 4.02E-09 (3.6659)***
2.92E-09 (3.8317)***
1.19E-09 (1.8444)*
1.25E-09 (1.7059)*
E 1.43E-08 (1.8285)*
5.05E-09 (1.5198)
3.78E-09 (2.3254)**
2.45E-09 (1.5910)
TFFI 6.37E-09 (3.0235)***
3.82E-09 (2.6034)**
6.96E-10 (0.5111)
5.38E-10 (0.3202)
OBDI 6.05E-10 (0.0836)
2.97E-09 (1.8499)*
-1.21E-08 (-3.0834)***
-3.64E-09 (-5.4590)***
CINFV -3.9422 (-1.1234)
-3.2602 (-1.0452)
-3.4104 (-0.8656)
-5.2243 (-0.9988)
Constant 17.8207 (24.0082)***
17.8219 (26.6834)***
18.0477 (22.7052)***
18.2999 (16.9152)***
Adj R2 0.5002 0.5692 0.4892 0.5146 F-statistics (Prob)
13.2081 (0.0000)
17.3840 (0.0000)
13.0652 (0.0000)
14.3580 (0.0000)
DW Stat. 2.3239 1.9930 2.0815 1.9024 ***, ** and * indicate significance at p < 0.01, p < 0.05 and p < 0.10, respectively. Note: Number in italic represents t-statistics. 1 Results are based on White-Heteroscedasticity Corrected Regression. Variable definitions: P = natural log market value of firms’ common equity measured three
months following the financial year BVNFI = book value of non financial instruments E = earnings for year t available to firm i’s common shareholders TBFI = total book value of financial instruments TFFI = net fair value of financial instruments OBDI = off-balance sheet derivative financial instruments CINFV = component score of net fair value t = time i = firm
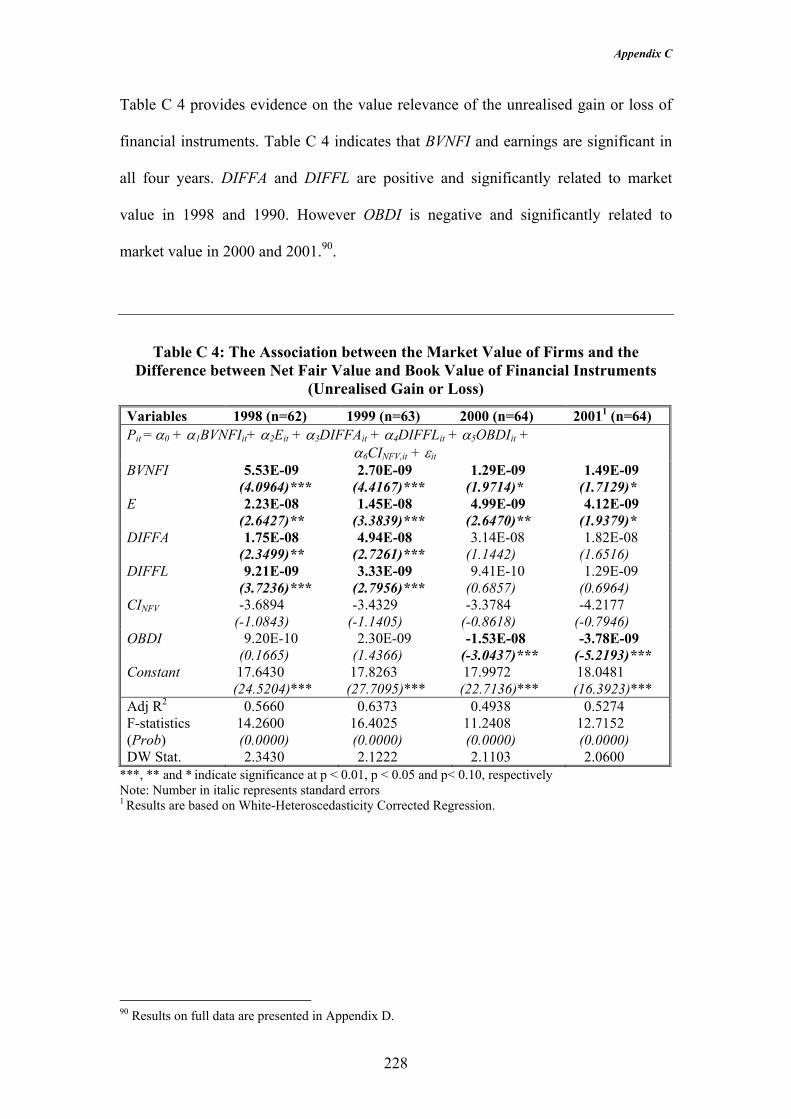
Appendix C
228
Table C 4 provides evidence on the value relevance of the unrealised gain or loss of
financial instruments. Table C 4 indicates that BVNFI and earnings are significant in
all four years. DIFFA and DIFFL are positive and significantly related to market
value in 1998 and 1990. However OBDI is negative and significantly related to
market value in 2000 and 2001.90.
Table C 4: The Association between the Market Value of Firms and the Difference between Net Fair Value and Book Value of Financial Instruments
(Unrealised Gain or Loss)
Variables 1998 (n=62) 1999 (n=63) 2000 (n=64) 20011 (n=64) Pit = α0 + α1BVNFIit+ α2Eit + α3DIFFAit + α4DIFFLit + α5OBDIit +
α6CINFV,it + εit BVNFI 5.53E-09
(4.0964)*** 2.70E-09
(4.4167)*** 1.29E-09
(1.9714)* 1.49E-09
(1.7129)* E 2.23E-08
(2.6427)** 1.45E-08
(3.3839)*** 4.99E-09
(2.6470)** 4.12E-09
(1.9379)* DIFFA 1.75E-08
(2.3499)** 4.94E-08
(2.7261)*** 3.14E-08
(1.1442) 1.82E-08
(1.6516) DIFFL 9.21E-09
(3.7236)*** 3.33E-09
(2.7956)*** 9.41E-10
(0.6857) 1.29E-09
(0.6964) CINFV -3.6894
(-1.0843) -3.4329
(-1.1405) -3.3784
(-0.8618) -4.2177
(-0.7946) OBDI 9.20E-10
(0.1665) 2.30E-09
(1.4366) -1.53E-08
(-3.0437)*** -3.78E-09
(-5.2193)***
Constant 17.6430 (24.5204)***
17.8263 (27.7095)***
17.9972 (22.7136)***
18.0481 (16.3923)***
Adj R2 0.5660 0.6373 0.4938 0.5274 F-statistics (Prob)
14.2600 (0.0000)
16.4025 (0.0000)
11.2408 (0.0000)
12.7152 (0.0000)
DW Stat. 2.3430 2.1222 2.1103 2.0600 ***, ** and * indicate significance at p < 0.01, p < 0.05 and p< 0.10, respectively Note: Number in italic represents standard errors 1 Results are based on White-Heteroscedasticity Corrected Regression.
90 Results on full data are presented in Appendix D.

Appendix C
229
Variable definitions: P = natural log market value of firms’ common equity measured three
months following the financial year BVNFI = book value of non financial instruments E = earnings for year t available to firm i’s common shareholders TBFI = total book value of financial instruments OBDI = off-balance sheet derivative financial instruments DIFFA = difference between net fair value of financial assets and book
value of financial assets. DIFFL = difference between net fair value of financial liabilities and book
value of financial liabilities. CINFV = component score of net fair value t = time i = firm

Appendix D
230
APPENDIX D: FURTHER TEST
Appendix D
231
Results for Refined Data
This appendix provides supporting evidence for the results presented in chapter eight.
The results presented in this appendix generally support the results presented in
previous chapters. This appendix provides evidence that the quality of derivatives
disclosure in the financial statement is value relevant as reported in chapter eight.
Market participants regard the net fair value information and risk information as
important as the book value of equity. However, these results have undoubtedly been
influenced by certain periods of time and this is especially the case for net fair value
information. To a limited extent, net fair value of financial instruments, the unrealised
gain or loss of financial liabilities and off-balance sheet derivative financial
instruments are value relevant.
Venkatachalam (1996) indicates that one plausible explanation for insignificant and
inconsistent results for the fair value of off-balance sheet items was due to setting this
variable to zero for firms that either reported no off-balance sheet obligations or
considered the fair value to be equal to the carrying value. The same approach was
performed in the current study, where the off-balance sheet derivative financial
instruments (OBDI) of 93 observations is set to zero for firms either reporting no
OBDI or firms that did not report anything about OBDI. Hence the above results may
be subject to the same distortion. Therefore, the above models are re-estimated using
the refined data of 162 firms. Further, six of the firm/years are deleted due to
substantial differences in the book value of equity and earnings compared to the rest
of the sample.
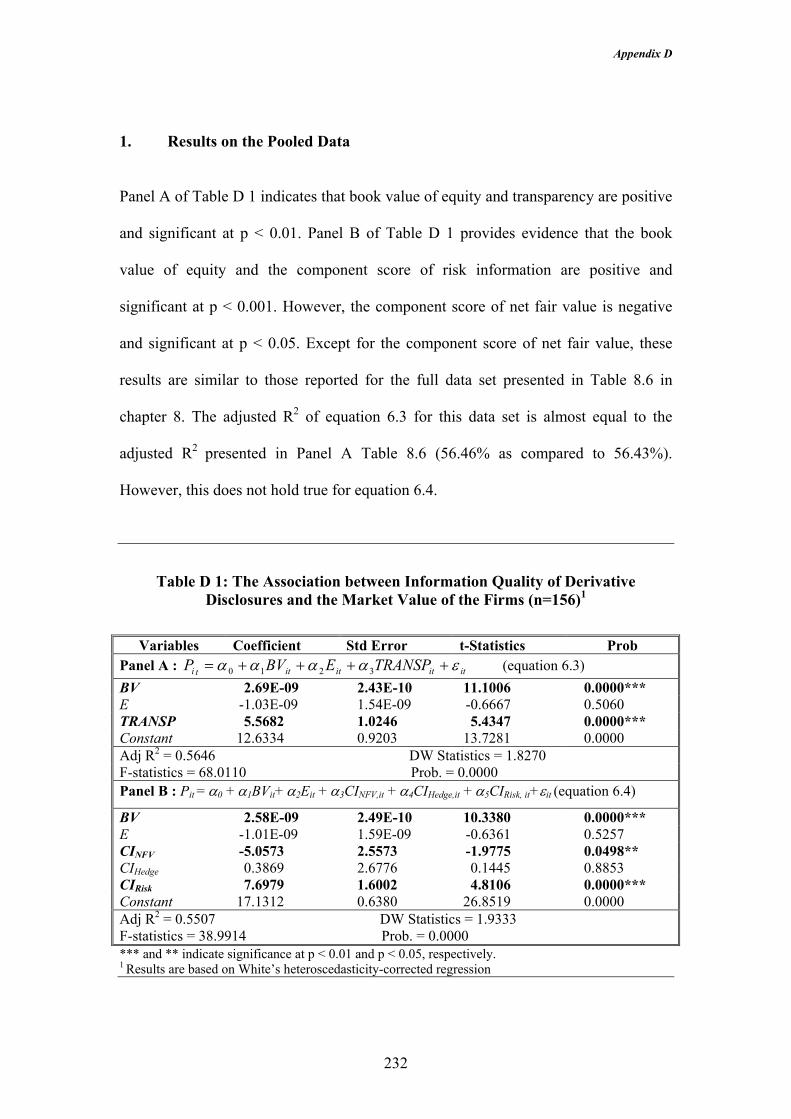
Appendix D
232
1. Results on the Pooled Data
Panel A of Table D 1 indicates that book value of equity and transparency are positive
and significant at p < 0.01. Panel B of Table D 1 provides evidence that the book
value of equity and the component score of risk information are positive and
significant at p < 0.001. However, the component score of net fair value is negative
and significant at p < 0.05. Except for the component score of net fair value, these
results are similar to those reported for the full data set presented in Table 8.6 in
chapter 8. The adjusted R2 of equation 6.3 for this data set is almost equal to the
adjusted R2 presented in Panel A Table 8.6 (56.46% as compared to 56.43%).
However, this does not hold true for equation 6.4.
Table D 1: The Association between Information Quality of Derivative Disclosures and the Market Value of the Firms (n=156)1
Variables Coefficient Std Error t-Statistics Prob
Panel A : ititititti TRANSPEBVP εαααα ++++= 3210 (equation 6.3) BV 2.69E-09 2.43E-10 11.1006 0.0000*** E -1.03E-09 1.54E-09 -0.6667 0.5060 TRANSP 5.5682 1.0246 5.4347 0.0000*** Constant 12.6334 0.9203 13.7281 0.0000 Adj R2 = 0.5646 DW Statistics = 1.8270 F-statistics = 68.0110 Prob. = 0.0000 Panel B : Pit = α0 + α1BVit+ α2Eit + α3CINFV,it + α4CIHedge,it + α5CIRisk, it+εit (equation 6.4)
BV 2.58E-09 2.49E-10 10.3380 0.0000*** E -1.01E-09 1.59E-09 -0.6361 0.5257 CINFV -5.0573 2.5573 -1.9775 0.0498** CIHedge 0.3869 2.6776 0.1445 0.8853 CIRisk 7.6979 1.6002 4.8106 0.0000*** Constant 17.1312 0.6380 26.8519 0.0000 Adj R2 = 0.5507 DW Statistics = 1.9333 F-statistics = 38.9914 Prob. = 0.0000 *** and ** indicate significance at p < 0.01 and p < 0.05, respectively. 1 Results are based on White’s heteroscedasticity-corrected regression

Appendix D
233
Variable definitions: P = natural log market value of firms’ common equity measured three
months following the financial year BV = book value of equity at year end E = earnings for year available to firm’s common shareholders TRANSP = disclosure transparency = firm’s actual disclosure scores/firm’s
total possible disclosure scores CIHedge, = component score of hedge information CINFV = component score of net fair value CIRisk = component score of risk information i = firm t = year
Table D 2 presents the results for the value relevance of hedge disclosures and the
market value of the firms. The results indicate that only book value of equity is
significant in both models. A departure from the results previously presented in Table
8.7 is the insignificance of hedge information in both models.
Table D 2: The Association between Hedge Disclosure and the Market Value of the Firms (n=156)1
Variables Coefficient Std Error T-statistics Prob Pit = α0 + α1BVit+ α2Eit + α3CHedge,it + α4OBDIit + α5URGL it+ εit BV 2.88E-09 2.67E-10 10.7693 0.0000*** E -9.77E-10 1.57E-09 -0.6229 0.5343 CIHedge 3.0556 2.6225 1.1652 0.2458 OBDI 4.71E-09 6.38E-09 0.7378 0.4618 URGL -5.34E-09 6.45E-09 -0.8279 0.4091 Constant 17.0214 0.5538 30.7350 0.0000 Adj R2 = 0.5192 Durbin Watson = 1.8828 F-statistics = 32.3970 Prob 0.0000
*** indicates significance at p < 0.01 1 Results are based on White’s Heteroscedasticity Corrected Regression Variable definitions: P = natural log market value of firms’ common equity measured three
months following the financial year, BV = book value of equity at year end, E = earnings for year t available to firm i’s common shareholders CIHedge = component score of hedge information URGL = unrealised gain or loss of financial assets and financial liabilities OBDI = off-balance sheet derivative financial instruments t = time i = firm

Appendix D
234
Table D 3 indicates that the net fair value fair value of financial instruments (TFFI)
and BVNFI are significant. The adjusted R2 for this data set is 49.10% compared to
49.98% for the results presented in Table 8.8.
Table D 3: The Association between Net Fair Value and Market Value (n=156) Variables Coefficient Std Error t-statistics Prob Pit = α0 + α1BVNFIit+ α2Eit + α3TFFIit + α4OBDIit + α5CINFV,it +εit
BVNFI 2.57E-09 4.55E-10 5.6497 0.0000*** E -9.14E-10 1.76E-09 -0.5193 0.6043 TFFI 2.05E-09 9.56E10 2.1489 0.0332** OBDI -6.62E-10 8.32E-10 -0.7951 0.4278 CINFV -0.6293 2.6363 -0.2387 0.8117 Constant 17.7700 0.5187 34.2561 0.0000 Adj R2 = 0.4910 Durbin Watson = 1.9344 F-statistics = 30.9026 Prob 0.0000 ***, ** and * indicate significance at p < 0.01 level, p < 0.05 and p < 0.10, respectively Variable definitions: P = natural log market value of firms’ common equity measured three
months following the financial year BVNFI = book value of non financial instruments E = earnings for year t available to firm i’s common shareholders TBFI = total book value of financial instruments TFFI = net fair value of financial instruments OBDI = off-balance sheet derivative financial instruments CINFV = component score of net fair value t = time i = firm
Table D 4 provides evidence on the association between URGL and the market value
of the firm. Consistent with the results of Simko (1999), Table D 4 indicates that the
unrealised gain or loss of financial liabilities is significant at p < 0.001. The adjusted
R2 for the equations presented in Table D 4 is higher than the adjusted R2 of Table 8.9.
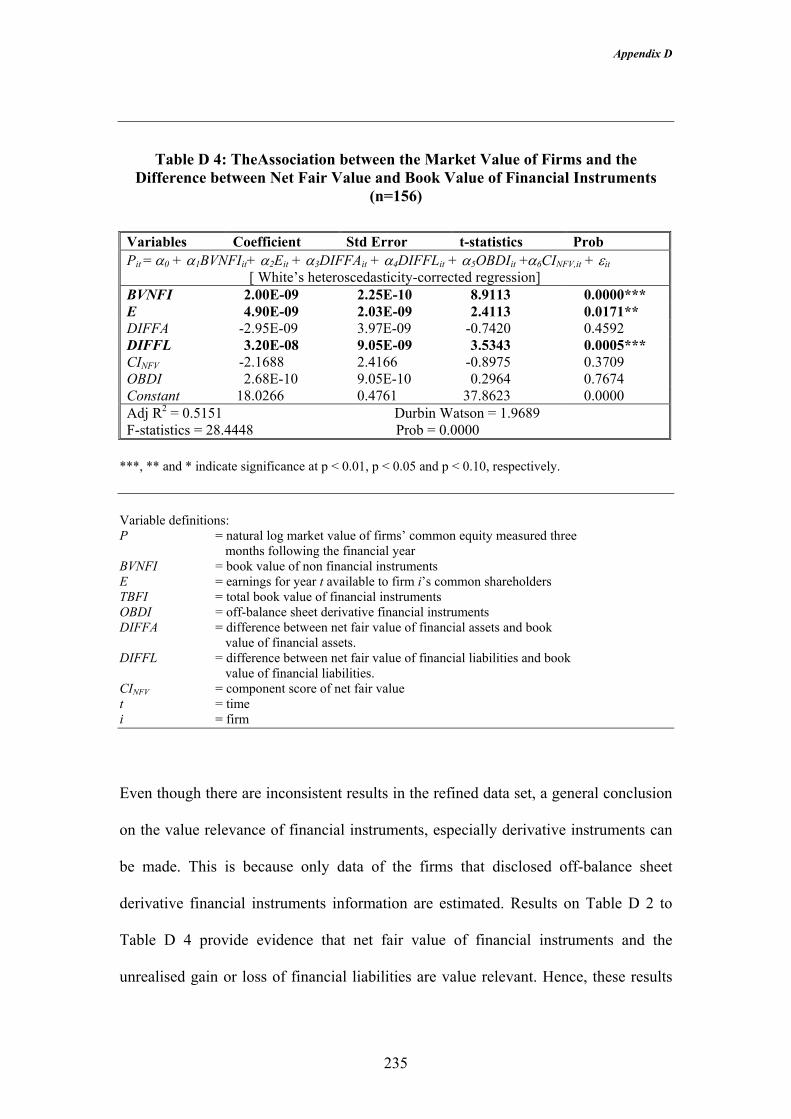
Appendix D
235
Table D 4: TheAssociation between the Market Value of Firms and the Difference between Net Fair Value and Book Value of Financial Instruments
(n=156) Variables Coefficient Std Error t-statistics Prob Pit = α0 + α1BVNFIit+ α2Eit + α3DIFFAit + α4DIFFLit + α5OBDIit +α6CINFV,it + εit
[ White’s heteroscedasticity-corrected regression] BVNFI 2.00E-09 2.25E-10 8.9113 0.0000*** E 4.90E-09 2.03E-09 2.4113 0.0171** DIFFA -2.95E-09 3.97E-09 -0.7420 0.4592 DIFFL 3.20E-08 9.05E-09 3.5343 0.0005*** CINFV -2.1688 2.4166 -0.8975 0.3709 OBDI 2.68E-10 9.05E-10 0.2964 0.7674
Constant 18.0266 0.4761 37.8623 0.0000 Adj R2 = 0.5151 Durbin Watson = 1.9689 F-statistics = 28.4448 Prob = 0.0000
***, ** and * indicate significance at p < 0.01, p < 0.05 and p < 0.10, respectively. Variable definitions: P = natural log market value of firms’ common equity measured three
months following the financial year BVNFI = book value of non financial instruments E = earnings for year t available to firm i’s common shareholders TBFI = total book value of financial instruments OBDI = off-balance sheet derivative financial instruments DIFFA = difference between net fair value of financial assets and book
value of financial assets. DIFFL = difference between net fair value of financial liabilities and book
value of financial liabilities. CINFV = component score of net fair value t = time i = firm
Even though there are inconsistent results in the refined data set, a general conclusion
on the value relevance of financial instruments, especially derivative instruments can
be made. This is because only data of the firms that disclosed off-balance sheet
derivative financial instruments information are estimated. Results on Table D 2 to
Table D 4 provide evidence that net fair value of financial instruments and the
unrealised gain or loss of financial liabilities are value relevant. Hence, these results
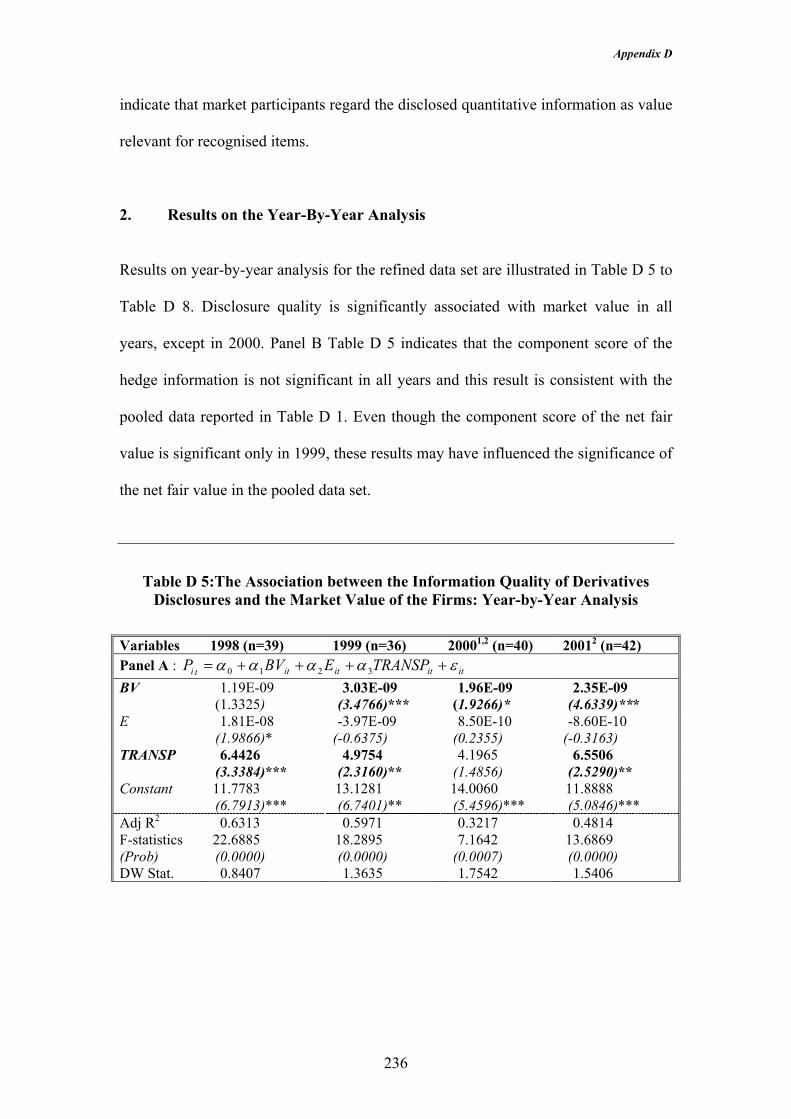
Appendix D
236
indicate that market participants regard the disclosed quantitative information as value
relevant for recognised items.
2. Results on the Year-By-Year Analysis
Results on year-by-year analysis for the refined data set are illustrated in Table D 5 to
Table D 8. Disclosure quality is significantly associated with market value in all
years, except in 2000. Panel B Table D 5 indicates that the component score of the
hedge information is not significant in all years and this result is consistent with the
pooled data reported in Table D 1. Even though the component score of the net fair
value is significant only in 1999, these results may have influenced the significance of
the net fair value in the pooled data set.
Table D 5:The Association between the Information Quality of Derivatives Disclosures and the Market Value of the Firms: Year-by-Year Analysis
Variables 1998 (n=39) 1999 (n=36) 20001,2 (n=40) 20012 (n=42) Panel A : ititititti TRANSPEBVP εαααα ++++= 3210 BV 1.19E-09
(1.3325) 3.03E-09
(3.4766)*** 1.96E-09
(1.9266)* 2.35E-09
(4.6339)*** E 1.81E-08
(1.9866)* -3.97E-09
(-0.6375) 8.50E-10
(0.2355) -8.60E-10
(-0.3163) TRANSP 6.4426
(3.3384)*** 4.9754
(2.3160)** 4.1965
(1.4856) 6.5506
(2.5290)** Constant 11.7783
(6.7913)*** 13.1281 (6.7401)**
14.0060 (5.4596)***
11.8888 (5.0846)***
Adj R2 0.6313 0.5971 0.3217 0.4814 F-statistics (Prob)
22.6885 (0.0000)
18.2895 (0.0000)
7.1642 (0.0007)
13.6869 (0.0000)
DW Stat. 0.8407 1.3635 1.7542 1.5406

Appendix D
237
Panel B : Pit = α0 + α1BVit+ α2Eit + α3CIHedge,it + α4CINFV,it + α5CIRisk, it+εit
BV 1.80E-09 (1.7069)*
2.72E-09 (3.0101)***
1.86E-09 (1.8868)*
1.97E-09 (3.5357)***
E 1.31E-08 (1.2303)
-3.18E-09 (-0.5080)
4.33E-10 (0.1229)
4.59E-10 (0.1466)
CINFV 2.6527 (0.4982)
-10.8648 (-2.3837)**
-4.9873 (-0.8711)
-9.5838 (-1.1732)
CIHedge -6.2751 (-1.0363)
-0.9937 (-0.2366)
4.0046 (0.9818)
2.4856 (0.3022)
CIRisk 4.9100 (1.7154)*
8.5689 (2.4367)**
7.4287 (1.9230)*
12.5015 (2.7161)**
Constant 17.3722 (13.8069)***
18.3860 (15.8976)***
16.5026 (11.9650)***
16.7912 (9.4107)***
Adj R2 0.5460 0.6023 0.3275 0.4893 F-stat. (Prob)
10.1407 (0.0000)
11.6023 (0.0000)
4.7981 (0.0020)
8.8566 (0.0000)
DW Stat. 0.7108 1.5806 1.7408 1.81407 ***, ** and * indicate significance at p < 0.01 level, p < 0.05 level and p < 0.10, respectively. Note: Number in italic represents t-statistics 1 Results for Equation 6.3 (Panel A) are based on White-Heteroscedasticity Corrected Regression. 2 Results for Equation 6.4 (Panel B) are based on White-Heteroscedasticity Corrected Regression. Variable definitions: Pit = natural log market value of firms’ common equity measured three
months following the financial year t for firm i, BVit = book value of equity at year end t for firm i, Eit = earnings for year t available to firm i’s common shareholders, TRANSP = disclosure transparency = firm’s actual disclosure scores/firm’s
total possible disclosure scores CIHedge = component score of hedge information, CINFV = component score of net fair value, CIRisk = component score of risk information. t = time i = firm
Table D 6 presents the results on the association between hedge disclosure and the
market value of the firms. Table D 6 indicates that URGL is significant in 1998 and
2000 at p < 0.10. OBDI is also significant in 1998 at p < 0.10. In addition to that
BVNFI is significant in 1998 and 1999, E is significant in 2000 at p < 0.05 and CINFV
significant at p < 0.10.
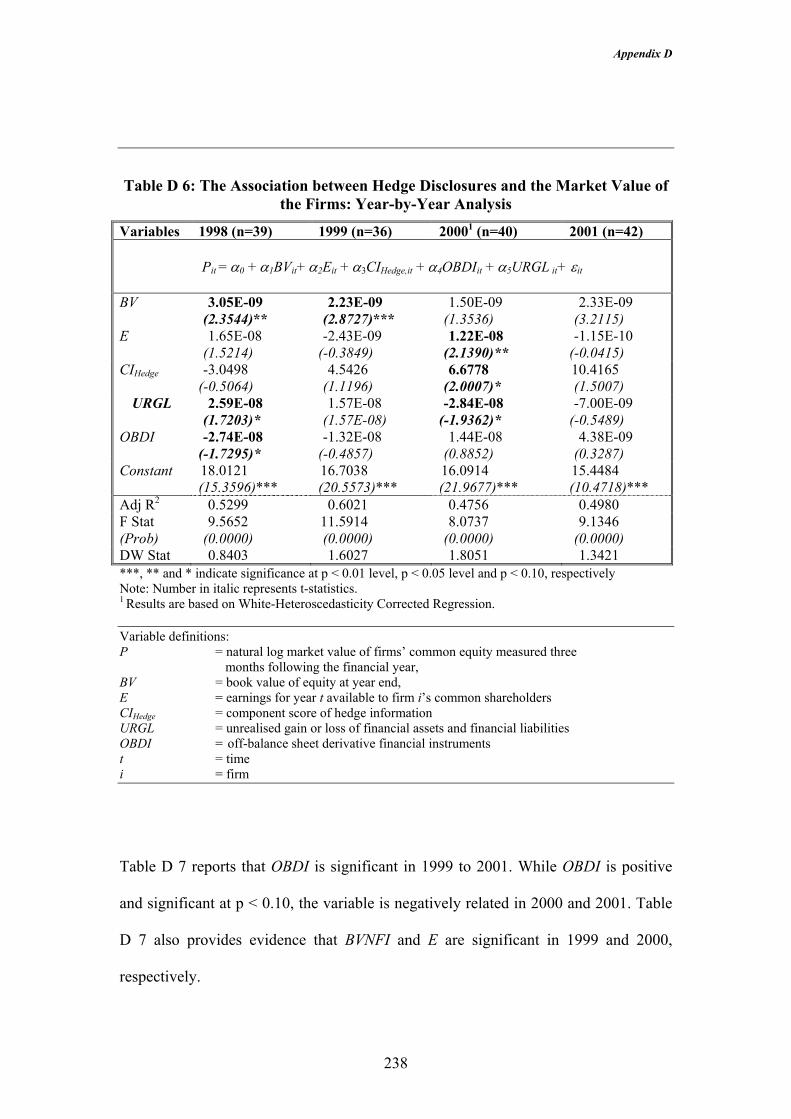
Appendix D
238
Table D 6: The Association between Hedge Disclosures and the Market Value of the Firms: Year-by-Year Analysis
Variables 1998 (n=39) 1999 (n=36) 20001 (n=40) 2001 (n=42)
Pit = α0 + α1BVit+ α2Eit + α3CIHedge,it + α4OBDIit + α5URGL it+ εit
BV 3.05E-09 (2.3544)**
2.23E-09 (2.8727)***
1.50E-09 (1.3536)
2.33E-09 (3.2115)
E 1.65E-08 (1.5214)
-2.43E-09 (-0.3849)
1.22E-08 (2.1390)**
-1.15E-10 (-0.0415)
CIHedge -3.0498 (-0.5064)
4.5426 (1.1196)
6.6778 (2.0007)*
10.4165 (1.5007)
URGL 2.59E-08 (1.7203)*
1.57E-08 (1.57E-08)
-2.84E-08 (-1.9362)*
-7.00E-09 (-0.5489)
OBDI -2.74E-08 (-1.7295)*
-1.32E-08 (-0.4857)
1.44E-08 (0.8852)
4.38E-09 (0.3287)
Constant 18.0121 (15.3596)***
16.7038 (20.5573)***
16.0914 (21.9677)***
15.4484 (10.4718)***
Adj R2 0.5299 0.6021 0.4756 0.4980 F Stat (Prob)
9.5652 (0.0000)
11.5914 (0.0000)
8.0737 (0.0000)
9.1346 (0.0000)
DW Stat 0.8403 1.6027 1.8051 1.3421 ***, ** and * indicate significance at p < 0.01 level, p < 0.05 level and p < 0.10, respectively Note: Number in italic represents t-statistics. 1 Results are based on White-Heteroscedasticity Corrected Regression. Variable definitions: P = natural log market value of firms’ common equity measured three
months following the financial year, BV = book value of equity at year end, E = earnings for year t available to firm i’s common shareholders CIHedge = component score of hedge information URGL = unrealised gain or loss of financial assets and financial liabilities OBDI = off-balance sheet derivative financial instruments t = time i = firm Table D 7 reports that OBDI is significant in 1999 to 2001. While OBDI is positive
and significant at p < 0.10, the variable is negatively related in 2000 and 2001. Table
D 7 also provides evidence that BVNFI and E are significant in 1999 and 2000,
respectively.
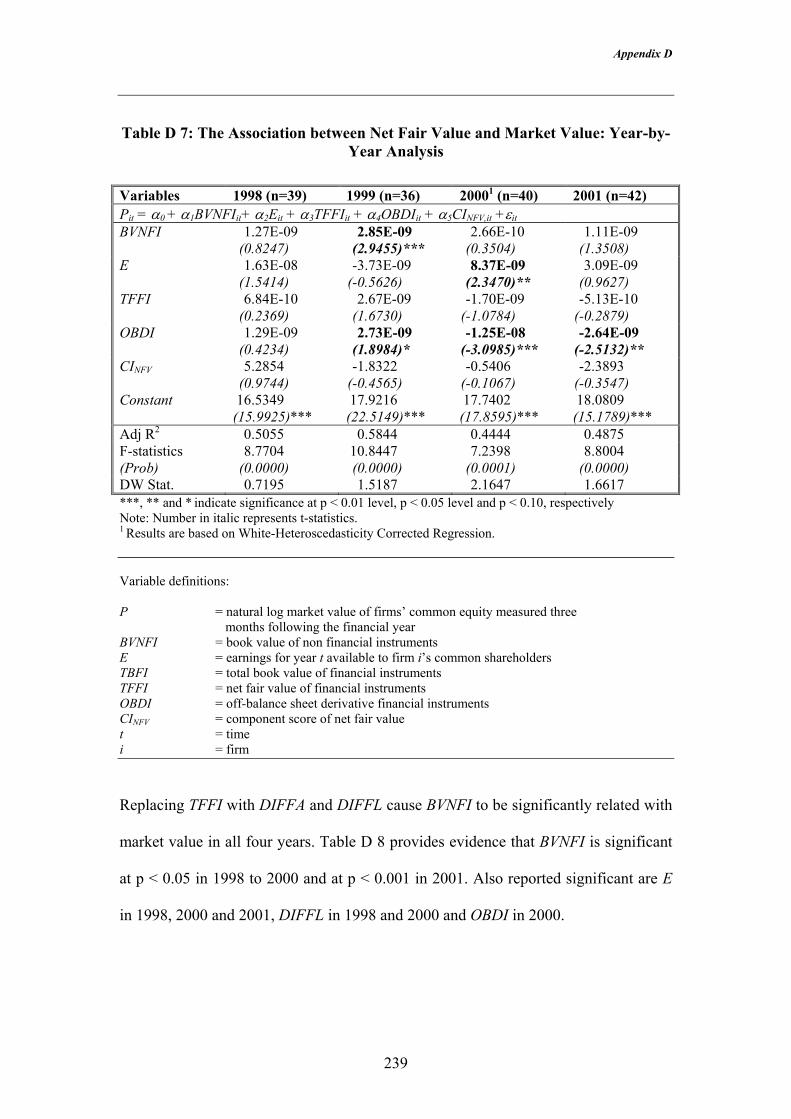
Appendix D
239
Table D 7: The Association between Net Fair Value and Market Value: Year-by-Year Analysis
Variables 1998 (n=39) 1999 (n=36) 20001 (n=40) 2001 (n=42) Pit = α0 + α1BVNFIit+ α2Eit + α3TFFIit + α4OBDIit + α5CINFV,it +εit
BVNFI 1.27E-09 (0.8247)
2.85E-09 (2.9455)***
2.66E-10 (0.3504)
1.11E-09 (1.3508)
E 1.63E-08 (1.5414)
-3.73E-09 (-0.5626)
8.37E-09 (2.3470)**
3.09E-09 (0.9627)
TFFI 6.84E-10 (0.2369)
2.67E-09 (1.6730)
-1.70E-09 (-1.0784)
-5.13E-10 (-0.2879)
OBDI 1.29E-09 (0.4234)
2.73E-09 (1.8984)*
-1.25E-08 (-3.0985)***
-2.64E-09 (-2.5132)**
CINFV 5.2854 (0.9744)
-1.8322 (-0.4565)
-0.5406 (-0.1067)
-2.3893 (-0.3547)
Constant 16.5349 (15.9925)***
17.9216 (22.5149)***
17.7402 (17.8595)***
18.0809 (15.1789)***
Adj R2 0.5055 0.5844 0.4444 0.4875 F-statistics (Prob)
8.7704 (0.0000)
10.8447 (0.0000)
7.2398 (0.0001)
8.8004 (0.0000)
DW Stat. 0.7195 1.5187 2.1647 1.6617 ***, ** and * indicate significance at p < 0.01 level, p < 0.05 level and p < 0.10, respectively Note: Number in italic represents t-statistics. 1 Results are based on White-Heteroscedasticity Corrected Regression. Variable definitions: P = natural log market value of firms’ common equity measured three
months following the financial year BVNFI = book value of non financial instruments E = earnings for year t available to firm i’s common shareholders TBFI = total book value of financial instruments TFFI = net fair value of financial instruments OBDI = off-balance sheet derivative financial instruments CINFV = component score of net fair value t = time i = firm Replacing TFFI with DIFFA and DIFFL cause BVNFI to be significantly related with
market value in all four years. Table D 8 provides evidence that BVNFI is significant
at p < 0.05 in 1998 to 2000 and at p < 0.001 in 2001. Also reported significant are E
in 1998, 2000 and 2001, DIFFL in 1998 and 2000 and OBDI in 2000.

Appendix D
240
Table D 8: The Association between the Market Value of Firms and the Difference between Net Fair Value and Book Value of Financial Instruments
Variables 1998 (n=39) 1999 (n=36) 20001 (n=40) 2001 (n=42) Pit = α0 + α1BVNFIit+ α2Eit + α3DIFFAit + α4DIFFLit + α5OBDIit +
α6CINFV,it + εit BVNFI 1.23E-09
(2.0456)** 1.60E-09
(2.6580)** 1.13E-09
(2.3627)** 2.05E-09
(5.1683)*** E 2.72E-08
(2.8756)*** 6.07E-09
(0.7136) 1.43E-08
(2.5442)** 9.46E-09
(2.8404***) DIFFA -1.90E-09
(-0.1295) 1.93E-08
(0.7467) -7.28E-08
(-1.6753) 1.85E-09
(0.1346) DIFFL 5.88E-08
(1.9770)* 6.72E-09
(0.1942) 3.25E-08
(2.3508)** 8.38E-08
(3.1590) CINFV 5.3516
(1.1622) -1.1981
(-0.2835) -1.2349
(-0.2874) -6.0550
(-1.1342) OBDI 1.21E-09
(0.6690) 3.67E-09
(1.3921) -1.04E-08
(-2.5701)** -1.07E-09
(-0.9674)
Constant 16.3600 (18.3168)***
17.8362 (21.1015)***
17.6892 (19.5991)***
18.6434 (18.4579)***
Adj R2 0.6190 0.5580 0.4993 0.5889 F-statistics (Prob)
11.2875 (0.0000)
8.3648 (0.0000)
7.4815 (0.0000)
10.7878 (0.0000)
DW Stat. 1.2401 1.9726 2.1308 2.1543 ***, ** and * indicate significance at p < 0.01 level, p < 0.05 level and p < 0.10, respectively Note: Number in italic represents t-statistics. 1 Results are based on White-Heteroscedasticity Corrected Regression. Variable definitions: P = natural log market value of firms’ common equity measured three
months following the financial year BVNFI = book value of non financial instruments E = earnings for year t available to firm i’s common shareholders TBFI = total book value of financial instruments OBDI = off-balance sheet derivative financial instruments DIFFA = difference between net fair value of financial assets and book
value of financial assets. DIFFL = difference between net fair value of financial liabilities and book
value of financial liabilities. CINFV = component score of net fair value t = time i = firm

Appendix D
241
3. The Incremental Explanatory Power of Net Fair Value and the
Unrealised Gain or Loss on Financial Instruments
Table D 9 and Table D 10 present the results on the incremental explanatory power of
net fair value and the unrealised gain or loss on financial instruments. Both tables
indicate that the incremental explanatory power of net fair value and the unrealised
gain or loss on financial instruments beyond the book value of financial and non-
financial instruments and earnings valued at historical cost for the pooled data is very
low. Table D 9 indicates that the incremental explanatory power of net fair value is -
0.19%. However, the incremental explanatory power of book value of financial and
non-financial instruments and earnings beyond the net fair value on financial
instruments for the pooled data is 18.11%. The low incremental explanatory power of
net fair value indicates that net fair value does not provide additional information
beyond the book value. This is consistent with results presented in chapter 8.
The incremental explanatory power of net fair value beyond the book value of
financial and non-financial instruments and earnings valued at historical cost has
increased dramatically from 0.90% (1998) to 13.22% (2000). However, unlike the
results using the full data, the incremental explanatory power of the book value of
financial and non-financial instruments and earnings beyond the net fair value also
increased from 9.10% (1998) to 21.70% (2000). Nevertheless, the incremental
explanatory power of each variable beyond the other reduced in 2001.

Appendix D
242
Table D 9: Incremental Explanatory Power of Net Fair Value Beyond the Book Value of Financial and Non-financial Instruments and Earnings Valued at the
Historical Cost
Pit = α0 + α1BVNFIit+ α2Eit + α3TBFI + α4TFFIit + α5OBDIit + α6CINFV,it +εit - AdjR2
h,nfv Pit = α0 + α1TFFIit + α2OBDIit + α3CINFV,it +εit - AdjR2
nfv Pit = α0 + α1BVNFIit+ α2Eit + α3TBFIit + εit - AdjR2
h AdjR2
h,nfv AdjR2h AdjR2
nfv AdjR2nfv/h AdjR2
h/nfv 1998 0.5253 0.5163 0.4343 0.0090 0.0910 1999 0.5898 0.5300 0.4043 0.0598 0.1855 2000 0.5027 0.3705 0.2857 0.1322 0.2170 2001 0.4945 0.4261 0.3928 0.0684 0.1017 Pooled data 0.4972 0.4991 0.3161 -0.0019 0.1811
Variable definitions: P = natural log market value of firms’ common equity measured three
months following the financial year BVNFI = book value of non financial instruments E = earnings for year t available to firm i’s common shareholders TBFI = total book value of financial instruments OBDI = off-balance sheet derivative financial instruments TFFI = net fair value of financial instruments CINFV = component score of net fair value t = time i = firm AdjR2
h,nfv = the total explanatory power of book value of financial and non-financial and earnings valued at historical cost and net fair value
AdjR2h = the explanatory power of book value of financial and non-financial and earnings valued at
historical cost AdjR2
nfv = the explanatory power of net fair value AdjR2 nfv/h = the incremental explanatory power of net fair value AdjR2
h/nfv = the incremental explanatory power of book value of financial and non-financial and earnings valued at historical cost
Table D 10 presents the results of the incremental explanatory power of the unrealised
gain or loss on financial instruments beyond the book value of financial and non-
financial instruments and earnings valued at historical cost. Table D 10 indicates that
the incremental explanatory power of the unrealised gain or loss on financial
instruments is 5.09% for the pooled data. Nevertheless, the incremental explanatory
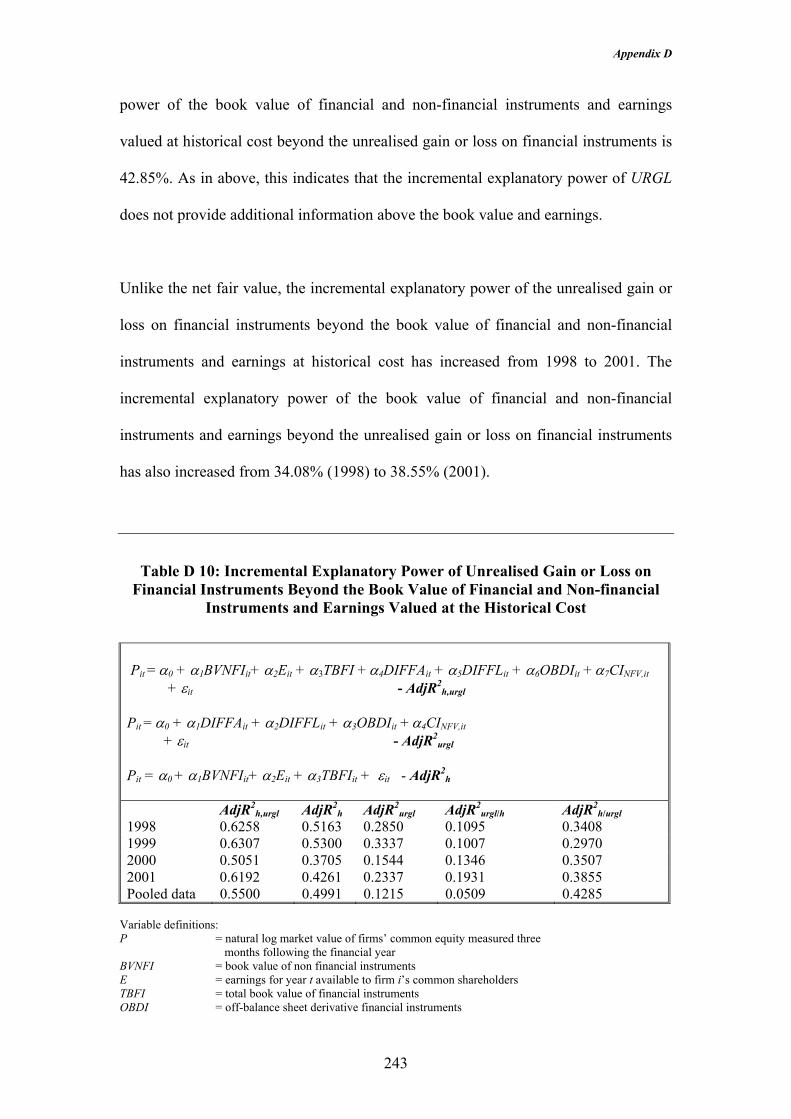
Appendix D
243
power of the book value of financial and non-financial instruments and earnings
valued at historical cost beyond the unrealised gain or loss on financial instruments is
42.85%. As in above, this indicates that the incremental explanatory power of URGL
does not provide additional information above the book value and earnings.
Unlike the net fair value, the incremental explanatory power of the unrealised gain or
loss on financial instruments beyond the book value of financial and non-financial
instruments and earnings at historical cost has increased from 1998 to 2001. The
incremental explanatory power of the book value of financial and non-financial
instruments and earnings beyond the unrealised gain or loss on financial instruments
has also increased from 34.08% (1998) to 38.55% (2001).
Table D 10: Incremental Explanatory Power of Unrealised Gain or Loss on Financial Instruments Beyond the Book Value of Financial and Non-financial
Instruments and Earnings Valued at the Historical Cost Pit = α0 + α1BVNFIit+ α2Eit + α3TBFI + α4DIFFAit + α5DIFFLit + α6OBDIit + α7CINFV,it
+ εit - AdjR2h,urgl
Pit = α0 + α1DIFFAit + α2DIFFLit + α3OBDIit + α4CINFV,it + εit - AdjR2
urgl Pit = α0 + α1BVNFIit+ α2Eit + α3TBFIit + εit - AdjR2
h AdjR2
h,urgl AdjR2h AdjR2
urgl AdjR2urgl/h AdjR2
h/urgl 1998 0.6258 0.5163 0.2850 0.1095 0.3408 1999 0.6307 0.5300 0.3337 0.1007 0.2970 2000 0.5051 0.3705 0.1544 0.1346 0.3507 2001 0.6192 0.4261 0.2337 0.1931 0.3855 Pooled data 0.5500 0.4991 0.1215 0.0509 0.4285
Variable definitions: P = natural log market value of firms’ common equity measured three
months following the financial year BVNFI = book value of non financial instruments E = earnings for year t available to firm i’s common shareholders TBFI = total book value of financial instruments OBDI = off-balance sheet derivative financial instruments
Appendix D
244
DIFFA = difference between net fair value of financial assets and book value of financial assets.
DIFFL = difference between net fair value of financial liabilities and book value of financial liabilities.
CINF, = component score of net fair value t = times i = firms AdjR2
h,urgl = the total explanatory power of book value of financial and non-financial and earnings valued at historical cost and unrealised gain or loss on financial instruments
AdjR2h = the explanatory power of book value of financial and non-financial and earnings valued at
historical cost AdjR2
urgl = the explanatory power of unrealised gain or loss on financial instruments AdjR2
urgl/h = the incremental explanatory power of unrealised gain or loss on financial instruments 4. Discussion of Results for the Refined Data Consistent with the suggested approach of Venkatachalam (1996), this appendix
presents the results for multiple regression analysis for a refined data set. Results
presented in Table D 1 indicate that market participants regard disclosure quality of
derivative information as important in firm valuation. This result is consistent with the
results from the full data set. This indicates that high quality derivative information
contributes to higher share prices. As for the full data set, Panel B Table D 1 indicates
that book value of equity, the component score of net fair value and the component
score of risk information are value relevant. However, the net fair value information is
negatively related to the market value of firms. The negative relationship may have
been influenced by certain years. Panel B Table D 5 indicates the negative
relationship between market value and the component score of net fair value for three
years out of the four year period (1999 to 2001). However, the component score of net
fair value is only significant in 1999.
The insignificance of hedge information in the pooled data has been influenced by a
firm specific year. The year-by-year analysis indicates that the component score of
hedge information and the information required by paragraph 5.8 AASB 1033 are
Appendix D
245
significant in some years, but not in other years. Table D 6 indicates that the
component score of hedge information is significant in 2000, while the other hedge
variables (URGL and OBDI,) are significant in 1998. URGL also significant in 2000.
Although the results for the pooled data indicate that none of the hedge information
variables are significant, the results for the year-by-year analysis indicate that the
information is significant in some years, providing evidence of their value relevant.
Table D 3 indicates that the off-balance sheet derivative financial instruments are
significant. However, this could be influenced by a time factor since the variable is
significant in 1998 to 2001. The net fair value of financial instruments is significant in
the pooled data. However, it is not significant for the year-by-year analysis. This
result indicates that net fair value may not provide better information for decision
making. Furthermore, the incremental explanatory power of net fair value and the
unrealised gain or loss on financial instruments is lower than the incremental
explanatory power of book value of financial and non-financial instruments and
earnings beyond the net fair value and the unrealised gain or loss on financial
instruments.
The inconsistencies in the significance of net fair value and the unrealised gain or loss
of financial instruments provides evidence that market participants in Australia,
especially with regard to the extractive industries, are not ready to move to a fair
value accounting regime. This is consistent with prior Australian studies (Deloitte
Touche Tohmatsu, 2000; Fargher, 2001; Tan et al., 2003), which fail to provide
conclusive evidence on the perceptions of managers and financial statement users on

Appendix D
246
fair value accounting. These results provide information to the standard setting bodies
in Australia in developing or adopting accounting standards related to fair values.
5. Summary This appendix provides evidence on the significance, or value relevance, of derivative
information based on a refined data set. Results presented in this appendix are
generally similar to those for the full data. This appendix indicates that market
participants regard the quality of derivative disclosures in the financial statements as
value relevant. They also value net fair value information and risk information as
being as important as the book value of equity. However, these results may have been
influenced by year effects, especially for the net fair value information. To a limited
extent, net fair value of financial instruments and the unrealised gain or loss of
financial liabilities also value relevant.

Appendix E
247
APPENDIX E: FIRM CHARACTERISTICS MODEL ESTIMATION WITHOUT THE OUTLIERS (REFINED DATA)

Appendix E
248
Table E 1: Results of Regression Analysis of the Association between Disclosure Transparency and Firms Characteristics (n=254)
TRANSPit=α0+α1SIZEit+α2PROFITit+α3PEit+α4TYPEit+α5AUDITit+α6MTBit
+α7R&Dit +α8DTEit+ εit
Variable Predicted Sign Coefficient Std. Error t-Statistics Prob
Constant ? 0.5346 0.0823 6.4968 0.0000
SIZE + 0.0195 0.0046 4.2494 0.0000***
PROFIT + 0.0183 0.0100 1.8360 0.0676*
PE + 3.67E-05 1.98E-05 1.8573 0.0645*
TYPE - 0.0023 0.0148 0.1557 0.8764
Audit +/- -0.0182 0.0187 -0.9732 0.3314
MTB + -8.23E-05 2.66E-05 -3.0955 0.0022***
R&D + 0.0078 0.0137 0.5695 0.5695
DTE +/- 0.0228 0.0103 2.2039 0.0285**
Adjusted R2 for model = 0.2124 Durbin-Watson Statistics = 2.0778 F statistics for model = 9.5308 p-value for model 0.0000 ***, ** and * indicate significance at p < 0.01, p < 0.05 and p < 0.10 respectively.
Variable Definitions: TRANSP = disclosure transparency = firm’s actual disclosure scores/firm’s total possible disclosure scores SIZE = log of total assets PROFIT = earnings before tax / total assets PE = price/earnings before extraordinary items per share TYPE = 1 for no-liability company, 0 otherwise. AUDIT = 1 for Big-5/6 auditor, 0 otherwise MTB = market value/net book value of tangible assets for the given class of equity R&D = 1 for R&D firm, 0 otherwise. DTE = total liabilities divided by book value of common equity
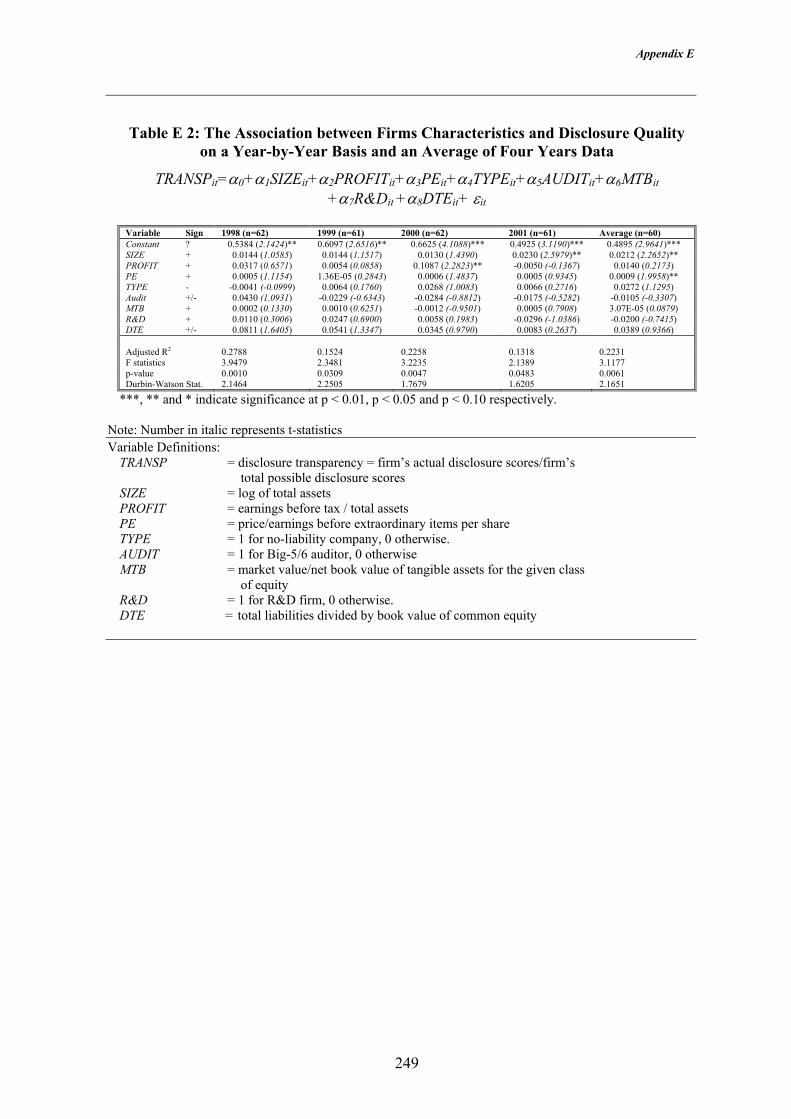
Appendix E
249
Table E 2: The Association between Firms Characteristics and Disclosure Quality on a Year-by-Year Basis and an Average of Four Years Data
TRANSPit=α0+α1SIZEit+α2PROFITit+α3PEit+α4TYPEit+α5AUDITit+α6MTBit +α7R&Dit +α8DTEit+ εit
Variable Sign 1998 (n=62) 1999 (n=61) 2000 (n=62) 2001 (n=61) Average (n=60) Constant ? 0.5384 (2.1424)** 0.6097 (2.6516)** 0.6625 (4.1088)*** 0.4925 (3.1190)*** 0.4895 (2.9641)*** SIZE + 0.0144 (1.0585) 0.0144 (1.1517) 0.0130 (1.4390) 0.0230 (2.5979)** 0.0212 (2.2652)** PROFIT + 0.0317 (0.6571) 0.0054 (0.0858) 0.1087 (2.2823)** -0.0050 (-0.1367) 0.0140 (0.2173) PE + 0.0005 (1.1154) 1.36E-05 (0.2843) 0.0006 (1.4837) 0.0005 (0.9345) 0.0009 (1.9958)** TYPE - -0.0041 (-0.0999) 0.0064 (0.1760) 0.0268 (1.0083) 0.0066 (0.2716) 0.0272 (1.1295) Audit +/- 0.0430 (1.0931) -0.0229 (-0.6343) -0.0284 (-0.8812) -0.0175 (-0.5282) -0.0105 (-0.3307) MTB + 0.0002 (0.1330) 0.0010 (0.6251) -0.0012 (-0.9501) 0.0005 (0.7908) 3.07E-05 (0.0879) R&D + 0.0110 (0.3006) 0.0247 (0.6900) 0.0058 (0.1983) -0.0296 (-1.0386) -0.0200 (-0.7415) DTE +/- 0.0811 (1.6405) 0.0541 (1.3347) 0.0345 (0.9790) 0.0083 (0.2637) 0.0389 (0.9366) Adjusted R2 0.2788 0.1524 0.2258 0.1318 0.2231 F statistics 3.9479 2.3481 3.2235 2.1389 3.1177 p-value 0.0010 0.0309 0.0047 0.0483 0.0061 Durbin-Watson Stat. 2.1464 2.2505 1.7679 1.6205 2.1651
***, ** and * indicate significance at p < 0.01, p < 0.05 and p < 0.10 respectively.
Note: Number in italic represents t-statistics Variable Definitions:
TRANSP = disclosure transparency = firm’s actual disclosure scores/firm’s total possible disclosure scores SIZE = log of total assets PROFIT = earnings before tax / total assets PE = price/earnings before extraordinary items per share TYPE = 1 for no-liability company, 0 otherwise. AUDIT = 1 for Big-5/6 auditor, 0 otherwise MTB = market value/net book value of tangible assets for the given class of equity R&D = 1 for R&D firm, 0 otherwise. DTE = total liabilities divided by book value of common equity

Appendix E
250
Table E 3: Results of Regression Analysis of the Association between Disclosure Transparency and Firms Characteristics: Ranked Transformation (n=254)
TRANSPit=α0+α1RSIZEit+α2RPROFITit+α3RPEit+α4TYPEit+α5AUDITit+α6RMTBit +α7R&Dit +α8RDTEit+ εit
Variable Predicted Sign Coefficient Std. Error t-Statistics Prob Constant ? 32.2153 19.5372 1.6489 0.1004 RSIZE + 0.3410 0.1011 3.3735 0.0009*** RPROFIT + 0.0371 0.0678 0.5469 0.5850 RPE + 0.2052 0.0649 3.1626 0.0018*** TYPE - 15.0826 11.3072 1.3339 0.1835 Audit +/- -14.4772 12.4769 -1.1603 0.2470 RMTB + -0.0547 0.0491 -1.1136 0.2666 R&D + -8.2306 10.3070 -0.7985 0.4253 RDTE +/- 0.2905 0.0727 3.9967 0.0001***
Adjusted R2 for model = 0.3215 Durbin-Watson Statistics = 2.0607 F statistics for model = 15.9878 p-value for model = 0.0000 ***, ** and * indicate significance at p < 0.01, p < 0.05 and p < 0.10 respectively.
Variable Definitions: RTRANSP = rank of disclosure (transparency) RSIZE = rank of total assets (in thousands) RPROFIT = rank of profitability RPE = rank of price/earnings ratio TYPE = 1 for no-liability company, 0 otherwise. AUDIT = 1 for Big-5/6 auditor, 0 otherwise RMTB = rank of market-to-book ratio R&D = 1 for R&D firm, 0 otherwise. RDTE = rank of total liabilities divided by book value of common equity

Appendix E
251
Table E 4: Refined Data: Association between Disclosure Transparency and Firms Characteristics: Ranked Transformation Year-by-Year Basis and an
Average of Four Years Data
TRANSPit=α0+α1RSIZEit+α2RPROFITit+α3RPEit+α4TYPEit+α5AUDITit+α6RMTBit +α7R&Dit +α8RDTEit+ εit
Variable Sign 1998 (n=62) 1999 (n=61) 2000 (n=62) 2001 (n=61) Average (n=60) Constant ? -3.8273(-0.3489) 9.2947(0.8809) 3.8887(0.4110) 9.3183(0.9764) -0.1688(-0.0200) RSIZE + 0.3962(1.6941)* 0.2451(0.9729) 0.2565(1.2327) 0.5419(2.4428)** 0.5610(2.6032)** RPROFIT + 0.0552(0.4286) 0.1052(0.7644) 0.0766(0.5620) -0.1539(-0.9463) -0.1831(-1.3550) RPE + 0.2706(2.3182)** 0.1827(1.2958) 0.4495(3.4934)*** 0.1296(0.8695) 0.4093(3.4449)*** TYPE - 5.5808(0.8688) 5.6231(0.8850) 9.5398(1.8181)* -0.3450(-0.0640) 7.1830(1.4798) Audit +/- 4.4076(0.8243) -6.3022(-1.0307) -1.1182(-0.1753) -4.5597(-0.6359) -1.7990(-0.2871) RMTB + -0.0424(-0.4028) -0.0875(-0.7482) -0.2163(-1.9979)* 0.1332(1.0856) 0.0253(0.2284) R&D + -2.4918(-0.4772) 2.5139(0.4211) -1.9442(-0.3401) -10.6214(-1.7057)* -7.5740(-1.4494) RDTE +/- 0.2794(1.8821)* 0.3283(2.2431)** 0.2586(1.7920)* 0.2815(2.0783)** 0.2450(1.8300)* Adjusted R2 0.3861 0.2347 0.3348 0.2510 0.3919 F statistics 5.7951 3.2998 4.8371 3.5130 5.7528 p-value 0.000 0.0040 0.0002 0.0026 0.0000 Durbin-Watson Stat. 2.1818 2.2635 1.7345 1.9162 2.0790
***, ** and * indicate significance at p < 0.01 , p < 0.05 and p < 0.10 respectively.
Note: Number in italic represents t-statistics Variable Definitions: RTRANSP = rank of disclosure (transparency) RSIZE = rank of total assets (in thousands) RPROFIT = rank of profitability RPE = rank of price/earnings ratio TYPE = 1 for no-liability company, 0 otherwise. AUDIT = 1 for Big-5/6 auditor, 0 otherwise RMTB = rank of market-to-book ratio R&D = 1 for R&D firm, 0 otherwise. RDTE = rank of total liabilities divided by book value of common equity

Appendix F
252
APPENDIX F: RESULTS ON MARKET VALUE MODEL FOR FULL DATA

Appendix F
253
1. Full Data Sample 2.1. Pooled Data
Table F 1: The Association between Information Quality of Derivative Disclosures and the Market Value of the Firms (n=260)1
Variables Coefficient Std Error T-statistics Prob
Panel A : ititititti TRANSPEBVP εαααα ++++= 3210 BV 7.22E-10 1.10E-10 6.5836 0.0000*** E 7.46E-10 5.85E-10 1.2746 0.2036 Transp 7.6693 0.8854 8.6623 0.0000*** Constant 10.9153 0.7752 14.0804 0.0000*** Adj R2 = 0.4709 DW Statistics = 1.9205 F-statistics = 77.8289 Prob. = 0.0000 Panel B : Pit = α0 + α1BVit+ α2Eit + α3CINFV,it + α4CIHedge,it + α5CIRisk, it+εit
BV 7.35E-10 1.03E-10 7.1432 0.0000*** E 7.24E-10 5.46E-10 1.3270 0.1857 CINFV -2.1492 2.2140 -09707 0.3326 CIHedge 8.5090 1.1452 7.4299 0.0000*** CIRisk 5.5022 1.2193 4.5124 0.0000*** Constant 15.5687 0.5288 29.4439 0.0000*** Adj R2 = 0.4855 DW Statistics = 1.8066 F-statistics = 49.8893 Prob. = 0.0000 *** indicates significance at p < 0.001 1 Results are based on White’s Heteroscedasticity Correction Regression Variable definitions: P = natural log market value of firms’ common equity measured three
months following the financial year BV = book value of equity at year end E = earnings for year available to firm’s common shareholders TRANSP = disclosure transparency = firm’s actual disclosure scores/firm’s total
possible disclosure scores CIHedge = component score of hedge information CINFV = component score of net fair value CIRisk = component score of risk information i = firm t = year
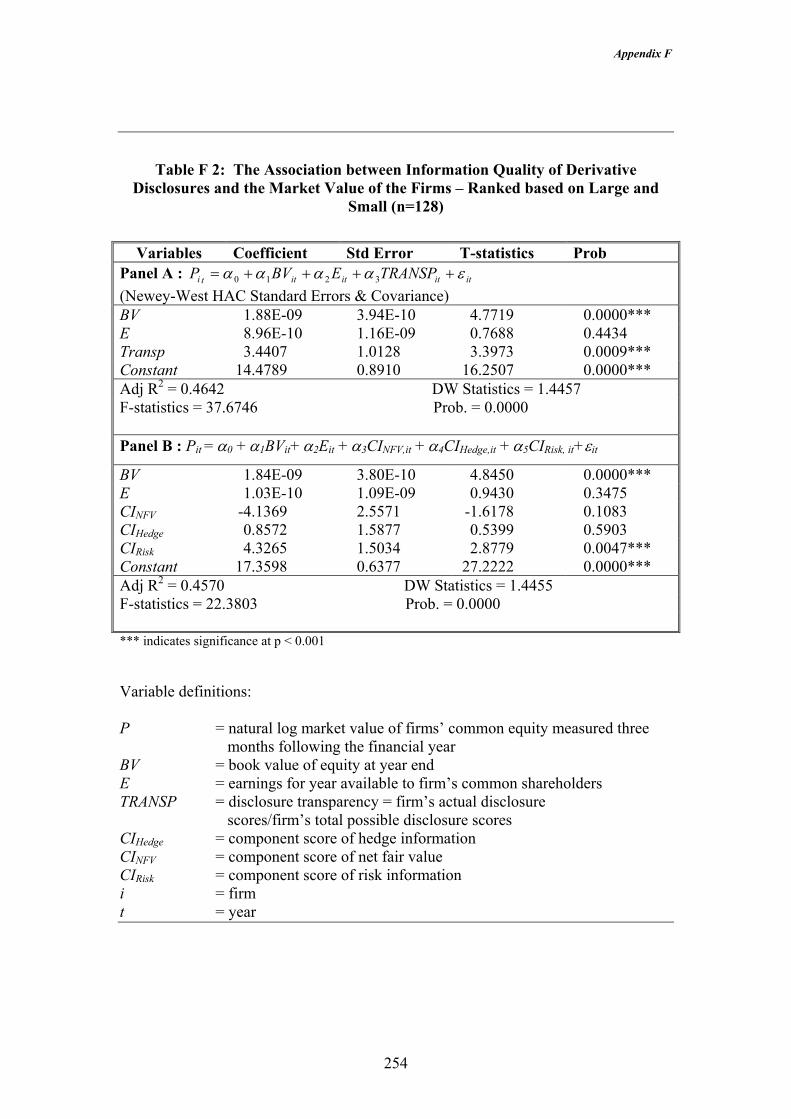
Appendix F
254
Table F 2: The Association between Information Quality of Derivative Disclosures and the Market Value of the Firms – Ranked based on Large and
Small (n=128)
Variables Coefficient Std Error T-statistics Prob Panel A : ititititti TRANSPEBVP εαααα ++++= 3210 (Newey-West HAC Standard Errors & Covariance) BV 1.88E-09 3.94E-10 4.7719 0.0000*** E 8.96E-10 1.16E-09 0.7688 0.4434 Transp 3.4407 1.0128 3.3973 0.0009*** Constant 14.4789 0.8910 16.2507 0.0000*** Adj R2 = 0.4642 DW Statistics = 1.4457 F-statistics = 37.6746 Prob. = 0.0000 Panel B : Pit = α0 + α1BVit+ α2Eit + α3CINFV,it + α4CIHedge,it + α5CIRisk, it+εit
BV 1.84E-09 3.80E-10 4.8450 0.0000*** E 1.03E-10 1.09E-09 0.9430 0.3475 CINFV -4.1369 2.5571 -1.6178 0.1083 CIHedge 0.8572 1.5877 0.5399 0.5903 CIRisk 4.3265 1.5034 2.8779 0.0047*** Constant 17.3598 0.6377 27.2222 0.0000*** Adj R2 = 0.4570 DW Statistics = 1.4455 F-statistics = 22.3803 Prob. = 0.0000 *** indicates significance at p < 0.001
Variable definitions: P = natural log market value of firms’ common equity measured three
months following the financial year BV = book value of equity at year end E = earnings for year available to firm’s common shareholders TRANSP = disclosure transparency = firm’s actual disclosure
scores/firm’s total possible disclosure scores CIHedge = component score of hedge information CINFV = component score of net fair value CIRisk = component score of risk information i = firm t = year

Appendix F
255
Table F 3: The Association between Information Quality of Derivative Disclosures and the Market Value of the Large and Small Firms
Variables Small firms (n=64) Large firms (n=64)1
Panel A : ititititti TRANSPEBVP εαααα ++++= 3210 BV 1.34E-08 (2.99E-09)*** 1.63E-09 (4.04E-10)*** E 9.82E-09 (5.59E-09)* 8.96E-10 (1.23E-09) Transp 0.0199 (1.0384) 6.9797 (1.1247)*** Constant 16.9718 (0.9450)*** 11.5517 (0.8795)*** Adj R2 0.2511 0.5832 DW Statistics 1.7969 1.4432 F-statistics (Prob.) 8.0410 (0.0001) 30.3859 (0.0000) Panel B : Pit = α0 + α1BVit+ α2Eit + α3CINFV,it + α4CIHedge,it + α5CIRisk, it+εit
BV 1.52E-08 (3.20E-09)*** 1.46E-09 (3.42E-10)*** E 9.59E-09 (5.60E-09)* 1.30E-09 (1.06E-09) CINFV -0.8730 (2.7394) -7.7563 (4.0236)* CIHedge -2.6425 (1.6874) 2.8661 (1.5754)* CIRisk 0.1629 (1.4843) 9.6935 (1.9023)*** Constant 17.5557 (0.6572)*** 16.9428 (0.9129)*** Adj R2 0.2596 0.5670 DW Statistics 1.9214 1.5589 F-statistics (Prob.) 5.4182 (0.0004) 19.6648 (0.0000) *** and * indicate significance at p < 0.001 and p < 0.10, respectively. 1 Results are based on the Newey-West HAC Standard Errors & Covariance. Variable definitions: P = natural log market value of firms’ common equity measured three
months following the financial year BV = book value of equity at year end E = earnings for year available to firm’s common shareholders TRANSP = disclosure transparency = firm’s actual disclosure
scores/firm’s total possible disclosure scores CIHedge = component score of hedge information CINFV = component score of net fair value CIRisk = component score of risk information i = firm t = year
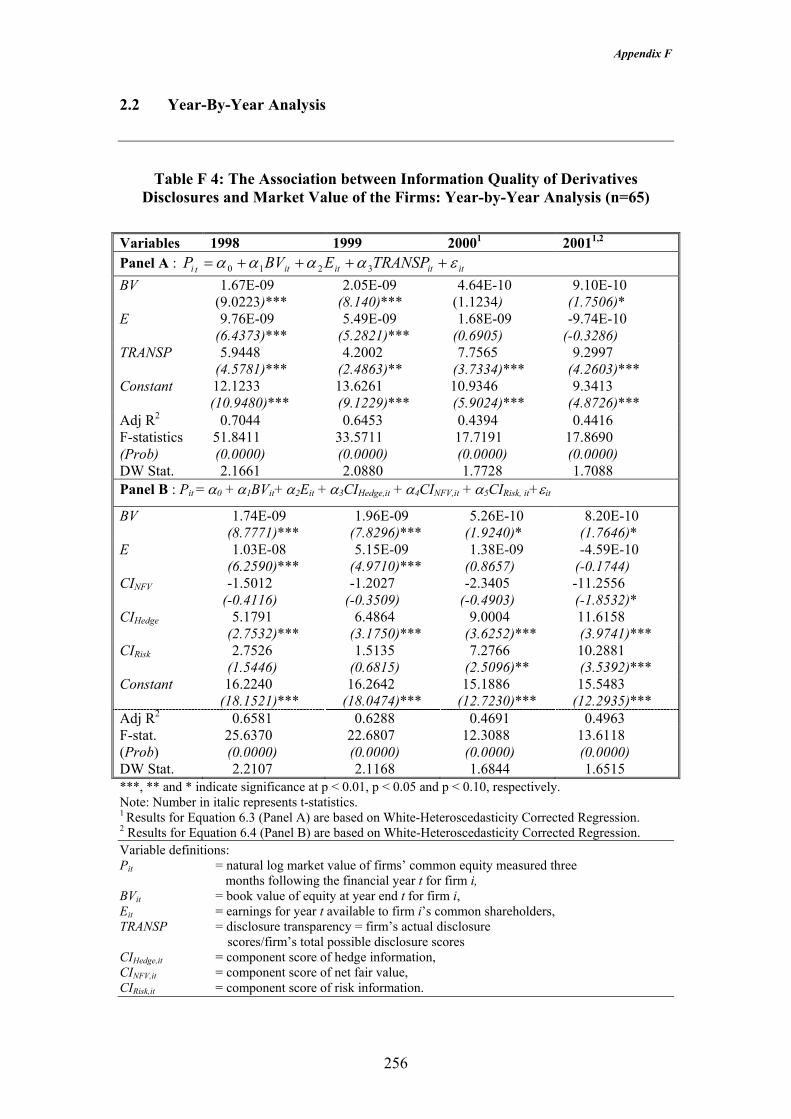
Appendix F
256
2.2 Year-By-Year Analysis
Table F 4: The Association between Information Quality of Derivatives Disclosures and Market Value of the Firms: Year-by-Year Analysis (n=65)
Variables 1998 1999 20001 20011,2
Panel A : ititititti TRANSPEBVP εαααα ++++= 3210 BV 1.67E-09
(9.0223)*** 2.05E-09
(8.140)*** 4.64E-10
(1.1234) 9.10E-10
(1.7506)* E 9.76E-09
(6.4373)*** 5.49E-09
(5.2821)*** 1.68E-09
(0.6905) -9.74E-10
(-0.3286) TRANSP 5.9448
(4.5781)*** 4.2002
(2.4863)** 7.7565
(3.7334)*** 9.2997
(4.2603)*** Constant 12.1233
(10.9480)*** 13.6261 (9.1229)***
10.9346 (5.9024)***
9.3413 (4.8726)***
Adj R2 0.7044 0.6453 0.4394 0.4416 F-statistics (Prob)
51.8411 (0.0000)
33.5711 (0.0000)
17.7191 (0.0000)
17.8690 (0.0000)
DW Stat. 2.1661 2.0880 1.7728 1.7088 Panel B : Pit = α0 + α1BVit+ α2Eit + α3CIHedge,it + α4CINFV,it + α5CIRisk, it+εit
BV 1.74E-09 (8.7771)***
1.96E-09 (7.8296)***
5.26E-10 (1.9240)*
8.20E-10 (1.7646)*
E 1.03E-08 (6.2590)***
5.15E-09 (4.9710)***
1.38E-09 (0.8657)
-4.59E-10 (-0.1744)
CINFV -1.5012 (-0.4116)
-1.2027 (-0.3509)
-2.3405 (-0.4903)
-11.2556 (-1.8532)*
CIHedge 5.1791 (2.7532)***
6.4864 (3.1750)***
9.0004 (3.6252)***
11.6158 (3.9741)***
CIRisk 2.7526 (1.5446)
1.5135 (0.6815)
7.2766 (2.5096)**
10.2881 (3.5392)***
Constant 16.2240 (18.1521)***
16.2642 (18.0474)***
15.1886 (12.7230)***
15.5483 (12.2935)***
Adj R2 0.6581 0.6288 0.4691 0.4963 F-stat. (Prob)
25.6370 (0.0000)
22.6807 (0.0000)
12.3088 (0.0000)
13.6118 (0.0000)
DW Stat. 2.2107 2.1168 1.6844 1.6515 ***, ** and * indicate significance at p < 0.01, p < 0.05 and p < 0.10, respectively. Note: Number in italic represents t-statistics. 1 Results for Equation 6.3 (Panel A) are based on White-Heteroscedasticity Corrected Regression. 2 Results for Equation 6.4 (Panel B) are based on White-Heteroscedasticity Corrected Regression. Variable definitions: Pit = natural log market value of firms’ common equity measured three
months following the financial year t for firm i, BVit = book value of equity at year end t for firm i, Eit = earnings for year t available to firm i’s common shareholders, TRANSP = disclosure transparency = firm’s actual disclosure
scores/firm’s total possible disclosure scores CIHedge,it = component score of hedge information, CINFV,it = component score of net fair value, CIRisk,it = component score of risk information.
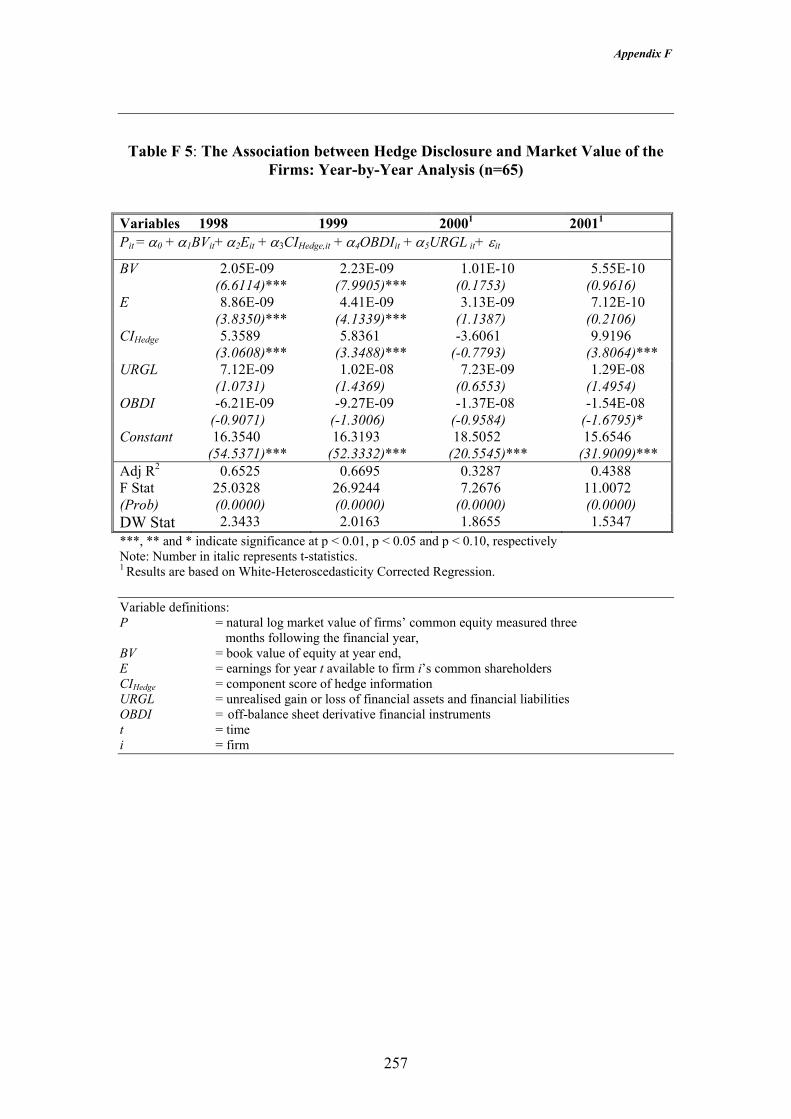
Appendix F
257
Table F 5: The Association between Hedge Disclosure and Market Value of the Firms: Year-by-Year Analysis (n=65)
Variables 1998 1999 20001 20011
Pit = α0 + α1BVit+ α2Eit + α3CIHedge,it + α4OBDIit + α5URGL it+ εit
BV 2.05E-09 (6.6114)***
2.23E-09 (7.9905)***
1.01E-10 (0.1753)
5.55E-10 (0.9616)
E 8.86E-09 (3.8350)***
4.41E-09 (4.1339)***
3.13E-09 (1.1387)
7.12E-10 (0.2106)
CIHedge 5.3589 (3.0608)***
5.8361 (3.3488)***
-3.6061 (-0.7793)
9.9196 (3.8064)***
URGL 7.12E-09 (1.0731)
1.02E-08 (1.4369)
7.23E-09 (0.6553)
1.29E-08 (1.4954)
OBDI -6.21E-09 (-0.9071)
-9.27E-09 (-1.3006)
-1.37E-08 (-0.9584)
-1.54E-08 (-1.6795)*
Constant 16.3540 (54.5371)***
16.3193 (52.3332)***
18.5052 (20.5545)***
15.6546 (31.9009)***
Adj R2 0.6525 0.6695 0.3287 0.4388 F Stat (Prob)
25.0328 (0.0000)
26.9244 (0.0000)
7.2676 (0.0000)
11.0072 (0.0000)
DW Stat 2.3433 2.0163 1.8655 1.5347 ***, ** and * indicate significance at p < 0.01, p < 0.05 and p < 0.10, respectively Note: Number in italic represents t-statistics. 1 Results are based on White-Heteroscedasticity Corrected Regression. Variable definitions: P = natural log market value of firms’ common equity measured three
months following the financial year, BV = book value of equity at year end, E = earnings for year t available to firm i’s common shareholders CIHedge = component score of hedge information URGL = unrealised gain or loss of financial assets and financial liabilities OBDI = off-balance sheet derivative financial instruments t = time i = firm
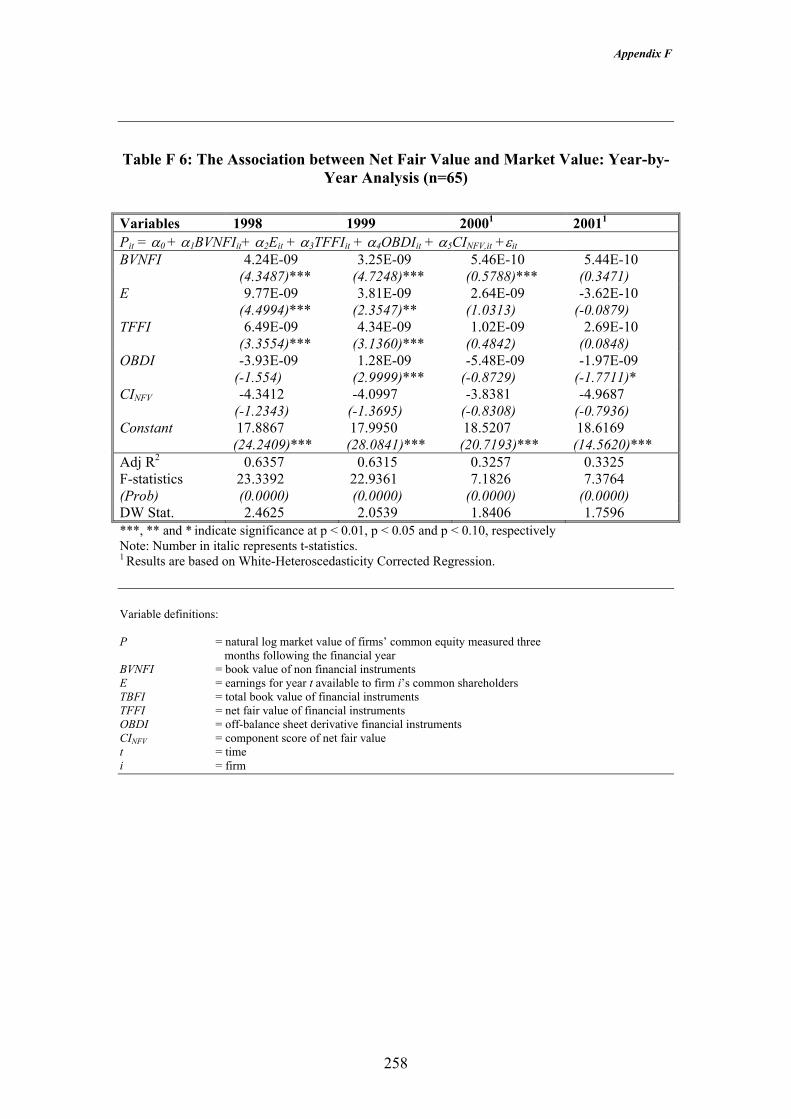
Appendix F
258
Table F 6: The Association between Net Fair Value and Market Value: Year-by-Year Analysis (n=65)
Variables 1998 1999 20001 20011
Pit = α0 + α1BVNFIit+ α2Eit + α3TFFIit + α4OBDIit + α5CINFV,it +εit
BVNFI 4.24E-09 (4.3487)***
3.25E-09 (4.7248)***
5.46E-10 (0.5788)***
5.44E-10 (0.3471)
E 9.77E-09 (4.4994)***
3.81E-09 (2.3547)**
2.64E-09 (1.0313)
-3.62E-10 (-0.0879)
TFFI 6.49E-09 (3.3554)***
4.34E-09 (3.1360)***
1.02E-09 (0.4842)
2.69E-10 (0.0848)
OBDI -3.93E-09 (-1.554)
1.28E-09 (2.9999)***
-5.48E-09 (-0.8729)
-1.97E-09 (-1.7711)*
CINFV -4.3412 (-1.2343)
-4.0997 (-1.3695)
-3.8381 (-0.8308)
-4.9687 (-0.7936)
Constant 17.8867 (24.2409)***
17.9950 (28.0841)***
18.5207 (20.7193)***
18.6169 (14.5620)***
Adj R2 0.6357 0.6315 0.3257 0.3325 F-statistics (Prob)
23.3392 (0.0000)
22.9361 (0.0000)
7.1826 (0.0000)
7.3764 (0.0000)
DW Stat. 2.4625 2.0539 1.8406 1.7596 ***, ** and * indicate significance at p < 0.01, p < 0.05 and p < 0.10, respectively Note: Number in italic represents t-statistics. 1 Results are based on White-Heteroscedasticity Corrected Regression. Variable definitions: P = natural log market value of firms’ common equity measured three
months following the financial year BVNFI = book value of non financial instruments E = earnings for year t available to firm i’s common shareholders TBFI = total book value of financial instruments TFFI = net fair value of financial instruments OBDI = off-balance sheet derivative financial instruments CINFV = component score of net fair value t = time i = firm
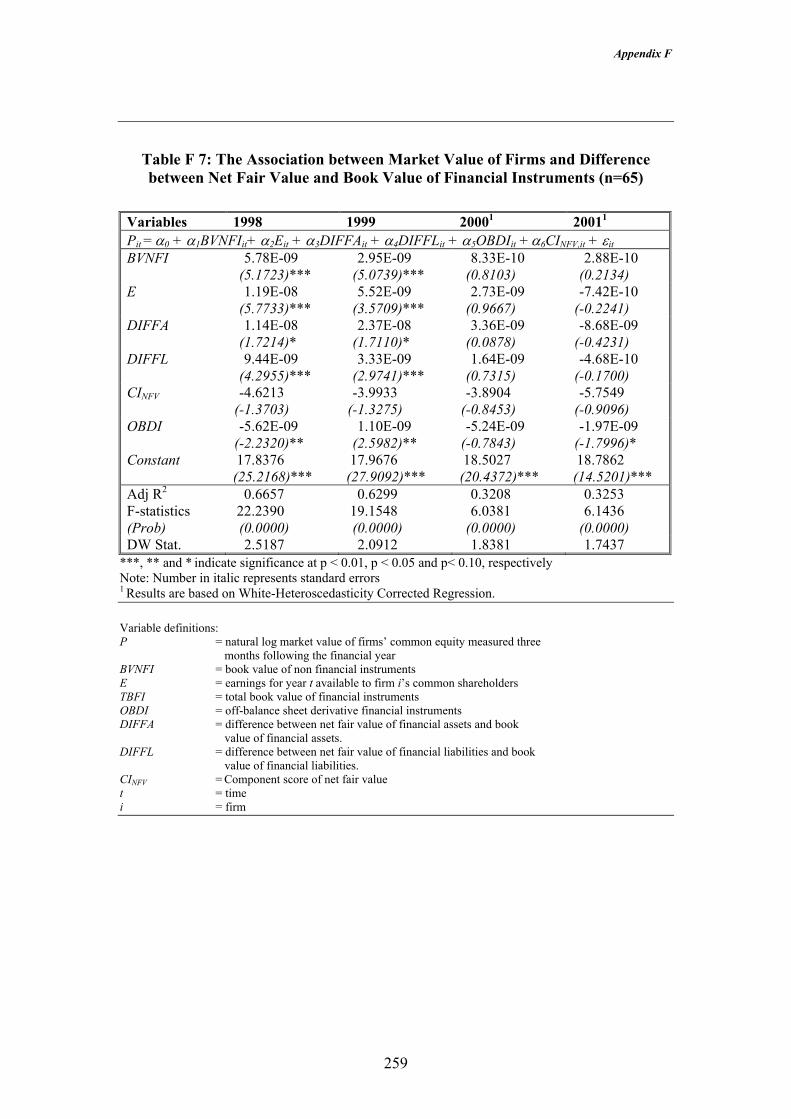
Appendix F
259
Table F 7: The Association between Market Value of Firms and Difference between Net Fair Value and Book Value of Financial Instruments (n=65)
Variables 1998 1999 20001 20011
Pit = α0 + α1BVNFIit+ α2Eit + α3DIFFAit + α4DIFFLit + α5OBDIit + α6CINFV,it + εit BVNFI 5.78E-09
(5.1723)*** 2.95E-09
(5.0739)*** 8.33E-10
(0.8103) 2.88E-10
(0.2134) E 1.19E-08
(5.7733)*** 5.52E-09
(3.5709)*** 2.73E-09
(0.9667) -7.42E-10
(-0.2241) DIFFA 1.14E-08
(1.7214)* 2.37E-08
(1.7110)* 3.36E-09
(0.0878) -8.68E-09
(-0.4231) DIFFL 9.44E-09
(4.2955)*** 3.33E-09
(2.9741)*** 1.64E-09
(0.7315) -4.68E-10
(-0.1700) CINFV -4.6213
(-1.3703) -3.9933
(-1.3275) -3.8904
(-0.8453) -5.7549
(-0.9096) OBDI -5.62E-09
(-2.2320)** 1.10E-09
(2.5982)** -5.24E-09
(-0.7843) -1.97E-09
(-1.7996)*
Constant 17.8376 (25.2168)***
17.9676 (27.9092)***
18.5027 (20.4372)***
18.7862 (14.5201)***
Adj R2 0.6657 0.6299 0.3208 0.3253 F-statistics (Prob)
22.2390 (0.0000)
19.1548 (0.0000)
6.0381 (0.0000)
6.1436 (0.0000)
DW Stat. 2.5187 2.0912 1.8381 1.7437 ***, ** and * indicate significance at p < 0.01, p < 0.05 and p< 0.10, respectively Note: Number in italic represents standard errors 1 Results are based on White-Heteroscedasticity Corrected Regression. Variable definitions: P = natural log market value of firms’ common equity measured three
months following the financial year BVNFI = book value of non financial instruments E = earnings for year t available to firm i’s common shareholders TBFI = total book value of financial instruments OBDI = off-balance sheet derivative financial instruments DIFFA = difference between net fair value of financial assets and book
value of financial assets. DIFFL = difference between net fair value of financial liabilities and book
value of financial liabilities. CINFV = Component score of net fair value t = time i = firm

Appendix F
260
Table F 8: Incremental Explanatory Power of Net Fair Value Beyond Book Value of Financial and Non-Financial Instruments and Earnings Valued at
Historical Cost Pit = α0 + α1BVNFIit+ α2Eit + α3TBFI + α4TFFIit + α5OBDIit + α6CINFV,it +εit - AdjR2
h,nfv Pit = α0 + α1TFFIit + α2OBDIit + α3CINFV,it +εit - AdjR2
nfv Pit = α0 + α1BVNFIit+ α2Eit + α3TBFIit + εit - AdjR2
h AdjR2
h,nfv AdjR2h AdjR2
nfv AdjR2nfv/h AdjR2
h/nfv 1998 0.6316 0.6193 0.3320 0.0123 0.2996 1999 0.6252 0.5713 0.2776 0.0539 0.3476 2000 0.3256 0.3239 0.2944 0.0017 0.0312 2001 0.3452 0.3206 0.3490 0.0246 -0.0038
Variable definitions: P = natural log market value of firms’ common equity measured three
months following the financial year BVNFI = book value of non financial instruments E = earnings for year t available to firm i’s common shareholders TBFI = total book value of financial instruments OBDI = off-balance sheet derivative financial instruments TFFI = net fair value of financial instruments CINFV = component score of net fair value t = time i = firm AdjR2
h,urgl = the total explanatory power of book value and earnings valued at historical cost and net fair value
AdjR2h = the explanatory power of book value and earnings valued at historical cost
AdjR2nfv = the explanatory power of net fair value
AdjR2urgl/h = the incremental explanatory power of net fair value
AdjR2h/urgl = the incremental explanatory power of book value and earnings valued at historical cost
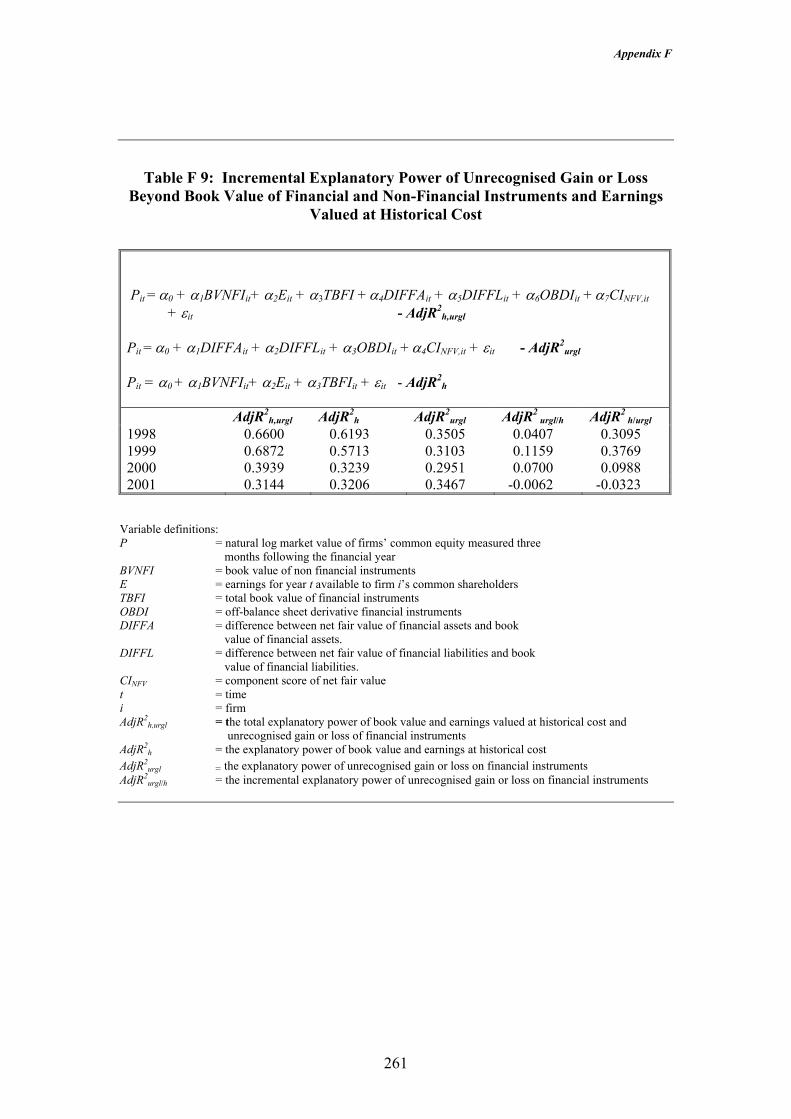
Appendix F
261
Table F 9: Incremental Explanatory Power of Unrecognised Gain or Loss Beyond Book Value of Financial and Non-Financial Instruments and Earnings
Valued at Historical Cost Pit = α0 + α1BVNFIit+ α2Eit + α3TBFI + α4DIFFAit + α5DIFFLit + α6OBDIit + α7CINFV,it
+ εit - AdjR2h,urgl
Pit = α0 + α1DIFFAit + α2DIFFLit + α3OBDIit + α4CINFV,it + εit - AdjR2
urgl Pit = α0 + α1BVNFIit+ α2Eit + α3TBFIit + εit - AdjR2
h AdjR2
h,urgl AdjR2h AdjR2
urgl AdjR2 urgl/h AdjR2
h/urgl 1998 0.6600 0.6193 0.3505 0.0407 0.3095 1999 0.6872 0.5713 0.3103 0.1159 0.3769 2000 0.3939 0.3239 0.2951 0.0700 0.0988 2001 0.3144 0.3206 0.3467 -0.0062 -0.0323
Variable definitions: P = natural log market value of firms’ common equity measured three
months following the financial year BVNFI = book value of non financial instruments E = earnings for year t available to firm i’s common shareholders TBFI = total book value of financial instruments OBDI = off-balance sheet derivative financial instruments DIFFA = difference between net fair value of financial assets and book
value of financial assets. DIFFL = difference between net fair value of financial liabilities and book
value of financial liabilities. CINFV = component score of net fair value t = time i = firm AdjR2
h,urgl = the total explanatory power of book value and earnings valued at historical cost and unrecognised gain or loss of financial instruments
AdjR2h = the explanatory power of book value and earnings at historical cost
AdjR2urgl = the explanatory power of unrecognised gain or loss on financial instruments
AdjR2urgl/h = the incremental explanatory power of unrecognised gain or loss on financial instruments
References
262
REFERENCES Aboody, D. 1996. Recognition Versus Disclosure in the Oil and Gas Industry. Journal
of Accounting Research. 34 (Supplement):21-32. Ahmad, N. 2000. Perakaunan Nilai Saksama: Kajian Terhadap Kerelevanan Dan
Kebolehpercayaan Maklumat Perakaunan (Fair Value Accounting: Study on Relevance and Reliability of Accounting Information). Unpublished Master of Accounting Dissertation. Universiti Kebangsaan Malaysia.
Ahmed, K. and D. Nicholls. 1994. The Impact of Non-financial Company
Characteristics on Mandatory Disclosure Compliance in Developing Countries: The Case of Bangladesh. The International Journal of Accounting. 29:62-77.
Ahmed, K. and J.K. Courtis. 1999. Associations Between Corporate Characteristics
and Disclosure Levels in Annual Reports: A Meta-Analysis. British Accounting Review. 31:35-61.
Ali, M.J., K. Ahmed and D. Henry. 2003. Disclosure Compliance with International
Accounting Standards by Listed Companies in South Asia. Paper Presented at the 2003 AFAANZ Conference. Brisbane. Australia.
Amir, E. 1993. The Market Valuation of Accounting Information: The Case of
Postretirement Benefits Other Than Pensions. Accounting Review. 68:703-724. Amir, E., T.S, Harris and E.K. Venuti. 1993. A Comparison of the Value Relevance
of US versus non-US-GAAP Accounting Measures Using Form 20-F Reconciliations. Journal of Accounting Research Supplement. 31:230-264.
Amir, E. and B. Lev. 1996. Value-Relevance of Nonfinancial Information: The
Wireless Communication Industry. Journal of Accounting and Economics. 22:3-30.
Ang, N., G. Gallery and B.K. Sidhu. 1999. The Value Relevance of Superannuation
Disclosures. Accounting and Finance. 39: 205-228. Annual Report Partners. 2002. Australasian Reporting Award. Available from:
http://www.annualreportpartners.com/ara1.htm [Assessed 2 June 2003]. Australasian Reporting Award. 2003. 53rd Australasian Reporting Awards. Available
from: http://www.arawards.com.au/criteria/overview2003.html [Assessed 2 June 2003].
Australian Accounting Research Foundation. 1990. Statement of Accounting
Concepts 3 (SAC 3) The Qualitative Characteristics of Financial Information. Australian Accounting Standards Board. 1993. Australian Accounting Standards, ED
59 Financial Instruments.
References
263
Australian Accounting Standards Board. 1995. Australian Accounting Standards, ED 65 Presentation and Disclosure of Financial Instruments.
Australian Accounting Standards Board. 1996. Australian Accounting Standards.
AASB 1033 Presentation and Disclosure of Financial Instruments. Australian Accounting Standards Board. 1999. Australian Accounting Standards
AASB 1033 (reissued) Presentation and Disclosure of Financial Instruments. Ball, R. and P. Brown. 1968. An Empirical Evaluation of Accounting Income
Numbers. Journal of Accounting Research. 6:159-178. Ball, R, S.P. Kothari and A. Robin. 2000. The Effect of International Institutional
Factors on Properties of Accounting Earnings. Journal of Accounting and Economics. 29:1-51.
Ball, R., A. Robin and J.S. Wu. 2002. Incentives Versus Standards: Properties of
Accounting Income in Four East Asian Countries, and Implications for Acceptance of IAS. Working Paper. Simon School of Business, University of Rochester.
Barnes, R. 2001. Accounting for Derivatives and Corporate Risk Management
Policies. Working Paper. London Business School. Barth, M.E. 1991. Relative Measurements Errors Among Alternative Pension Asset
and Liability Measurers. The Accounting Review. 66:433-463. Barth, M.E. 1994. Fair Value Accounting: Evidence From Investment Securities and
the Market Valuation of Banks. The Accounting Review. 69 (January):1-25. Barth, M.E. 2000. Valuation-Based Accounting Research: Implications for Financial
Reporting and Opportunities for Future Research. Accounting and Finance. 40:7-31.
Barth, M.E. and W.R. Landsman. 1995. Fundamental Issues Related to Using Fair
Value Accounting for Financial Reporting. Accounting Horizons. 9(4):97-107. Barth, M.E. and S. Kallapur. 1996. The Effects of Cross-Sectional Scale Differences
on Regression Results in Empirical Accounting Research. Contemporary Accounting Research. 13(2):527-567.
Barth, M.E. and G. Clinch. 1996. International Accounting Differences and Their
Relation to Share Prices: Evidence from U.K., Australian, and Canadian Firms. Contemporary Accounting Research. 13(1):35-170.
Barth, M.E. and G. Clinch. 1998. Revalued Financial, Tangible, and Intangible
Assets: Associations with Share Prices and Non-Market-Based Value Estimates. Journal of Accounting Research. 36(Supplement):199-233

References
264
Barth, M.E., W.H. Beaver and W.R. Landsman. 1996. Value Relevance of Banks Fair Value Disclosures under SFAS 107. The Accounting Review. 71 (October):513-537.
Barth, M.E., W.H. Beaver and W.R. Landsman. 2001. The Relevance and Value
Relevance Literature for Financial Accounting Standard Setting: An Another View. Journal of Accounting and Economics. 31:77-104.
Barth, M.E., W.R. Landsman and J.M. Wahlen. 1995. Effects of Bank Earnings
Volatility, Regulatory Capital, and Valuation Contractual Cash Flows. Journal of Banking and Finance. 19:577-605.
Beaver, W. 1968. The Information Content of Annual Earnings Announcements.
Journal of Accounting Research. 6 (Supplement): 67-92. Bens, D.A. 2002. The Determinants of the Amount of Information Disclosed about
Corporate Restructurings. Journal of Accounting Research. 40(1):1-20. Berkman, H., M.E. Bradbury, P. Hancock and C. Innes. 1997. An Analysis Of
Disclosures Of Derivative Financial Instruments In Australia And New Zealand. Accounting Forum. 21(2): 207-228.
Berkman, H., M.E. Bradbury, P. Hancock and C. Innes. 2002. Derivative Financial
Instrument Use in Australia. Accounting and Finance. 42:97-109 Bernard, V.L. 1987. Cross-Sectional Dependence and Problems in Inference in
Market Based Accounting Research, Journal of Accounting Research. 25(1):1-48.
Blankey, A. and R. Schroeder. 2000. Accounting for Derivatives Under SFAS No.
133. The Mid-Atlantic Journal of Business. 36(1):17-35. Board, J., B. Rees and C. Sutcliffe. 1992. Measuring the Incremental Information
Content of Multiple Accounting Signals: A Note on the Use of Singular Value Decomposition. Journal of Business Finance and Accounting. 19(3):447-454.
Bollen, K.A. and R.W. Jackman. 1990. Regression Diagnostics: An Expository
Treatment of Outliers and Influential Cases, in Modern Methods of Data Analysis. (Edited by Fox, J. and J.S. Long). Newbury Park:Sage Publications.
Botosan, C. A. 1997. Disclosure Level and the Cost of Equity Capital. The
Accounting Review. 72(3):323-349. Botosan, C. A. and M. A. Plumlee. 2002. A Re-examination of Disclosure Level and
the Expected Cost of Equity Capital. Journal of Accounting Research. 40(1):21-40.
Bradbury, M.E. 2000. Issues in the Drive to Measure Liabilities at Fair Value.
Australian Accounting Review. 11(2):19-25.
References
265
Bradshaw, M.T., S.A. Richardson and R.G. Sloan. 1999. Earnings Quality and Financial Reporting Credibility: An Empirical Investigation. Working Paper. University of Michigan.
Bradshaw, M.T. and G.S. Miller. 2002. Are Detailed Accounting Standards Sufficient
to Ensure Compliance? Evidence from Non-U.S. Firms Adopting U.S GAAP. Working Paper. Harvard Business School.
Breedan, D. and S. Viswanathan. 1996. Why Do Firms Hedge? An Symmetric
Information Model. Working Paper. Duke University. In Tufano, P. 1996. Who Manages Risk? An Empirical Examination of Risk Management Practices in the Gold Mining Industry. Journal of Finance. 51 (4):1097-1138.
Brennan, M.J. 1991. A Perspective on Accounting and Stock Prices. The Accounting
Review. 66(1):67-79. Brown, P. 1994. Capital Markets-Based Research In Accounting: An Introduction.
Coopers and Lybrand and Accounting Association of Australia and New Zealand. Melbourne.
Brown, P. and B. Howieson. 1998. Capital Markets Research and Accounting
Standard Setting. Accounting and Finance. 38:5-28. Bushee, B.J. and C.F. Noe. 2000. Corporate Disclosure Practices, Institutional
Investors, and Stock Return Volatility. Journal of Accounting Research. 38 (supplement):171-202.
Chalmers, K. 2001. The Progression From Voluntary to Mandatory Derivative
Instrument Disclosures-Look Who’s Talking. Australian Accounting Review. 11(1): 34-45.
Chalmers, K. and J.M. Godfrey. 2000. Practice versus Prescription in The Disclosure
and Recognition of Derivatives. Australian Accounting Review. 11(2): 40-50. Choi, J.S. 1999. An Investigation of the Initial Voluntary Environmental Disclosures
Made in Korean Semi-Annual Financial Reports. Pacific Accounting Review. 11(1): 73-102.
Clinch, G. 1991. Employee Compensation and Firms’ Research and Development
Activity. Journal of Accounting Research. 29(1):59-78. Collins, D.W., E.L. Maydew and I.S. Weiss. 1997. Changes in the Value-Relevance
of Earnings and Book Values over the Past Forty Years. Journal of Accounting and Economics. 24(4) (December):39-68.
Collins, D.W, M. Pincus and H. Xie. 1999. Equity Valuation and Negative Earnings:
The Role of Book Value of Equity. The Accounting Review 74(1): 29-61. Cooke, T.E. 1989. Disclosure in the Corporate Annual Reports of Swedish
Companies. Accounting and Business Research. 19(74):113-124.

References
266
Cooke, T.E. 1991. An Assessment of Voluntary Disclosure in the Annual Reports of
Japanese Corporations. The International Journal of Accounting. 26:174-189. Cooke, T.E. 1992. The Impact of Size, Stock Market Listing and Industry Type on
Disclosure in the Annual Reports of Japanese Listed Corporations. Accounting and Business Research. 22(87):229-237.
Cornett, M.M., Z. Rezaee and H. Tehranian. 1996. An Investigation of Capital Market
Raections to Pronouncements on Fair value Accounting. Journal of Accounting and Economics. 22:119-154.
DaDalt, P. G.D. Gay and J. Nam. 2001. Asymmetric Information and Corporate
Derivatives Use. Working Paper. Georgia State University. Davis-Friday, P.Y., L.B. Folami, C.S. Liu and H.F. Mittelstaedt. 1999. The Value
Relevance of Financial Statement Recognition Vs Disclosure: Evidence From SFAS No 106. The Accounting Review. 74 (4): 403-423.
Deegan, C. 2002. Australian Financial Accounting. McGraw-Hill. 3rd edition. New
South Wales Australia. DeAngelo, L.E. 1981. Auditor Size and Audit Quality. Journal of Accounting and
Economics. 3:183-199. Deloitte Touche Tohmatsu. 2000. Accounting for Financial Instruments. Australian
Financial Markets Association. DeMarzo, P.M. and D. Duffie. 1995. Corporate Incentives for Hedging and Hedge
Accounting. Review of Financial Studies. 8(3): 743-771. Department of Foreign Affairs and Trade. 2003a. Exports of Primary and
Manufactured Products-Australia 2002. Market Information and Analysis Section. May.
Department of Foreign Affairs and Trade. 2003b. Australia Economic and Trade
Statistics. Market Information and Analysis Section. July. Duchac, J.E. 1998. Evaluating and Interpreting the Effectiveness of End User Interest
Rate Derivatives Disclosures. Journal of Managerial Issues. 10(Winter):419-438.
Easton, P.D. 1999. Security Returns and the Value Relevance of Accounting Data.
Accounting Horizons. 13(4):399-412. Eccher, A., K. Ramesh and S.R. Thiagarajan. 1996. Fair Value Disclosures of Bank
Holding Companies. Journal of Accounting and Economics. 22:79-117.
References
267
Eccher, E. and P.M. Healy. 2000. The Role of International Accounting Standards in Transitional Economies: A Study of The People’s Republic of China. Working Paper. MIT Sloan School of Management.
Eng, L.L. and Y.T. Mak. 2003. Corporate Governance and Voluntary Disclosure.
Journal of Accounting and Public Policy. 22: 325-345. Fama, E.F. and M.C. Jensen. 1983. Agency Problems and Residual Claims. Journal of
Law and Economics. 26(June):327-349. Fargher, N. 2001. Management Perceptions of Fair Value Accounting for All
Financial Instruments. Australian Accounting Review. 11(2): 62-72. Feay, W.F. and F.A. Abdullah. 2001. Impact of New Derivative Disclosures on
Multinational Firms’ Financing Strategies. Multinational Business Review. Spring:1-8.
Fekrat, M. A., C. Inclan and D. Petroni. 1996. Corporate Environmental Disclosures:
Competitive Disclosure Hypothesis Using 1991 Annual Report Data. The International Journal of Accounting. 31(2): 175-195.
Feltham, G.A. and J.A. Ohlson. 1995. Valuation and Clean Surplus Accounting for
Operating and Financial Activities. Contemporary Accounting Research. 11(Spring):689-731.
Financial Accounting Standards Board. 1991. Statement of Financial Accounting
Standards No 107 Disclosures about Fair Value of Financial Instruments. Financial Accounting Standards Board of the Financial Accounting Foundation.
Financial Accounting Standards Board. 1994. Statement of Financial Accounting
Standards No 119 Disclosure about Derivative Financial Instruments and Fair Value of Financial Instruments. Financial Accounting Standards Board of the Financial Accounting Foundation.
Financial Accounting Standards Board. 1998. Statement of Financial Accounting
Standards No 133 Accounting for Derivative Instruments and Hedging Activities. Financial Accounting Standards Board of the Financial Accounting Foundation.
Firth, M. 1979. The Impact of Size, Stock Market Listing, and Auditors on Voluntary
Disclosure in Corporate Annual Reports. Accounting and Business Research. Autumn: 273-280.
Ford, H.A.J. 1986. Principles of Company Law. 4th Ed. Butterworths. Gaver, J. and K.Gaver. 1993. Additional Evidence on the Association between the
Investment Opportunity Set and Corporate Financing, Dividend, and Compensation Policies. Journal of Accounting and Economics. 16:125-60.
References
268
Géczy, C., B.A. Minton and C. Schrand. 1997. Why Firms Use Currency Derivatives. The Journal of Finance. LII(4):1323-1354.
Gelb, D.S. and P. Zarowin. 2002. Corporate Disclosure Policy and the
Informativeness of Stock Prices. Review of Accounting Studies. 7 (33): 33-52. Godfrey, J. & S.P. Koh. 2001. The Relevance to Firm Valuation of Capitalising
Intangible Assets in Total and By Category. Working Paper. University of Tasmania.
Graham, R.C. and R.D. King. 2000. Accounting Practices and the Market Valuation
of Accounting Numbers: Evidence from Indonesia, Korea, Malaysia, the Philippines, Taiwan, and Thailand. The International Journal of Accounting. 35(4):445-470.
Guay, W.R. 1999. The Impact of Derivatives on Firm Risk: An Empirical
Examination of New Derivatives Users. Journal of Accounting and Economics. 26: 319-351
Gujarati, D.N. 1999. Essentials of Econometrics. 2nd Edition. McGraw-Hill, New
York. Gujarati, D.N. 2003. Basic Econometrics. 4th Edition. McGraw-Hill, New York. Hancock, P. 1994. Accounting for Financial Instruments: An Overview. Australian
Accounting Review. 4(2):3-12. Hancock, P. 1996. Financial Instruments. Accounting Forum. 19(4):385-398. Harris, M.S. and K.A. Muller III. 1999. The Market Valuation of IAS Versus US-
GAAP Accounting Measures Using Form 20-F Reconciliations. Journal of Accounting and Economics. 26:285-312.
Hassan, M.S. 1994. Hedging Accounting in Banking Institutions: Does It Exist in
Islamic Banks? Unpublished Master Science's Dissertation. University of Southampton.
Hassan, M.S., N. Mohd Saleh and A.G. Ismail.1996. Derivatives: The Need for
Reporting Standards. Proceeding International Seminar: Globalisation Issues in Economics and Management. Universiti Kebangsaan Malaysia.
Hassan, M.S., N. Mohd Saleh and A.G. Ismail. 1998. Derivatives in Foreign
Exchange: The Accounting Dilemma. Banker's Journal Malaysia. The Institute of Bankers Malaysia. September: 20-26.
Healy, P.M. and K.G. Palepu. 2001. Information Asymmetry, Corporate Disclosure,
and the Capital Markets: A Review of the Empirical Disclosure Literature, Journal of Accounting and Economics. 31:405-440.
References
269
Heflin, F., K.W. Shaw and J.J. Wild. 2001. Disclosure Quality and Market Liquidity. Working Paper. Purdue University.
Henderson, S. and G. Peirson. 2000. Issues in Financial Accounting, 9th Ed,
Longman, New South Wales. Holthausen, R.W. and R. L. Watts. 2001. The Relevance of the Value Relevance
Literature for Financial Accounting Standard Setting. Journal of Accounting and Economics. 31:3-75.
Hope, O.K. 2003a. Disclosure Practices, Enforcement of Accounting Standards, and
Analysts’ Forecast Accuracy: An International Study. Journal of Accounting Research. 41(2): 235-272.
Hope, O.K. 2003b. Firm Level Disclosures and the Relative Roles of Culture and
Legal Origin. Working Paper. Joseph L. Rotman School of Management, University of Toronto.
Hossain, M. and M. Adams. 1995. Voluntary Financial Disclosure by Australian
Listed Companies. Australian Accounting Review. 5(2): 45-55. Hudack, L.R. and J. P. McAllister. 1994. An investigation of the FASB's Application
of Its Decision Usefulness Criteria. Accounting Horizons. 8 (September): 1-18. Hughes, K.E. 2000. The Value Relevance of Nonfinancial Measures of Air Pollution
in the Electric Utility Industry. The Accounting Review. 75(2):209-228. Iman, R.L. and W.J. Conover. 1979. The Use of the Rank Transform in Regression.
Technometrics. 21(4)(November):499-509. Imhoff, E.A. Jr. 1992. The Relation Between Perceived Accounting Quality and
Economic Characteristics of the Firm. Journal of Accounting and Public Policy. 11: 97-118.
International Accounting Standards Committee. 1996. Financial Instruments:
Disclosure and Presentation. International Accounting Standard: 32. London. International Accounting Standards Committee. 1998. Impairment of Assets.
International Accounting Standard: 36. London. International Accounting Standards Committee. 1999. Financial Instruments:
Recognition and Measurement. International Accounting Standard: 39. London. IASC Steering Committee on Extractive Industries. 2000. Issues Paper: Extractive
Industries. International Accounting Standard Committee. United Kingdom. International Swaps and Derivatives Association Incorporation. 2002. 2001 Year End
Market Survey. Available from: http://www.isda.org/statistics/recent.html [Accessed1 July 2002].

References
270
Jaffar, R., T. Mohd Iskandar and J. Muhammad. 2002. An Investigation of Environmental Disclosures in Malaysia. Paper presented at the AAANZ Conference, Perth, Australia.
Jenkins, E.L. 1994. An Information Highway in Need of Capital Improvements.
Journal of Accountancy. May:77-82. Jensen, M.C. 1986. Agency Costs of Free Cash Flow, Corporate Finance, and
Takeovers. American Economic Review. 76:323-329. Jensen, M.C. and W.H. Meckling. 1976. Theory of The Firm: Managerial Behavior,
Agency Costs and Ownership Structure. Journal of Financial Economics. 3:305-360.
Johnson, L.T. and R. J. Swieringa. 1996. Derivatives, Hedging and Comprehensive
Income. Accounting Horizons. 10(4):109-122. Kane, G.D. and N.L. Maede. 1997. Rank Transformation in Cross-Sectional
Comparisons Using Ratio Analysis. Journal of Financial Statement Analysis. 2 (Winter):61-73.
Kennedy, P. 1998. A Guide to Econometrics. Blackwell Publication. Fourth Ed.
United Kingdom. Knoff, J. D., J. Nam and J. H. Thornton Jr. 2002. The Volatility and Price Sensitivities
of Managerial Stock Option Portfolios and Corporate Hedging. Journal of Finance. 57(2): 801-813.
Koonce, L., M.L. McAnally and M. Mercer. 2000. How Do Investors Judge the Risk
of Financial and Derivative Instruments? Working Paper. The University of Texas.
Kothari, S.P. 2000. The Role of Financial Reporting in Reducing Financial Risks in
The Market. Federal Reserve Bank of Boston Conference Series. Series 44(June): 89-102.
Kothari, S.P. 2001. Capital Markets Research in Accounting. Journal of Accounting
and Economics. 31:105-231. Lang, M. and R. Lundholm. 1993. Cross-Sectional Determinants of Analyst Ratings
of Corporate Disclosures. Journal of Accounting Research. 31(Autumn): 246-271.
Lang, M., J.S. Raedy and M.H. Yetman. 2003. How Representative Are Cross-Listed
in The United States? An Analysis of Accounting Quality. Journal of Accounting Research. 41(2):363-386.
Leo, K. and J.Radford. 1999. Financial Accounting Issues. 2nd ed. John Wiley and
Sons.
References
271
Levitt, A. 1998. The Importance of High Quality Accounting Standards. Accounting Horizons. 12(1):79-82.
Li-Chin, J.H., L. Chao-Shin and S. Pyung-Sik. 2001. The Value Relevance of
Accounting Information Around the 1997 Asian Financial Crisis-the Case of South Korea. Asia-Pacific Journal of Accounting and Economics. 8(2):83-107.
Lobo, G.J. and J. Zhou. 2001. Disclosure Quality and Earning Management. Asia
Pacific Journal of Accounting and Economics. 8(1): 1-20 Malone, D., C. Fries and T. Jones. 1993. An Empirical Investigation of the Extent of
Corporate Financial Disclosure in the Oil and Gas Industry. Journal of Accounting, Auditing, and Finance. 8(3): 249-273.
Marston, C.L. and P.J. Shrives. 1991. The Use of Disclosure Indices in Accounting
Research: A Review Article. British Accounting Review. 23:195-210. Miller, P.B.W. 2001. Will You Adopt Quality Financial Reporting? Strategic
Finance. 82(7):50-55. Miller, P.B.W. and P.R. Bahnson. 2002. Quality Financial Reporting. McGraw-Hill.
New York. Nance, D.R., C.W. Smith Jr. and C.W. Smithson. 1993. On the Determinants of
Corporate Hedging. The Journal if Finance. XLVIII(1):267-284. Nelson, K. 1996. Fair Value Accounting for Commercial Banks: An Empirical
Analysis of SFAS 107. The Accounting Review. 71:161-182. Neu, D., H. Warsame and K. Pedwell. 1998. Managing Public Impressions:
Enviromental Disclosures in Annual Reports, Accounting Organisations and Society. 23(3):265-282.
Nguyen, H. and R. Faff. 2002. On the Determinants of Derivatives Usage by
Australian Companies. Australian Journal of Managemen. 20(1):1-24. Ohlson, J.A. 1995. Earnings, Book Values and Dividends in Equity Valuation.
Contemporary Accounting Research. 11(2):661-687. Ota, K. 2001. The Impact of valuation Models on Value Relevance Studies in
Accounting: A Review of Theory and Evidence. Working Paper. The Australian National University.
Owusu-Ansah, S. 1998. The Impact of Corporate Attributes on the Extent of
Mandatory Disclosure and Reporting by Listed Companies in Zimbabwe. The International Journal of Accounting. 33(5):605-631.
Park, M.S., T. Park and B.T. Ro. 1999. Fair Value Disclosures for Investment
Securities and Bank Equity: Evidence from SFAS No 115. Journal of Accounting, Auditing and Finance. 14(3): 347-370.

References
272
Percy, M. 2000. Financial Reporting Discretion and Voluntary Disclosure: Corporate
Research and Development Expenditure in Australia. Asia-Pacific Journal of Accounting and Economics. 7: 1-31.
Pfeiffer, R.J. Jr. 1998. Market Value and Accounting Implications of Off-Balance
Sheet Items. Journal of Accounting and Public Policy. 17:185-207. Pincus, M. and S. Rajgopal. 2002. The Interaction Between Accrual Management and
Hedging: Evidence From Oil and Gas Firms. The Accounting Review. 77(1):127-160.
Pownall, G. and K. Schipper. 1999. Implications of Accounting Research for the
SEC’s Consideration of International Accounting Standards for U.S. Securities Offerings. Accounting Horizons. 13(3):259-280.
Price, R. 1998. Price Responsiveness of Informed Investors to Increases in Financial
Statement Disclosure Quality. Working Paper. The College of Williams and Mary.
Rasch, R.H. and A.C. Wilson. 1998. Comprehensive Accounting For Derivatives and
Hedging Activities. The Ohio CPA Journal. July-Sept:34-36. Riahi-Belkaouhi. A. 2001. Level of Multinationality, Growth Opportunities, and Size
as Determinants of Analysts Ratings of Corporate Disclosures. American Business Review. June:115-120.
Sarwal, A.K. 1989. KPMG International Handbook of Financial Instruments and
Transactions. Butterworths. London. Schrand, C.M. 1997. The Association Between Stock-Price Interest Rate Sensitivity
and Disclosures about Derivative Instruments. The Accounting Review. 72(1): 87-109.
Scott, W.R. 1997. Financial Accounting Theory. Prentice Hall. New Jersey. Sengupta, P. 1998. Corporate Disclosure Quality and the Cost of Debt. The
Accounting Review. 73(4): 459-474. Shaw, K.W. 2002. Corporate Disclosure Quality, Earnings Smoothing, and Earnings’
Timeliness. Journal of Business Research. 1-8. Simko, P.J. 1999. Financial Instrument Fair Values and Nonfinancial Firms. Journal
of Accounting, Auditing and Finance. Summer: 247-273. Singhvi, S.S. and H.B. Desai. 1971. An Empirical Analysis of the Quality of
Corporate Financial Disclosure. The Accounting Review. January:129-138. Smith, C.W. Jr. and J.B. Warner. 1979. On Financial Contracting : An Analysis of
Bond Covenants. Journal of Financial Economics. 7:117-161.
References
273
Smith, C.W. and R.M. Stulz. 1985. The Determinants of Firms' Hedging Policies.
Journal of Financial and Quantitative Analysis. 20(4):391-405. Smith, C.W. and R.L. Watts. 1992. The Investment Opportunity Set and Corporate
Financing, Dividend, and Compensation Policies, Journal of Financial Economics. 32:263-292.
Smith, D.T., M. Percy and G.R. Richardson. 2001. Discretionary Capitalisation of
R&D: Evidence on the Usefulness in An Australian and Canadian Context. Advances in International Accounting. 14:15-46.
Smith, R. 2000. TBA Denounces FASB’s Fair Value Accounting Proposal. Texas
Banking. July:34-38. Stanga, K.G. 1976. Disclosure in Published Annual Reports. Financial Management.
Winter:42-52. Stanga, K.G. 1980. The Relationship Between Relevance and Reliability: Some
Empirical Results. Accounting and Business Research. Winter: 29-39. Stulz, R.M. 1984. Optimal Hedging Policies. Journal of Financial Quantitative
Analysis. 19(June):127-140. Stulz, R.M. 1990. Managerial Discretion and Optimal Financing Policies. Journal of
Financial Economics. 26:3-28. Tai, B.Y.K., P.K. Au-Yueng, M.C.M. Kwok and L.W.C. Lau. 1990. Non-Compliance
with Disclosure Requirements in Financial Statements: The Case of Hong Kong Companies. The International Journal of Accounting. 25: 99-112.
Tan, R.C.W., G. Tower, P. Hancock and R.H. Taplin. 2003. The Unspoken Voice:
What Do Users Think of Fair Value Accounting For All Financial Instruments? Paper Presented at AFAANZ Conference. July. Brisbane.
Taplin, R.H., G. Tower and P. Hancock. 2002. Disclosure (Discernibility) and
Compliance of Accounting Policies: Asia-Pacific Evidence. Accounting Forum. 26(2):172-190.
Taylor, P. and S. Turley. 1986. The Regulation of Accounting. Blackwell. Oxford. Thomas, R.L. 1997. Modern Econometrics, An Introduction. Addison-Wesley.
England. Tower, G., P. Hancock and R.H. Taplin. 1999. A Regional Study of Listed
Companies’ Compliance with International Accounting Standards. Accounting Forum. 23(3): 293-305.
Trombley, M.A. 2003. Accounting for Derivatives and Hedging. McGraw-Hill/Irwin.
International Edition.
References
274
Tufano, P. 1996. Who Manages Risk? An Empirical Examination of Risk
Management Practices in the Gold Mining Industry. Journal of Finance. 51 (4):1097-1138.
U.S. Department of Justice (D.J.). 1998. United State Attorneys’ Manual, Title 4
“Civil Resource Manual” No. 59 Executory Contracts in Bankruptcy http://www.usdoj.gov/usao/eousa/foia_reading_room/usam/title4/civ00059.htm [Assess on 6 February 2004].
Venkatachalam, M. 1996. Value-Relevance of Banks' Derivatives Disclosures.
Journal of Accounting and Economics. 22: 327-355. Wallace, R.S.O. 1988. Corporate Financial Reporting in Nigeria. Accounting and
Business Research. 18(72): 352-362. Wallace, R.S.O., K. Naser and A. Mora. 1994. The Relationship Between the
Comprehensiveness of Corporate Annual Reports and Firm Characteristics in Spain. Accounting and Business Research. 25(7):41-53.
Wallace, R.S.O. and K. Naser. 1995. Firm-Specific Determinants of the
Comprehensiveness of Mandatory Disclosure in the Corporate Annual Reports of Firms Listed on the Stock Exchange of Hong Kong. Journal of Accounting and Public Policy. 14: 311-368.
Watts, R.L. and J.L. Zimmerman. 1986. Positive Accounting Theory. Prentice Hall
International. London. White, H. 1980. A Heteroskedasticity-Consistent Covariance Matrix Estimator and a
Direct Test for Heteroskedasticity. Econometrica. May:817-838. Whittred, G., I. Zimmer and S. Taylor. 2000. Financial Accounting Incentive Effects
and Economic Consequences. Fifth Ed. Harcourt, Sydney. Wilson, A.C. and G.R. Smith. 1997. Proposed Accounting for Derivatives: Does it
Address the Concerns of Current Accounting? Accounting Horizons. 11(3):69-78.
Wong, M.H. Franco. 2000. The Association between SFAS no 119 Derivatives
Disclosures and the Foreign Exchange Risk Exposure of Manufacturing Firms. Journal of Accounting Research. 38(2): 387-417.

References
275