Embed Size (px)
Citation preview

The Information Content of Options Trading: Evidence from the Taiwan Stock Exchange
Chuang-Chang Chang, Pei-Fang Hsieh and Hung Neng Lai ∗
ABSTRACT In this paper, we set out to investigate the information content of options trading using a unique dataset to examine the predictive power of the put and call positions of different types of traders in the TAIEX options market. We find that options volume, as a whole, carries no information on TAIEX spot index changes, essentially because the majority of trades originate from domestic institutional investors and individual investors; as such, they contain insignificant information. On the other hand, however, although foreign institutional investors do not engage in much trading, there is strong evidence to show that the trading in which they do engage has significant predictive power on the underlying asset returns. We also find that foreign institutional investors have greater predictive power with regard to out-of-the-money and short-horizon options, which results in higher trading leverage.
JEL classification: G14.
Keywords: Option volume; Emerging markets; Investors.
Current Draft: February 2008
∗ Chuang-Chang Chang, Pei-Fang Hsieh and Hung Neng Lai (the corresponding author) are collocated at the Department of Finance, National Central University, Taiwan. Address for correspondence: Hung Neng Lai, Department of Finance, National Central University, Jung-Li 32001, Taiwan. Tel: (03) 422-7151 ext 66264; Fax. (03) 425-2961; email: [email protected].

1. INTRODUCTION
A growing body of literature has emerged examining the magnitude of the impact of
foreign investor trading on host-country returns. Although some of the related
studies have explored the relationship between equity flows and US returns (e.g.
Bohn and Tesar, 1996; Brennan and Cao, 1997; and Karolyi, 2002), their findings
have failed to produce any coincidental evidence on whether such equity flows from
foreign investors do indeed have any impact on host-country returns.
In the emerging markets, Froot et al. (2001), Griffin et al. (2004) and Richards
(2005) are seen as providing the most relevant examinations of the relationship
between such foreign investor capital flows and returns. Froot et al. (2001) found
that the relationship between such capital flows and host-country returns was
positive, thereby implying that foreign investors actually possessed more information
on local stocks than local investors. However, in contrast to the Froot et al. (2001)
findings, in their investigation of aggregated equity flows in the emerging markets,
Griffin et al. (2004) and Richards (2005) both found comprehensive evidence to
show that capital flows from foreign investors (say, US investors) had a positive
correlation with host-country stock returns.
In this paper, we directly examine the ways in which foreign investor flows have
an impact on prices. To the best of our knowledge, this study represents the first of its
kind to investigate the relationship between foreign investment flows and host-country
returns using daily data on the options market. In a complete market, options trading
2

should convey no additional information on the underlying asset, essentially because
options are redundant assets; however, in practice, informed traders may choose to
trade in options instead of equities based upon several distinct advantages.
Black (1975) was the first to argue that the higher leverage and lower transaction
costs available in the options market may induce informed traders to participate in
that market. Mayhew et al. (1995) subsequently indicated that the lower margins
associated with equity options induced both informed and uninformed traders to
migrate to the options market. Back (1993) indicated that since asymmetric
information was the cause of the volatility in the underlying assets, informed traders
could bet on such volatility in the options market. Although there are numerous
other empirical studies which have investigated the linkage between the stock
market and the options market, the evidence is still inconclusive.1
The data for this study comes from the Taiwanese stock and options markets. The
Taiwan Stock Exchange (TWSE) was, according to the World Federation of Exchanges,
one of the major exchanges in the emerging markets in 2006, with its market
capitalization and trading volume respectively ranking it twentieth and fifteenth in the
world. Furthermore, the Taiwan index options (hereafter TAIEX options), the
underlying asset of which is the TWSE Capitalization Weighted Stock Index, are
currently ranked the fourth most frequently traded index option on a global scale.2
1 See, for example, Stephan and Whaley (1990), Vijh (1990), Chan et al. (1993), Easley et al. (1998), Chan et al. (2004), Chakravarty et al. (2004), Cao et al. (2005) and Pan and Poteshman (2006). 2 For detailed statistics, see the Statistics Section and Derivatives Market Survey available at the World Federation of Exchanges website, http://www. world-exchanges.org/.
3

Several of the prior studies (for example, Richards, 2005) have found that abnormal
positive returns in the TWSE are associated with foreign inflows, whilst Barber et al.
(2006) went on to use TWSE transaction data to demonstrate that individual investors
were the main losers, and foreign institutional investors were the main winners. Since
foreign investors play such an important informational role in the TWSE, this motives
us to investigate whether the capital flows from foreign investors into the Taiwan
options market also contain information on the underlying asset returns.
Although in a fairly large equity market, such as the US market, it is very
unlikely that anyone might possess private information about the market index, as
argued by Richards (2005), foreign capital flows in the emerging markets are so
large that they create price pressure. This clearly offers profitable opportunities for
those who have access to the information flow. For example, a Citibank trader who
knew that a mutual fund tracking in the Asian emerging markets of his/her company
would increase the portfolio weighting in the Taiwan market, may take advantage of
his/her information to build new long call positions. This positive information leads
to capital inflows from informed traders in the Taiwan options market.
Unlike most of the prior studies which have examined the CBOE options market,
Chan et al. (2005, 2006) used TAIEX options data to analyze the information content
between options and the underlying index; however, since they used net trading
volume as the information variable, they could not directly test the information
content arising from each type of trader. Similarly, in Pan and Poteshman (2006)
4

different classes of investor were inferred from brokerage identifications.
We, on the other hand, have obtained a unique dataset with detailed information
on all transaction records within the TAIEX options market, which enables us to
identify the different classes of investors. Thus, in contrast to Chan et al. (2005,
2006) and Pan and Poteshman (2006), we are able to identify exactly who the
individual or institutional investors are, and indeed, whether they are domestic or
foreign. This feature allows us to unearth evidence on the informational role of
various investor classes, thereby contributing to the literature on price discovery
from domestic vis-à-vis foreign capital flows in the equity and option markets.3
Our theoretical framework adopts the equilibrium model of Easley et al. (1998)
which allows the participation of informed traders in the options market to be
decided endogenously within an equilibrium framework. The Easley et al. model
determines that, in equilibrium, informed traders will use options, stocks, or a
mixture of the two assets. This feature enables us to discover the price-volume
linkage between the equity and options markets. We use option trades initiated by
buyers to open new positions as our information variables, which may contain the
predictability of future stock price movements noted by Pan and Poteshman (2006).
The main empirical results obtained from this study indicate that the capital
flows from foreign institutional investors do indeed have significant predictive
power with regard to next-day TAIEX spot index returns, whereas flows from other
3 Refer to Stulz (1999) for a general review of the literature in this area.
5

types of investors appear to have no significant predictive power. Since the entire
informed traders in the TAIEX options market account for less than 10 per cent of
the total trading volume in open positions, we can find no evidence of any price
discovery between the options and underlying asset markets in Taiwan.
We also use the Lee and Ready (1991) algorithm to compute the publicly
observable buyer-initiated put and call option volumes, but find that these have no
predictive power whatsoever for the index returns in our main regressions. Our
finding of overall option volume predictability in the index options market is
consistent with that of Pan and Poteshman (2006) which involved an examination of
the three major index options traded in the CBOE. Furthermore, our finding of
foreign investor flows in the options market is consistent with those of both Griffin
et al. (2004) and Richards (2005), that foreigner investor flows were predictive of
underlying asset returns in the emerging markets.
The dataset adopted for this study also facilitates an investigation into options
leverage, which is seen as extremely important, since a number of the prior studies
have suggested that this is the most important factor inducing informed traders to
trade in the options market. Black (1975) and Chakravarty et al. (2004), for example,
both indicated that leverage was the key variable determining whether informed
traders would choose to trade in the options market, whilst Kaul et al. (2004) also
suggested that informed traders would trade-off between options leverage and the
transaction costs arising from the liquidity of options.
6

Our results reveal that informed traders will choose to use out-of-the-money
(OTM) and short-horizon options for higher leverage; indeed, we observe the largest
predictability in both OTM and short-horizon options from the informed traders
group. Finally, we also investigate the predictability of information variables
constructed from others option volumes, and find that open-buy option volumes
provide the best information variables for testing the predictive power of investors.
An interesting finding of this study is the indirect evidence on individual investors’
apparent preference for contrarian strategies as opposed to the trend-chasing
behavior of institutional investors.
The remainder of this paper is organized as follows. Section 2 provides an
introduction to the data used in this study, followed in Section 3 by a description of
our empirical specifications. The empirical results are presented in Section 4, with
the conclusions drawn from this study being provided in the final section.
2. DATA
2.1 The Main Dataset
The options dataset used in this study was obtained from the Taiwan Futures
Exchange (TAIFEX). Our unique dataset consists of all TAIEX options transaction
records, providing the identification of investors, investors classes, type of options
(call/put), option characteristics (strike price and time to expiration), trading
directions (buy/sell), transaction prices and volume (in number of contracts). The
data period covers all trading days from 21 December 2001 to 24 December 2005,
7

and all options maturity days from January 2002 to December 2005.
One of the unique features of our dataset is that each transaction record can be
identified for different investor classes,4 which enables us to classify the associated
transaction volume into four main investor classes comprising of: domestic
institutional investors, foreign institutional investors, individual investors and
market makers.5 Although market makers and individual investors account for the
main proportion of all TAIEX options transactions, when analyzing the
predictability of futures returns, we did not include the trading volumes of these
investors, since we regarded these as non-directional, risk-neutral earnings.
As compared with the approach of Pan and Poteshman (2006), which involved the
use of daily aggregated trading volume, another feature of our dataset is that it contains
more detailed information on each transaction record initiated by each investor. This
characteristic allows us to correctly identify the trade type for each transaction,
according to the transaction records of the same type of option (call/put) and option
characteristics (strike price and time to expiration) of each investor for each trading day.
For example, we can identify the trading direction (buy/sell) and transaction
volume of a Citibank employee engaging in trades for the bank’s own account on a
4 TAIFEX options transaction data provides around 35 detailed categories of investor classes; for example, we can categorize institutional investors as domestic proprietary traders, clearing members, banks, securities investment trusts, foreign institutional investors, and so on. Individual investors can be similarly separated into domestic and foreign individual traders. The data also provides information on trading by market makers. Hence, our data contains more precise information than that adopted by Pan and Poteshman (2006). 5 We also classify investors into the nine groups suggested by the TAIFEX. Given that we find only a few trades being initiated by certain investor classes, our findings are robust to such classification. In this study, the classification of domestic institutional investors includes domestic institutions, proprietary traders and securities investment trusts.
8

specific day. We can determine whether the trade types are ‘open-buy’ if the
employee first opened a new position for which we can find no corresponding
‘open-sell’ before the time and day that the buy order was initiated. Conversely, we
can determine ‘close-buys’ if the employee opened a new sell position prior to
initiating the buy order. With similar logic, we can determine both ‘open-sell’ and
‘close-sell’, and we can also determine ‘open-interest’ trade types by collecting
those positions which existed at each trading day.6
This method of classification of trade types provides distinct advantages over
other datasets used in many of the prior studies. Firstly, as in Pan and Poteshman
(2006), we know the certain ‘sign’ of the trading volume, and unlike the prior
studies which used the Lee and Ready (1991) algorithm to speculate the sign, we
can reduce the determined error and obtain more information content on options
volume. Secondly, this information content helps us to analyze the motives behind
the trading activities, because the open and close positions may be generated by
different viewpoints on the direction of the underlying asset.
Details on the daily option trading volume, by different types of trades and
classes of investors, are provided in Table 1. The average trading volume is
calculated by a time-series average of the aggregated daily volume with different
strike prices and times to expiration. The trading volume for call options is, on
average, much higher than that for put options, a phenomenon which is the same
6 Our open-interest volumes differ from the daily open-interest of market published in the TAIFEX website, because ours can be identified as put and call contract volume, which is helpful to our study.
9

across all types of trades. It is interesting to note that we find that the TAIEX options
open-buy call position is, on average, the highest across all trade types, and that this
phenomenon differs from the transaction structure of US index options’.7
<Table 1 is inserted about here>
Table 1 also reports the proportion of trading volume by different classes of
investors. As one can see from the table, the composition of the participants in the
TAIEX options market differs significantly from that of the US index options market,
with individual investors being the major participants across almost all types of
trades in the TAIEX, as well as the most active in open-buy call and put positions.
The second largest class of investors is the market makers, whilst institutional
investors, including both domestic and foreign institutional investors, account for only
around 10 per cent of all market participation. If we were to exclude the trading volume
of the market makers, the structure of the TAIEX options market would comprise of
around 75 per cent individual investors and 25 per cent institutional investors.
In contrast, the main participants in the S&P 500 index options market are
proprietary traders who may have large portfolios made up of components of the
S&P 500, and who will tend to open-buy put to protect against the downside risk.8
7 In their examination of S&P 500, S&P 100 and NASDAQ 100 index options, Pan and Poteshman (2006) found that the average time-series open-buy call positions in the S&P 500 and NASDAQ 100 were smallest across open-buy and open-sell positions, although the latter were slightly larger than the former. In contrast, the open-buy put positions in these US index options were highest across all trade types, with the time-series average open-buy call positions in the S&P 100 also being found to be smaller than the open-buy put positions. 8 Referring to the statistics of Pan and Poteshman (2006), the participants in the S&P 500 index options comprised of about 20 per cent proprietary traders. In addition, full-services customers, who account for around 60 per cent of all participants, excluding market makers, may include some elements of institutional traders.
10

Lakonishok et al. (2004) also suggested that hedgers tended towards open-sell call
positions for the purpose of generating covered calls, and that they also tended to
make their short call positions larger than their long call positions. Lakonishok et al.
(2004) further noted that speculators tended to buy call or put positions relating to
the returns of the underlying assets in the previous week.
In this study, we find that speculators in the TAIEX options market are much
more active, which is quite different the scenario in the US index options market
where investors use index options mainly for hedging purposes.9 These features of
the TAIEX options market motivate us to examine the way in which the composition
of investors has an impact on prices.
2.2 The Open-Buy Subset
Open-buy trading volume is the key variable in our examination of the information
content of trading volume, because informed traders are very likely to open new
positions in cases where they possess private information on the underlying asset.
Hence, our open-buy subset includes all options trading volume initiated by buyers
to open up new positions. We calculate the total open-buy volume by summing all
put and calls across all available strike prices and times to expiration. We then
examine whether these four classes of investors tend to open-buy new positions, and
if so, which type of options contracts they tend to use.
9 In their investigation of the information role of the TAIEX index options market, Chan et al. (2005) found that informed trading in this market was occurring in a way which differed from many of the prior findings for mature options markets.
11

The percentage of open-buy trading volume from the various classes of investors,
across different levels of moneyness of put and call options, are reported in Panel A of
Table 2. The categories of moneyness follow the classification of Pan and Poteshman
(2006). As Panel A shows, overall, investors tend to open a long position with more
out-of-the-money (OTM) options than in-the-money (ITM) options, with the highest
proportion of open-buys occurring at near-the-money options. Furthermore, slightly
OTM options are much more liquid than ITM options, although a little less liquid than
near-the-money options. Consistent with Kaul et al. (2004), deep-OTM options are
less liquid than near-the-money and slightly OTM options.
<Table 2 is inserted about here>
From observation of the trading behavior of each type of investor, we find that
foreign institutional investors trade most actively in OTM options, whereas these
options are traded least actively by individual investors. Chan et al. (2005, 2006)
found that leverage determined where informed traders would trade in the TAIEX
options market and that the index returns were led by OTM options. This feature
motives us to examine whether the capital flows of foreign institutional investors do
indeed predict the underlying asset returns.
Panel B of Table 2 shows the percentage of open-buy trading volume from the
different classes of investors across various times to expiration of put and call options,
revealing that most investors tend to trade in the nearby TAIEX options; this is
probably because the liquidity of the nearby contracts is much better than others, or
12

because short-horizon contracts also provide higher leverage than others. It is
interesting to observe more active trading by foreign institutional investors in
mid-horizon contracts (30-59 days) and other long-horizon contracts (60-89 days),
than in other contracts. If there are larger spreads in long-horizon options, giving rise
to higher transaction costs, we may speculate that foreign institutional investors have
very little concern over such high transaction costs.
Our aim, in Panel C of Table 2, is to determine when investors will tend to open
up long positions in put or call contracts. Given that our main tests will examine the
predictability of options trading volume and index returns over short horizons, an
issue which is also of concern is the way in which past-week futures returns
influence the trading behavior of investors. As Panel C shows, the behavior of the
four classes of investors is quite similar, with only slight differences in the case of
individual investors, who tend to open-buy call when past-week returns were low
and open-buy put when past-week returns had performed well. On the other hand,
however, institutional investors and market makers tended to open up long put
positions when past-week returns were at their worst, and opened up long call
positions when past-week returns had performed well.
This finding concurs with Pan and Poteshman (2006), who found that firms’
proprietary traders would tend to buy fewer call (put) options when stocks had
performed poorly (well). They explained that these proprietary traders had less
incentive to buy call (put) options for hedging their short (long) positions in stocks
13

when the underlying stock had already performed poorly (well). Hence, similar to
the finding of Lakonishok et al. (2004), a possible explanation of this is that
institutional investors will tend to implement momentum strategies, whereas in
contrast, individual investors will tend to use contrarian strategies.
3. EMPIRICAL SPECIFICATIONS
3.1 Testing the Predictability of Privative Information
Our empirical investigation focuses on whether the options trading volume of
different investors provides different information on the future movement of the
underlying assets. The information-based model constructed by Easley et al. (1998)
is capable of investigating the linkage between options volume and stock prices;
however, they used aggregated option trades and were unable to determine the
differences between various types of investors. The dataset used by Pan and
Poteshman (2006) provided information on the types of trades, such as open or close
trade positions which enabled them to use the open-buy put-call ratios as the
information variables in the options market; as a result, they found that the
non-public option volumes provided predictability of the underlying stock returns.
In this study, we also adopt the information variable of Pan and Poteshman
(2006), although our empirical investigation focuses on the flows into the TAIEX
options market; as such, our empirical design will differ slightly from that of Pan
and Poteshman (2006), which mainly examined individual stock options using a
cross-sectional separating equilibrium regression. We test the hypothesis on the
14
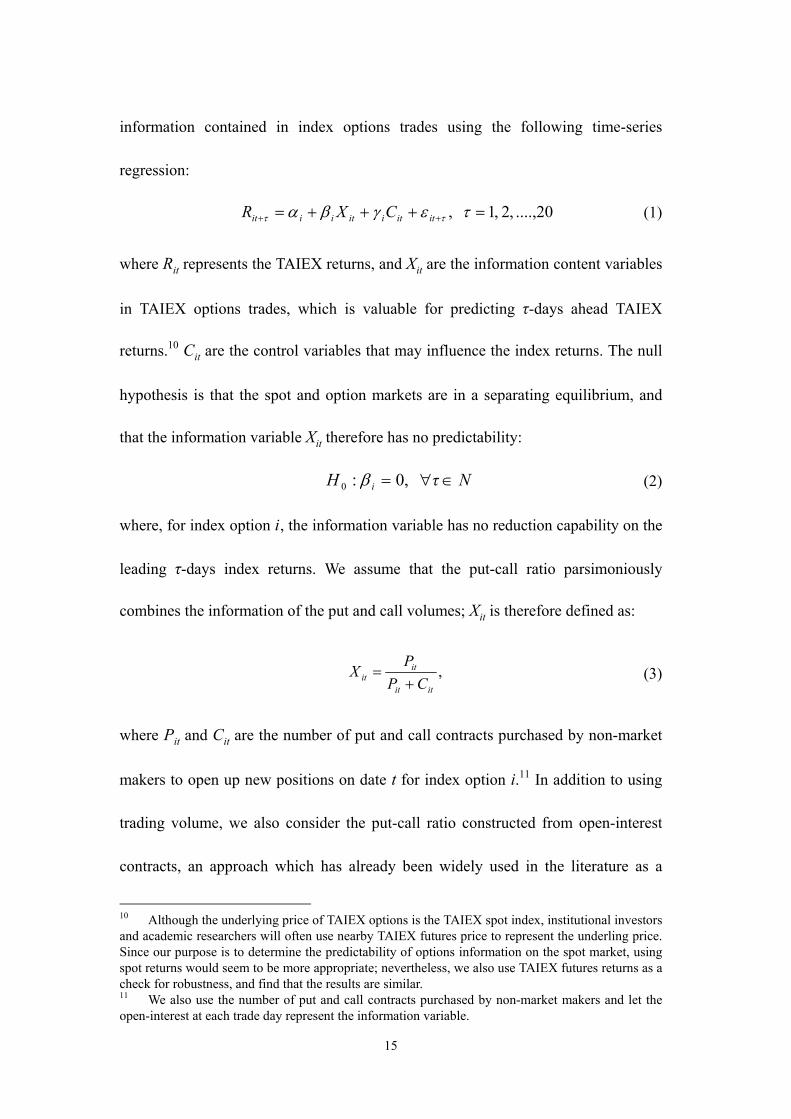
information contained in index options trades using the following time-series
regression:
20...., ,2 ,1 , =+++= ++ τεγβα ττ ititiitiiit CXR (1)
where Rit represents the TAIEX returns, and Xit are the information content variables
in TAIEX options trades, which is valuable for predicting τ-days ahead TAIEX
returns.10 Cit are the control variables that may influence the index returns. The null
hypothesis is that the spot and option markets are in a separating equilibrium, and
that the information variable Xit therefore has no predictability:
NτH i ∈∀= ,0:0 β (2)
where, for index option i , the information variable has no reduction capability on the
leading τ-days index returns. We assume that the put-call ratio parsimoniously
combines the information of the put and call volumes; Xit is therefore defined as:
,itit
itit CP
PX
+= (3)
where Pit and Cit are the number of put and call contracts purchased by non-market
makers to open up new positions on date t for index option i.11 In addition to using
trading volume, we also consider the put-call ratio constructed from open-interest
contracts, an approach which has already been widely used in the literature as a
10 Although the underlying price of TAIEX options is the TAIEX spot index, institutional investors and academic researchers will often use nearby TAIEX futures price to represent the underling price. Since our purpose is to determine the predictability of options information on the spot market, using spot returns would seem to be more appropriate; nevertheless, we also use TAIEX futures returns as a check for robustness, and find that the results are similar. 11 We also use the number of put and call contracts purchased by non-market makers and let the open-interest at each trade day represent the information variable.
15

proxy either for private information or investors’ heterogeneous beliefs.12
We use the new open position as the informed trader flows (say foreign
institutional investors), and consider that if informed traders with positive
information were able to take advantage of their information by building new long
call positions, this positive information would give rise to inflows from informed
traders, and add to the total number of call contracts. Conversely, informed traders
will open buy a put position when they wish to realize their negative private
information and increase the unobservable open-buy put-call ratio. We construct our
alternative hypothesis from these ideas; that is, if the flows of informed traders could
predict the underlying asset returns, then we would expect the coefficient βi in
Equation (1) to be negative and significant.
3.2 Test of Privative vs. Public Information
In order to undertake a comparison with the private (non-public) information possessed
by informed traders, we also introduce a public information variable, the put-call ratio
constructed from the option volume of the buyer- or seller-initiated trade determined by
the Lee and Ready (1991) algorithm. The put-call ratio constructed from this algorithm
would combine informed and uninformed traders’ option volume and would not classify
opening or closing positions. If informed traders’ motives for opening new long (short)
positions included their private positive (negative) information, then the put-call ratio
12 Amin and Lee (1997) demonstrated that good (or bad) earnings news had a positive correlation with a pre-announcement increase in call (or put) open interest, whilst more recently, Buraschi and Jiltsov (2006) established a theoretical model which linked the heterogeneity in beliefs to option open-interest.
16

determined by the Lee-Ready algorithm would mix up this information, which would
then be weakened, in terms of its capacity for predicting index returns. We define the
public observable put-call ratio, XitL&R, as follows:
,R&LR&L
R&LR&L
itit
itit CP
PX
+= (4)
where PitL&R and Cit
L&R are the numbers of put and call contracts, determined as
buyer-initiated trades using the Lee-Ready algorithm on date t for index option i.
Many of the prior studies, such as Easley et al. (1998), have used the put and call
volume constructed from the Lee-Ready algorithm and found that this provided
weak predictability. We therefore expect that if we use the put-call ratio determined
by the Lee-Ready algorithm as the independent variable in Equation (1), the
coefficient βi would be less significant, or indeed, insignificant.
3.3 Decomposing Privative Information
In order to investigate which traders may possess superior information, we
decompose the information variable into three components, which are constructed
by the open-buy put-call ratios of three of the classes of investors (excluding market
makers). The regression is expressed as follows:
1IIFIFIDIDI
1 ++ ++++= its
its
is
its
is
its
iiit XXXR εβββα (5)
where XitDIs, Xit
FIs and XitIs respectively denote the open-buy put-call ratio of domestic
institutional, foreign institutional, and individual investors in TAIEX options at date t.
17

We anticipate those investor classes with more significantly negative coefficients
providing higher predictability levels, and indeed, that foreign institutional investors will
demonstrate the greatest predictability, followed in second place by domestic
institutional investors, with individual investors providing the least predictability.
We also analyze which types of options attract most informed traders. It has been
suggested in the prior studies that informed traders will elect to trade in the options
market as a result of options leverage. This motivates us to investigate whether
informed traders do indeed prefer to use options leverage. We decompose the
information variable of various investor classes once again into groups of moneyness,
and then separately reform three predictive regressions, with the predictive regression
of foreign institutional investors, for example, being of the following form:
1M&FIs
1 ++ ++= ititMiiit XR εβα (6)
where Rit +1 is the next-day TAIEX spot index return, XitFIs&M is the put-call ratio of
foreign institutional investors constructed using OTM, near-the-money or ITM put
and call open-buy volume.
As in much of the prior literature, in which there is general agreement that OTM
options provide higher leverage, we would expect that informed traders would tend to
trade OTM options as the means of taking advantage of their privative information.
We therefore suspect that the coefficient of OTM options, β OTM, as the informed
traders group, will be more significantly negative than the coefficient of ITM options,
β ITM, because the flows of OTM options contain more of the private information
18

revealed by informed traders.
Referring back to our summary statistics in Panel A of Table 2, we find that
foreign institutional investors do trade most actively in OTM options; hence, it is
reasonable to expect that we would observe the most significant negative coefficient
for the foreign institutional investors group. Furthermore, using time to expiration as
another variable for options leverage, we expect that short-horizon options, which
provide higher leverage, will have better predictive power than long-horizon options.
4. RESULTS
4.1 Predictability of the Overall Market
As indicated in our empirical specification in Section 3, the overall market
predictability regression would show whether the aggregated options volume could
predict future returns. In order to calculate the daily aggregation of the put-call ratio,
as expressed in Equation (3), we sum the put and call contracts of the non-market
makers, which were determined as open-buy (or open-interest) types of trades; we
then obtain the daily publicly non-observable put-call ratios. For comparison, we
include publicly observable options volume; that is, the put-call ratio determined by
the Lee-Ready algorithm in Equation (4). Note that due to limitations of the database,
we obtain a slightly shorter period, from 2 January 2002.13
The results of Equation (1), without control variables, are reported in Table 3, from
13 As a result of the lack of TEJ daily closing bid and ask prices on the TAIEX options in 2001, data which is used for Lee and Ready put-call ratios, we lose six days’ data.
19
which we are unable to find any significant predictability within one week for either of
the publicly non-observable put-call ratios. This is hardly surprising, since the prior
studies have tended to focus on individual stock options, positing that some investors
have private information on the underlying stock which they may try to exploit by
trading in the options market. However, in the case of index options, it is difficult for the
aggregated trade activities to reveal the private information of individual stocks, since
the underlying index essentially diversifies the firm-specific information.
<Table 3 is inserted about here>
In order to investigate longer periods of information content, we extend the
predictability horizon and find that the publicly non-observable options volume has
predictability at the leading 7 days, 9 days and 18 days. Conversely, the publicly
observable options volume has no predictability for any leading period. In summary,
our test of overall market predictability is unable to reject the hull hypothesis that
the aggregated option volume has no predictive power to future returns; or at least,
no predictability of the leading returns within one week.
4.2 Predictability of Informed versus Uninformed Traders
After finding no predictability for aggregated options volume, we turn to investigate
the predictability of each of the classes of investors. Our dataset enables us to
classify open-buy volume from three investor classes; hence, we can identify the
put-call ratios for each of these groups. We reinvestigate Equation (1) and jointly run
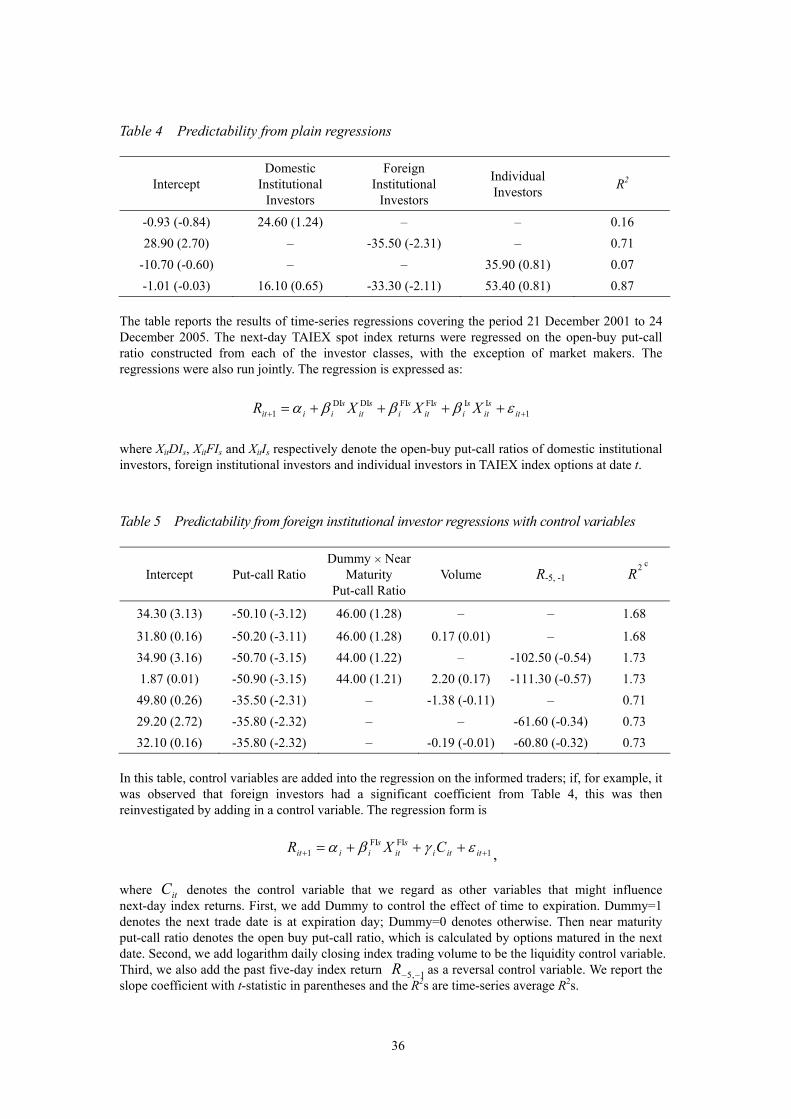
the regressions of Equation (5). Table 4 shows the summarized results.
20
<Table 4 is inserted about here>
The open-buy volume from foreign institutional investors provides the only
strong predictive power in terms of both magnitude and statistical significance, with
a coefficient of –35.5 basis points and a t-statistic of –2.31. Conversely, neither the
domestic institutional investors nor the individual investors have any significant
predictability. It is interesting to note that individual investors account for about 50
per cent of the open-buy volume that was reported in Table 1, although their trades
do not contain any significant information. On the other hand, despite the fact that
foreign institutional investors account for only a small proportion of the total volume,
their trades provide strongly predictive power with regard to leading returns. This is
direct evidence that flows from foreign institutional investors can indeed predict the
underlying asset returns in the Taiwan market.
In order to further investigate the predictive power of foreign institutional
investors, we add into Equation (1) some control variables which might influence
the next-day index returns. Firstly, we add a dummy variable to control for the effect
of time to expiration.14 If Dummy=1 denotes the next trade day is maturity date, and
then excludes the near maturity open-buy put-call ratio, which is calculated by
options matured in the next date. Secondly, we add in daily closing index trading
14 Ni et al. (2005) provided several explanations of the expiration-day effects. Most of the prior studies refer to the need to unwind arbitrage positions at expiration (e.g. Stoll and Whaley, 1987, 1990) or the manipulation of the underlying stock price at expiration by investors with written options. Kumar and Seppi (1992), for example, noted that if futures accounts were closed by ‘cash settlement’ rather than by ‘physical delivery’, manipulative spot trading could then improve the settlement price; however, uninformed investors could still have positive expected profits by establishing futures positions and then trading in the spot market to manipulate the spot price used to compute the cash settlement at delivery.
21

volume as the liquidity control variable. Thirdly, we add in the past five-day index
return R–5,–1 as a reversal control variable.15 Table 5 summarizes the results of the
predictive regressions with these control variables.
<Table 5 is inserted about here>
Overall, we find that the put-call ratio from foreign institutional investors still
has strong predictive power on all of the regressions, and that these controls have no
impact on next-day return predictability from options volume. It should be noted
that we can find no significant additional information at the expiration date. Trading
volume has a slightly positive influence on next-day returns, although the impact is
not significant, and we also find a slightly insignificant reversal of index returns.
As a test of robustness, we also undertook analysis of the open-interest volume
and found similar results to the open-buy volume. In summary, we find that there is
overall predictive power from foreign institutional investors, despite the fact that
they account for only a small proportion of the total volume.
4.3 Predictability with Varying Options Leverage
In this section, our main focus is on the types of options preferred by informed
traders. We classify the put and call options from the different classes of investors
into five categories, based upon their moneyness and time to expiration. Panel A of
Table 6 reports the predictability results for each of the classes of investors with
options volume of varying moneyness, as specified in Equation (6). The fact that we
15 Lo and Mackinlay (1990) reported a negative relationship between leading and past returns.
22

can observe foreign institutional investors trading most actively in deep OTM and
slightly OTM options is hardly surprising; and indeed, these particular investors
trade around 5 per cent and 40 per cent of their aggregated open-buy volume, as
compared with 2 per cent and 29 per cent for individual investors, and 2 per cent and
33 per cent for domestic institutional investors.
<Table 6 is inserted about here>
Furthermore, we observe strong predictability for next-day index returns, in
terms of both magnitude and statistical significance, in the deep-OTM and slightly
OTM options trading undertaken by foreign institutional investors. Nevertheless, we
find the strongest information content for next-day index returns comes from
slightly OTM options (3 per cent to 10 per cent) as opposed to deep OTM options
(above 10 per cent). We then move to the lesser leverage options in the foreign
institutional investor groups, and find predictability gradually weakening.
Another interesting finding is our observation that domestic institutional
investors also actively trade in OTM options, although their trades may contain
insignificant information for next-day index returns. The last three columns of Panel
A of Table 6 show the results of predictability for individual investors. Again, it is
unsurprising to find that this group has a lower proportion of trades in OTM options,
as compared with other investor groups, and that they have no significant
predictability with regard to the index returns.
Panel B of Table 6 reports the findings of our further examination of the
23

information content of options volume with different times to expiration. With a
given level of moneyness, short-horizon options offer higher leverage than
long-horizon options. We also find that a significant proportion of all investors’
trades are in nearby options, although only the trading volume of foreign
institutional investors contains information on next-day index returns.
It should be noted that relatively high proportions of foreign institutional
investors’ trades are also discernible in middle- and long-horizon (30-59 and 60-89
days) options, with their trading activities having significant predictability, in terms
of both magnitude and statistical significance; however, we can find no similarly
significant predictive power in short-horizon options for the other two classes of
investors. In summary, our findings are consistent with those of Black (1975) and
Chakravarty et al. (2004), who found that informed agents would trade in OTM
option contracts and that OTM options play a significant role in price discovery.
4.4 Predictability for Other Option Types
We now examine the information content of the other option volume types; i.e.,
open-sell, close-buy and close-sell. If informed traders possess positive information on
the overall market, they can either open buy a new call, or sell a new put in the options
market to realize their prediction. The former adds to the total number of contracts in
open-buy call options and reduces the open-buy put-call ratio, such that the expectation
of next-day index returns is that they will rise, whilst the latter adds to the total number
of contracts in open-sell put options and increases the open-sell put-call ratio, with the
24

resultant expectation that the next-day index returns will fall.
It is, however, reasonable to assume that investors will prefer to buy put rather
than sell put, because buying put is a way of overcoming their short-sell restrictions,
whilst selling put is equal to establishing a long position, and buying an index future
or call option is more straightforward.16 Hence, we would expect less significant
predictability from informed traders in the predictive regression on the open-sell
put-call ratio than on the open-buy put-call ratio.
In order to investigate the predictability of other option types, we redefined the
put-call ratios according to open-sell, close-buy and close-sell volume, with these
put-call ratios substituting for the independent variables in Equation (1). The
coefficients of joint regressions by investor classes are presented in Table 7, from
which we observe that the open-sell volume for both foreign and domestic
institutional investors is positive, but not significant.
<Table 7 is inserted about here>
It should be noted that we observe a positive and significant coefficient on the
open-sell volume for individual investors. Corresponding to Panel C of Table 2, we
find that individual investors will tend to use contrarian strategies relating to the
past-week returns; hence, a reasonable explanation might be that individual
investors open sell new put positions when the prior returns are low, since the
16 Lakonishok et al. (2004) also noted that many of the sell call positions were part of the cover call strategies adopted, as opposed to direct speculation that the underlying price would fall. As such, the open-sell option volume would contain complex trading information, which would result in the weakening of the predictive results by such noisy signals.
25

returns are more likely to see a future reversal.
Nevertheless, Lakonishok et al. (2004) pointed out that in opening their new
positions, non-market makers are trend-chasers in their purchases of calls rather than
short-sale puts. Chan et al. (2005, 2006) also noted that during a downtrend in a bull
market, informed traders were more likely to buy OTM calls than to sell OTM puts,
and vice versa. Overall, the predictability of open-sell option volume is less direct
than that of open-buy.
Informed traders can also close their existing option positions in order to realize
the profits arising from their private information, in which case, we would expect to
observe less information content in close positions than in open positions. Table 7
also reports the results of predictability in close option volume, from which we can
indeed observe that the coefficients of the close-buy and close-sell option volumes
of foreign institutional investors are both insignificant.
It seems rather strange that we observe a significant close-buy option volume of
incorrect sign for individual investors; however, as noted earlier, the close-buy
positions have complex trading purposes that might easily distort the predictability.
In summary, we conclude that the information in open-buy volume is clearly more
informative, at least with regard to the results for foreign institutional investors.
5. CONCLUSIONS
Having obtained a unique dataset with detailed information on transaction records in the
TAIEX options market, we provide evidence of varying degrees of predictability from
26

different classes of investors. In addition, our study sheds some light on the capital flows
from foreign investors in the Taiwan options market which may have predictive power
with regard to the underlying asset returns. Our investigation may provoke further study
of the information content of index options markets, which are generally viewed in the
prior studies as being less informative than individual stock markets.
The findings of this study suggest that only foreign institutional investors have
significant predictive power in the TAIEX options market, thereby providing
evidence that foreign investor flows do indeed have an impact on host-country (say,
Taiwan equity market) returns. Our findings are consistent with those of Griffin et al.
(2004) and Richards (2005); however, we find that TAIEX options volume, overall,
carries no information on leading TAIEX spot index changes. Our finding of overall
options volume predictability in the index options market is consistent with Pan and
Poteshman (2006) who investigated three major index options traded in the CBOE.
We further investigated the influence of options leverage on predictability, with the
results showing that the group of informed traders provided the largest predictability in
OTM and short-horizon options, thereby providing higher leverage. Our findings also
provide indirect evidence that individual investors appear to prefer contrarian strategies,
whilst institutional investors tend more towards momentum trades.
Our study has focused only on predictability from options volume to the
underlying asset price; however, market cycles may play another important role in
the predictability of options. For example, informed traders may be more inclined to
27

open new call positions in a bull market for higher leverage. On the other hand, in a
bear market, informed traders may wish to overcome their short-sale restrictions on
the underlying assets by opening more new put positions in the options market.
Hence, further research seeking to determine whether such predictability will change
under different market conditions would seem worthwhile.
28

REFERENCES
Amin, K. and C.M. Lee (1997), ‘Option Trading, Price Discovery and Earnings
News Dissemination’, Contemporary Accounting Research, 14: 153-92.
Back, K. (1993), ‘Asymmetric Information and Options’, Review of Financial
Studies, 6: 435-72.
Barber, B.M., Y. Lee, Y. Liu and T. Odean (2006), ‘Just How Much Do Individual
Investors Lose by Trading?’, Working Paper, University of California, Davis.
Black, F. (1975), ‘Fact and Fantasy in the Use of Options’, Financial Analysts
Journal, 31: 36-41, 61-72.
Bohn, H., and L.L. Tesar (1996), ‘US Equity Investment in Foreign Markets:
Portfolio Rebalancing or Return Chasing?’, American Economic Review, 86:
77-81.
Brennan, M.J. and H.H. Cao (1997), ‘International Portfolio Investment Flows’,
Journal of Finance, 52: 1851-80.
Buraschi A. and A. Jiltsov (2006), ‘Model Uncertainty and Option Markets with
Heterogeneous Beliefs’, Journal of Finance, 61: 2841-97.
Cao, C., Z. Chen and J.M. Griffin (2005), ‘The Informational Content of Option
Volume Prior to Takeovers’, Journal of Business, 50: 1073-1109.
Chakravarty, S., H. Gulen and S. Mayhew (2004), ‘Informed Trading in Stock and
Option Markets’, Journal of Finance, 59: 1235-57.
Chan, K., P. Chung and H. Johnson (1993), ‘Why Option Prices Lag Stock Prices: A
Trading-based Explanation’, Journal of Finance, 48: 1957-67.
Chan, K., Y.P. Chung and W. Fong (2002), ‘The Information Role of Stock and
Option Volume’, Review of Financial Studies, 15: 1049-75.
29
Chan K.C., Y. Chang and P. Lung (2005), ‘Informed Trading under Different Market
Conditions and Moneyness: Evidence from TXO Options’, Working Paper,
Department of Economics and Finance, University of Dayton.
Chan K.C., Y. Chang and P. Lung (2006), ‘Do Options Contribute to Price
Discovery in Emerging Markets?’, Working Paper, Department of Economics
and Finance, University of Dayton.
Easley, D., M. O’Hara and P. Srinivas (1998), ‘Option Volume and Stock Prices:
Evidence on Where Informed Traders Trade’, Journal of Finance, 53: 431-65.
Froot, K.A., P.G.J. O’Connell and M.S. Seasholes (2001), ‘The Portfolio Flows of
International Investors’, Journal of Financial Economics, 59: 151-93.
Griffin, J.M., F. Nardari and R.M. Stulz (2004), ‘Are Daily Cross-border Equity
Flows Pushed or Pulled?’, Review of Economics and Statistics, 86: 641-57.
Karolyi, G.A. (2002), ‘Did the Asian Financial Crisis Scare Foreign Investors Out of
Japan?’ Pacific Basin Finance Journal, 10: 411-42.
Kaul, G., M. Nimalendran and D. Zhang (2004), ‘Informed Trading and Option
Spreads’, Working paper, University of Michigan.
Kumar P. and D.J. Seppi (1992), ‘Futures Manipulation with Cash Settlement’,
Journal of Finance, 47: 1485-1502.
Lakonishok J., I. Lee and A.M. Poteshman (2004), ‘Behavioral Finance and the
Option Market’, Working Paper, Department of Finance, University of Illinois
at Urbana-Champaign.
Lee C.M.C. and M.J. Ready (1991), ‘Inferring Trade Direction from Intraday Data’,
Journal of Finance, 46: 733-46.
Lo, A. and C. Mackinlay (1990), ‘When are Contrarian Profits due to Stock Market
Overreaction?’, Review of Financial Studies, 3: 175-205.
30
31
Mayhew, S., A. Sarin and K. Shastri (1995), ‘The Allocation of Informed Trading
Across Related Markets: An Analysis of the Impact of Changes in Equity-
Option Margin Requirements’, Journal of Finance, 50: 1635-53.
Ni, S.X., N.D. Pearson and A.M. Poteshman (2005), ‘Stock Price Clustering on
Option Expiration Dates’, Journal of Financial Economics, 78: 49-87.
Pan J. and A.M. Poteshman (2006), ‘The Information in Option Volume for Future
Stock Prices’, Review of Financial Studies, 19: 871-908.
Richards, A. (2005), ‘Big Fish in Small Ponds: The Trading Behavior and Price
Impact of Foreign Investors in Asian Emerging Equity Markets’, Journal of
Financial and Quantitative Analysis, 40: 1-27.
Stephan, J. and R. Whaley (1990), ‘Intraday Price Change and Trading Volume
Relations in the Stock and Stock Option Markets’, Journal of Finance, 45:
191-220.
Stoll, H. and R. Whaley (1987), ‘Program Trading and Expiration Day Effects’,
Financial Analysts Journal, 43: 16-28.
Stoll, H. and R. Whaley (1990), ‘Program Trading and Individual Stock Returns:
Ingredients of the Triple-Witching Brew’, Journal of Business, 63: S165-S192.
Stulz, R.M. (1999), ‘International Portfolio Flows and Security Returns’, in M.
Feldstein (ed.), International Capital Flows, Chicago: University of Chicago
Press.
Vijh, A. (1990), ‘Liquidity of the CBOE Equity Options’, Journal of Finance, 45:
1157-79.

Table 1 Daily option trading volume, by different trade types and different classes of investors
Open CloseBuy
Sell Buy SellTrading Volume (Contracts)
Put Call Put Call Put Call Put Call
Average (No.) 9,424 11,981 7,827 10,277 7,000 9,406 8,450 10,885
Domestic institutional investors (%) 6.04 3.19 8.52 8.69 8.93 8.78 5.67 3.37
Foreign institutional investors (%)
8.39 3.85 1.85 2.88 1.49 1.95 4.55 2.67
Individual investors (%) 50.10 67.72 48.82 39.42 43.96 35.79 49.88 66.15
Market makers (%) 35.47 25.23 40.82 49.01 45.62 53.47 39.91 27.80
Data period runs from December 21, 2001 to December 24, 2005. The average trading volume is calculated by the time-series average of the aggregated different strike prices and the time to expiration at each trading day; the proportion of trading volume by different classes of investors (expressed as a percentage) is calculated by the time-series average of each trade type by different classes of investors divided by the total time-series average trade volume of the corresponding trade types.
32

Table 2 Open-buy positions, by different option types and different classes of investors
Domestic Institutional Investors Foreign Institutional Investors Individual Investors Market Makers
Variables Call Put Call Put Call Put Call Put
Panel A: Moneyness
Above 10% OTM
2.96 2.31 2.04 7.34 2.40 2.70 3.53 3.393-10% OTM 32.47 35.33 39.63 45.23 28.91 30.55 32.88 34.36Near-the-money 61.19 59.47 56.96 46.29 66.87 65.63 58.15 58.823-10%ITM 3.18 2.70 1.24 0.98 1.79 1.09 5.08 3.24Above 10% ITM 0.21 0.19 0.14 0.15 0.04 0.03 0.35 0.18
Panel B: Time to expiration
Under 30 days
84.48 75.71 53.11 55.77 84.02 87.28 79.01 77.7930-59 days 14.74 23.59 36.24 32.98 15.34 12.23 18.85 19.4160-89 days 0.48 0.43 6.76 7.05 0.44 0.28 1.22 1.7990-179 days 0.26 0.22 2.28 2.31 0.16 0.12 0.57 0.57Above 179 days 0.03 0.05 1.62 1.90 0.04 0.09 0.34 0.44
Panel C: Past-week TAIEX spot index returns
Lowest
10.03 11.95 12.09 12.72 9.77 9.48 7.15 9.71Second lowest 21.46 26.51 19.96 25.26 23.89 22.78 21.20 25.29Medium 33.08 30.08 30.40 30.62 30.40 30.75 31.79 31.39Second highest 24.79 22.27 26.29 22.69 24.16 25.50 28.62 24.14Highest 10.64 9.18 11.25 8.71 11.78 11.49 11.24 9.47
The reported numbers are the open-buy call (or put) volume belonging to each category as a percentage of the total open-buy call (or put) volume for each investor class. In panel A, OTM denotes out-of-money options, and ITM denotes in-the money options. The 10% OTM call option is defined as a strike to index price ratio of 1.10, whilst the 10% OTM put option has a strike to index price ratio of 0.90. Near-the-money refers to the call and put options having a strike to index price ratio between 0.97 and 1.03. In panel B, time to expiration of each option is the period from each trading day to the maturity of the corresponding option. Time to expiration ‘under 30 days’ indicates that all options have a period of less than 30 days to their time to expiration. In panel C, the cut-off points for the return quintiles are –0.0252, –0.0065, 0.0096 and 0.0279.
33

Table 3 Predictability of publicly observable and publicly non-observable option volume
Publicly Non-observable Option Volume Publicly Observable Option Volume Open-buy Put-call Ratio Open-interest Put-call Ratio Lee and Ready Put-call Ratio +τ Days Ahead
Slope Coefficient t Statistic Slope Coefficient t Statistic Slope Coefficient t Statistic 1 36.30 0.77 5.90 0.14 -35.60 -0.912
-7.33 -0.17 -29.00 -0.70 2.09 0.053 24.50 0.58 6.13 0.15 -43.90 -1.144 -31.90 -0.77 -28.40 -0.68 -11.80 -0.315 -28.10 -0.70 -28.60 -0.69 -32.20 -0.876 -26.40 -0.68 -29.90 -0.72 0.04 0.007 -102.70 -2.81 -84.90 -2.05 -36.00 -1.078 -58.20 -1.67 -69.00 -1.66 -7.05 -0.229 -85.60 -2.58 -108.20 -2.62 41.10 1.34
10 -65.30 -2.09 -40.40 -0.97 -9.94 -0.3411 -5.14 -0.17 25.70 0.62 -15.40 -0.5612 -50.90 -1.81 -38.50 -0.93 -19.30 -0.7313 -35.20 -1.32 -14.00 -0.34 -11.00 -0.4314 -16.20 -0.64 2.32 0.06 -11.30 -0.4615 1.20 0.05 5.85 0.14 4.91 0.2116 -18.70 -0.80 -11.90 -0.29 5.96 0.2617 -15.40 -0.67 10.00 0.24 25.30 1.1518 -14.90 -0.67 -87.20 -2.11 -4.91 -0.2319 -8.49 -0.40 -29.90 -0.73 -10.20 -0.5020 -37.40 -1.80 -19.30 -0.47 -13.70 -0.68
The table reports the slope coefficients of regressions and t-statistics of time-series regressions covering the period 21 December 2001 to 24 December 2005 for publicly non-observable option volume, and a slightly shorter period, from 2 January 2002 to 24 December 2005, for publicly observable option volume. We regress the τ-days ahead TAIEX spot index returns, Rt +τ , as well as the information content variables in the TAIEX options trades, Xit , and then test the hypothesis of the information contained in the index options trades using a time-series regression of the form
34

We then separate the information variable into publicly observable and non-observable options volume, which are defined as non-market makers open-buys, non-market makers open-interest and the Lee-Ready algorithm put-call ratios.
20...., ,2 ,1 , =++= ++ τεβα ττ ititiiit XR
35
36
Table 4 Predictability from plain regressions
Intercept Domestic
Institutional Investors
Foreign Institutional
Investors
Individual Investors R2
-0.93 (-0.84) 24.60 (1.24) – – 0.16 28.90 (2.70) – -35.50 (-2.31) – 0.71
-10.70 (-0.60) – – 35.90 (0.81) 0.07 -1.01 (-0.03) 16.10 (0.65) -33.30 (-2.11) 53.40 (0.81) 0.87
The table reports the results of time-series regressions covering the period 21 December 2001 to 24 December 2005. The next-day TAIEX spot index returns were regressed on the open-buy put-call ratio constructed from each of the investor classes, with the exception of market makers. The regressions were also run jointly. The regression is expressed as:
1IIFIFIDIDI
1 ++ ++++= its
its
is
its
is
its
iiit XXXR εβββα
where XitDIs, XitFIs and XitIs respectively denote the open-buy put-call ratios of domestic institutional investors, foreign institutional investors and individual investors in TAIEX index options at date t. Table 5 Predictability from foreign institutional investor regressions with control variables
Intercept Put-call Ratio Dummy × Near
Maturity Put-call Ratio
Volume R-5, -1 R 2
c
34.30 (3.13) -50.10 (-3.12) 46.00 (1.28) – – 1.68
31.80 (0.16) -50.20 (-3.11) 46.00 (1.28) 0.17 (0.01) – 1.68 34.90 (3.16) -50.70 (-3.15) 44.00 (1.22) – -102.50 (-0.54) 1.73 1.87 (0.01) -50.90 (-3.15) 44.00 (1.21) 2.20 (0.17) -111.30 (-0.57) 1.73 49.80 (0.26) -35.50 (-2.31) – -1.38 (-0.11) – 0.71 29.20 (2.72) -35.80 (-2.32) – – -61.60 (-0.34) 0.73 32.10 (0.16) -35.80 (-2.32) – -0.19 (-0.01) -60.80 (-0.32) 0.73
In this table, control variables are added into the regression on the informed traders; if, for example, it was observed that foreign investors had a significant coefficient from Table 4, this was then reinvestigated by adding in a control variable. The regression form is
1FI
1 ++ +++= ititis
iiit CR εγβα
C
R
where it denotes the control variable that we regard as other variables that might influence next-day index returns. First, we add Dummy to control the effect of time to expiration. Dummy=1 denotes the next trade date is at expiration day; Dummy=0 denotes otherwise. Then near maturity put-call ratio denotes the open buy put-call ratio, which is calculated by options matured in the next date. Second, we add logarithm daily closing index trading volume to be the liquidity control variable. Third, we also add the past five-day index return 1,5 −− as a reversal control variable. We report the slope coefficient with t-statistic in parentheses and the R2s are time-series average R2s.
FIsitX ,

Table 6 Predictability with varying option leverage, by different investor classes
Domestic Institutional Investors Foreign Institutional Investors Individual Investors Contract type
Intercept Put-call Ratio
Avg. No. of contracts Intercept Put-call
Ratio Avg. No. of
contracts Intercept Put-call Ratio
Avg. No. of contracts
Panel A: Moneyness
Above 10% OTM 5.62 (0.58)
2.14 (0.17) 154 14.10
(0.84) -11.90 (-0.62) 828 -1.28
(-0.16) 7.94
(0.69) 1,291
3-10% OTM -13.70 (-1.48)
32.00 (2.18) 1,308 16.10
(1.54) -18.30 (-1.33) 3,053 0.20
(0.02) 6.85
(0.35) 14,752
Near-the-money 9.95 (1.09)
-15.20 (-0.92) 2,261 27.40
(3.14) -36.10 (-2.74) 3,670 -20.90
(-1.35) 64.90 (1.63) 33,207
3-10%ITM -0.51 (-0.07)
16.80 (1.43) 133 -7.21
(-0.67) 17.60 (1.01) 171 -2.57
(-0.39) 19.70 (1.26) 768
Above 10% ITM 4.34
(0.47) -3.58
(-0.20) 24
-9.73 (-0.62)
41.20 (1.51)
52 6.54
(1.14) 0.52
(0.04) 25
Panel B: Time to expiration
Under 30 days -5.98 (-0.55)
21.60 (1.07) 3,146 19.90
(2.02) -20.50 (-1.47) 4,285 -11.50
(-0.65) 39.70 (0.91) 45,102
30-59 days 11.50 (1.30)
-15.40 (-1.08) 991 30.40
(2.93) -39.10 (-2.74) 2,957 8.54
(0.92) -26.20 (-1.03) 8,044
60-89 days 8.67 (1.09)
-10.90 (-0.79) 53 22.90
(1.95) -33.60 (-2.12) 920 9.08
(1.19) -20.70 (-1.10) 265
90-179 days 1.93 (0.20)
-12.00 (-0.63) 34 1.25
(0.11) -7.95
(-0.52) 382 -11.30 (-1.53)
39.80 (2.43) 96
Above 179 days 10.10
(0.68)
14.30
(0.56) 18
4.94
(0.34)
-14.40
(-0.75) 352
3.12
(0.38)
0.26
(0.02) 46
The table reports the the slope coefficient (with t-statistic in parentheses) of time-series regressions from December 21, 2001 to December 24, 2005. In panel A, we
redecompose information variable of various investor classes into groups of moneyness and reform three predictive regressions separately. For example, the predictive
37

regression of domestic institutional investors is the form as follow
1M&DIs
1 ++ ++= ititMiiit XR εβα
where is next-day TAIEX spot index return, is the put-call ratio of domestic institutional investors constructed from five categories of moneyess of put and call open-buy volumes and denotes the coefficient estimated from those five categories, symbolized as , , , and . In panel B, we use similar regression above, but decompose information variable of various investor classes by various time to expiration. Average number of contracts is daily average open-buy contracts from each category and investor class.
1+itR M&DIsitX
Miβ
DOTMiβ
OTMiβ
ATMiβ
ITMiβ
DITMiβ
38

Table 7 Predictability from other option volumes
Contract Type Put-call Ratio Investor classes
Intercept Open Buy Open Sell Close Buy Close Sell R2
Domestic Institutional Investors -22.20
(-1.07)
20.60
(0.97)
4.64
(0.18)
-10.20
(-0.46)
39.10
(1.92) 0.62
Foreign Institutional Investors 27.40 (1.59)
-67.30 (-3.31)
-5.72 (-0.30)
5.37 (0.30)
32.00 (1.94)
3.25
Individual Investors -161.80 (-4.85)
51.00 (1.25)
110.60 (2.60)
163.60 (4.89)
41.90 (1.26)
3.35
This table reports the results of the daily time-sectional regressions from 21 December 2001 to 24 December 2005, showing the coefficients and t-statistics (in parentheses). The dependent variable is the next day TAIEX spot index return, and the independent variable is the put-call ratio computed from various types of option volume, excluding those at 5 days before maturity. The put-call ratio is the put volume divided by the sum of the put and call volume from each type of option volume. R2 are time-series average R2.
39