Embed Size (px)
Citation preview
The Informal Sector and Tax Revenue Drive:A Nigerian Case Study
Veronica Olaitan ∗
Master’s ProjectUniversity of Winnipeg
August 4, 2016
ABSTRACT: There has been a recent need to boost internally generated revenue inNigeria due to the fall in the price of oil, upon which Nigeria has been dependent forrevenue. The Nigerian government’s attention has been drawn to the massive size ofthe informal sector from which little or no taxes are being collected. To resolve thisdiscrepancy, it plans to introduce a presumptive tax regime aimed at taxing the firmsin the informal sector. In this paper, I analyze the effect of different presumptivetaxation policies on the size of the informal sector, tax revenue, output and welfare.Results show that an assessment in the form of proportional presumptive tax seemsto be more efficient than a uniform lump-sum presumptive tax. However, I alsoshow that in certain cases, the optimal policy for a government that cares aboutinequality would be a proportional presumptive tax with size-based “tax holiday”for informal firms who operate with less than a prescribed capital threshold.
∗Veronica Olaitan is a Masters student at the Economics Department of The University of Winnipeg. Theauthor would like to thank Professor Stefan Dodds of the University of Winnipeg’s Economics departmentfor his contribution and guidance in the process of preparing this paper. To all other Professors: thank youfor allowing me to draw from your wealth of knowledge.
1 Introduction
Direct tax should be the major source of government revenue for any country, but most
developing countries have come to this realization a bit too late. It is becoming increasingly
difficult for developing countries to obtain financial aid from abroad (Shah, 2014)1 and
the cost of financing domestic debt has become more expensive than foreign borrowing
(Christensen, 2004). As a result of these problems coupled with the downward trend in
revenue from non-tax sources, most developing countries are determined to increase tax
collection in order to generate more revenue to run the economy and control economic
instability.
Although increasing tax revenue seems to be an easy way to generate more government
revenue, the challenge with meeting this target is getting people to comply. This challenge
is associated with the fact that most taxable persons in developing countries are outside
the tax net because they operate in the informal sector of the economy. The International
Labor Organization (ILO, 2002) estimates that the informal sector represents 51% of non-
agricultural employment in Latin America, 65% in Asia, 48% in North Africa, and 72% in
Sub-Saharan Africa (SSA).
The informal sector is generally characterized by a high level of under-regulation by
the government, cash transactions (which makes it difficult to properly track the amount
of revenue generated), and improper-record keeping (Ofori, 2009). As a result of these
problems, the informal sector has been and remains very difficult to tax. This challenge of
taxing the activities in the informal sector means that little or none of the income generated
in the informal sector is transferred to the government in form of tax. Therefore, a very
high percentage of potential tax revenue is unaccounted for.
This topic has become important especially in SSA where many programs are springing
up to encourage entrepreneurship and Small and Medium scale Enterprise (SME) growth,
with little or no attention being paid to the barriers to entry into the formal sector. One
such barrier is the tax regime. SMEs account for a large portion of Gross Domestic Product
1Shah, Anup. 2014. “Foreign Aid for Development Assistance.” Global Issues News Article.http://www.globalissues.org/article/35/foreign-aid-development-assistance (accessed August 8, 2016).
1
(GDP) in developing countries (Arimah, 2001). Unfortunately, the growing number of these
SMEs does not necessarily translate into improved tax revenue since they mostly cluster
in the informal sector, in order to avoid the burden of tax compliance associated with
developing countries. As revealed by Fjose et al. (2010) “Many countries in Sub-Saharan
Africa have a large number of SMEs relative to the size of the economy, but these are almost
exclusively micro companies and they are often not part of the formal economy”.
The tax environment in SSA is characterized by a series of challenges: the tax laws often
contain legal ambiguities that are difficult for a lay taxpayer to interpret (Bird, 2007). This
leads to increase in cost of compliance for the taxpayer; corruption and embezzlement of
public funds by government officials are major thorns in the tax system. In most cases, tax
revenue collected is not used judiciously and tax payers often have to source privately for
services that should have been provided by the government (Angahar and Alfred, 2012).
The reluctance of tax authorities to refund excess taxes due to taxpayers as a result of
inefficient system, database and funds provides less incentive for taxpayers to comply (PwC
Nigeria, 2015). Firms would rather avoid paying taxes than have a portion of their profit
stuck with the government due to over-payment.
These challenges create a hostile tax environment that erodes the benefits of operating
in the formal sector. Consequently, a number of entrepreneurs2 feel more comfortable
operating in the informal sector where taxation is almost non-existent or underdeveloped.
To solve the problem of SME’s clustering in the informal sector, and to increase its
tax revenue base, most developing countries are beginning to introduce taxation in the
informal sector through the presumptive tax framework. Presumptive taxation is a concept
of taxation involving the use of indirect means to ascertain tax liability, which differ from
the usual rules based on taxpayers’ accounts.3
Nigeria introduced presumptive taxation into its tax laws with the amendment to the
Personal Income Tax Act (PITA) in 2011. The application of the regime is expected to be
based on a framework to be prescribed by the Ministry of Finance in regulations published
2Note that the terms ‘Firm’ and ‘Entrepreneur’ are used interchangeably in this study.3This definition is based on the definition on http://definitions.uslegal.com. Similar definitions have been
used by other researchers (e.g, Thuronyi, 2003).
2
in a gazette.4 Currently, the Ministry of Finance has not released any regulations with
respect to presumptive taxation in Nigeria. However, the Federal Inland Revenue Service
(FIRS) has already indicated its plan to commence the enforcement of presumptive tax,
with the state revenue authorities planning to follow suit. The targets are small businesses,
professionals and individuals who operate in the informal sector.
This development has been spurred by the recent fall in the price of oil, upon which
Nigeria has been dependent for revenue. As a result, attention has been shifted from the
export of crude oil to internally generated revenue with the main emphasis on non-oil tax
revenue. This revenue drive has put much pressure on the tax authorities in Nigeria to
expand its tax base and generate more tax revenue. The question then is, in the absence of
the regulation on presumptive tax by the Minister of Finance, what method of presumptive
taxation should be applied by the FIRS?
Based on the above proposal by the FIRS, I analyze in this paper the economic effect
of two of the generally accepted and widely used forms of presumptive taxation on the size
of the informal sector, SME growth, tax revenue, social welfare and equity. My analysis is
based on the existing investment climate in Nigeria, with a focus on the tax regime in the
formal and informal sectors. The aim is not to recommend one optimal presumptive tax
policy, but to bring to bear the effect that different policies would have on the economy. I
then make available different optimal policies, the choice of which depends on the priority
the Nigerian government places on SME growth, tax revenue maximization, social welfare
and equity.
This study is a positive contribution to the existing literature on informal sector and
taxation in developing economies and is the first in terms of analyzing the economic effect
of the proposed presumptive tax regime vis a vis the hostile tax environment in Nigeria.
In this paper, I build a behavioral model of occupational sector choice. This model helps
to generate situations where individuals are located in three different sectors. I assume that
individuals have the choice of not working, starting up a firm in the informal sector or
operating in the formal sector. Each individual’s choice is informed by the utility she
4A gazette is the term used in Nigeria to describe an official publication of a government institution,listing appointments or other public notices.
3
derives from each sector, given the investment climate in each sector. Using data and
assumptions based on the investment climate in Nigeria, I calibrate this model to generate
cut-off skill levels corresponding to capital investments that are sensitive to tax parameters.
I then analyze how changes in the tax regime will modify capital choice, as well as the sector
each individual chooses to operate in. In particular, I analyze the impact of proportional
presumptive taxation (PPT) and uniform lump-sum presumptive taxation (ULT)— which
are two forms of presumptive taxation that have been widely used in developing countries—
on the size of the informal sector, tax revenue, output and social welfare.
The PPT involves applying a tax rate on the capital invested in production while the
ULT is a lump-sum tax levied on all individuals based on their occupation, without neces-
sarily specifying a threshold at which an informal firm becomes liable to the ULT.
While both policies seem to generate more revenue for the government, they do not solve
the problem of equity and fairness for smaller informal firms whose only means of subsistence
is the revenue generated from business. Consequently, I introduce a third policy (PPT with
size-based “tax holiday”). This policy imposes tax on large informal firms based on PPT
while exempting from tax small informal firms that operate with capital below a prescribed
threshold.
In general, my analysis shows that assessment in the form of proportional presumptive
tax seems to be more efficient than a uniform lump-sum presumptive tax. However, I also
show that in certain cases, the optimal policy for a government that cares about inequality
would be a proportional presumptive tax with size-based “tax holiday” for informal firms
who operate with less than a prescribed capital threshold. I also show that to maximize
output, tax revenue and welfare, the size of the informal sector needs to shrink, but not be
completely eliminated.
The remaining sections of this paper are structured as follows: Section 2 provides an
overview and literature review of the informal sector, presumptive taxation and a discussion
on the Nigerian tax system. In Section 3, I present my model and parameters. In Section 4,
I run simulations using the model in section 3 and discuss my results. In Section 5, I present
an extended case of my model and discuss its policy implications. Finally, I summarize my
4
analysis in Section 6, while recommending areas for further research.
2 Literature Review
2.1 Overview of The Informal Sector in Developing Countries
In recent times, much attention has been drawn to the growing informal sector in most
developing economies and the effect it has on their overall economic growth potential. In
the past, activities carried out outside the formal economy were given little attention by
economists. It was not until the 1972 report released by the International Labor Office
(ILO) that this phenomenon was given an academic audience (ILO, 2014).5 Since then,
a lot of literature and research on the informal sector has sprung up (e.g. Feige, 1981;
Inchauste et al., 2005; Routh, 2011; Williams et. al, 2015).
Different criteria have been used to define the Informal sector by several authors. The
ILO identifies the informal sector as being characterized by ease of entry, small scale opera-
tion, and an unregulated and competitive market among other features (ILO, 1972). Feige
(1981) uses tax evasion and national accounts to define informality as “all economic ac-
tivity which, because of accounting conventions, non-reporting or under-reporting, escapes
the social measurement apparatus, most notably the Gross National Product (GNP).” La
Porta and Shleifer (2008) identified informal firms based on two phenomena: unregistered
firms that hide all of their output from tax authorities and regulators and registered firms
that hide some of their output from tax authorities in order to reduce their tax liability.
Other key words that have been used to define informality are tax evasion, lack of social
security coverage for employees, and illegality (Gerxhani, 2004; Routh 2011).
Based on the above, it is obvious that there is no single generally accepted definition
of the informal sector. As Benjamin and Mbaye (2014) puts it: “Informality is better
described as a continuum.” As a result, the main criteria used in identifying the informal
sector can be narrowed down to registration with the relevant government agencies, size
(which reflects the scale of operation), and improper record keeping.
5The term informal sector was launched into development policy debate by the ILO in 1972 in its publishedreport following an employment mission to Kenya.
5
In this study, I restrict my definition of informality to size, registration and the asym-
metric nature of information between regulators and firms. In particular, I focus on non-
agricultural SMEs who are not registered with the relevant government agencies (especially
the tax authorities) and who do not keep proper accounts.
The informal sector makes up a significant portion of the economies in developing coun-
tries and it is often characterized as unmanageable (Wikipedia, 2016).6 Although the
informal sector has been observed in both developing and developed economies, its influ-
ence has been more significant in developing countries, especially in Africa. The alarming
size of the informal sector leaves no surprise why it has been termed as the “new normal”
(World Bank, 2014).7 ILO (2002) reports that the informal sector represents 51% of non-
agricultural employment in Latin America, 65% in Asia, 48% in North Africa, and 72% in
SSA. They stated that
In Sub-Saharan Africa, the informal sector accounts for three-quarters of non-
agricultural employment, having increased dramatically over the last decade
from about two-thirds (ILO, 2002).
According to Steel and Snodgrass (2008), the informal sector in Africa accounts for about
50%-80% of GDP. This number is a significant increase from the 42% estimated for 1999/2000
by Schneider (2002).
So what has led to the rapid growth of this sector? Studies have shown that the informal
sector in developing countries is borne out of the need for survival and there is little or
no accumulation of income generated (ILO, 2002; Gerxhani 2004; Williams and Youssef,
2015). In general, the business climate in which firms operate is a major determinant of
informality. This investment climate includes quality of institutions, business regulations,
and enforcement. The business environment in Africa has been identified as one with
institutional malfunction and unenforced property rights law, leading to a high cost of
doing business. This high cost can only be internalized by large firms (Benjamin and
6Wikipedia contributors. 2016. “Informal sector”. Wikipedia, The Free Encyclopedia.https://en.wikipedia.org/w/index.php?title=Informal sector&oldid=729509553 (accessed July 17, 2016).
7This description was also used by the World Economic Forum on Africa at its meeting held from 3 to5 June, 2015 in Cape Town, South Africa. https://www.weforum.org/events/world-economic-forum-africa-2015/sessions/informal-new-normal/ (accessed 20 July, 2016).
6
Mbaye, 2014). As a result, smaller firms are faced with a greater incentive to operate in an
“invisible” economy where their operations are neither guided nor regulated by any formal
institution.
In particular, the investment climate factors range from administrative bureaucracy,
high tax rate, regulatory burden and so on. This position is supported by the World Busi-
ness Environment Survey (WBES) data which involves firm-level survey responses of over
4,000 firms with a minimum of five employees in 41 countries (mostly developing and tran-
sitioning), as reported by Inchauste et al. (2005). The survey reports on firms’ perception
of the quality and integrity of public services; the regulatory burden faced by the firms; the
extent of bribery and corruption; financial constraints; taxes, rules and regulations; legal
systems; and other characteristics. The survey showed that about 67% of small firms under
reported their sales to the tax authorities, and 56% and 44% for medium and large firms
respectively. Although the firms interviewed were all registered (which puts them in the
formal sector), one thing they had in common with informality was that they all had a
percentage of their output that was unreported to the tax authorities. As such, the survey
result could be used as a proxy for the determinants of informality. Also in their empirical
test using this data, Inchauste et al. (2005) found a high positive correlation between the
percentage of sales not reported to the tax authorities and general constraints in the form
of corruption, taxes and regulation, enforceability and regulatory burden. Their result also
showed that small companies are more likely to hide output/operate informally compared
to large companies.
The general perception is that some informal firms would like to formalize, but for the
various barriers of entry into the formal sector. As a result, a typical firm will weigh the
costs and benefits of operating in the formal and informal sectors and will only choose
to operate formally if the benefits of operating in the formal sector outweigh those in the
informal sector (Soto, 1989; Mel et al., 2012). The perception of citizens about the public
sector also contributes to the growing size of the informal sector. For example,
If citizens perceive that there are very few benefits from the funds collected by
government, in terms of social welfare, infrastructure, health or education, this
7
only reinforces their initial reticence to pay taxes (Tadesse and Taube, 1996).
The most convenient way to avoid tax payments is to hide under the informal sector where
tax compliance is not enforced.
An increasing informal sector is bad for an economy in that it causes distortion in
the unemployment rate. Government agencies typically do not have records of persons
employed in the informal sector because such information is either not kept by the informal
firms or it is not made available to the relevant agencies. The absence of this information
can result to erroneous inclusion of persons operating in the informal sector in the statistics
of unemployed labor force (Gerxhani, 2004); incorrect statistics on growth rate — which as
noted by Feige (1981)is caused by exclusion of the informal sector in measuring GNP. This
exclusion is caused by lack of information on the informal sector revenue by the relevant
agencies; and it leads to reduction in government revenues through tax evasion. In the bid
to maintain tax revenue, the government may then have to increase the formal sector tax
rate, thereby shifting the tax burden to formal firms.
Notwithstanding these disadvantages, the influence of the informal sector on the econ-
omy can be positive. As revealed by previous studies (Porta and Shleifer, 2008; Williams
and Youssef, 2015), it is characterized by low cost of labor. For instance, “The lower human
capital workers work in informal and smaller firms, and receive lower wages” (Porta and
Shleifer, 2008), and it enables the poor and marginalized in the economy to meet their basic
needs while improving their well-being (ILO, 2002; Gerxhani 2004; Williams and Youssef,
2015). Considering the fact that poverty is a major problem in SSA, the aim of the govern-
ment might not be to eliminate the informal sector, but to seek the optimal informal sector
size that maximizes tax revenue and/or welfare and boosts economic development, in order
to avoid destroying the means of livelihood of the marginalized.
2.2 Presumptive Taxation and The Informal Sector
The informal sector has been referred to as the “Hard-to-Tax” sector in a lot of literature
on presumptive taxation(e.g Casanegra de Jantscher and Tanzi, 1987; Rajaraman, 1995;
Wallace, 2002; Thuronyi, 2003). This definition is due to the unfavorable characteristics
8
associated with the sector, such as lack of proper accounting records and lack of transparency
with respect to profits made, making it easy for informal firms to evade tax. This makes it
difficult for the government to collect tax revenue from the informal sector and as a result,
translates into revenue loss for the economy. This hurdle has been crossed by some developed
countries using presumptive taxation system which seeks to tax firms in the informal sector
on the basis of indicators other than profit: e.g The United States of America (USA), France,
and Israel (Thomas, 2013). While there is no one single presumptive taxation method, it
generally involves using factors that can be easily verified. Such factors can be as basic as
phone bills, electricity or water bills8 which can easily be obtained by the authorities.
Based on past experience, presumptive taxation has been noted to reduce the opportu-
nity to evade taxes because it removes the obligation of self-assessment from the informal
firms (unlike the case under normal tax rules), such that the responsibility to estimate
taxable income then falls on the taxing authority (Thomas, 2013).
The presumptive taxation system has been around for over two decades and is still
used in many countries, both developing and developed. However, it is extensively used
in the former where the informal sector constitutes a very large portion of the taxable
population. The reasons for introducing presumptive tax vary. It could be to reduce the
compliance burden on smaller taxpayers, to prevent tax avoidance and evasion, promote a
more equitable distribution of tax burden or boost government revenue (Thuronyi 1996).
As Casanegra de Jantscher and Tanzi (1987) state, “in most cases, presumptive methods
are used as a simple administrative expedient, but they can also be used for efficiency
and equity goals.” Whatever the reason for introducing presumptive taxation, the method
employed by the government must be objective in order for it to be credible (Rajaraman,
1995).
Presumptive taxation systems have been identified in the literature based on the method
used to determine the tax liability. Arachi and Santoro (2007) classify these methods as:
estimation of income based on the nature of the business, sales, employees, assets, and
location; methods that impute a return on business assets; methods that apply a rate
8Thomas (2013) mentioned that laundromats in Israel were once taxed based on water and electricitybills, which were obtained by the revenue authorities through meter reading.
9
on turnover; and income estimates based on external indicators such as personal financial
lifestyle.
Specifically, the various forms of presumptive taxation that have been used are:
1. Uniform lump-sum payments based on occupation or trade: this is a form of presump-
tive taxation which is based on an income average in the industry. In this case, a flat
tax liability is imposed on all firms operating under the same occupation or trade.
This method does not require the tax authority’s dependence on firm-specific informa-
tion. As a result, there is no direct interaction between firms and tax officials in the
process of determining the industry’s tax liability. The implication of this disconnec-
tion between tax officials and the firms is that the uniform method has the propensity
to curb corruption and discourage bribing of tax officials. However, it has been noted
that this form of presumptive taxation is “ineffective in taxing higher-income pro-
fessionals” (Thuronyi, 1996) and that “it treats equally all taxpayers within a given
class, regardless of their actual income” (Thuronyi, 2003).
2. Presumptive minimum taxes: in this case, taxpayers are assigned some minimum level
of income in any given year. This can take about five forms: (i) which is levied in
lump-sum form and may or may not be graduated depending the firm size or volume
of operation (ii) as a percentage of turnover or gross asset, or a combination of the two
(iii) the use of lump-sum minimum plus a percentage of turnover (iv) the higher of the
lump-sum amount and a percentage of turnover (v) the highest of the tax liabilities
based on different tax bases (Tadesse and Taube 1996). This form of taxation has
however been identified as mainly used to reduce under-reporting of tax liabilities by
large scale formal firms (Tadesse and Taube, 1996; Wallace, 2002).
3. A capacity-based presumptive tax which depends on a firm’s income generating ca-
pacity based on what is possible given normal circumstances without considering the
actual scale of operation. In this case, the indicator used is typically the assets used
in the business operation, based on financial or physical measurement (Rajaraman,
1995).
10
4. Another form noted in Rajaraman (1995) is the estimated assessment which measures
the flow of activities in the firm either from the input or output ends. In this case, a
firm’s tax liability is a function of indicators of business activity and unlike the fixed
lump-sum payments, it is not related to occupation. It is geared towards estimating
income and applying the regular tax rate, to specify a tax liability.
In addition to the forms above, two forms of presumptive taxation have received a lot of
attention in the literature. These are the Tachshiv (used in Isreal) and the Forfait (used in
France).
• The Tachshiv was introduced in Israel and is being used in several countries. The
objective is to determine the net profit upon which tax is to be imposed. It is based
on two steps. First, the tax authorities estimate the firm’s turnover based on several
indicators, e.g average sales per worker, which is then applied to firm variables like the
number of workers in the firm. Secondly, an estimated amount of business expense
is subtracted from the estimated turnover to arrive at the taxable profit (Arachi and
Santoro 2007). This form requires a lot of process and a large amount of resources.
As a result, the Tachshiv may not be effective in countries where tax administration
is poor. As Thuronyi (2003) puts it, “in countries with weak tax administrations,
the prospect of using a Tachshiv-type system presents a dilemma, because it requires
sophisticated and extensive work to set up.”
• The French Forfait is a form of estimated approach. In this case, presumptive taxation
is applicable only to SMEs with an annual turnover below a specified threshold. It is
also called the contractual method because it involves an agreement by the tax payer
and the tax authorities on the amount of taxes due. In this case, the tax authority
uses information provided by the firm with respect to sales, assets and number of
employees to estimate turnover and expenses. The differentiating factor between this
form and the Tachshiv system is that the liability estimated by the tax authority is a
proposal which is subject to agreement or appeal by the taxpayer (Arachi and Santoro
2007). Just like the Tachshiv, the Forfait system requires substantial record keeping,
11
sophistication and honesty on the part of the tax administrator.
Based on the features of the Tachshiv and ForFait systems, these presumptive systems do
not seem likely to be appropriate for resolving the issues of informality and taxation in SSA,
even though this is the region facing the most serious hard-to-tax problems.
Rajaraman (1995) identified the capacity-based presumptive taxation, the estimated
approach and the uniform lump-sum presumptive taxation as the three forms of presumptive
taxation predominant in developing countries, depending on the type of indicator used to
ascertain tax liability. According to him, a number of developing countries have used the
asset-based presumptive tax for corporate entities whose profit is difficult to ascertain, with
the most used base being “total assets” or “net worth”. His work also shows that all three
forms of presumptive taxation mentioned above have been used for small business. For
instance, the asset-based presumptive taxation has been used by Ghana (for taxi drivers
and fishermen) and Ecuador (for service providers) based on the valuation of physical assets
like premises and equipment while the estimation method has been adopted by Mexico,
Paraguay, Niger, and Bolivia, with the most widely used form being the uniform lump-sum
presumptive taxation with no threshold.
Similarly, Tadesse and Taube (1996) in their study of presumptive taxation in SSA,
identify the uniform method, presumptive minimum tax and the estimated assessment as the
predominant forms of presumptive taxation being used in some SSA countries. According to
them, presumptive tax promote greater equity and fairness in that it facilitates the taxation
of self-employed persons and SMEs who often do not pay taxes. As a result, the average
wage earner who tends to be overtaxed in relation to their self-employed counterparts, feels
compensated—by presumptive taxation.
The uniform lump-sum method has been an attractive tool for many African countries
because it is simple to administer. Tax authorities do not need to verify a particular firm’s
or individual’s records in order to arrive at a tax liability. However, imposing the same
amount of tax on low-income and high-income firms simply because they belong to the
same occupation violates vertical equity. Although several African countries utilize this
method, it does not appear to be the most effective way of taxing the income of small
12
businesses.
The size of the business premises, capital base, labor use, and years of operation are
common indicators used by developing countries (including Africa) for estimated assessment.
While this method can be adjusted to take into account any income shocks faced by the
firm, and has proven to be a pragmatic tax tool, there is a tendency to rely excessively on
indicators such as labor or capital. This can create adverse effects with respect to output
generation, such that firms reduce their use of these inputs in order to reduce their tax
liabilities9 (Tadesse and Taube 1996).
These effects of the uniform lump-sum and the estimated presumptive methods are captured
in my model.
2.3 The Nigerian Tax System
Like many countries in SSA, the informal sector in Nigeria constitutes a very large portion
of the Nigerian economy. Tadesse and Taube (1996) in their paper prepared for the Inter-
national Monetary Fund showed that informal sector in Nigeria was about 27% of GDP in
1989. According to Schneider et al. (2010) in their policy research paper prepared for the
World Bank, the size of Nigeria’s informal sector as a percentage of GDP averaged about
56.2% from 1999-2006, which placed Nigeria as the country with the fifth largest informal
economy among the 98 developing countries in their study. This number increased to 58%
in 2014 based on the estimate from Nigerian Federal Ministry of Budget and Planning
(NFMBP).10 According to one recent report,
An unpublished survey in 2008 suggested that the informal sector in Nigeria
accounted for about 90% of new jobs in the country, about 80% of all non-
agricultural employment and about 60% of urban jobs created, earning it the
description of being mammoth, heterogeneous and the backbone of the formal
9A similar case has been reported by Thomas (2013) in which laundromats in Israel whose income wasestimated based on water and electricity bills stopped using hot water so as to reduce the amount of electricityused, which in turn reduced their tax liability.
10Nigeria Federal Ministry of Budget and National Planning. 2014. “Nigerian Informal Sec-tor has Great Potential, Contributes 58% to Economy.” National Planning Commission NewsArticle. http://www.nationalplanning.gov.ng/index.php/news-media/news/current-news/225-nigerian-informal-sector-has-great-potential-contributes-58-to-economy (accessed May 24, 2016).
13
sector(CISLAC, 2013).11
Conversely, the Nigerian Bureau of Statistics (NBS, 2016) estimates that the contribution
of the informal sector to GDP (at current basic prices) for 2015 is about 41%. Even if this
lower figure is correct, the current size is a significant increase from what it was in 1989.
The increase in the size of the informal sector in Nigeria has been attributed to excessive
regulation in the formal sector. The informal sector on the other hand offers a lot of flexi-
bility to entrepreneurs because they are usually not regulated and as a result, entrepreneurs
can enter and exit any sphere of business much more easily. Other determining factors for
the size of the informal sector are: complicated and high cost of entry into the formal sector
such as registration fees, legal fees and high taxes; high levels of unemployment and the
need to survive; low literacy levels (it is typical for the least educated/skilled entrepreneurs
in Nigeria to operate in the informal sector because entry into the formal sector requires a
lot of documentation and disclosures which may be difficult for them to comprehend); and
a low tax compliance culture which is boosted by the may challenges associated with the
tax system in Nigeria (CISLAC, 2013).
Taxation in Nigeria is administered by federal, state and the local governments. The
Nigerian tax system has undergone significant changes in recent times. Despite these im-
provements, the recent amendments to some of the tax laws are far from solving certain
problems associated with the Nigerian tax system.
The relevant legislation which regulates taxation matters for individuals in Nigeria is the
Personal Income Tax Act (PITA). The PITA provides the rules under which individuals
including employees, self-employed persons, enterprises, partnership and unincorporated
trust, joint ventures, families and communities are taxed. The personal income tax rate is
progressive in nature and is based on a graduated scale from 7% of the first NGN300,000
of an individual’s annual taxable income/profit to 24% of annual taxable income/profit
above NGN3,200,000. While the effective tax rate varies based on individuals’ income and
11The Civil Society Legislative Advocacy Centre (CISLAC) is a non-governmental, non-profit legislativeadvocacy, lobbying, information sharing and research organization in Nigeria, established in 2006. Theorganization works towards bridging the gap between the legislature and the electorate with a focus onbudget monitoring, transparency, accountability, anti-corruption, human rights, trade policy and securitymanagement.
14
deductions claimed, the highest effective tax rate currently stands at 19.2% (PwC Nigeria,
2015).
Nigeria’s tax system is characterized by poor administration which is mainly due to
inadequate training and compensation of tax officials (CISLAC, 2013). Most tax officials
are under qualified and the very few who have a sound knowledge of the tax laws are under-
compensated. As a result, they tend to handle their jobs with minimal interest. Multiplicity
of taxes is another major problem faced in Nigeria (PwC Nigeria, 2015): this involves
imposing similar taxes on the same or substantially similar tax bases. An example is the
companies’ income tax, information technology tax, education tax, and the Nigerian content
development levy all of which are based on income or profits; the value added tax, sales
tax, hotel consumption tax all based on sales; the employee compensation contribution and
industrial training fund both levied on employees’ annual gross income. Dispute resolution
and tax audit procedures are very slow and inefficient (PwC Nigeria, 2015). Tax audit
and investigation is carried out annually in Nigeria, but because of poor administration,
companies find themselves having to deal with multiple year audits which in most cases
remain open and inconclusive. Companies who choose to comply with the tax laws find
themselves faced with a high cost of compliance, which includes the problem of multiple tax
revenue bank account for different type of taxes (PwC Nigeria, 2015), and ambiguities and
conflicts in the tax laws (PwC Nigeria, 2015; CISLAC, 2013). These ambiguities cause a
lot of confusion for the compliant taxpayer who may then need to employ the services of a
lawyer to interpret the tax laws. Sadly, it is very difficult to get a refund for over-payment
of taxes in Nigeria, even though such provision is made available in the tax laws.
CISLAC (2013) reported that a typical firm in Nigeria is expected to spend a total of
938 hours per year to file all requisite taxes. This time compares unfavorably to countries
like Botswana and Burkina Faso (140 hours), New Zealand (70 hours), and Ireland (76
hours). The Nigerian figure is about 11% of the total number of hours in a year, making it
one of the highest in the World.
Finally, and most notorious of the challenges, is the fact that tax revenue collected is
usually misappropriated and in most cases is not used to provide basic infrastructure for
15
Nigerian citizens. Most companies typically privately source their own water and electricity
and at times maintain the roads leading to their business premises, in order to avoid disrup-
tion of their business operation (Angahar and Alfred, 2012). These challenges discourage
citizens and reduces the confidence and trust the taxpayers have in the system, as well as
lead to an influx of new businesses into the informal sector, which is perceived to be an
escape route for individuals who want to evade tax the “legal” way.
With a population of over 170 million, one might expect that tax revenue would make up
a significant portion of Nigeria’s GDP. However, based on World Bank (2016b) estimates,
tax revenue as a percentage of GDP stood at 2.41% in 2006, peaked at 5.46% in 2008 and
has since been declining. The figure in 2012 was 1.56%, which is a 7-year low.12 The Central
Intelligence Agency (CIA, 2016) puts the 2015 estimate of tax/GDP ratio at 2.9%, which
is not a significant increase compared to the 2012 figure.
The options for dealing with personal income taxes in Nigeria are through withholding
for employees, direct/self-assessment for high net worth individuals and presumptive tax for
those in the informal sector. While the first two approaches are functional, the presumptive
tax regime is but theory as no framework for applying this has been released. As a result,
those operating in the informal sector have been enjoying a sort of tax holiday, because
no attention has been paid to the potential tax revenue that can be generated from this
sector. However, with the amendment to the PITA in 2011, more emphasis has been laid
on presumptive taxation of those in the informal sector. The application of the regime
is expected to be based on a framework to be prescribed by the Ministry of Finance in
regulations published in a gazette.
Currently, the Ministry of Finance has not released any regulations with respect to
presumptive taxation in Nigeria. However, the FIRS has already indicated its plan to
commence the enforcement of presumptive taxation, with the state revenue authorities
planning to follow suit. The targets are small businesses, professionals and individuals who
operate in the informal sector. This tax revenue drive has been spurred by the recent fall
in the price of oil, which Nigeria has been dependent upon. As a result, attention has been
12These figures are based on International Monetary Fund, Government Finance Statistics Yearbook anddata files, and World Bank and OECD GDP estimates.
16
shifted from the export of crude oil to internally generated revenue with a main emphasis
on non-oil tax revenue.
Nigeria ran a budget deficit of 1.4% of GDP in 2015 (CIA, 2016) and according to
Reuters (2015),13 the deficit is expected to double in 2016 due to the government’s plan
to triple its capital expenditure. Also Nigeria experienced an increasing public debt from
10.9% of GDP in 2014 to 11.7% of GDP in 2015 (CIA, 2016). The fact that the ratio of
public debt to GDP is higher than the ratio of tax revenue to GDP, coupled with the plans
to increase public expenditure, raises serious budgetary concerns.
According to NFMBP (2016),14 the federal government targets an 87% increase in non-
oil revenues in 2016, to help cushion the effect of the slump in oil prices. One way to achieve
this target is to “squeeze” small businesses who make up about half of GDP, to boost tax
revenues by 33%. As a result, much pressure has been put on the tax authorities in Nigeria
to expand its tax base and generate more tax revenue.
3 Model
I build a simple behavioral model of choice for entrepreneurs with heterogeneous skill level,
s, with s ∈ [Smin, Smax] distributed according to a Probability Distribution Function (PDF),
f(s). Every individual in the economy is a potential entrepreneur, endowed with the same
units of capital, K. Each individual makes a decision of which sector to operate in: (1)
the Neutral sector (n) where she chooses leisure over work, (2) the Informal sector (i), or
(3) the Formal sector (f). The decision of which sector to operate in depends on utility
comparisons (given entry into a particular sector).
Regardless of whether the individual chooses to operate in the informal or formal sector,
she has access to the same production technology:
Y = AsKθKLθL , 0 < θK , θL < 1 (1)
13Eboh, Camillus, and Felix Onuah. 2015. “Nigeria expects 2016 bud-get deficit to double to $11 billion.” Reuters Africa News Article, December 20http://af.reuters.com/article/investingNews/idAFKBN0U51HS20151222 (accessed July 26, 2016).
14Nigeria Federal Ministry of Budget and National Planning. 2016. “ Buhari Summons Fed-eral Executive Council Meeting to Discuss Budget” National Planning Commission News Arti-cle. http://www.nationalplanning.gov.ng///index.php/news-media/news/news-summary/586-april-20th-2016%7D (accessed May 24, 2016).
17
where A is the factor of productivity, K is the capital used in production and L is labor.
The production function is a simple Cobb-Douglas function with constant returns to scale,
such that θK = θL = 12 . I assume that each entrepreneur uses exactly one unit of labor. As
a result, the production function reduces to
Y = AsK1/2 (2)
The government imposes a tax, t (0 < t < 1) on the profit of an entrepreneur operating
in the formal sector while the activities of the informal sector firm are taxed based on
a proportional presumptive taxation (PPT) regime using the estimated assessment with
capital, K as an indicator of income. The PPT serves as the benchmark presumptive
taxation policy in my model. In particular, the informal sector entrepreneur is taxed at a
rate, h (0 ≤ h < 1) on the capital she employs in production.
As mentioned earlier, each entrepreneur has to choose from remaining neutral, or operat-
ing in the formal or informal sector. The decision of which sector to operate in is determined
by the utility she gets from each sector. She will choose a sector that maximizes her utility,
given her skill level and the investment climate, as will be discussed shortly. The utility of
an individual in the neutral sector is simply
Un = rK (3)
where r is the cost of capital.
An entrepreneur operating in the formal sector will choose capital to maximize utility:
Uf = (PAsK12f − rKf )(1− t)− bfPAsK
12f − E + r(K −Kf ) (4)
where P is the unit price of output, E is the entry cost into the formal sector, which includes
the cost of registration, obtaining licenses and other formalities backed by regulation, and
bf (0 < bf < 1) is all other cost associated with the formal sector, such as bureaucratic
cost, corruption, and other regulatory burden.15 It is represented as a portion of the firm’s
15In Nigeria, companies operating in the formal sector face all sorts of costs associated with inefficiencies inthe tax system. These range from senior managements’ time spent on tax and regulatory issues, bureaucracyin the tax system, high compliance cost and bribes paid to tax officials to avoid huge liabilities. Maira (2014)and World Bank (2015) explains more about these costs.
18
revenue paid to the relevant agencies or the revenue equivalent of the time spent on resolving
regulatory issues (e.g tax audits and compliance).
An informal sector entrepreneur on the other hand will choose capital to maximize
utility:
Ui = (PAsK12i − rKi)− hKi − biPAsK
12i − L+ r(K −Ki) (5)
where L is the cost of entry into the informal sector and bi (0 < bi < 1) is the extortion,
corruption and burden associated with operating in the informal sector,16 also expressed as
a percentage of revenue.
The first order conditions give the optimal choice of capital17 for each sector as:
K∗f =
(PAs)2(1− t− bf )2
4r2(2− t)2(6)
K∗i =
(PAs)2(1− bi)2
4(2r + h)2(7)
These generate optimal output Y ∗f and Y ∗
i with optimal utilities:
U∗f =
(PAs)2(1− t− bf )2
4r(2− t)− E + rK (8)
U∗i =
(PAs)2(1− bi)2
4(2r + h)− L+ rK (9)
K∗i will be less than K∗
f because K is a function of skill level and entrepreneurs with higher
skill are more likely to operate in the formal sector than the informal sector. I assume that
(bf + t) < 1 and (bi + h) < 1.
3.1 Comparative Statics
The amount of capital invested is determined by skill level, s, the cost of capital, r, taxes, t
and h and other costs associated with bureaucracy, corruption and extortion in each sector,
16In Nigeria, informal traders are subject to all sorts of extortion from touts presenting themselves as somesort of authority and even tax officials, as they have to pay some amount of bribe to avoid been draggedinto the tax net.
17For very high skill levels, it is possible to invest capital greater than K. However, the additional capitalabove K can be sourced from financial institutions, because it is easier to gain access to credit at that level.Also, capital use can be controlled by restricting the rate at which capital increases. This can be achievedby assuming that technology is lower: that is setting A < 1 and re-calibrating the model. However, in orderto keep things simple, I choose to ignore this situation because the number of people that can be affectedby borrowing (k > K) is insignificant as there are very few people at that skill level.
19
bf and bi.
∂K∗f
∂s=s(PA)2(1− t− bf )2
2r2(2− t)2> 0 (10)
∂K∗f
∂t= −
(PAS)2(1− t− bf )(1 + bf )
2r2(2− t)3< 0 (11)
∂K∗f
∂bf= −
(PAs)2(1− t− bf )
2r2(2− t)2< 0 (12)
∂K∗i
∂s=s(PA)2(1− bi)2
2(2r + h)2> 0 (13)
∂K∗i
∂h= −(PAs)2(1− bi)2
2(2r + h)3< 0 (14)
∂K∗i
∂bi= −(PAs)2(1− bi)
2(2r + h)2< 0 (15)
As is expected, an increase in entrepreneurial skill will lead to an increase in the amount of
capital invested, a higher tax rate discourages investment and any additional cost associ-
ated with bureaucracy and extortion reduces the individual’s interest in increasing capital
invested.
3.2 Entrepreneurial Choice
At the initial state of the economy, there are three skill level thresholds, Si, Sf , and Smax
which guides the decision of the entrepreneurs.18 For an economy with all three sectors
existing and with Si < Sf < Smax, the choice of the individuals is such that:
• If 0 ≤ s ≤ Si, the individual remains neutral.
18This subsection is similar to section 4.1 of Ordonez(2013). He analyzed the effect of incomplete taxenforcement on aggregate output and productivity using a dynamic general equilibrium framework.
20
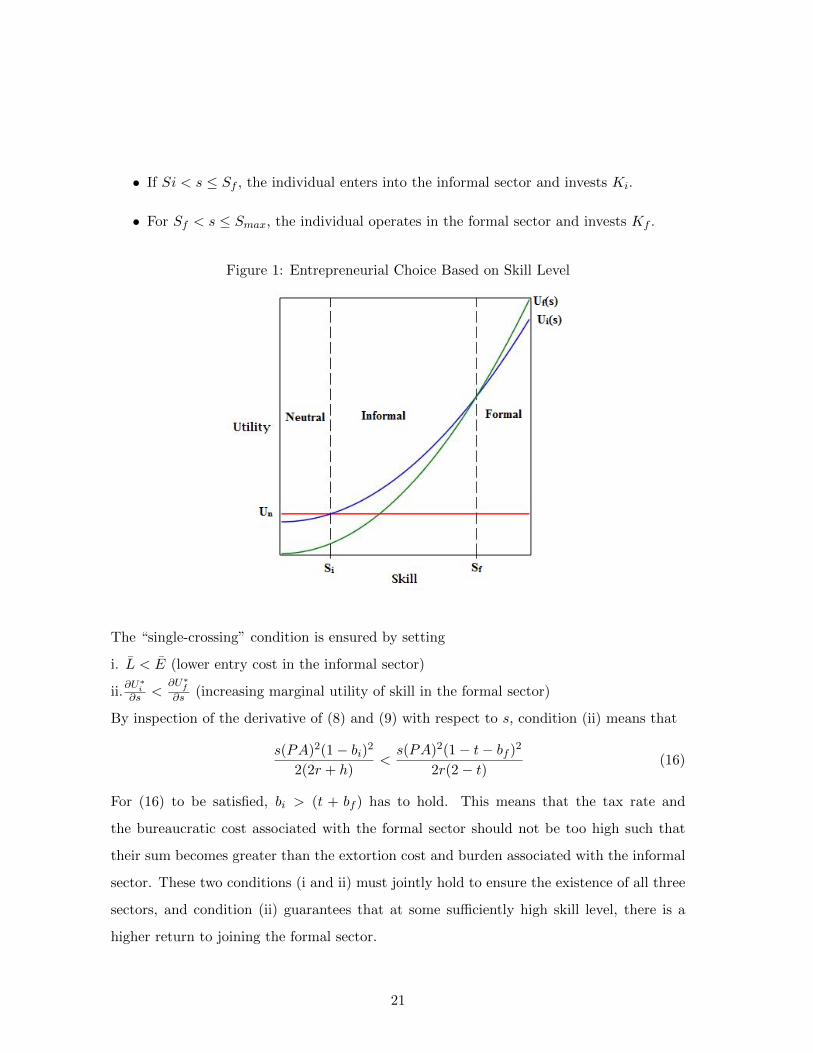
• If Si < s ≤ Sf , the individual enters into the informal sector and invests Ki.
• For Sf < s ≤ Smax, the individual operates in the formal sector and invests Kf .
Figure 1: Entrepreneurial Choice Based on Skill Level
The “single-crossing” condition is ensured by setting
i. L < E (lower entry cost in the informal sector)
ii.∂U∗
i∂s <
∂U∗f
∂s (increasing marginal utility of skill in the formal sector)
By inspection of the derivative of (8) and (9) with respect to s, condition (ii) means that
s(PA)2(1− bi)2
2(2r + h)<s(PA)2(1− t− bf )2
2r(2− t)(16)
For (16) to be satisfied, bi > (t + bf ) has to hold. This means that the tax rate and
the bureaucratic cost associated with the formal sector should not be too high such that
their sum becomes greater than the extortion cost and burden associated with the informal
sector. These two conditions (i and ii) must jointly hold to ensure the existence of all three
sectors, and condition (ii) guarantees that at some sufficiently high skill level, there is a
higher return to joining the formal sector.
21
Based on the parameters of the model, I find that
Si =
√L
φi(h)(17)
and
Sf =
√E − L
φf (t)− φi(h)(18)
where φi(h) = (PA)2(1−bi)24(2r+h) and φf (t) =
(PA)2(1−t−bf )24r(2−t) .
The comparative statics on the thresholds Si and Sf as presumptive tax changes show
that:∂Si∂h
= −1
2φ−3/2i (h)
√L∂φi(h)
∂h> 0 (19)
and∂Sf∂h
= −1
2(φf (t)− φi(h))−3/2
√E − L(−∂φi(h)
∂h) < 0 (20)
since ∂φi(h)∂h < 0 and with conditions (i) and (ii) satisfied.
Equations (19) and (20) show that an increase in h tends to make Si higher and Sf lower.
This is because an increase in h affects the utility of entrepreneurs in the informal sector.
These entrepreneurs respond by moving from the informal sector to the sector that gives
them a higher utility. While the larger informal firms will move into the formal sector, the
utility of the smaller firms in the informal sector becomes so small that it actually benefits
them more to suspend operations and move into the neutral sector. The interpretation of
this movement is that the introduction of the PPT will shrink the size of the informal sector
(refer to figure 1), and it is possible for the informal sector to be completely eliminated
with higher values of h.
The utility of individuals in the neutral sector is rK irrespective of the skill level while
the utility of individuals above skill level Si increases as their skill increases. At Si, the
individual is indifferent between operating in the informal sector or remaining neutral,
because Un = Ui at that point. However, above Si, Ui becomes higher than Un. It the
follows that everyone with skill above Si will choose to be entrepreneurs. At Sf , it becomes
more rewarding to operate in the formal sector than the informal sector. This is because
22
apart from the higher utility, operating in the informal sector becomes more costly for
individuals with very high skill level. As a result, they would prefer to operate at a large
scale given their high productivity. With this in mind, every entrepreneur with a skill level
above Sf will choose to operate in the formal sector.
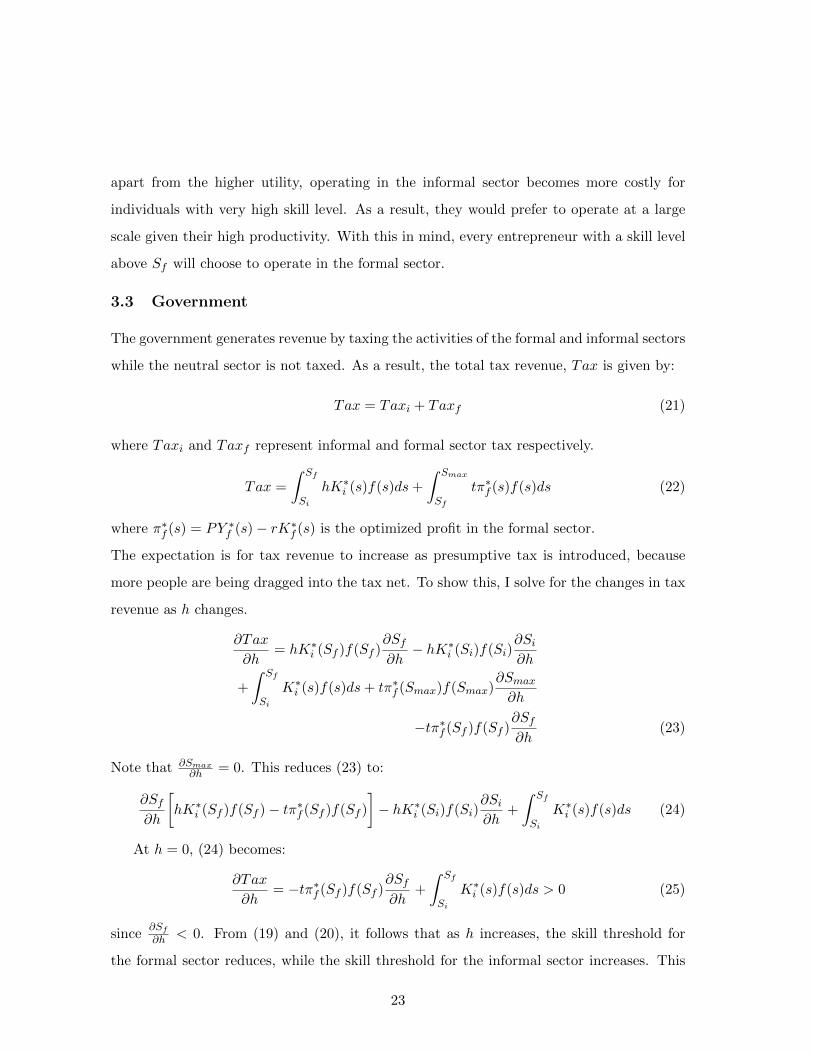
3.3 Government
The government generates revenue by taxing the activities of the formal and informal sectors
while the neutral sector is not taxed. As a result, the total tax revenue, Tax is given by:
Tax = Taxi + Taxf (21)
where Taxi and Taxf represent informal and formal sector tax respectively.
Tax =
∫ Sf
Si
hK∗i (s)f(s)ds+
∫ Smax
Sf
tπ∗f (s)f(s)ds (22)
where π∗f (s) = PY ∗f (s)− rK∗
f (s) is the optimized profit in the formal sector.
The expectation is for tax revenue to increase as presumptive tax is introduced, because
more people are being dragged into the tax net. To show this, I solve for the changes in tax
revenue as h changes.
∂Tax
∂h= hK∗
i (Sf )f(Sf )∂Sf∂h− hK∗
i (Si)f(Si)∂Si∂h
+
∫ Sf
Si
K∗i (s)f(s)ds+ tπ∗f (Smax)f(Smax)
∂Smax∂h
−tπ∗f (Sf )f(Sf )∂Sf∂h
(23)
Note that ∂Smax∂h = 0. This reduces (23) to:
∂Sf∂h
[hK∗
i (Sf )f(Sf )− tπ∗f (Sf )f(Sf )
]− hK∗
i (Si)f(Si)∂Si∂h
+
∫ Sf
Si
K∗i (s)f(s)ds (24)
At h = 0, (24) becomes:
∂Tax
∂h= −tπ∗f (Sf )f(Sf )
∂Sf∂h
+
∫ Sf
Si
K∗i (s)f(s)ds > 0 (25)
since∂Sf∂h < 0. From (19) and (20), it follows that as h increases, the skill threshold for
the formal sector reduces, while the skill threshold for the informal sector increases. This
23
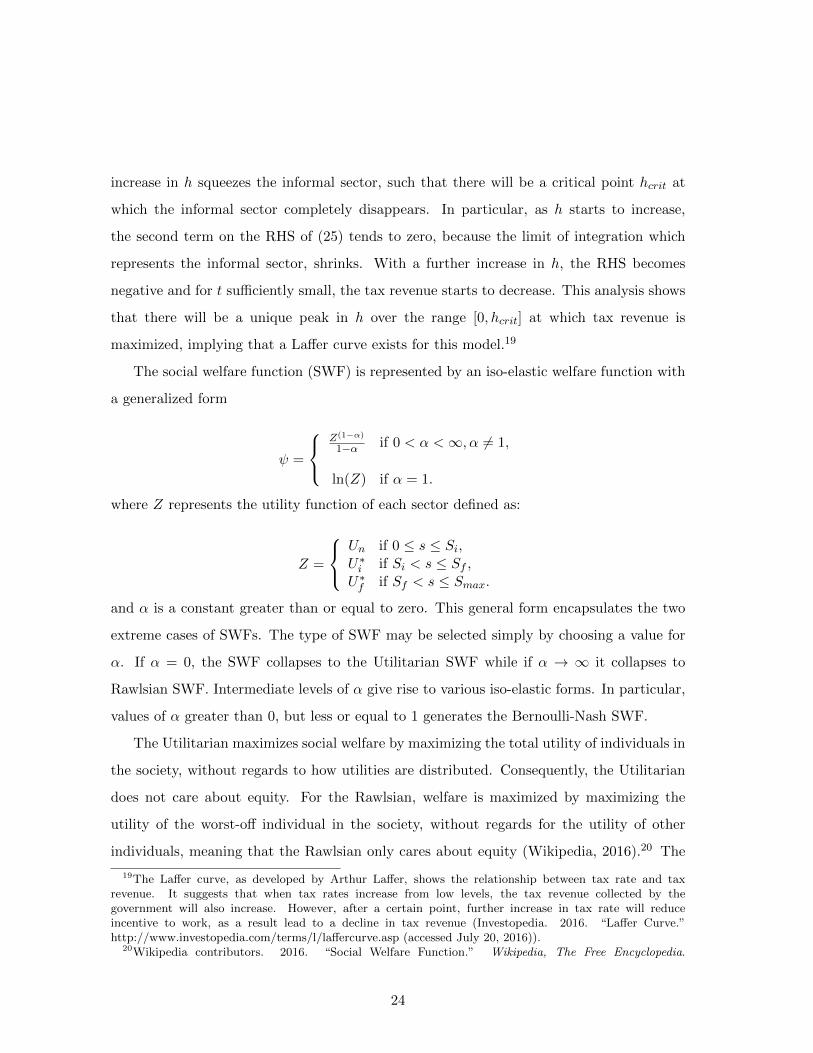
increase in h squeezes the informal sector, such that there will be a critical point hcrit at
which the informal sector completely disappears. In particular, as h starts to increase,
the second term on the RHS of (25) tends to zero, because the limit of integration which
represents the informal sector, shrinks. With a further increase in h, the RHS becomes
negative and for t sufficiently small, the tax revenue starts to decrease. This analysis shows
that there will be a unique peak in h over the range [0, hcrit] at which tax revenue is
maximized, implying that a Laffer curve exists for this model.19
The social welfare function (SWF) is represented by an iso-elastic welfare function with
a generalized form
ψ =
Z(1−α)
1−α if 0 < α <∞, α 6= 1,
ln(Z) if α = 1.
where Z represents the utility function of each sector defined as:
Z =
Un if 0 ≤ s ≤ Si,U∗i if Si < s ≤ Sf ,
U∗f if Sf < s ≤ Smax.
and α is a constant greater than or equal to zero. This general form encapsulates the two
extreme cases of SWFs. The type of SWF may be selected simply by choosing a value for
α. If α = 0, the SWF collapses to the Utilitarian SWF while if α → ∞ it collapses to
Rawlsian SWF. Intermediate levels of α give rise to various iso-elastic forms. In particular,
values of α greater than 0, but less or equal to 1 generates the Bernoulli-Nash SWF.
The Utilitarian maximizes social welfare by maximizing the total utility of individuals in
the society, without regards to how utilities are distributed. Consequently, the Utilitarian
does not care about equity. For the Rawlsian, welfare is maximized by maximizing the
utility of the worst-off individual in the society, without regards for the utility of other
individuals, meaning that the Rawlsian only cares about equity (Wikipedia, 2016).20 The
19The Laffer curve, as developed by Arthur Laffer, shows the relationship between tax rate and taxrevenue. It suggests that when tax rates increase from low levels, the tax revenue collected by thegovernment will also increase. However, after a certain point, further increase in tax rate will reduceincentive to work, as a result lead to a decline in tax revenue (Investopedia. 2016. “Laffer Curve.”http://www.investopedia.com/terms/l/laffercurve.asp (accessed July 20, 2016)).
20Wikipedia contributors. 2016. “Social Welfare Function.” Wikipedia, The Free Encyclopedia.
24
Bernoulli-Nash on the other hand is an intermediate case of welfare, caring more about
equity than the Utilitarian, but less than the Rawlsian. This means that the value assigned
to α depends on the equity preference of the government in question.
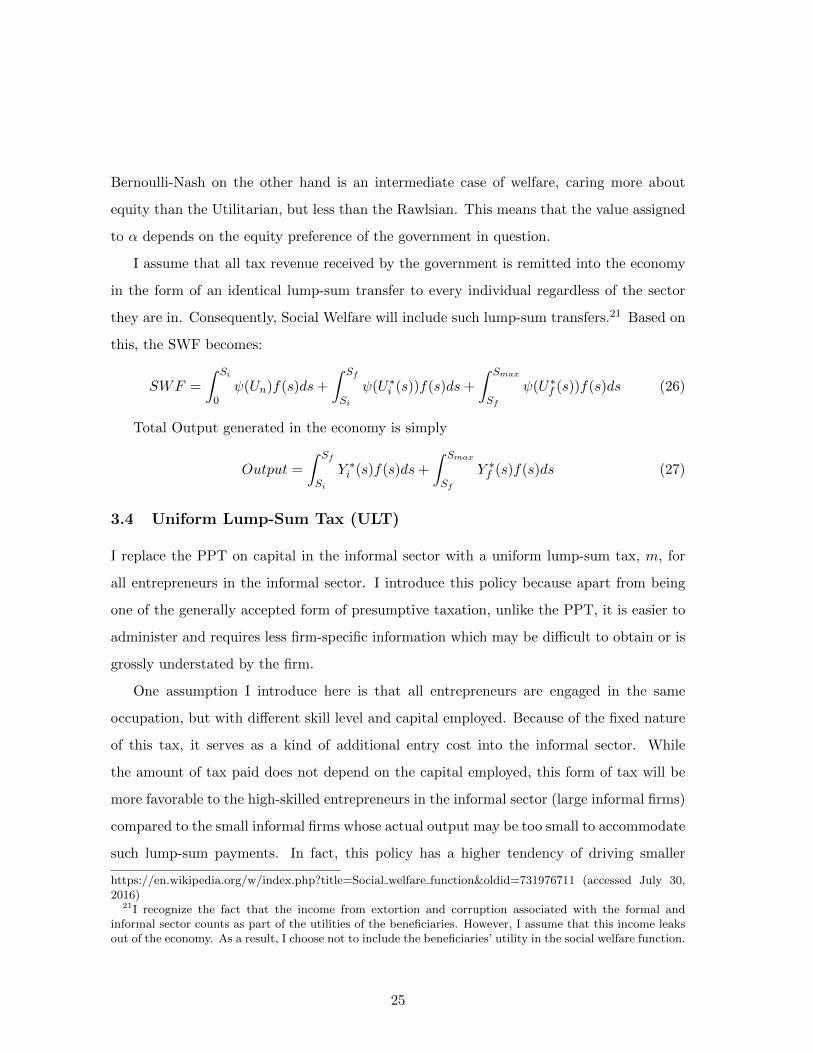
I assume that all tax revenue received by the government is remitted into the economy
in the form of an identical lump-sum transfer to every individual regardless of the sector
they are in. Consequently, Social Welfare will include such lump-sum transfers.21 Based on
this, the SWF becomes:
SWF =
∫ Si
0ψ(Un)f(s)ds+
∫ Sf
Si
ψ(U∗i (s))f(s)ds+
∫ Smax
Sf
ψ(U∗f (s))f(s)ds (26)
Total Output generated in the economy is simply
Output =
∫ Sf
Si
Y ∗i (s)f(s)ds+
∫ Smax
Sf
Y ∗f (s)f(s)ds (27)
3.4 Uniform Lump-Sum Tax (ULT)
I replace the PPT on capital in the informal sector with a uniform lump-sum tax, m, for
all entrepreneurs in the informal sector. I introduce this policy because apart from being
one of the generally accepted form of presumptive taxation, unlike the PPT, it is easier to
administer and requires less firm-specific information which may be difficult to obtain or is
grossly understated by the firm.
One assumption I introduce here is that all entrepreneurs are engaged in the same
occupation, but with different skill level and capital employed. Because of the fixed nature
of this tax, it serves as a kind of additional entry cost into the informal sector. While
the amount of tax paid does not depend on the capital employed, this form of tax will be
more favorable to the high-skilled entrepreneurs in the informal sector (large informal firms)
compared to the small informal firms whose actual output may be too small to accommodate
such lump-sum payments. In fact, this policy has a higher tendency of driving smaller
https://en.wikipedia.org/w/index.php?title=Social welfare function&oldid=731976711 (accessed July 30,2016)
21I recognize the fact that the income from extortion and corruption associated with the formal andinformal sector counts as part of the utilities of the beneficiaries. However, I assume that this income leaksout of the economy. As a result, I choose not to include the beneficiaries’ utility in the social welfare function.
25
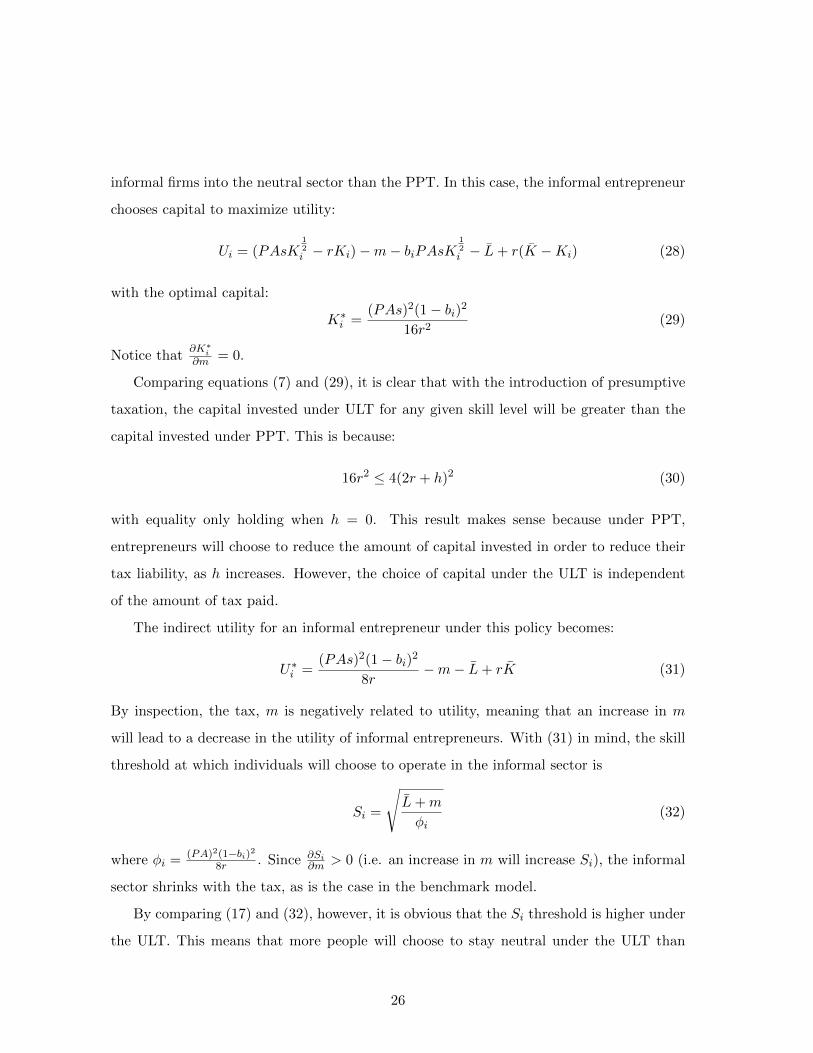
informal firms into the neutral sector than the PPT. In this case, the informal entrepreneur
chooses capital to maximize utility:
Ui = (PAsK12i − rKi)−m− biPAsK
12i − L+ r(K −Ki) (28)
with the optimal capital:
K∗i =
(PAs)2(1− bi)2
16r2(29)
Notice that∂K∗
i∂m = 0.
Comparing equations (7) and (29), it is clear that with the introduction of presumptive
taxation, the capital invested under ULT for any given skill level will be greater than the
capital invested under PPT. This is because:
16r2 ≤ 4(2r + h)2 (30)
with equality only holding when h = 0. This result makes sense because under PPT,
entrepreneurs will choose to reduce the amount of capital invested in order to reduce their
tax liability, as h increases. However, the choice of capital under the ULT is independent
of the amount of tax paid.
The indirect utility for an informal entrepreneur under this policy becomes:
U∗i =
(PAs)2(1− bi)2
8r−m− L+ rK (31)
By inspection, the tax, m is negatively related to utility, meaning that an increase in m
will lead to a decrease in the utility of informal entrepreneurs. With (31) in mind, the skill
threshold at which individuals will choose to operate in the informal sector is
Si =
√L+m
φi(32)
where φi = (PA)2(1−bi)28r . Since ∂Si
∂m > 0 (i.e. an increase in m will increase Si), the informal
sector shrinks with the tax, as is the case in the benchmark model.
By comparing (17) and (32), however, it is obvious that the Si threshold is higher under
the ULT. This means that more people will choose to stay neutral under the ULT than
26
under the PPT. It then follows that ULT discourages smaller informal firms from operating
compared to the benchmark case.
Apart from the changes noted in this section, all other parameters remain the same as
the benchmark model.
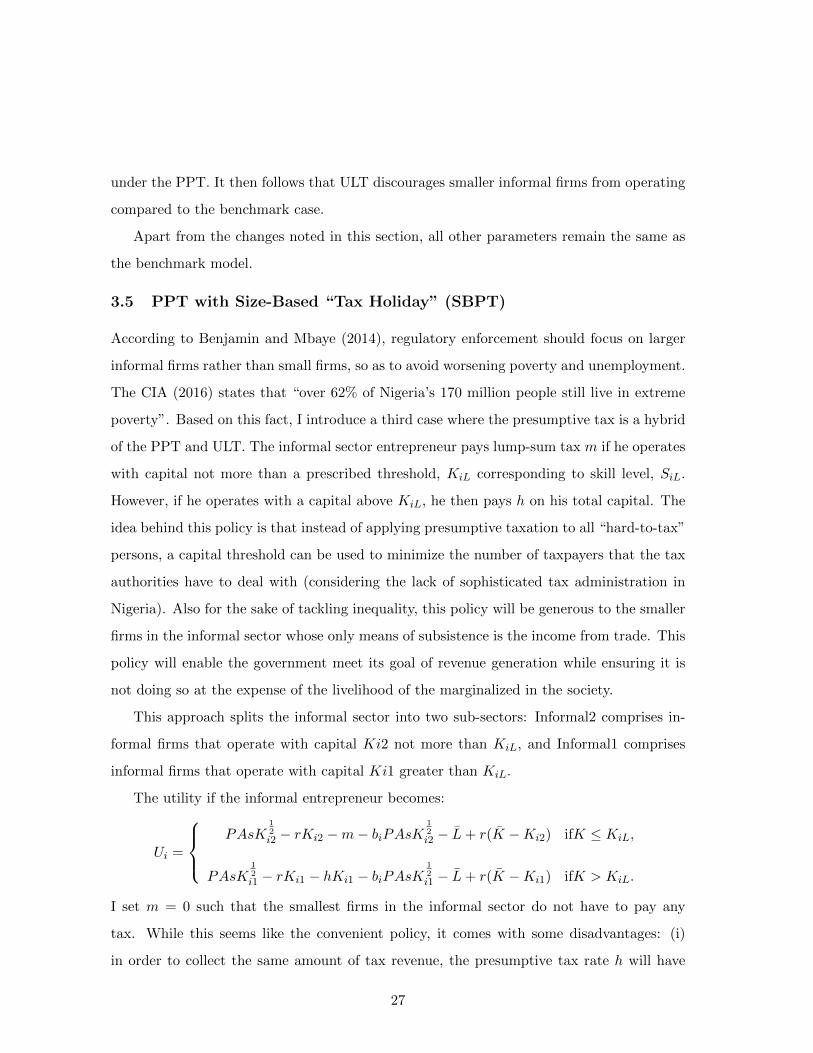
3.5 PPT with Size-Based “Tax Holiday” (SBPT)
According to Benjamin and Mbaye (2014), regulatory enforcement should focus on larger
informal firms rather than small firms, so as to avoid worsening poverty and unemployment.
The CIA (2016) states that “over 62% of Nigeria’s 170 million people still live in extreme
poverty”. Based on this fact, I introduce a third case where the presumptive tax is a hybrid
of the PPT and ULT. The informal sector entrepreneur pays lump-sum tax m if he operates
with capital not more than a prescribed threshold, KiL corresponding to skill level, SiL.
However, if he operates with a capital above KiL, he then pays h on his total capital. The
idea behind this policy is that instead of applying presumptive taxation to all “hard-to-tax”
persons, a capital threshold can be used to minimize the number of taxpayers that the tax
authorities have to deal with (considering the lack of sophisticated tax administration in
Nigeria). Also for the sake of tackling inequality, this policy will be generous to the smaller
firms in the informal sector whose only means of subsistence is the income from trade. This
policy will enable the government meet its goal of revenue generation while ensuring it is
not doing so at the expense of the livelihood of the marginalized in the society.
This approach splits the informal sector into two sub-sectors: Informal2 comprises in-
formal firms that operate with capital Ki2 not more than KiL, and Informal1 comprises
informal firms that operate with capital Ki1 greater than KiL.
The utility if the informal entrepreneur becomes:
Ui =
PAsK
12i2 − rKi2 −m− biPAsK
12i2 − L+ r(K −Ki2) ifK ≤ KiL,
PAsK12i1 − rKi1 − hKi1 − biPAsK
12i1 − L+ r(K −Ki1) ifK > KiL.
I set m = 0 such that the smallest firms in the informal sector do not have to pay any
tax. While this seems like the convenient policy, it comes with some disadvantages: (i)
in order to collect the same amount of tax revenue, the presumptive tax rate h will have
27
to be higher than in the benchmark case, because the number of taxable individuals in
the informal sector reduces; (ii) this policy can serve as a disincentive to operate in the
“larger” informal sector by inducing a “clustering” effect where some firms decide to peg
their capital at exactly KiL to avoid paying taxes. The cluster point, Si corresponds to
the skill level at which the entrepreneur becomes indifferent between being “small” and
not paying taxes (since m = 0) or being “large” and paying h, while operating with KiL.
This cluster will cause a distortion in the capital profile and productivity of the economy
and shift the burden of taxation onto the largest informal firms who must pay the h tax.
Notwithstanding these disadvantages, the SBPT policy might be the price the government
has to pay to tackle inequality and fairness.
4 Simulation
I apply the theoretical framework presented in Section 3 to parameter values based on data
and estimates representative of the Nigerian investment climate. Due to unavailability of
complete relevant data on the Nigerian economy, the variables used in this simulation are
partly based on available data, while the other parameters are based on assumptions made
to mimic relevant aspects of the Nigerian economy.
I obtain the value for formal sector tax, t from the “Paying Taxes 2016” section of the
World Bank “Doing Business” report (World Bank, 2016a). As mentioned earlier, self-
employed individuals are taxed under the PITA which is represented as labor tax in the
report. Their estimate shows labor tax as a percentage of profit at 12%. As a result of the
varying lending rates used by Nigerian financial institutions, I set the cost of capital, r at
the monetary policy rate of the Central Bank of Nigeria (CBN) which is currently 12% as at
March 2016 (CBN, 2016). I assume that the good produced in the economy is a composite
commodity with price indexed to 1 (P = 1) and I benchmark the factor of productivity at
1 (A = 1).
I assume a minimum skill level Smin = 0 and a maximum skill level Smax = 10. I
choose parameters to begin with h=0, to calibrate the size of the informal sector at 58% as
estimated by NFMBP (2014). This figure is more representative of the size of the informal
28
sector based on estimates from various authors like Steel and Snodgrass (2008), Schneider
et al. (2010), and ILO (2002), compared to the 41% released by the NBS (2016). All other
parameters have been chosen to fix the skill level thresholds for various sectors (i.e Si and
Sf ) to represent the size of these sectors in Nigeria using the available data on the size of
the informal sector as a starting point.
The cost of firm entry into the formal sector is much higher than the entry cost into
the informal sector. This is because of the regulations regarding registration, obtaining an
operating license, and other legal formalities. As a result, I fix formal sector entry cost at
E = 10. Entry into the informal sector comes at little or no cost to the entrepreneur. To
be more practical, I assume that the informal firm will require an amount equivalent to five
times less than the formal sector entry cost. Consequently, I fix L = 2. This amount can be
interpreted as the association levy or membership dues that the entrepreneur may have to
pay to operate in a certain occupation (this is typical in Nigeria where small firms organize
themselves into associations based on their occupation/trade).
World Bank (2015) identified the different bureaucratic and inefficiencies associated
with doing business in Nigeria. According to their report, about 26% of firms in their study
stated that they are expected to give gifts in meetings with tax inspectors, 25% are expected
to give gifts to get an operating license and about 8% of senior management time is spent
dealing with requirements of government regulation. According to Maira,
Data from the 2013 Global Corruption Barometer shows that the percentage
of citizens reporting paying a bribe to officials in tax administration and / or
customs in the African countries assessed is much higher than the global average
(Maira 2014).
Maira (2014) further stated that based on the respondents to the Afrobarometer,22 the
perception of corruption among tax officials is highest in Nigeria and Cameroun (59% each).
Despite the level of the dead weight loss in operating in the formal sector, there is still
some level of caution exercised by corrupt officials, because their actions “can in principle”
22Afrobarometer is a pan-African, non-partisan research network that conducts public attitude surveys ondemocracy, governance, economic conditions, and related issues in more than 35 countries in Africa.
29
be regulated and have legal consequences. However, the same cannot be said of the informal
sector. In Nigeria, informal traders are subject to all sorts of extortion from touts presenting
themselves as some sort of authority and even tax officials, as they have to pay some amount
of bribe to avoid been dragged into the tax net. In most cases, these entrepreneurs pay
these extortionists in order to avoid distortions to their business activities:
Although the individuals and enterprises operating in the informal sector may
not be paying statutory taxes in the real sense of the word, they do make different
forms of compulsory payment to touts and thugs operating in the uncoordinated
and crude levy systems that have come to be integral part of the Nigerian
markets and motor parks. These thugs and touts are usually the foot soldiers of
the ubiquitous, but largely invisible market and motor park kingpins who assume
lordship over various spheres usually occupied by majority of those operating in
the informal sector (CISLAC, 2013).
Unlike in the formal sector, there is little or no form of regulation and involvement by
the government on issues relating to the informal sector. Based on this analysis, I assume
that bf < bi and fix bf = 12% (or 0.12) and bi = 30% (or 0.3). Moreover, this condition has
to hold in order to have a positive formal and informal sector. Recall from (16), that bf
has to be higher than bi for∂U∗
i∂s <
∂U∗f
∂s (which ensures the single-crossing condition). If the
single-crossing condition does not hold, the formal sector will seize to exist, as the informal
sector utility will always be higher than formal sector utility, and every entrepreneur will
choose to operate in the informal sector. But this is not representative of the Nigerian
economy. I assume that these bureaucratic and extortion costs in the formal and informal
sector respectively are paid from revenue made from operations. The payments made to
touts by the informal sector firms are “compulsory” and independent of the fact that the
firm may or may not be making profits. Consequently, I assume that the touts can observe
the revenue of the informal sector firms. A summary of the parameter values chosen are
shown below.
When these parameters are applied to the model with h = 0 (i.e no presumptive tax, which
is the current case in Nigeria), I obtain the initial skill thresholds of [Si, Sf ] = [1.98, 7.86].
30
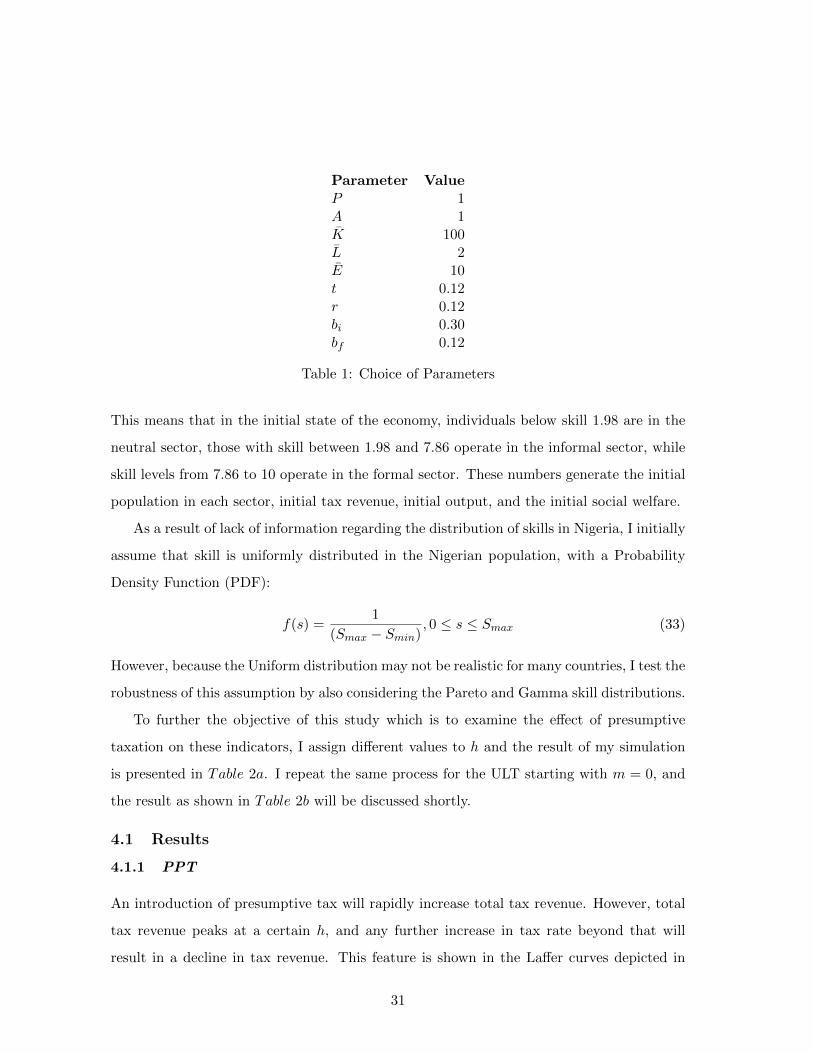
Parameter ValueP 1A 1K 100L 2E 10t 0.12r 0.12bi 0.30bf 0.12
Table 1: Choice of Parameters
This means that in the initial state of the economy, individuals below skill 1.98 are in the
neutral sector, those with skill between 1.98 and 7.86 operate in the informal sector, while
skill levels from 7.86 to 10 operate in the formal sector. These numbers generate the initial
population in each sector, initial tax revenue, initial output, and the initial social welfare.
As a result of lack of information regarding the distribution of skills in Nigeria, I initially
assume that skill is uniformly distributed in the Nigerian population, with a Probability
Density Function (PDF):
f(s) =1
(Smax − Smin), 0 ≤ s ≤ Smax (33)
However, because the Uniform distribution may not be realistic for many countries, I test the
robustness of this assumption by also considering the Pareto and Gamma skill distributions.
To further the objective of this study which is to examine the effect of presumptive
taxation on these indicators, I assign different values to h and the result of my simulation
is presented in Table 2a. I repeat the same process for the ULT starting with m = 0, and
the result as shown in Table 2b will be discussed shortly.
4.1 Results
4.1.1 PPT
An introduction of presumptive tax will rapidly increase total tax revenue. However, total
tax revenue peaks at a certain h, and any further increase in tax rate beyond that will
result in a decline in tax revenue. This feature is shown in the Laffer curves depicted in
31
Figure 3. In my analysis, the PPT rate that maximizes tax revenue is 22.65% at which
point tax revenue would have increased from the initial level of 2.77 (without presumptive
tax) to about 5.2. At this point, the informal sector population reduces from about 58% to
19% (producing about 4% of total output). There is a critical rate (hcrit = 72%) at which
the informal sector seizes to exist, but this point is significantly above the tax maximizing
level of h. This result shows that a government whose objective is to maximize tax revenue
can only collect an additional 88% in tax revenues and still keep a positive informal sector.
Although the size of the formal sector tax increases continuously with the introduction of
PPT, because of the movement of high skilled informal sector entrepreneurs into the formal
sector, diminishing returns to formal sector tax sets in at about h = 7%. The higher the
tax rate beyond this point, the less the revenue gained by a rate increase or lost by a rate
decrease. Strikingly, at this rate, the increase in the informal tax revenue starts to decline.
One explanation for the decline in the total tax revenue is that beyond the rate 22.65%,
the rate at which entrepreneurs move into the neutral sector becomes higher than the rate
at which they move into the formal sector. So while the formal sector still grows, the rate
of growth decreases leading to diminishing returns. The informal sector population, on the
other hand, continues to decrease. These two effect combines together to generate the Laffer
curve for the total tax revenue.
As expected, formal sector output continues to rise with h, although at a decreasing
rate, for the same reason as the diminishing returns to formal tax revenue. With the
introduction of PPT more entrepreneurs move into the formal sector. These entrepreneurs
are characterized by having higher skills and capital investments. As PPT increases, the
high skilled informal firms would be geared to move into the formal sector where the tax
is not paid on the amount of capital invested, but rather based on productivity and profit.
They will therefore invest more capital and with their high skill increase their productivity in
order to make profits that can accommodate their tax liability, while increasing their bottom
line (this is true even though they must pay the higher entry cost, E). The informal sector
output, on the other hand, continues to decline because of the movement of entrepreneurs
from the informal sector and also because the remaining informal sector entrepreneurs will
32
reduce the capital invested in order to reduce tax paid (recall from (14) that∂K∗
i∂h < 0). The
reduction in capital invested leads to a reduction in output. Similar to the formal sector
output, the total output increases at a decreasing rate with an increase in the PPT rate,
reaches its maximum at h = 54.75% and starts to decline beyond this rate, but not before
reducing the informal sector to just 5% of the population. At this point, the percentage of
output generated by the informal sector is only about 0.58% of total output. To maximize
total output, the PPT rate has to be about double the rate that maximizes tax revenue,
and because of the diminishing returns associated with the increase in total output, the
small increase in output may not be worth the disincentive effects of an increase in PPT
rate.
In order to analyze the effect of PPT on social welfare, I initially assume that the
government is Utilitarian by setting α = 0. The result shows that social welfare spikes
to a maximum and starts to decline as h is set beyond 15.44%. The implication of this
result is that a government that is interested in maximizing social welfare under the PPT
will do so at the expense of tax revenue and output maximization, although the increase in
tax revenue beyond this point (15.44%) is not very significant. At the welfare-maximizing
level of h, the size of the informal sector in terms of percentage of total output reduces to
6%. Notwithstanding the behavior of the social welfare, the individuals in the neutral and
formal sector will gain as a result of continuous welfare increase in these sectors, while the
welfare of the informal sector will continue to decrease with increases in h.
4.1.2 ULT
The reaction of the total tax revenue to the introduction of ULT is similar to that of the
PPT, except that in this case, the increase in tax revenue is not as rapid as the tax charge
rises. Total tax rises to a maximum at m = 4.60 and then starts to decline. At this point
the informal sector reduces to about 10% of the population. This revenue change is shown
in the Laffer curve in Figure 3f . Also unlike under the PPT, the maximum-tax revenue
point is very close to the critical m (mcrit = 5.97) at which the informal sector seizes to
exist. Although tax revenue from the informal sector peaks with about m = 3 and starts
to decrease as more people move away from the informal sector, the tax revenue from the
33
formal sector continues to increase almost at a constant rate.
Informal sector output decreases continuously at a constant rate while the formal sector
output increases continuously at a constant rate, which is due to the manner in which firms
move into the formal sector. The total output will increase at first and start to decline
at ULT above 3.95. The maximum output will be achieved at an informal:formal ratio of
about 12%:88% of total output, compared to the initial ratio of about 44%:56%.
Social welfare on the other hand peaks at m = 4.40 and then starts to decline (with
maximum welfare achieved when the ratio of informal sector output to total output is about
12%). This pattern is similar to the behavior of welfare under PPT. Since the tax revenue
peaks at a greater m compared to the output and welfare, a government whose objective
is to maximize tax revenue should be prepared for a sub-optimal output level and social
welfare.
A similar conclusion I draw from the effect of these two policies on tax, output and
welfare is that these indicators are individually maximized at different levels of presumptive
tax. Most importantly, welfare maximization requires a lower tax rate (h) or tax charge
(m) compared to total tax revenue maximization. These results also show that the optimal
policy is one that maximizes either tax, output or welfare, depending on the objective of the
government, without necessarily wiping out the informal sector. This is a very reasonable
result considering the fact that operating in the informal sector is the only means of survival
for many small entrepreneurs in Nigeria like the street hawkers, roadside traders, commercial
motorcyclist and so many others. More so, countries that are considered “developed” still
have a positive informal sector. An example is the USA with an informal sector size of
8.4%, Germany and Canada at 15.3%, United Kingdom, 12.2%, Australia, 13.5% and New
Zealand at 12% (as a percentage of GDP), as of 2007 (Schneider et al. 2010). These values
are close to the tax/output/welfare maximizing size of the informal sector (in terms of the
ratio of informal sector output to total output) in my model.
4.1.3 PPT and ULT with Gamma and Pareto Distributions
In practice, the Uniform skill distribution may not be realistic in many countries, including
Nigeria. Consequently, I re-estimate my model using two different distributions: the Gamma
34
distribution and the Pareto distribution. The Gamma distribution suggests that there are
fewer people in the lower and high skill levels, while more people are concentrated in the
mid-skill level. With the Pareto distribution, I assume that the population density decreases
continuously as skill level increases. Note that Smax → ∞ with the Pareto and Gamma
distributions (and this is maintained in the simulations).
The results from the Gamma and the Pareto distributions under the PPT exhibit the
same qualitative behavior as the Uniform distribution with respect to tax and welfare.
Interestingly, total tax is maximized at h = 23.59% under Gamma and 21.10% under Pareto
which is in the same range with the 22.65% for the Uniform distribution. Similarly the
welfare for all three distributions peaks within the range 14.29% to 15.77%. Worthy to note
is that all maximum values occur at the point where the informal sector is still positive in
size. Notwithstanding the similarities in the tax and welfare results with these distributions,
the maximum amount of tax revenue is different. The maximum tax revenue that can be
collected under the Uniform distribution and Gamma distribution are about 5.2 and 4.6
respectively, while tax revenue of up to 28 can be collected under the Pareto distribution.
This difference is because there is relatively greater density at the highest skill levels in the
Pareto distribution than under the Gamma distribution which translates into more output,
profit and eventually more tax. It then follows that if Nigeria’s skill distribution is the
Pareto type, then it can collect more tax revenue at a lower rate compared to a country
with similar investment climate but has a Uniform or Gamma skill distribution.
Similar to the Uniform distribution, the informal sector output declines continuously
while formal sector output rises with an increase in PPT rate under both Gamma and
Pareto. Total output, on the other hand, declines continuously under the Gamma and
Pareto distributions compared to the Uniform distribution where it rises at first and then
declines beyond PPT rate above 54.75%. The reason for this is strictly because of the type
of distribution. In both cases, there are more entrepreneurs in the lower and mid-skill levels
than the high skill levels; however, these are the people that dominate the informal sector.
Consequently, the effect from the informal sector output dominates.
The effect of ULT on all estimates for Gamma (tax, output and welfare) are qualitatively
35
the same as the Uniform distribution. The Pareto distribution also exhibits the same
behavior with regards to tax and social welfare. Output, on the other hand, declines
continuously under the Pareto distribution. With the ULT, more entrepreneurs from the
informal sector are lured into the neutral sector compared to the number that moves into
the formal sector. Also, recall that the population of entrepreneurs reduces as skill level
increases, which means that there are fewer individuals at the tail end of the distribution.
As a result, the rate at which the informal output declines is faster than the rate at which
formal output increases. Again, the effect from the informal sector dominates. Based on
the above analysis, it is clear that the effects of PPT and ULT on tax, welfare and output
are similar regardless of the assumed skill distribution.
The above analysis tells a lot about the effects of different presumptive tax policy but
does not provide a comparative analysis as to which policy is better. This comparison is
dealt with in the next section.
4.2 Revenue Neutrality
In order to compare the two policies directly, I invoke the concept of “Revenue Neutrality”.
This is a procedure that allows the government to still receive the same amount of tax
revenue despite changes in tax policies. I assume that the government wishes to collect a
certain amount of tax and then run simulations based on that tax revenue to determine the
output and welfare associated with the different policies.
The results (Table 5) show that for the Uniform and Pareto distributions, the PPT
generates higher welfare for the same amount of tax compared to the ULT. The simple
explanation for this is as follows. As noted earlier, the ULT violates vertical equity, in
that both small and large firms pay the same amount of tax. This puts pressure on the
smaller informal firms, who decide to move to the neutral sector where they are assured of
a constant utility without having to deal with the burden of tax compliance. A look at the
population sizes in Table 6 shows that the move from the informal sector into the neutral
sector is higher for ULT than the PPT. Also, more people move into the formal sector under
the PPT compared to the ULT. This movement puts more people on a higher utility (See
Figure 1) under the PPT, hence a higher welfare. One striking result is that this pattern
36
holds at different levels of α. Therefore, the policy choice will be the same for a Utilitarian
who does not care about equity, a Rawlsian government that is all about tackling inequality,
and a Bernoulli-Nash government whose weight placed on equity is neither as low as the
Utilitarian nor as high as the Rawlsian. However, for the Gamma distribution (Table 5b),
the PPT is only better for the Utilitarian and the Bernoulli-Nash (i.e α = 0 and α = 1) if
the government aims at collecting Tax Revenue up to 4: this is because, for a tax revenue
above 4, the PPT tax rate becomes so high that it discourages entrepreneurs in the informal
sector from investing. As a result, more entrepreneurs with lower skill level choose to keep
their money rather than invest. For high enough levels of revenue, there is a greater flow of
entrepreneurs from the informal sector into the neutral sector under the PPT than under
the ULT. For instance, to get a tax revenue of 4.5 under the Gamma distribution, the PPT
rate would have to more than double the rate needed to collect a tax revenue of 4 (that is,
from 6.5% to 14.81%) which is a high leap for just a revenue increase of 0.5. So a Utilitarian
and the Bernoulli-Nash government that wants to collect tax revenue above 4 would opt
for the ULT, given the higher welfare induced. It then follows from the above result that a
Rawlsian government (who cares more about equity) will always choose to maximize welfare
using the PPT, regardless of the skill distribution.
The same result cannot be reported for total output. Contrary to the welfare case,
total output produced is always higher under the ULT for all skill distributions and all tax
revenues. That is, for the same amount of tax revenue, the entrepreneurs produce more
under the ULT than under the PPT. There are two reasons behind this result:
1. Movement of low-skilled informal entrepreneurs to the neutral sector: recall that the
optimal capital invested under the ULT is independent of the amount of tax paid,
while the tax rate has a negative effect on capital invested under the PPT. Although
under the ULT there is more movement of low skilled entrepreneurs into the neutral
sector where no production takes place, unlike the PPT (in which case the marginal
effect of increase in h is the disincentive to invest) the capital of those remaining in the
informal sector does not decrease as a result of tax paid. Consequently, the informal
sector entrepreneurs are still able to invest at the same level prior to introduction
37
of ULT. This is the reason for the higher informal sector output under the ULT as
presented in Table 5.
2. Movement of high skilled informal entrepreneurs to the formal sector: for the high-
skilled entrepreneurs, introduction of presumptive tax moves them into the formal
sector because they would prefer to operate at a large scale given their high produc-
tivity. As stated earlier, the ULT moves less high skilled informal sector entrepreneurs
into the formal sector than the PPT. Therefore the formal sector output will be lower
under the ULT.
The total effect is a combination of the two effects above. As shown in the results (Table
4), the first effect overrides the second, since total output is higher under the ULT.
Based on the above analysis, the choice of presumptive tax policy depends on the inten-
tion of the government. A government that wants to maximize total output given a certain
amount of tax revenue will choose the ULT, while the PPT will be the optimal choice (in
most cases) for a government that is interested in maximizing welfare, whether or not it is
Utilitarian, Bernoulli-Nash, or Rawlsian.
5 Extension: PPT with Size-Based “Tax Holiday” (SBPT)
Having established similar qualitative results for all three skill distributions, I restrict atten-
tion in this section to the Uniform distribution. I assume that small informal firms (defined
by the amount of capital invested) enjoy a tax holiday, which is a term used to describe a
temporary reduction or elimination of a tax to encourage business investment (Wikipedia,
2016).23 Recall that the essence of the tax holiday is to tackle inequality, such that small
informal firms who operate with not more than a prescribed capital threshold are exempted
from paying taxes. These small informal firms are classified as operating in the informal
sector as a means of survival. As a result, the aim of the government is to encourage these
firms by not taxing them. Consequently, I set m = 0 while large informal firms (operating
above the prescribed capital threshold) pay 5% on the amount of capital invested. This case
23Wikipedia contributors. 2016. “Tax holiday” Wikipedia, The Free Encyclopedia.https://en.wikipedia.org/w/index.php?title=Tax holiday&oldid=676842365 (accessed July 30, 2016).
38
is then reduced to a similar policy to the ordinary PPT beyond a certain threshold. How-
ever, the difference here is that the number of taxpayers from the informal sector reduces as
a result of the “tax holiday” being granted to smaller informal firms. This policy is good for
reducing the number of “hard-to-tax” for the tax authority. It also encourages small firms
who can show that they are not able to pay taxes without shutting down their business. The
idea is for the government to nurture small up-coming firms, encourage entrepreneurship
and gradually help these firms grow to a point where they will naturally fall into the large
informal sector, and eventually transit into the formal sector. However, this rationale is
outside the current model because the model does not track this natural/gradual transition
into the formal sector.
I still maintain formal sector tax rate, t at 12% and with the additional PPT rate,
h = 5%, the skill thresholds become [Si, Sf ] = [1.98, 6.06], such that individuals between
skill level 1.98 and 6.06 are in the informal sector. The challenge then is choosing the capital
threshold at which an informal firm is considered large (KiL). In order to do this, I choose
different skill levels between Si and Sf and calibrate my model to see the effect. I start with
the midpoint skill level, i.e SiL = 4.02. This skill level corresponds to a capital threshold,
KiL of 34.39. As a result, entrepreneurs that invest less than 34.39 are considered small
and do not pay any taxes, while investments above 34.39 are considered an indication of a
large-scale operation in the informal sector and thus subject to PPT.
The implication of the above analysis is that some informal firms will try to pretend
that they were low-skilled, and so they intentionally invest capital exactly equal to 34.39
and avoid paying taxes. I call this the “clustering” effect. The skill level at which the
cluster occurs corresponds to the skill level where such a firm would be indifferent between
(i) KiL = 34.39 and pay zero taxes (ii) choosing a higher level of capital and paying the
PPT. I call this skill level Si. With a capital threshold of 34.39, the cluster will occur at
6.88. Note that Si is then higher than Sf : thus if the threshold is set at KiL = 34.39, apart
from the small firms that are exempted from tax, not only will every other entrepreneur in
the informal sector cluster and avoid taxes, the cluster will also extend to some individuals
in the formal sector. This capital threshold is sub-optimal because apart from the fact that
39
no tax will be collected from the informal sector (which is the current case), the taxable
population in the formal sector is further reduced, translating to a reduction in the formal
sector tax revenue. Based on the above result, I re-calibrate my model choosing lower
levels of SiL (corresponding to lower levels of KiL). The results are presented in Table
7a. We can see that total tax revenue, total output and social welfare (for all levels of
α) increase continuously as the capital threshold reduces. However, the rate of increase
declines as I choose capital thresholds that correspond to skill levels closer to Si.24 Based
on the re-calibration, the ideal capital threshold should be between the range 8.5 to 26
which corresponds to skill level range 2 to 3.5 (the “relevant range”). This ensures that:
1). the cluster does not extend into the formal sector; 2). There is a reasonable number
of individuals in the large informal sector to pay the presumptive tax; and 3). The small
informal sector for which the policy is designed is not completely wiped out.
One striking result that differentiates this policy from the ordinary PPT and the ULT
is that the Si threshold remains unchanged, which means that there is no incentive for the
small informal firms to move into the neutral sector. Also, within the “relevant range”,
the Sf threshold does not change, meaning that the formal sector tax will remain constant,
but total tax will increase as a result of the large informal firms that are been dragged into
the tax net. As a result, this policy focuses on taxing the activities in the informal sector
without necessarily forcing informal firms to move into the formal sector.
In order to quantitatively compare this policy to the ordinary PPT, I choose an SiL
equal to the Si value of the PPT policy with h = 5%, i.e 2.18 (see Table 2a: row 2 and
Table 7a: row 6). At this point, only individuals with skill level between 2.18 to 6.06 are
expected to pay the presumptive tax. All things being equal, the effect on tax, output and
welfare should be the same. However, the effect is different for the following reasons: 1)
the tax revenue for ordinary PPT (4.69) is higher than the tax revenue under SBPT (4.59),
because of the clustering effect in the latter policy in which case certain taxable individuals
avoid taxes; 2) as expected, the output is also higher under the ordinary PPT (52.19) than
the SBPT (52.10) again because those that cluster fix the amount of capital they invest
24It is reasonable to state that the threshold cannot be less than Si because individuals below that skilllevel are in the neutral sector.
40
at exactly KiL. Recall that the clustering effect allows these individuals to use the exact
capital threshold just to avoid paying taxes, whereas there is no such effect with the PPT;
and 3) based on the result, one can see that the welfare is higher under the SBPT with a
value of 50.39 compared to 40.94 under PPT.
The above results suggest that a higher tax revenue and a higher output does not
necessarily translate into better welfare for citizens. While the difference in tax revenue
and output are negligible, the difference in welfare is significant. Based on the above, a
government that wants to maximize welfare may be better off adopting SBPT.
To further strengthen this point, I test for the optimal policy using revenue neutrality.
This time, I compare all three policies in terms of social welfare, given tax revenue targets
3 and 4. I choose different levels of SiL within the “relevant range” for the SBPT to ensure
robustness of my findings. The results (Tables 7b, 7c & 7d) show that for all calibrations, the
SBPT generates a higher social welfare, and this holds true for all types of SWF. To collect
the same amount of tax revenue under SBPT, a higher tax rate h must be set compared
to the ordinary PPT without a tax holiday. However, the upside of this higher PPT rate
is that the rate only applies to the large informal firms who are willing to pay the tax due
or else move into the formal sector if h becomes too high. Also, the maximum amount of
tax revenue that can be generated under the SBPT is 4 compared to 5.3 under ULT and
5.2 under PPT. With the higher social welfare that is generated with SBPT, one can say
that the clustering effect, and slightly lower tax revenue and output, may just be the price
to pay to promote equity and encourage entrepreneurship.
5.1 Capital Profile (PPT vs ULT vs SBPT)
I examine the levels of capital investment in the informal sector under all three policies. To
compare the capital profiles for all three policies, I arbitrarily choose a tax revenue target,
Tax = 4 by the government and analyze the reaction of informal sector entrepreneurs under
each policy in terms of the corresponding amount of capital invested in the informal sector.
For SBPT, I choose a case where the government targets a tax revenue of 4 with KiL set at
19.14. In general, there is distortion in the amount of capital invested in the economy and
the ULT encourages more capital investment.
41
As expected, less capital will be invested if the government chooses to use PPT to collect
a tax revenue of 4 than when it adopts ULT (refer to equations (7) and (29)). This result
stems from the fact that under the PPT, informal entrepreneurs will choose to reduce the
amount of capital invested to reduce their tax liability, whereas the choice of capital under
the ULT is independent of the amount of tax paid. However, the PPT still generates more
capital investment than the SBPT because apart from the effect of PPT on capital, there
is also the clustering effect under SBPT. As stated earlier, under SBPT, a number of large
informal firms who have a higher potential of being productive (because of their skill level)
will intentionally choose to operate with exactly KiL, so as to be viewed as “small” by the
regulator and avoid paying taxes. As a result, they invest less capital than they would
otherwise.
As shown in figure 2 below, with the PPT and ULT, there are two jumps (points of
discontinuity) in the capital profile occurring at Si and Sf . However, there are multiple
points of discontinuity in the capital profile for the SBPT for the same reason given above.
In particular, the capital profile for ULT and PPT is such that:
• If s ≤ Si, remain in the neutral sector: K = 0.
• If Si < s ≤ Sf , enter the informal sector: invest K∗i .
• If s > Sf , enter the formal sector: invest K∗f .
While for SBPT:
• If s ≤ Si, remain in the neutral sector: K = 0.
• If Si < s ≤ SiL, enter the informal sector: invest K∗i2.
• If SiL < s ≤ Si, enter the informal sector: invest exactly KiL.
• If Si < s ≤ Sf , enter the informal sector: invest K∗i1.
• If s > Sf , enter the formal sector: invest K∗f .
42
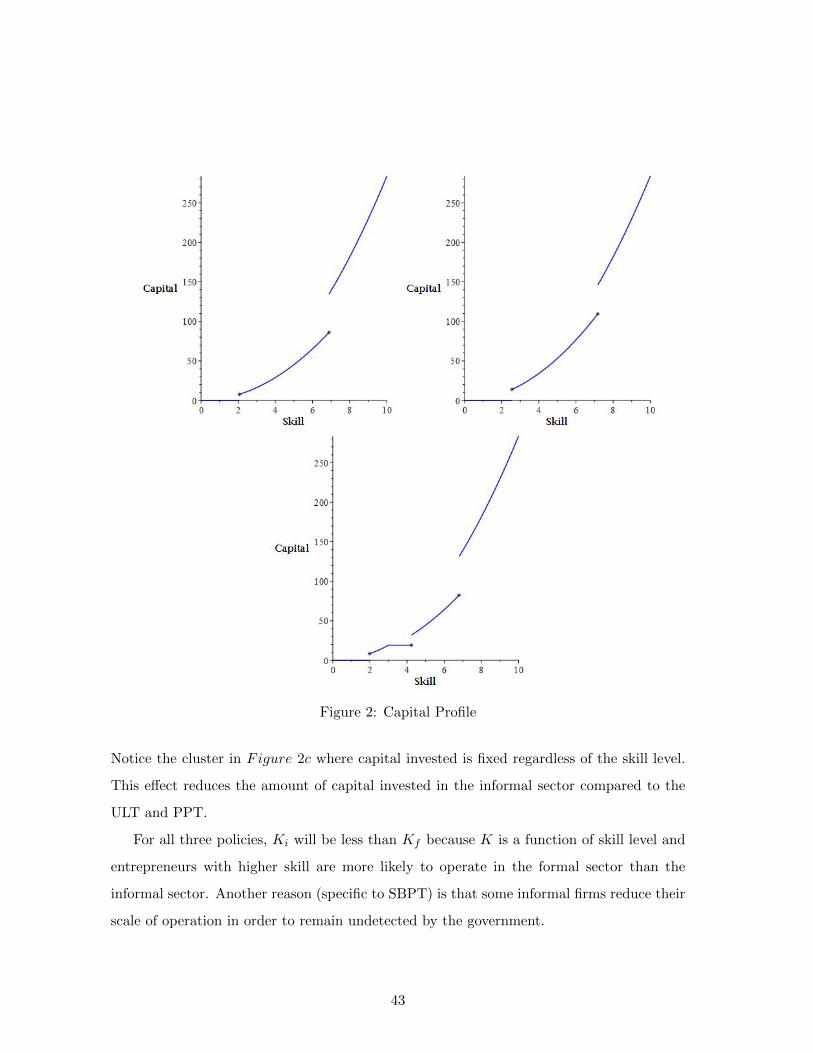
Figure 2: Capital Profile
Notice the cluster in Figure 2c where capital invested is fixed regardless of the skill level.
This effect reduces the amount of capital invested in the informal sector compared to the
ULT and PPT.
For all three policies, Ki will be less than Kf because K is a function of skill level and
entrepreneurs with higher skill are more likely to operate in the formal sector than the
informal sector. Another reason (specific to SBPT) is that some informal firms reduce their
scale of operation in order to remain undetected by the government.
43
6 Conclusion
In this paper, I have analyzed the effect of different presumptive taxation policies on the
size of the informal sector in Nigeria, using available data and relevant assumptions that
mirror the investment climate in Nigeria. I analyze three types of presumptive taxation
policies. The first is a proportional presumptive tax on capital which is a form of estimated
assessment presumptive tax, the second is a form of uniform lump-sum presumptive tax and
the third is a hybrid of the first two policies, introduced mainly to address the problems
of equity associated with the first two policies. I then quantify the effect of these policies
on tax revenue, output and social welfare. The main results can be summarized into five
points:
1. The choice of presumptive taxation policy depends on the objective of the government.
Therefore the government must define its goal for presumptive taxation since the best
policy for one goal may not be the same for others.
2. A government whose objective is to maximize welfare is better off with a proportional
tax on capital than a uniform lump-sum tax, regardless of its degree of concern with
equity.
3. The uniform lump-sum tax generates higher total output compared to the proportional
tax on capital, given revenue neutrality.
4. To ensure equity and fairness, encourage entrepreneurship and help small firms to
grow, the optimal policy is to exempt small informal firms from tax and apply a
proportional presumptive tax on the capital used by the larger informal firms.
5. If the government’s goal is to eventually move the informal sector firms into the formal
economy, then the SBPT will not be the ideal policy.
There has been concerns as to whether presumptive taxation is really effective in moving
informal firms firms into the formal economy and eventually into the normal tax system.
The effectiveness of any presumptive taxation regime would depend on the features of the
44
form adopted and the quality of administration. The administrative and compliance cost
associated with any presumptive method of taxation should be lower than that based on
normal tax rules. This goal can be achieved with a simple presumptive method which is
based on readily available information (Arachi and Santoro, 2007).
In order to ensure easy transition of informal sector tax payers from the presumptive
taxation regime into the normal tax system (formal sector tax), the formal sector tax rate
should be set at a reasonable level. The government can also provide incentives in the
formal sector, such as additional tax reliefs or bonus for compliant taxpayers in the formal
sector. These incentives will encourage the movement of informal sector entrepreneurs into
the formal sector (Wallace, 2002).
As represented in SBPT, the focus of presumptive taxation should not be the smallest
informal firms, because apart from their need for survival, their productivity is so low, such
that exempting them from tax may not cause any significant decline in tax revenue. Nev-
ertheless, economic development becomes difficult when majority of the economic activity
is in the informal sector which is “outside of the regulatory and tax regime” (Benjamin
and Mbaye, 2014). As a result, formalization of the informal sector should be a long-term
objective.
Notwithstanding the above points, the capacity of the tax authorities to handle a par-
ticular presumptive method is of utmost importance. The practicality of a particular pre-
sumptive method and the ability of the informal sector firms to hide the chosen indicator
(as chosen by the tax authority) should be considered (Thuronyi, 1996). For example, if
under the PPT, informal sector firms can easily hide the true amount of capital invested in
their business, then the PPT based on capital employed will not be the ideal presumptive
taxation policy. As a result of the above analysis, adopting an ideal presumptive taxation
policy will depend on the administrative capacity of the tax authorities involved, which
differs from country to country.
Despite the findings of this paper, further research is required to test the robustness of
the current model. For example, another study can investigate the impact of reducing the
bureaucratic and extortion cost associated with the formal and informal sectors respectively
45
(i.e reduce bi and bf ), and seeing how the optimal choice of the individuals in both sectors
will change. The study can also investigate if these reductions are more capable of bringing
more entrepreneurs into the formal sector. However, the level at which bi and bf can be
reduced to would depend on the specific costs of reducing these.
Also, I have not considered what will happen if the tax revenue could help to fund
improvements in general productivity. This will be represented by an increase in A in the
current model. Although by inspection of the production function in the current model, an
increase in A will lead to an increase in output in the formal and informal sectors, it is not
clear how this increase will affect the entrepreneurial choice and the optimal presumptive
taxation policy. As a result, there could be relevant general equilibrium effects which would
be interesting to look at in a dynamic model.
46
REFERENCES
1. Angahar, Paul A., and Sani I. Alfred. 2012. “Personal Income Tax Administrationin Nigeria: Challenges and Prospects for Increased Revenue Generation from SelfEmployed Persons in the Society.” Global Business and Economics Research Journal,1 no. 1: 1-11.
2. Arachi, Giampaolo, and Alessandro Santoro. 2007. “Tax Enforcement for SMEs:Lessons from the Italian Experience?” eJournal of Tax Research, 5 no. 2: 225-243.
3. Arimah, Ben C. 2001. “Nature and Determinants of the Linkages between Informaland Formal Sector Enterprises in Nigeria.” African Development Review, 13 (1):114-144.
4. Benjamin, Nancy, Ahmadou A. Mbaye. 2014. “Informality, Growth, and Developmentin Africa.” WIDER Working Paper, No. 2014/052.
5. Bird, Richard M. 2007. “Tax Challenges Facing Developing Countries: A PerspectiveFrom Outside The Policy Arena.” SSRN Electronic Journal.
6. Casanegra de Jantscher, Milka, and Vito Tanzi. 1987. “Presumptive Income Taxation:Administrative, Efficiency, and Equity Aspects.” IMF Working Paper, 87(54).
7. Central Bank of Nigeria. 2016. “Monetary Policy Rate: March 2016.” Central Bankof Nigeria Money Market Indicators. https://www.cbn.gov.ng/rates/mnymktind.asp (accessed June 27, 2016).
8. Central Intelligence Agency. 2016. “Nigeria.” The World Factbook. Retrieved July20, 2016.
9. Christensen, Jakob. 2004. “Domestic Debt Markets in Sub-Saharan Africa.” IMFWorking Paper, 04(46).
10. Civil Society Legislative Advocacy Center (CISLAC). 2013. “Expanding the Tax Basein the Informal Sector in Nigeria.” CISLAC Policy Brief.
11. Feige, Edgar L. 1981. “The UK’s Unobserved Economy: A Preliminary Assessment.”Economic Affairs, 1 no. 4: 205-212.
12. Fjose, Sveinung, Leo A. Grunfeld, and Chris Green. 2010. “SMEs and Growth in Sub-Saharan Africa: Identifying SME Roles and Obstacles to SME Growth.” MENONBusiness Economics Publication, No. 14.
13. Gerxhani, Klarita. 2004. “The Informal Sector in Developed and Less DevelopedCountries: A Literature Survey.” Public Choice, 120 (3/4): 267-300.
14. International Labour Office. 1972. “Employment, Incomes and Equality: A Strategyfor Increasing Productive Employment in Kenya.” A Report of an Inter-Agency TeamFinanced by the United Nations Development Programme.
47
15. —————————————-2002. “Decent Work and the Informal Economy: SixthItem on the Agenda.” Ninetieth session of the International Labor Conference, Geneva,Report 90/VI.
16. —————————————-2014. “Transitioning from the Informal to the FormalEconomy.” One hundred and third session of the International Labour Conference,Geneva, Report 103/V/1.
17. Inchauste, Gabriela, Mark Gradstein, and Era Dabla-Norris. 2005. “What CausesFirms to Hide Output? The Determinants of Informality.” IMF Working Paper, 05(160): 1.
18. La Porta, Rafael, and Andrei Shleifer. 2008. “The Unofficial Economy and EconomicDevelopment.” NBER Working Paper series, No. 14520.
19. Leal-Ordonez, Julio C. 2013. “Tax Collection, the Informal Sector, and Productivity.”Banco de Mexico Working Paper, No. 22.
20. Maira, Martini. 2014. “Approaches to Curbing Corruption in Tax Administration inAfrica.” U4 Anti-Corruption Resource Center, No. 11.
21. Mel, Suresh de, David McKenzie, and Christopher Woodruff. 2012. “Do InformalFirms Want To Formalize and Does It Help Them If They Do?” The World Bank,No. 10053.
22. Nigeria National Bureau of Statistics. 2016. “Formal and Informal Sector Split ofGross Domestic Product in 2015.” Nigerian National Bureau of Statistics SectorialReport, No. 403.
23. Ofori, Emmanuel G. 2009. “Taxation of The Informal Sector in Ghana: A Critical Ex-amination.” PhD diss., Institute of Distance Learning, Kwame Nkrumah Universityof Science and Technology, Kumasi.
24. PricewaterhouseCoopers (PwC) Nigeria. 2015. “Overview of Personal Income Tax-ation in Nigeria.” Paper presented at PwC Nigeria Tax Academy for Rivers StateInternal Revenue Service Tax Officers, Port-Harcourt, Rivers State, Nigeria.
25. Rajaraman, Indira. 1995. “Presumptive Direct Taxation: Lessons from Experiencein Developing Countries.” Economic and Political Weekly, 30 (18/19): 1103-1124.
26. Routh, Supriya. 2011. “Building Informal Workers Agenda: Imagining ‘InformalEmployment’ in Conceptual Resolution of ‘Informality’.” GLJ, 2 (3).
27. Schneider, Friedrich. 2002. “Size and Measurement of the Informal Economy in 110Countries around the World.” Paper presented at a Workshop of Australian NationalTax Centre, ANU, Canberra, Australia.
48
28. Schneider, Friedrich, Andreas Buehn, and Claudio E. Montenegro. 2010.“Shadow Economies All Over the World: New Estimates for 162 Countries from 1999to 2007.” World Bank Policy Research Working Paper, 5356.
29. Soto, Hernando de 1989. “The Other Path: The Invisible Revolution in the ThirdWorld.” New York.
30. Steel, W., and D. Snodgrass. 2008. “Raising Productivity and Reducing Risks ofHousehold Enterprises: Diagnostic Methodology Framework.” World Bank AfricaRegion Analysis on the Informal Economy with the support of the WIEGO network.
31. Tadesse, Helaway, and Gunther Taube. 1996. “Presumptive Taxation in Sub-SaharanAfrica: Experiences and Prospects.” IMF Working Papers, 96 (5).
32. Thomas, Kathleen D. 2013. “Presumptive Collection: A Prospect Theory Approachto Increasing Small Business Tax Compliance.” Tax Law Rev., 67: 111.
33. Thuronyi, Victor. 1996. “Presumptive Taxation.” Tax law design and drafting, IMF,1: 1996-1998.
34. ————————-2003. “Presumptive Taxation of the Hard-to-Tax.” InternationalStudies Program, Andrew Young School of Policy Studies, Georgia State UniversityWorking Paper, No. 03-25.
35. Wallace, Sally. 2002. “Imputed and Presumptive Taxes: International Experiencesand Lessons for Russia.” International Studies Program, Andrew Young School ofPolicy Studies, Georgia State University Working Paper, No. 02-03.
36. Williams, Colin C., and Youssef Youssef. 2015. “Theorising Entrepreneurship inthe Informal Sector in Urban Brazil: A Product of Exit or Exclusion?” Journal ofEntrepreneurship, 24 (2): 148-168.
37. Williams, Colin C., Ioana A. Horodnic. 2015. “Who Participates in the UndeclaredEconomy in South-Eastern Europe? An Evaluation of the Marginalization Thesis.”South Eastern Europe Journal of Economics, 2: 157-175.
38. World Bank. 2014. “More Jobs, Better Jobs: A Priority for Egypt.” World BankLabor Market Report, 88447-EG.
39. ——————-2015. “Nigeria Country Profile 2014.” The World Bank EnterpriseSurveys.
40. ——————-2016a. “Paying Taxes 2016.” World Bank Doing Business Report.
41. ——————-2016b. “World Development Indicators: Nigeria, Tax Revenue as Per-centage of GDP.” World Bank Databank. http://databank.worldbank.org/data/reports.aspx?source=world-development-indicators (accessed June 12, 2016).
49
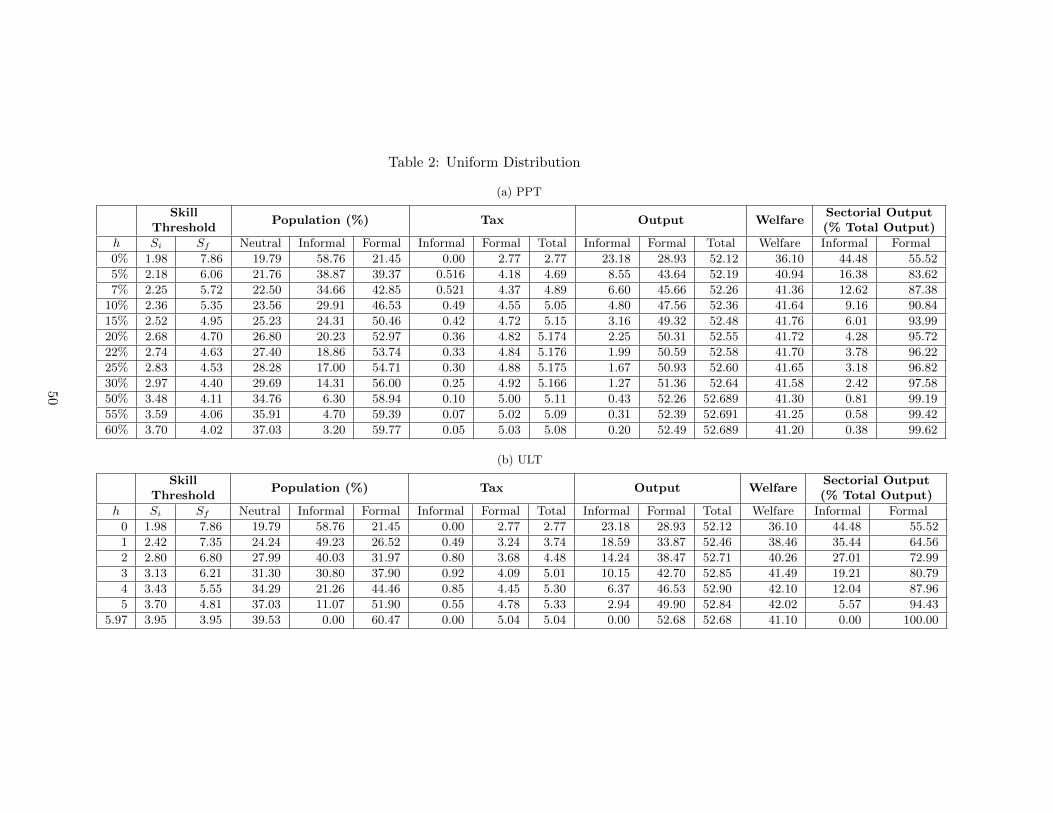
Table 2: Uniform Distribution
(a) PPT
SkillThreshold
Population (%) Tax Output WelfareSectorial Output(% Total Output)
h Si Sf Neutral Informal Formal Informal Formal Total Informal Formal Total Welfare Informal Formal
0% 1.98 7.86 19.79 58.76 21.45 0.00 2.77 2.77 23.18 28.93 52.12 36.10 44.48 55.52
5% 2.18 6.06 21.76 38.87 39.37 0.516 4.18 4.69 8.55 43.64 52.19 40.94 16.38 83.62
7% 2.25 5.72 22.50 34.66 42.85 0.521 4.37 4.89 6.60 45.66 52.26 41.36 12.62 87.38
10% 2.36 5.35 23.56 29.91 46.53 0.49 4.55 5.05 4.80 47.56 52.36 41.64 9.16 90.84
15% 2.52 4.95 25.23 24.31 50.46 0.42 4.72 5.15 3.16 49.32 52.48 41.76 6.01 93.99
20% 2.68 4.70 26.80 20.23 52.97 0.36 4.82 5.174 2.25 50.31 52.55 41.72 4.28 95.72
22% 2.74 4.63 27.40 18.86 53.74 0.33 4.84 5.176 1.99 50.59 52.58 41.70 3.78 96.22
25% 2.83 4.53 28.28 17.00 54.71 0.30 4.88 5.175 1.67 50.93 52.60 41.65 3.18 96.82
30% 2.97 4.40 29.69 14.31 56.00 0.25 4.92 5.166 1.27 51.36 52.64 41.58 2.42 97.58
50% 3.48 4.11 34.76 6.30 58.94 0.10 5.00 5.11 0.43 52.26 52.689 41.30 0.81 99.19
55% 3.59 4.06 35.91 4.70 59.39 0.07 5.02 5.09 0.31 52.39 52.691 41.25 0.58 99.42
60% 3.70 4.02 37.03 3.20 59.77 0.05 5.03 5.08 0.20 52.49 52.689 41.20 0.38 99.62
(b) ULT
SkillThreshold
Population (%) Tax Output WelfareSectorial Output(% Total Output)
h Si Sf Neutral Informal Formal Informal Formal Total Informal Formal Total Welfare Informal Formal
0 1.98 7.86 19.79 58.76 21.45 0.00 2.77 2.77 23.18 28.93 52.12 36.10 44.48 55.52
1 2.42 7.35 24.24 49.23 26.52 0.49 3.24 3.74 18.59 33.87 52.46 38.46 35.44 64.56
2 2.80 6.80 27.99 40.03 31.97 0.80 3.68 4.48 14.24 38.47 52.71 40.26 27.01 72.99
3 3.13 6.21 31.30 30.80 37.90 0.92 4.09 5.01 10.15 42.70 52.85 41.49 19.21 80.79
4 3.43 5.55 34.29 21.26 44.46 0.85 4.45 5.30 6.37 46.53 52.90 42.10 12.04 87.96
5 3.70 4.81 37.03 11.07 51.90 0.55 4.78 5.33 2.94 49.90 52.84 42.02 5.57 94.43
5.97 3.95 3.95 39.53 0.00 60.47 0.00 5.04 5.04 0.00 52.68 52.68 41.10 0.00 100.00
50
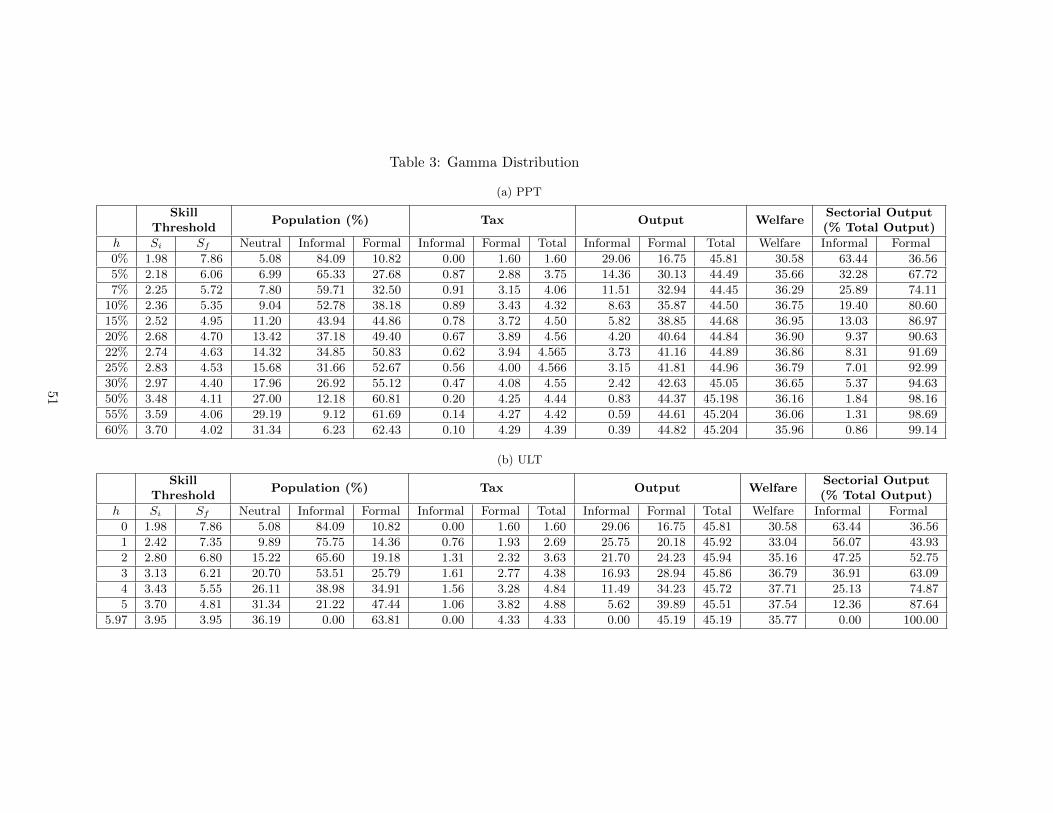
Table 3: Gamma Distribution
(a) PPT
SkillThreshold
Population (%) Tax Output WelfareSectorial Output(% Total Output)
h Si Sf Neutral Informal Formal Informal Formal Total Informal Formal Total Welfare Informal Formal
0% 1.98 7.86 5.08 84.09 10.82 0.00 1.60 1.60 29.06 16.75 45.81 30.58 63.44 36.56
5% 2.18 6.06 6.99 65.33 27.68 0.87 2.88 3.75 14.36 30.13 44.49 35.66 32.28 67.72
7% 2.25 5.72 7.80 59.71 32.50 0.91 3.15 4.06 11.51 32.94 44.45 36.29 25.89 74.11
10% 2.36 5.35 9.04 52.78 38.18 0.89 3.43 4.32 8.63 35.87 44.50 36.75 19.40 80.60
15% 2.52 4.95 11.20 43.94 44.86 0.78 3.72 4.50 5.82 38.85 44.68 36.95 13.03 86.97
20% 2.68 4.70 13.42 37.18 49.40 0.67 3.89 4.56 4.20 40.64 44.84 36.90 9.37 90.63
22% 2.74 4.63 14.32 34.85 50.83 0.62 3.94 4.565 3.73 41.16 44.89 36.86 8.31 91.69
25% 2.83 4.53 15.68 31.66 52.67 0.56 4.00 4.566 3.15 41.81 44.96 36.79 7.01 92.99
30% 2.97 4.40 17.96 26.92 55.12 0.47 4.08 4.55 2.42 42.63 45.05 36.65 5.37 94.63
50% 3.48 4.11 27.00 12.18 60.81 0.20 4.25 4.44 0.83 44.37 45.198 36.16 1.84 98.16
55% 3.59 4.06 29.19 9.12 61.69 0.14 4.27 4.42 0.59 44.61 45.204 36.06 1.31 98.69
60% 3.70 4.02 31.34 6.23 62.43 0.10 4.29 4.39 0.39 44.82 45.204 35.96 0.86 99.14
(b) ULT
SkillThreshold
Population (%) Tax Output WelfareSectorial Output(% Total Output)
h Si Sf Neutral Informal Formal Informal Formal Total Informal Formal Total Welfare Informal Formal
0 1.98 7.86 5.08 84.09 10.82 0.00 1.60 1.60 29.06 16.75 45.81 30.58 63.44 36.56
1 2.42 7.35 9.89 75.75 14.36 0.76 1.93 2.69 25.75 20.18 45.92 33.04 56.07 43.93
2 2.80 6.80 15.22 65.60 19.18 1.31 2.32 3.63 21.70 24.23 45.94 35.16 47.25 52.75
3 3.13 6.21 20.70 53.51 25.79 1.61 2.77 4.38 16.93 28.94 45.86 36.79 36.91 63.09
4 3.43 5.55 26.11 38.98 34.91 1.56 3.28 4.84 11.49 34.23 45.72 37.71 25.13 74.87
5 3.70 4.81 31.34 21.22 47.44 1.06 3.82 4.88 5.62 39.89 45.51 37.54 12.36 87.64
5.97 3.95 3.95 36.19 0.00 63.81 0.00 4.33 4.33 0.00 45.19 45.19 35.77 0.00 100.00
51
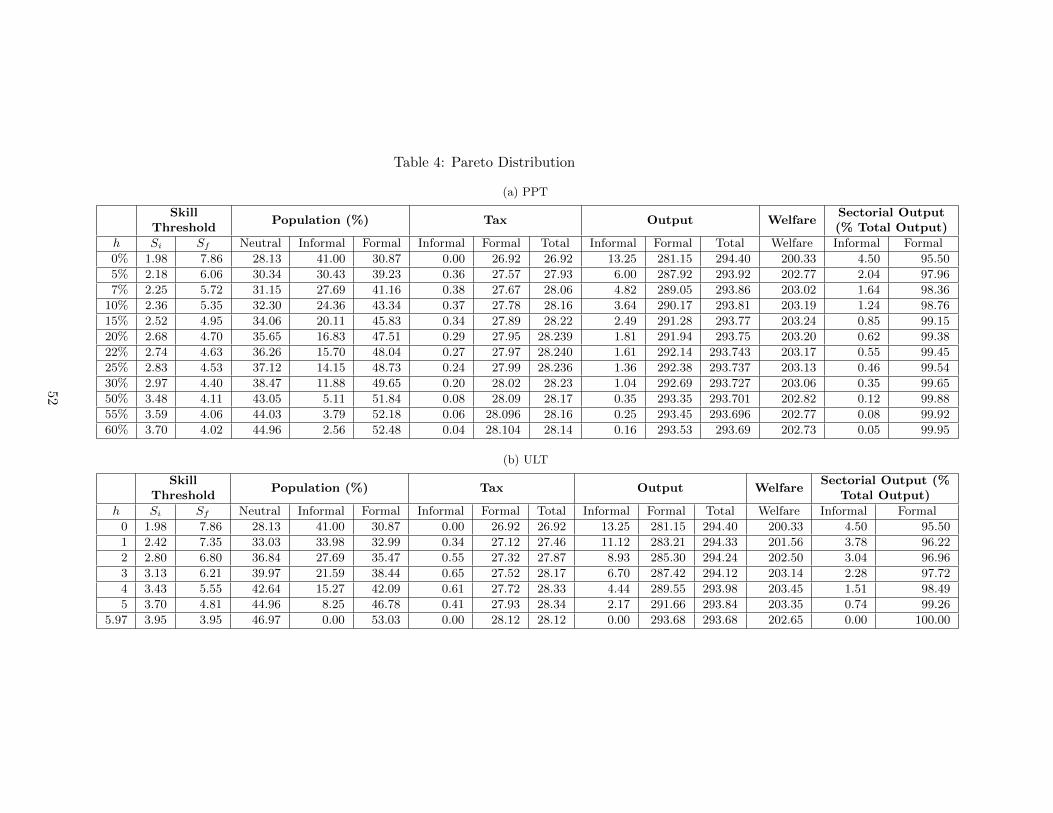
Table 4: Pareto Distribution
(a) PPT
SkillThreshold
Population (%) Tax Output WelfareSectorial Output(% Total Output)
h Si Sf Neutral Informal Formal Informal Formal Total Informal Formal Total Welfare Informal Formal
0% 1.98 7.86 28.13 41.00 30.87 0.00 26.92 26.92 13.25 281.15 294.40 200.33 4.50 95.50
5% 2.18 6.06 30.34 30.43 39.23 0.36 27.57 27.93 6.00 287.92 293.92 202.77 2.04 97.96
7% 2.25 5.72 31.15 27.69 41.16 0.38 27.67 28.06 4.82 289.05 293.86 203.02 1.64 98.36
10% 2.36 5.35 32.30 24.36 43.34 0.37 27.78 28.16 3.64 290.17 293.81 203.19 1.24 98.76
15% 2.52 4.95 34.06 20.11 45.83 0.34 27.89 28.22 2.49 291.28 293.77 203.24 0.85 99.15
20% 2.68 4.70 35.65 16.83 47.51 0.29 27.95 28.239 1.81 291.94 293.75 203.20 0.62 99.38
22% 2.74 4.63 36.26 15.70 48.04 0.27 27.97 28.240 1.61 292.14 293.743 203.17 0.55 99.45
25% 2.83 4.53 37.12 14.15 48.73 0.24 27.99 28.236 1.36 292.38 293.737 203.13 0.46 99.54
30% 2.97 4.40 38.47 11.88 49.65 0.20 28.02 28.23 1.04 292.69 293.727 203.06 0.35 99.65
50% 3.48 4.11 43.05 5.11 51.84 0.08 28.09 28.17 0.35 293.35 293.701 202.82 0.12 99.88
55% 3.59 4.06 44.03 3.79 52.18 0.06 28.096 28.16 0.25 293.45 293.696 202.77 0.08 99.92
60% 3.70 4.02 44.96 2.56 52.48 0.04 28.104 28.14 0.16 293.53 293.69 202.73 0.05 99.95
(b) ULT
SkillThreshold
Population (%) Tax Output WelfareSectorial Output (%
Total Output)
h Si Sf Neutral Informal Formal Informal Formal Total Informal Formal Total Welfare Informal Formal
0 1.98 7.86 28.13 41.00 30.87 0.00 26.92 26.92 13.25 281.15 294.40 200.33 4.50 95.50
1 2.42 7.35 33.03 33.98 32.99 0.34 27.12 27.46 11.12 283.21 294.33 201.56 3.78 96.22
2 2.80 6.80 36.84 27.69 35.47 0.55 27.32 27.87 8.93 285.30 294.24 202.50 3.04 96.96
3 3.13 6.21 39.97 21.59 38.44 0.65 27.52 28.17 6.70 287.42 294.12 203.14 2.28 97.72
4 3.43 5.55 42.64 15.27 42.09 0.61 27.72 28.33 4.44 289.55 293.98 203.45 1.51 98.49
5 3.70 4.81 44.96 8.25 46.78 0.41 27.93 28.34 2.17 291.66 293.84 203.35 0.74 99.26
5.97 3.95 3.95 46.97 0.00 53.03 0.00 28.12 28.12 0.00 293.68 293.68 202.65 0.00 100.00
52
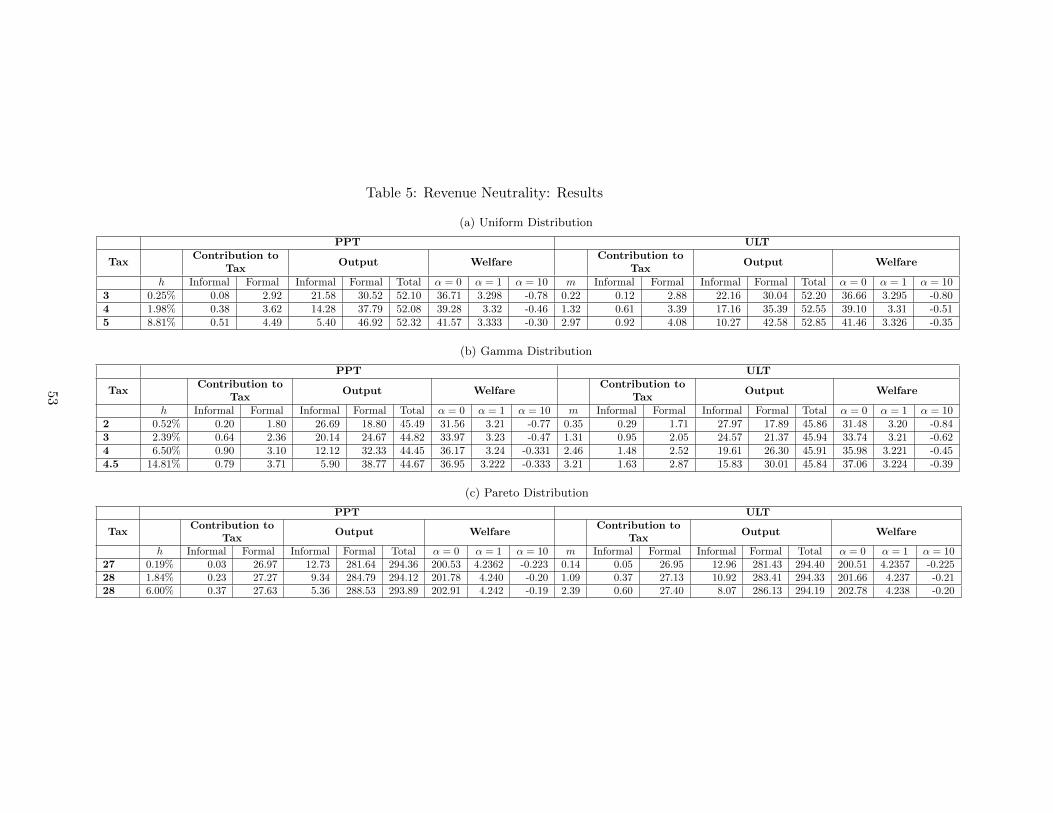
Table 5: Revenue Neutrality: Results
(a) Uniform Distribution
PPT ULT
TaxContribution to
TaxOutput Welfare
Contribution toTax
Output Welfare
h Informal Formal Informal Formal Total α = 0 α = 1 α = 10 m Informal Formal Informal Formal Total α = 0 α = 1 α = 103 0.25% 0.08 2.92 21.58 30.52 52.10 36.71 3.298 -0.78 0.22 0.12 2.88 22.16 30.04 52.20 36.66 3.295 -0.804 1.98% 0.38 3.62 14.28 37.79 52.08 39.28 3.32 -0.46 1.32 0.61 3.39 17.16 35.39 52.55 39.10 3.31 -0.515 8.81% 0.51 4.49 5.40 46.92 52.32 41.57 3.333 -0.30 2.97 0.92 4.08 10.27 42.58 52.85 41.46 3.326 -0.35
(b) Gamma Distribution
PPT ULT
TaxContribution to
TaxOutput Welfare
Contribution toTax
Output Welfare
h Informal Formal Informal Formal Total α = 0 α = 1 α = 10 m Informal Formal Informal Formal Total α = 0 α = 1 α = 102 0.52% 0.20 1.80 26.69 18.80 45.49 31.56 3.21 -0.77 0.35 0.29 1.71 27.97 17.89 45.86 31.48 3.20 -0.843 2.39% 0.64 2.36 20.14 24.67 44.82 33.97 3.23 -0.47 1.31 0.95 2.05 24.57 21.37 45.94 33.74 3.21 -0.624 6.50% 0.90 3.10 12.12 32.33 44.45 36.17 3.24 -0.331 2.46 1.48 2.52 19.61 26.30 45.91 35.98 3.221 -0.454.5 14.81% 0.79 3.71 5.90 38.77 44.67 36.95 3.222 -0.333 3.21 1.63 2.87 15.83 30.01 45.84 37.06 3.224 -0.39
(c) Pareto Distribution
PPT ULT
TaxContribution to
TaxOutput Welfare
Contribution toTax
Output Welfare
h Informal Formal Informal Formal Total α = 0 α = 1 α = 10 m Informal Formal Informal Formal Total α = 0 α = 1 α = 1027 0.19% 0.03 26.97 12.73 281.64 294.36 200.53 4.2362 -0.223 0.14 0.05 26.95 12.96 281.43 294.40 200.51 4.2357 -0.22528 1.84% 0.23 27.27 9.34 284.79 294.12 201.78 4.240 -0.20 1.09 0.37 27.13 10.92 283.41 294.33 201.66 4.237 -0.2128 6.00% 0.37 27.63 5.36 288.53 293.89 202.91 4.242 -0.19 2.39 0.60 27.40 8.07 286.13 294.19 202.78 4.238 -0.20
53
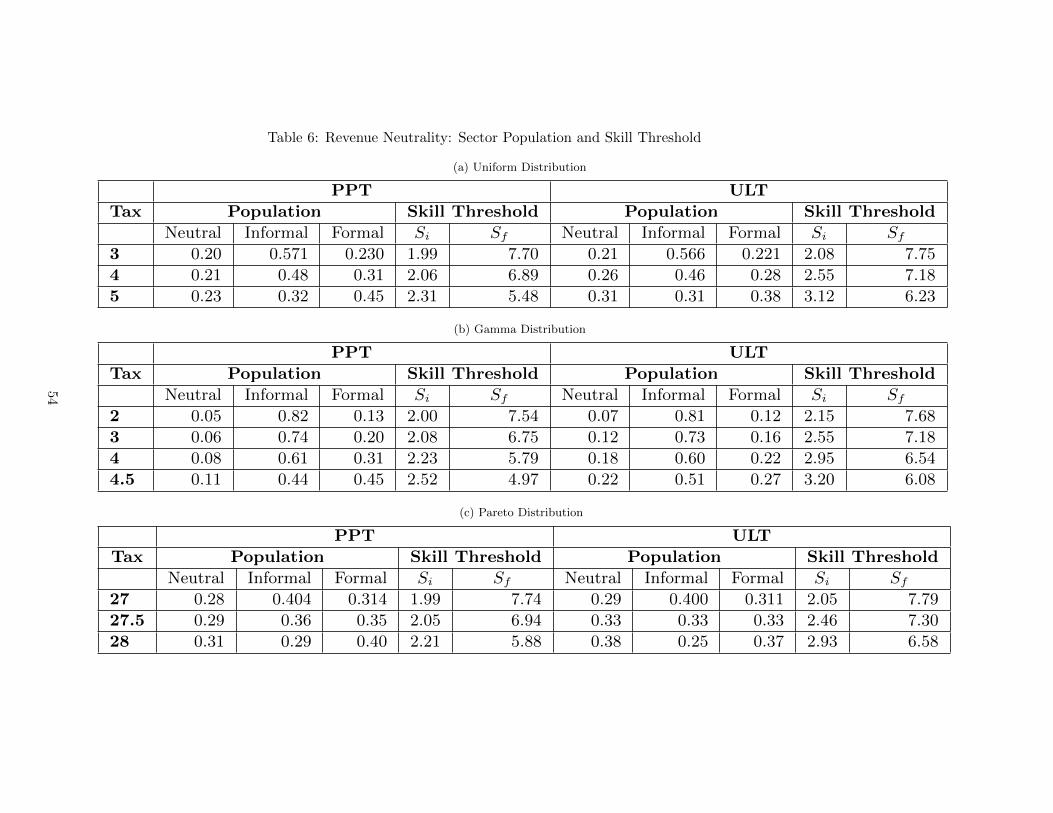
Table 6: Revenue Neutrality: Sector Population and Skill Threshold
(a) Uniform Distribution
PPT ULT
Tax Population Skill Threshold Population Skill Threshold
Neutral Informal Formal Si Sf Neutral Informal Formal Si Sf3 0.20 0.571 0.230 1.99 7.70 0.21 0.566 0.221 2.08 7.75
4 0.21 0.48 0.31 2.06 6.89 0.26 0.46 0.28 2.55 7.18
5 0.23 0.32 0.45 2.31 5.48 0.31 0.31 0.38 3.12 6.23
(b) Gamma Distribution
PPT ULT
Tax Population Skill Threshold Population Skill Threshold
Neutral Informal Formal Si Sf Neutral Informal Formal Si Sf2 0.05 0.82 0.13 2.00 7.54 0.07 0.81 0.12 2.15 7.68
3 0.06 0.74 0.20 2.08 6.75 0.12 0.73 0.16 2.55 7.18
4 0.08 0.61 0.31 2.23 5.79 0.18 0.60 0.22 2.95 6.54
4.5 0.11 0.44 0.45 2.52 4.97 0.22 0.51 0.27 3.20 6.08
(c) Pareto Distribution
PPT ULT
Tax Population Skill Threshold Population Skill Threshold
Neutral Informal Formal Si Sf Neutral Informal Formal Si Sf27 0.28 0.404 0.314 1.99 7.74 0.29 0.400 0.311 2.05 7.79
27.5 0.29 0.36 0.35 2.05 6.94 0.33 0.33 0.33 2.46 7.30
28 0.31 0.29 0.40 2.21 5.88 0.38 0.25 0.37 2.93 6.58
54
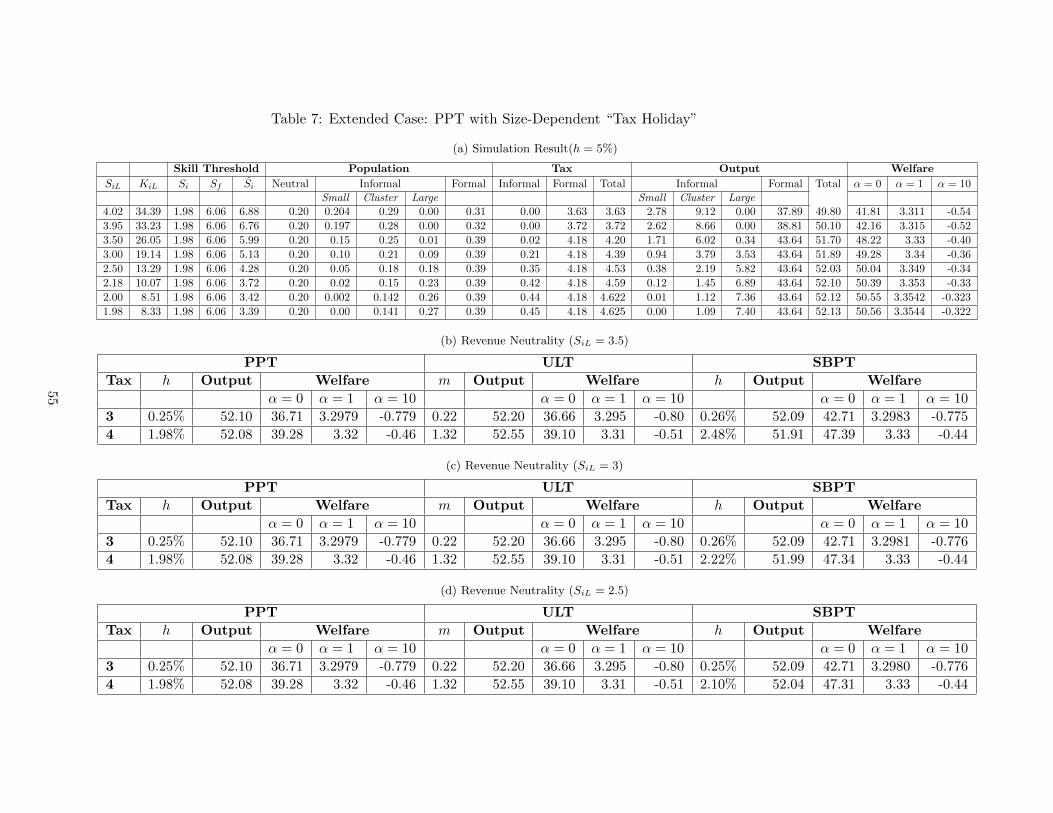
Table 7: Extended Case: PPT with Size-Dependent “Tax Holiday”
(a) Simulation Result(h = 5%)
Skill Threshold Population Tax Output Welfare
SiL KiL Si Sf Si Neutral Informal Formal Informal Formal Total Informal Formal Total α = 0 α = 1 α = 10Small Cluster Large Small Cluster Large
4.02 34.39 1.98 6.06 6.88 0.20 0.204 0.29 0.00 0.31 0.00 3.63 3.63 2.78 9.12 0.00 37.89 49.80 41.81 3.311 -0.54
3.95 33.23 1.98 6.06 6.76 0.20 0.197 0.28 0.00 0.32 0.00 3.72 3.72 2.62 8.66 0.00 38.81 50.10 42.16 3.315 -0.52
3.50 26.05 1.98 6.06 5.99 0.20 0.15 0.25 0.01 0.39 0.02 4.18 4.20 1.71 6.02 0.34 43.64 51.70 48.22 3.33 -0.40
3.00 19.14 1.98 6.06 5.13 0.20 0.10 0.21 0.09 0.39 0.21 4.18 4.39 0.94 3.79 3.53 43.64 51.89 49.28 3.34 -0.36
2.50 13.29 1.98 6.06 4.28 0.20 0.05 0.18 0.18 0.39 0.35 4.18 4.53 0.38 2.19 5.82 43.64 52.03 50.04 3.349 -0.34
2.18 10.07 1.98 6.06 3.72 0.20 0.02 0.15 0.23 0.39 0.42 4.18 4.59 0.12 1.45 6.89 43.64 52.10 50.39 3.353 -0.33
2.00 8.51 1.98 6.06 3.42 0.20 0.002 0.142 0.26 0.39 0.44 4.18 4.622 0.01 1.12 7.36 43.64 52.12 50.55 3.3542 -0.323
1.98 8.33 1.98 6.06 3.39 0.20 0.00 0.141 0.27 0.39 0.45 4.18 4.625 0.00 1.09 7.40 43.64 52.13 50.56 3.3544 -0.322
(b) Revenue Neutrality (SiL = 3.5)
PPT ULT SBPT
Tax h Output Welfare m Output Welfare h Output Welfare
α = 0 α = 1 α = 10 α = 0 α = 1 α = 10 α = 0 α = 1 α = 10
3 0.25% 52.10 36.71 3.2979 -0.779 0.22 52.20 36.66 3.295 -0.80 0.26% 52.09 42.71 3.2983 -0.775
4 1.98% 52.08 39.28 3.32 -0.46 1.32 52.55 39.10 3.31 -0.51 2.48% 51.91 47.39 3.33 -0.44
(c) Revenue Neutrality (SiL = 3)
PPT ULT SBPT
Tax h Output Welfare m Output Welfare h Output Welfare
α = 0 α = 1 α = 10 α = 0 α = 1 α = 10 α = 0 α = 1 α = 10
3 0.25% 52.10 36.71 3.2979 -0.779 0.22 52.20 36.66 3.295 -0.80 0.26% 52.09 42.71 3.2981 -0.776
4 1.98% 52.08 39.28 3.32 -0.46 1.32 52.55 39.10 3.31 -0.51 2.22% 51.99 47.34 3.33 -0.44
(d) Revenue Neutrality (SiL = 2.5)
PPT ULT SBPT
Tax h Output Welfare m Output Welfare h Output Welfare
α = 0 α = 1 α = 10 α = 0 α = 1 α = 10 α = 0 α = 1 α = 10
3 0.25% 52.10 36.71 3.2979 -0.779 0.22 52.20 36.66 3.295 -0.80 0.25% 52.09 42.71 3.2980 -0.776
4 1.98% 52.08 39.28 3.32 -0.46 1.32 52.55 39.10 3.31 -0.51 2.10% 52.04 47.31 3.33 -0.44
55
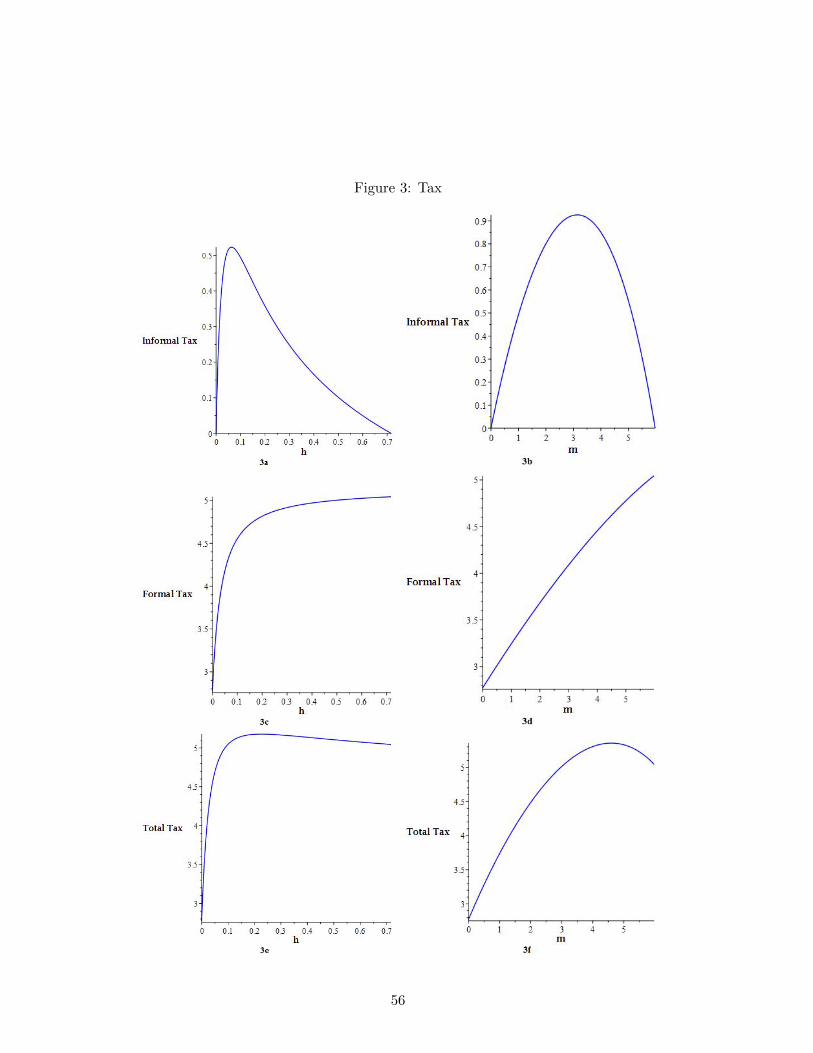
Figure 3: Tax
56
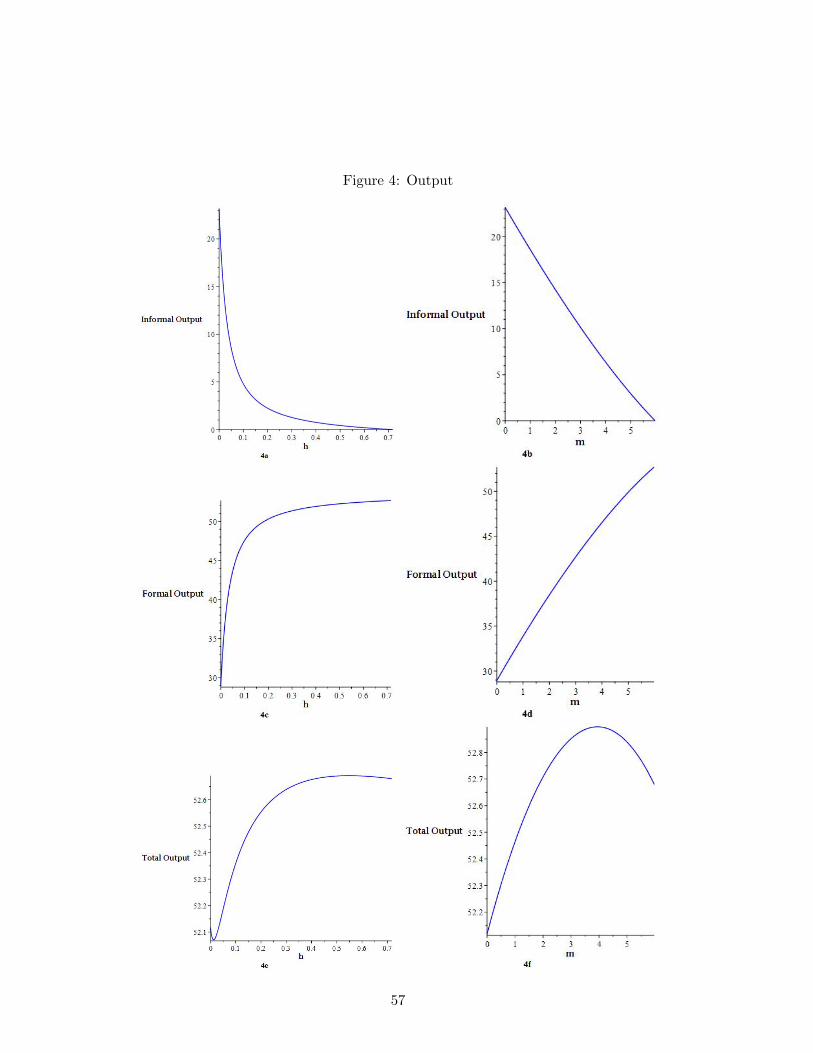
Figure 4: Output
57
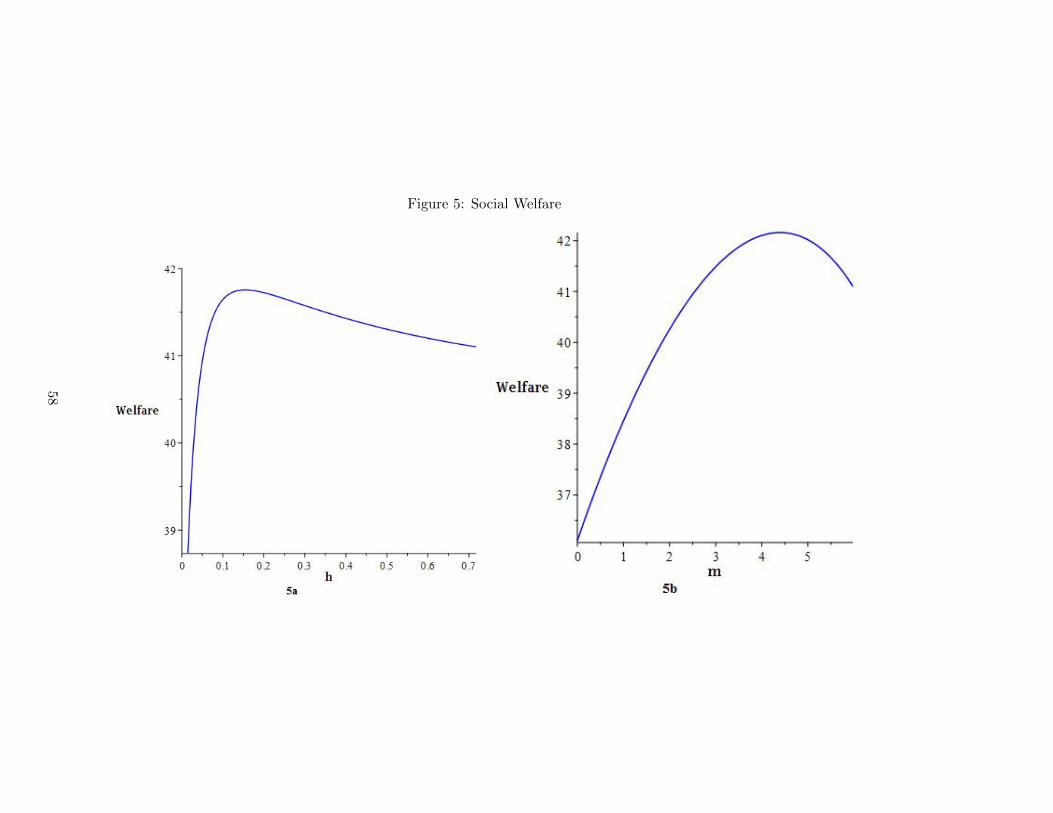
Figure 5: Social Welfare
58