Embed Size (px)
Citation preview

ISSN: 2289-4519 Page 162
International Journal of Accounting & Business Management
www.ftms.edu.my/journals/index.php/journals/ijabm
Vol. 3 (No.1), April, 2015
ISSN: 2289-4519 DOI: 10.24924/ijabm/2015.04/v3.iss1/162.186
This work is licensed under a
Creative Commons Attribution 4.0 International License.
Research Paper
The Influence of Transformational Leadership in Creating a Learning Organisation
Wong Pui Teng
School of Accounting and Business Management FTMS College, Malaysia [email protected]
Zubair Hassan
School of Accounting and Business Management FTMS College, Malaysia
Abstract
This study seeks to establish the influence of transformational leadership behaviour on learning organisation. For this purpose Avilio and Bass (2000) transformational leadership questionnaire is adopted and Peter Senge’s learning organisation dimensional questionnaire is used. The independent variables to measure transformational leadership include; Idealised behaviour, idealized attributes, inspirational motivation, intellectual stimulation and individual consideration. The dependent variable used to measure learning organisation includes mental models, personal mastery, shared vision, team learning and system thinking. The study adopted descriptive and explanatory research design. Also this study used a cross sectional survey methods using a survey questionnaires containing 56 items with Likert Scale (Disagree -1 and 5 for Agree). The sample of 100 employees from Amway in Kuala Lumpur were selected using simple probability sampling. The collected data was analysed using descriptive means and regression via SPSS.21. This study found that most of the transformational leadership behaviour is significant and positively influences learning organisation except System Thinking of learning organisation. Though this study included only two organisations, future studies may include larger sample size by conducting the research on more privaye sector organisation, particular only one sector. The future studies may compare differences based on socio-demographic profile and might examine the similarities of national culture in relation with Malaysia.
Key Terms: Learning Organisation, Transformational Leadership, Malaysia

ISSN: 2289-4519 Page 163
1. Introduction Many researches that have been done related to leadership and learning organisation has shown that the increased of significance of the influence of leadership in creating a learning organisation. One of the pioneering study shows that leaders who were successful in carrying out the concept of learning organisation employed it as the solution to a business problem, while devoting attention and time to the change (Johnson, 2002). Another exploratory study, hypothesized that higher characteristics of Learning Organisation would be connected with a more transformational style of leadership that influences followers (Schiena, et al., 2013). The popularity of leadership role in creating a learning organisation were widely researched and discussed in most of the developed countries, in particular Europe and United States. More recently similar studies were done in Malaysian context. One of the studies that are well cited is Watkins & Mersick (1993). In case of Malaysia, similar studies were conducted by Nazari & Pihie(2012). Also Kumar and Idris (2006) showing the importance of leadership in creating and sustaining a learning organization. It is worthy to note that most of the research that has taken place in Malaysia mainly focus on education sector. Therefore there is much room to fill the research gap by conducting this research on corporate business sector than education industry. 1.1. Research Rational The firm has to learn how to adapt to transformations in the variety in its customers and employees in addition to the ever-changing requests for social responsibility (Bass, 2000). Leaders are exhausted of always “managing change,” still so hardly any organizations do it properly (Gebler, 2013). Leaders who have performed their whole occupations in a surrounding that is in a control and command manner acknowledge that these types of transitions are extremely tough for them (Gebler, 2013). Shifting the management style consider not urgent things to carry out even if it continues to be number one on the list of extremely vital thing to perform as in the flow of a day of firefighting and crisis management (Gebler, 2013). A firm should grow into more able, responsive, and flexible of adjusting to transformation as means to make sure its existence in the globalisation generation (Hamzah, et al., 2011). Society of twenty-first century sets a greater importance than in the former times on each firm and person’s potential to commit to continuous learning, so that they are capable to take action on the fast alterations around and nearby them (Hamzah, et al., 2011). Companies progress very slowly, stagnate, and fail to keep their way as with lacking of leadership (Mills, 2005). Researchers urged leaders in organization to act in consistent with strategies of learning organisation for improvement of the learning on individual, group and organizational leads to performance promotion (Najafi, 2011). In the development of a learning organisation, leaders represent a main role and leadership is vital to form learning in the organisation (Haley and Lazouskas, n.d.). For managers and senior executives, it is crucial for them to identify and construct on the connections between learning organisation and leadership (Somerville and McConnell-Imbriotis, 2004 cited in Haley and Lazouskas, n.d.). The learning organisations’ challenges need the manager’s prospect that is objective and in addition the commitment and vision of leader (Haley and Lazouskas, n.d.). This means that some of the leadership style or behaviour could be more appropriate to create and sustain learning culture. A common characteristic that are attributed to learning organisation is ‘continuous’ learning or adaptation to the changing environment (Senge, 1996; Watkins and Mersick, 2004; Pedler, 1991; Garvin 1993). One of the key leadership behaviour that gained much attention in past was transformational leadership, where it they found four attributes that are much more closely linked with learning organisation and encouraged continuous learning such as charismatic and idealised influences and inspirational motivation (Hassan, 2014).

ISSN: 2289-4519 Page 164
Due to the limited research done on this topic that focuses on transformational leadership in relations with learning organization developing countries, in particular Malaysia, this research would focuses on examining the influence of transformational leadership on creating a learning organization in private business sector of Malaysia. 1.2 Research Aims and Objectives/Research Question The aim of this research is to identify the impact of transformational leadership on practice of learning organisation in Malaysian context. Therefore the following research objectives were formulated to test the theoretical framework of transformational leadership and its link on learning organisation (five discipline of Seng’s learning organisation):
1) To determine the extent of learning organisation and transformational leadership
practices
2) To examine the influence of transformational leadership in creating a learning
organisation.
This follows two research questions
1) What is the extent of learning organisation and transformational leadership
practices?
2) Has transformational leadership positively influences in creating a learning
organisation?
This paper is organised as follows: first part is discussed above. Second part is the theoretical framework and research hypothesis development. Third part discusses the research design and methodology, data collection procedures and process. Fourth part presents the results and discussion. Final part is conclusion and recommendation, and implication for further research
2. Literature Review 2.1. Definition of Leadership and Learning Organisation Bennis (1984, p.19) argued that managers are persons who perform the things right; leaders are persons who perform the right things. Bethel (1990, p.6) came up with a definition of leadership which is more specific as just “influencing others”. Locke et al. (1991, p.2 cited in Johnson, 2002, p.242) defined leadership as a process of inducing others to perform something in the direction to achieve a common goal. Yet, Senge (1996, p.36) argued that leadership only takes place when leaders are truly committed to deep transformation of companies and themselves to achieve sustainable competitive advantage. Learning organisation is one “where persons produce the outcomes that they really hope for by continuously increase their capacity, where the patterns of thinking that are expansive and new are developed, where collective aim is set free, and where persons are always learning how to learn with each other” (Senge, 1990, p.7). The learning company is defined by Pedlar et al. (1991, p.1) as an “organisation that helps the learning of each and every of its members and have itself changes endlessly for the purpose of fulfilling its strategic aims”. On the other hand Watkins and Marsick (1993) defined learning organisation as one that learns endlessly and changes itself. Similarly Garvin (1993, p. 80) argued that learning organisation is one expert at having the knowledge created, acquired, and transferred, and at modifying its behaviour to reveal insights and knowledge that are new. Main insights given in this definition are behavior

ISSN: 2289-4519 Page 165
modification and knowledge transfer. The definition of the leaning organisation from Marquardt (1996, p.80) as one which learns jointly and strongly and is endlessly changing itself to have the knowledge to be collected, managed, and employed more thoroughly for the success of the corporate.
2.2 Leadership Theories/Models One of the pioneering study on leadership was developed by Kurt Lewin. This study introduced three popular types of leadership behaviour, which are autocratic, democratic and laissez fair. The well-known Lewin, Lippitt, and White (1939) research of leadership-generated group climates, which analysed the effects of laissez faire, democratic, and autocratic leaders on the outcomes and actions of follower, gives a sample that is good of such study in a controlled laboratory setting (Zaccaro and Horn, 2003). Another popular theory on leadership is introduced by Hersey-Blanchard . They emphasis on attributes of leaders that enables them to adjust into various situation. As firstly suggested (Hersey & Blanchard, 1972; 1982 cited in Thompson and Vecchio, 2009), Situational Leadership Theory forecast that most favourable supervision style (definite by particular mixtures of leader task-focus and leader relationship-focus) can be established for specified levels of maturity of subordinate (definite as the compound of subordinate commitment and competence) (Thompson and Vecchio, 2009). However in 1973, Adair’s action centered leadership emerged. As stated by Adair, an action-centred leader should direct the task to be completed (task structuring), support and reassess the individual’s performance, co-ordinate and fostered team work (Bolden, et al., 2003). However some criticised this model for its weakness in implementing such leadership as both persons and task are offered together as one consider on how to exert it (Blake, 1982). Much later transformational and transactional leadership model, referred to in more contemporary publishing as the “full range leadership model” (Bass and Avolio, 1997 cited in Obiwuru et al., 2011). Organisations that are able, prepare, and inclined to transform are more transformational than transactional in relations to the new leadership model (Bass, 2000). One study conducted in the Nepal and India pharmaceutical industries revealed that characteristics of Learning Organisation and Transformational leadership were strongly connected (Schiena, et al., 2013). Solely aggregate measures were employed, and moreover, in the study, Transactional leadership was not employed (Schiena, et al., 2013). More recently, Steven Covey’s 7 habits of highly effective leaders become very popular and many sees that these attributes are more important and relevant to their companies and such habits can be practiced and learned. Also many perceived that such habits could be the answer for transforming and strategising the organisation. They stand for the internalisation of principles that are correct upon which long-lasting victory(Covey, n.d.). As suggested by Covey, the seven habits that can be learned to enhance manager’s effectiveness on interpersonal and personal level (Buhler, 1997). 2.3 Learning Organisation Theories/Models One of the key theory that were found on organizational learning was singl-loop and double loop learning (Argyris, 1976). It is dissimilar of double-loop learning than single-loop learning which contains enhancing efficiency and transforming measures to acquire objectives that are formed (that is, “doing things right”) (Cartwright, 2002). Transforming the objectives themselves (that is, “doing the right things”) is covered by double-loop learning (Cartwright, 2002). One of the main purposes of leadership education is to affect the behaviour and thinking of persons to develop into leaders that are more effective in transform organisation (Cartwright, 2002). The aim of double-loop learning is transformation too; the transformation of seriously kept perspectives of the world which we act and work (Cartwright, 2002).

ISSN: 2289-4519 Page 166
The design of Senge’s five disciplines is dependent on the hypothesis that organisational members always plan to grow their capacity to have the intended outcomes produced, to establish models of thinking that are new, and to learn how to learn in a mutual manner (Torlak, 2004). To make sure that these goals they have to employ at various organisational levels with five disciplines, which govern their firms’ behaviour (Torlak, 2004). As suggested by Senge (1990), leaders require being accountable for learning by building learning organizations. The leader’s role in the creation of a Learning Organisation has been distinctly stressed by Senge and presented different functions of leaders in this procedure in his essay, for example, constructing a Shared Vision, emerging and testing Mental Models, and establishing and promoting Systems Thinking (Schiena, et al., 2013). Few years later, Garvin (1993) sought five activities that are closely attributed to a learning organisation. He emphasis on experimentation with new methods, systematic problem solving, learning from the best practices and experiences of others, transferring knowledge efficiently and swiftly all over the firm, and learning from their previous history and personal experience (Garvin, 1993). Each one is partnered by a specific behaviour pattern, tool kit, and mind-set facilitating learning culture within the organisation (Garvin, 1993). By evaluating performance on every building block, the areas requiring enhancement are identified, transferring the firm that a lot closer to the ideal of learning organisation (Garvin, Edmondson and Gino, 2008). However it is worthy to note that with the absence of a supportive environment and climate, leaders by themselves will no way be capable to form the learning organisation (Melhem, 2011). It was evident in past that post audit actions, experimentation, and learning processes cannot function to a learning organisation without proper supportive environment and effective transformational leadership (Melhem, 2011). In the same year Watkins and Marsick (1993) found and established seven (7) actions that are imperative to become a learning organisation. This include promoting inquiry and dialogue, create continuous learning opportunities, empower individuals toward a collective vision, encourage collaboration and team learning, form systems to capture and share learning, connect the firm to its environment, provide strategic leadership for learning (Davis and Daley, 2008). The range to which a company “learns’ is considered to be associated to both cultural elements (involving shared professional values, vision, and leadership) and structural elements (processes and mechanisms that permit companies to systematically collect, disseminate, and employ information) (Rowe, 2010). Few years later Pedler (1995) extracted eleven (11) characteristics that are attributed to a learning organisation from studies carried out by Senge, Revans, Argyris and Schon (Tarrini, 2004). The ideal Learning Organisation would display all these characteristics and that every firm would understand and join together the Characteristics in their particular method as proposed by Pedler(1995). In their initial researches, Pedler et al. (1991) have revealed that learning is neither an independent factor nor an individual procedure, and that learning organisations owns organisational factors, individuals, managerial tasks, procedures and more. Based on all these past theoretical frameworks, this research considered Transformational Leadership and five disciplines of a learning organisation for its relevancy and simplicity to implement in an organisation.
2.4 Conceptual Framework

ISSN: 2289-4519 Page 167
Figure 2 – Conceptual Framework of Leadership and Learning Organisation According to Schiena, et al. (2013), each dimensions of Transformational leadership were significantly and positively connected with at least one attribute of Learning Organisation and vice-versa by excluding of the behavioural element of Idealised Influence (Schiena, et al., 2013). The particular pattern of relations proposes that factors of Transformational leadership might lead to the growth of Learning Organisation attributes in diverse ways (Schiena, et al., 2013). Similarly Hamzah, et al. (2011), it had revealed that there is a positive, significant, moderate relationship between transformational leadership and the growth of learning organizations. Individualised Attributes and Learning Organisation One of the attribute of Transformational leadership, the Individualised Consideration and Idealised Influence (Attribute) seem to be the most vital elements fostering a Learning Organisation (Sachien et al, 2013). This indicates that giving consideration and attention to every member of the team and ‘charisma’ is fundamental to change a company into a more adaptive, flexible and to become a learning organisation (Schiena, et al., 2013). The research found that Individualised Consideration was strongly linked with four of the five attributes of Learning Organisation(Schiena, et al., 2013). Inspirational Motivation and Learning Organisation To create and sustain a learning organization, leaders should assisted by consultation with colleagues, must articulate what is missing and the changes that are required to become a learning organization. Inspirational leaders mostly shared a vision about the style of leadership that is needed (Bass, 2000). They emphasis on utilising mentoring and coaching. This means giving and receiving feedback, open communication along with listening to build trust are worthy to create and sustain a learning organisation (Bass, 2000). In Malaysian context, Hamzah, et al. (2011) found that inspirational motivation has a significant impact on learning organisation. It was found that inspiration motivation coupled with other leadership practices increases employee commitment enabling them to achieve the visions and missions of the
Transformational
Leadership
Learning
Organisation
Transformational Leadership
Idealised Influence Attributed
Idealised Influence Behaviour
Inspirational Motivation
Intellectual Stimulation
Individualised Consideration
Mental Models
Shared Vision
Team Learning
Systems Thinking
Personal Mastery

ISSN: 2289-4519 Page 168
organisation and accomplishing them in a consistent manner (Hamzah, et al., 2011). Also Schiena, et al. (2013) indicated that Mental Models of Learning Organisation characteristics were positively influenced by Inspirational Motivation. Intellectual Stimulation and Learning Organisation Intellectual stimulation of leadership behaviour encourage employees to take the whole organisation when they make a decision. This means that intellectual stimulation has a direct impact on ‘Systems Thinking’ of learning organisation (Schiena, et al, 2013). As an outcome, knowledge sharing (Intellectual Stimulation) and Individualised Consideration regarded to be more necessary for constructing such a complex, mental illustration of the firm to become a learning organisation (Schiena, et al., 2013). Individualised Consideration and Learning Organisation Individualised considerate leaders treat each subordinate or colleague as having different developmental needs (Bass, 2000). They give and accept feedback as part of the learning process. They provide mentoring and coaching (Bass, 2000). Individualized considerate leaders made a significant connection with Personal Mastery aspects of learning organisation (Schiena et al, 2013). The connection between Individualised Consideration and Team Learning was specifically strong and it is believed to be vital for a mission’s victory, as it warrants the recognition of lessons learned and knowledge capturing with the team members from an intervention as means to ensure knowledge sharing with the team members (Schiena, et al., 2013).
3. Research Design and Methodology Primarily this study used both descriptive and causal research design to collect data. To collect data a survey with 56 items in English were distributed, which is the most common secondary language used in Malaysian. Managers were discussed and confirmed by managers that the use of English would be fine before the questionnaires were distributed among the staff. Two sets of questionnaire are being used in this study. The first set is Transformational Leadership Questionnaire from Multi-factor Leadership Questionnaire (MLQ) by Avolio and Bass (1997 ) as to evaluate the leadership style of manager or supervisor based on the transformational leadership dimensions (Schiena, et al., 2013). The total items for this set of questionnaire is 20 and the scales include Idealised Influence(Attributes) with 4 items, Idealised Influence (Behaviour) with 4 items, Inspirational Motivation with 4 items, Intellectual Stimulation with 4 items, and Individualised Consideration with 4 items. The second set is the Questionnaire for Learning Organisation (QLO) with the total of 36 items as stated by the five disciplines of Peter Senge where respondents were inquired to rate items in keeping with their personal work circumstance (Oudejans, et al., 2009). The scales learning organisation consist of Personal Mastery (PM with 9 items), Mental Models (MM with 4 items), Shared Vision (SV with 5 items), Team Learning (TL with 13 items), and Systems Thinking (ST with 5 items). Both Transformational Leadership and Learning Organisation questionnaires used five-point Likert scale, ranging from 1 (Strongly Disagree) to 5 (Strongly agree). Five-point Likert scale was chosen for this research because the only main purpose to apply a Likert Scale is to enable easily to code the data and present the information consistently. By allocating codes to the responses with the result that a higher score indicates higher degree of agreement (Colosi, 2006). 3.1. Sample size and Sampling method

ISSN: 2289-4519 Page 169
This study was mainly focuses on the Amway company, the population involved was mainly professionals and secretaries from Amway that are located in Kuala Lumpur, Malaysia with the total collected sample of 100 sets. The total target population is 331 (Securities, 2010). The collected samples are 100 with the response rate of 100%. This means approximately 21 (twenty one) percent of employees were selected using simple random probability sampling. The names of every employee were put together in a bowl and took a draw. In this draw, every 4th name was taken into consideration until 100th employee was given the survey form to be completed. In this way, researcher tried to ensure every employee in the organisation has an equal chance of being participated in the survey to avoid any personal biasness. It was chosen because it enhanced survey accuracy, it gives the benefit that is commonly logistically simpler to have a population divided into strata and so prepare to survey within every stratum (Brown, 2007 cited in Salkind and Rasmussen, 2007). 3. 2. Ethical Considerations Before the questionnaire was being distributed to the respected companies, there are well-informed by the researcher as to conduct a questionnaire survey with the employees of their companies. After the permission was granted by the respected companies, a research letter by affiliated institution was delivered to the selected companies as to further confirm with them the conduct of the survey and it is strictly for academic purpose. Attached with the questionnaire is the participant consent form where each participant was asked to sign as they are agreed to take part in this research voluntarily. The collected data are kept confidential that do not contained any specific information except some demographic questions such as name, age group and so on. Each company has given a permission letter allowing this research to be conducted at their companies.
4. Results and Discussion In this research, total of 100 questionnaires were distributed to the respected companies to conduct the study. Analysis of the results is being demonstrated below as to create further understanding of the study. In this section, few important analysis were carried out: Descriptive Analysis, Normality Test, Reliability Test, Validity test, Descriptive Mean, Correlation, and Regression. 4.1. Demographic Analysis The study engaged 100 employees from Amway, Malaysia. Majority of the respondents were female 51%, male 49%. Most of the employees are aged between 36-45 years constituted 37% followed by aged group 26-35 years with 34%. 91% of staffs were professional level staff while 9% only represents secretary level staff. The detailed table 1 illustrated the information about respondents.
Table 1: Socio-demographic Profile of the Participants
Variable
Frequency Percent Valid Percent
Cumulative Percent
Age Group 19-25 23 23.0 23.0 23.0 26-35 34 34.0 34.0 57.0 36-45 37 37.0 37.0 94.0 46-56 6 6.0 6.0 100.0
Gender Female 51 51.0 51.0 51.0 Male 49 49.0 49.0 100.0
Race Malay 39 39.0 39.0 39.0 Chinese 61 61.0 61.0 100.0

ISSN: 2289-4519 Page 170
Nationality Malaysian 100 100.0 100.0 100.0 Occupation Professional 91 91.0 91.0 91.0
Secretary 9 9.0 9.0 100.0
4.2. Normality of data distribution There are two popular aspects that researchers look in examining normality of data distribution (Park 2008). Kurtosis refers to the distribution’s peakedness while skewness refers to the symmetry of the distribution, in which distributions of left-skewed possess a long tail point to the left and distributions of right-skewed possess a long tail indicating to the right (Pole and Bondy, 2010 cited in Salkind, 2010). As refer to Table 2 below, the kurtosis statistics of this data set is between - 0.540 and 0.940, which it is in a range that is acceptable between -1 to +1, proposing that this data set is normal (Hassan and Yau, 2013). The skewness statistics of this data set is between -0.652 and 0.469, proposing that this group settles between -1 to +1. This signals that the statistics of this skewness is in a range that is acceptable (Hassan and Yau, 2013)
Table 2 - Descriptive Statistics
N Mean Std. Deviation Skewness Kurtosis
Statistic Statistic Statistic Statistic Std. Error Statistic Std. Error
Q1 100 3.49 .674 -.367 .241 -.194 .478 Q2 100 3.49 .659 .146 .241 -.168 .478 Q3 100 3.56 .656 -.335 .241 -.054 .478 Q4 100 3.53 .627 .010 .241 -.244 .478 Q5 100 3.50 .704 -.178 .241 -.191 .478 Q6 100 3.49 .643 .038 .241 -.197 .478 Q7 100 3.56 .608 -.509 .241 -.106 .478 Q8 100 3.50 .674 .000 .241 -.171 .478 Q9 100 3.46 .702 -.034 .241 -.200 .478
Q10 100 3.50 .689 -.284 .241 -.177 .478 Q11 100 3.56 .686 -.316 .241 -.065 .478 Q12 100 3.53 .703 -.287 .241 -.141 .478 Q13 100 3.46 .593 .009 .241 -.411 .478 Q14 100 3.57 .728 -.248 .241 -.144 .478 Q15 100 3.58 .699 .071 .241 -.231 .478 Q16 100 3.49 .703 -.142 .241 -.199 .478 Q17 100 3.42 .781 .012 .241 -.376 .478 Q18 100 3.49 .703 .036 .241 -.189 .478 Q19 100 3.58 .699 -.473 .241 .028 .478 Q20 100 3.52 .703 -.250 .241 -.162 .478 Q21 100 3.57 .685 -.162 .241 -.113 .478 Q22 100 3.55 .716 .074 .241 -.236 .478 Q23 100 3.56 .795 -.139 .241 -.371 .478 Q24 100 3.55 .757 -.030 .241 -.296 .478 Q25 100 3.68 .723 -.573 .241 .292 .478 Q26 100 3.66 .655 .045 .241 -.238 .478 Q27 100 3.58 .669 .113 .241 -.234 .478 Q28 100 3.52 .772 -.001 .241 -.336 .478 Q29 100 3.57 .714 .003 .241 -.218 .478 Q30 100 3.46 .731 -.652 .241 .516 .478 Q31 100 3.57 .700 -.255 .241 -.090 .478 Q32 100 3.52 .745 -.444 .241 .617 .478 Q33 100 3.44 .845 -.475 .241 .302 .478 Q34 100 3.49 .772 -.302 .241 -.352 .478 Q35 100 3.61 .709 .034 .241 -.246 .478 Q36 100 3.43 .714 -.173 .241 -.287 .478 Q37 100 3.43 .714 -.173 .241 -.287 .478 Q38 100 3.49 .893 -.360 .241 .080 .478 Q39 100 3.39 .634 -.303 .241 -.432 .478 Q40 100 3.56 .729 -.213 .241 -.169 .478 Q41 100 3.36 .798 -.380 .241 -.121 .478

ISSN: 2289-4519 Page 171
Q42 100 3.48 .745 -.304 .241 -.302 .478 Q43 100 3.55 .716 -.600 .241 .940 .478 Q44 100 3.56 .671 -.632 .241 .060 .478 Q45 100 3.43 .714 -.003 .241 -.218 .478 Q46 100 3.48 .835 -.148 .241 -.540 .478 Q47 100 3.42 .589 .469 .241 -.162 .478 Q48 100 3.35 .672 -.348 .241 .741 .478 Q49 100 3.39 .764 -.382 .241 .175 .478 Q50 100 3.33 .697 -.372 .241 .475 .478 Q51 100 3.50 .704 -.178 .241 -.191 .478 Q52 100 3.56 .743 -.135 .241 -.227 .478 Q53 100 3.44 .833 -.449 .241 .406 .478 Q54 100 3.47 .674 .111 .241 -.152 .478 Q55 100 3.62 .736 -.038 .241 -.259 .478 Q56 100 3.81 .837 -.365 .241 .185 .478
Valid N (listwise) 100
Source: SPSS generated data
4.3. Scale Reliability Lee Cronbach created Alpha as to give a rate of the internal consistency of a scale or test; it is demonstrated as a digit between 0 and 1 (Tavakol and Dennick, 2011). The bond between the observed scores and true score must be powerful (Multon and Coleman, 2010 cited in Salkind, 2010). Therefore, a .70 coefficient alpha for a test signifies that 30% of the variance in scores is not significant and random (Multon and Coleman, 2010 cited in Salkind, 2010).
Table 3 – Reliability Statistics for the whole scale
Pilot Test (sample of 20) Actual Sample of 100
Cronbahc’s Alpha 0.954 0.974
Cronbach's Alpha Based on Standardized Items 0.954 0.974
Source: SPSS generated
Table 3 is the result of the Reliability Statistics for this research with all the 56 items. The Cronbach's Alpha for it is 0.974, which is categorised as high reliability coefficient as determined by Multon and Coleman (2010 cited in Salkind, 2010).
Table 4: Reliability Test
Dimensions Cronbach's
Alpha
Number of
Items
Transformational Leadership
Idealised Influence (Attributed) 0.836 4
Idealised Influence (Behaviour) 0.768 4
Inspirational Motivation 0.779 4
Intellectual Stimulation 0.770 4
Individualised Consideration 0.814 4
Learning Organisation
Personal Mastery 0.892 9

ISSN: 2289-4519 Page 172
Mental Models 0.816 4
Shared Vision 0.819 5
Team Learning 0.918 13
Systems Thinking 0.758 5
Source: SPSS generated
As refer to Table 4, among all the dimensions of Transformational Leadership, Idealised Influence (Attributed) is with the highest Cronbach's Alpha of 0.836, followed Individualised Consideration with the Cronbach's Alpha of 0.814 while Idealised Influence (Behaviour) is the lowest with 0.768 which is an adequate or good reliability coefficient (Multon and Coleman, 2010 cited in Salkind, 2010). As shown in Table 4, one of the Learning Organisation’s dimensions, Team Learning is with the highest Cronbach's Alpha of 0.918 indicating the scale is highly reliable (Multon and Coleman, 2010 cited in Salkind, 2010), followed by Personal Mastery with the Cronbach's Alpha of 0.892 and then Systems Thinking is with the lowest Cronbach's Alpha of 0.758 which is considered as adequate or good reliability coefficient (Multon and Coleman, 2010 cited in Salkind, 2010). Overall, all the dimensions of Transformational Leadership and Learning Organisation are in the range of 0.70 to 0.95 which the range of alpha is in the acceptable values (Tavakol and Dennick , 2011).
4.4. Factor Analysis
The goal of the data extraction is to lessen a huge number of items into factors (Williams, Onsman and Brown, 2010). Few measures are accessible to investigators as means to simplify the factor solutions and to create scale unidimensionality (Williams, Onsman and Brown, 2010). Numerous extraction methods and rules exist involving the Scree test, Kaiser’s criteria (eigenvalue ˃1 rule), parallel analysis, and cumulative percent of variance extracted (Williams, et al, 2010). According to the extraction table generated from SPSS, Question 52 has the highest extraction value of 0.838 and Question 22 has the lowest extraction value of 0.570.
Table 5 – Total Variance Explained
Component Initial Eigenvalues Extraction Sums of Squared Loadings
Total % of Variance Cumulative % Total % of Variance Cumulative %
1 23.479 41.926 41.926 23.479 41.926 41.926
2 3.184 5.685 47.611 3.184 5.685 47.611
3 2.113 3.772 51.384 2.113 3.772 51.384
4 1.848 3.299 54.683 1.848 3.299 54.683
5 1.610 2.874 57.557 1.610 2.874 57.557
6 1.549 2.767 60.324 1.549 2.767 60.324
7 1.334 2.382 62.706 1.334 2.382 62.706
8 1.283 2.292 64.997 1.283 2.292 64.997
9 1.209 2.158 67.156 1.209 2.158 67.156
10 1.157 2.066 69.221 1.157 2.066 69.221
11 1.094 1.954 71.175 1.094 1.954 71.175

ISSN: 2289-4519 Page 173
12 1.051 1.877 73.052 1.051 1.877 73.052
Source: SPSS generated
As shown in Table 5, from the initial eigenvalues, the % of variance for the first component is 41.926%, the second component is 5.685%, and the third component is with 3.772%. The % of variance for the last component is with 1.877, and cumulative % of 73.052. Therefore, total of 12 components possess an eigenvalue ˃1 rule (Williams et al, 2010). Also this indicates that scale is more unidimensional.
4.5. Descriptive Statistics The mean and standard deviation from descriptive statistics are used to analysed the data. The average or mean is the most popular measure of central tendency (Thompson, 2009). The usage of means to explain a dataset must be bounded to ratio and interval level data (Thompson, 2009). The mean is more affected by the allocation of the values than is the median and it is more responsive to outliers (Thompson, 2009).
Table 6 – Descriptive Statistics: Transformational Leadership and Learning Organisation (N=100)
N Minimum Maximum Mean Std. Deviation
Statistic Statistic Statistic Statistic Std. Error Statistic
TL 100 2.0 4.6 3.442 .0507 .5066
SV 100 2.0 4.6 3.490 .0581 .5814
MM 100 2.0 5.0 3.506 .0607 .6074
IC 100 2.0 5.0 3.513 .0579 .5786
IM 100 2.0 5.0 3.514 .0540 .5401
IIA 100 2.0 5.0 3.518 .0536 .5357
IIB 100 2.0 4.5 3.522 .0507 .5074
IS 100 2.0 5.0 3.535 .0529 .5285
ST 100 2.0 5.0 3.580 .0546 .5464
PM 100 2.2 5.0 3.586 .0527 .5271
Source: SPSS generated
Among the five principles of Learning Organisations, the mean statistics of Personal Mastery (PM) is the highest with 3.586 (Std. Deviation=0.5271), which signifies most respondents agreed that Personal Mastery is the most often practices of Learning Organisation. Then it is the Systems Thinking (ST) with the mean statistics of 3.580 (Std. Deviation= 0.5464). Followed by the rest of the principles such as Mental Models (MM) with mean of 3.506 (Std. Deviation=0.6074), Shared Vision (SV) is 3.490 (Std. Deviation=0.5814), and lastly Team Learning (TL) with mean of 3.442 (Std. Deviation=0.5066). In terms of Transformational Leadership, Intellectual Stimulation (IS) is with the highest mean of 3.535 (Std. Deviation= 0. .5285) among all the Transformational Leadership dimensions which indicates that majority of the respondents agreed that this dimension is the most vital and displayed leadership behaviour of Transformational Leadership. Next is the Idealised Influence (Behaviour) (IIB) with 3.522 (Std. Deviation= 0. .5074). Then followed by Idealised Influence (Attributed) (IIA) with mean of 3.518, (Std. Deviation=0.5357), Inspirational Motivation (IM) with mean of 3.514 (Std. Deviation=0.5401). Lastly is the Individualised Consideration (IC) with the mean statistics of 3.513 (Std. Deviation= 0. .5786). 4.6. Correlation Analysis

ISSN: 2289-4519 Page 174
Pearson’s product-moment correlation coefficient is to the most extreme the most standard index of the bivariate relationship or association between two variables (Onwuegbuzie, Daniel and Leech, 2007 cited in Salkind and Rasmussen, 2007). Among all the dimensions of Transformational Leadership, the highest Pearson correlation for this data set is with one of the Learning Organisation dimensions that is between Idealised Influence (Behaviour) (IIB) and Shared Vision (SV) with 0.782, which means that between these two variables, they have the strongest relationship as compared to other variables (Chen and Krauss, 2004 cited in Lewis-Beck, Bryman and Liao, 2004) followed by is Individualised Consideration (IC) and Shared Vision (SV) with the Pearson correlation of 0.768. The correlation between Intellectual Stimulation (IS) with Personal Mastery (PM) is 0.765, followed Intellectual Stimulation (IS) and Shared Vision (SV) with Pearson correlation of 0.755. However, relationship between variables of Idealised Influence (Attributed) (IIA) and Mental Models (MM), has weakest relationship with a correlation of 0.465, followed by Idealised Influence (Attributed) (IIA) and Systems Thinking (ST) with a correlation of 0.507 followed by Idealised Influence (Behaviour) (IIB) and Systems Thinking (ST) with the Pearson correlation of 0.525.
Table 7: Pearson’s Correlation Coefficient of TL* and LO*
PM MM SV TL ST
IIA
Pearson Correlation .611** .465** .674** .593** .507**
Sig. (2-tailed) .000 .000 .000 .000 .000
N 100 100 100 100 100
IIB
Pearson Correlation .739** .575** .782** .683** .525**
Sig. (2-tailed) .000 .000 .000 .000 .000
N 100 100 100 100 100
IM
Pearson Correlation .650** .537** .700** .635** .587**
Sig. (2-tailed) .000 .000 .000 .000 .000
N 100 100 100 100 100
IS
Pearson Correlation .765** .627** .755** .667** .574**
Sig. (2-tailed) .000 .000 .000 .000 .000
N 100 100 100 100 100
IC
Pearson Correlation .745** .647** .768** .694** .543**
Sig. (2-tailed) .000 .000 .000 .000 .000
N 100 100 100 100 100
*TL=transformational leadership *LO= learning organisation
Referring the Table 7 above, it is clearly evident that all the transformational leadership behaviour or styles are significantly associated with dimensions of learning, which includes personal mastery (PM), mental models (MM), shared vision (SV), team learning (TL) and system thinking (ST) as the significant value for each dimension is lower than 0.05 (p<0.05). 4.7. Regression Analysis 4.7.1. Transformational Leadership and Personal Mastery
Table 8 – Model Summaryb of Personal Mastery
Model R R Adjusted Std. Error of Change Statistics Durbin-

ISSN: 2289-4519 Page 175
Square R Square the Estimate R Square
Change
F
Change
df1 df2 Sig. F
Change
Watson
1 .821a .674 .657 .3089 .674 38.843 5 94 .000 1.558
a. Predictors: (Constant), IC, IIA, IS, IM, IIB
b. Dependent Variable: PM
As refer to Table 8, the dependent variable is PM, and independent variables are IC, IIA, IS, IM and IIB. The value for R is 0.821, R square is 0.674, and adjusted R squared is 0.657 which signifies 65.7% of the variance in Personal Mastery (of learning organisation) will be the changing dimension of transformational leadership Learning Organisation is able predicted by the changes in IIA, IIB, IM, IS, and IC (Hassan and Yau, 2013). As a general rule if the adjusted R square exceeds 60%, then it is considered as a ‘good fit’ (Hassan and Yau, 2013). The adjusted R squared=0.657, 65.7% which indicates that it is a ‘good fit’. The value of Durbin-Watson (DW) 1.558 is acceptable as it is smaller than two (Boef, 2004 cited in Lewis-Beck et al, 2004).
Table 9 –Coefficientsa of Personal Mastery
Model Unstandardized
Coefficients
Standardized
Coefficients
t Sig. Collinearity Statistics
B Std. Error Beta Tolerance VIF
1
(Constant) .532 .234
2.275 .025
IIA -.016 .096 -.016 -.169 .866 .367 2.723
IIB .345 .117 .332 2.944 .004 .273 3.668
IM -.111 .109 -.113 -1.019 .311 .280 3.570
IS .358 .108 .359 3.307 .001 .294 3.402
IC .290 .101 .318 2.856 .005 .279 3.578
a. Dependent Variable: PM
Dependent factor: Learning organisation
Y= PM (personal mastery)
Independent factor: Transformational leadership
X1=IIA (idealised attributes)
X2=IIB (idealised behaviour)
X3=IM (inspirational motivation)
X4=IS (intellectual stimulation)
X5=IC (Individualised consideration)
C=constant
Therefore the model should be
Y= B1X1+B2X2+B3X3+B4X4+B5X5 +C

ISSN: 2289-4519 Page 176
The result shows that only three transformational leadership behaviour significantly and positively influence Personal Mastery (PM) of learning organisation where IIB (0.332, p=0.04), IS (0.359, p=0.001) and IC (0.318 , p=0.005 ) as refer to Table 11 (Hassan and Yau, 2013). The Constant is significant and positive. None of the tolerance statistic from Table 11 shows that it is less than 0.20 (Menard, 2010), so it signifies that the variable is not greatly collinear with the rest of the predictor variables (Ualberta, n.d.). Therefore the empirical model 1 can be illustrated as follows
PM=0.332 (IIB)+0.359 (IS)+0.318(IC)+0.532 This empirical model 1 indicated that changing 1 unit of IIB along with IS and IC will causes to change overall 1.009 units of PM enabling to create a learning organisation while constant remains same. This finding is consistent with Schiena, et al., (2013), where IC, IIB were found to have significant association with PM. PM is referred as awareness of personal improvement and weakness areas and in addition objectivity, humility and the continuous willingness to search for self-development thus, the feeling of acquiring concentration from the leader seems to become critical for the Personal Mastery establishment (Schiena, et al., 2013). 4.7.2. Transformational Leadership and Mental Models
Table 10 – Model Summaryb of Mental Models
Model R R
Square
Adjusted
R Square
Std. Error of
the Estimate
Change Statistics Durbin-
Watson R Square
Change
F
Change
df1 df2 Sig. F
Change
2 .682a .465 .436 .4560 .465 16.330 5 94 .000 1.943
a. Predictors: (Constant), IC, IIA, IS, IM, IIB
b. Dependent Variable: MM
As refer to Table 10, the dependent variable is PM, and independent variables are IC, IIA, IS, IM and IIB. The table shows that adjusted R square is 0.436 indicating that 43.6% of variance in mental models (MM) of learning organisation is attributed in changing transformational leadership behaviour or style. However as adjusted R square is less than 60%, the overall model is not considered as a ‘good fit’ (Hassan and Yau, 2013). The value of Durbin-Watson (DW) 1.943 is acceptable as it is smaller than two (2) (Boef, 2004 cited in Lewis-Beck, et al 2004).
Table 11 –Coefficientsa of Mental Models
Model Unstandardized
Coefficients
Standardized
Coefficients
t Sig. Collinearity Statistics
B Std. Error Beta Tolerance VIF
2
(Constant) .716 .345
2.076 .041
IIA -.083 .141 -.073 -.589 .557 .367 2.723
IIB .221 .173 .185 1.277 .205 .273 3.668
IM -.091 .160 -.081 -.570 .570 .280 3.570
IS .324 .160 .282 2.026 .046 .294 3.402
IC .421 .150 .401 2.811 .006 .279 3.578

ISSN: 2289-4519 Page 177
a. Dependent Variable: MM
Dependent factor: Learning organisation
Y= MM (Mental Models)
Independent factor: Transformational leadership
X1=IIA (idealised attributes)
X2=IIB (idealised behaviour)
X3=IM (inspirational motivation)
X4=IS (intellectual stimulation)
X5=IC (Individualised consideration)
C=constant
Therefore the model should be
Y= B1X1+B2X2+B3X3+B4X4+B5X5 +C
The result shows that only three transformational leadership behaviour significantly and positively influence Mental Model (MM) of learning organisation where IS (0.282, p=0.046) and IC (0.401 , p=0.006 ) as refer to Table 13. The Constant is significant and positive. None of the tolerance statistic from Table 11 shows that it is less than 0.20 (Menard, 2010), so it signifies that the variable is not greatly collinear with the rest of the predictor variables (Ualberta, n.d.). Therefore the empirical model 2 can be illustrated as follows
MM=0.282 (IS)+0.401 (IC)+0.532
The result shows that only two transformational leadership behaviour significantly and
positively influence Mental Models. In this model if 1 unit of IS changes or increases, then MM will increases by 0.282 units. As a cumulative influence of transformational leadership influence through 1 unit of IS and IC, a combined effect of leadership will enable to increases the MM (mental models) by 0.683 resulting to create a learning organisation. In past Schiena et al (2013) found individualised consideration has a positive impact on learning organisation. Although this study found IS has a positive impact, in Schiena et al (2013) did not found any relationship between IS and learning organisation. 4.7.3. Transformational Leadership and Shared Vision
Table 12 – Model Summaryb of Shared Vision
Model R R
Square
Adjusted
R Square
Std. Error of
the Estimate
Change Statistics Durbin-
Watson R Square
Change
F
Change
df1 df2 Sig. F
Change
3 .842a .708 .693 .3222 .708 45.665 5 94 .000 1.556
a. Predictors: (Constant), IC, IIA, IS, IM, IIB
b. Dependent Variable: SV

ISSN: 2289-4519 Page 178
The result from Table 12 shows that the dependent variable is SV, and independent
variables are IC, IIA, IS, IM and IIB. R is 0.842, R square is 0.708, and adjusted R squared is 0.693 means that 69.3% of the variance in Shared Vision is explained by the independent transformational leadership (Hassan and Yau, 2013) and it also shows that it is a ‘good fit’ as the R square exceeds 60% (R square is 69.3%). 1.556 is the value of Durbin-Watson (DW) and it is highly acceptable since it is less than two (Boef, 2004 cited in Lewis-Beck et al, 2004).
Table 13 –Coefficientsa of Shared Vision
Model Unstandardized
Coefficients
Standardized
Coefficients
t Sig. Collinearity Statistics
B Std. Error Beta Tolerance VIF
3
(Constant) -.042 .244
-.174 .862
IIA .078 .100 .072 .784 .435 .367 2.723
IIB .415 .122 .362 3.394 .001 .273 3.668
IM -.039 .113 -.036 -.344 .732 .280 3.570
IS .223 .113 .203 1.975 .051 .294 3.402
IC .326 .106 .324 3.075 .003 .279 3.578
a. Dependent Variable: SV
Dependent factor: Learning organisation
Y= SV (Shared Vision)
Independent factor: Transformational leadership
X1=IIA (idealised attributes)
X2=IIB (idealised behaviour)
X3=IM (inspirational motivation)
X4=IS (intellectual stimulation)
X5=IC (Individualised consideration)
C=constant
Therefore the model should be
Y= B1X1+B2X2+B3X3+B4X4+B5X5 +C
Reference to Table 13, only three transformational leadership practices are significantly and positively influences shared vision of learning organisation. This means that IIB, IS and IC of leadership practices enables organisation to become a learning organisation through shared vision. The other two transformational leadership was found to be non-significant in influencing to create a shared vision among the employees as their significant values are higher than 0.05.
This means the empirical model of transformational leadership behaviour in influencing to create and sustain a shared vision or values among the employees are illustrated as follows

ISSN: 2289-4519 Page 179
SV=0.362 (IIB) +0.203 (IS) +0.324 (IC) –0.042
This models shows that if transformational leadership is not taken place, there is a negative value for shared values since it is a negative value for ‘Constant’. Therefore it is important to display transformational leadership behaviour among the employees to create a shared purpose or vision. The model revealed that if other things being constant, changing one unit of IIB , will increase shared vision by 0.362 units, followed by IS with 0.203 units, and by 0.24 units with changing 1 unit of IC. This finding is consistent with the result of Schiena et al (2013). 4.7.4. Transformational Leadership and Team Learning
Table 14 – Model Summaryb of Team Learning
Model R R
Square
Adjusted
R Square
Std. Error of
the Estimate
Change Statistics Durbin-
Watson R Square
Change
F
Change
df1 df2 Sig. F
Change
4 .746a .557 .533 .3460 .557 23.644 5 94 .000 1.896
a. Predictors: (Constant), IC, IIA, IS, IM, IIB
b. Dependent Variable: TL
As refer to Table 14, the dependent variable is TL, and independent variables are IC, IIA,
IS, IM and IIB. R is 0.746, R square is 0.557, and adjusted R squared is 0.533 that signifies 53.3% of the variance in Team Learning is able to be forecasted by the independent variables (Hassan and Yau, 2013). However, it is not a good fit as adjusted R square is lower than 60%. Durbin-Watson (DW) value is 1.896 which is acceptable (Boef, 2004 cited in Lewis-Beck et al, 2004).
Table 15 –Coefficientsa of Team Learning
Model Unstandardized
Coefficients
Standardized
Coefficients
t Sig. Collinearity Statistics
B Std. Error Beta Tolerance VIF
4
(Constant) .725 .262
2.770 .007
IIA .053 .107 .056 .491 .624 .367 2.723
IIB .273 .131 .273 2.078 .040 .273 3.668
IM .013 .122 .014 .107 .915 .280 3.570
IS .153 .121 .160 1.260 .211 .294 3.402
IC .280 .114 .320 2.466 .015 .279 3.578
a. Dependent Variable: TL
Dependent factor: Learning organisation
Y= TL (Team Learning)
Independent factor: Transformational leadership
X1=IIA (idealised attributes)

ISSN: 2289-4519 Page 180
X2=IIB (idealised behaviour)
X3=IM (inspirational motivation)
X4=IS (intellectual stimulation)
X5=IC (Individualised consideration)
C=constant
Therefore the model should be
Y= B1X1+B2X2+B3X3+B4X4+B5X5 +C
Based on the table 15, only two independent variables are significant and positively
influence team learning. That is IIB (B=0.273, p=0.04), and IC (B=0.320, p=0.015) indicating that IIB and IC are positively and significantly influences team learning since ‘P’ values for each of this Beta Coefficient is lower than 0.05. Therefore the empirical model for team learning should be illustrated as follows
TL=0.273 (IIB) +0.320 (IC) +0.725
The empirical model of team learning (TL) shows that changing 1 unit of IIB, there is a changes of 0.273 units of TL when other things remain constant. Similarly, when other things remain constant, if 1 unit of IC changes, it will cause to change 0.320 units of team learning. Also this model shows that team learning is often encourage and taken place in the organisation when transformational leadership behaviour of idealised behaviour and individualised consideration are not displayed. It is important to note that the intellectual stimulations, inspirational motivation and idealised attributes or charima does not play significant role in team learning. This finding is contrary to many previous findings such as Bass(2000) and Schiena et al (2013). 4.7.4. Transformational Leadership and System Thinking
Table 16 – Model Summaryb of System Thinking
Model R R
Square
Adjusted
R Square
Std. Error of
the Estimate
Change Statistics Durbin-
Watson R Square
Change
F
Change
df1 df2 Sig. F
Change
5 .625a .391 .358 .4378 .391 12.052 5 94 .000 1.735
a. Predictors: (Constant), IC, IIA, IS, IM, IIB
b. Dependent Variable: ST
As shown in Table 16, the dependent variable is ST, and independent variables are IC, IIA, IS, IM and IIB. R is 0.625, R square is 0.391, and adjusted R squared is 0.358 which indicates that 35.8% of the variance in Systems Thinking can be predicted by independent variables (Hassan and Yau, 2013) but it is not a ‘good fit’ since R square is lower than 60% (in this case adjusted R square 35.8%). 1.735 is the figure of Durbin-Watson is acceptable as it is significantly less than 2 (Boef, 2004 cited in Lewis-Beck et al, 2004).
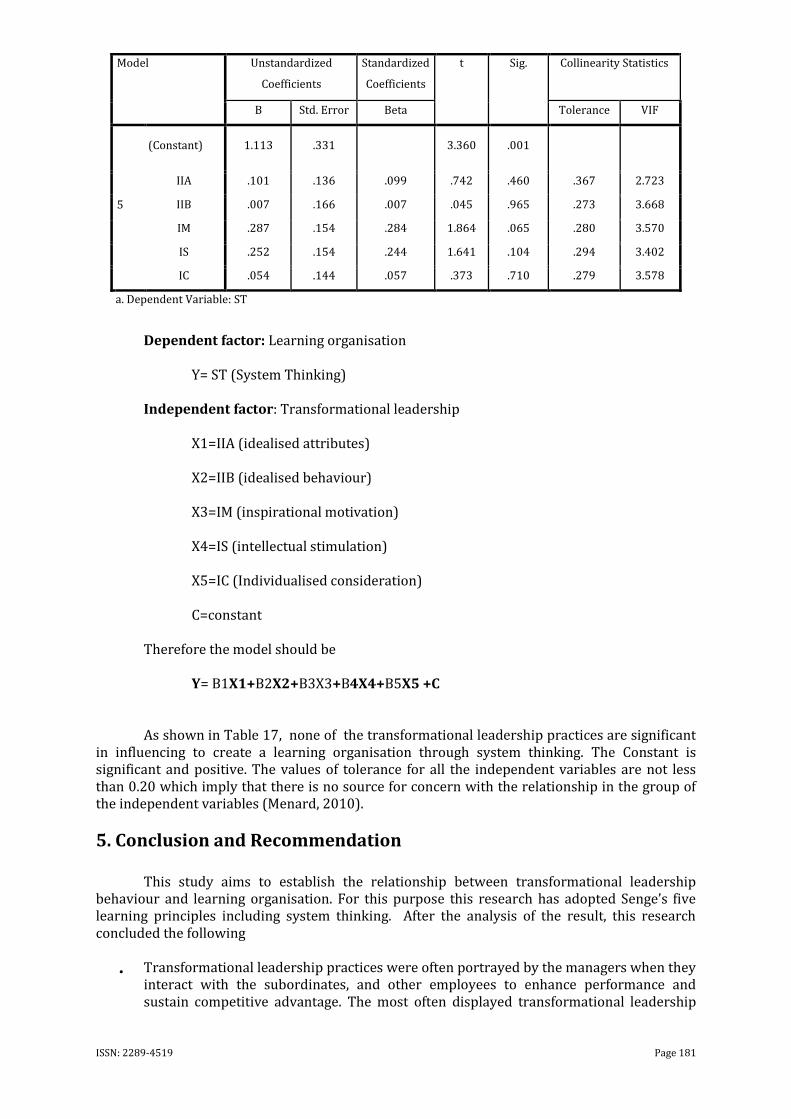
Table 17 –Coefficientsa of System Thinking
ISSN: 2289-4519 Page 181
Model Unstandardized
Coefficients
Standardized
Coefficients
t Sig. Collinearity Statistics
B Std. Error Beta Tolerance VIF
5
(Constant) 1.113 .331
3.360 .001
IIA .101 .136 .099 .742 .460 .367 2.723
IIB .007 .166 .007 .045 .965 .273 3.668
IM .287 .154 .284 1.864 .065 .280 3.570
IS .252 .154 .244 1.641 .104 .294 3.402
IC .054 .144 .057 .373 .710 .279 3.578
a. Dependent Variable: ST
Dependent factor: Learning organisation
Y= ST (System Thinking)
Independent factor: Transformational leadership
X1=IIA (idealised attributes)
X2=IIB (idealised behaviour)
X3=IM (inspirational motivation)
X4=IS (intellectual stimulation)
X5=IC (Individualised consideration)
C=constant
Therefore the model should be
Y= B1X1+B2X2+B3X3+B4X4+B5X5 +C
As shown in Table 17, none of the transformational leadership practices are significant
in influencing to create a learning organisation through system thinking. The Constant is significant and positive. The values of tolerance for all the independent variables are not less than 0.20 which imply that there is no source for concern with the relationship in the group of the independent variables (Menard, 2010).
5. Conclusion and Recommendation This study aims to establish the relationship between transformational leadership behaviour and learning organisation. For this purpose this research has adopted Senge’s five learning principles including system thinking. After the analysis of the result, this research concluded the following
Transformational leadership practices were often portrayed by the managers when they interact with the subordinates, and other employees to enhance performance and sustain competitive advantage. The most often displayed transformational leadership

ISSN: 2289-4519 Page 182
practices is intellectual stimulation and idealized behaviour and least type of transformational leadership style is individual considerate leadership style.
Personal mastery is agreed to be the most often displayed learning organizational dimension followed by System Thinking. The least perceived learning that has taken place in the organisation is team learning and shared vision.
There is a significant influence of transformational leadership practices or behaviour on learning culture or practices in the organisation. In more detail, transformational leadership has a significant and positive influence on four types of learning culture or dimensions which includes Personal Mastery, Mental Models, Shared Visions and Team Learning. This study also concludes that there is no significant influence of transformational leadership on System Thinking (fifth discipline) of a learning organisation. Therefore the final empirical formulas are illustrated below:
PM=0.332 (IIB) +0.359 (IS) +0.318(IC) +0.532----------------------(1)
MM=0.282 (IS) +0.401 (IC) +0.532-------------------------------------(2)
SV=0.362 (IIB) +0.203 (IS) +0.324 (IC) –0.042---------------------(3)
TL=0.273 (IIB) +0.320 (IC) +0.725------------------------------------(4)
Overall, this study concluded transformational leadership is only able to influence foru type of learning, mental models, personal mastery, shared visions, and team learning. Also we conclude that there is no significant influence of transformational leadership on system thinking. Therefore this study recommends the following:
As this study included only 2 organization with a sample of 100 may require future
studies with a larger sample sizes and recommended to focus on more MNCs. The future
studies may compare differences based on socio-demographic profile and academic
profile.
Secondly, future studies should study refined the variables included under system
thinking. Also it is advisable to focus on identifying the impact of learning organisation
on performance of employees and commitment.
Thirdly, further study is needed to identify the other potential factors that influence
learning organisation and creating or sustaining a learning culture.
This study will be a useful study for those managers who are trying to transform their
organisation to learning organization. This study will be a guide to those who wants to learn
transformational leadership and learning organizational culture.

ISSN: 2289-4519 Page 183
References Argyris, C., 1976. Single-loop and double-loop models in research on decision making. Administrative science
quarterly, [online] Available at:
<http://academic.udayton.edu/richardghere/igo%20ngo%20research/argyris.pdf> [Accessed 12 January
2014].
Avolio, B.J., Bass, B.M., & Jung, D.I. 1997. Replicated confirmatory factor analyses of the Multifactor
Leadership Questionnaire. Binghamton, NY: Center for Leadership Studies, Binghamton University.
Bass, B. M., 2000. The future of leadership in learning organizations. Journal of Leadership & Organizational
Studies, [e-journal] 7(3), pp. 18-40. Accessed 6 November 2013].
Bennis, W. 1984. The four competencies of leadership. Training and Development Journal, 38(5), pp.14‐ 19
Bethel, S.M. 1990, Making the Difference: Twelve Qualities That Make You a Leader, P.G. Putnam and Sons,
New York,
Blake, R., 1982. A Comparative Analysis of Situationalism and 9, 9 Management by Principle. Organizational
Dynamics, [e-journal] 10(4), pp. 20-43. Available through: Anglia Ruskin University Library website
<http://libweb.anglia.ac.uk/> [Accessed 14 April 2014].
Bolden, R., et al., 2003. A review of leadership theory and competency frameworks. Centre for Leadership
Studies, Exeter: University of Exeter, [online] Available at:
<http://www2.fcsh.unl.pt/docentes/luisrodrigues/textos/Lideran%C3%A7a.pdf> [Accessed 12 January
2014].
Buhler, P., 1997. Managing in the 90s. Supervision, [e-journal] 58(1), p. 24. Available through: Anglia Ruskin
University Library website <http://libweb.anglia.ac.uk/> [Accessed 12 January 2014].
Cartwright, S., 2002. Double-Loop Learning: A Concept and Process for Leadership Educators. The Journal of
Leadership Education, [online] Available at:
<http://www.leadershipeducators.org/Resources/Documents/jole/2002_summer/JOLE_1_1_Cartright.pdf>
[Accessed 15 February 2014].
Covey, S. R., n.d. The seven habits of highly effective people. [online] Available at:
<http://www.theautonomist.com/iindv/articles_stand/soccult/Seven_Habits_of_Highly_Effective_People.pd
f> [Accessed 12 January 2014].
Colosi, L. (2006). Designing an effective questionnaire. Research brief available online at: http://parenting. cit.
cornell. edu/documents/Designing an Effective Questionnaire. pdf.
ISSN: 2289-4519 Page 184
Davis, D. and Daley, B. J., 2008. The learning organization and its dimensions as key factors in firms'
performance. Human Resource Development International, [e-journal] 11(1), pp. 51-66. Available through:
Anglia Ruskin University Library website <http://libweb.anglia.ac.uk/> [Accessed 17 December 2013].
Garvin, D. A., 1993. Building a learning organization. Harvard Business Review, [e-journal] 71(4), pp. 78-91.
Available through: Anglia Ruskin University Library website <http://libweb.anglia.ac.uk/> [Accessed 13
January 2014].
Garvin, D. A., Edmondson, A. C. and Gino, F., 2008. Is yours a learning organization? Harvard business
review, [online] 86(3), p. 109. Available at:
<http://www.egatlearning.com/2011egrp3/reading/Is%20Yours%20a%20Learning%20Organization.pdf>
[Accessed 13 January 2014].
Gebler, D., 2013. How to Really Change a Workplace. The Huffington Post Canada, [online] 15 November.
Available at: <http://www.huffingtonpost.ca/david-gebler/workplace-change_b_4282784.html> [Accessed
16 November 2013].
Haley, C.K., and Lazouskas, L., n.d. Leadership development and learning organization: a literature review.
[pdf] Available at: <http://www.ufhrd.co.uk/wordpress/wp-content/uploads/2008/06/632-leadership-
development-and-learning-organization-a-lite.pdf> [Accessed 15 November 2013].
Hamzah, M. I. M., et al., 2011. School as Learning Organisation: The Role of Principal’s Transformational
Leadership in Promoting Teacher Engagement. World Applied Sciences Journal 14 (Special Issue of
Innovation and Pedagogy for Diverse Learners), pp. 58-63. [online] Available at:
<http://www.idosi.org/wasj/wasj14%28IPDL%2911/12.pdf> [Accessed 4 November 2013].
Hassan, Z. 2014. Intellectual behaviour of module tutors to predict student satisfaction and intention to leave:
An empirical study from Malaysian Private Higher Education Institutions. International Journal of
Innovation and Applied Studies, 8(3), 964-975.
Hassan, Z. and Yau, S, 2013. Transformational Leadership Practices and Student Satisfaction in an Educational
Setting in Malaysia. International Journal of Accounting, and Business Management (IJABM), [online]
1(1).
Johnson, J. R. 2002. Leading the learning organization: portrait of four leaders. Leadership & Organization
Development Journal, [e-journal] 23(5), pp. 241-249. Available through: Emerald [Accessed 11 October
2013].
Kumar, N., & Idris, K. (2006). An examination of educational institutions' knowledge performance: Analysis,
implications and outlines for future research. The Learning Organization, 13(1), 96-116.
Lewin, K., Lippitt, R., & White, R. 1939. Patterns of aggressive behavior in experimentally created “social
climates.” Journal of Social Psychology, 10 (2) pp.271-299.
Lewis-Beck, M.S., Bryman, A. and Liao, T.F 2004. Durbin-Watson Statistic, Pearson's Correlation Coefficient.
The SAGE Encyclopedia of Social Science Research Methods, [e-journal], pp. 291-292, pp. 808-811.
[Accessed 10 April 2014].
Marquardt, M.J. 1996. Building the Learning Organization: A Systems Approach to Quantum Improvement and
Global Success, McGraw‐ Hill, New York, NY.
Melhem, Y., 2011. Learning Organisation on building blocks: The case of irbid district electricity company
(IDECO) In Jordon. International Journal of Business and Public Administration, [online] Available at:
<http://info.psu.edu.sa/psu/fnm/ymelhem/learning%20org%20building%20blocks.pdf> [Accessed 15
February 2014]
Menard, S., 2010. Logistic regression diagnostics and problems of inference. Logistic regression: From
introductory to advanced concepts and applications, [e-journal] pp. 125-145. Available through: Anglia
Ruskin University Library website <http://libweb.anglia.ac.uk/> [Accessed 30 April 2014].
Mills, D.Q., 2005. Leadership: How to Lead, How to Live. MindEdge Press, [online] Available at:
<http://www.cafanet.com/LinkClick.aspx?fileticket=qwswE8roe74%3D&tabid=96> [Accessed 12
February 2014].
ISSN: 2289-4519 Page 185
Najafi, A., 2011. The Effect of the Learning Organization on the Performance. World Applied Sciences Journal,
[online] Available at:
<http://www.academia.edu/768102/The_Effect_of_the_Learning_Organization_on_the_Performance>
[Accessed 12 February 2014].
Nazari, K., & Pihie, Z.L. (2012). Assessing learning organization dimensions and demographic factors in
technical and vocational colleges in Iran. International Journal of Business and Social Science, 3(3), 210-
219
Obiwuru, T.C., et al., 2011. Effects of Leadership Style on Organizational Performance: A Survey of Selected
Small Scale Enterprises In IKOSI-KETU Council Development Area of Lagos State, Nigeria. Australian
Journal of Business and Management Research, [online] Available at:
<http://ajbmr.com/articlepdf/ajbmr_17_16i1n7a11.pdf> [Accessed 12 January 2014].
Oudejans, S.C.C., et al., 2009. Chapter 5: Measuring the learning capacity of organizations: development and
factor analysis of the Questionnaire for Learning Organizations(QLO). [pdf] Available at:
<http://dare.uva.nl/document/137561> [Accessed 23 December 2013].
Pedler, M. 1995. A guide to the learning organization. Industrial and Commercial Training, 27(4) pp.21 – 25.
Pedler, M., Burgoyne, J. and Boydell, T. 1991, The Learning Company: A Strategy for Sustainable
Development, McGraw‐ Hill, London.
Rowe, E., 2010. Looking at extension as a learning organization. Journal of extension, [online] Available at:
<http://www.joe.org/joe/2010august/pdf/JOE_v48_4rb1.pdf> [Accessed 15 February 2014].
Salkind, N.J. and Rasmussen, K., 2007. Pearson Product-Moment Correlation Coefficient, Stratified Random
Sampling. Encyclopedia of Measurement and Statistics, [e-journal] pp. 751-756, pp. 968-972. [Accessed 8
April 2014].
Salkind, N.J., 2010. Coefficient Alpha, Correlation, Normality Assumption, Regression Coefficient, Reliability,
Validity. Encyclopedia of Research Design, [e-journal] pp. 160-164, pp. 265-268, pp. 932-935, pp. 1231-
1235, pp. 1238-1244, pp. 1589-1592. [Accessed 8 April 2014].
Schiena, D., et al., 2013. Relationship between Leadership and Characteristics of Learning Organizations in
Deployed Military Units: An Exploratory Study. Administrative Sciences, [online] Available at:
<http://www.mdpi.com/2076-3387/3/3/143> [Accessed 3 November 2013].
Securities, 2010. Amway (Malaysia) Holdings Berhad. [online] Available at:
<http://www.securities.com/Public/company-
profile/MY/Amway__Malaysia__Holdings_Berhad_en_1660174.html> [Accessed 8 April 2014].
Senge, P.M. 1990. The Fifth Discipline: The Art and Practice of the Learning Organization, Currency
Doubleday, New York, NY.
Senge, P.M. 1996. Leading learning organizations. Training and Development, 50(12), pp. 36‐ 7
Tarrini, M. G., 2004. The Development and application of a bespoke organisational learning competency
framework in a global organisation. [online] Available at:
<https://dspace.lib.cranfield.ac.uk/bitstream/1826/113/5/Chapter%203%20.pdf> [Accessed 12 January
2014].
Tavakol, M. and Dennick, R., 2011. Making sense of Cronbach's alpha. International journal of medical
education, [online] Available at: <http://www.ijme.net/archive/2/cronbachs-alpha.pdf> [Accessed 10 April
2014].
Thompson, C. B., 2009. Descriptive Data Analysis. Air medical journal, [online] Available at:
<http://hpm.fk.ugm.ac.id/hpmlama/images/Biostatistik/eq_4_science_thompson.pdf> [Accessed 10 April
2014].
Thompson, G. and Vecchio, R. P., 2009. Situational leadership theory: A test of three versions. The Leadership
Quarterly, [e-journal] 20(5), pp. 837-848. [Accessed 14 February 2014].

ISSN: 2289-4519 Page 186
Torlak, G. N., 2004. Learning Organizations. Journal of Economic and Social Research, [online] Available at:
<http://www.fatih.edu.tr/~jesr/jesr.torlak.pdf> [Accessed 13 January 2014].
Ualberta, n.d. Child Health and Development study: 13. Multiple Regression Diagnostics in SPSS. [pdf]
Available at: <http://www.stat.ualberta.ca/statslabs/casestudies/files/childmu13.pdf> [Accessed 30 April
2014].
Watkins, K.E. and Marsick, V.J. 1993. Sculpting the Learning Organization: Lessons in the Art and Practice of
a Systemic Change, Jossey‐ Bass, San Francisco, CA.
Williams, B., Onsman, A. and Brown, T., 2010. Exploratory factor analysis: A five-step guide for novices.
Journal of Emergency Primary Health Care, [online] Available at:
<http://ro.ecu.edu.au/cgi/viewcontent.cgi?article=1373&context=jephc> [Accessed 10 April 2014].
Zaccaro, S. J. and Horn, Z. N., 2003. Leadership theory and practice: Fostering an effective symbiosis. The
Leadership Quarterly, [e-journal] 14(6), pp. 769-806. [Accessed 14 February 2014].