Embed Size (px)
Citation preview
THE INFLUENCE OF TRADITIONAL AND VALUE BASED
PERFORMANCE MEASURES ON SHAREHOLDER’S VALUE
CREATION OF MALAYSIAN LISTED CONSTRUCTION
COMPANIES
SHRIKANT KRUPASINDHU PANIGRAHI
Thesis submitted in fulfilment of the requirements
for the award of the degree of
Doctor of Philosophy
Faculty of Industrial Management
UNIVERSITI MALAYSIA PAHANG
FEBRUARY 2016
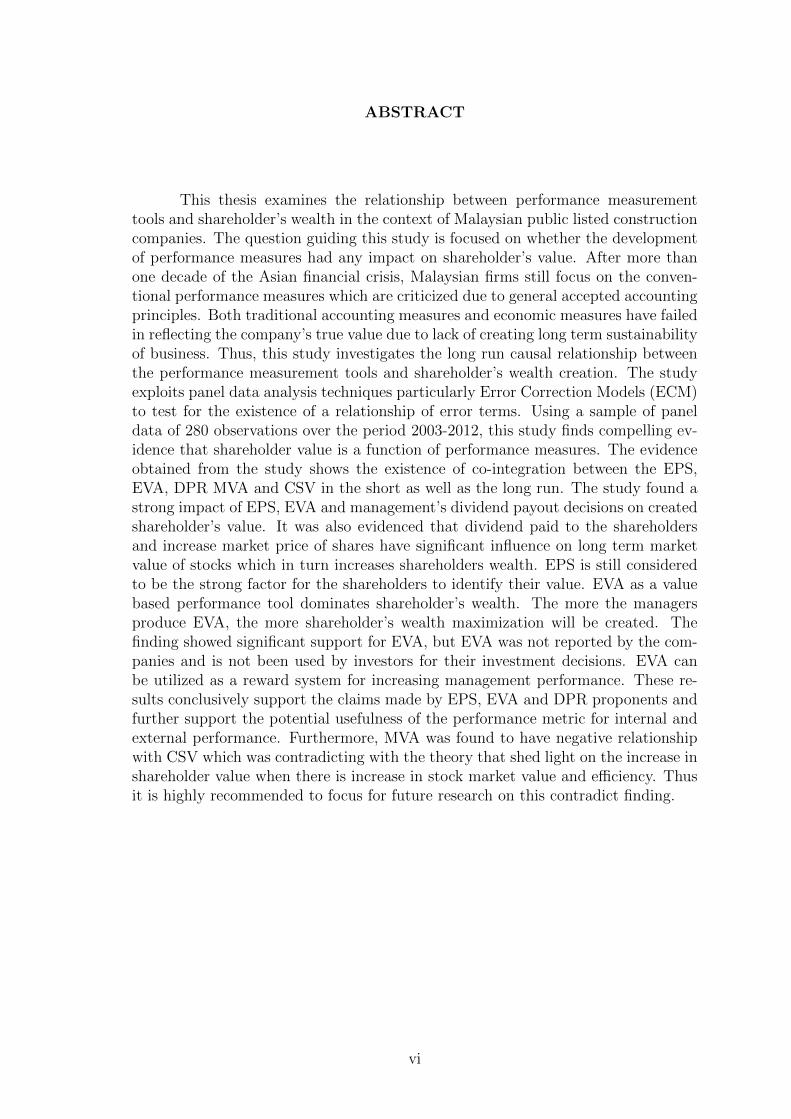
ABSTRACT
This thesis examines the relationship between performance measurementtools and shareholder’s wealth in the context of Malaysian public listed constructioncompanies. The question guiding this study is focused on whether the developmentof performance measures had any impact on shareholder’s value. After more thanone decade of the Asian financial crisis, Malaysian firms still focus on the conven-tional performance measures which are criticized due to general accepted accountingprinciples. Both traditional accounting measures and economic measures have failedin reflecting the company’s true value due to lack of creating long term sustainabilityof business. Thus, this study investigates the long run causal relationship betweenthe performance measurement tools and shareholder’s wealth creation. The studyexploits panel data analysis techniques particularly Error Correction Models (ECM)to test for the existence of a relationship of error terms. Using a sample of paneldata of 280 observations over the period 2003-2012, this study finds compelling ev-idence that shareholder value is a function of performance measures. The evidenceobtained from the study shows the existence of co-integration between the EPS,EVA, DPR MVA and CSV in the short as well as the long run. The study found astrong impact of EPS, EVA and management’s dividend payout decisions on createdshareholder’s value. It was also evidenced that dividend paid to the shareholdersand increase market price of shares have significant influence on long term marketvalue of stocks which in turn increases shareholders wealth. EPS is still consideredto be the strong factor for the shareholders to identify their value. EVA as a valuebased performance tool dominates shareholder’s wealth. The more the managersproduce EVA, the more shareholder’s wealth maximization will be created. Thefinding showed significant support for EVA, but EVA was not reported by the com-panies and is not been used by investors for their investment decisions. EVA canbe utilized as a reward system for increasing management performance. These re-sults conclusively support the claims made by EPS, EVA and DPR proponents andfurther support the potential usefulness of the performance metric for internal andexternal performance. Furthermore, MVA was found to have negative relationshipwith CSV which was contradicting with the theory that shed light on the increase inshareholder value when there is increase in stock market value and efficiency. Thusit is highly recommended to focus for future research on this contradict finding.
vi
ABSTRAK
Tesis ini mengkaji hubungan antara alat ukuran prestasi dan kekayaan pe-megang saham dalam konteks syarikat pembinaan senarai awam di Malaysia. Per-soalan yang memandu kajian ini menumpukan sama ada pembangunan ukuranprestasi mempunyai kesan ke atas nilai pemegang saham. Setelah lebih dari satudekad krisis kewangan di Asia, pemegang saham di Malaysia masih bergantungkepada pengukuran prestasi konvensional yang mendapat kritikan disebabkan prin-sip perakaunan umum yang dipakai. Kedua-dua ukuran perakaunan tradisional danekonomi gagal dalam memberi gambaran kepada nilai sebenar disebabkan keku-rangan dalam mencipta perniagaan yang lestari untuk jangkapanjang. Oleh itu,sumbangan kajian ini memasukkan ukuran perakaunan berasaskan perolehan danuntung, pengukuran ekonomi berasaskan nilai pasaran, nilai semasa tunai dan kepu-tusan bayaran dividen berasaskan perolehan sebelum kadar bunga dan cukai, perole-han setiap saham sebagai memaksimumkan pasaran nilai dalam sektor pembinaanMalaysia. Nilai tidak dicipta melalui sumbangan bebas faktor berasingan tetapiadalah dengan menyiasat kaitan antara factor-faktor tersebut. Alasan utama untukmemasukkan ukuran seperti EVA dan MVA untuk mengkaji nilai pemegang sahamdimotivasikan oleh pengurus di dalam bentuk pembelajaran operasional yang diciptamelalui kerjasama antara pemegang taruh yang mungkin menyumbang kepada ni-lai ekonomi untuk pemegang saham dan perbadanan di masa hadapan. Kajian inimengkaji hubungan penyebab jangkapanjang antara alat pengukuran prestasi danpenciptaan kekayaan pemegang saham. Dengan menggunakan sampel data panelsebanyak 280 pemerhatian sepanjang tempoh 2003-2012, kajian ini mendapati buktiyang menyerlah iaitu nilai pemegang saham adalah fungsi ukuran prestasi. Kajianini mengekploitasi analisis teknik data panel khususnya, Error Correction Models(ECM) untuk menguji kewujudan hubungan dalam ralat. Bukti diperolehi dari ka-jian ini menunjukkan kewujudan intergrasi bersama antara EPS, EVA, DPR, MVAdan CSV untuk jangkamasa pendek dan panjang. Kajian mendapati kesan yangkuat antara EPS, EVA dan keputusan pembayaran pengurusan dividen ke atasnilai pemegang saham dicipta. Juga didapati dividen dibayar kepada pemegang sa-ham dan meningkatkan harga saham mempunyai pengaruh signifikan ke atas nilaipasaran saham jangkapanjang yang akan meningkatkan kekayaan pemegang saham.EPS masih dianggap faktor yang kuat untuk pemegang saham untuk mengenal-pasti nilainya. EVA sebagai alat nilai berasaskan prestasi mendominasi kekayaanpemegang saham. Semakin banyak pengurus menghasilkan EVA, semakin banyakmemaksimumkan kekayaan pemegang saham dicipta. Dapatan menunjukkan sokon-gan yang signifikan bagi EVA, tetapi EVA tidak dilaporkan oleh syarikat dan tidakdigunakan oleh pelabur-pelabur untuk keputusan pelaburan. EVA masih boleh di-gunakan sebagai system ganjaran untuk meningkatkan prestasi pengurusan. Kepu-tusan ini menyokong pandangan yang dibuat melalui EPS, EVA dan DPR, danseterusnya menyokong potensi kebergunaan metric prestasi untuk presatsi dalamandan luaran. Sementara itu, MVA didapati mempunyai hubungan yang negativedengan CSV yang bertentangan dengan teori yang menunjukkan peningkatan ni-lai pemegang saham bila ada peningkatan dalam nilai pasaran saham dan efisiensi.
vii

Dengan adanya dapatan bertentangan adalah disarankan untuk memberi tumpuanbagi penyelidikan masa depan.
viii

LIST OF ABBREVIATIONS
ABET Accreditation Board for Engineering and Technology
ADF Augmented Dickey Fuller
APT Arbitrage Pricing Theory
BNM Bank Negara Malaysia
CAPM Capital Asset Pricing Model
CA Current Assets
CE Capital Employed
CC Capital Charge
Cd Cost of Debt
Ce Cost of equity
CIDB Construction Industrial Development Board
CSV Created Shareholders Value
CVA Cash Value Added
DCF Discounted Cash Flow
DPS Dividend Per Share
DPR Dividend Payout Ratio
EBIT Earnings before Interest and Taxes
EBITDA Earnings before Interest, Tax, Depreciation and Amor-
tization
EC Equity Capital
ECM Error Correction Model
ECT Error Correction Term
EMV Equity Market Value
EPS Earnings Per Share
EVA Economic Value Added
ix
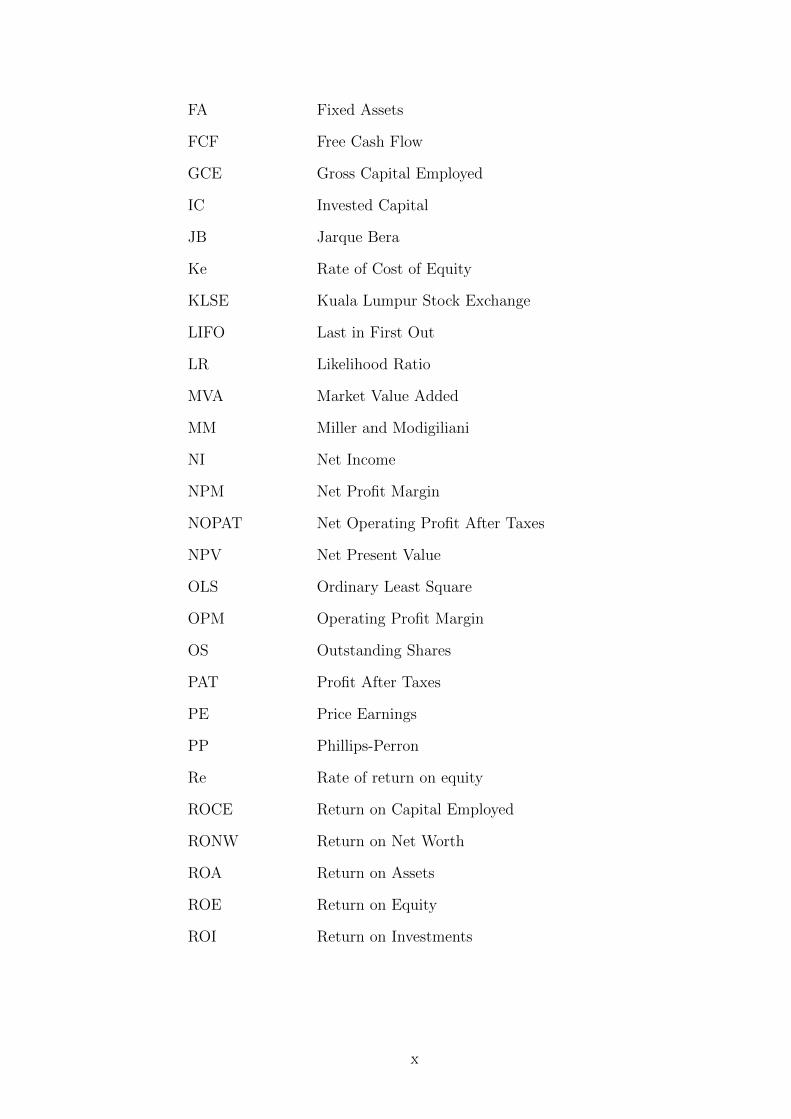
FA Fixed Assets
FCF Free Cash Flow
GCE Gross Capital Employed
IC Invested Capital
JB Jarque Bera
Ke Rate of Cost of Equity
KLSE Kuala Lumpur Stock Exchange
LIFO Last in First Out
LR Likelihood Ratio
MVA Market Value Added
MM Miller and Modigiliani
NI Net Income
NPM Net Profit Margin
NOPAT Net Operating Profit After Taxes
NPV Net Present Value
OLS Ordinary Least Square
OPM Operating Profit Margin
OS Outstanding Shares
PAT Profit After Taxes
PE Price Earnings
PP Phillips-Perron
Re Rate of return on equity
ROCE Return on Capital Employed
RONW Return on Net Worth
ROA Return on Assets
ROE Return on Equity
ROI Return on Investments
x
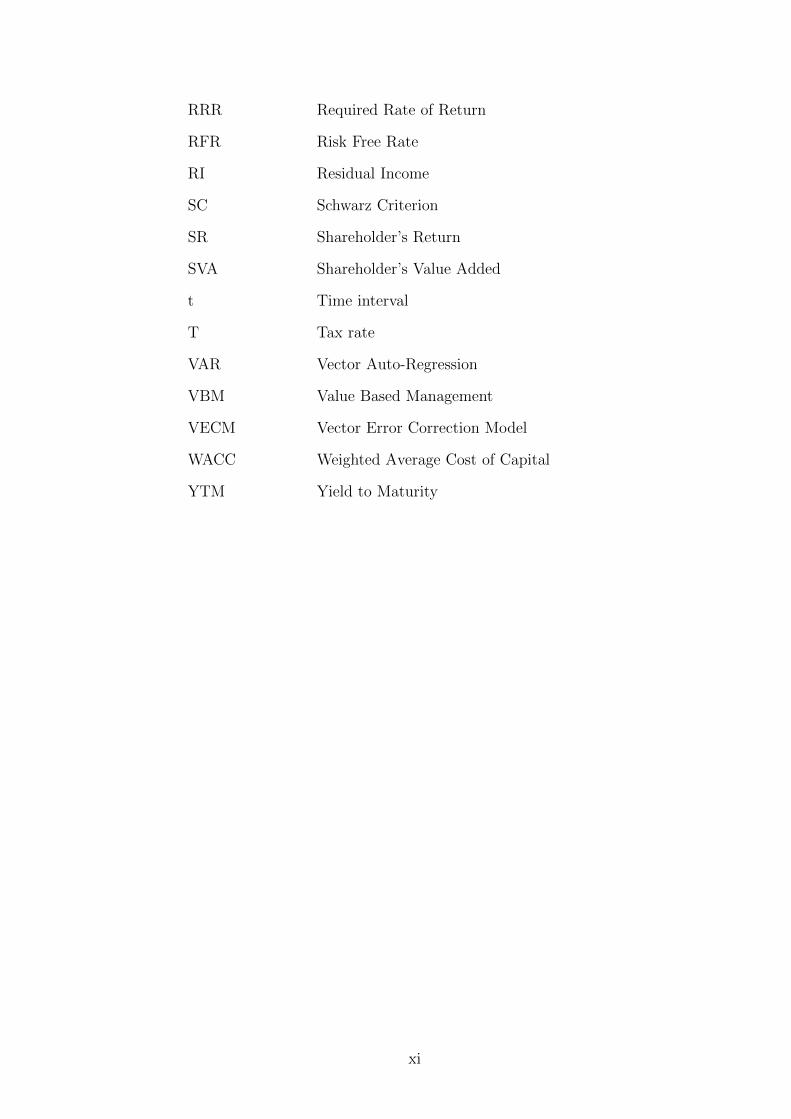
RRR Required Rate of Return
RFR Risk Free Rate
RI Residual Income
SC Schwarz Criterion
SR Shareholder’s Return
SVA Shareholder’s Value Added
t Time interval
T Tax rate
VAR Vector Auto-Regression
VBM Value Based Management
VECM Vector Error Correction Model
WACC Weighted Average Cost of Capital
YTM Yield to Maturity
xi
TABLE OF CONTENTS
DECLARATION OF THESIS AND COPYRIGHT i
SUPERVISOR’S DECLARATION ii
STUDENT’S DECLARATION iii
DEDICATION iv
ACKNOWLEDGEMENTS v
ABSTRACT vi
ABSTRAK vii
LIST OF ABBREVIATIONS ix
LIST OF FIGURES xvi
LIST OF TABLES xvii
1 INTRODUCTION 1
1.1 INTRODUCTION 1
1.2 INDUSTRY OVERVIEW 4
1.3 PROBLEM STATEMENT 7
1.4 AIM OF THE RESEARCH 10
1.5 RESEARCH OBJECTIVE 10
1.6 RESEARCH QUESTION 11
1.7 SCOPE OF THE STUDY 12
1.8 SIGNIFICANCE OF THE STUDY 13
1.9 THEORETICAL BASE 14
1.10 MOTIVATION OF THE STUDY 17
1.11 OUTLINE OF THE THESIS 19
1.12 CONCLUDING REMARKS 20
2 PERFORMANCE MEASURES AND SHAREHOLDER’S VALUE:
LITERATURE REVIEW 21
2.1 INTRODUCTION 21
2.2 THEORIES UNDERLYING SHAREHOLDER’S VALUE AND PER-
FORMANCE MEASURES 24
xii
2.2.1 Neoclassical economic theory 25
2.2.2 Stakeholder theory for value creation 27
2.2.3 Theoretical view on dividend policy 29
2.3 LITERATURE REVIEW ON TRADITIONAL PERFORMANCE
MEASURES 35
2.3.1 Earnings Per Share (EPS) 38
2.3.2 Return on Assets (ROA) 39
2.3.3 Return on Equity (ROE) 41
2.3.4 Return on Capital Employed (ROCE) 43
2.3.5 Disadvantages of Traditional Measures 46
2.4 STUDIES RELATED TO TRADITIONAL PERFORMANCE MEA-
SURES AND EVA 48
2.5 LITERATURE REVIEW ON DIVIDEND PAYOUT DECISIONS 51
2.6 STUDIES RELATING TO DPR AND CSV 54
2.7 LITERATURE REVIEW ON ECONOMIC VALUE BASED MEA-
SURES 58
2.7.1 Economic Value Added (EVA) 59
2.7.2 Advantages and shortcomings of EVA 65
2.8 STUDIES RELATING TO EVA AND SHAREHOLDER’S VALUE
CREATION 73
2.8.1 Market Value Added (MVA) 79
2.9 STUDIES RELATING TO MVA AND EVA 82
2.10 CREATED SHAREHOLDER’S VALUE (CSV) 87
2.11 CONCLUSIONS 91
3 RESEARCH DESIGN AND METHODOLOGY 93
3.1 INTRODUCTION 93
3.2 EMPIRICAL ECONOMETRIC ANALYSIS 94
3.3 RESEARCH DESIGN 97
3.4 RESEARCH METHODOLOGY 98
3.4.1 Sampling and Data Collection 98
3.4.2 Data Sources 100
3.4.3 Validity and Reliability of the Data 101
3.4.4 Measures of Traditional performance tools 102
3.4.5 Measures of Management’s Dividend Decision 105
3.4.6 Measurement of economic performance tools 107
3.4.7 Measures of Created Shareholder’s Value 120
3.5 CONCEPTUAL FRAMEWORK 123
3.6 HYPOTHESIS DEVELOPMENT 125
xiii
3.6.1 Hypothesis One 126
3.6.2 Hypothesis Two 126
3.6.3 Hypothesis Three 127
3.6.4 Hypothesis Four 128
3.6.5 Hypothesis Five 128
3.6.6 Hypothesis Six 129
3.6.7 Hypothesis Seven 130
3.7 PANEL DATA ANALYSIS 130
3.7.1 Pooled regression Model 132
3.7.2 Fixed Effects Model 133
3.7.3 Random Effects Model 134
3.8 STATISTICAL METHODS USED IN THE RESEARCH 135
3.8.1 Unit Root Tests 136
3.8.2 Johansen Co-integration Analysis 139
3.8.3 Error Correction Model 140
3.9 CONCLUDING REMARKS 142
4 RESULTS AND FINDINGS 143
4.1 INTRODUCTION 143
4.2 DEFINING THE VARIABLES 144
4.2.1 Independent variables 144
4.2.2 Dependent Variable 145
4.3 SUMMARY OF DESCRIPTIVE STATISTICS 146
4.4 RESIDUAL DIAGNOSTIC TEST 149
4.4.1 Histogram–Normality Test 149
4.4.2 Test for heteroscadasticity 152
4.4.3 Serial Correlation Test 155
4.5 UNIT ROOT TEST 157
4.6 JOHANSEN CO-INTEGRATION TEST 160
4.7 ERROR CORRECTION MODEL (ECM) 164
4.8 MODEL SPECIFICATION METHOD 165
4.8.1 Pooled OLS Regression Method 167
4.8.2 Fixed Effect Model 168
4.8.3 Random Effect Model 170
4.9 HYPOTHESIS TESTING 175
4.10 CHAPTER SUMMARY 180
5 SUMMARY, CONCLUSION AND RECOMMENDATIONS 181
5.1 SUMMARY AND CONCLUSION 181
5.2 CONTRIBUTION OF THE STUDY 187
xiv
5.2.1 Practical contribution to body of knowledge 188
5.2.2 Contribution to the industry 189
5.3 LIMITATION OF THE STUDY 191
5.4 RECOMMENDATION FOR FUTURE RESEARCH 192
REFERENCES 195
A ANNUAL REPORT DATA 225
B CALCULATED DATA 247
C CERTIFICATE OF PROOFREADING 308
xv
LIST OF FIGURES
Figure Page
1.1 Growth rate of Malaysian GDP and other sectors from 2003− 2014 6
2.1 ROCE using income statement and balance sheet items 44
2.2 Theoretical base on dividend policy 52
2.3 Flow from equity market value to created shareholder’s value 89
2.4 Management decisions and Shareholder’s equity 90
3.1 Portfolio of diversification 116
3.2 Conceptual Framework 124
4.1 Scatterplot of CSV with the independent variables 148
4.2 Histogram for normal distribution and descriptive statistics 150
4.3 Theoretical distributions of the variables CSV, EPS, EVA, DPR,
MVA, ROA, ROE, ROCE and NOPAT 150
4.4 Actual, fitted, residual graph 153
xvi
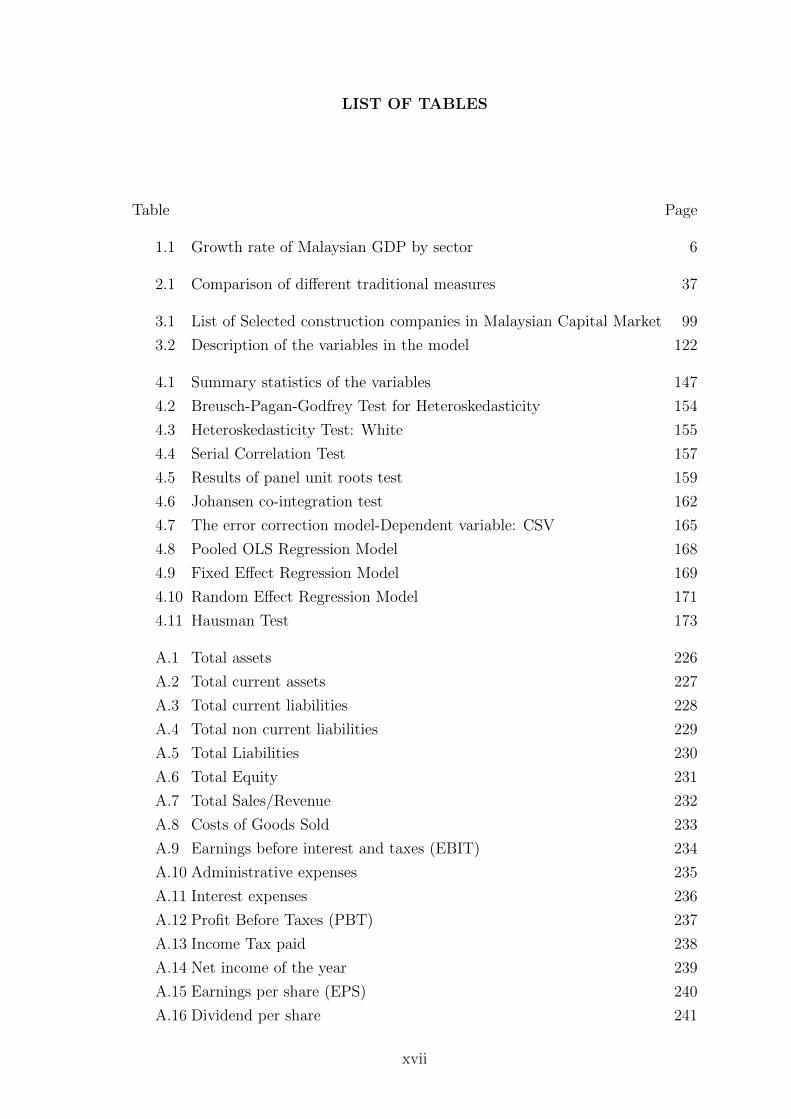
LIST OF TABLES
Table Page
1.1 Growth rate of Malaysian GDP by sector 6
2.1 Comparison of different traditional measures 37
3.1 List of Selected construction companies in Malaysian Capital Market 99
3.2 Description of the variables in the model 122
4.1 Summary statistics of the variables 147
4.2 Breusch-Pagan-Godfrey Test for Heteroskedasticity 154
4.3 Heteroskedasticity Test: White 155
4.4 Serial Correlation Test 157
4.5 Results of panel unit roots test 159
4.6 Johansen co-integration test 162
4.7 The error correction model-Dependent variable: CSV 165
4.8 Pooled OLS Regression Model 168
4.9 Fixed Effect Regression Model 169
4.10 Random Effect Regression Model 171
4.11 Hausman Test 173
A.1 Total assets 226
A.2 Total current assets 227
A.3 Total current liabilities 228
A.4 Total non current liabilities 229
A.5 Total Liabilities 230
A.6 Total Equity 231
A.7 Total Sales/Revenue 232
A.8 Costs of Goods Sold 233
A.9 Earnings before interest and taxes (EBIT) 234
A.10 Administrative expenses 235
A.11 Interest expenses 236
A.12 Profit Before Taxes (PBT) 237
A.13 Income Tax paid 238
A.14 Net income of the year 239
A.15 Earnings per share (EPS) 240
A.16 Dividend per share 241
xvii
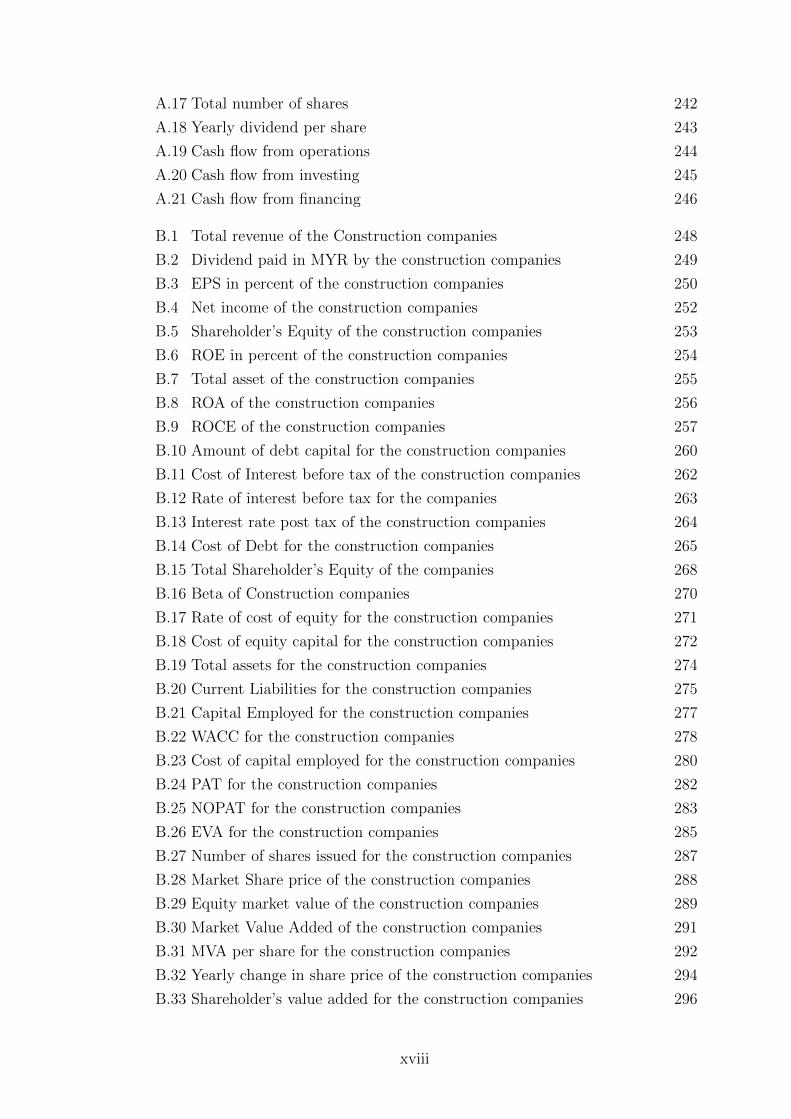
A.17 Total number of shares 242
A.18 Yearly dividend per share 243
A.19 Cash flow from operations 244
A.20 Cash flow from investing 245
A.21 Cash flow from financing 246
B.1 Total revenue of the Construction companies 248
B.2 Dividend paid in MYR by the construction companies 249
B.3 EPS in percent of the construction companies 250
B.4 Net income of the construction companies 252
B.5 Shareholder’s Equity of the construction companies 253
B.6 ROE in percent of the construction companies 254
B.7 Total asset of the construction companies 255
B.8 ROA of the construction companies 256
B.9 ROCE of the construction companies 257
B.10 Amount of debt capital for the construction companies 260
B.11 Cost of Interest before tax of the construction companies 262
B.12 Rate of interest before tax for the companies 263
B.13 Interest rate post tax of the construction companies 264
B.14 Cost of Debt for the construction companies 265
B.15 Total Shareholder’s Equity of the companies 268
B.16 Beta of Construction companies 270
B.17 Rate of cost of equity for the construction companies 271
B.18 Cost of equity capital for the construction companies 272
B.19 Total assets for the construction companies 274
B.20 Current Liabilities for the construction companies 275
B.21 Capital Employed for the construction companies 277
B.22 WACC for the construction companies 278
B.23 Cost of capital employed for the construction companies 280
B.24 PAT for the construction companies 282
B.25 NOPAT for the construction companies 283
B.26 EVA for the construction companies 285
B.27 Number of shares issued for the construction companies 287
B.28 Market Share price of the construction companies 288
B.29 Equity market value of the construction companies 289
B.30 Market Value Added of the construction companies 291
B.31 MVA per share for the construction companies 292
B.32 Yearly change in share price of the construction companies 294
B.33 Shareholder’s value added for the construction companies 296
xviii
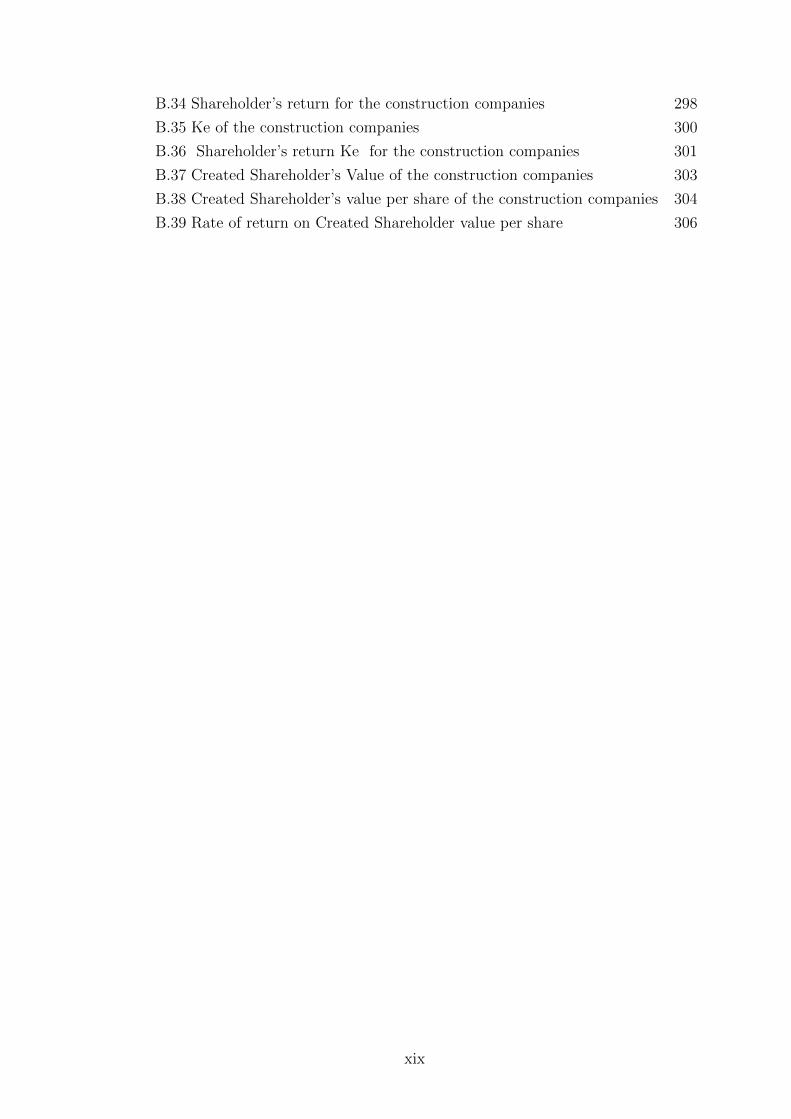
B.34 Shareholder’s return for the construction companies 298
B.35 Ke of the construction companies 300
B.36 Shareholder’s return Ke for the construction companies 301
B.37 Created Shareholder’s Value of the construction companies 303
B.38 Created Shareholder’s value per share of the construction companies 304
B.39 Rate of return on Created Shareholder value per share 306
xix
CHAPTER 1
INTRODUCTION
1.1 INTRODUCTION
The real value of corporations is one of the most important things that share-
holders and investors care about (Lin and QIAO, 2009). The primary goal of most
firms is to maximize shareholder value (Brigham and Ehrhardt, 2005). Likewise,
McTaggart et al. (1994) also believed that shareholder’s value maximization allows
managers and board of directors to resolve any conflicts to all stakeholder’s long term
benefits. Shareholder’s value creation has been an important issue for managers as it
is the driving force behind strategic and operational decisions. Shareholder’s value
means meeting the expectation of shareholders at the heart of the management
decisions. Value based management is a management process that links strategy,
measurement and operational processes towards creating shareholder’s value. In
other words shareholder’s value is the sum of all strategic decisions that affect the
firm’s ability to efficiently increase the amount of free cash flow over time (Bontis
et al., 1999; Gamba and Triantis, 2008).
In a market driven economy many companies will create value and many
other companies, however, will undoubtedly destroy it (Grant, 2003). For corporate
managers, value creation is fundamental to the economic survival of the company.
No company will be able to continue to exist if it fails to create sufficient value
1
for their shareholders. In other words the company not generating value addition
in their wealth will struggle to survive and over a period of time will be either a
subject of takeover or liquidation. According to (Worthington and West, 2001):
“Shareholder’s value is traditionally assessed by either standard accounting magni-
tudes such as profits, earnings and cash flows from operations or financial statements
ratios such as earnings per share,return on assets or capital employed” (p.76).
The linkage between the value based performance measures and creation of
shareholder’s value has been the debatable issues for academicians and practitioners
in the last decade. Corporate managers and executives have engaged in the de-
bate on whether the new value based economic measures are highly significant for
shareholder’s value creation than the old traditional performance measures. The
main goal of managers is to attempt to maximize the shareholder’s value. However,
the manager’s decisions favor the interest of non-shareholders or stakeholders at the
expense of shareholders (Brigham and Ehrhardt, 2013). Furthermore, Irala et al.
(2006) mentioned that managers are encouraged to undergo projects that could
increase shareholder’s value using measurement tools like economic value added
(EVA).
According to Lee (1996), for years, investors and corporate managers have
been seeking a timely and reliable measurement of shareholder’s value. With such a
measure, investors could spot over-or under- priced stocks, lenders could gauge the
security of their loans and mangers could monitor the profitability of their factories,
divisions and firms.
It has been a traditional goal for the managers of the corporate level to
maximize shareholder’s value. In the economy that is market driven many firms
create value for their shareholders whereas some of them certainly destroy it. The
managers that fail to identify the importance of shareholders in an open economy,
2
do so for their own careers and the peril of the firms (Grant, 2003). According to
Stern Stewart Company, the following fundamental conditions are necessary for
increasing the shareholder’s value:
• A solid understanding of how the business is valued by the market
• A management system that drives market-based decisions about resource al-
location and management deep into the organization
• An incentive structure that makes managers think and act like owners
• A commitment to continuous improvement rather than short-term goals
In the past few years it has been an ultimate goal of an organization to make
a revolutionary change in the measurement of performance from the traditional
profit based measures like Earning per Share (EPS), Return on Capital Employed
(ROCE), Return on Equity (ROE), Net Profit Margin (NPM), Operating Profit
Margin (OPM)and Net Operating Profit After Tax (NOPAT) to the new mod-
ern economic value based performance measures like Market value Added (MVA),
Shareholder’s Value Added (SVA), Cash Value Added (CVA), Equity Market Value
(EMV), Created Shareholder’s Value (CSV), Economic Value Added (EVA). Out
of the value based measures, EVA has received high attention as an important per-
formance measurement tool for the corporate performance and shareholder’s value
maximization. EVA helps the entity to focus on how to use capital and how to
generate cash from it. Managers are able to care about managing assets and income
and help in bringing up balance between them through EVA.
There are traditional measures like EPS, ROE, ROA and ROCE have been
used by the shareholders to measure performance appraisals. Such traditional mea-
sures have been criticized due to not inclusive of the cost of capital resources of the
firm (Hasani and Fathi, 2012). Nevertheless, the traditional profit measures of the
net income include depreciation costs (Historical fixed cost and long term assets)
and interest cost (Cost of Debt). However, the net income does not include the
3
equity cost that determines the return of investors. In addition, the performance
measures based on the net income and operating income promote and help man-
agers in short term decision making. Furthermore, in order to overcome such issues
economic value based measures like the economic value added (EVA), Market Value
Added (MVA) and Shareholder’s Value Added (SVA) were proposed (Al Mamun
et al., 2012; Erasmus, 2008).
1.2 INDUSTRY OVERVIEW
Construction industry is a major consumer of capital resources due to its
magnitude, complexity and nature of the work it executes. The construction in-
dustry is considered to be those companies involved in the physical construction of
house building, infrastructure, industrial construction, commercial construction and
building materials (Chan et al., 2005). However, the cost management strategies
in the construction industry worldwide still remain a chronic challenge (Chigara
et al., 2013). Thus there is a need for suitable tool to control the operations and all
aspects of costs including the opportunity cost of capital and taxes. Construction
industry in Malaysia is divided into two main categories: i.e. general construction
and Special Trade Works (CIDB, 2007).
The Oxford Business Group (Group, 2008) highlighted a range of issues that
the Malaysian construction industry suffered from. There is deep concern that the
Malaysian construction industry as a whole is under achieving in the following areas
as reported by (Alfan and Zakaria, 2013):
• It has a low rate of profitability;
• The construction industry has remained a very fragmented industry where dif-
ferent activities in the entire value chain of the construction processes are being
4
undertaken by different parties, often undertaken in isolation, thus resulting
in inefficiencies;
• The segregation of design and construction activities which is widely practiced
does not encourage consideration for factors like savings in labour utilisation,
ease of maintenance, construction safety and the practicality of construction
methods
• Due to the problem of escalating costs, construction companies are therefore
striving to reduce and control their cost related activities.
Prior to the 1997 Asian financial crisis, Malaysia had attained robust eco-
nomic growth since the 1980s. However, following the 1998 crisis and its protracted
negative impact, the economic growth has moderated. An economic decline in de-
mand and a reduction in the real estate had greatly influenced the monetary policy of
Malaysia. The construction industrial sector is an important part of the Malaysian
economy. Construction industry contributes 5% of GDP and employs 3% of the
workforce all over the world. For the Malaysian market, the construction industry
contributes 11.4% of GDP for year 2010 and 18.9% in 2012 (Malaysian Economic
Report 2012 and 2014) as shown in figure 1.1.
The 1997 Asian financial meltdown resulted in many economic casualties,
including Malaysia. The construction industry consequently contracted significantly
due to the plunge in private investment, with its contribution to GDP sliding from
RM 9,552 million in 1997 to RM 7,241 million in 1998. With prudent initiatives
put in place, the economy was lifted out of the doldrums, registering an impressive
GDP growth of 6.1% in 1999 and 8.3% in 2000, far surpassing the - 7.4% in 1998.
Since the financial crisis in 1998, the construction sector growth rate has not reached
anywhere near the pre-1998 growth rates reaching its highest at 2.1% in 2001 and
declining to 2.0% in 2002, 1.5% in 2003 and into a contraction of -1.5% in 2004
estimated to improve to -1.1% in 2005. However, from the year 2007 till 2014, the
5
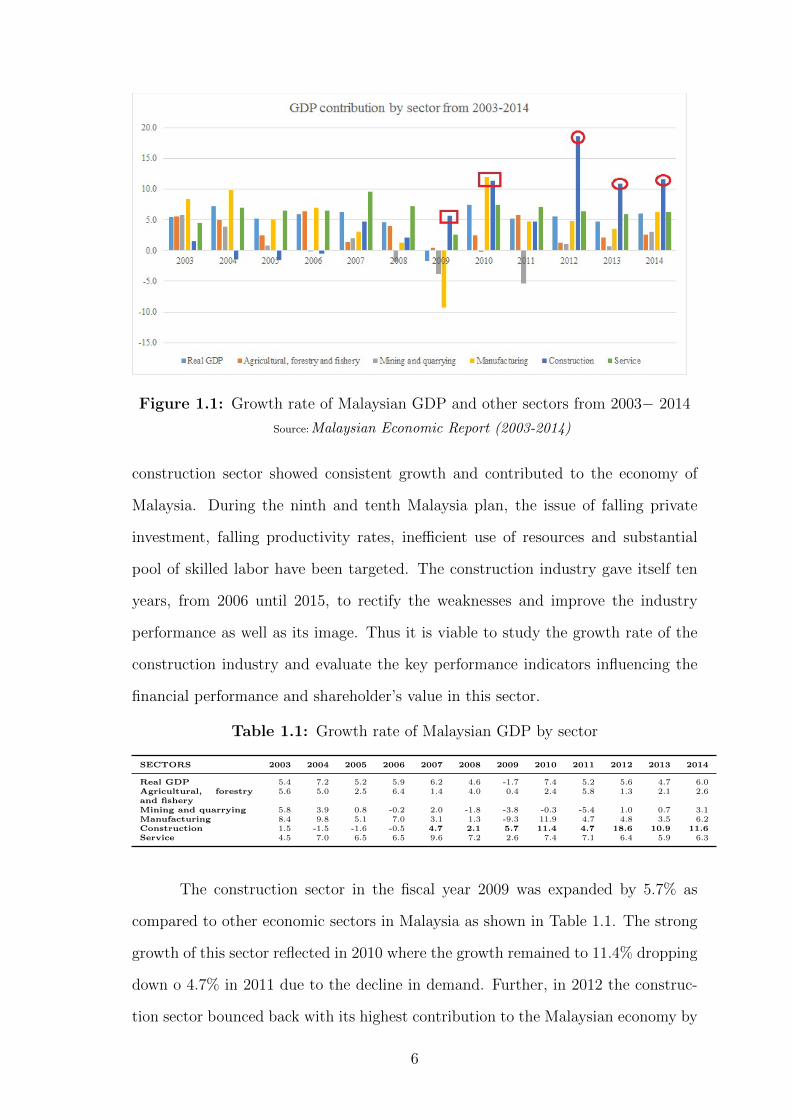
Figure 1.1: Growth rate of Malaysian GDP and other sectors from 2003− 2014
Source:Malaysian Economic Report (2003-2014)
construction sector showed consistent growth and contributed to the economy of
Malaysia. During the ninth and tenth Malaysia plan, the issue of falling private
investment, falling productivity rates, inefficient use of resources and substantial
pool of skilled labor have been targeted. The construction industry gave itself ten
years, from 2006 until 2015, to rectify the weaknesses and improve the industry
performance as well as its image. Thus it is viable to study the growth rate of the
construction industry and evaluate the key performance indicators influencing the
financial performance and shareholder’s value in this sector.
Table 1.1: Growth rate of Malaysian GDP by sector
SECTORS 2003 2004 2005 2006 2007 2008 2009 2010 2011 2012 2013 2014
Real GDP 5.4 7.2 5.2 5.9 6.2 4.6 -1.7 7.4 5.2 5.6 4.7 6.0Agricultural, forestryand fishery
5.6 5.0 2.5 6.4 1.4 4.0 0.4 2.4 5.8 1.3 2.1 2.6
Mining and quarrying 5.8 3.9 0.8 -0.2 2.0 -1.8 -3.8 -0.3 -5.4 1.0 0.7 3.1Manufacturing 8.4 9.8 5.1 7.0 3.1 1.3 -9.3 11.9 4.7 4.8 3.5 6.2Construction 1.5 -1.5 -1.6 -0.5 4.7 2.1 5.7 11.4 4.7 18.6 10.9 11.6Service 4.5 7.0 6.5 6.5 9.6 7.2 2.6 7.4 7.1 6.4 5.9 6.3
The construction sector in the fiscal year 2009 was expanded by 5.7% as
compared to other economic sectors in Malaysia as shown in Table 1.1. The strong
growth of this sector reflected in 2010 where the growth remained to 11.4% dropping
down o 4.7% in 2011 due to the decline in demand. Further, in 2012 the construc-
tion sector bounced back with its highest contribution to the Malaysian economy by
6
18.6%. This strong growth of the sector contributed heavily in the economic stim-
uli of the country. In addition, Esa et al. (2006) mentioned that the construction
industry has played a key role in the socio- economic development of Malaysia. How-
ever, Ariff and Lopez (2008) uttered that Malaysian companies have been investing
abroad since mid of 1970s. With the formation of ASEAN Free Trade Area in 1992,
Malaysian companies were to invest abroad in the ASEAN countries. Likewise, Esa
et al. (2006) also acknowledged that the globalization of construction market not
only brings along competition and challenges but also provides opportunities by
opening new markets.
As customer’s needs and expectations intensify, construction companies needs
to strive to construct highest quality with minimal cost. This move would help the
construction companies to get projects that are crucial in order to sustain their mar-
ket share. The focus of the study is to provide financial strategy matrix based on
generating profit exceeding the cost of capital and manage sales growth of the con-
struction companies listed in the main board of the Bursa Malaysia stock exchange.
1.3 PROBLEM STATEMENT
Financial statement failure in determining the firm’s true value has drawn
wide research focus in investigating the broadened gap between the firm’s market
and book value (Othman et al., 2012). Furthermore, studies like (Lev and Rad-
hakrishnan, 2003; Lev and Zarowin, 1999; Vijayalakshmi, 2014) mentioned that in
reality traditional accounting measures and economic measures have failed in re-
flecting the company’s true value due to lack of creating long term sustainability
of business and their issue of distortion. One of the key obstacles for the share-
holders is in identifying the key performance tools that can help them getting the
company’s accurate profit information. For managers, it has been a great challenge
to increase their earnings keeping in view of the shareholder’s return as they both
7
reflects historical performance (Bhunia, 2012). According to Baker (2002) it is not
the performance measures that have been criticized in the past three decades but its
distortion. Performance measures derived from accounting profits like profit, earn-
ings, cash flow can be easily distorted and manipulated by the managers for their
own benefits. Likewise, Stewart (1991) suggested EVA as an economic measure for
the solution to accounting distortion. However, even this measure is not left without
criticism as EVA still uses accounting information for its calculation. EVA has also
been criticized for explaining the firm’s short term indicator of value (Geyser and
Liebenberg, 2003; van der Poll et al., 2011). Thus it is confirmed that despite of
long success, EVA still has a number of issues in use. Thus a much debated question
is how can the shareholder’s value be maximized?
A study performed by Ab Razak et al. (2008) suggested that the reason
of poor performance of Malaysian organization may be attributed to agency prob-
lem. Most of the public listed companies in Malaysia are still using traditional
performance measures that consider accounting profits or ratios for measuring share-
holder’s return. Traditional method uses accounting profit or ratios like earnings
per share or return on the shareholder’s equity. Over the years financial indicators
like ROA, ROE, EPS and many others are being strongly criticized as they are not
able to measure the cost of capital owned. Similarly,Nahar Abdullah (2004) argued
that in Malaysia, ratios are widely used by the companies in order to measure firm
value, may not be able to measure and capture firm’s performance which is created
over the period. Furthermore,Al Mamun et al. (2012) mentioned that after more
than one decade of the crisis Malaysian firms still stick with the conventional perfor-
mance measures which are criticized due to general accepted accounting principles.
Malaysia is suffering from having a suitable performance measurement tool which
can help the investors to assess value created on their investment (Ismail, 2011).
Moreover, Vijayalakshmi (2014) mentioned that there are varieties of measures to
show the value creation for shareholders, but none of the traditional measures are
8

able to explain the variation in the shareholder’s value. In addition, the earnings per
share that is known to be as profit based measure is criticized due to its absence in
the balance sheet. EPS disregards the value of assets used to generate the balanced
sheet.
To illustrate, Abdullah et al. (2005) pointed out that dividend payment is a
signal of performance of firms. If dividend increases, share price will also increases,
which leads to the creation of shareholder’s value. In addition, Appannan and Sim
(2011) mentioned that Malaysia as a developing country still lack of research on
dividend policy and its determinants for the public listed companies. Nevertheless,
in reality, most of companies focused more on making profit rather than maximizing
the shareholder’s value. Even in Malaysia particularly, most of the companies do
not emphasis so much on dividend and do not have a proper dividend policy except
for several large, well-established companies. Furthermore, Zakaria et al. (2012) also
supported the findings that in Malaysia, since there is no standard policy or proce-
dure governing dividend payments, companies therefore decides freely on how much
dividend to pay to its shareholders. Ideally, companies should give or distribute prof-
its earned on a particular year in the form of dividend to the shareholders as satisfied
shareholders will have confidence in the companies and ultimately contribute more
to the company to support its growth. This is actually increasing the value of the
company’s shares, which will lead to the maximization of shareholder’s value.
According to Kapoor (2011) shareholder’s value maximization is the sum of
all strategic decisions in increasing earnings, dividend and market value, but no pre-
vious study has investigated it all together. The use of earnings that is explained
by traditional measures, economic profits explained by economic measures like EVA
and MVA and dividends that is crucial strategic management decision have not
been investigated theoretically and empirically. Similarly, de Wet (2005) supported
the traditional accounting indicators like EPS and ROE along with EVA in driving
9
shareholder’s value. Thus a combination of traditional measures, economic mea-
sures and management’s dividend payout decisions can play an important role in
addressing the issue of shareholder value maximization. Finding the best compa-
nies in the market place is of primary importance for the investment managers and
shareholders. With proper financial tools, portfolio managers may be able to en-
hance their active performance over and above the returns available on similar risk
indexed passive strategies. The present study fills a gap in the literature and pro-
vides an important opportunity to advance the understanding on the firms’ strategic
decisions within the aspects of earnings, market value and dividend based measures
as the benchmark in determining shareholder’s value.
1.4 AIM OF THE RESEARCH
The main aim of this study is to investigate all the aspects of shareholder’s
value creation empirically by determining the influence of traditional measures like
EPS, ROA, ROE and ROCE, economic measures like EVA and MVA and dividend
payout decisions for the period of 2003 to 2012 for construction companies listed in
the Bursa Malaysia stock exchange. A further aim would be to determine if there
is any relationship between traditional, economic and dividend payout measures
within the respective sector.
1.5 RESEARCH OBJECTIVE
The primary objective of this research is to empirically testing the asser-
tion that the combination of earnings, market value and dividend payout is highly
associated with shareholder’s value creation. The main objective of the research
is to provide investors a strategic approach that can evaluate the performance of
construction companies effectively and assist them to use the economic strategies in
order to maximize shareholder’s value. This research work is particularly aimed to
10
accomplish the following objectives:
• To study and analyze the impact of traditional accounting measures (EPS,
ROA, ROE, ROCE) on the shareholder’s value creation in Malaysian con-
struction listed companies.
• To study the relationship between economic value based measures (EVA and
MVA) and shareholder’s value creation in Malaysian construction listed com-
panies.
• To investigate the relationship between management’s dividend payout deci-
sions and shareholder’s value creation.
1.6 RESEARCH QUESTION
The research questions to be tested are derived from the notion that the
combination of earnings, market value and dividend payout decisions is more likely
associated with shareholder’s value creation. Thus this study poses the following
questions:
1. To what extent the traditional performance measures creates the shareholder’s
value of Malaysian listed construction companies?
This research question aimed (i) to develop a framework of the drivers of
shareholder’s value creation and (ii) to identify how a particular traditional
measures affects it. Various traditional measures like EPS, ROA, ROE and
ROCE were examined to study their impact on shareholder’s value creation.
2. Does economic value based measures dominate in explaining shareholder’s
value creation of Malaysian listed construction companies?
In order to obtain a comprehensive answer, the study tried to identify the most
significant predictor among traditional and economic value based measures
that explains the shareholder’s value creation of Malaysian listed construction
sector.
11
This study tries to explain the application and advantage of EVA and MVA
principles for the evaluation of shareholder’s value of the Malaysian listed
construction companies. The main purpose was to interpret economic realities
of the selected organizations. Thus the second question involves a series of
computations to reach the numbers of EVA and MVA.
3. Is there any statistical relationship between dividend payout decisions and
shareholder’s value creation?
These three research questions form the foundation of this study. Whilst
the first research question explores the direction and strength of the relationship
between EPS, ROA, ROE, ROCE and CSV; the second research question investi-
gates the effect of EVA and MVA on CSV and finally; the third one investigates
the influence of dividend payout decisions in predicting shareholder’s value. The
study compared the traditional performance measures, economic value based mea-
sures and dividend payout of the Malaysian listed construction companies on the
basis of their background indicators and financial performance measures.
1.7 SCOPE OF THE STUDY
This research is based on the published financial reports of the construction
companies and all the information published in financial reports would be consid-
ered while doing this research. Financial decisions taken by the managers reflects
the long term strategies of the companies. Therefore the financial reports of at least
10 years would be taken into consideration for studying performance measures and
shareholder’s value creation. The study covers the construction companies which
are listed in Bursa Malaysia stock exchange. As per the statistical reports of Con-
struction Industry Development Board (CIDB), construction industry in Malaysia
is a major consumer of capital resources. However, this sector has remained a very
isolated industry as different activities in the construction process are being under-
taken by different entities resulting to inefficiencies. Even then the construction
12
industry has the highest contribution to Malaysia’s GDP. This is the rationale rea-
son to select Construction Industry in order to examine implications of performance
measures in relation to shareholder’s value creation.
The financial years, 2003 to 2012, have been taken into consideration for the
purpose of the study and for testing the hypothesis. This study consists of seven
hypotheses and in order to support the results of the panel data set, unit root test,
causality test, co-integration test, OLS regression analysis and Hausman test for
confirming fixed or random OLS regression model were performed.
1.8 SIGNIFICANCE OF THE STUDY
The significant of the study becomes more evident when considering Malaysian
companies that contemplate competing in the global market. When competing in
the global market, investors will have the ease of options to put their investment
where they can best achieve the highest returns. All this will further pressure com-
panies to maximize shareholder’s value. This study will be a significant endeavor in
the corporate decision making and internal strategy enhancement of the managers
favoring corporate stakeholders. This study will further benefit the investors and
financial analysts for evaluating and monitoring the organization and their perfor-
mance. This study will also be helpful to the students, academicians and practition-
ers in the corporate finance and business management when they employ effective
and critical analysis in their workplace and research modeling. By understanding
the needs of the shareholders and benefits of the performance measures, managers
will be assured of a competitive advantage and shareholder’s confidence. Moreover,
this research will provide recommendation on how to evaluate the performance of a
certain corporate in accordance to the corporate finance and management perspec-
tive. Also it is of interest to see if companies in Malaysia use dividend policy as a
tool in giving value to shareholders. In addition to the dividend aspects of firm’s
13
overall financial policy, this research will also try to discover if any traditional or
economic measures exists to maximize shareholder’s value.
Moreover, this study will be helpful to the industry and business practition-
ers in the area of understanding performance measurement tools, objectives and
strategies for the shareholder’s value maximization. It will also serve as a future ref-
erence for researchers on the subject of shareholder’s value creation and corporate
performance. And importantly, this research will educate investors in deciding on
whether an industry is really fulfilling its responsibility to the value creation or just
showing off to attract the investors for its business.
1.9 THEORETICAL BASE
From the past decades, creating firm value and shareholder’s value has been
a debatable issue in the literature of corporate finance and economics. By appro-
priate allocation of resources by the managers the target of value creation can be
achieved. Extant theoretical and empirical researches in financial economics also
accept shareholder’s value maximization as the primary and ideal goal on which
organization decision should be based.
According to the agency theory, managers or top management must use their
efforts for maximizing the value of shareholders instead of the corporation as share-
holders are considered to be the true owners of the firm. However, the duty of
care and loyalty towards the corporation can still be found in many guides pro-
vided by the top management but the responsibility towards shareholders are not
addressed. Shareholders who are considered as the true owners of the company
are prioritized after all other stakeholders like suppliers, debt holders, government
agencies, paying taxes and other obligations under state and federal securities laws
are satisfied. Thus the agency theory for shareholder’s value is still questionable.
14
According to the recent article published by Smith (2013) a share is very weak legal
promise. Shareholders are considered as outsiders for the company and no informa-
tion like the company judgment in future prospects, future acquisition and plan for
new products can be shared with them due to its competitive sensitiveness. The
only thing shareholders can do is to trust the accounting information disclosed by
the managers and take their investment decisions. Shareholders due to their vot-
ing rights play a crucial role in monitoring performance of the managers. Agency
theory links shareholder’s value with managerial incentives in order to avoid con-
flict of interest between managers and the shareholders (Roth and O’Donnell, 1996).
Stakeholder theory was put forward by (Freeman, 1984) with the perspective
of strategic management and has been adopted by many market based organizations
as a means of management. The main weakness of the stakeholder theory is that
it is not focused on the goal of the shareholder’s value maximization only and is
bound to serve all the stakeholders in the corporation and has been criticized too
due to its vagueness and ambiguity. Furthermore, the stakeholder theory argues that
managers must take decisions in favor of all the stakeholders. Thus such theory is
more attractive to the self-interest of the managers and directors due to their multi-
ple stakeholders and goals. Firm value cannot be maximized by ignoring the value
of stakeholders (Jensen, 2001). While it is difficult to present a widely accepted
and well-defined form of the stakeholder theory, the essential message conveyed by
nearly all of the stakeholder theorists is the rejection of the primacy of the share-
holders. In other words, the stakeholder theory challenges the basic premise built
into the corporate finance theory, teaching and practices. While the theory has its
origins in academic work relating to business ethics and business and society, it is
finding much broader audience and a general, perhaps conditional, acceptance and
respectability in business disciplines such as strategy. Thus both the agency theory
and stakeholder theory were facing critiques that made this research to reconcile
the paradigm of agency theory and stakeholder theory favoring the shareholder’s
15
value maximization. Due to such criticism of the stakeholder and agency paradigm,
confidence level of the shareholders on the corporation has been diminished in the
past decades. Therefore there is a need of additional measures to address the loss
of confidence.
Performance measures help the shareholders to increase their confidence level
on the corporation. The concept of economic and traditional measures as a perfor-
mance measurement tool is central to the shareholder’s value. EVA is a dominant
feature of economic measures whereas; traditional measures are based on accounting
profits like EPS, earnings, profit, cash flows and other financial ratios. According to
previous studies (Chen and Dodd, 1997; Lehn and Makhija, 1997; Rogerson, 1997)
unfortunately none of the traditional measures like net profit, earnings, cash flow
and other financial ratios can be relied for explaining the value of shareholders. EVA
in the form of economic based performance measures suggested by (Stewart, 1994)
was a good approach as it includes economic profit and net present value of the
firm. The main advantage of EVA is it includes the opportunity cost of capital by
the firm. Even this measure (EVA) is not left without criticism.. Due to its reliance
on economic profit apart from accounting profit, EVA is downgraded during high
inflation period (De Villiers, 1997).
The efficiency of EVA has also been criticized by studies like (Biddle et al.,
1997; Chen and Dodd, 1997; Fernandez, 2002; Tortella and Brusco, 2003). The main
reason to criticize EVA was its lack of analyzing stock market reaction by the firms
when adopting EVA. EVA has also been criticized due to its lack of adoption by the
corporates. According to Fernandez (2002) a low correlation was observed between
EVA and MVA whereas NOPAT and WACC were having high level of correlation
with MVA. Biddle et al. (1997) after examining the EVA data provided by Stern
Stewart it was found that the operating cash flow performs better than EVA for
the shareholder’s value. In response to these claims an emerging literature has
16
addressed on the issue whether EVA is more highly associated with shareholder’s
value than the accounting based measures. After analyzing the literature on EVA
it was noticed that there is a mixed result for its role on the shareholder’s value.
From such mixed results there can be theoretical argument on the properties of
EVA. There have been many studies that discussed on the characteristics of EVA,
but they also questioned on its utility. Thus it can be said that there is a research
gap on identifying measurement tool for shareholders value creation.
1.10 MOTIVATION OF THE STUDY
This study is motivated to fill the theoretical gap identified in the above
section of the theoretical framework. Shareholder’s value is the sum of all strategic
decisions that is delivered to shareholders due to the management’s ability to in-
crease earnings, dividends and market value that increase free cash flow over time
(Kapoor, 2011). Previous studies like (Issham et al., 2008; Lin and QIAO, 2009; Vi-
jayalakshmi, 2014)also claimed that earnings, cash flow and market value increase
the firm ability and performance, but so far all the studies reviewed, have suffered
from the fact that dividend payout to shareholders is a major value for them. Even
though it is evidenced from the theoretical concept that strategic decisions of the
firms must be towards earnings, dividends and market share price but there is still
lack of studies that focus on all the aspects. This study contributes by including
the accounting measures based on earnings and profits, economic measures based
on market value of the present cash flow and dividend payout decisions based on
earnings before interest and taxes and earnings per share as the shareholder’s value
maximization in the Malaysian construction sector.
This study investigates the influence of economic and accounting measures
on the shareholder’s value maximization. Variable proportional influence of the
performance measures and dividend payout decisions with the shareholder’s value
17
is an academic contribution of the study. Contribution related to economic mea-
sures, traditional measures and dividend payout decisions by the leading studies
of Chen and Dodd (1997), Rogerson (1997);Lehn and Makhija (1997) and Kapoor
(2011) is indeed worth mentioning, but none of these studies has employed inter-
active relationship of variables related to the shareholder’s value maximization of
the construction sector. The investigation on the interactive relationship between
the variables was suggested by (Freeman et al., 2004) who mentioned that value is
not created by the independent contribution of isolated factors but by investigating
the cooperation among the factors. The main reason to include economic measures
like EVA and MVA for investigating shareholder’s value was motivating managers
in the form of operational learning that is created by managers probably with the
cooperation of other stakeholders that may contribute to create the economic value
for the shareholders and corporations in the future.
However, there is an inconsistency with this argument that economic and
traditional measures are effective as performance measurement tool for the share-
holders; this study contributes by focusing on the cost of capital formulated based
on CAPM model. CAPM model is the most dominant model used by practition-
ers to estimate the cost of equity. The components of EVA calculation are taken
into account differently than other studies explaining the shareholder’s value and
contributing most to variation in EVA. Furthermore, this research aims to propose
an alternative and additional performance tool for shareholders and managers to
gain their internal strategy of handling cost of operational, capital and future de-
velopments. The introduction of key performance measures will have the following
benefits:
1. It will increase the awareness of the construction industry to a new way of
measuring the success of their organization;
2. It will be a constant reminder for the construction companies that their contin-
ued existent is reliant on generating value for their shareholders which can be
18
better achieved through the introduction of an effective performance measures;
3. The result of this study should serve as an indication that managers ought to
take into account the opportunity cost of capital in their business activity.
The anticipated contribution that will come out from the findings of this study is to
establish a different way of analyzing the data and representing shareholder’s value.
Therefore, it is suggested that this different way should provide an improved alter-
native to existing accounting practice in the industry since it will take into account
the opportunity costs of all capital and it corrects for potential distortions inherent
in the adoption of GAAP. Consequently, a better measure of the value that a com-
pany has created for the shareholders in the period of accounting can be achieved.
This study is motivated by the controversial results of the previous researches
that appeared in different variations. If companies and strategic decision makers em-
ploy this model, they will have better understanding on maximizing shareholder’s
value from this segment perspective than if they use the existing traditional account-
ing measures.
1.11 OUTLINE OF THE THESIS
The study is organized as follows:
Chapter 2 highlights review of literatures based on the value based management
techniques like traditional measures, economic measures and dividend policies for
the creation of shareholder’s value. Furthermore, this chapter highlights the key
theoretical underpinnings considered to make the empirical study more focused.
In chapter 3, empirical research design along with research hypothesis and data
analysis techniques are described. In chapter 4, the results of empirical statistical
investigation are presented to test each hypotheses and interpreted in detail. Finally,
chapter 5 summarizes, concludes and recommends for future studies by taking into
consideration additional aspects.
19
1.12 CONCLUDING REMARKS
Over the last three decades or so, there has been a growing concern among
business analysts, academics, and professional managers that traditional accounting
measures of performance are no longer appropriate for the purpose of strategic deci-
sions and control. The EVA and MVA which is a residual income that subtracts the
cost of capital has been a real improvement over the traditional accounting measures.
However both traditional and economic measures have been criticized for identifying
the value of shareholders. This study explores the assertion that a combination of
earnings, market value and dividend payout would improve identifying shareholder’s
value creation. In the following chapters this issue will be thoroughly investigated
and examined empirically.
20
CHAPTER 2
PERFORMANCE MEASURES AND SHAREHOLDER’S VALUE:
LITERATURE REVIEW
2.1 INTRODUCTION
The creation of shareholder’s value is one of the important goals in the orga-
nization. The importance of company valuation has been increasing eventually over
the past decades. In the capital market the valuation of company plays a crucial role
and shows dynamic growth of the company transactions (Hillman and Keim, 2001).
The concept of company valuation includes investment, operational and financial
decisions. When focusing on the valuation of company question arises of who might
be interested in the resulting numbers. A more specific and general answer would
be all the stakeholders (Jensen, 2001).
Stakeholders are the group of people who are affected by or can affect the
organization’s activities such as shareholders, debt holders, customers, employees,
suppliers or management. In order to identify the value of stakeholders, there are
many accounting based and economic based measurement tools that work in the
goal of maximizing shareholder’s value. Economic Value Added (EVA) as a value
based measure is used to measure the performance of organization by calculating
the shareholder’s value (Sharma and Kumar, 2010). According to Brigham and
Houston (2011), “EVA has been widely adopted by management to make effective
21
financial decisions and increase profitability and productivity in assisting to invest
in new capital and which under performing assets to liquidate” (p.223). In addition,
EVA also assists investors to measure company performance and decide which share
to invest in. Traditional accounting measures rely on earnings to calculate and
identify shareholder’s value. Shareholders heavily considered traditional accounting
measures as the best measures for maximizing shareholder’s value. However, there
has been growing awareness on the traditional measures to be non-reliable to risk
and inflation (Che and Li, 2011; Venanzi, 2012). Other reasons for the failure of
earnings to measure the economic value of the business are:
1. Employment of an alternative accounting methods
2. Dividend policy is not considered
3. Ignorance of time value of money
According to Sundaram and Inkpen (2004) an organization that treats its
stakeholders unethically will not be able to create long run business. Furthermore,
Freeman et al. (2004) suggested that managers must prioritize stakeholders’ inter-
ests, but added further that such sentiments are not guided for decision making.
This study has reviewed many previous studies that provide information in the area
of EVA and shareholder’s value. Different resources have been used by the researcher
to compile the information on the research area. Performance measurement has been
used previously by organizations to control and ensure their organizational strate-
gies in order to achieve organizational goals.
Performance measurement is defined as how well organization is managed and
the value they deliver for customers and other stakeholders. Performance measure-
ment is the ongoing monitoring and reporting program accomplishment, towards
pre-established goals. Performance measurement is used for the improvement in
the process by monitoring the operation, planning and forecasting by serving as a
progress check, meeting the competition by identifying weak areas and addressing
22
them to sharpen their competitive edge, rewarding and motivating employees who
have excelled in achieving goals, to help the organization in complying with the
government regulations and standards. According to Richard et al. (2009) “there
are many performance measurement tools available, but which tool would be useful
to meet the organization goals is the main issues for the organizations”(p.67). Max-
imizing shareholder’s value is always being criticized and is inconsistent with the
firm’s other constituencies. This study examines the influence of management deci-
sion of construction industry on shareholder’s value using dividend payout decisions
examined by the dividend payout ratio, value based measures like EVA, MVA and
traditional measures like Earning per Share (EPS), Return on Capital Employed
(ROCE), Return on Equity (ROE), and Return on Assets (ROA). The next section
highlights the underlying theories that have been focused upon in order to investi-
gate the theme of shareholder’s value maximization.
It is still not clear, whether shareholders have enough knowledge to pick a
company’s new direction accurately. Thus it becomes the responsibility of the man-
agers or company’s decision makers to provide accurate information about com-
pany’s future directions. Having made an investment in a business, shareholders are
concerned with assessing the profitability of their investment. The decisions made
by managers determine what they can expect both in terms of dividends, or profits,
and capital growth, both of which are reflected through the share price.
Neely et al. (2002) in their book mentioned that companies must play an
important role in delivering value to their shareholders. Strategies, processes and
capabilities need to be linked to each other in order to understand how they fit
together towards satisfying shareholder’s and organization’s wants and needs. It
is critical to ensure that they are aligned and integrated with one another if the
organization is to be best positioned to deliver real value to all of its stakeholders.
Below are the five elements that the shareholders look in the business to perform:
23
1. Raising Financial Performance
In order to meet company’s objective of delivering superior returns and take
measures to meet financial targets.
2. Sharpening the culture
To become an organization where all its employees are more accountable, ag-
gressive, and adaptive in pursuit of goals.
3. Value based management
Analyzing the business, the market in which it operates, its strength and
weaknesses with those of its competitors to maximize returns for shareholders.
4. Leadership capability
Leadership in managers is must to ensure company achieves its goals. Com-
pany need to identify leaders who are capable of motivating their teams,
achieving objectives and delivering results in their outlook.
5. Rewards
Company must align the interests of employees as closely as possible with the
interests of shareholders. This can be done by rewarding employees for the
creation of value and encouraging them for future goals.
Finally, managing for value has realigned the company with the interests of
its shareholders. The move towards a value based culture would renew vigor and
momentum in the company. Next section highlights some important theories that
is crucial for the investigation on shareholder’s value creation.
2.2 THEORIES UNDERLYING SHAREHOLDER’S VALUE AND PER-
FORMANCE MEASURES
Various studies dealing with the theoretical applications of traditional per-
formance measures, economic based performance measures and dividend payout
24