Embed Size (px)
Citation preview
1
The influence of the VAT increase on consumer prices1
Master Thesis in Economics and Taxation
Student: Jonneke Dijkstra
Supervisor: Hendrik Vrijburg PhD
Final version: September 2013
Abstract: This thesis studies the effect of the VAT increase on consumer prices in the Netherlands.
The main question is whether the current period of economic downturn has led to a delayed pass
through of the VAT increase into consumer prices. The first part consists of a theoretical study on the
effects of a VAT change; the second part is an empirical investigation of the 2001 and 2012 VAT
increases in the Netherlands. I estimate the impact of the VAT increase by performing a difference in
difference analysis. I find that both VAT increases have been fully shifted into consumer prices. I
assess the results to different robustness check, including a common correlated effects estimation
(Pesaran: 2006) and a difference in difference analysis using another control group. The robust checks
yield the same results. The 2001 VAT increase is fully passed forward in the month of
implementation. The results of the robustness analysis provide some evidence for a delayed pass
through of the October 2012 VAT increase.
Key words: Value Added Tax (VAT) increase; inflation; recession
JEL classification: E31, H22
1 I thank my supervisor Hendrik Vrijburg for his enthusiasm and his helpful comments and suggestions. I thank Martin
Mellens for the time he has put into supervising during my internship at the CPB Netherlands Bureau of Economic Policy
Analysis; Leon Bettendorf and Daniel van Vuuren from the CPB for their constructive comments on this study. All
remaining errors are my own.
2
Table of Contents
1 Introduction .......................................................................................................................................... 3
2 What mechanisms influence the pass through of a VAT increase into consumer prices? ................... 5
2.1 Introduction .................................................................................................................................. 5
2.2 The role of the competition setting .............................................................................................. 5
2.2.1 Perfect competition ............................................................................................................... 6
2.2.2 Imperfect competition ........................................................................................................... 6
2.3 Asymmetric tax shifting ................................................................................................................ 9
2.4 Price-elasticity of consumers ....................................................................................................... 9
2.5 Other factors ............................................................................................................................... 11
2.6 The impact of a recession on the pass through of a VAT change ............................................... 11
2.6 Conclusion .................................................................................................................................. 11
3 Empirical evidence on the pass-through of a VAT change on consumer prices. ............................... 13
3.1 VAT increase the Netherlands 2001 .......................................................................................... 13
3.2 VAT increase Germany 2007...................................................................................................... 13
3.2.1 Deutsche Bundesbank ......................................................................................................... 13
3.2.2 Carare & Danninger ........................................................................................................... 14
3.3 VAT increase/decrease France 1995 and 2000 ........................................................................... 15
3.4 Temporary VAT cut United Kingdom 2008 ............................................................................... 15
3.5 VAT changes in Switzerland 1995, 1999 and 2001 .................................................................... 16
3.6 Conclusions & Summary ............................................................................................................ 16
4 Data and descriptive statistics ............................................................................................................ 18
5 Methodology ...................................................................................................................................... 23
6 Results ................................................................................................................................................ 26
6.1 Results base specification .......................................................................................................... 26
6.2 Robustness checks....................................................................................................................... 30
6.2.1 Splitting panel over time ..................................................................................................... 30
6.2.2 Time-series analysis ............................................................................................................ 32
6.2.3 Difference in difference analysis - Belgium ....................................................................... 34
6.2.4 Common Correlated Effects (CCE)-Estimator ................................................................... 35
6.3 Conclusions ................................................................................................................................. 38
7 Conclusion ......................................................................................................................................... 41
References ............................................................................................................................................. 42
Appendix 1 ............................................................................................................................................ 44
Appendix 2 ............................................................................................................................................ 45
3
Chapter 1: Introduction
On October 1, 2012 the Dutch standard Value Added Tax (VAT) rate has been changed from 19% to
21%. Companies would like to shift the burden of this VAT increase into consumer prices. They can
do this by raising consumer prices, which will lead to a higher inflation. However, from economic
theory it is known that the degree to which changes in VAT rates can be shifted to consumer prices
depends on several factors, such as competition in the market and the elasticity of demand and supply
(Taxud: 2011). Among these factors is the influence of the business cycle (Blundell 2009), which
might be particularly relevant for the Dutch situation in 2012. Due to the weakness of consumer
expenditures in 2012, suppliers may have decided to shift only a small part of the increase in the VAT
rate into consumer prices. The purpose of this thesis is to quantify the effect of last year’s policy
change of consumer prices.
Understanding the inflationary effect of the raise in Dutch VAT-rate is also of interest for policy
makers. According to Carare and Danniger (2008) many advanced economies have experienced
eroding of direct tax bases as labor and capital have become more mobile. Therefore many
governments are considering a shift towards indirect taxation. Raising income from VAT is a policy
of many governments throughout the euro zone. For those governments it is important to know the
macroeconomics implications of such a shift. Therefore the research question I want to address is:
What is the influence of a VAT increase on consumer prices?
The first part of this thesis consists of a theoretical framework from economic literature. Chapter 2
pays attention to the economic incidence of a VAT increase. I will describe mechanisms that affect
the degree to which changes in the VAT rate are passed forward to consumers. A number of papers
have already studied the question of commodity tax shifting (e.g. Katz & Rosen: 1985 and
Carbonnier: 2005). Furthermore, in chapter 3, I will pay attention to papers that empirically
investigate the effect of an increase in the VAT rate. I expect these papers to provide me some
information on consumer and producer behavior. Besides, these papers will provide me ideas about
how to measure the VAT effects and the variables I should include as control variables.
After providing a theoretical framework, in the second part of my thesis an empirical investigation on
the effect of the VAT increase on consumer prices will be conducted. I use data from Statistics
Netherlands on the development of inflation of goods subjected to the standard VAT rate and the
general VAT rate. Chapter 4 provides information on the data set, as well as some descriptive
statistics. In order to investigate the aforementioned effect, I estimate inflation in VAT items relative
to non-VAT items. I adopt the methodology of Carare and Danninger (2008) and estimate the
inflation rate of a commodity item by a static and dynamic linear model using fixed effects.

4
Differences in inflation between the two groups which cannot be accounted for by standard
determinants of inflation are due to the VAT increase. I elaborate on this methodology in chapter 5. In
chapter 6 the results are discussed. Besides, I assess the estimated coefficients of the VAT dummies to
four robustness checks. In chapter 7 I present the conclusions of this thesis and discuss the policy
implications of the results.
5
Chapter 2: What mechanisms influence the pass through of a VAT increase
in consumer prices?
2.1 Introduction
In this chapter I will describe mechanisms that affect the degree to which changes in the VAT rate are
passed forward to consumers. The key question of this study is whether the VAT on commodities is
completely shifted into consumer prices and paid by consumers or that part of it is paid by firms. To
assess this issue, incidence analysis needs to be done. Tax incidence is the study of who bears the
burden of the tax. According to Fullerton and Metcalf (2002) distinction needs to be drawn between
statutory incidence and economic incidence. The statutory incidence of a tax refers to the distribution
of tax payments based on a legal obligation. Economic incidence measures the changes in economic
welfare in society arising from a tax. It is about who loses real income (Fullerton and Metcalf: 2002).
Because of tax shifting, economic incidence often differs from statutory incidence. For example,
changes in the VAT might be passed through to consumers. Producers rise consumer prices, so
consumers have to bear (part of) the burden. Incidence analysis is important for several reasons
(TAXUD: 2011). First, it is of interest how the economic burden influences the behavior of
households and firms and what is the impact on the economy. Second, it is of interest how different
groups in the population will be affected by a tax change, e.g. whether low-income households are
more affected than high-income households. The main question is: Is the VAT on commodities
completely shifted into their prices, or does part of the incidence fall on firms (in which case it falls
on workers or capital owners, as firms do not pay taxes)? In this chapter I will describe mechanisms
that affect the degree to which changes in the VAT rate are passed forward to consumers.
2.2 The role of the competition setting
One of the things that affect the pass through of an increase in the VAT rate is the competition setting.
In this section I describe the situation of perfect competition and imperfect competition.
2.2.1 Perfect competition
In the situation of perfect competition both producers and consumers are price takers. The price of a
good is determined by demand and supply. The increase of the VAT rate raises the consumer price.
Firms will supply the same amount if the market prices are increased by the amount of the tax
payment such that the firms receive the same revenues as before the increase of the VAT rate.
However, as the consumer prices are higher, consumers demand less of the good. This leads to a new
intersection of the supply and demand curve (TAXUD: 2011). Under perfect competition, taxes
cannot be over-shifted. The tax shifting parameter (the degree to which a tax increase is shifted onto
consumer prices) is always less than or equal to 100% (Carbonnier: 2006). In the figures below can be
6
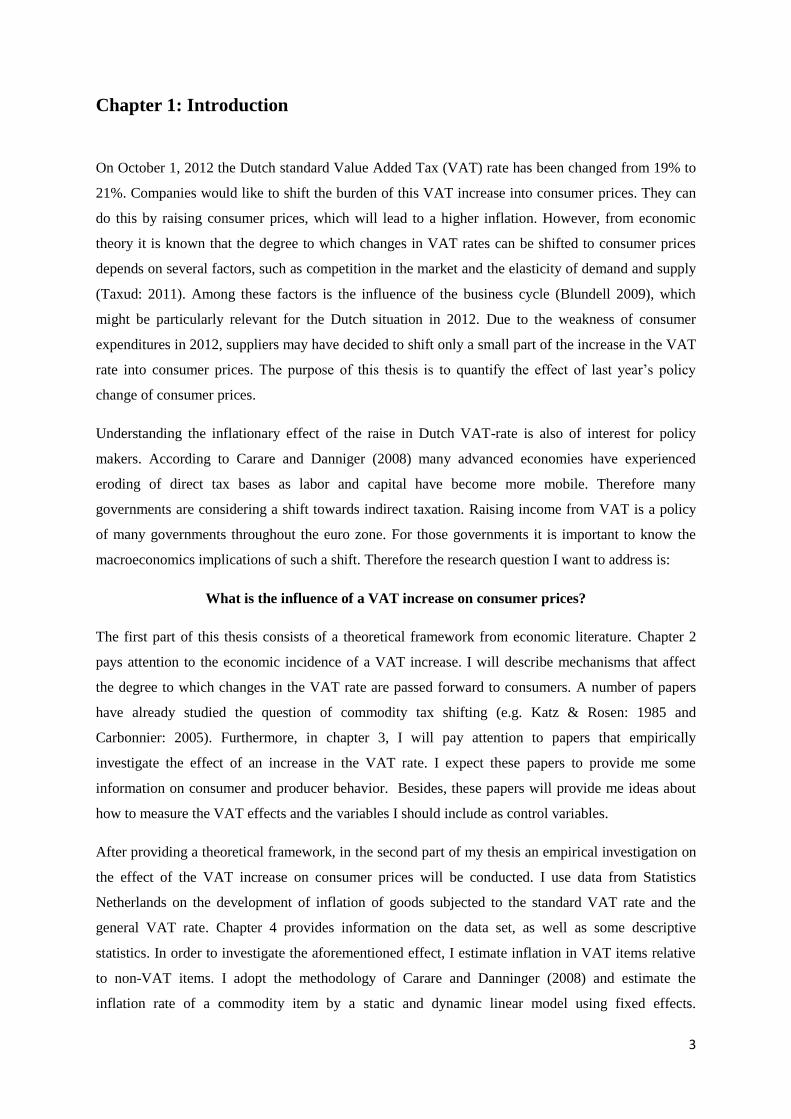
seen that the impact of a VAT on the price depends on the elasticity of demand and supply. The
elasticity shows the responsiveness of demand or supply to a change in the price of goods. The
elasticity determines whether the tax shifting parameter is close to 100% or to 0%.
Figure 2.1: impact VAT increase on price Figure 2.2: impact VAT increase on price.
Perfectly elastic supply
Source: TAXUD 2011 Source: TAXUD 2011
From the figures can be learned that the one with the most inelastic curve has to bear the biggest part
of the VAT increase. As shown in figure 1 a VAT increase raises the price of a good. The supply
curve shifts to the left as producers still supply the same amount of goods. However, as goods became
more expensive, consumers consume less and the amount traded decreases to Q*. The flatter the
curve, the stronger consumers respond to a tax increase and the bigger the distance between P** and
P* (the part of the VAT increase that is borne by producers). In case of a downward sloping demand
curve and an upward sloping supply curve (see Fig. 1) both suppliers and consumers have to bear a
part of the VAT increase, as always less than the tax will be shifted into consumer prices. Figure 2
shows that when the supply curve of a taxed consumption good is completely elastic, consumers have
to bear the complete burden. This is the case when marginal costs are constant. If the elasticity of
demand is perfectly elastic, suppliers will not be able to pass a VAT increase forward to consumers.
Therefore, it is necessary to analyze the behavior of consumers and producers with respect to a change
of the VAT rate, to be sure on who bears the burden of taxation.
2.2.2 Imperfect competition
Usually, competition is not perfect but limited. In case of imperfect competition the market consists
out of several firms (Stiglitz: 1997). Each of the firms is aware that its sales depend on the price it
charges and other actions that it takes, such as advertising. Firms have some market power. In
literature several forms of imperfect competition are studied. Bertrand and Cournot oligopolies and
7
monopolistic competition are most often studied. Below I will pay attention to tax shifting in these
three competition settings.
Bertrand model
The Bertrand model is characterized by firms choosing the price at which goods are sold in the
market. Products of the firms are homogenous. This means that firms produce goods which are
perfectly equivalent from the perspective of a consumer. Furthermore, it is assumed that there are no
capacity constraints. So, one firm is able to handle the complete demand for a good and production
costs are linear (TAXUD: 2011). The price equilibrium is as follows: firms compete by lowering their
prices until all firms set the price equal to their common marginal costs. So, in a Bertrand model
prices are equal to unit costs and no firm earns economic profits. Therefore, an increase in the VAT
rate would be shifted completely forward into prices, since the producer price cannot fall below
marginal cost (Fullerton and Metcalf: 2002). This means that supply is perfectly elastic and that the
burden of the tax increase is on consumers.
Cournot model
Most of the empirical studies done on tax incidence consider a Cournot oligopoly (e.g. Katz & Rosen:
1985, Besley: 1989, Delipalla and Keen: 1992). In a Cournot model firms are price takers but choose
the level of output. In the model firms take into account the impact of their output decision on
aggregate output and therefore on the price (TAXUD: 2011). The higher the aggregate output, the
lower will be the market price. A lower market price means less excess profits for the firm.
According to Fullerton and Metcalf (2002) over-shifting can occur in a Cournot setting. Over-shifting
occurs when the price of a good rises by more than the increase of the tax rate. This is possible
because of the existence of market power and strategic behavior among firms. When a tax is shifted
forward, demand for a good will decrease. Therefore, under the circumstances explained below, firms
in a Cournot setting will raise the price more than the increase in tax to compensate for the revenue
loss from the decreased demand.
Following TAXUD (2011) the degree of price shifting of taxes depends on (1) the demand function of
households, (2) the cost function of firms, (3) the number of firms and (4) the extent of competition
the firms perceives. I will briefly explain these factors below. The reader is referred to TAXUD
(2011) for a more detailed discussion of these factors.
1. The demand function of households: under-shifting occurs when demand reacts more strongly
to a price increase than a price decrease. The higher the original price level, the stronger the
effect of the price increase. When it is the other way around, and demand reacts less strong to
price increases, over-shifting becomes more likely. In that situation the demand decrease gets
8
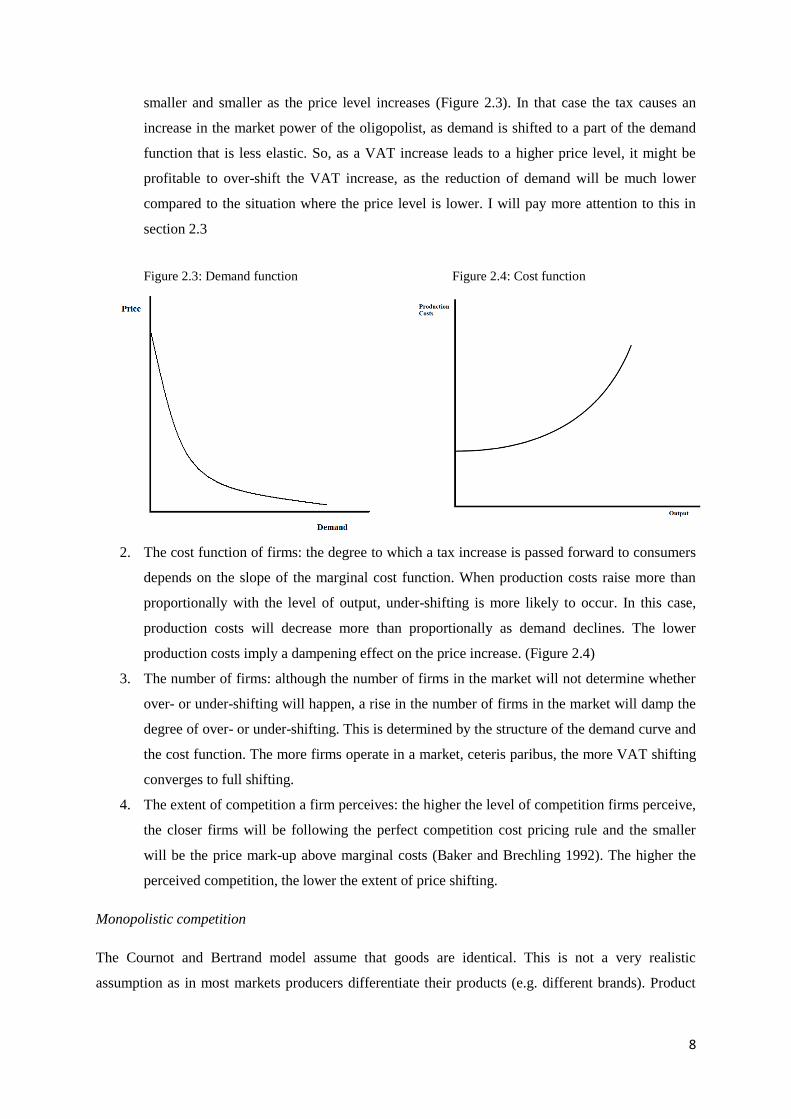
smaller and smaller as the price level increases (Figure 2.3). In that case the tax causes an
increase in the market power of the oligopolist, as demand is shifted to a part of the demand
function that is less elastic. So, as a VAT increase leads to a higher price level, it might be
profitable to over-shift the VAT increase, as the reduction of demand will be much lower
compared to the situation where the price level is lower. I will pay more attention to this in
section 2.3
Figure 2.3: Demand function Figure 2.4: Cost function
2. The cost function of firms: the degree to which a tax increase is passed forward to consumers
depends on the slope of the marginal cost function. When production costs raise more than
proportionally with the level of output, under-shifting is more likely to occur. In this case,
production costs will decrease more than proportionally as demand declines. The lower
production costs imply a dampening effect on the price increase. (Figure 2.4)
3. The number of firms: although the number of firms in the market will not determine whether
over- or under-shifting will happen, a rise in the number of firms in the market will damp the
degree of over- or under-shifting. This is determined by the structure of the demand curve and
the cost function. The more firms operate in a market, ceteris paribus, the more VAT shifting
converges to full shifting.
4. The extent of competition a firm perceives: the higher the level of competition firms perceive,
the closer firms will be following the perfect competition cost pricing rule and the smaller
will be the price mark-up above marginal costs (Baker and Brechling 1992). The higher the
perceived competition, the lower the extent of price shifting.
Monopolistic competition
The Cournot and Bertrand model assume that goods are identical. This is not a very realistic
assumption as in most markets producers differentiate their products (e.g. different brands). Product
9
differentiation creates some monopoly power. Producers have to decide at which price their
differentiated products are sold.
Fullerton and Metcalf (2002) find that in a situation of differentiated products an ad-valorem tax has
no impact on producer price but is entirely shift forward to consumers. Besides, under the assumption
of constant elasticity and linear cost result, an excise tax will be more than 100 percent forward
shifted. However this situation is not very likely to happen, as it assumes perfectly elastic supply.
2.3 Asymmetric tax shifting
One of the factors that affect the degree to which a VAT-increase is shifted forward in a Cournot
model is the shape of the demand function of households and the cost function of firms. According to
Carbonnier (2005) asymmetric (non linear) properties of the supply and demand curve may cause
asymmetric tax shifting. As mentioned in section 2.2, the shape of the curves determines whether
under- or over-shifting will occur. In this section I will go more into detail about asymmetric tax
shifting.
First, due to asymmetric properties in the production process, the supply curve can be asymmetric. It
is harder for firms to increase their production than to decrease it. Increasing the production requires
new machines and new workers. Following a decrease of the VAT rate, an increase of supply is
needed to observe a decrease of prices. Producers face high marginal costs when expanding the
production to meet the increase in demand that follows the lower price. These constraints on supply
increases lead to smaller price decreases than price increases. According to Carbonnier (2005) labor
intensive services represent a competitive market, whereas capital intensive products are
representatives of an imperfectly competitive market. He found that on (1) labor intensive markets
(perfect competition) firms reflect commodity tax variations more fully in consumer prices when the
taxes increase than when taxes decrease. (2) For each capital intensive product (imperfect
competition) it was the other way around.
With respect to (2), Carbonnier suggest that firms on an imperfectly competitive market might take
into account demand reactions. He proposes demand asymmetry arguments. Due to psychological
effects or to the shadow price of changing one’s consumption habits, customers might react stronger
to important price variations than to small ones. Imperfectly competitive markets better consider the
variations of demand because of the price making power of firms. In this case price increases might
be relatively weak to prevent the fall of demand. Besides, price decreases might be relatively strong to
take profit of the takeoff of the demand.
10
2.4 Price-elasticity of consumers
As mentioned in section 2.2 the impact of a VAT on the price depends on the elasticity of demand and
supply. Therefore, it is necessary to analyze the behavior of consumers with respect to a change of the
VAT rate, to be sure on who bears the burden of taxation. The price elasticity depends on two
components: the substitution effect and the income effect.
When the price of good X rises, close substitutes become more attractive relative to good X. The cost
of close substitutes decreases in terms of good X. As the substitutes have a lower price, consumers
like to purchase more substitutes. This is the so-called substitution effect. The second effect of a price
increase is to reduce the consumer’s purchasing power. The change in quantity purchased attributable
to the change in purchasing power is the income effect of the price change (Frank: 2008).
The sum of the substitution effect and the income effect is the total effect of a price change, or for this
study: a change in the VAT rate. The substitution effect will always be negative: when price goes up,
quantity demanded goes down. The sign of the income effect depends on whether the good is a
normal good or an inferior good. If good X is a normal good, the income effect is negative: when the
price of good X goes up, the fall in purchasing power causes the quantity demanded to fall. If good X
is an inferior good the effect works the other way around: in that case the income effect is positive.
When the total effect, the price elasticity is zero, the demand curve is perfectly inelastic. In that case
consumers have to bear the full burden of the tax increase. However, this assumption is not very
realistic as it only occurs when the income effect perfectly offsets the substitution effect, or when the
income effect and the substitution effect are both zero.
What is the implication of the theory mentioned above for the degree to which a VAT increase is
passed through to consumers? The higher the total effect, substitution effect and income effect, of a
VAT increase, the higher the price elasticity, the lower the degree to which a VAT increase can be
shifted onto consumers. As the goods subjected to the general tax rate are normal goods (or even
luxury goods), the income effect is negative in case of a VAT increase. Below I will pay attention to
the substitution effect with respect to a change in the VAT rate.
The substitution effect: when the price of good X increases due to an increase of the general VAT
rate, consumers can choose from several substitutes: (1) consume more of good Y (subject to reduced
rate or exempted from VAT). Goods exempted from VAT or subjected to a reduced rate become more
attractive relative to good X. This substitution effect cannot be found in all sectors, as in many sectors
close substitutes are also subjected to the general tax rate. However according to ING (2012) in the
Netherlands this substitution can be found in the housing sector. From empirical studies of the 2001
VAT increase they conclude that existing houses (exempted from VAT) become more attractive
relative to new houses (general tax rate). (2) Consume less and enjoy more leisure. In a basic utility
11
function an individual derives utility from consumption and leisure. When the price of consumption
increases, leisure becomes more attractive. The implication of this theory with respect to a VAT
increase is that as the price of consumption gets higher, consumers will choose to refrain from
consumption and save more. (3) Change the timing of consumption: According to Carare and
Danniger (2008) consumers might anticipate that a part of the VAT increase will be passed on to
them by a higher price. Consumers will therefore bring forward their consumption to before the date
of the VAT increase. Besides, according to Barrell and Weale (2009) individuals may change the
timing of their consumption in relation to the path of expected real interest rates because these affect
the current price of consumption in future periods relative to the present. An anticipated rise in VAT
rates will reduce the expectation of the real interest rate (nominal interest rate adjusted for expected
rate of inflation) in the period immediately before the increase. Due to a reduction in the interest rate,
consumption becomes cheaper. Therefore consumption will increase in the period before the VAT
increase.
As both the income effect and the substitution effect are negative with respect to a VAT increase,
producers will always have to bear a part of the VAT increase.
2.5 Other factors
Baker and Brechling (1992) provide three more practical considerations that might influence the
extent of tax shifting. The first consideration is that firms face significant adjustment costs. This might
result in firms combining the effect of a change of an indirect tax with other marginal cost changes
into single price changes. In this case, adjustment might be delayed. A second reason is that producers
in the short run attempt to keep their prices down by cutting profit margins, hoping that competitors
will be forced to drop out of the market. According to the authors such behavior should be identified
in empirical estimation by a lagged response to duty changes. The last consideration is that firms have
different conjectures on the response of the other firms in the market. This could lead to different
levels of tax shifting and to a delayed response.
2.6 The impact of the recession on the pass through of a VAT change
Another important component of the analysis of the pass through of a VAT increase on consumer
prices is considering whether the recession may have an impact on the degree to which a VAT
increase is shifted into consumer prices. According to Blundell (2009) two characteristics of recession
possibly influence the impact of a VAT change. First, the growth in uncertainty and second, the
increase in the number of families facing credit problems. He refers to a study from Blundell,
Pistaferri and Preston (2008). They found that the recession period in the 1980’s was characterized by
a peak in income uncertainty. A growth in income uncertainty reduces the level of consumption.
12
Thus, uncertainty leads to a higher price elasticity of demand, which makes producers less able to
shift a VAT change into consumer prices.
Purchasing durable goods often requires credit. Following Blundell (2009) the availability of credit is
also important. He argues that the incidence of credit constraints very probably rises in recessions.
Credit constraints can make the income effect more relevant because opportunities for intertemporal
substitution become restricted by a lack of credit.
2.7 Conclusion
The pass through of a VAT increase on consumer prices is influenced by several mechanisms. First,
the degree to which a VAT increase can be passed forward depends on the competition setting. In
different markets (e.g. oligopoly) over- or under-shifting will occur. Besides, literature shows that tax
shifting on prices operates differently upwards and downwards. Furthermore, the impact of a VAT
change on the price level depends on the elasticity of demand. Price elasticity of demand is
determined by the income effect and the substitution effect. For normal goods these effects work in
the same direction. As both the income effect and the substitution effect are negative with respect to a
VAT increase, producers will always have to bear a part of the VAT increase. The higher the price
elasticity of demand, the lower the degree to which a VAT increase can be shifted into consumer
prices. Third, some practical considerations might influence the extent of tax shifting, for example:
adjustment costs and different conjectures on the response of the other firms in the market. Last,
characteristics of recession, like uncertainly, might also have impact on the pass through of a VAT
increase into consumer prices.
13
Chapter 3: Empirical evidence on the pass-through of a VAT change on
consumer prices.
In the past twenty years a lot of research is done on the effects of a change in the VAT rate on
inflation in other countries. In this chapter I will pay attention to these studies. I have to distinguish
between two types of studies. The first group studies the effect of a change in the VAT rate on the
overall price level in a country. The second type concentrates on changes of the VAT rate for specific
goods. According to IHS (2011) the reason that the literature is focusing on tax changes for single
goods is that the prices of the considered goods are assumed to be affected by the business cycle in the
same way as a proper control good. When analyzing the impact of a VAT change on the overall price
level it is more difficult to control for the business cycle. I will focus on the first type of studies, as
these studies are more relevant for my thesis.
3.1 VAT increase The Netherlands 2001
Jonker, Folkertsma and Blijenberg (2004) investigate price setting behavior in the Netherlands. They
also discuss the effect of the VAT increase of January 2001 on Dutch inflation. On January 1, 2001
the Dutch general VAT rate was increased from 17.5% to 19%. They find that the 1.5 percent point
increase in the VAT was almost completely passed through into consumer prices. The authors had to
deal with the problem that in January prices usually fall due to the winter sales. However, in 1999 and
2000 they observe an about 1% lower price in January than in December. In 2001 prices went up with
0.3% from December to January, this suggests a 1.3% higher price increase than in 1999 and 2001.
However, following IHS (2001) the result of Jonker et al. (2004) should be treated with care, as the
authors controlled for the economic environment in a very simple way. They only compare monthly
price changes from December to January in the year of reform, with the price changes in the two years
preceding the reform. Besides it should be kept in mind that the increase in the VAT rate came along
with a decrease of income tax rates.
3.2 VAT increase Germany 2007
3.2.1 Deutsche Bundesbank
The Deutsche Bundesbank (2008) investigates the price and volume effects of the VAT increase in
Germany on January 1, 2007. German standard VAT rates were raised from 16% to 19%. The
motives behind this three percent points increase were raising tax revenues because of the extremely
tight situation of public finance and reducing the heavy burden of social security contributions on
labor. Using intervention analysis the Deutsche Bundesbank estimates the impact of the VAT increase
on the monthly rate of the Harmonized Index of Consumer Prices (HICP). The authors refer to
Valadkhani (2005) for an explanation of their methodology. Intervention analysis can be used to
14
assess the impact of a certain event on the time series of interest. Dummy variables are used to
evaluate the effects of an unusual event. There are the pulse function and the step function. A pulse
function indicates that the intervention only occurs in the single time index t0 whereas a step function
shows that the intervention continues to exist starting with the time index t0 (Tsay 2008). According to
Valadkhani (2005) it is widely believed that an intervention, such as a sales tax (or value added tax)
increase only has a temporary impact on inflation. Therefore the impact of a VAT change on prices
can be measured by a dummy variable, taking the value of zero everywhere, except in the quarter the
VAT change took place. However it is also possible that the effect of the introduction may persist
before or after the VAT change. To capture these effects pulse dummy variables can be added in the
four quarters before and the four quarters after the change. As this study focuses on whether the VAT
increase led to a delayed shift into consumer prices I will use this technique to identify the pattern of
the pass through of the VAT increase. I refer to chapter 5 for a broader explanation.
The Deutsche Bundesbank conducts the analysis for the monthly rate of change of the overall HICP
and for its main subcomponents. The calculations are based on data of the past 17 years. The model
should capture systematic underlying time patterns in the data. To separate the VAT-related price
movements, the Bundesbank controls for additional government measures, seasonal effects, the
medium-term price trend, effects due to crude oil, the exchange rate and special price developments at
the import and producer level. They find that the higher tax rates have been largely passed through to
prices. The pass-through of a higher VAT was effected solely by a higher frequency of price
increases. However, only a small percentage of companies raised their prices at the exact date and by
the full amount of the tax increase. Only a small part of the additional price increases precisely
matched the pure VAT effect, the most of them were much larger. Besides, the Deutsche Bundesbank
finds anticipatory effects in both private consumption and housing construction. The VAT increase
had a dampening effect on the pick-up in domestic economic activity.
3.2.2 Carare & Danninger
Carare and Danninger (2008) also investigate the influence of the VAT increase of January 1, 2007 on
inflation in Germany. They trace inflation of any commodity item over time and relative to items that
are not subjected to the VAT increase, by including VAT dummies that take value 1 for goods
subjected to the VAT increase in a certain period. Inflation is estimated during the announcement
period, the implementation and the post-implementation. The authors control for the euro area wide
inflation effects, time trend and commodity-specific items. As I will largely adopt this approach, I will
elaborate on this methodology in chapter 5.
Carare and Danninger conclude that increases in core inflation in 2007 were smaller than expected.
Contrary to the Deutsche Bundesbank they do not find empirical evidence for a delayed price increase
during 2007. The authors focus on inflation smoothing. Besides they explore whether the
15
development of inflation of goods subject to the VAT increase differs from the development of
inflation of those goods that were not. They find that the inflationary profile of a tax hike is likely
affected by the length of the announcement period. Price adjustment in advance of a VAT increase
can help to smooth the inflation. Two reasons for this inflation smoothing are provided. First, not all
firms adjust their prices every period, because gathering information and changing prices is costly. An
announcement period might lead firms to make larger price increases, since this minimizes the
chances that prices are misaligned in the period after the VAT increase. Second, during the
announcement consumers might anticipate price increases and shift consumption to the period before
the tax increase. Firms may be able to take advantage from this intertemporal consumption shifting by
increasing the price before the VAT hike. They also find that price increases were stronger among
durable goods and in markets with imperfect competition. According to the authors, the inflation
smoothing effect may also explain why there were little further increases among VAT items in the
aftermath of the VAT increase.
3.3 VAT increase/decrease France 1995 and 2000
Carbonnier (2005) studies the economic impact of French commodity tax reforms in 1995 and 2000.
In 1995 the French general VAT rate was increased by two percent points, followed by a decrease of
this rate with one percent point in 2000. He uses difference-in-differences regressions on the prices of
selected goods around both the VAT increase in 1995 and the VAT decrease in 2000. The purpose of
the study is to estimate tax shifting parameters. To estimate the parameters, regressions of the relative
price variations are implemented on the relative tax variations. (x =1 + τt/pt * (pt+1 − pt / τt+1 − τt)). The
parameter is the ratio between the effective after-tax prices following the reform and the after-tax
prices if the pre-tax prices do not follow the reform. If the tax is completely shifted into consumer
prices, x = 100%. X = 0% if the after-tax prices do not change following the reform.
To make this comparison Carbonnier uses monthly data on labor intensive services at one hand and
manufactured products at the other hand, as he assumes that labor is more flexible and therefore labor
intensive services may be represented by a perfect competition model, whereas manufactured
products have high fixed costs and may be better represented by an oligopoly model. He chooses
books as a control index, as these goods have not been affected by any of the VAT reforms. Besides,
regressions are controlled with variables providing information about the production costs. In addition
to the main control variables, Carbonnier also controls café and restaurants consumptions with before
tax prices of alcoholic drinks. He stresses the usefulness of these additional controls.
Carbonnier finds that on a competitive market, the tax shifting parameter is higher upwards than
downwards. This might be due to the fact that the existence of fixed adjustment costs may prevent
firms from decreasing their prices after small VAT decreases. In more collusive markets (oligopoly)
16
the tax shifting parameter is lower upwards than downwards. A potential explanation could be that
demand reactions might be stronger after important price variations than after tenuous ones.
3.4 Temporary VAT cut United Kingdom 2008
Chirakijja et al. (2009) analyze the impact of the 2008 VAT cut stimulus policy on inflation. On
November 24, 2008 UK government announced a decrease of the standard VAT rate from 17.5% to
15% from December 1, 2008 to December 31, 2009. The reason was that the economic situation was
rapidly worsening and the government wanted to stimulate consumer expenses. They adopt the
methodology of Carare and Danniger (2008). They evaluate whether the inflation dynamics of the
items subject to the standard VAT rate is different from that of the non-VAT items across the VAT
cut, having controlled for time trends and seasonal effects. The authors find that about 75% of the
VAT decrease was passed through into consumer prices. They expected a different effect between
durables and non-durables as consumers may bring forward purchases of non-perishable (or storable)
goods to be consumed later. However, they do not find evidence for this effect.
3.5 VAT changes in Switzerland 1995, 1999 and 2001
Kaufmann (2008) investigates price-setting behavior of firms in Switzerland. He also studies the
effect of changes in VAT rates. He finds that tax changes affected the frequency of price increases.
However, he finds that in all three cases, the size of the price increase was slightly lower than in the
two adjoining quarters. The author provides two potential explanations for his findings. First, since
price increases due to a tax increase can be justified in a transparent way, they will not harm the
relationship between retailer/producers and costumer. Second, the tax changes were relatively small
compared to the average size of a price increase. Besides he finds that prices are not adjusted in
anticipation of VAT rate changes. They are adjusted in the quarter in which the VAT rate change
takes effect. He suggests therefore that there must be forces that prevent firms from raising their
prices in anticipation of the VAT increase, as most models imply that firms optimize their prices when
they obtain information about future events. Two reasons: first, price changes related to the increase
of realized cost are easier to communicate to consumers. Second, in a competitive market,
individually taken price increases could lead to a loss in market share.
3.6 Conclusion & summary
From these empirical studies I can conclude that VAT changes lead to a higher frequency of price
increases. In most cases a VAT change will be largely passed through into consumer prices. It is not
sure whether there are different effects between durables and non-durables. Furthermore, the
inflationary profile a VAT increase might be affected by the length of the announcement period.
17
Considering the papers above, I would expect that a big part of the Dutch VAT increase has been
passed through into consumer price. Besides, it could be interesting to investigate whether the earlier
announcement of the VAT increase (May 2012) has led to inflation smoothing.
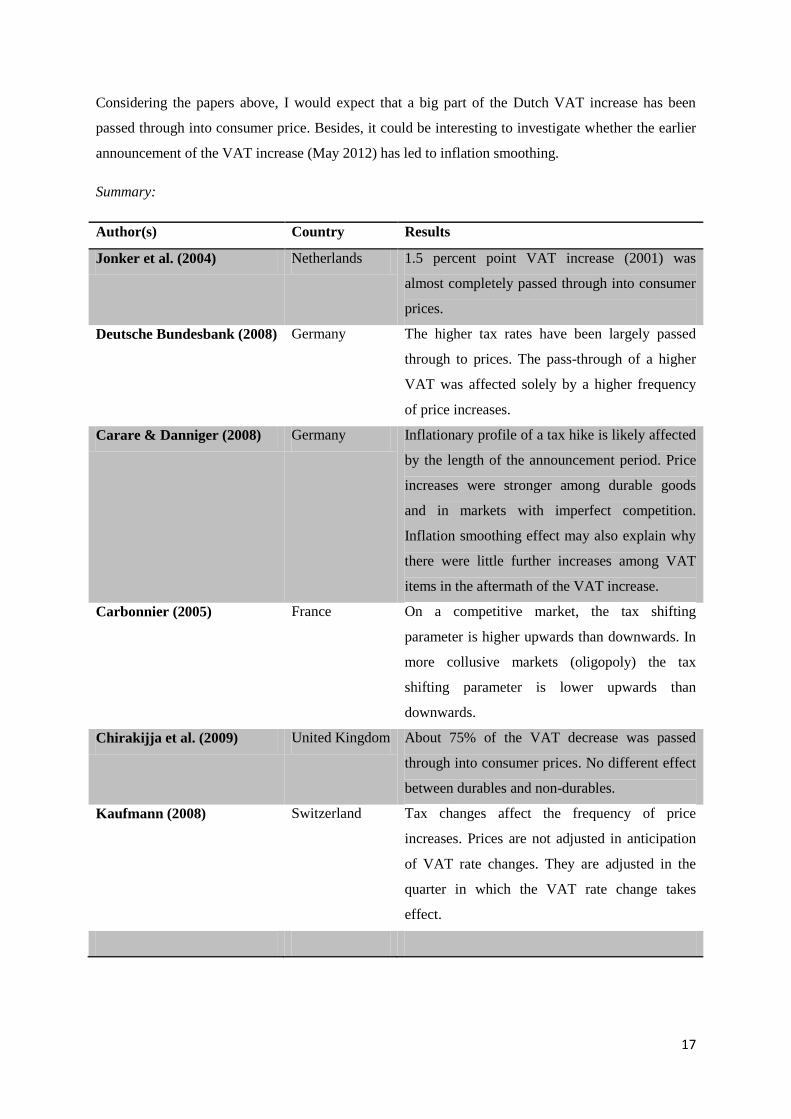
Summary:
Author(s) Country Results
Jonker et al. (2004) Netherlands 1.5 percent point VAT increase (2001) was
almost completely passed through into consumer
prices.
Deutsche Bundesbank (2008) Germany The higher tax rates have been largely passed
through to prices. The pass-through of a higher
VAT was affected solely by a higher frequency
of price increases.
Carare & Danniger (2008) Germany Inflationary profile of a tax hike is likely affected
by the length of the announcement period. Price
increases were stronger among durable goods
and in markets with imperfect competition.
Inflation smoothing effect may also explain why
there were little further increases among VAT
items in the aftermath of the VAT increase.
Carbonnier (2005) France On a competitive market, the tax shifting
parameter is higher upwards than downwards. In
more collusive markets (oligopoly) the tax
shifting parameter is lower upwards than
downwards.
Chirakijja et al. (2009) United Kingdom About 75% of the VAT decrease was passed
through into consumer prices. No different effect
between durables and non-durables.
Kaufmann (2008) Switzerland Tax changes affect the frequency of price
increases. Prices are not adjusted in anticipation
of VAT rate changes. They are adjusted in the
quarter in which the VAT rate change takes
effect.
18
0.0
1.0
2.0
3.0
4.0
5.0
6.0
19
96
19
97
19
98
19
99
20
00
20
01
20
02
20
03
20
04
20
05
20
06
20
07
20
08
20
09
20
10
20
11
20
12
Infl
ati
on
Consumer price
index
Core inflation
HICP
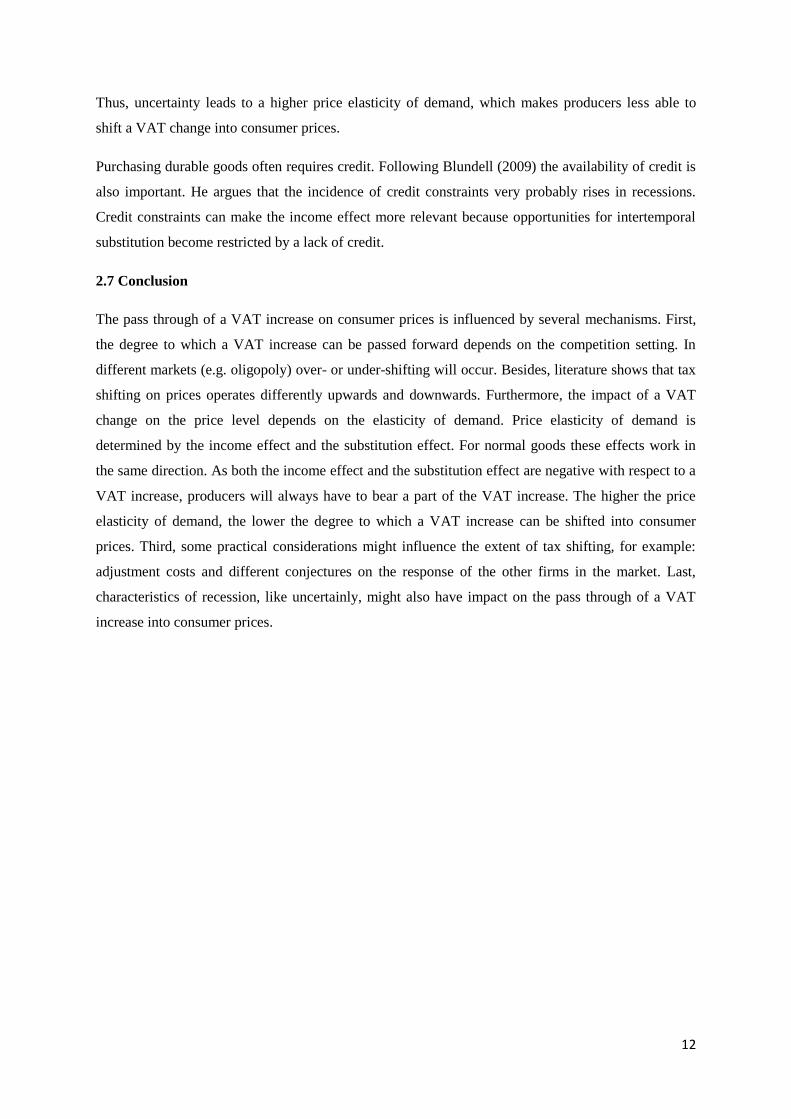
Chapter 4: Data and descriptive statistics
Data
This chapter provides information on the data used and the process of gathering data. Furthermore it
includes descriptive statistics.
A large number of indicators has been proposed to measure inflation. For expository purposes, I will
show five different indicators that are commonly used in economic analysis.
1. Consumer price index (CPI): CPI is the most common used measure for inflation. The index
measures the cost of purchasing a basket of goods and services expressed relative to a base
year in the past.
2. Derived consumer price index: excludes the effect of taxes. This measure is derived
technically from the CPI by the Statistics Netherlands (CBS). As the size of the tax is only
estimated roughly this measure will not be used in this thesis.
3. Core inflation: Some goods, like vegetables and fruits, face volatile price movements. This
measure excludes the effect of food and energy because these products can have price shocks
that deviate from the overall inflation trend.
4. Deflator consumption: measures the price level of household spending.
5. HICP: Harmonized Index Consumer Prices: this index is used for international comparisons
within the EU.
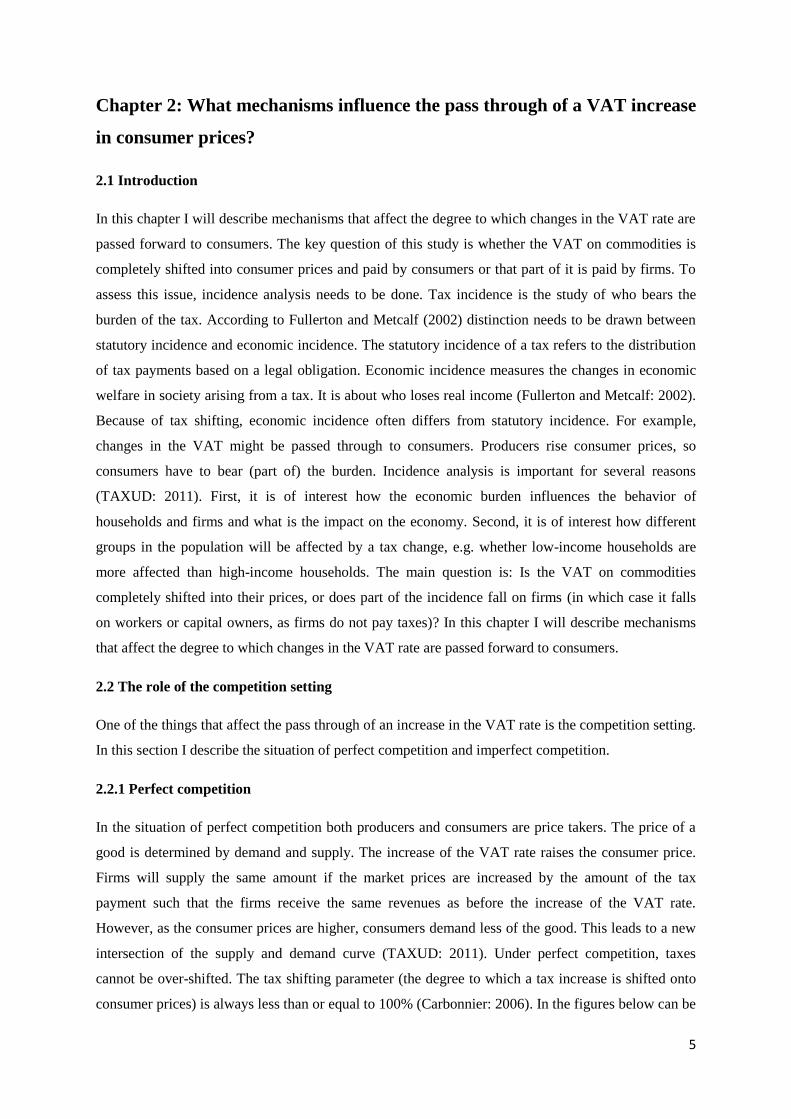
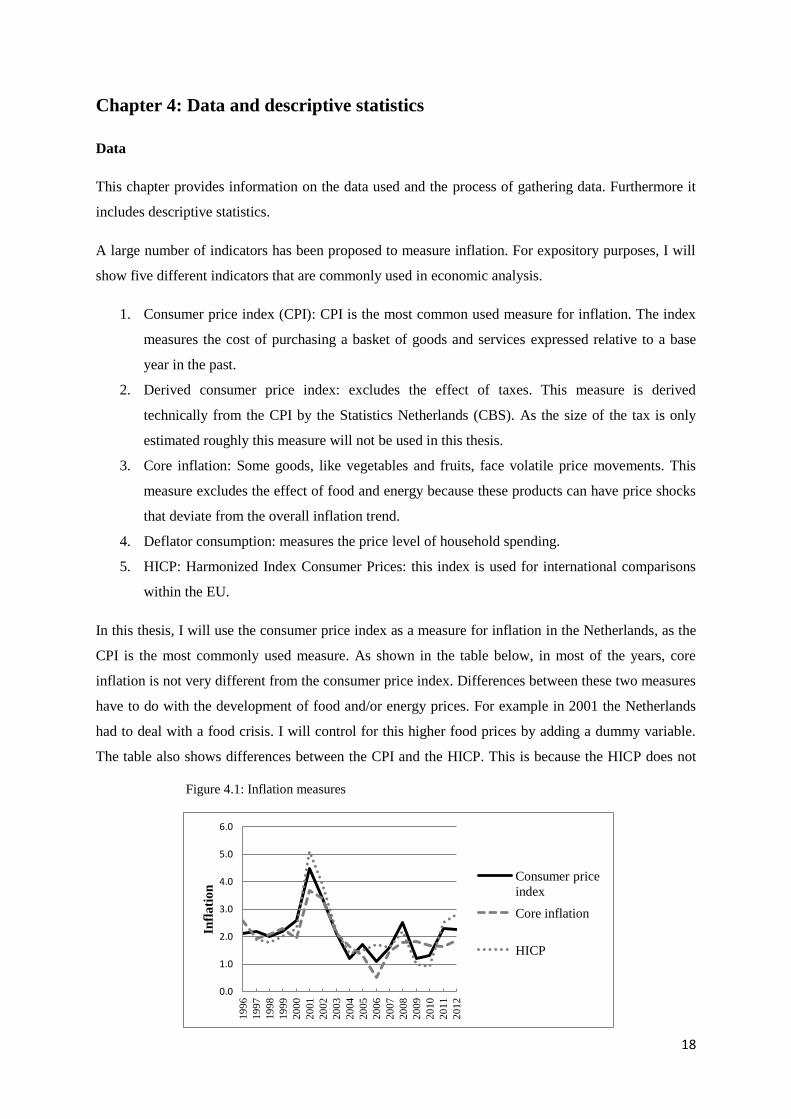
In this thesis, I will use the consumer price index as a measure for inflation in the Netherlands, as the
CPI is the most commonly used measure. As shown in the table below, in most of the years, core
inflation is not very different from the consumer price index. Differences between these two measures
have to do with the development of food and/or energy prices. For example in 2001 the Netherlands
had to deal with a food crisis. I will control for this higher food prices by adding a dummy variable.
The table also shows differences between the CPI and the HICP. This is because the HICP does not
Figure 4.1: Inflation measures
19
include consumption taxes, while the CPI does. Therefore, the HICP is not a useful measure to study
the effect of a VAT increase on consumer prices. However, I use the HICP as measure for euro area
inflation, to control for euro area wide inflation trends.
The CPI data used in this study is collected from Statistics Netherlands (CBS). This database provides
monthly data on the annual rate of change of inflation for each commodity item from January 1997 to
March 2013. Therefore it is possible to analyze the period 1997-2013 and take into account both the
VAT change of January 2001 and October 2012. I will use two digit level data. This allows me to
differentiate between commodity items subjected and not subjected to the VAT increase. At a two
digit level Statistic Netherlands provides 90 commodity items. However, a few items will be dropped
from the analysis. I drop education and health, as these items only have a small weight in the CPI.
Besides, I will leave out municipal taxes, insurances and fees as these groups consist of a special kind
of goods which are quite different from the other goods in the study. After this selection there are 74
commodity items left, which I will include in my analysis based on their individual weights in
aggregate CPI. By using weighted inflation rates the analysis will not be distorted by inflation trends
of goods with only a small weight in the total CPI. The weights of the different commodity items are
collected from Statistics Netherlands.
The data is divided into two sets of goods. The first set is subjected to the standard tax rate and
therefore subjected to the VAT increase. The other goods are subjected to the reduced rate. In
Appendix 1 a table that lists all 74 commodity items can be found. It also shows whether they are
subjected to the VAT increase. The goods in italic are also subjected to excises.
The data on the Euro area inflation is collected from Eurostat. Like Statistics Netherlands Eurostat
uses COICOP2 to classify the commodity items. However Eurostat does not contain data on the
following commodity items. For these items I will therefore be unable to control for Euro area
inflation:
cp0412: garage rent
cp0521: curtains, blinds etc.
cp0522: bed clothes
Stata will drop these commodity items from the analysis, as data on euro area inflation is not
available. However, this will not significantly influence the results as these commodity items all have
a very low weight in the total CPI (together 1%). Furthermore, Eurostat combines some commodity
items in one group:
cp0321: shoes and cp0322: repair of footwear
2 Classification of Individual Consumption According to Purpose
20
0
0.5
1
1.5
2
2.5
3
3.5
4
j m m j s n j m m j s n j m
2011 2012 2013
Reduced rate Standard rate
cp0531: major household appliances and cp0532: small household appliances
cp0712: motorcycles and cp0713: bicycles
cp0921: articles for outdoor recreation and cp0922: articles for indoor recreation
cp0394: pets and related products and cp0935: veterinary and other services for pets
cp0961: holidays in the Netherlands and cp0962: holidays abroad
cp1212: electric appliances for personal care and cp1213: other products for personal care
I choose to use the inflation of the combined commodity item as Euro area inflation for both
commodity items. For example, in 1997m1 Euro area inflation is 1.6% for the combined groups:
shoes and repair of footwear. I will use 1.6% as HICP_EA for both shoes and repair of footwear.
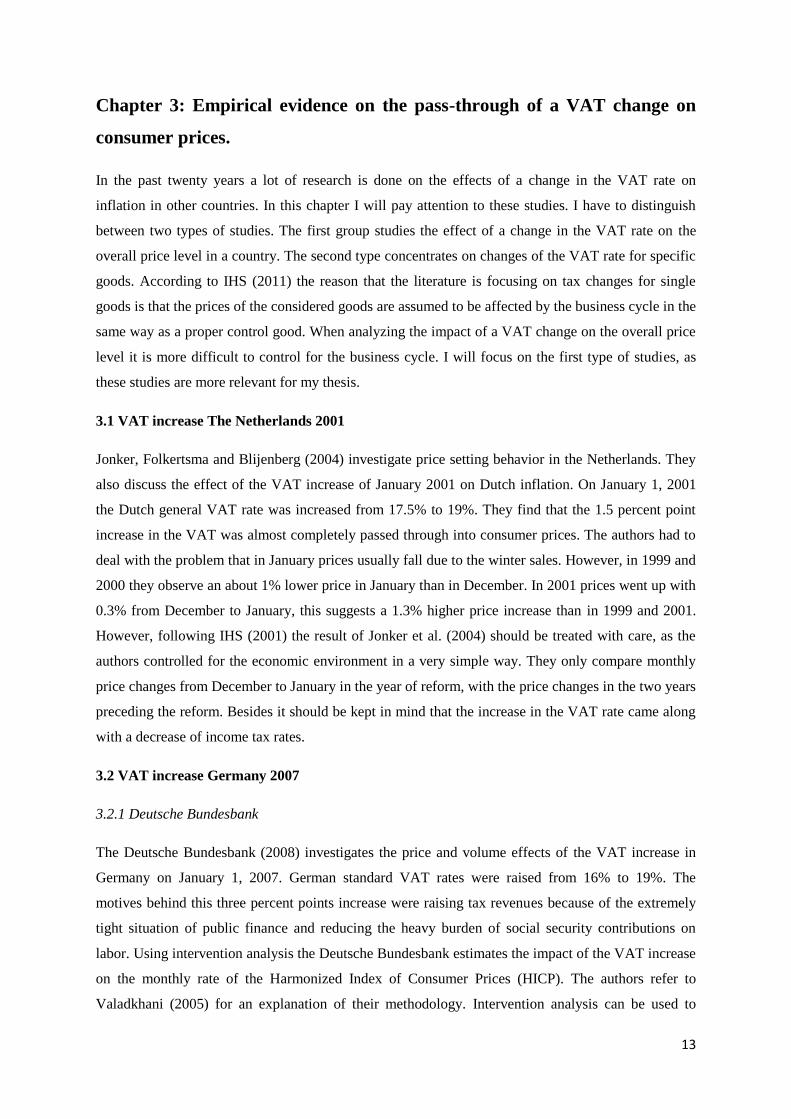
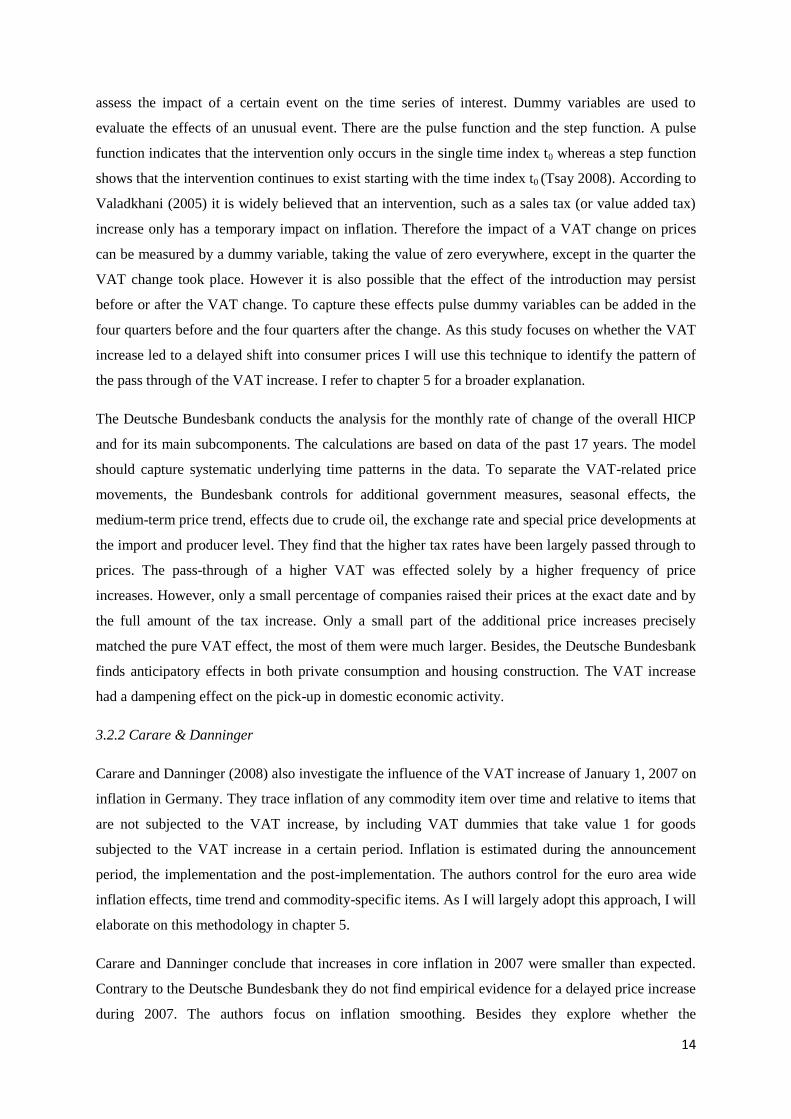
Descriptive statistics
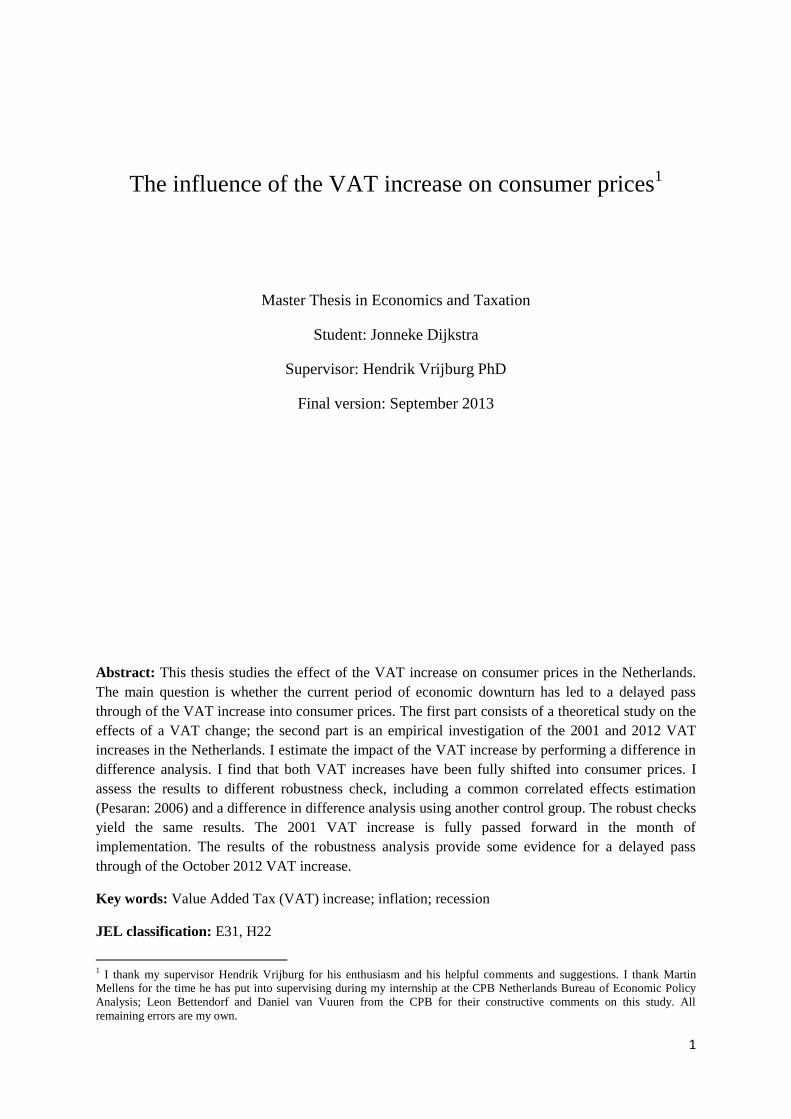
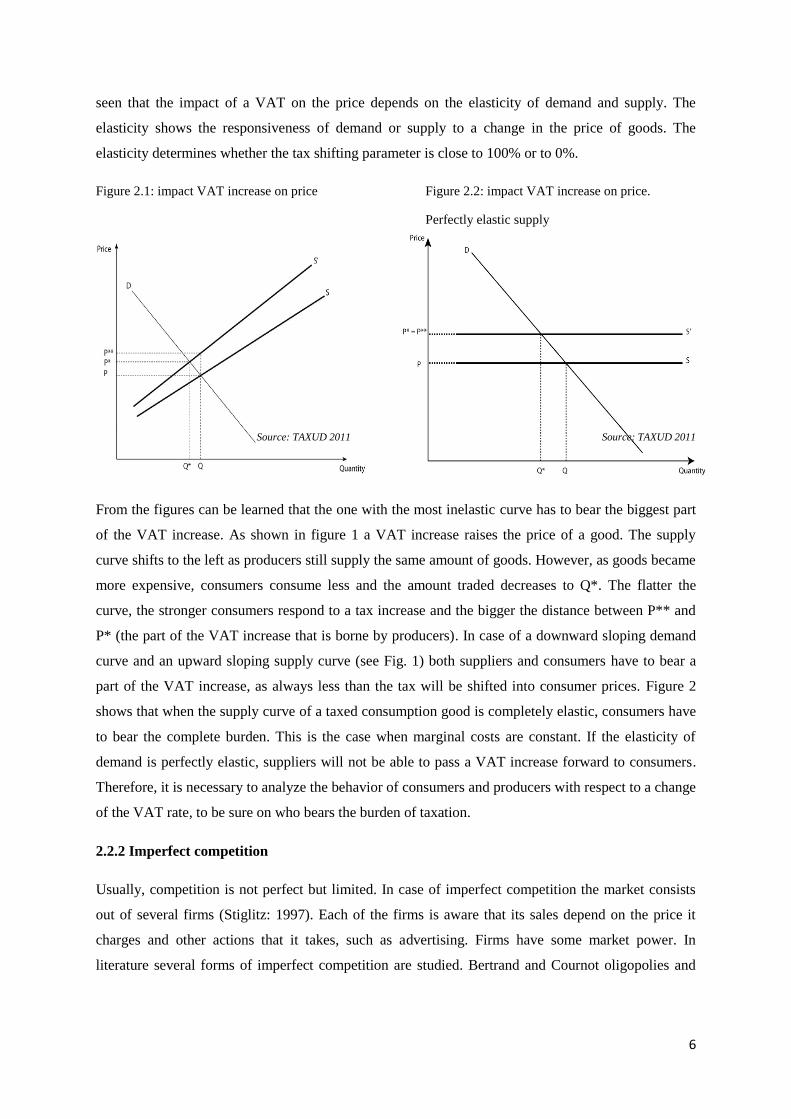
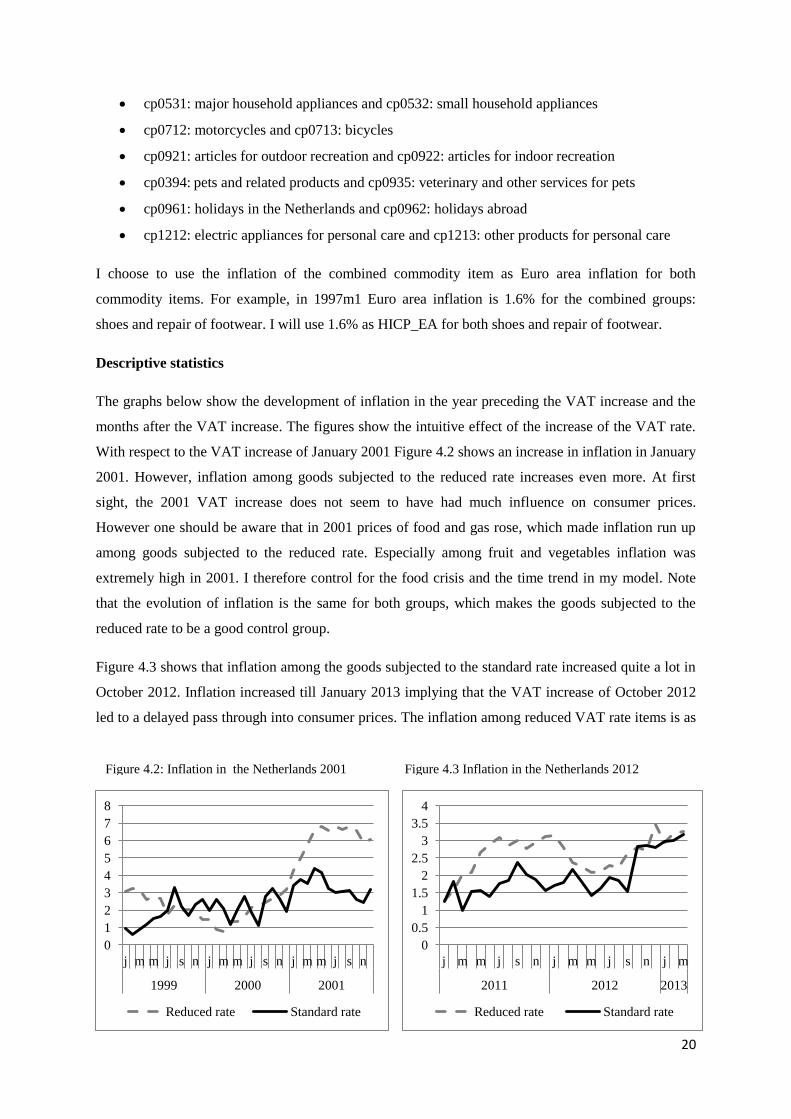
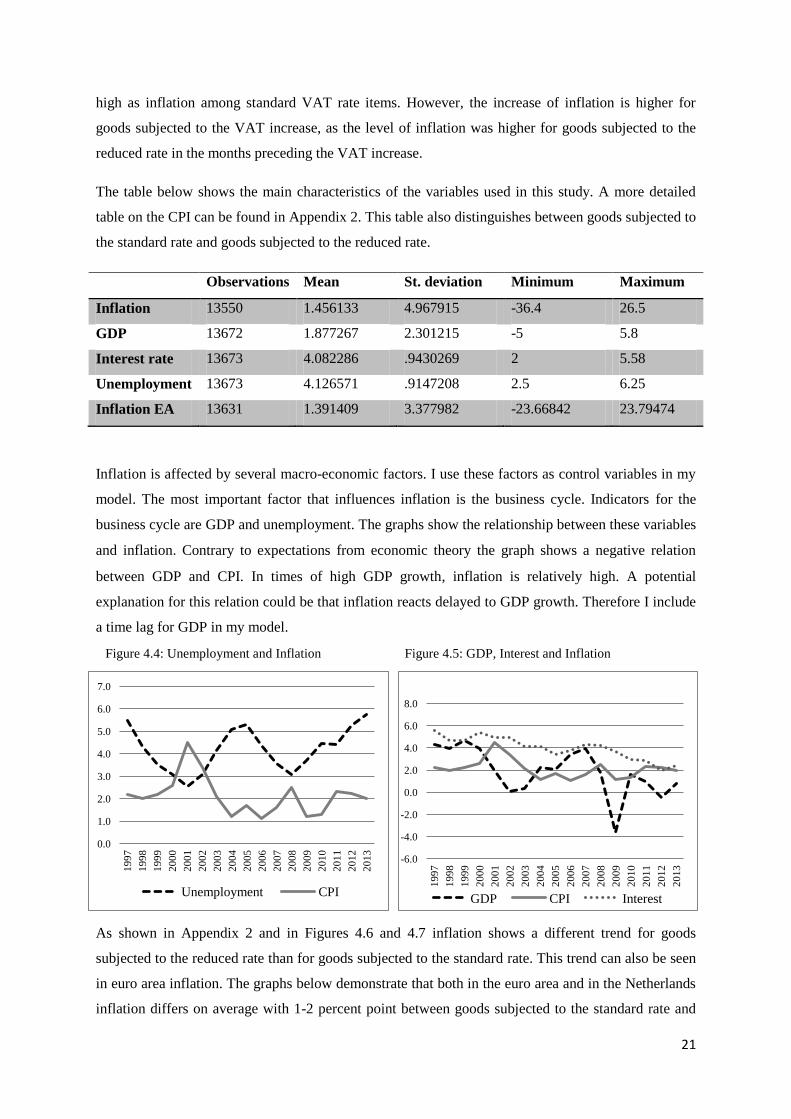
The graphs below show the development of inflation in the year preceding the VAT increase and the
months after the VAT increase. The figures show the intuitive effect of the increase of the VAT rate.
With respect to the VAT increase of January 2001 Figure 4.2 shows an increase in inflation in January
2001. However, inflation among goods subjected to the reduced rate increases even more. At first
sight, the 2001 VAT increase does not seem to have had much influence on consumer prices.
However one should be aware that in 2001 prices of food and gas rose, which made inflation run up
among goods subjected to the reduced rate. Especially among fruit and vegetables inflation was
extremely high in 2001. I therefore control for the food crisis and the time trend in my model. Note
that the evolution of inflation is the same for both groups, which makes the goods subjected to the
reduced rate to be a good control group.
Figure 4.3 shows that inflation among the goods subjected to the standard rate increased quite a lot in
October 2012. Inflation increased till January 2013 implying that the VAT increase of October 2012
led to a delayed pass through into consumer prices. The inflation among reduced VAT rate items is as
Figure 4.2: Inflation in the Netherlands 2001 Figure 4.3 Inflation in the Netherlands 2012
0
1
2
3
4
5
6
7
8
j m m j s n j m m j s n j m m j s n
1999 2000 2001
Reduced rate Standard rate
21
-6.0
-4.0
-2.0
0.0
2.0
4.0
6.0
8.0
19
97
19
98
19
99
20
00
20
01
20
02
20
03
20
04
20
05
20
06
20
07
20
08
20
09
20
10
20
11
20
12
20
13
GDP CPI Interest
0.0
1.0
2.0
3.0
4.0
5.0
6.0
7.0
19
97
19
98
19
99
20
00
20
01
20
02
20
03
20
04
20
05
20
06
20
07
20
08
20
09
20
10
20
11
20
12
20
13
Unemployment CPI
high as inflation among standard VAT rate items. However, the increase of inflation is higher for
goods subjected to the VAT increase, as the level of inflation was higher for goods subjected to the
reduced rate in the months preceding the VAT increase.
The table below shows the main characteristics of the variables used in this study. A more detailed
table on the CPI can be found in Appendix 2. This table also distinguishes between goods subjected to
the standard rate and goods subjected to the reduced rate.
Observations Mean St. deviation Minimum Maximum
Inflation 13550 1.456133 4.967915 -36.4 26.5
GDP 13672 1.877267 2.301215 -5 5.8
Interest rate 13673 4.082286 .9430269 2 5.58
Unemployment 13673 4.126571 .9147208 2.5 6.25
Inflation EA 13631 1.391409 3.377982 -23.66842 23.79474
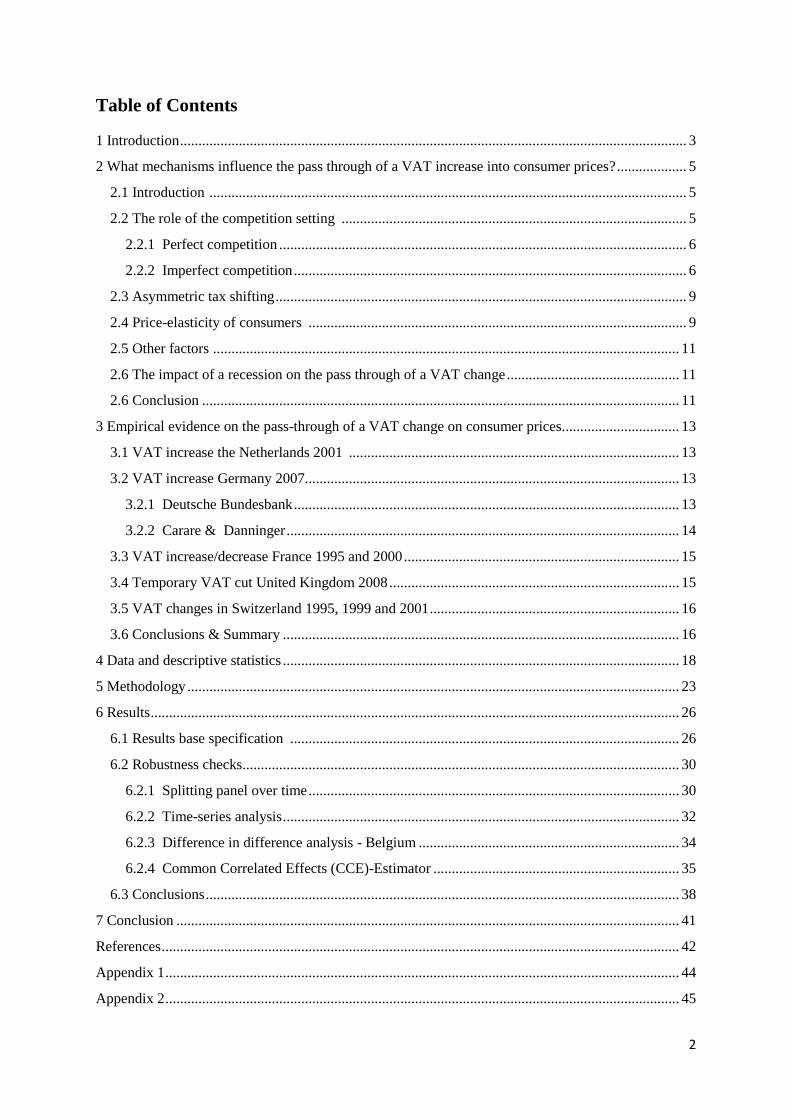
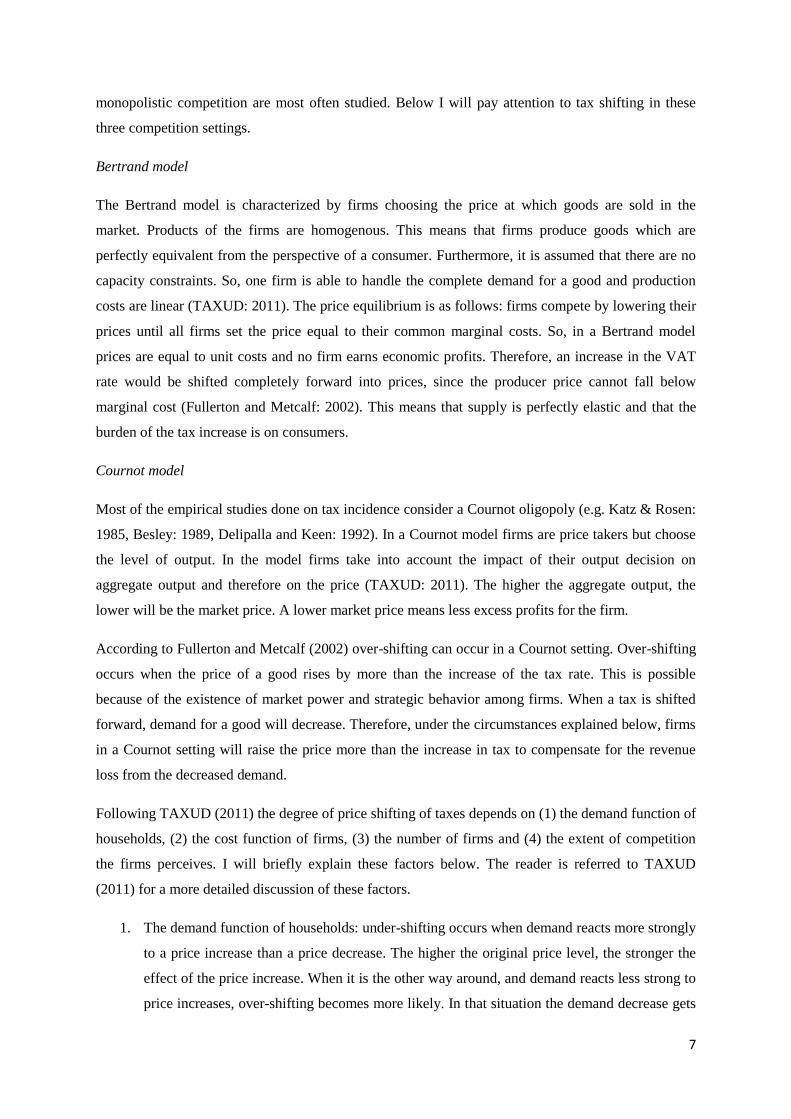
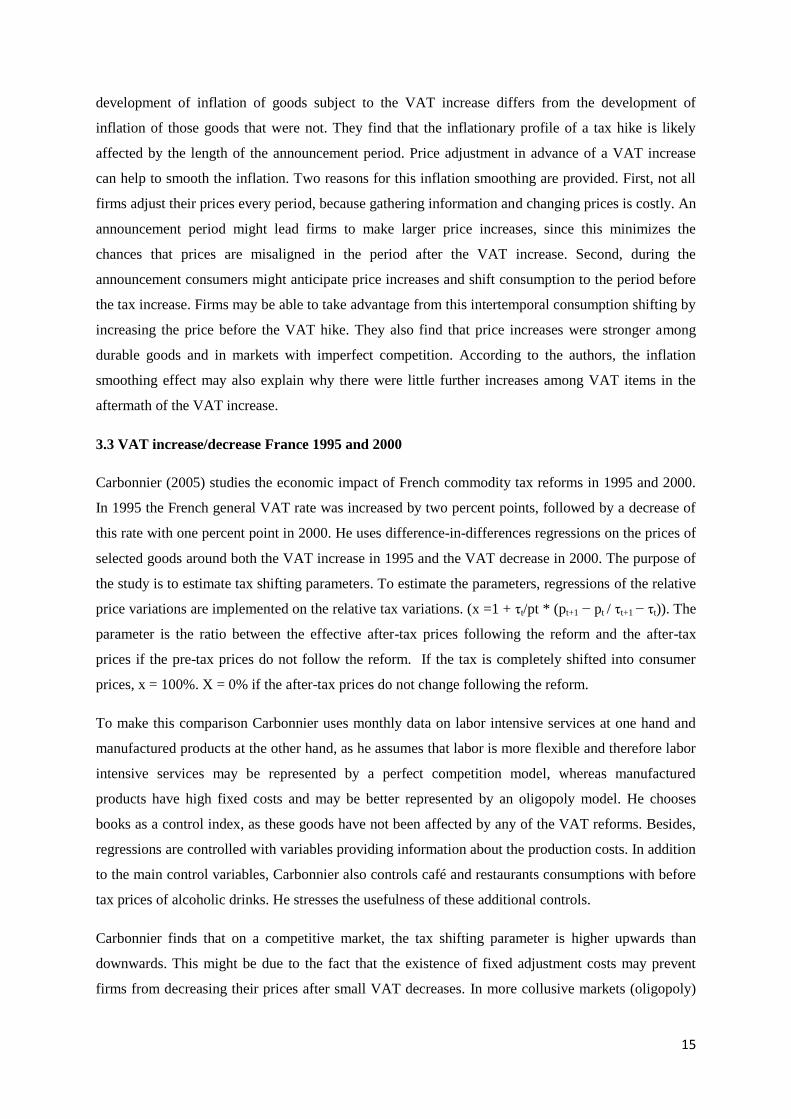
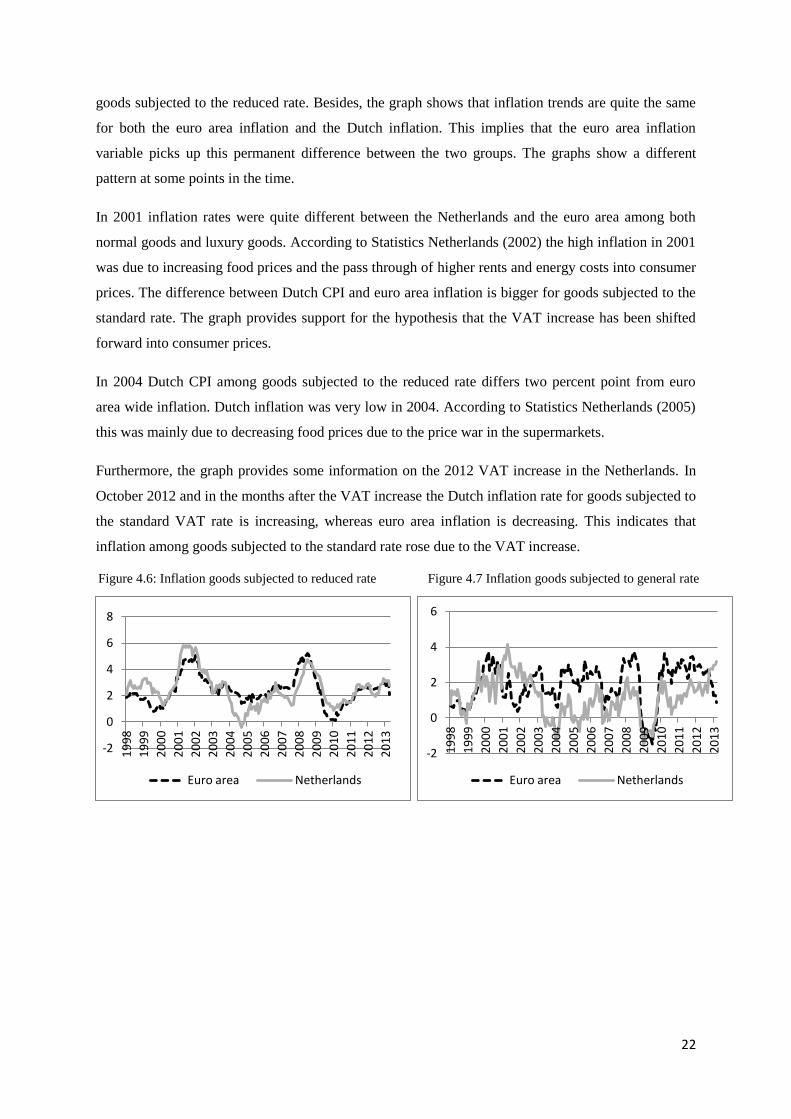
Inflation is affected by several macro-economic factors. I use these factors as control variables in my
model. The most important factor that influences inflation is the business cycle. Indicators for the
business cycle are GDP and unemployment. The graphs show the relationship between these variables
and inflation. Contrary to expectations from economic theory the graph shows a negative relation
between GDP and CPI. In times of high GDP growth, inflation is relatively high. A potential
explanation for this relation could be that inflation reacts delayed to GDP growth. Therefore I include
a time lag for GDP in my model.
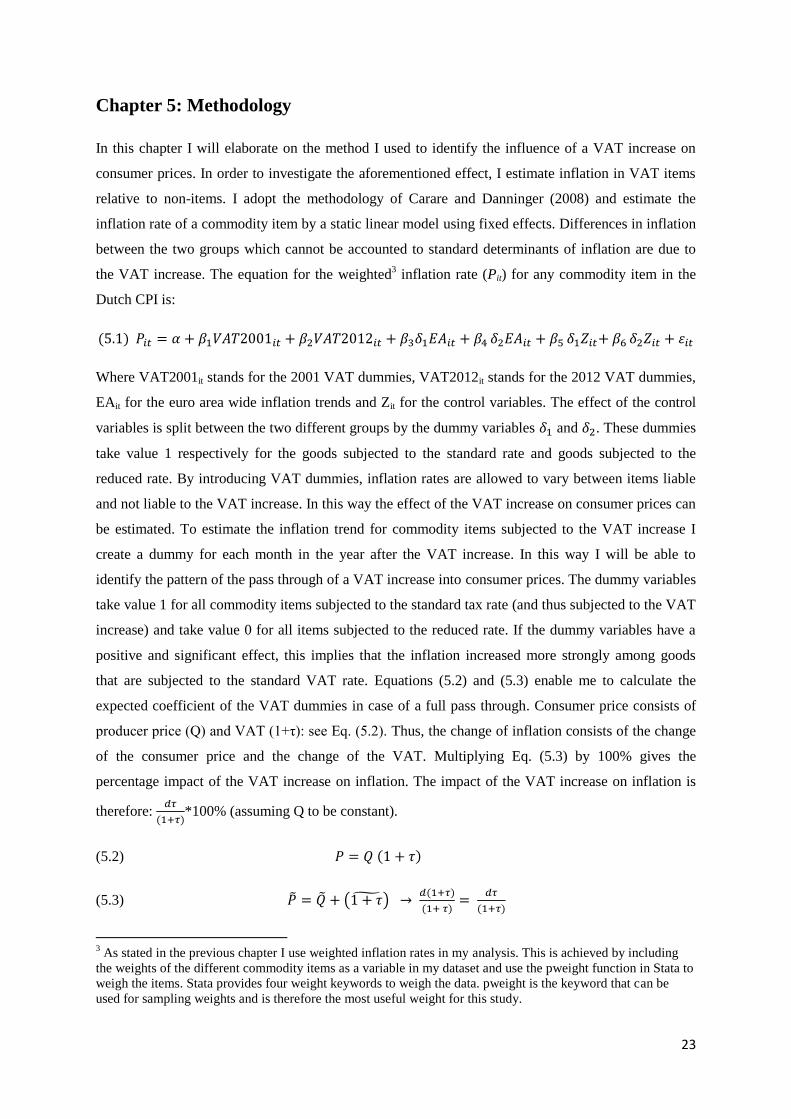
As shown in Appendix 2 and in Figures 4.6 and 4.7 inflation shows a different trend for goods
subjected to the reduced rate than for goods subjected to the standard rate. This trend can also be seen
in euro area inflation. The graphs below demonstrate that both in the euro area and in the Netherlands
inflation differs on average with 1-2 percent point between goods subjected to the standard rate and
Figure 4.4: Unemployment and Inflation Figure 4.5: GDP, Interest and Inflation
22
goods subjected to the reduced rate. Besides, the graph shows that inflation trends are quite the same
for both the euro area inflation and the Dutch inflation. This implies that the euro area inflation
variable picks up this permanent difference between the two groups. The graphs show a different
pattern at some points in the time.
In 2001 inflation rates were quite different between the Netherlands and the euro area among both
normal goods and luxury goods. According to Statistics Netherlands (2002) the high inflation in 2001
was due to increasing food prices and the pass through of higher rents and energy costs into consumer
prices. The difference between Dutch CPI and euro area inflation is bigger for goods subjected to the
standard rate. The graph provides support for the hypothesis that the VAT increase has been shifted
forward into consumer prices.
In 2004 Dutch CPI among goods subjected to the reduced rate differs two percent point from euro
area wide inflation. Dutch inflation was very low in 2004. According to Statistics Netherlands (2005)
this was mainly due to decreasing food prices due to the price war in the supermarkets.
Furthermore, the graph provides some information on the 2012 VAT increase in the Netherlands. In
October 2012 and in the months after the VAT increase the Dutch inflation rate for goods subjected to
the standard VAT rate is increasing, whereas euro area inflation is decreasing. This indicates that
inflation among goods subjected to the standard rate rose due to the VAT increase.
-2
0
2
4
6
8
19
98
19
99
20
00
20
01
20
02
20
03
20
04
20
05
20
06
20
07
20
08
20
09
20
10
20
11
20
12
20
13
Euro area Netherlands
-2
0
2
4
6
19
98
19
99
20
00
20
01
20
02
20
03
20
04
20
05
20
06
20
07
20
08
20
09
20
10
20
11
20
12
20
13
Euro area Netherlands
Figure 4.6: Inflation goods subjected to reduced rate Figure 4.7 Inflation goods subjected to general rate
23
Chapter 5: Methodology
In this chapter I will elaborate on the method I used to identify the influence of a VAT increase on
consumer prices. In order to investigate the aforementioned effect, I estimate inflation in VAT items
relative to non-items. I adopt the methodology of Carare and Danninger (2008) and estimate the
inflation rate of a commodity item by a static linear model using fixed effects. Differences in inflation
between the two groups which cannot be accounted to standard determinants of inflation are due to
the VAT increase. The equation for the weighted3 inflation rate (Pit) for any commodity item in the
Dutch CPI is:
Where VAT2001it stands for the 2001 VAT dummies, VAT2012it stands for the 2012 VAT dummies,
EAit for the euro area wide inflation trends and Zit for the control variables. The effect of the control
variables is split between the two different groups by the dummy variables and . These dummies
take value 1 respectively for the goods subjected to the standard rate and goods subjected to the
reduced rate. By introducing VAT dummies, inflation rates are allowed to vary between items liable
and not liable to the VAT increase. In this way the effect of the VAT increase on consumer prices can
be estimated. To estimate the inflation trend for commodity items subjected to the VAT increase I
create a dummy for each month in the year after the VAT increase. In this way I will be able to
identify the pattern of the pass through of a VAT increase into consumer prices. The dummy variables
take value 1 for all commodity items subjected to the standard tax rate (and thus subjected to the VAT
increase) and take value 0 for all items subjected to the reduced rate. If the dummy variables have a
positive and significant effect, this implies that the inflation increased more strongly among goods
that are subjected to the standard VAT rate. Equations (5.2) and (5.3) enable me to calculate the
expected coefficient of the VAT dummies in case of a full pass through. Consumer price consists of
producer price (Q) and VAT (1+τ): see Eq. (5.2). Thus, the change of inflation consists of the change
of the consumer price and the change of the VAT. Multiplying Eq. (5.3) by 100% gives the
percentage impact of the VAT increase on inflation. The impact of the VAT increase on inflation is
therefore:
*100% (assuming Q to be constant).
(5.2)
(5.3)
3 As stated in the previous chapter I use weighted inflation rates in my analysis. This is achieved by including
the weights of the different commodity items as a variable in my dataset and use the pweight function in Stata to
weigh the items. Stata provides four weight keywords to weigh the data. pweight is the keyword that can be
used for sampling weights and is therefore the most useful weight for this study.
24
This leads to hypothesis 1: When the VAT increase is shifted fully into consumer prices, the dummy
variables have a coefficient of 1.68 in 2012 and 1.28 in 2001.
Besides, I will explore whether the earlier announcement of the VAT increase has led consumers to
bring forward their purchases to before the VAT increase, by creating announcement dummies for the
months preceding the VAT increase. If these dummy variables have a positive and significant effect,
consumers anticipated on the VAT increase.
I use the following control variables in my model:
is a variable that is used to control for the regional trend. The specification of the variable
includes euro area inflation for each commodity item separately and thus measures the price effect
rising from the euro area. The inflation rates were computed for the euro area, excluding the
Netherlands. The inflation of the Netherlands was filtered from the euro area inflation by using the
following formula, were w1 stands for the weight of the Netherlands in the euro area inflation and w2
stands for the aggregate country weights of the other euro area countries in euro area inflation:
(5.4)
stands for the variables that control for the business cycle. I control for the GDP and the interest
rate. In another specification I control for unemployment. I split the effect of the control variables on
aggregate inflation in (1) the effect on inflation of the goods subjected to the standard VAT rate and
(2) the effect on the inflation of goods subjected to the reduced VAT rate. This is achieved by creating
an interaction between the dummies for the commodity items and the variables that represent the
business cycle (for example GDPstandard = Dum_standard * GDP).
Furthermore, dummy variables are added for the years 2001, 2012 and 2013. The year 2001 was a
special year. According to Statistics Netherlands (2002) inflation rose for several reasons. The dotcom
bubble collapsed and food prices increased rapidly due to poor harvests and the foot and mouth
disease4. Besides, gas prices increased. It is also argued that producers and retailers might have raised
their price anticipating the introduction of the euro on January 1, 2002. Dum_2001 is added to control
for the effect of these events that apply to all commodity items. Dum_Food2001 is added to pick up
the effect of the small food crisis in 2001. The dummy variable takes value 1 for product 1-3, 6 & 7.
Dum_2012 and Dum_2013 might pick up some business cycle effects that are not covered by the
other variables that control for the business cycle.
4 Food and mouth disease is an infectious viral disease that affects cloven-hoofed animals, such as cows and
sheep. As the disease can be easily transmitted a lot of cattle was killed in an attempt to halt the disease. This led
to enormous cost for the agricultural sector.
25
To control for seasonal and time specific effects monthly time dummies are introduced. Besides, some
goods are subjected to excises. I will therefore add a dummy Dum_EXC that takes value 1 for the
excise goods in the year of a change of the excises.
Second, inflation (Pit) will be measured as a dynamic panel with lagged inflation Pit-1. By including
this lags I control for the dynamics of the process:
Including lagged inflation changes the intuition of the coefficient of the other variables. After
including a lag the coefficients represent the short term effects of the VAT increase on inflation.
Furthermore, to obtain consistent estimations, it is important to obtain standard errors that are robust
to disturbances being heteroskedastic and autocorrelated. This is achieved by using the option
cluster() in Stata. This option specifies that the standard errors allow for intragroup correlation,
relaxing the usual requirement that the observations are independent.
26
Chapter 6: Results and robustness analysis
6.1 Results
Table 6.1 shows the core results of the estimation of inflation. All models include VAT dummies that
measure the influence of the VAT increase on consumer prices, variables that control for the time
trend, euro area inflation and monthly time dummies that control for seasonal effects. Besides, fixed
effects are used in all models. The standard errors are robust to heteroskedasticity and clustered into a
group subjected to the standard VAT rate and a group subjected to the reduced VAT rate. The purpose
of the clustering is to account for the difference in the variance of goods subjected to the reduced rate
and to the standard rate; standard errors might be clustered within the groups.
I used five different specifications to estimate inflation. The two main differences between the
specifications are: (1) the inclusion of year dummies (in specification 4 and 5) and (2) including
lagged inflation (specification 1, 2 and 4). In my view the specifications that include year dummies
are the most useful specifications, as these dummies might pick up some time trend that is not
controlled for by the other control variables. Euro area inflation has a positive and very significant
effect on inflation in the Netherlands. The coefficients of this variable are robust throughout the
different specifications. GDP influences inflation negative, interest positive. However, these control
variables are not all significant. This provides support for including year dummies that pick up the
other effects of the time trend on inflation. Furthermore, in specification (2) I added lagged GDP to
control for the time trend as inflation may react delayed to GDP growth. However this lagged GDP
does not influence inflation significantly and the coefficients of the VAT dummies change only very
slightly. The dummy for the 2001 food crisis is positive and significant. Inflation is 1.7 percent point
higher among fruit, vegetables, meat, fish and bread because of poor harvests and the mouth and foot
disease.5
The VAT dummies are most relevant to assess my research question. They measure whether inflation
increased more strongly among items subjected to the VAT increase.
The VAT_2012 dummies all show a positive and significant effect throughout all specifications. In
October 2012 the coefficient of the dummy is between 1.5 and 1.9 in the different specifications. This
implies that in the month of implementation inflation is 1.5-1.9 percent point higher for commodity
items subjected to the VAT increase than for commodity items not subjected to the VAT increase. As
stated in Chapter 5, I expected the coefficient to be 1.7 in case of a full pass through of the VAT
increase into consumer prices. This would apply for each month in the year after the VAT increase, as
5 Besides, I estimated inflation controlling for (1) unemployment and (2) wages (as a measure for the business
cycle). However, the results of these estimations do not influence the conclusions, as the coefficients of the
VAT dummies do not change significantly. I did not include the results in this thesis.
27
the inflation measures a year on year price change. None of the coefficients of the VAT dummies
differs significantly from 1.7. This provides support for the hypothesis that the VAT increase was
shifted fully into consumer prices. Besides, the coefficients are increasing over the months; this might
provide evidence that the VAT increase led to a delayed pass through into consumer prices. However,
the coefficients in specification 4 and 5 do not differ significantly between the different months. The
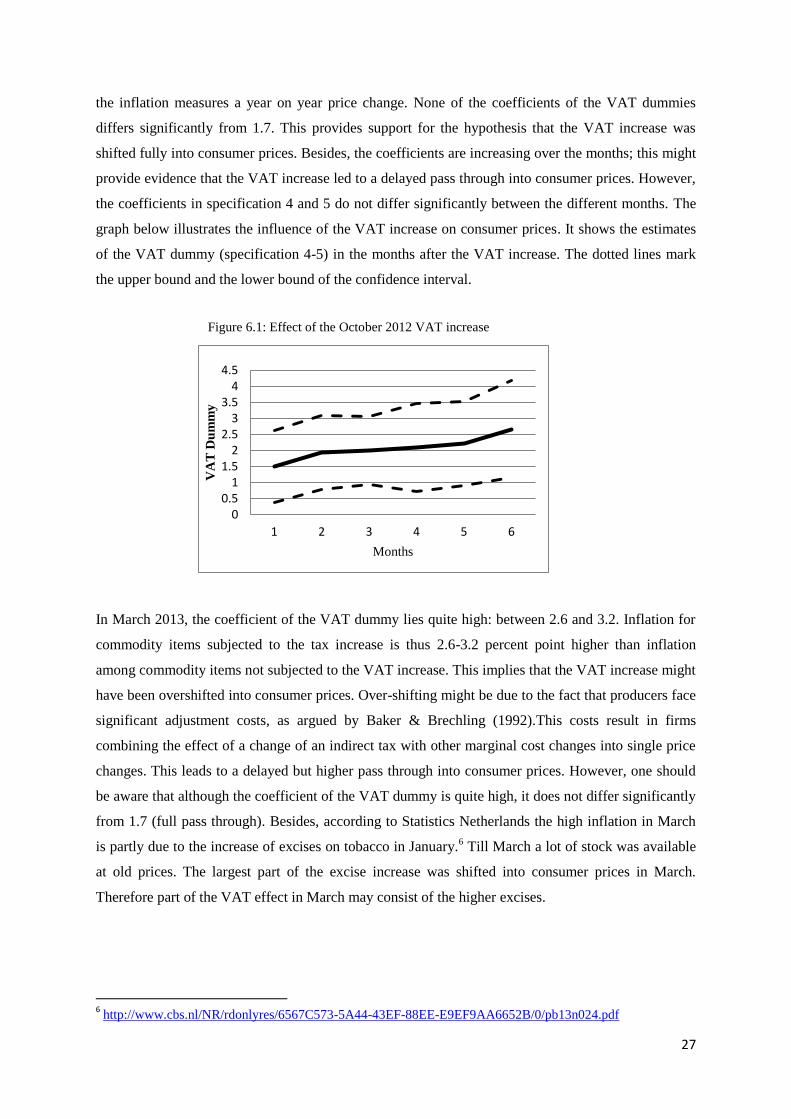
graph below illustrates the influence of the VAT increase on consumer prices. It shows the estimates
of the VAT dummy (specification 4-5) in the months after the VAT increase. The dotted lines mark
the upper bound and the lower bound of the confidence interval.
In March 2013, the coefficient of the VAT dummy lies quite high: between 2.6 and 3.2. Inflation for
commodity items subjected to the tax increase is thus 2.6-3.2 percent point higher than inflation
among commodity items not subjected to the VAT increase. This implies that the VAT increase might
have been overshifted into consumer prices. Over-shifting might be due to the fact that producers face
significant adjustment costs, as argued by Baker & Brechling (1992).This costs result in firms
combining the effect of a change of an indirect tax with other marginal cost changes into single price
changes. This leads to a delayed but higher pass through into consumer prices. However, one should
be aware that although the coefficient of the VAT dummy is quite high, it does not differ significantly
from 1.7 (full pass through). Besides, according to Statistics Netherlands the high inflation in March
is partly due to the increase of excises on tobacco in January.6 Till March a lot of stock was available
at old prices. The largest part of the excise increase was shifted into consumer prices in March.
Therefore part of the VAT effect in March may consist of the higher excises.
6 http://www.cbs.nl/NR/rdonlyres/6567C573-5A44-43EF-88EE-E9EF9AA6652B/0/pb13n024.pdf
0 0.5
1 1.5
2 2.5
3 3.5
4 4.5
1 2 3 4 5 6
VA
T D
um
my
Months
Figure 6.1: Effect of the October 2012 VAT increase
28
0
1
2
3
4
5
1 2 3 4 5 6 7 8 9
VA
T d
um
my
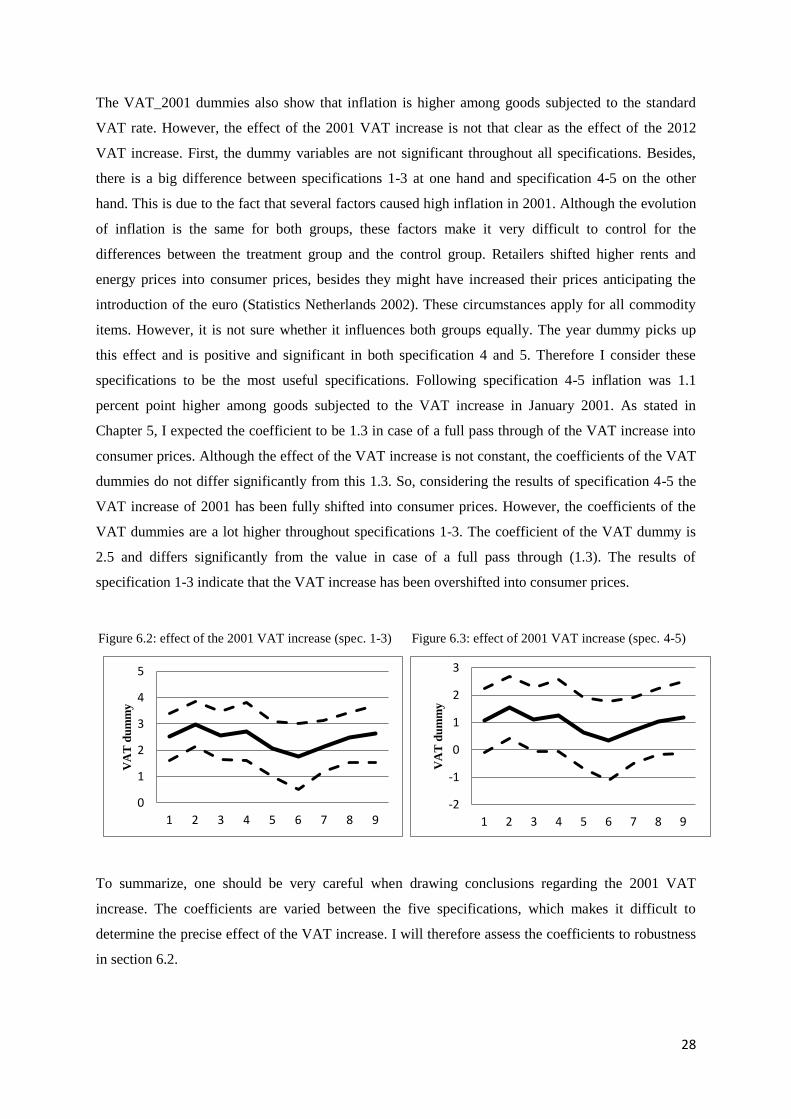
The VAT_2001 dummies also show that inflation is higher among goods subjected to the standard
VAT rate. However, the effect of the 2001 VAT increase is not that clear as the effect of the 2012
VAT increase. First, the dummy variables are not significant throughout all specifications. Besides,
there is a big difference between specifications 1-3 at one hand and specification 4-5 on the other
hand. This is due to the fact that several factors caused high inflation in 2001. Although the evolution
of inflation is the same for both groups, these factors make it very difficult to control for the
differences between the treatment group and the control group. Retailers shifted higher rents and
energy prices into consumer prices, besides they might have increased their prices anticipating the
introduction of the euro (Statistics Netherlands 2002). These circumstances apply for all commodity
items. However, it is not sure whether it influences both groups equally. The year dummy picks up
this effect and is positive and significant in both specification 4 and 5. Therefore I consider these
specifications to be the most useful specifications. Following specification 4-5 inflation was 1.1
percent point higher among goods subjected to the VAT increase in January 2001. As stated in
Chapter 5, I expected the coefficient to be 1.3 in case of a full pass through of the VAT increase into
consumer prices. Although the effect of the VAT increase is not constant, the coefficients of the VAT
dummies do not differ significantly from this 1.3. So, considering the results of specification 4-5 the
VAT increase of 2001 has been fully shifted into consumer prices. However, the coefficients of the
VAT dummies are a lot higher throughout specifications 1-3. The coefficient of the VAT dummy is
2.5 and differs significantly from the value in case of a full pass through (1.3). The results of
specification 1-3 indicate that the VAT increase has been overshifted into consumer prices.
To summarize, one should be very careful when drawing conclusions regarding the 2001 VAT
increase. The coefficients are varied between the five specifications, which makes it difficult to
determine the precise effect of the VAT increase. I will therefore assess the coefficients to robustness
in section 6.2.
-2
-1
0
1
2
3
1 2 3 4 5 6 7 8 9
VA
T d
um
my
Figure 6.2: effect of the 2001 VAT increase (spec. 1-3) Figure 6.3: effect of 2001 VAT increase (spec. 4-5)
29
One of the hypotheses was that the current period of economic downturn and lower consumer
expenditures has led suppliers to only shift part of the VAT increase into consumer prices. The results
do not confirm this hypothesis, as the coefficients of the VAT dummies show that the VAT increase
was shifted fully into consumer prices. Comparing these results to the results for 2001 I do not find
evidence that business-cycle effects influenced the pass-through of the VAT-increase in 2012. Timing
and the extent of the pass-through are roughly similar in both years.
In addition I explored the hypothesis whether the VAT increase led to price increased anticipating the
VAT increases in January 2001 and October 2012. The anticipation dummies that measure the
difference in inflation rates between luxury goods and basic goods in the period preceding the VAT
increase do not offer support for an anticipation effect (I did not include the results in the table).
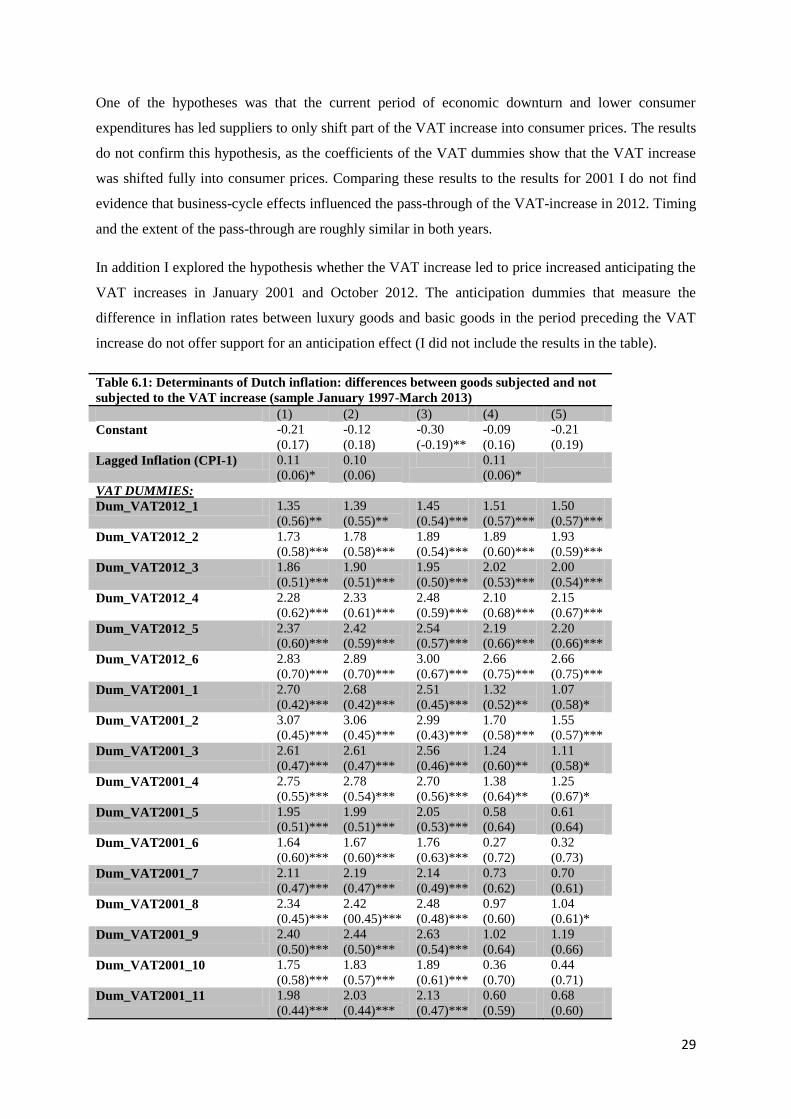
Table 6.1: Determinants of Dutch inflation: differences between goods subjected and not
subjected to the VAT increase (sample January 1997-March 2013)
(1) (2) (3) (4) (5)
Constant -0.21
(0.17)
-0.12
(0.18)
-0.30
(-0.19)**
-0.09
(0.16)
-0.21
(0.19)
Lagged Inflation (CPI-1) 0.11
(0.06)*
0.10
(0.06)
0.11
(0.06)*
VAT DUMMIES:
Dum_VAT2012_1 1.35
(0.56)**
1.39
(0.55)**
1.45
(0.54)***
1.51
(0.57)***
1.50
(0.57)***
Dum_VAT2012_2 1.73
(0.58)***
1.78
(0.58)***
1.89
(0.54)***
1.89
(0.60)***
1.93
(0.59)***
Dum_VAT2012_3 1.86
(0.51)***
1.90
(0.51)***
1.95
(0.50)***
2.02
(0.53)***
2.00
(0.54)***
Dum_VAT2012_4 2.28
(0.62)***
2.33
(0.61)***
2.48
(0.59)***
2.10
(0.68)***
2.15
(0.67)***
Dum_VAT2012_5 2.37
(0.60)***
2.42
(0.59)***
2.54
(0.57)***
2.19
(0.66)***
2.20
(0.66)***
Dum_VAT2012_6 2.83
(0.70)***
2.89
(0.70)***
3.00
(0.67)***
2.66
(0.75)***
2.66
(0.75)***
Dum_VAT2001_1 2.70
(0.42)***
2.68
(0.42)***
2.51
(0.45)***
1.32
(0.52)**
1.07
(0.58)*
Dum_VAT2001_2 3.07
(0.45)***
3.06
(0.45)***
2.99
(0.43)***
1.70
(0.58)***
1.55
(0.57)***
Dum_VAT2001_3 2.61
(0.47)***
2.61
(0.47)***
2.56
(0.46)***
1.24
(0.60)**
1.11
(0.58)*
Dum_VAT2001_4 2.75
(0.55)***
2.78
(0.54)***
2.70
(0.56)***
1.38
(0.64)**
1.25
(0.67)*
Dum_VAT2001_5 1.95
(0.51)***
1.99
(0.51)***
2.05
(0.53)***
0.58
(0.64)
0.61
(0.64)
Dum_VAT2001_6 1.64
(0.60)***
1.67
(0.60)***
1.76
(0.63)***
0.27
(0.72)
0.32
(0.73)
Dum_VAT2001_7 2.11
(0.47)***
2.19
(0.47)***
2.14
(0.49)***
0.73
(0.62)
0.70
(0.61)
Dum_VAT2001_8 2.34
(0.45)***
2.42
(00.45)***
2.48
(0.48)***
0.97
(0.60)
1.04
(0.61)*
Dum_VAT2001_9 2.40
(0.50)***
2.44
(0.50)***
2.63
(0.54)***
1.02
(0.64)
1.19
(0.66)
Dum_VAT2001_10 1.75
(0.58)***
1.83
(0.57)***
1.89
(0.61)***
0.36
(0.70)
0.44
(0.71)
Dum_VAT2001_11 1.98
(0.44)***
2.03
(0.44)***
2.13
(0.47)***
0.60
(0.59)
0.68
(0.60)
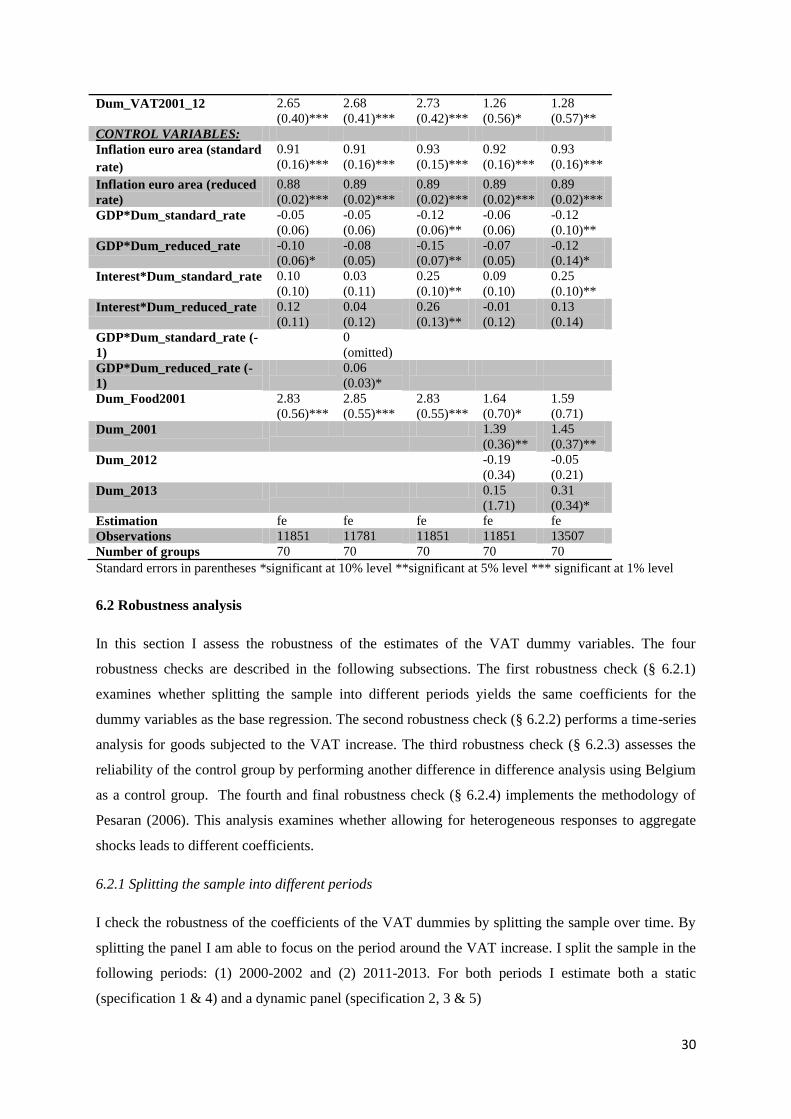
30
Dum_VAT2001_12 2.65
(0.40)***
2.68
(0.41)***
2.73
(0.42)***
1.26
(0.56)*
1.28
(0.57)**
CONTROL VARIABLES:
Inflation euro area (standard
rate)
0.91
(0.16)***
0.91
(0.16)***
0.93
(0.15)***
0.92
(0.16)***
0.93
(0.16)***
Inflation euro area (reduced
rate)
0.88
(0.02)***
0.89
(0.02)***
0.89
(0.02)***
0.89
(0.02)***
0.89
(0.02)***
GDP*Dum_standard_rate -0.05
(0.06)
-0.05
(0.06)
-0.12
(0.06)**
-0.06
(0.06)
-0.12
(0.10)**
GDP*Dum_reduced_rate -0.10
(0.06)*
-0.08
(0.05)
-0.15
(0.07)**
-0.07
(0.05)
-0.12
(0.14)*
Interest*Dum_standard_rate 0.10
(0.10)
0.03
(0.11)
0.25
(0.10)**
0.09
(0.10)
0.25
(0.10)**
Interest*Dum_reduced_rate 0.12
(0.11)
0.04
(0.12)
0.26
(0.13)**
-0.01
(0.12)
0.13
(0.14)
GDP*Dum_standard_rate (-
1)
0
(omitted)
GDP*Dum_reduced_rate (-
1)
0.06
(0.03)*
Dum_Food2001 2.83
(0.56)***
2.85
(0.55)***
2.83
(0.55)***
1.64
(0.70)*
1.59
(0.71)
Dum_2001 1.39
(0.36)**
1.45
(0.37)**
Dum_2012 -0.19
(0.34)
-0.05
(0.21)
Dum_2013 0.15
(1.71)
0.31
(0.34)*
Estimation fe fe fe fe fe
Observations 11851 11781 11851 11851 13507
Number of groups 70 70 70 70 70
Standard errors in parentheses *significant at 10% level **significant at 5% level *** significant at 1% level
6.2 Robustness analysis
In this section I assess the robustness of the estimates of the VAT dummy variables. The four
robustness checks are described in the following subsections. The first robustness check (§ 6.2.1)
examines whether splitting the sample into different periods yields the same coefficients for the
dummy variables as the base regression. The second robustness check (§ 6.2.2) performs a time-series
analysis for goods subjected to the VAT increase. The third robustness check (§ 6.2.3) assesses the
reliability of the control group by performing another difference in difference analysis using Belgium
as a control group. The fourth and final robustness check (§ 6.2.4) implements the methodology of
Pesaran (2006). This analysis examines whether allowing for heterogeneous responses to aggregate
shocks leads to different coefficients.
6.2.1 Splitting the sample into different periods
I check the robustness of the coefficients of the VAT dummies by splitting the sample over time. By
splitting the panel I am able to focus on the period around the VAT increase. I split the sample in the
following periods: (1) 2000-2002 and (2) 2011-2013. For both periods I estimate both a static
(specification 1 & 4) and a dynamic panel (specification 2, 3 & 5)
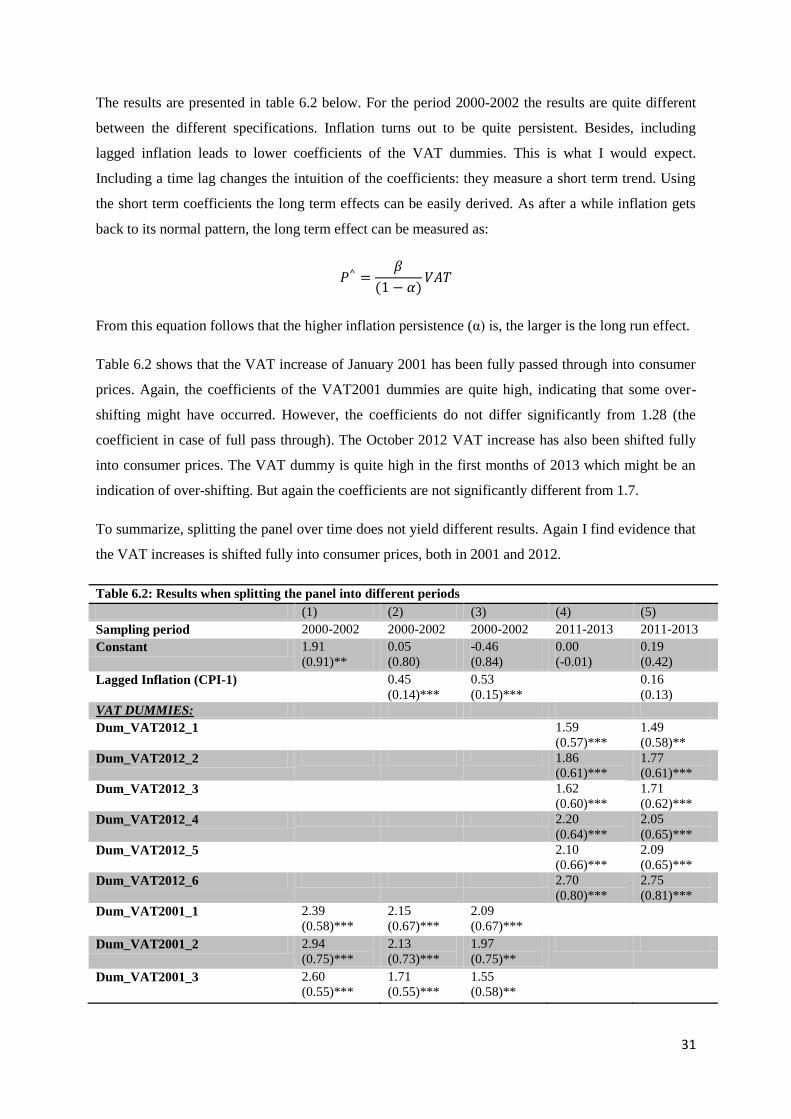
31
The results are presented in table 6.2 below. For the period 2000-2002 the results are quite different
between the different specifications. Inflation turns out to be quite persistent. Besides, including
lagged inflation leads to lower coefficients of the VAT dummies. This is what I would expect.
Including a time lag changes the intuition of the coefficients: they measure a short term trend. Using
the short term coefficients the long term effects can be easily derived. As after a while inflation gets
back to its normal pattern, the long term effect can be measured as:
From this equation follows that the higher inflation persistence (α) is, the larger is the long run effect.
Table 6.2 shows that the VAT increase of January 2001 has been fully passed through into consumer
prices. Again, the coefficients of the VAT2001 dummies are quite high, indicating that some over-
shifting might have occurred. However, the coefficients do not differ significantly from 1.28 (the
coefficient in case of full pass through). The October 2012 VAT increase has also been shifted fully
into consumer prices. The VAT dummy is quite high in the first months of 2013 which might be an
indication of over-shifting. But again the coefficients are not significantly different from 1.7.
To summarize, splitting the panel over time does not yield different results. Again I find evidence that
the VAT increases is shifted fully into consumer prices, both in 2001 and 2012.
Table 6.2: Results when splitting the panel into different periods
(1) (2) (3) (4) (5)
Sampling period 2000-2002 2000-2002 2000-2002 2011-2013 2011-2013
Constant 1.91
(0.91)**
0.05
(0.80)
-0.46
(0.84)
0.00
(-0.01)
0.19
(0.42)
Lagged Inflation (CPI-1) 0.45
(0.14)***
0.53
(0.15)***
0.16
(0.13)
VAT DUMMIES:
Dum_VAT2012_1 1.59
(0.57)***
1.49
(0.58)**
Dum_VAT2012_2 1.86
(0.61)***
1.77
(0.61)***
Dum_VAT2012_3 1.62
(0.60)***
1.71
(0.62)***
Dum_VAT2012_4 2.20
(0.64)***
2.05
(0.65)***
Dum_VAT2012_5 2.10
(0.66)***
2.09
(0.65)***
Dum_VAT2012_6 2.70
(0.80)***
2.75
(0.81)***
Dum_VAT2001_1 2.39
(0.58)***
2.15
(0.67)***
2.09
(0.67)***
Dum_VAT2001_2 2.94
(0.75)***
2.13
(0.73)***
1.97
(0.75)**
Dum_VAT2001_3 2.60
(0.55)***
1.71
(0.55)***
1.55
(0.58)**
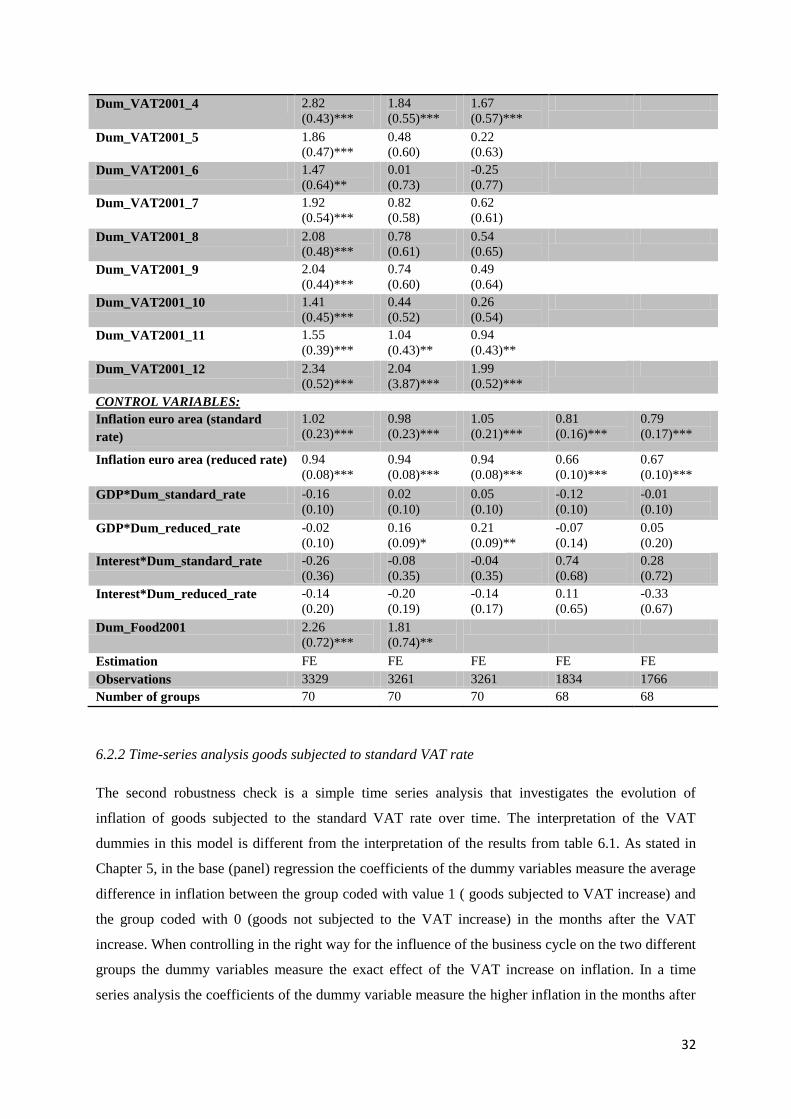
32
Dum_VAT2001_4 2.82
(0.43)***
1.84
(0.55)***
1.67
(0.57)***
Dum_VAT2001_5 1.86
(0.47)***
0.48
(0.60)
0.22
(0.63)
Dum_VAT2001_6 1.47
(0.64)**
0.01
(0.73)
-0.25
(0.77)
Dum_VAT2001_7 1.92
(0.54)***
0.82
(0.58)
0.62
(0.61)
Dum_VAT2001_8 2.08
(0.48)***
0.78
(0.61)
0.54
(0.65)
Dum_VAT2001_9 2.04
(0.44)***
0.74
(0.60)
0.49
(0.64)
Dum_VAT2001_10 1.41
(0.45)***
0.44
(0.52)
0.26
(0.54)
Dum_VAT2001_11 1.55
(0.39)***
1.04
(0.43)**
0.94
(0.43)**
Dum_VAT2001_12 2.34
(0.52)***
2.04
(3.87)***
1.99
(0.52)***
CONTROL VARIABLES:
Inflation euro area (standard
rate)
1.02
(0.23)***
0.98
(0.23)***
1.05
(0.21)***
0.81
(0.16)***
0.79
(0.17)***
Inflation euro area (reduced rate) 0.94
(0.08)***
0.94
(0.08)***
0.94
(0.08)***
0.66
(0.10)***
0.67
(0.10)***
GDP*Dum_standard_rate -0.16
(0.10)
0.02
(0.10)
0.05
(0.10)
-0.12
(0.10)
-0.01
(0.10)
GDP*Dum_reduced_rate -0.02
(0.10)
0.16
(0.09)*
0.21
(0.09)**
-0.07
(0.14)
0.05
(0.20)
Interest*Dum_standard_rate -0.26
(0.36)
-0.08
(0.35)
-0.04
(0.35)
0.74
(0.68)
0.28
(0.72)
Interest*Dum_reduced_rate -0.14
(0.20)
-0.20
(0.19)
-0.14
(0.17)
0.11
(0.65)
-0.33
(0.67)
Dum_Food2001 2.26
(0.72)***
1.81
(0.74)**
Estimation FE FE FE FE FE
Observations 3329 3261 3261 1834 1766
Number of groups 70 70 70 68 68
6.2.2 Time-series analysis goods subjected to standard VAT rate
The second robustness check is a simple time series analysis that investigates the evolution of
inflation of goods subjected to the standard VAT rate over time. The interpretation of the VAT
dummies in this model is different from the interpretation of the results from table 6.1. As stated in
Chapter 5, in the base (panel) regression the coefficients of the dummy variables measure the average
difference in inflation between the group coded with value 1 ( goods subjected to VAT increase) and
the group coded with 0 (goods not subjected to the VAT increase) in the months after the VAT
increase. When controlling in the right way for the influence of the business cycle on the two different
groups the dummy variables measure the exact effect of the VAT increase on inflation. In a time
series analysis the coefficients of the dummy variable measure the higher inflation in the months after
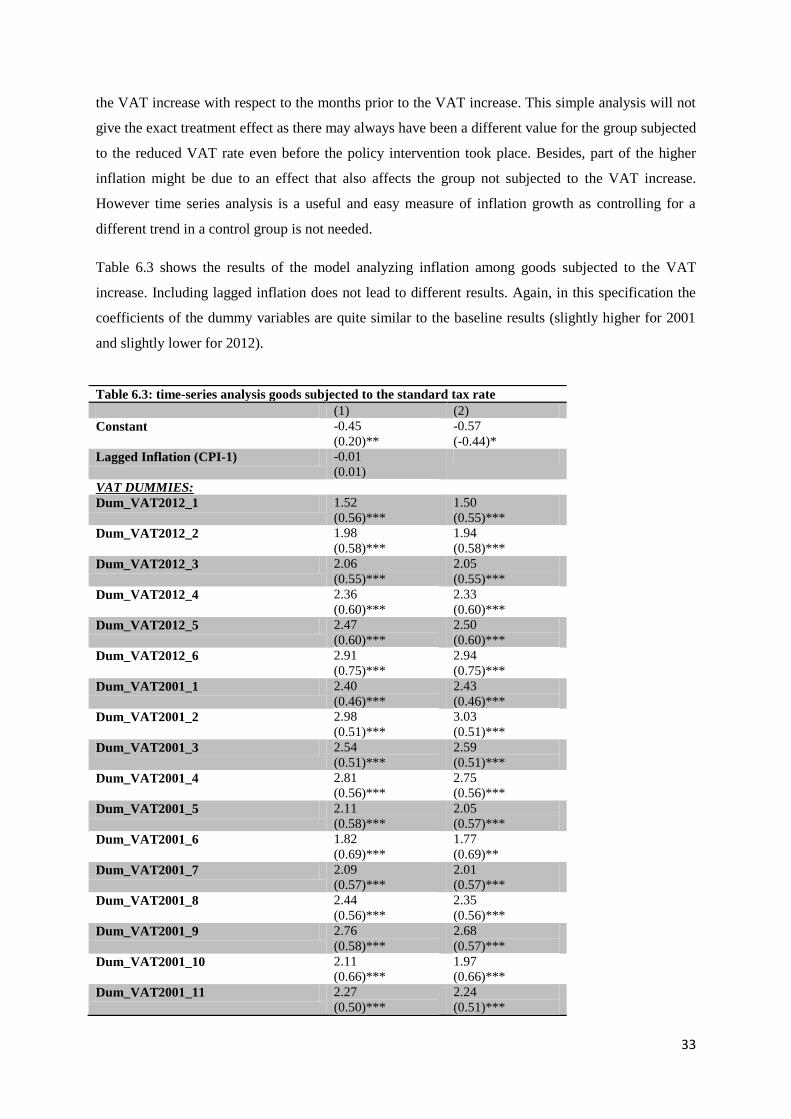
33
the VAT increase with respect to the months prior to the VAT increase. This simple analysis will not
give the exact treatment effect as there may always have been a different value for the group subjected
to the reduced VAT rate even before the policy intervention took place. Besides, part of the higher
inflation might be due to an effect that also affects the group not subjected to the VAT increase.
However time series analysis is a useful and easy measure of inflation growth as controlling for a
different trend in a control group is not needed.
Table 6.3 shows the results of the model analyzing inflation among goods subjected to the VAT
increase. Including lagged inflation does not lead to different results. Again, in this specification the
coefficients of the dummy variables are quite similar to the baseline results (slightly higher for 2001
and slightly lower for 2012).
Table 6.3: time-series analysis goods subjected to the standard tax rate
(1) (2)
Constant -0.45
(0.20)**
-0.57
(-0.44)*
Lagged Inflation (CPI-1) -0.01
(0.01)
VAT DUMMIES:
Dum_VAT2012_1 1.52
(0.56)***
1.50
(0.55)***
Dum_VAT2012_2 1.98
(0.58)***
1.94
(0.58)***
Dum_VAT2012_3 2.06
(0.55)***
2.05
(0.55)***
Dum_VAT2012_4 2.36
(0.60)***
2.33
(0.60)***
Dum_VAT2012_5 2.47
(0.60)***
2.50
(0.60)***
Dum_VAT2012_6 2.91
(0.75)***
2.94
(0.75)***
Dum_VAT2001_1 2.40
(0.46)***
2.43
(0.46)***
Dum_VAT2001_2 2.98
(0.51)***
3.03
(0.51)***
Dum_VAT2001_3 2.54
(0.51)***
2.59
(0.51)***
Dum_VAT2001_4 2.81
(0.56)***
2.75
(0.56)***
Dum_VAT2001_5 2.11
(0.58)***
2.05
(0.57)***
Dum_VAT2001_6 1.82
(0.69)***
1.77
(0.69)**
Dum_VAT2001_7 2.09
(0.57)***
2.01
(0.57)***
Dum_VAT2001_8 2.44
(0.56)***
2.35
(0.56)***
Dum_VAT2001_9 2.76
(0.58)***
2.68
(0.57)***
Dum_VAT2001_10 2.11
(0.66)***
1.97
(0.66)***
Dum_VAT2001_11 2.27
(0.50)***
2.24
(0.51)***
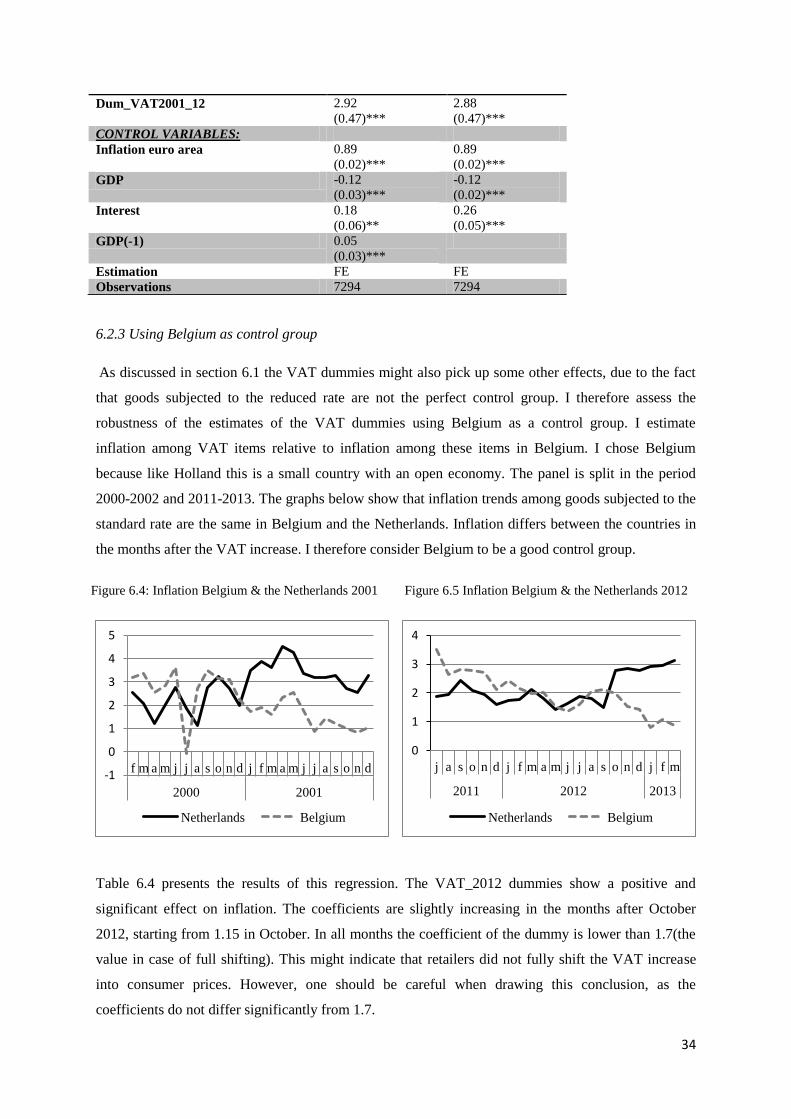
34
6.2.3 Using Belgium as control group
As discussed in section 6.1 the VAT dummies might also pick up some other effects, due to the fact
that goods subjected to the reduced rate are not the perfect control group. I therefore assess the
robustness of the estimates of the VAT dummies using Belgium as a control group. I estimate
inflation among VAT items relative to inflation among these items in Belgium. I chose Belgium
because like Holland this is a small country with an open economy. The panel is split in the period
2000-2002 and 2011-2013. The graphs below show that inflation trends among goods subjected to the
standard rate are the same in Belgium and the Netherlands. Inflation differs between the countries in
the months after the VAT increase. I therefore consider Belgium to be a good control group.
Table 6.4 presents the results of this regression. The VAT_2012 dummies show a positive and
significant effect on inflation. The coefficients are slightly increasing in the months after October
2012, starting from 1.15 in October. In all months the coefficient of the dummy is lower than 1.7(the
value in case of full shifting). This might indicate that retailers did not fully shift the VAT increase
into consumer prices. However, one should be careful when drawing this conclusion, as the
coefficients do not differ significantly from 1.7.
Dum_VAT2001_12 2.92
(0.47)***
2.88
(0.47)***
CONTROL VARIABLES:
Inflation euro area 0.89
(0.02)***
0.89
(0.02)***
GDP -0.12
(0.03)***
-0.12
(0.02)***
Interest 0.18
(0.06)**
0.26
(0.05)***
GDP(-1) 0.05
(0.03)***
Estimation FE FE
Observations 7294 7294
0
1
2
3
4
j a s o n d j f m a m j j a s o n d j f m
2011 2012 2013
Netherlands Belgium
-1
0
1
2
3
4
5
f m a m j j a s o n d j f m a m j j a s o n d
2000 2001
Netherlands Belgium
Figure 6.4: Inflation Belgium & the Netherlands 2001 Figure 6.5 Inflation Belgium & the Netherlands 2012
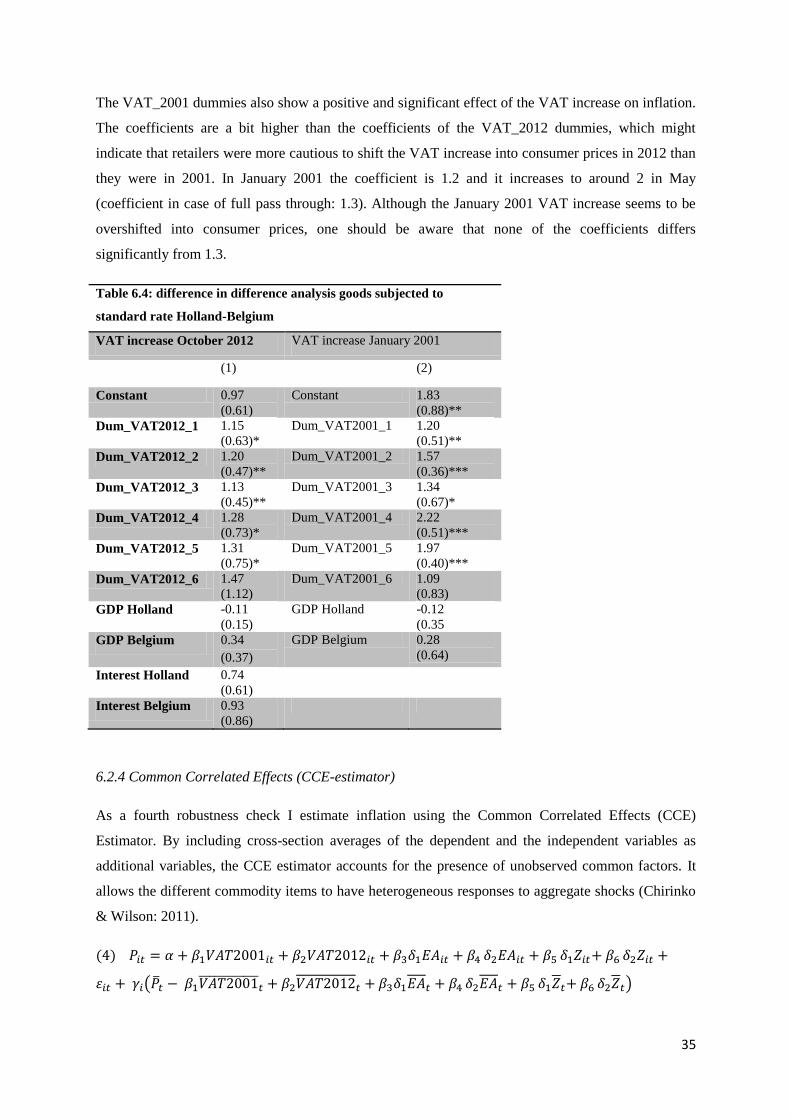
35
The VAT_2001 dummies also show a positive and significant effect of the VAT increase on inflation.
The coefficients are a bit higher than the coefficients of the VAT_2012 dummies, which might
indicate that retailers were more cautious to shift the VAT increase into consumer prices in 2012 than
they were in 2001. In January 2001 the coefficient is 1.2 and it increases to around 2 in May
(coefficient in case of full pass through: 1.3). Although the January 2001 VAT increase seems to be
overshifted into consumer prices, one should be aware that none of the coefficients differs
significantly from 1.3.
Table 6.4: difference in difference analysis goods subjected to
standard rate Holland-Belgium
VAT increase October 2012 VAT increase January 2001
(1) (2)
Constant 0.97
(0.61)
Constant 1.83
(0.88)**
Dum_VAT2012_1 1.15
(0.63)*
Dum_VAT2001_1 1.20
(0.51)**
Dum_VAT2012_2 1.20
(0.47)**
Dum_VAT2001_2 1.57
(0.36)***
Dum_VAT2012_3 1.13
(0.45)**
Dum_VAT2001_3 1.34
(0.67)*
Dum_VAT2012_4 1.28
(0.73)*
Dum_VAT2001_4 2.22
(0.51)***
Dum_VAT2012_5 1.31
(0.75)*
Dum_VAT2001_5 1.97
(0.40)***
Dum_VAT2012_6 1.47
(1.12)
Dum_VAT2001_6 1.09
(0.83)
GDP Holland -0.11
(0.15)
GDP Holland -0.12
(0.35
GDP Belgium 0.34
(0.37)
GDP Belgium 0.28
(0.64)
Interest Holland 0.74
(0.61)
Interest Belgium 0.93
(0.86)
6.2.4 Common Correlated Effects (CCE-estimator)
As a fourth robustness check I estimate inflation using the Common Correlated Effects (CCE)
Estimator. By including cross-section averages of the dependent and the independent variables as
additional variables, the CCE estimator accounts for the presence of unobserved common factors. It
allows the different commodity items to have heterogeneous responses to aggregate shocks (Chirinko
& Wilson: 2011).
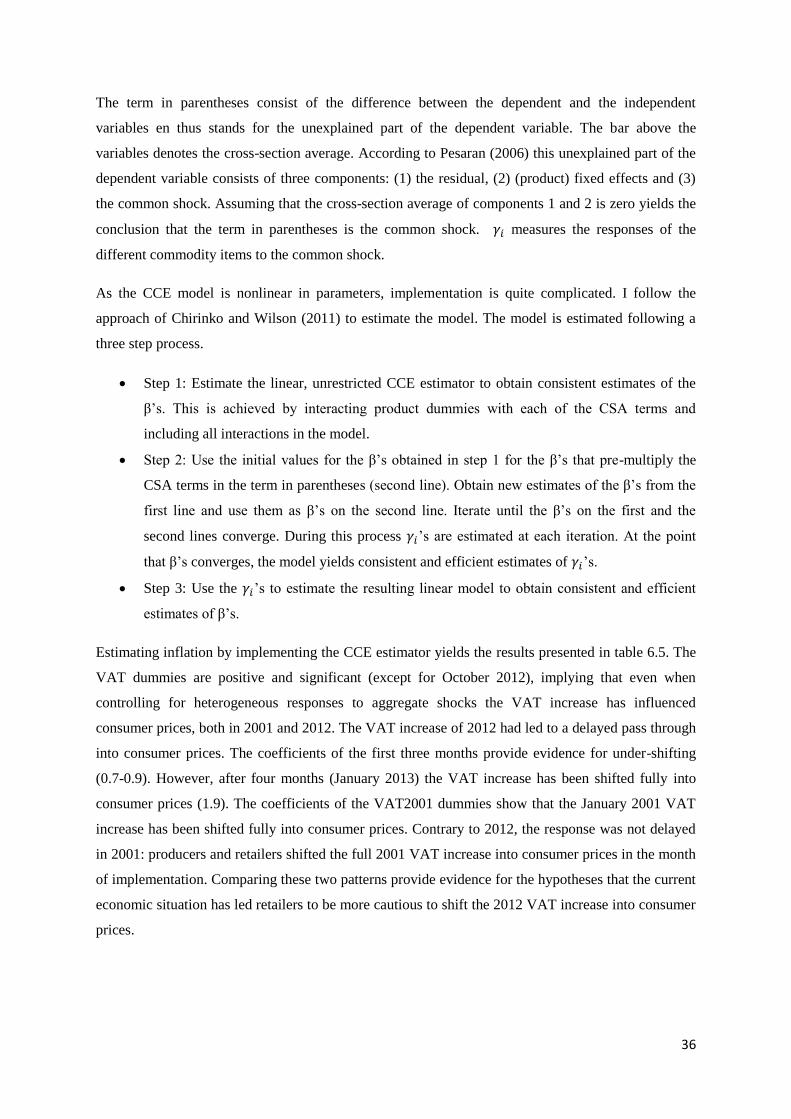
36
The term in parentheses consist of the difference between the dependent and the independent
variables en thus stands for the unexplained part of the dependent variable. The bar above the
variables denotes the cross-section average. According to Pesaran (2006) this unexplained part of the
dependent variable consists of three components: (1) the residual, (2) (product) fixed effects and (3)
the common shock. Assuming that the cross-section average of components 1 and 2 is zero yields the
conclusion that the term in parentheses is the common shock. measures the responses of the
different commodity items to the common shock.
As the CCE model is nonlinear in parameters, implementation is quite complicated. I follow the
approach of Chirinko and Wilson (2011) to estimate the model. The model is estimated following a
three step process.
Step 1: Estimate the linear, unrestricted CCE estimator to obtain consistent estimates of the
β’s. This is achieved by interacting product dummies with each of the CSA terms and
including all interactions in the model.
Step 2: Use the initial values for the β’s obtained in step 1 for the β’s that pre-multiply the
CSA terms in the term in parentheses (second line). Obtain new estimates of the β’s from the
first line and use them as β’s on the second line. Iterate until the β’s on the first and the
second lines converge. During this process ’s are estimated at each iteration. At the point
that β’s converges, the model yields consistent and efficient estimates of ’s.
Step 3: Use the ’s to estimate the resulting linear model to obtain consistent and efficient
estimates of β’s.
Estimating inflation by implementing the CCE estimator yields the results presented in table 6.5. The
VAT dummies are positive and significant (except for October 2012), implying that even when
controlling for heterogeneous responses to aggregate shocks the VAT increase has influenced
consumer prices, both in 2001 and 2012. The VAT increase of 2012 had led to a delayed pass through
into consumer prices. The coefficients of the first three months provide evidence for under-shifting
(0.7-0.9). However, after four months (January 2013) the VAT increase has been shifted fully into
consumer prices (1.9). The coefficients of the VAT2001 dummies show that the January 2001 VAT
increase has been shifted fully into consumer prices. Contrary to 2012, the response was not delayed
in 2001: producers and retailers shifted the full 2001 VAT increase into consumer prices in the month
of implementation. Comparing these two patterns provide evidence for the hypotheses that the current
economic situation has led retailers to be more cautious to shift the 2012 VAT increase into consumer
prices.
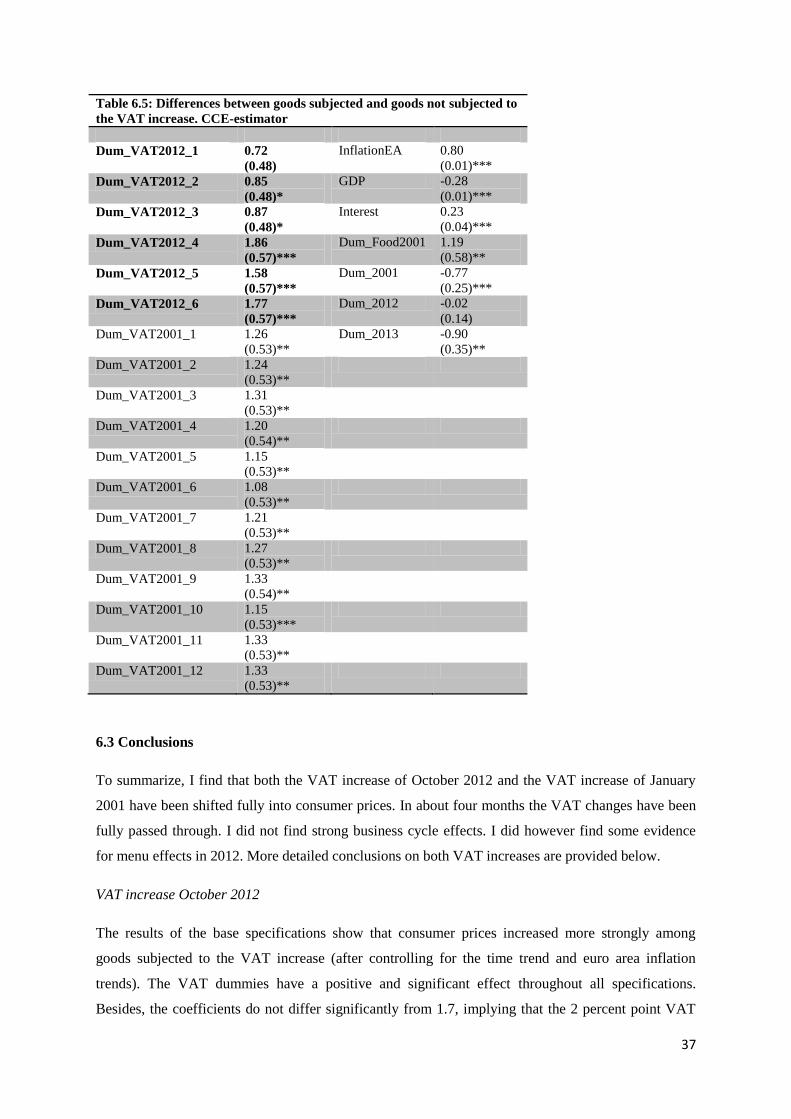
37
Table 6.5: Differences between goods subjected and goods not subjected to
the VAT increase. CCE-estimator
Dum_VAT2012_1 0.72
(0.48)
InflationEA 0.80
(0.01)***
Dum_VAT2012_2 0.85
(0.48)*
GDP -0.28
(0.01)***
Dum_VAT2012_3 0.87
(0.48)*
Interest 0.23
(0.04)***
Dum_VAT2012_4 1.86
(0.57)***
Dum_Food2001 1.19
(0.58)**
Dum_VAT2012_5 1.58
(0.57)***
Dum_2001 -0.77
(0.25)***
Dum_VAT2012_6 1.77
(0.57)***
Dum_2012 -0.02
(0.14)
Dum_VAT2001_1 1.26
(0.53)**
Dum_2013 -0.90
(0.35)**
Dum_VAT2001_2 1.24
(0.53)**
Dum_VAT2001_3 1.31
(0.53)**
Dum_VAT2001_4 1.20
(0.54)**
Dum_VAT2001_5 1.15
(0.53)**
Dum_VAT2001_6 1.08
(0.53)**
Dum_VAT2001_7 1.21
(0.53)**
Dum_VAT2001_8 1.27
(0.53)**
Dum_VAT2001_9 1.33
(0.54)**
Dum_VAT2001_10 1.15
(0.53)***
Dum_VAT2001_11 1.33
(0.53)**
Dum_VAT2001_12 1.33
(0.53)**
6.3 Conclusions
To summarize, I find that both the VAT increase of October 2012 and the VAT increase of January
2001 have been shifted fully into consumer prices. In about four months the VAT changes have been
fully passed through. I did not find strong business cycle effects. I did however find some evidence
for menu effects in 2012. More detailed conclusions on both VAT increases are provided below.
VAT increase October 2012
The results of the base specifications show that consumer prices increased more strongly among
goods subjected to the VAT increase (after controlling for the time trend and euro area inflation
trends). The VAT dummies have a positive and significant effect throughout all specifications.
Besides, the coefficients do not differ significantly from 1.7, implying that the 2 percent point VAT
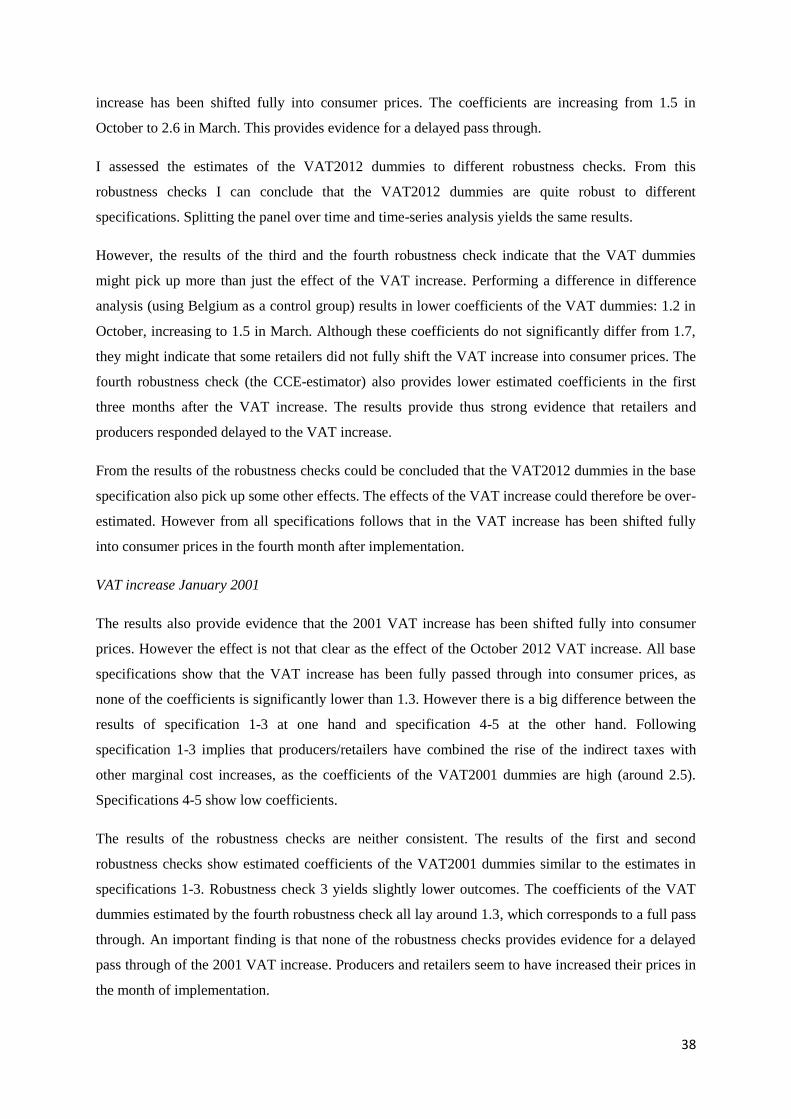
38
increase has been shifted fully into consumer prices. The coefficients are increasing from 1.5 in
October to 2.6 in March. This provides evidence for a delayed pass through.
I assessed the estimates of the VAT2012 dummies to different robustness checks. From this
robustness checks I can conclude that the VAT2012 dummies are quite robust to different
specifications. Splitting the panel over time and time-series analysis yields the same results.
However, the results of the third and the fourth robustness check indicate that the VAT dummies
might pick up more than just the effect of the VAT increase. Performing a difference in difference
analysis (using Belgium as a control group) results in lower coefficients of the VAT dummies: 1.2 in
October, increasing to 1.5 in March. Although these coefficients do not significantly differ from 1.7,
they might indicate that some retailers did not fully shift the VAT increase into consumer prices. The
fourth robustness check (the CCE-estimator) also provides lower estimated coefficients in the first
three months after the VAT increase. The results provide thus strong evidence that retailers and
producers responded delayed to the VAT increase.
From the results of the robustness checks could be concluded that the VAT2012 dummies in the base
specification also pick up some other effects. The effects of the VAT increase could therefore be over-
estimated. However from all specifications follows that in the VAT increase has been shifted fully
into consumer prices in the fourth month after implementation.
VAT increase January 2001
The results also provide evidence that the 2001 VAT increase has been shifted fully into consumer
prices. However the effect is not that clear as the effect of the October 2012 VAT increase. All base
specifications show that the VAT increase has been fully passed through into consumer prices, as
none of the coefficients is significantly lower than 1.3. However there is a big difference between the
results of specification 1-3 at one hand and specification 4-5 at the other hand. Following
specification 1-3 implies that producers/retailers have combined the rise of the indirect taxes with
other marginal cost increases, as the coefficients of the VAT2001 dummies are high (around 2.5).
Specifications 4-5 show low coefficients.
The results of the robustness checks are neither consistent. The results of the first and second
robustness checks show estimated coefficients of the VAT2001 dummies similar to the estimates in
specifications 1-3. Robustness check 3 yields slightly lower outcomes. The coefficients of the VAT
dummies estimated by the fourth robustness check all lay around 1.3, which corresponds to a full pass
through. An important finding is that none of the robustness checks provides evidence for a delayed
pass through of the 2001 VAT increase. Producers and retailers seem to have increased their prices in
the month of implementation.
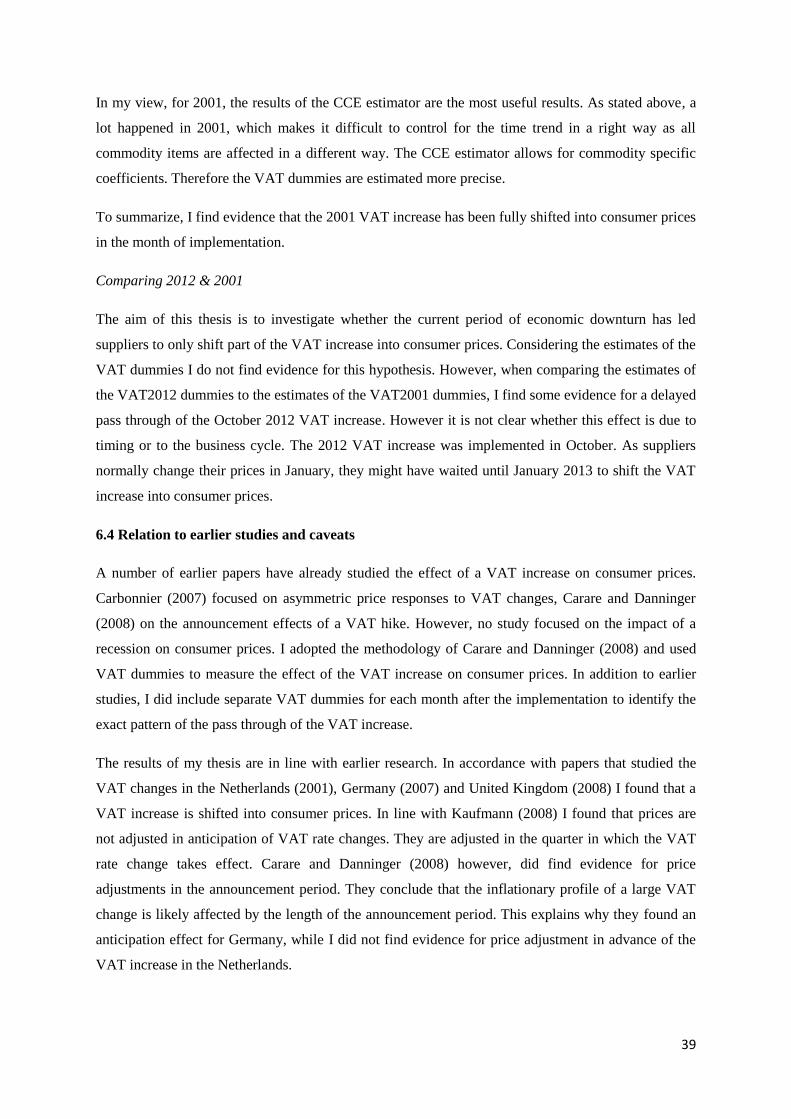
39
In my view, for 2001, the results of the CCE estimator are the most useful results. As stated above, a
lot happened in 2001, which makes it difficult to control for the time trend in a right way as all
commodity items are affected in a different way. The CCE estimator allows for commodity specific
coefficients. Therefore the VAT dummies are estimated more precise.
To summarize, I find evidence that the 2001 VAT increase has been fully shifted into consumer prices
in the month of implementation.
Comparing 2012 & 2001
The aim of this thesis is to investigate whether the current period of economic downturn has led
suppliers to only shift part of the VAT increase into consumer prices. Considering the estimates of the
VAT dummies I do not find evidence for this hypothesis. However, when comparing the estimates of
the VAT2012 dummies to the estimates of the VAT2001 dummies, I find some evidence for a delayed
pass through of the October 2012 VAT increase. However it is not clear whether this effect is due to
timing or to the business cycle. The 2012 VAT increase was implemented in October. As suppliers
normally change their prices in January, they might have waited until January 2013 to shift the VAT
increase into consumer prices.
6.4 Relation to earlier studies and caveats
A number of earlier papers have already studied the effect of a VAT increase on consumer prices.
Carbonnier (2007) focused on asymmetric price responses to VAT changes, Carare and Danninger
(2008) on the announcement effects of a VAT hike. However, no study focused on the impact of a
recession on consumer prices. I adopted the methodology of Carare and Danninger (2008) and used
VAT dummies to measure the effect of the VAT increase on consumer prices. In addition to earlier
studies, I did include separate VAT dummies for each month after the implementation to identify the
exact pattern of the pass through of the VAT increase.
The results of my thesis are in line with earlier research. In accordance with papers that studied the
VAT changes in the Netherlands (2001), Germany (2007) and United Kingdom (2008) I found that a
VAT increase is shifted into consumer prices. In line with Kaufmann (2008) I found that prices are
not adjusted in anticipation of VAT rate changes. They are adjusted in the quarter in which the VAT
rate change takes effect. Carare and Danninger (2008) however, did find evidence for price
adjustments in the announcement period. They conclude that the inflationary profile of a large VAT
change is likely affected by the length of the announcement period. This explains why they found an
anticipation effect for Germany, while I did not find evidence for price adjustment in advance of the
VAT increase in the Netherlands.
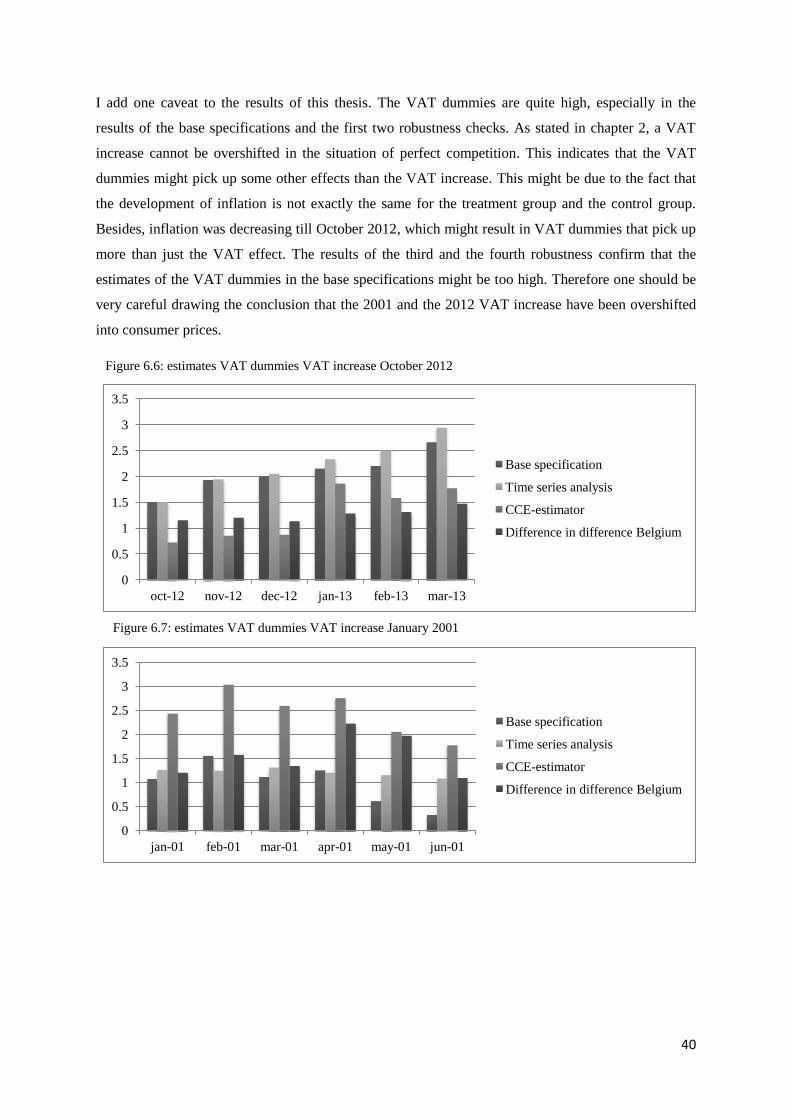
40
I add one caveat to the results of this thesis. The VAT dummies are quite high, especially in the
results of the base specifications and the first two robustness checks. As stated in chapter 2, a VAT
increase cannot be overshifted in the situation of perfect competition. This indicates that the VAT
dummies might pick up some other effects than the VAT increase. This might be due to the fact that
the development of inflation is not exactly the same for the treatment group and the control group.
Besides, inflation was decreasing till October 2012, which might result in VAT dummies that pick up
more than just the VAT effect. The results of the third and the fourth robustness confirm that the
estimates of the VAT dummies in the base specifications might be too high. Therefore one should be
very careful drawing the conclusion that the 2001 and the 2012 VAT increase have been overshifted
into consumer prices.
Figure 6.7: estimates VAT dummies VAT increase January 2001
0
0.5
1
1.5
2
2.5
3
3.5
oct-12 nov-12 dec-12 jan-13 feb-13 mar-13
Base specification
Time series analysis
CCE-estimator
Difference in difference Belgium
0
0.5
1
1.5
2
2.5
3
3.5
jan-01 feb-01 mar-01 apr-01 may-01 jun-01
Base specification
Time series analysis
CCE-estimator
Difference in difference Belgium
Figure 6.6: estimates VAT dummies VAT increase October 2012
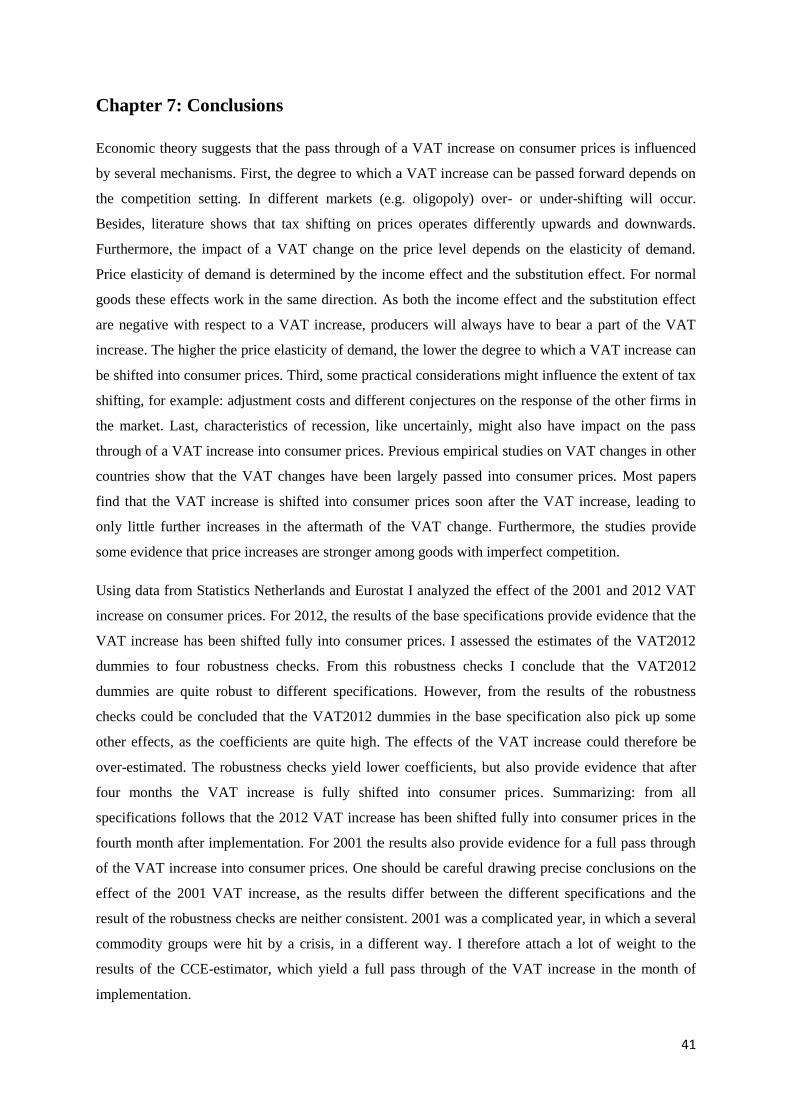
41
Chapter 7: Conclusions
Economic theory suggests that the pass through of a VAT increase on consumer prices is influenced
by several mechanisms. First, the degree to which a VAT increase can be passed forward depends on
the competition setting. In different markets (e.g. oligopoly) over- or under-shifting will occur.
Besides, literature shows that tax shifting on prices operates differently upwards and downwards.
Furthermore, the impact of a VAT change on the price level depends on the elasticity of demand.
Price elasticity of demand is determined by the income effect and the substitution effect. For normal
goods these effects work in the same direction. As both the income effect and the substitution effect
are negative with respect to a VAT increase, producers will always have to bear a part of the VAT
increase. The higher the price elasticity of demand, the lower the degree to which a VAT increase can
be shifted into consumer prices. Third, some practical considerations might influence the extent of tax
shifting, for example: adjustment costs and different conjectures on the response of the other firms in
the market. Last, characteristics of recession, like uncertainly, might also have impact on the pass
through of a VAT increase into consumer prices. Previous empirical studies on VAT changes in other
countries show that the VAT changes have been largely passed into consumer prices. Most papers
find that the VAT increase is shifted into consumer prices soon after the VAT increase, leading to
only little further increases in the aftermath of the VAT change. Furthermore, the studies provide
some evidence that price increases are stronger among goods with imperfect competition.
Using data from Statistics Netherlands and Eurostat I analyzed the effect of the 2001 and 2012 VAT
increase on consumer prices. For 2012, the results of the base specifications provide evidence that the
VAT increase has been shifted fully into consumer prices. I assessed the estimates of the VAT2012
dummies to four robustness checks. From this robustness checks I conclude that the VAT2012
dummies are quite robust to different specifications. However, from the results of the robustness
checks could be concluded that the VAT2012 dummies in the base specification also pick up some
other effects, as the coefficients are quite high. The effects of the VAT increase could therefore be
over-estimated. The robustness checks yield lower coefficients, but also provide evidence that after
four months the VAT increase is fully shifted into consumer prices. Summarizing: from all
specifications follows that the 2012 VAT increase has been shifted fully into consumer prices in the
fourth month after implementation. For 2001 the results also provide evidence for a full pass through
of the VAT increase into consumer prices. One should be careful drawing precise conclusions on the
effect of the 2001 VAT increase, as the results differ between the different specifications and the
result of the robustness checks are neither consistent. 2001 was a complicated year, in which a several
commodity groups were hit by a crisis, in a different way. I therefore attach a lot of weight to the
results of the CCE-estimator, which yield a full pass through of the VAT increase in the month of
implementation.
42
Literature
Baker, P. and V. Brechling, 1992. The impact of excise duty changes on retail prices in the UK.
Fiscal Studies, 13 (2), p.48-65
Barrell, R. and M. Weale. The Economics of a Reduction in VAT. Fiscal Studies, 30 (1), p. 17-30
Blundell, R. Assessing the temporary VAT cut policy in the UK. Fiscal Studies, 30 (1), p. 31-38
Carbonnier, C., 2005. Is tax shifting asymmetric? Evidence from French VAT reforms 1995-2000.
Paris- Jourdan Sciences Economiques Working Paper, WP/2005/09
Carbonnier, C., 2006. Who pays commodity taxes? Evidence from French Reforms 1987-1999. Paris-
Jourdan Sciences Economiques Working Paper, WP/2006/13
Carare, A. and S. Danninger, 2008. Inflation smoothing and the modest effect of VAT in Germany.
IMF Working Paper, WP/08/175.
Chirakijja, J., T.F. Crossley, M. Lührmann, & C. Odea (2009). The Stimulus Effect of the 2008 UK
Temporary Vat Cut, Prepared for: Value-Added Tax: Fiscal and Practical Potential NTA National Tax
Association Annual Meeting.
Chirinko, R. and D. Wilson, 2011. Tax competition among US states: racing to the bottom or riding
on a seesaw? CESifo Working Paper no. 3535
De Nederlandsche Bank 2012. Economische ontwikkelingen en vooruitzichten. December 2012/ nr. 4
Deutsche Bundesbank, 2008. Price and Volume effects of VAT increase on January 2007. Monthly
Report, April, p. 29-46.
Frank, R.H, 2008. Microeconomics and behavior (7th ed.). Singapore: McGraw-Hill.
Fullerton, D. and G.E. Metcalf, 2002. Tax Incidence, in: Auerbach A.J. and M. Feldstein (eds.),
Handbook of Public Economics 4, p. 1787-1872.
Hoffmann, J. and J.R. Kurz-Kim, 2006. Consumer price adjustment under the microscope, Germany
in a period of low inflation. ECB Working Paper Series, no. 652.
IFS, CPB, CAP, CASE, CEPPII, ETLA, IFO and IHS, 2011. The effect of VAT on price-setting
behavior. In: a retrospective evaluation of elements of the EU VAT system, Chapter 8, p. 285-358.
ING Economisch Bureau. Sectoralert btw: ondernemer betaalt hogere btw.
http://www.ing.nl/Images/ING-Sectoralert-btw-Ondernemer-betaalt-hogere-btw_tcm7-
119116.pdf?id=20120906095957
43
Jonker, N., C. Folkertsma and H. Blijenberg, 2004. An empirical analysis of price setting behaviour in
the Netherlands in the period 1998-2003 using Micro Data. ECB Working Paper Series, no. 413.
Katz, M and H. Rosen,1985. Tax analysis in an oligopoly model. Public Finance Quarterly 13, p. 3-
19.
Kaufmann, D. (2008). Price-Setting Behaviour in Switzerland Evidence from CPI Micro Data (No.
2008-15).
Pesaran, M.H. (2006). Estimation and inference in large heterogeneous panels with a multifactor error
structure. Econometrica, 74(4):967-1012
Statistics Netherlands. Persbericht: Inflatie in 2001 hoogste sinds 1982.
http://www.cbs.nl/NR/rdonlyres/6D0394C5-062B-400D-A0ED-D8D0BAE6F4D0/0/pb02n005.pdf
Stiglitz, J.E. 1997. Economics (2nd ed.). New York: W.W. Norton & Company Inc.
Valadkhani, A. (2005). Goods and Services Tax Effects on Goods and Services Included in the
Consumer Price Index Basket. Economic Record, 81(s1), S104-S114.
Viren, M. 2009. Does the value-added tax shift to consumption prices? Auco 3/02, p. 123-142
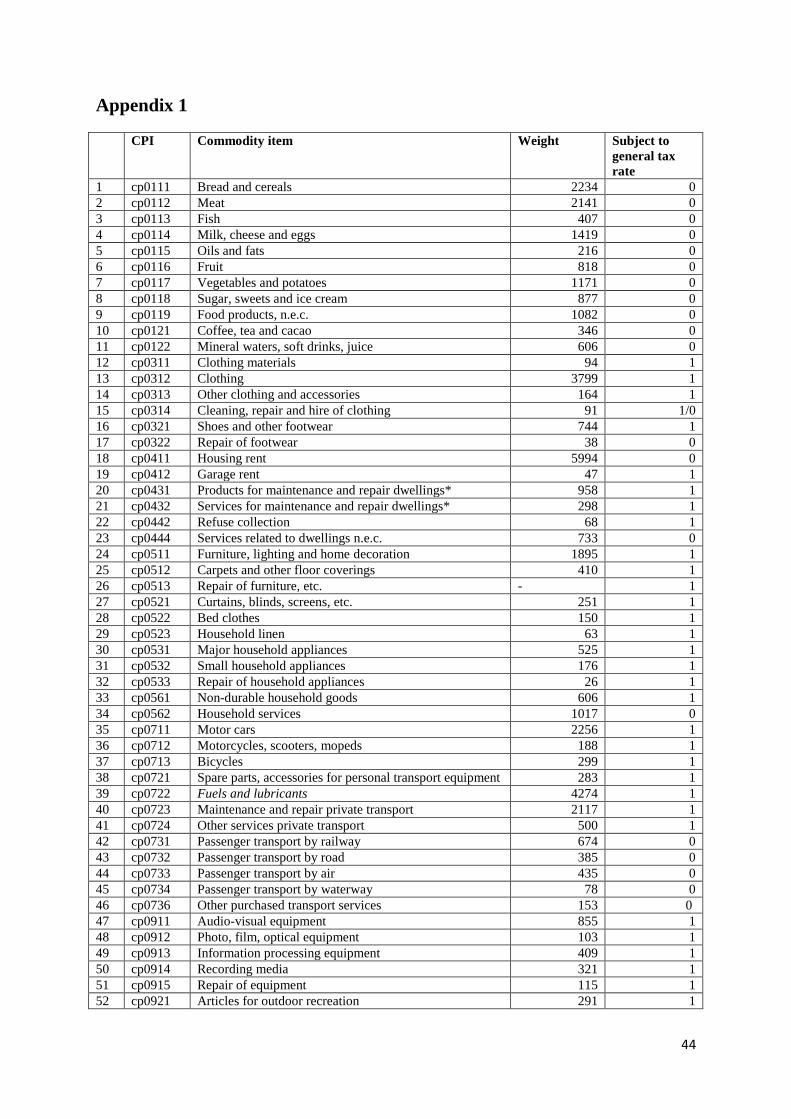
44
Appendix 1
CPI Commodity item Weight Subject to
general tax
rate
1 cp0111 Bread and cereals 2234 0
2 cp0112 Meat 2141 0
3 cp0113 Fish 407 0
4 cp0114 Milk, cheese and eggs 1419 0
5 cp0115 Oils and fats 216 0
6 cp0116 Fruit 818 0
7 cp0117 Vegetables and potatoes 1171 0
8 cp0118 Sugar, sweets and ice cream 877 0
9 cp0119 Food products, n.e.c. 1082 0
10 cp0121 Coffee, tea and cacao 346 0
11 cp0122 Mineral waters, soft drinks, juice 606 0
12 cp0311 Clothing materials 94 1
13 cp0312 Clothing 3799 1
14 cp0313 Other clothing and accessories 164 1
15 cp0314 Cleaning, repair and hire of clothing 91 1/0
16 cp0321 Shoes and other footwear 744 1
17 cp0322 Repair of footwear 38 0
18 cp0411 Housing rent 5994 0
19 cp0412 Garage rent 47 1
20 cp0431 Products for maintenance and repair dwellings* 958 1
21 cp0432 Services for maintenance and repair dwellings* 298 1
22 cp0442 Refuse collection 68 1
23 cp0444 Services related to dwellings n.e.c. 733 0
24 cp0511 Furniture, lighting and home decoration 1895 1
25 cp0512 Carpets and other floor coverings 410 1
26 cp0513 Repair of furniture, etc. - 1
27 cp0521 Curtains, blinds, screens, etc. 251 1
28 cp0522 Bed clothes 150 1
29 cp0523 Household linen 63 1
30 cp0531 Major household appliances 525 1
31 cp0532 Small household appliances 176 1
32 cp0533 Repair of household appliances 26 1
33 cp0561 Non-durable household goods 606 1
34 cp0562 Household services 1017 0
35 cp0711 Motor cars 2256 1
36 cp0712 Motorcycles, scooters, mopeds 188 1
37 cp0713 Bicycles 299 1
38 cp0721 Spare parts, accessories for personal transport equipment 283 1
39 cp0722 Fuels and lubricants 4274 1
40 cp0723 Maintenance and repair private transport 2117 1
41 cp0724 Other services private transport 500 1
42 cp0731 Passenger transport by railway 674 0
43 cp0732 Passenger transport by road 385 0
44 cp0733 Passenger transport by air 435 0
45 cp0734 Passenger transport by waterway 78 0
46 cp0736 Other purchased transport services 153 0
47 cp0911 Audio-visual equipment 855 1
48 cp0912 Photo, film, optical equipment 103 1
49 cp0913 Information processing equipment 409 1
50 cp0914 Recording media 321 1
51 cp0915 Repair of equipment 115 1
52 cp0921 Articles for outdoor recreation 291 1
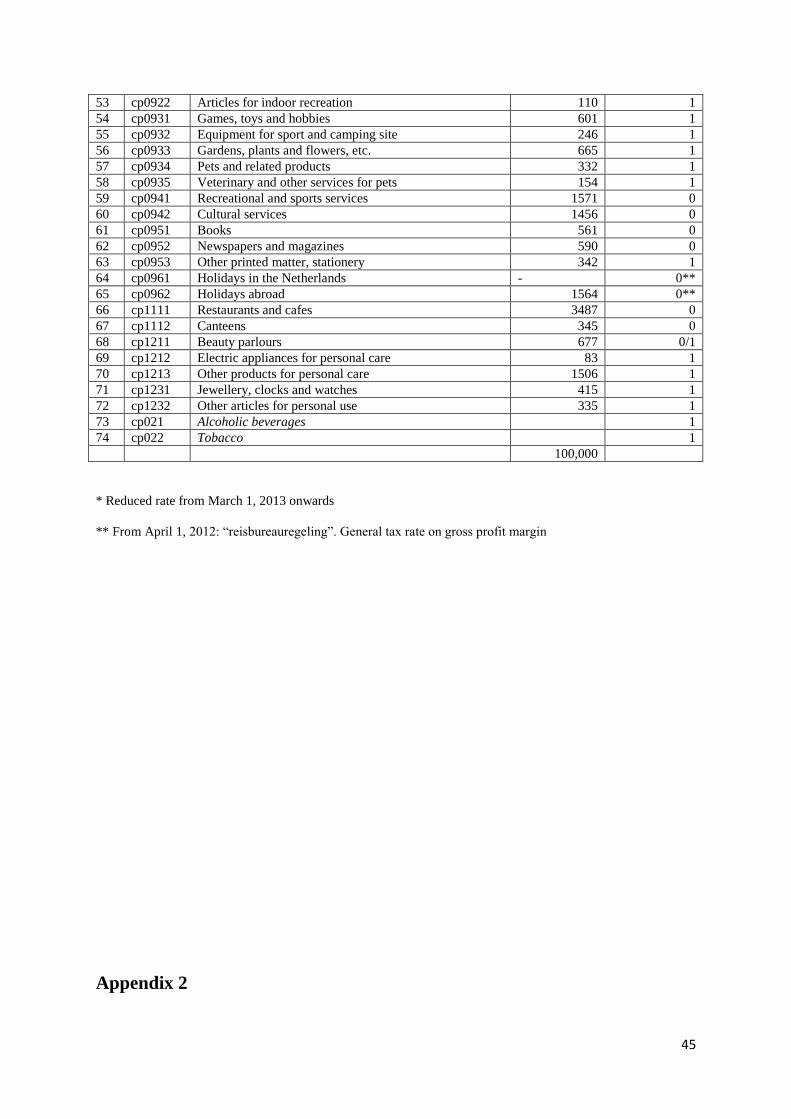
45
53 cp0922 Articles for indoor recreation 110 1
54 cp0931 Games, toys and hobbies 601 1
55 cp0932 Equipment for sport and camping site 246 1
56 cp0933 Gardens, plants and flowers, etc. 665 1
57 cp0934 Pets and related products 332 1
58 cp0935 Veterinary and other services for pets 154 1
59 cp0941 Recreational and sports services 1571 0
60 cp0942 Cultural services 1456 0
61 cp0951 Books 561 0
62 cp0952 Newspapers and magazines 590 0
63 cp0953 Other printed matter, stationery 342 1
64 cp0961 Holidays in the Netherlands - 0**
65 cp0962 Holidays abroad 1564 0**
66 cp1111 Restaurants and cafes 3487 0
67 cp1112 Canteens 345 0
68 cp1211 Beauty parlours 677 0/1
69 cp1212 Electric appliances for personal care 83 1
70 cp1213 Other products for personal care 1506 1
71 cp1231 Jewellery, clocks and watches 415 1
72 cp1232 Other articles for personal use 335 1
73 cp021 Alcoholic beverages 1
74 cp022 Tobacco 1
100,000
* Reduced rate from March 1, 2013 onwards
** From April 1, 2012: “reisbureauregeling”. General tax rate on gross profit margin
Appendix 2
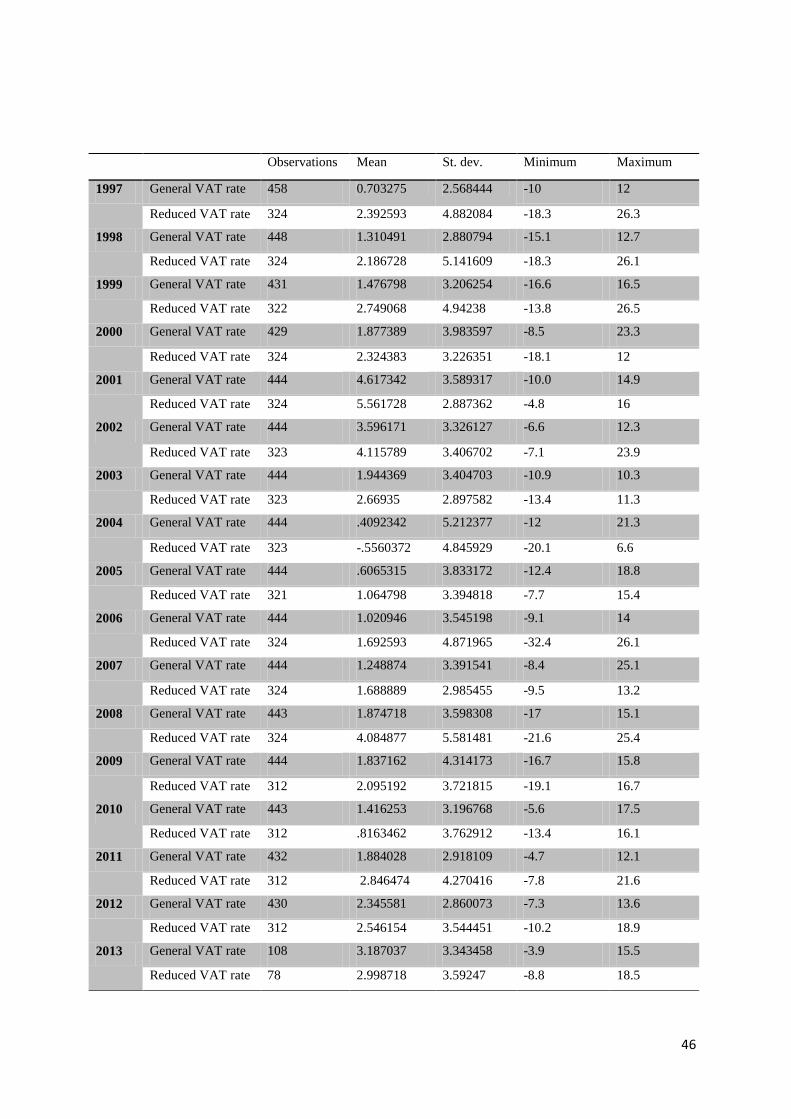
46
Observations Mean St. dev. Minimum Maximum
1997 General VAT rate 458 0.703275 2.568444 -10 12
Reduced VAT rate 324 2.392593 4.882084 -18.3 26.3
1998 General VAT rate 448 1.310491 2.880794 -15.1 12.7
Reduced VAT rate 324 2.186728 5.141609 -18.3 26.1
1999 General VAT rate 431 1.476798 3.206254 -16.6 16.5
Reduced VAT rate 322 2.749068 4.94238 -13.8 26.5
2000 General VAT rate 429 1.877389 3.983597 -8.5 23.3
Reduced VAT rate 324 2.324383 3.226351 -18.1 12
2001 General VAT rate 444 4.617342 3.589317 -10.0 14.9
Reduced VAT rate 324 5.561728 2.887362 -4.8 16
2002 General VAT rate 444 3.596171 3.326127 -6.6 12.3
Reduced VAT rate 323 4.115789 3.406702 -7.1 23.9
2003 General VAT rate 444 1.944369 3.404703 -10.9 10.3
Reduced VAT rate 323 2.66935 2.897582 -13.4 11.3
2004 General VAT rate 444 .4092342 5.212377 -12 21.3
Reduced VAT rate 323 -.5560372 4.845929 -20.1 6.6
2005 General VAT rate 444 .6065315 3.833172 -12.4 18.8
Reduced VAT rate 321 1.064798 3.394818 -7.7 15.4
2006 General VAT rate 444 1.020946 3.545198 -9.1 14
Reduced VAT rate 324 1.692593 4.871965 -32.4 26.1
2007 General VAT rate 444 1.248874 3.391541 -8.4 25.1
Reduced VAT rate 324 1.688889 2.985455 -9.5 13.2
2008 General VAT rate 443 1.874718 3.598308 -17 15.1
Reduced VAT rate 324 4.084877 5.581481 -21.6 25.4
2009 General VAT rate 444 1.837162 4.314173 -16.7 15.8
Reduced VAT rate 312 2.095192 3.721815 -19.1 16.7
2010 General VAT rate 443 1.416253 3.196768 -5.6 17.5
Reduced VAT rate 312 .8163462 3.762912 -13.4 16.1
2011 General VAT rate 432 1.884028 2.918109 -4.7 12.1
Reduced VAT rate 312 2.846474 4.270416 -7.8 21.6
2012 General VAT rate 430 2.345581 2.860073 -7.3 13.6
Reduced VAT rate 312 2.546154 3.544451 -10.2 18.9
2013 General VAT rate 108 3.187037 3.343458 -3.9 15.5
Reduced VAT rate 78 2.998718 3.59247 -8.8 18.5