Embed Size (px)
Citation preview
THE INFLUENCE OF THE ORIGINAL LOCAL
GOVERNMENT REVENUE (PAD) AND GENERAL
ALLOCATION OF FUNDS (DAU) TO LOCAL GOVERNMENT
EXPENDITURES
(Case Study in 10 Districts/Cities in Lampung Province)
Written by :
Merdiansyah
NIM. 109082100008
INTERNATIONAL PROGRAM
ACCOUNTING DEPARTMENT
FACULTY OF ECONOMIC AND BUSINESS
STATE ISLAMIC UNIVERSITY SYARIF HIDAYATULLAH
JAKARTA
1434 H / 2013 M

iii

v

ii
CURRICULUM VITAE
PERSONAL DATA
Name :
Merdiansyah
Place, date of birth :
Karta, march 22nd
1990
Current Address :
Jl. H. ir. Juanda, gang karyawan no.39 RT 004/ RW 001 kel. Ciputat tanggerang selatan, banten
Permanent Address :
Jl. Ratu Pengadilan no. 3 RT 002/ RK 002 karta, Tulang Bawang Barat, Lampung.
Nationality :
Indonesia
Phone :
+6281284518282
Email :
[email protected] [email protected]
Hobbies & Interests :
Dragbike, futsal & learning new thing
GPA :
3,43
CAREER OBJECTIVE
EDUCATION
2009 – 2013
syarif hidayatullah Islamic state university, Jakarta
International accounting
2006 – 2009
Al-Kautsar Senior High School
Social
2005 - 2006
Al-Kautsar Junior High School
2003 - 2005
Public 2 Junior High School
1997 - 2003
Public 2 Elementary school
WORKING EXPERIENCE & INTERNSHIP
2012 CV. Buana Mahardika Field Supervisor
2011 CV. Radin Sebuai Field Supervisor
ORGANIZATION EXPERIENCE
2010-2012
“Himpunan Mahasiswa Lampung’ tanggerang selatan
Humas
ACHIEVEMENT
2010 One of Founder of “himpunan mahasiswa lampung” Syarif Hidayatullah Islamic State University”
TRAINING & SEMINAR
2012 DAAD Study trip go to Germany “democracy”
2011 “Learning how to be rich” Savinaturssalam social entity
2009 Moderate Muslim Society ”islam in the west and the east: boosting democracy, Human Rights, Freedom and peaceful coexistence”
LANGUAGE & SKILLSLANGUAGE
English Good
COMPUTER
Ms Office (MS Words, Ms Excel, Ms PowerPoint)
RELEVANT CERTIFICATE
Training Certificates
Implementing my knowledge which I learn from university and environment and develop it to enrich my experience..
vi

vii
ABSTRACT
This research aimed to analyze the influences of Original Local
Government Revenues (PAD) and General Allocation Funds (DAU) partially and
simultaneously to the Local Government Expenditures and analyze the which
Flypaper Effect occurred or not in 10 Districts/Cities in Lampung province at
2008- 2010.
This research is using purposive sampling method, that is aimed by the
researcher are likely to obtain information from specific target groups, the
sampling here is confined to specific types of people/sample which can provide
the desired information, either because they are the only ones which have it, or
conform to some criteria set by the researcher.
Among the number of districts / cities submitting the realization, APBD
Report between 2008 and 2010 to the www.djpk.depkeu.go.id site and
www.bps.go.id site are as many as 10 districts / cities in the Lampung Province
This research founds that local government revenues (PAD) has no
significant effect to Local Government Expenditures. The higher the PAD in
Local Government Revenue and Expenditure Budget (APBD), the higher
allocation of local government expenditures. The General Allocation Funds
(DAU) has a significant positive effect on the Local Expenditures (BD). Local
Government Revenue and Expenditure budget (APBD) with higher DAU will
have higher local government expenditures. This research has discovered that
Original Local Government Revenues (PAD) and the General Allocation Funds
(DAU) have a simultaneously impact on Local Government Expenditures (BD).
The authors concluded that there has been a Flypaper effect in 10
districts / cities in the Lampung province by analyze the composition of the Local
Government Revenue and Expenditure Budget (APBD) between the PAD, and the
Balanced Fund is much different.
Keyword : General allocation fund (DAU),Original Local Government
Revenues (PAD),the Local Expenditures (BD), Flypaper effect
viii
ABSTRAK
Penelitian ini bertujuan untuk menganalisis pengaruh Pendapatan Asli
Daerah (PAD) dan Dana Alokasi Umum (DAU) secara parsial dan secara
simultan terhadap Belanja Pemerintah Daerah dan menganalisis yang flypaper
effect terjadi atau tidak di 10 Kabupaten / Kota di Provinsi Lampung pada 2008-
2010.
Penelitian ini menggunakan metode purposive sampling, yang ditujukan
oleh peneliti yang mungkin untuk mendapatkan informasi dari kelompok sasaran
tertentu, sampling di sini terbatas pada jenis tertentu orang / sampel yang dapat
memberikan informasi yang diinginkan, baik karena mereka adalah satu-satunya
yang memilikinya, atau sesuai dengan beberapa kriteria yang ditetapkan oleh
peneliti.Di antara jumlah kabupaten / kota mengirimkan realisasi, Laporan APBD
antara tahun 2008 dan 2010 ke situs www.djpk.depkeu.go.id dan www.bps.go.id
disebutkan sebanyak 10 kabupaten / kota di Provinsi Lampung.
Penelitian ini menemukan bahwa pendapatan asli daerah (PAD)
berpengaruh positif terhadap Belanja Pemerintah Daerah. Semakin tinggi PAD
Pendapatan Daerah dan Belanja (APBD), alokasi lebih besar dari pengeluaran
pemerintah daerah. Dana Alokasi Umum (DAU) berpengaruh positif signifikan
terhadap Belanja Daerah (BD). Pendapatan Pemerintah Daerah dan Belanja
(APBD) dengan DAU yang lebih tinggi akan memiliki pengeluaran pemerintah
daerah yang lebih tinggi. Penelitian ini telah menemukan bahwa Pendapatan Asli
Daerah Pemerintah (PAD) dan Dana Alokasi Umum (DAU) secara bersamaan
memiliki dampak pada Belanja Pemerintah Daerah (BD).
Para penulis menyimpulkan bahwa telah terjadi flypaper effect di 10
kabupaten / kota di Provinsi Lampung dengan menganalisis komposisi
Pendapatan Daerah Pemerintah dan Belanja (APBD) antara PAD, dan DAU jauh
berbeda.
Kata kunc i: Pendapatan Asli Daerah (PAD), Dana Alokasi Umum (DAU),
Belanja Daerah (BD), flypaper effect

ix
FOREWORD
Assalamu’alaikum Wr.Wb
All praise to Allah SWT and Shalawat always gives to our Prophet
Muhammad SAW.
With the strength, intelligence, patience, and passion from Allah SWT, I
can to finish this my thesis as one of requirements to achieve bachelor degree. I
believe there is an invisible hand (God) which have helped me going through this
proces.
My special thank for my Mom, Rohida Adi, who has been helping and
support to finish the thesis. You are my angels in human form. So, I want to make
you always smile and proud of me at any situations. Thank you mom for
everything, I love you so much. You are the best mother in this whole world, and
thanks to allah because i have chance became your son.
My Beloved Father, Hersyah, who always give me lot of spirits and
motivations when i felt hopeless to finish my thesis. You always belived that I can
do everything on my own. You are the first man that I want to say thanks in the
world when I finish this thesis. I love you so much and thanks for everything.
I believe I am nothing without each one of you who has helped me to
finish this thesis. Thus, in this very special moment, let me say thanks to all of
them who were helped me through the process of this thesis, including:
1. Prof. Dr. Abdul Hamid, MS as Dean of Economic Faculty of UIN Syarif
Hidayatullah Jakarta.

x
2. Ahmad Dumyathi Bashori, MA as Head of International Program.
3. Prof. Dr. H.Margareth Gfrerer as my supervisor I. You are my inspiring
woman, thanks for your time, motivations, and knowledge which you had
given to me. So, I able to finish this thesis and the last thanks for quote “
do not become a man with developed country mindset if you want to
become number one”.
4. Abdul Hamid Cebba, Drs, Mba, Ak as my supervisor II who has provided
guidance and thank you for your time that you gave to me, I can finish this
mini thesis.
5. All Lecturers who have taught me patiently, may what they have given to
me useful in future and all staff UIN Jakarta, special thanks to:
Mr. Sugih Waluyo “thanks you have taught me and given explanation
about the thesis and also for provided any information”.
Mr. agusman who had gave motivations and change my mindset “do
not ever say IMPOSSIBLE but say I’M POSSIBLE”.
Mr. chairul anwar and Mrs. Ari purwanti thanks for your experience
and knowledge which you had shared to me.
Mr.Herni Ali, HT,. MM thanks for your directions, suggestions and
help so I can finish my study at university.
6. All my friends in Accounting International Program 6th
Batch (2009), who
helped me in finishing this thesis. Bunch of love for you guys Nanda, ,
Pipit, angga, bimo, dea, arini and eca thanks for every support and
motivation that you have gave to finish my thesis. ucup jihan, angga,
xi
Evi,cici, Diah, Septian tami, Opi and Aul thanks for every foolish things
and jokes that you have done, and you made my day full of laugh. Adnan,
Osman thanks for the time we have been through together for three and
half years. Senior, Junior, and management class thanks all who couldn’t
mention one by one “Thanks for your pray”.
7. My family.. Special thanks to my brother sadarsyah, SH, slamet
riyadi,S.E, and adam syah for moral and material supports my sister
Wahyuni Herda .
Authors realize that this thesis is still far from perfection, the suggestions
and constructive criticism from all parties are expected to improve further.
Finally, only Allah SWT will return all and writer hope this skripsi will be useful
to all parties, especially for writers and readers in general, may Allah bless us.
Amin.
Wassalammualaikum Wr.Wb.
Author
Jakarta, September 2013
(Merdiansyah)
xii
CONTENTS OF TABLE
INFORMATION PAGE
Cover ................................................................................................................... i
Certifivation From Supervisor ............................................................................ ii
Certification of Comprehensive Exam Sheet ...................................................... iii
Certification of Thesis Exam Sheet .................................................................... iv
Sheet Statement Authenticity Scientific Work .................................................... v
Curriculum Vitae ................................................................................................ vi
Abstract ............................................................................................................... vii
Abstract ............................................................................................................... viii
Foreword .............................................................................................................. ix
Table of Content ................................................................................................. xii
List of Tables ...................................................................................................... xiii
List of Figures ..................................................................................................... xiv
List of Appendix .................................................................................................. xv
Chapter I INTRODUCTION
A. Background Issues ................................................................ 1
B. Problem Formulation ............................................................. 7
C. Research Objectives .............................................................. 7
D. Research Benefits ................................................................. 8
Chapter II LITERATURE REVIEW
A. Theory Development ............................................................ 9
xiii
1. Local Government Budget (APBD) ............................... 10
2. Definition of Local Government Expenditures (BD) ..... 17
a. General Administration Expenditures ......................... 21
b. Operating Expenditures .............................................. 22
c. Capital Expenditures ................................................... 23
d. Transfer Expenditures ................................................. 23
e. Unexpected Expenditures ........................................... 23
3. Original Local Government Revenue (PAD) .................. 24
a. Local Taxes .............................................................. 26
b. Local Retribution ...................................................... 27
c. Results of Regional Owned-Enterprises and
Separated Local Wealth Management ...................... 28
d. Other Legal Revenue ............................................... 29
4. General Allocation Fund (DAU) ..................................... 30
B. Previous Research ................................................................. 32
C. Theoritical Framework ......................................................... 35
D. Hypothesis ............................................................................ 37
Chapter III RESEARCH METHODOLOGY
A. Scope of Research ................................................................. 38
B. Sampling Method .................................................................. 38
C. Data Collection Method ........................................................ 39
D. Data Analyze Method ............................................................ 39
1. Classical Assumption ...................................................... 40

xiv
a. Normality Test ........................................................... 40
b. Multicollinearity Test ................................................ 41
c. Autocorrelation Test .................................................. 42
d. Heteroscedasticity Test .............................................. 42
2. Hypothesis Testing .......................................................... 43
a. Multiple Regression .................................................. 43
b. Coefficient of Determination (R2) ........................... 44
c. Simultaneous Significance Test (F-Test) .................. 44
d. Partial Significance Test (t-Test) ............................... 45
E. Operational Variable ............................................................ 46
1. Original Local government revenue (variable X1) ........ 46
2. General Allocation Funds (Variable X2) ....................... 46
3. Local government Expenditures (Variable Y1) ............. 46
Chapter IV ANALYSIS AND DISCUSSION
A. General Description .............................................................. 48
B. Descriptive Statistics ............................................................. 49
1. Original Local Government Revenue (PAD) ................. 49
2. General Allocation Funds (DAU) ................................... 50
3. Local Government Expenditures (BD) ........................... 51
C. Analysis and Discussion ....................................................... 52
1. Classic Assumption Test ................................................. 52
a. Normality Test ............................................................ 52
b. Multicollinearity Test .................................................. 55
xv
c. Autocorrelation Test ................................................... 56
d. Heterocedasticity Test ................................................ 57
2. Hypothesis Testing ......................................................... 58
a. Coefficient of Determination ..................................... 58
b. Multiple Linear Regression ........................................ 60
c. Simultaneous Significant Test (F-Test) ...................... 61
d. Significant Partial Test (t-Test) .................................. 63
e. Hypothesis test result ................................................. 66
Chapter V CONCLUSIONS AND RECOMMENDATIONS
A. Conclusion ............................................................................ 67
B. Recomendation ..................................................................... 68
1. Local Government .......................................................... 68
a. Improving Strategy ................................................... 68
1). Local Tax ............................................................. 69
2). Regional Owned Enterprise (BUMD) ................. 70
3). Policy of side user ............................................... 71
2. Further Research ............................................................ 73
REFERENCE .................................................................................................... 74
APPENDIX I ..................................................................................................... 76
APPENDIX II .................................................................................................... 77
xvi
LIST OF TABLE
NO DESCRIPTIONS PAGE
2.1 Income and Expenditure Budget Chart ...................................................... 15
2.2 Previous Research Table ........................................................................... 34
3.1 Classification value of D ............................................................................ 42
4.1 Descriptive Statistics Test .......................................................................... 49
4.2 Kolmogorov-Smirnov Test ......................................................................... 53
4.3 Multicollinearity Test ................................................................................ 56
4.4 Autocorrelation Test ................................................................................... 56
4.5 Coefficient of Determination ...................................................................... 59
4.6 Multiple Regression ................................................................................... 60
4.7 Simultaneous Significant Test (F-Test) ..................................................... 62
4.8 Significant Partial Test (T-Test) ................................................................ 63
xvii
LIST OF FIGURE
NO DESCRIPTIONS PAGE
2.1 Theoritical Framework .............................................................................. 36
4.1 Normal P-Plot Graph ................................................................................. 54
4.2 Histogram Graph ....................................................................................... 55
4.3 Heteroscedasticity Test .............................................................................. 58

xviii
LIST OF APPENDIXES
NO DESCRIPTIONS PAGE
Appendix 1 Research Data .............................................................................. 76
Appendix 2 Output SPSS That Used for the Result of the Research .............. 77
1
CHAPTER I
INTRODUCTION
A. Background Issues
In January 2001 in Indonesia began a new round of nation organizing
system on all government levels and is known as the regional autonomy.
Nearly all the authorities of the Central Government devolved on the area,
except for five the field; Foreign policy, Security, Defense, Justice, Finance
and Religion. Since then the budget of the Local Government from year to
year had shown significant improvements, both in terms of coverage of the
types of funds allocated, as well as the quantity of allocation. Local
Government Expenditures are prioritized to execute government affairs, which
consist of the mandatory affairs and the option affairs that are set on the basis
statutory.
The Reformation brought many changes in the life of nation and the
state, one of the many reforms that led to a change is the reform of Central
Government relations with Local Governments better known as the "Regional
Autonomy." The term “Regional Autonomy” is not new, it is already
mentioned within the laws of the Constitution of 1945. The current Regional
Autonomy associated with the Law No. 32 of 2004, which concerns on local
governments and has been revised in the Law No. 22 of 1999 and Law No. 25.
In 1999 about of Local Government and Fiscal Balance between the Central
Government and Local Government. The enforcement of both statuary Laws
2
made an impact on changing patterns of regional accountability over funds
allocated. The pattern in use is the Horizontal Accountability pattern through
the House of Representatives (DPR).
Through the Regional Autonomy Act, the authority of regional
autonomy has been set up and is administrating the interests of the local
communities according to their own initiatives based on the aspirations of the
community. Bastian (2002:2) states that regional autonomy is a local
empowerment effort in regional decision making related to the management of
its resources consistence with the interests, priorities, and the regional
potency.
Regional Autonomy demanded local governments to be able to
providing excellent service as well as good news to the community, one of the
forms the service is to provide information that is transparent and accountable.
The concept of Regional Autonomy requires.
1. Community empowerment
2. Democratization in the sense of giving responsibility to all communities
3. Opportunities To accelerate the equally society welfare
4. The improvement quality of bureaucracy service.
5. Improved quality of supervision by the legislature.
Public sector reforms that accompanied the demands of
democratization become a global phenomenon, including in Indonesia. The
demands of democratization led to transparency and accountability aspect.
Both aspects are important parts in Governance, especially in the field of

3
financial management of the State or regions. Public accountability means the
obligation of authorities to explain publicly, fully and fairly, before and after
the fact, how they are carrying out responsibilities that affect the public in
important ways (McCandless, 2008). These explanations, whether publicly
and objectively validated for their fairness and completeness, will produce not
only useful information for citizens but also a beneficial self-regulating
influence on the decisions of authorities. The economy observers, political
observers, investors and the community members begin to pay attention to any
policies in financial management.
The execution of Government financing based on the principle of
decentralization is expended to Local Government Revenue and Expenditure
Budgets (APBD). In the framework of Government activities and services to
the community is based on the principles of decentralization, which has
transferred the tax/levy collection and the management of Natural resources to
the local authorities. The source of funds for the region is consisting of the
Original Local Government Revenues, the Balanced Budget (DAU, DBH, and
DAK) and the Local Government Loans. The first three sources of the fund
namely the Original Local Government Revenues (PAD), the Balanced
Budgets and the Local Government Loans are directly managed and set by the
local government in the Local Government Revenues and Expenditures
Budget (APBD), while the others (Grants Funds, Emergency Funds) are
managed by the Central Government through cooperation with local
governments (Halim, 2007:21).
4
When local governments carry out their functions effectively and get
freedom in the public sector expenditure decision-making then their support
should be considered as a source of financial resources coming from the
Original Local Government Revenues (PAD), the Balanced Budgets (DAK,
DAU, DBH), the Local Government Financing, and others legal revenues
(Halim, 2007:22).
Original Local Government Revenues (PAD) are an area of earned
income withheld based on local regulations in accordance with legislation
(Act No. 33 of 2004). Optimization of the acceptance of the Original Local
Government Revenues should be supported by local government efforts to
improve the quality of public services (Mardiasmo, 2002). The Original Local
Government Revenues (PAD) per region are different. For regions, which
have advanced in the field of industry and have natural resources it is likely to
have greater Original Local Government Revenues (PAD) than the other
regions. Because of that an inequality of the Original Local Government
Revenues might occur. On one side, there are very rich regions with a high
PAD and on the other side, there are regions that are lagging behind with a
low PAD.
According to Halim (2009), the problems faced by the regions are seen
in the general deal with digging up the sources of taxes and local retribution. It
is one of the components of the Original Local Government Revenues (PAD),
Taxes and Retribution still do not give a contribution significantly to the
Original Local Government Revenues as a whole. Missing planning
5
capabilities and a weak financial supervision can result in leaks of the budget.
The role of the Original Local Government Revenues in financing Local
Government Expenditures is very small and varies among the regions.
Overall, the regional funding is somewhere between smaller than 10% and up
to 50% depending on the region.
The distribution of taxes between regions is unequal because the tax
bases among regions are different. The role of taxes and retribution in
financing regions is extremely low and this is due to the differences in terms
of population, geographical situation (impact on costs relatively expensive)
and the capability of the communities.
Many previous researchers have analyzed the influence of the General
Allocation Funds (DAU) and the Original Local Government Revenues
(PAD) to the Local Government Expenditures on the Java Island, Bali, even
Sumatra. The result of the analysis on the Sumatra Island about The Original
Local Government Revenues (PAD) showed no significance on the Local
Government Expenditures. A Flypaper Effect occurred. This is in accordance
with the hypotheses, which stated that the influence of General Allocation
Funds (DAU) against Local Government Expenditures is larger than the
influence of the Original Local Government Revenues (PAD) to Local
Government Expenditures. These results are consistent with the findings
before, such as Sukriy & Halim (2004) and Maemunah (2006). Noni Puspita
Sari (2009) examines in Riau results, i.e. DAU gives significant effects against
direct expenditures. While The PAD shows insignificant influence of direct
6
expenditures that PAD individually does not affect direct spending. From the
previous researches results, investigators had depth examination of the
influence of PAD and DAU to allocation of Local Government Expenditures,
particularly in Lampung province.
Indonesia is an archipelago consisting of 32 provinces and 434
districts/cities, each has its own characteristics and cultural customs, so the
effects of income or spending vary in each of the provinces/districts/cities
This research will focus on the different circumstances, which influence the
expenditure predictions of the DAU and the PAD in local governments in
Indonesia.
The Flypaper Effect is a financial condition of local governments,
which have spent more by using funds from the transfer of the Central
Government (DAU) than using own funds (PAD). This effect is the main topic
discussed in this study.
THE INFLUENCE OF THE ORIGINAL LOCAL GOVERNMENT
REVENUES (PAD) AND GENERAL ALLOCATION OF FUNDS (DAU)
TO LOCAL GOVERNMENT EXPENDITURES
(Case study in 10 districts/cities in Lampung province).
B. Problem Formulation
Based on the background described above, the subject is considered to
find answers on the following questions:
7
1. Does the General Allocation Funds (DAU) and Original Local
Government Revenues (PAD) effecting to the local government
expenditures (BD) partially and simultaneously in 10 Districts / cities in
Lampung province?
2. What is happening the Flypaper Effect ON the General Allocation Funds
(DAU) and the Original Local Government Revenues (PAD) against Local
Government Expenditure (BD) in 10 districts/cities in Lampung province?
C. Research Objective
The purposes of this research are:
1. To analyze the influences of Original Local Government Revenues (PAD)
and General Allocation Funds (DAU) partially and simultaneously the to
Local Government Expenditures in 10 Districts/ Cities in Lampung
province.
2. To analyze the Flypaper Effect occurred or not in 10 Districts/ Cities in
Lampung province.
D. Research Benefits
This research is expected to be beneficial for:
1. Local Government
Provide advises to the Central Government and the Regions in terms of
future policy formulation.
2. For Researchers
8
a. Add science and insights from the information gathered, as well as add
to the experience of researchers in the field of research.
b. Increase knowledge and understanding of the influence of the Original
Local Government Revenues (PAD) and General Allocation Funds
(DAU) towards the Local Government Expenditures.
3. For The World of Education.
a. Provide input for academics to develop science in the Government
Accounting field, in particular, on the effect of Original Local
Government Revenues (PAD) and the General Allocation Funds
(DAU) to Local Government Expenditures.
b. Open the research subject to similar studies.
9
CHAPTER II
LITERATURE REVIEW
A. Theory Development
The elements contained in the Local Government Revenue and
Expenditure Budgets (APBD) are the income and the expenditures, where the
income in question is the source of acceptance for the area known by the
Original Local Government Revenues (PAD). While expenditures are equal
to the expenditures incurred by local governments in carrying out the tasks
and functions. In accordance with Act No. 32 of 2004 concerning Local
Governments, local governments have the right to set up and take care of
their own Government Affairs according to the principles of the regional
autonomy of the region, geared to accelerate the achievement of well-being
communities through improving the services, empowerment and participation
of all communities, as well as the increase the competitiveness of the area
having regard to the principles of democracy, equity, justice and the
specificities of an area in a unitary state system of the Republic of Indonesia.
In order to fulfill the rights and obligations, the Government
elaborates a plan to achieve the purpose, which is aspired to. This plan is used
as a guide in each step of the execution of the duties of the State. (Ghozali,
1997:37).
10
1. Local Government Revenue and Expenditure Budgets (APBD)
Halim (2007:19) said APBD (Local Government Revenue and
Expenditure Budgets) is the operational plan of the local government,
which, on the one hand, illustrate the estimated expenditures as high as
possible in order to finance activities and projects of the specific budget
for one year, and on the other hand, described the estimates and the
acceptance of sources in order to cover the expenditures in question.
In the pre-Reformation characteristics of regional financial
budgeting in the pre-vaccine era of reform are as follows: (Henri Edison
2009: 23).
a. Input planning system.
b. Output planning System.
c. Views of the structure, APBD consists of revenue and expenditure,
where expenditure is divided into two, namely routine expenditure
and development expenditures.
d. Process of planning systems uses line-item budget and the
incremental approach, whereas the preparation that is applied is the
input-oriented and fragmental.
e. Preparation of Documents used in DUKDA/DUPDA
f. Loans and the rest of the budget calculations more last year as the
income of the region.
g. Transfer of Funds from the Center consists of donations. subsidies,
and rewards.
11
h. The establishment of a reserve fund is not allowed.
i. Unexpected expenditures consist of miscellaneous expenditures and
are executed by the head of area’s policy.
j. The Local Government Revenue and Expenditure Budgets (APBD)
of Districts/ Cities is ratified by the Governor for the province, while
endorsed by the Ministers in the Country.
k. To change Local Government Revenue and Expenditure Budgets
(APBD), Representative Members get informed.
In the new order, APBD is the financial work plan made for a period
of time when the legislature (DPRD) gives credit to the Executive
Board (region leaders) to finance the household needs in accordance
with the draft, which became the basis of the determination of the
budget and shows all earnings to cover expenses. The definition of
both concluded that the regional budget has elements as follows:
(Halim, 2007:19).
1) An Activity plan is presented along with the supporting details
2) An acceptance minimum target is set, which is to cover the costs
related to such activity, and any costs, which are the maximum
limit of expenditures, which will be implemented.
a) The types of activities and projects implemented are listed
in the form of numbers.
b) The budget is enforced for one fiscal year
12
Budgeting for future areas of reform refers to different
characteristics of financial management areas in pre-reformation that
differences in the characteristics of budgeting in the pre-vaccine era
reform with budgeting in the era of reform are as follows:
1. Understanding of the region's provinces and districts/ cities.
2. The sense of regional government is the head of the region along
with other devices.
3. The calculation of APBD has become one of the responsibilities of
the head of the area and provides direction for APBD general policy
in line with the agreement between the Executive and the legislative.
4. Output system Differences, planning over APBD use a system of
surplus/deficit budget.
5. The structure of the APBD consists of revenues, and expenditures.
6. System planning is a performance budget, standard output
orientation of service-learning outcomes, and integrated.
7. The documentation for the preparation of the budget through RASK
(budget plans a unit of work).
8. Loans and the rest of the more budget calculation (SILPA) is a type
of financing.
9. Transfer of Funds from the Central Government consists of the
Balanced Budget (Tax share (DBH), Income Tax (PPh), Tax on
Acquisition of Land & Buildings (BPHTB), Natural Resources

13
(SDA), General Allocation Funds (DAU), and Special Allocation
Funds (DAK)).
10. Record-keeping and reporting systems using accounting systems
cash base pairing and customizations.
11. From the accountability report end of year budget consists of:
a. Report of the realization budget.
b. Balance sheet
c. Cash flow statement
d. Notes to the financial statements.
12. Come with performance research based on a benchmark strategic
plan areas.
13. The loans APBD are no longer included in the post, but revenues
have been introduced in the post of receipts.
14. The community was involved in the preparation of the APBD in
addition to the Government and Parliament.
15. An indicator of the performance of local governments includes:
a. Comparison of budget and actual
b. A comparison between standard costs with its realization.
c. Physical percentage targets and projects.
d. Accountability the head area at the end of its APBD fiscal year
calculation reports is covered by the Local Home of
Representatives (DPRD) and contains the consequences to the
head region, when legislators rejected twice.
14
In the post-war period of reform, APBD a lot of the changes are
pretty basic. The first form of APBD is based on the decision of the
Minister of Home Affairs Number 29 in 2002 about the management,
accountability and financial control area, as well as the procedures for the
preparation of the calculation of the budget revenues and local
government expenditure. In Act No. 17 of 2003 about the finances of the
State mentioned that:
1. APBD is the financial management, which is determined annually by
the regional regulation.
2. APBD consists of revenues, expenditures, and financing. Regional.
3. Revenue from PAD.
4. Local Government expenditure divided according to the
organization, function and type of expenditure.
According to the regulation of the Minister of Home Affairs No.
13 of 2006 articles 1 paragraph (9) mentioned that the APBD is the
annual budget plan for local government, which is discussed and
approved jointly by local governments and local parliament (DPRD), and
set as local regulations.
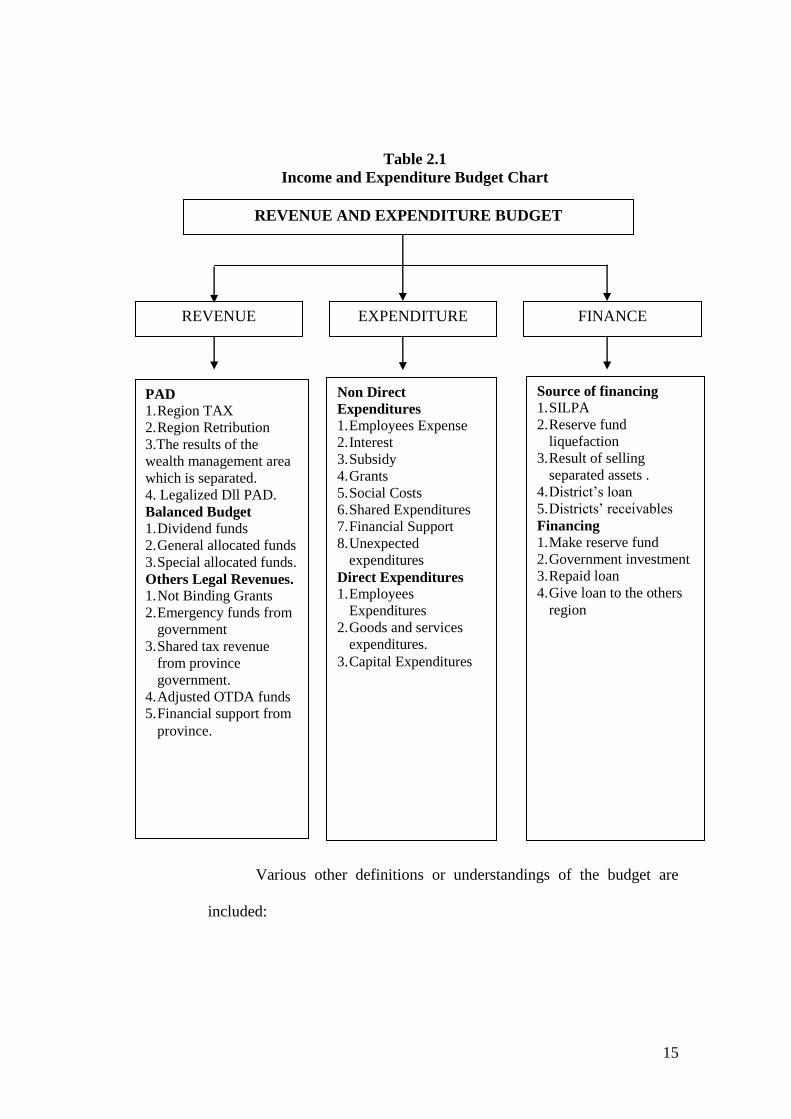
The budget income and expenditures can be presented - according
to the area of Ministry of Home Affairs No. 13 of 2006 in the image
below.
15
Table 2.1
Income and Expenditure Budget Chart
Various other definitions or understandings of the budget are
included:
PAD
1. Region TAX
2. Region Retribution
3.The results of the
wealth management area
which is separated.
4. Legalized Dll PAD.
Balanced Budget
1. Dividend funds
2. General allocated funds
3. Special allocated funds.
Others Legal Revenues.
1. Not Binding Grants
2. Emergency funds from
government
3. Shared tax revenue
from province
government.
4. Adjusted OTDA funds
5. Financial support from
province.
Non Direct
Expenditures
1. Employees Expense
2. Interest
3. Subsidy
4. Grants
5. Social Costs
6. Shared Expenditures
7. Financial Support
8. Unexpected
expenditures
Direct Expenditures
1. Employees
Expenditures
2. Goods and services
expenditures.
3. Capital Expenditures
Source of financing
1. SILPA
2. Reserve fund
liquefaction
3. Result of selling
separated assets .
4. District’s loan
5. Districts’ receivables
Financing
1. Make reserve fund
2. Government investment
3. Repaid loan
4. Give loan to the others
region
REVENUE AND EXPENDITURE BUDGET
REVENUE EXPENDITURE FINANCE

16
1. Budget describes any form of local government in look for sources
of revenue, and then how these funds are used to achieve
government objectives.
2. Budget estimates and expenditure describing areas expected to occur
within the next year based on the realization of the past.
3. Budget is a Government operational work plans to be carried out the
next year in units of numbers of dollars. This budget is a translation
monetarist of the existing regional planning documents and agreed to
be carried out during the year.
Budgeting needs to be a reference (BPKP, 2005 in Warsito, et al
2008) as follows:
1. Transparency and accountability of the budget
In order to achieve good governance, clean and respectable, budget
transparency is important, budget is one means of evaluating the
performance of government that provides information about the
goals, objectives, outcomes and community benefits of an activity or
project.
2. Budget discipline
The budget needs to be clarified clearly drafted to avoid overlap that
can lead to wastage and leakage of funds. Therefore, the budget must
be efficient, effective, timely and accountable.

17
3. Justice budget
Local government financing through taxes and retribution
mechanism imposed upon society. Therefore, they should be
allocated fairly and proportionately in order to be enjoyed by the
whole community.
4. The efficiency and effectiveness of budget
Funds collected and used for the development must be felt by most
people.
5. Compiled with the performance approach
Budgets are prepared with performance approach, which focus on
supporting the achievement of the performance results of the cost
allocation plan or the input set. This work should be equivalent or
greater than the cost or input set. In addition it must be able to foster
the professionalism of the work of any organization-related work.
2. Definition of Local Government Expenditures (BD)
The definition of expenditures by the Law 24 of 2005 is as follows:
“Expenditure is all expenditures from the account of the State / Regional
equity funds reduce smoothly in the corresponding period of the fiscal
year that will not be earned back by the government payment.”
Another definition of expenditure is as described in the
Regulation of the Minister of Home Affairs Decree. 59 of 2007 as
follows:
18
"Expenditures are the obligation of the local government which is
recognized as a deduction from net worth."
Both of these definitions make it clear that the deal will reduce
the equity fund expenditures of local governments. Both the rules, which
arrange the expenditures, classify expenditures by different
classifications. The difference is simply because there is anything else
you want covered by the Regulation of the Minister of Home Affairs
Decree. 59 of 2007. As it is defined by the Minister of Home Affairs
Decree 59 in 2007 as a local financial management guideline, which
includes the planning, budgeting, administration, accounting and
accountability. As the required budgetary instrument the information
control is indicated, which is considered the information associated with
the concept of performance-based budgeting.
Expenditures are measured and compared to the output achieved.
Direct expenditures are expenditures that are directly affected by the
program and planned activities. Government asked to focus more on
increasing expenditure (direct expenditure), either by increasing
consumer purchasing power and infrastructure development. Direct
expenditure is believed to have a more powerful multiplier effect in job
creation than just fiscal incentives enjoyed by some people only (Abdul
Halim, 2002) According to Law no.58 2005 the local government
expenditures are used in order to fund the implementation of government
affairs under the authority of the provinces or districts / cities consisting
19
of obligatory, choice affairs and the treatment affairs in certain sections
or areas that can be carried out jointly between the central government
and the local government or among local governments established by the
prevailing legislation.
Local Government expenditures are all local government
expenditures within a budget period. Revenues and expenditures consist
of three main components, namely the element of revenues, the routine
of expenditures and the expenditures’ development. The third component
is even prepared almost at same time, but the proceeding is within
different institutions. (Halim, 2002).
According to Law no 58 article 26.2005 Expenditure matters
concerning the implementation of priority referred to protect and
improving the quality of life of the community in an effort to meet local
obligations are realized in the form of increased basic services,
education, health, social facilities and public facilities and develop an
appropriate social security system.
The classification of expenditure by business shall include:
education, health, public works, housing, spatial planning, transport,
environment, land, population and civil, women's empowerment, family
planning and family welfare, social, labor, cooperative and small and
medium enterprises, investment, culture, youth and sports, national unity
and domestic politics, public administration, employment, community
development and rural, statistics, records and communications and
20
informatics. The classification of expenditures by business choices
includes: agriculture, forestry, energy and mineral resources, tourism,
marine and fisheries, trade, industry, and transmigration.
Expenditures in handling government affairs in a particular part
or midwife can be implemented jointly by the government and local
governments established by the statutory provisions set out in the form of
programs and activities that classified according to obligatory and
matters of choice.
The local government expenditures are all local government
expenditures in a budget period. (Abdul Halim, 2002). Revenues and
expenditures consist of three main components, namely the elements of
acceptance, routine and development expenditure. The three components
that though composed almost simultaneously, but the drafting process in
different institutions. The budget process as a whole is in the hands of the
Regional Secretaries responsibility for coordinating all activities of
budgeting. While the process of developing routines compiled by the
Government Finance Department, the process of preparing the reception
conducted by the Regional Revenue Service (DISPENDA) and the
preparation of development expenditures compiled by Regional Planning
Agency (Bapeda). (Pratiwi, 2007).
According to research of Pambudi (2007) expenditure can also be
categorized according to their characteristics into two parts, namely: (1)
in addition to Capital Expenditures (expenditures of public
21
administration; Expenditure of operation, maintenance of public
infrastructure; Expenditure transfers; Expenditure unexpected). (2) The
Capital expenditures. In general, expenditures in the budget are grouped
into five groups, namely:
a. General administration expenditure
Government expenditure is all that is not directly related to
the activity or public service. General administration expenditure
group consists of four types, namely:
1) Personnel expenditures are expenditures for the Local
Government/Personnel (salaries, honorarium, and overtime) that
is not directly related to the activities providing services to
citizens.
2) Expenditures for goods are local government expenditures on
goods and services not directly related to public services.
3) Expenditures for travel are expenditures on travel expenses and
council employees who are not directly related to the public
service.
4) Maintenance expenditures are expenditures for the maintenance
of the Local Government of goods that are not directly related to
the public service.

22
b. Operating Expenditures
Maintenance of public infrastructure is an all expenses
associated with the Local Government or public service activities.
Expenditure groups include:
1) Personnel expenditure (Operation and Maintenance Expenditure
Group facilities and public infrastructure) are expenditures for
the Local Government/Personal the effect directly to a specific
activity or in other words, an expenditure that is variable.
2) Goods expenditures (Group Operations and
Maintenance Expenditures infrastructure public) is local
government expenditure for the provision of goods and services
directly related to the public service.
3) Travel expenditures (Group Operations and
Maintenance Expenditures infrastructure public) are local
government expenditures for employee travel expenses directly
related to the public service.
4) Maintenance expenditures (Operation and Maintenance
Expenditure Group facilities and public infrastructure) are
government expenditures for the maintenance of assets from
current areas that have a direct impact on the public service.
23
c. Capital Expenditures
Government Capital Expenditures refer to government
spending on investment goods. This means spending on things that
last for a certain period of time. This may include investment in
hospitals, schools, equipment (furniture, IT-facilities, archive
facilities) and roads. Capital Expenditures are divided into:
1) Public expenditures, these are expenditures those benefits can be
enjoyed directly by the general public.
2) Apparatus expenditures, namely expenditures directly benefit
not enjoyed by the public, but it is felt directly by the apparatus.
d. Transfer expenditures
Transfer Expenditures are the expenditures for the transfer of
money from the government to third parties without expecting
reward or gain refunds of the money transferred. The group consists
of expenditures for:
1) Installment of loans.
2) Grants.
3) Reserve funds.
e. Unexpected Expenditures
Unexpected expenditures are the expenses incurred by local
governments to finance the activities of unexpected and
extraordinary events. According to Nurlan (2008) states that
unexpected expenditures are expenditures for activities are unusual
24
or not expected to recur like natural disasters and social disasters
unforeseen, including the refunds of excess revenues from previous
years that have been closed.
Classification of expenditures by function for alignment and
integration of financial management consists of:
1) Public Service;
2) Order and Peace;
3) The Economy;
4) The Environment;
5) Housing and Public facilities;
6) Health;
7) Tourism and culture;
8) Education, and
9) Social protects.
3. Original Local Government Revenues (PAD)
One of the main objectives of fiscal decentralization is creating
local independence. In this perspective, the governments (local
governments) are expected to be able to explore the local financial
resources, particularly through revenues (Sidik, 2002). Dependence on
transfers from central government from year to year should be more
limited. (Oates, 1999) provide a fairly rational reason why the
government should reduce this dependency:
25
a. Central government transfers are usually accompanied by certain
conditions, so it is a compromise relative autonomy, especially if the
funds transfer is the dominant source of local revenues.
b. Rely on the central government transfer actually reduces the local
creativity to take a policy associated with an efficient local revenue
collection.
Original Local Government Revenues (PAD) ideally should be
the main source of local revenue. Another source of income is relatively
volatile and tend to out of control (authority) local government (Sidik,
2002; Bappenas 2003). The data indicate that the contribution of PAD
increased from 6.59% in 2001 to 7.33% in 2002 (Central Bureau of
Statistics, 2004), the main source of revenue from local taxes and
retribution. However, the contribution of PAD is still very small while
compared to the transfer from central government (DAU and DAK),
which reached 79.14%.
The Original Local Government Revenues are accumulated from
the Tax Revenues containing Local Tax and Local Retribution, Non Tax
Revenues, which contain the profit of Regional Owned Enterprise
(BUMD), Postal Receipts Investment and Management of Natural
Resources. (Bastian, 2002).
The Regional Original Revenues (PAD) are all local revenues
derived from the original local economy. The identification of revenue
source is : investigate, determine and establish where the real source of
26
revenues by way of researching and seeking and managing revenue
sources properly so as to provide maximum results. (Elita in Pratiwi,
2007).
In the Law, no.13 from 2006 the Ministry of Home Affairs
explains the revenues will be divided according to the type of income:
a. Local Taxes
According to Law no.28 2009, the local taxes are a
mandatory contribution to the region charged to individuals or
entities, which is not getting benefits directly. The purpose of the
local taxes is seen in a better citizen’s prosperity.
Mardiasmo et al, (2002) revealed that in order to reduce the
dependence on finance from the central government, local
governments should be given autonomy and flexibility in this area.
An important step that must be done to increase local tax revenues is
to calculate the potential tax revenues that the real area owned by the
area, so they can know region’s capacities (tax capacities). The
improvement of tax capacities is essential in order to optimize the
local revenue sources.
Law No. 34 of 2000 on the amendment of Law no. 18 Year
1997 on local Taxes broken down into:
1) Province taxes consist of: Motor vehicle tax and water vehicle,
transfer tax motor vehicles (BBNKB) and vehicles on the water,
27
motor vehicle fuels Tax, and Tax collection and utilization of
underground water and surface water.
2) Type of district / city tax consists of: Hotel Taxes, Restaurant
Tax, Entertainment Tax, Advertisement Tax, Tax of street
lighting, exploitation Minerals Group C Tax, Parking Tax.
b. Local Retribution
Collection of retribution paid directly by those who enjoy the
service, and are usually intended to cover all the costs or the
ministry. Retribution according to Law no. 28 of 2009 is taxation as
a payment for certain services or special permits provided and / or
administered by the local government for Personal or Entities. The
amount of retribution should be (more or less) equal to the value of
the services provided. In the new budget structure with performance
approach, the kind of income that comes from local tax and
retribution areas under Law 34 of 2000 on the Amendment Of Law
no. 18 Year 1997, Retribution broken down into:
Retribution is broken down into:
1) General Retribution
That is, a levy on services provided or provided by local
governments for general interest and can be enjoyed by private
persons or entities.
28
2) Business Retribution
i.e.: fees for services provided by the government to adhere to
commercial principles because basically provided by the private
sector.
c. Income of Local Government Corporate Management of
Regional Government Separated Wealth
As per Law no. 34 of 2004, the kind of results that separated
the area of wealth management can be broken down by revenue
object that covers the return on capital investment in locally-owned
companies / enterprises. Part return on capital investment in state-
owned enterprises / state and the return on equity investment in
privately-owned company or a group of business people.
1) Regional Company
In an effort to explore the sources of revenue can be done in
various ways, as long as not contrary to the Laws and
regulations. One source of revenue is very important and needs
special attention is the company area.
2) The company is a unit of production area that is:
(a) Providing services
(b) Conducting general use
(c) Cultivate revenue
3) The regional company's goal to participate in implementing
regional development, in particular, and the development needs
29
of the people with industrialization and peace and tranquility of
working towards a just and prosperous society.
4) Regional company engaged in the field according to household
affairs under the Laws governing local government subjects.
5) Branches of production which are important for the region and
to lord lives of many people in the area, the capital is entirely
separated regional assets.
d. Other Legal Revenues
Other types of PAD (Revenue) are constituted under Act No.
33 of 2004. Other legal revenues are revenues gained from outside
taxes, retribution, and income, which have been described above.
Other legal revenues include:
1) The sale of regional assets that are not separated by cash or
installment / mortgage, current account.
2) Interest income.
3) Receipt of compensation claims area.
4) Receipt of commissions.
5) Discounts or other forms achieved as a result of sales or
procurement of goods and services by a region.
6) Revenue gains from the differences in the exchange rate against
foreign currencies.
30
4. General Allocation Funds (DAU)
According to the Law No.33 2004, the General Allocation Funds
are sourced from the State Revenues and Expenditure Budget (APBN) to
be allocated for local government in balancing the financial capacities
among regions and to fulfill local government needs in terms of
decentralization.
The source of regional revenues in the context of autonomy and
decentralization are dominated by aid and transfer from the central
government in form of the General Allocation Funds (DAU), Special
Allocation Funds (DAK), and Tax shares (DBH), whereas the amount of
PAD is still relatively small (Mardiasmo, 2002).
Referring to Law 104, 2000 that the prime DAU objective is
horizontal equity and sufficiency. The objective of horizontal equity is in
the central government’s interest in order to distribute the income in a
fair and equitable way to avoid wide disparities among regions.
Meanwhile, the regional interest adequacy (sufficiency) is to close the
fiscal gap. The sufficiency is influenced by several factors, namely
Authority, Capacity, and Minimum Service Standards (MSS)
(Mardiasmo, 2002).
According to Halim (2009), economic disparities among the
provinces cannot be avoided by fiscal decentralization due to the lack of
tax sources and fewer natural resources, which can be explored by the
Regional Government. In order to tackle inequality, the Central
31
Government provides subsidies in the form of DAU to the local
government. For local government with a low level of Original Local
Government Revenues (PAD), the DAU is larger than for those with
sufficient income from local sources. In addition to reduce the disparities
in financial capacity among regions, the General Allocation Funds of
26% taken the national revenue. General Allocation Funds will provide
certainty for regions in obtaining financial means to cover the
expenditures.
General Allocation Funds (DAU) are funds coming from the state
budget (APBN) allocated to equal financial capacities among regions to
finance the Local Government Expenditures. The DAU provisions are as
follows (Halim, 2007):
a. General Allocation Funds (DAU) cover 26% at a minimum level of
the domestic revenues in the state budget.
b. General Allocation Funds (DAU) are set as 10% for the provinces
and 90% for districts / cities of the General Allocation funds as
defined above.
c. General Allocation Funds (DAU) for specific districts / cities are
determined by multiplying the number of general allocation funds
for districts / cities set by the state budget with a portion of
concerned districts / cities.
In Act, No.32/2004 mentions that for the implementation of the
local government authority, the central government will transfer the
32
Balanced Budget consisting of the General Allocation Funds (DAU),
Special Allocation Funds (DAK), and Tax Share (DBH) consisting of
taxes and income from natural resources. Besides the Balanced Budget
(DAU, DAK.etc), Local Governments have their own sources of funding
in the form of Original Local Government Revenues (PAD) and Local
Government Financing.
According to the Law No.33, 2004 about Central Balanced
Budget and local government stated that DAU in a Region (Provincial,
District and City) is determined by using a fiscal gap approach, which is
indicated by local needs and the potential of a region (Natural and
Human Resources). The General Allocation Funds (DAU) are used to
cover the fiscal gap. Fiscal gap happened when the Local Government
Expenditures exceed the Original Local Government Revenues (PAD).
B. Previous Research
Researchers had previously analyzed the effects of PAD, DAU and
local government expenditures in Java, Bali and Sumatra. The analysis of the
Sumatra case study shows that the PAD did not significantly affect the
local government expenditures. That means Flypaper Effect occurred. This
along with the hypothesis demonstrates that the influence of DAU on local
government expenditures is greater than the influence of PAD on
local government expenditures is accepted.

33
Previous researchers such as Abdullah & Halim (2004) stated DAU
and PAD had a significant effect on local government expenditure budget.
Maemunah (2006) analyzed the effect of General Allocation Funds (DAU)
and Original Local Government Revenues (PAD) on local government
expenditures on Sumatra with the objective to show:
1. The influence of General Allocation Funds (DAU) and regional original
revenues (PAD) to government expenditures districts / cities in Sumatra.
2. The possible Flypaper Effect on districts / cities expenditures on the
island of Sumatra.
3. The tendency of Flypaper Effect which led to an increasing number of
local government expenditures.
Another study conducted by Nur Indah Rahmawati (2010) who
investigated the districts / cities in Central Java province and concluded that
the PAD positively affects the allocation of expenditure budget. Local
Governments with high revenues show higher local government expenditure
allocations. If the General Allocation Fund (DAU) is higher, automatically
Local Government Expenditure (BD) higher too . It cannot be concluded
whether Flypaper Effect has occurred or not.
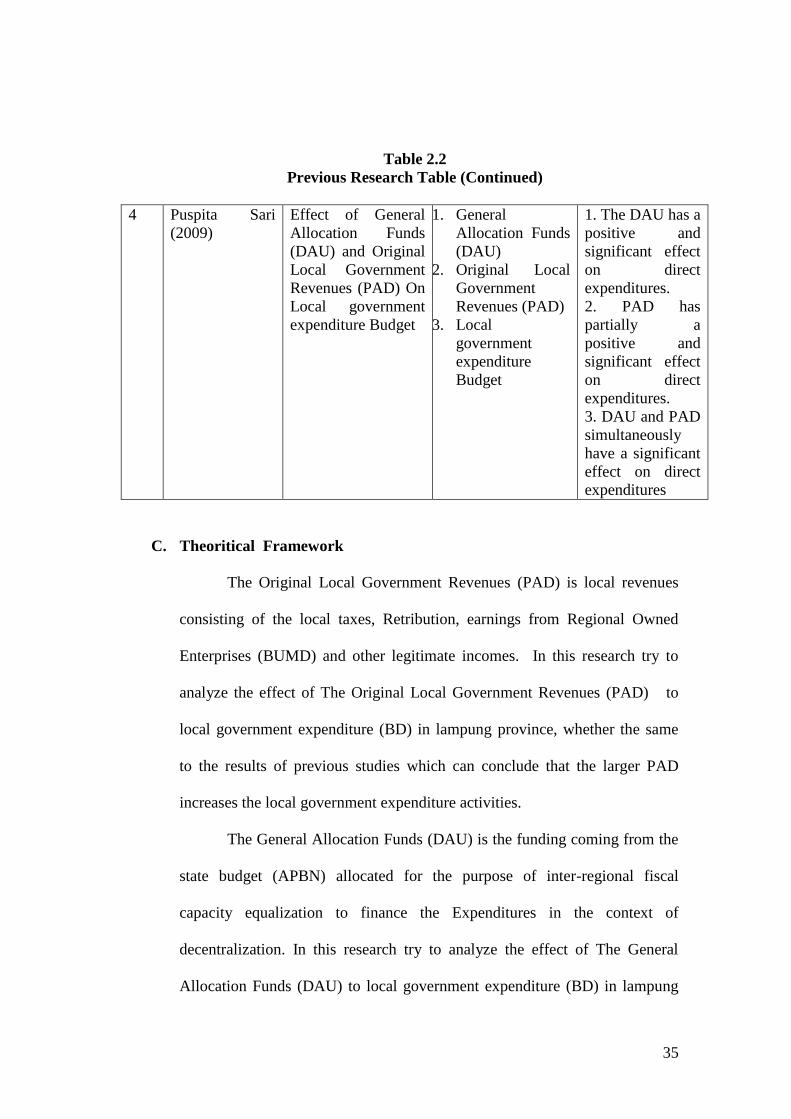
The research conducted by Puspita Sari (2009) tested the effect of the
DAU and PAD against direct expenditures in districts / cities in the Riau
Province. There are three conclusions:
34
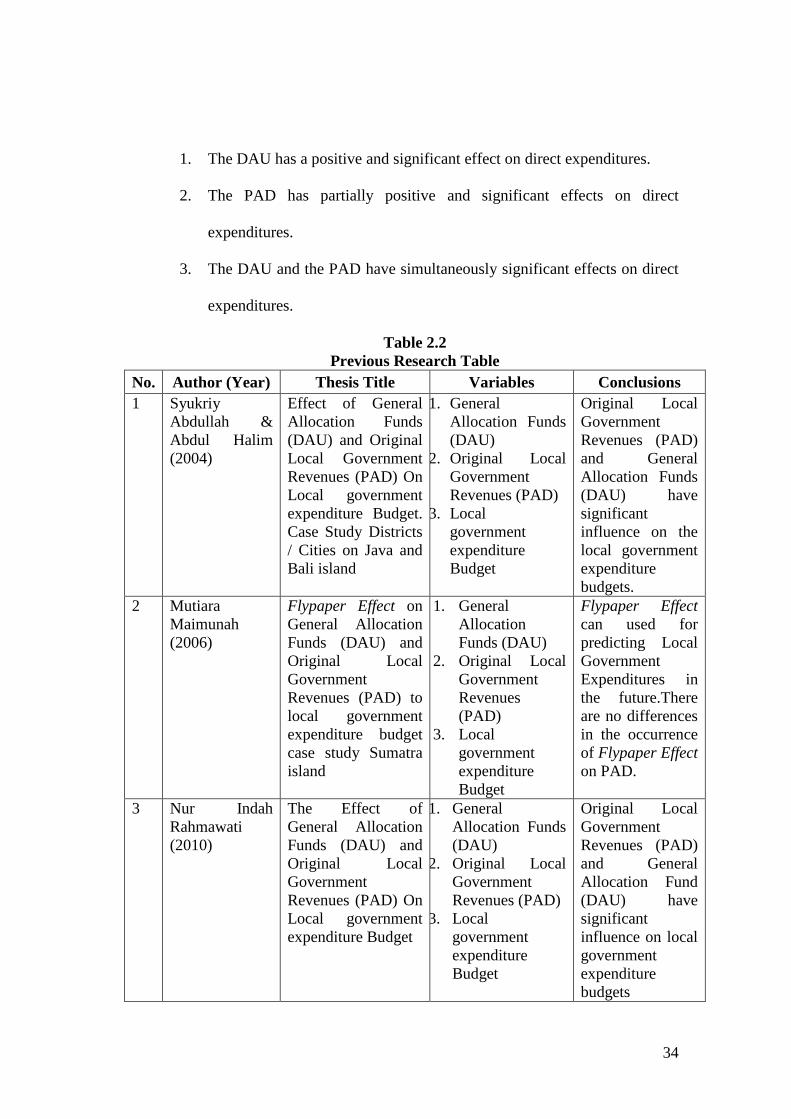
1. The DAU has a positive and significant effect on direct expenditures.
2. The PAD has partially positive and significant effects on direct
expenditures.
3. The DAU and the PAD have simultaneously significant effects on direct
expenditures.
Table 2.2
Previous Research Table
No. Author (Year) Thesis Title Variables Conclusions
1 Syukriy
Abdullah &
Abdul Halim
(2004)
Effect of General
Allocation Funds
(DAU) and Original
Local Government
Revenues (PAD) On
Local government
expenditure Budget.
Case Study Districts
/ Cities on Java and
Bali island
1. General
Allocation Funds
(DAU)
2. Original Local
Government
Revenues (PAD)
3. Local
government
expenditure
Budget
Original Local
Government
Revenues (PAD)
and General
Allocation Funds
(DAU) have
significant
influence on the
local government
expenditure
budgets.
2 Mutiara
Maimunah
(2006)
Flypaper Effect on
General Allocation
Funds (DAU) and
Original Local
Government
Revenues (PAD) to
local government
expenditure budget
case study Sumatra
island
1. General
Allocation
Funds (DAU)
2. Original Local
Government
Revenues
(PAD)
3. Local
government
expenditure
Budget
Flypaper Effect
can used for
predicting Local
Government
Expenditures in
the future.There
are no differences
in the occurrence
of Flypaper Effect
on PAD.
3 Nur Indah
Rahmawati
(2010)
The Effect of
General Allocation
Funds (DAU) and
Original Local
Government
Revenues (PAD) On
Local government
expenditure Budget
1. General
Allocation Funds
(DAU)
2. Original Local
Government
Revenues (PAD)
3. Local
government
expenditure
Budget
Original Local
Government
Revenues (PAD)
and General
Allocation Fund
(DAU) have
significant
influence on local
government
expenditure
budgets
35
Table 2.2
Previous Research Table (Continued)
4 Puspita Sari
(2009)
Effect of General
Allocation Funds
(DAU) and Original
Local Government
Revenues (PAD) On
Local government
expenditure Budget
1. General
Allocation Funds
(DAU)
2. Original Local
Government
Revenues (PAD)
3. Local
government
expenditure
Budget
1. The DAU has a
positive and
significant effect
on direct
expenditures.
2. PAD has
partially a
positive and
significant effect
on direct
expenditures.
3. DAU and PAD
simultaneously
have a significant
effect on direct
expenditures
C. Theoritical Framework
The Original Local Government Revenues (PAD) is local revenues
consisting of the local taxes, Retribution, earnings from Regional Owned
Enterprises (BUMD) and other legitimate incomes. In this research try to
analyze the effect of The Original Local Government Revenues (PAD) to
local government expenditure (BD) in lampung province, whether the same
to the results of previous studies which can conclude that the larger PAD
increases the local government expenditure activities.
The General Allocation Funds (DAU) is the funding coming from the
state budget (APBN) allocated for the purpose of inter-regional fiscal
capacity equalization to finance the Expenditures in the context of
decentralization. In this research try to analyze the effect of The General
Allocation Funds (DAU) to local government expenditure (BD) in lampung
36
province whether the same to previous research which stated that DAU
implicates the magnitude of local government expenditures.
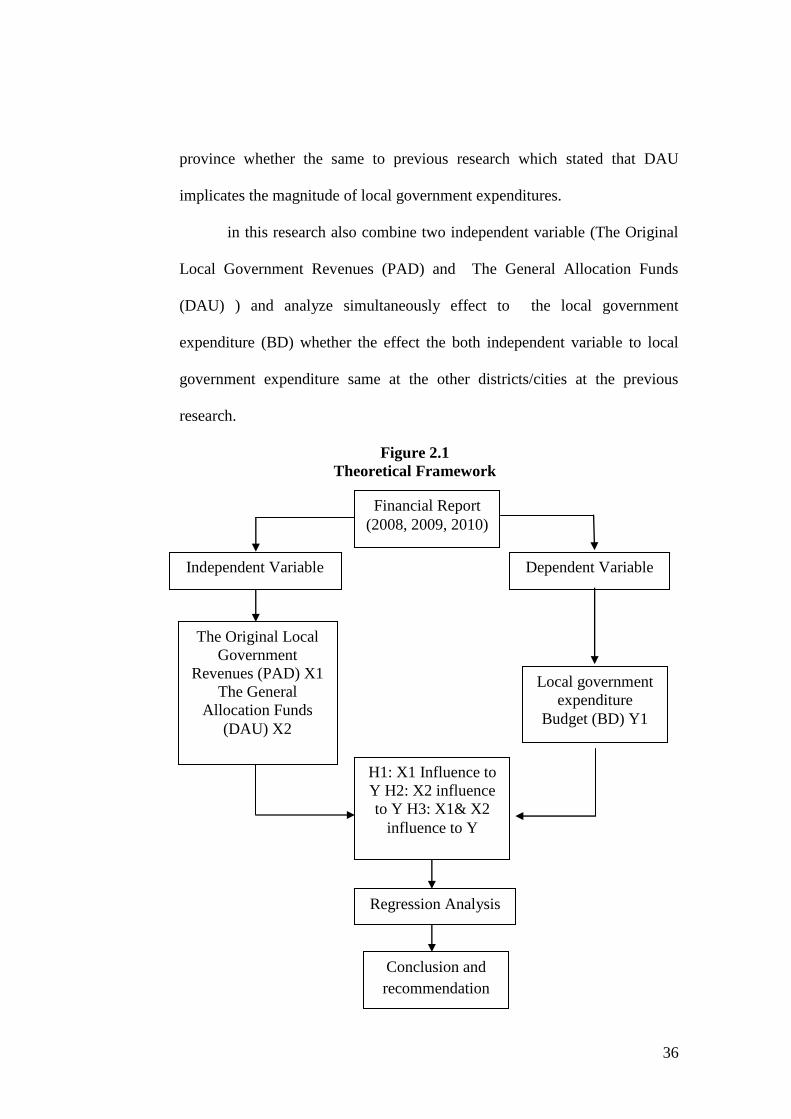
in this research also combine two independent variable (The Original
Local Government Revenues (PAD) and The General Allocation Funds
(DAU) ) and analyze simultaneously effect to the local government
expenditure (BD) whether the effect the both independent variable to local
government expenditure same at the other districts/cities at the previous
research.
Figure 2.1
Theoretical Framework
Financial Report
(2008, 2009, 2010)
The Original Local
Government
Revenues (PAD) X1
The General
Allocation Funds
(DAU) X2
Local government
expenditure
Budget (BD) Y1
Dependent Variable
H1: X1 Influence to
Y H2: X2 influence
to Y H3: X1& X2
influence to Y
Regression Analysis
Conclusion and
recommendation
Independent Variable
37
D. Research Hypothesis
Based on the theoretical framework above, can be formulated these
alternative hypotheses.
Ha1 : Original Local Government Revenues (PAD) no significantly
effecting Local Government Expenditures.
Ha2 : General Allocation Funds (DAU) significantly effecting Local
Government Expenditures
Ha3 : Original Local Government Revenues (PAD), the General
Allocation Funds (DAU), and simultaneously implies significant
impact on Local Government Expenditures.

38
CHAPTER III
RESEARCH METHODOLOGY
A. Scope of Research
Type of this research is association causality aimed to analyze the
relationship between variables to another variable (Sekaran, 2003: 30). In this
research, there are independent variables / variables that influence and
dependent variable / variable influenced. This research is conducted to
determine and prove the influence Original Local Government Revenue
(PAD), and the General Allocation Fund (DAU) as independent variables to
Local Government Expenditure (BD) as the dependent variable.
B. Sampling Method
The population is a collection of all possible people, objects, or the
size of the interest of the case to the attention (Sekaran, 2003: 31). The
population used in this research is the government of districts / cities in the
province of Lampung, amounting to 10 districts / cities in the year 2008 to
2010 for reasons of data availability.
The sample is a portion or part of a particular population of concern
(Mason and Douglas, 1996). This research is using purposive sampling
method, that is aimed by the researcher are likely to obtain information from
specific target groups, the sampling here is confined to specific types of
people/sample which can provide the desired information, either because they
39
are the only ones which have it, or conform to some criteria set by the
researcher.
Among the number of districts / cities submitting the realization,
APBD Report between 2008 and 2010 to the mentioned site are as many as
10 districts / cities in the Lampung Province. The 30 research data amounts
to, which is derived by the formula:
N= amount of districts / cities X research period
N= 10 X 3 years
N= 30
C. Data Collection Method
The secondary data collection method refers to the data collection
through recording and iterating data relating to the research objective. This
study uses the purposive sampling method by taking the sample of as many as
10 districts / cities in the Lampung Province from 2008 to 2010.
D. Data Analyze Method
The dependent variable in this study refers to the Local Government
Expenditures, while the independent variables refer to the DAU and the PAD.
The analytical tools used are the simple regression (simple regression) in
order to see the effect on each variable, on the separate expenditures and the
multiple regression (multiple regression) in order to see the effect on all these

40
variables simultaneously. Tests carried out by using the computer application
program SPSS 20.0 for Windows.
1. Classical Assumptions
a. Normality Test
Normality test is intended to determine whether the used data
is normally distributed or not. Normality test needs to be done to
determine the statistical tools, so that the conclusions drawn can be
accounted for. There are two ways to detect whether the residuals are
normally distributed or not, namely:
1) Graph Analysis
One of the easiest ways to see the normality of the
residuals is to see a histogram graph comparing the
observational data with the distribution which closes to normal
distribution. More reliable method is by looking the normal
probability plots comparing to the cumulative distribution of a
normal distribution. Normal distribution will form a straight
diagonal line and plot the data will be compared with the
residual diagonal lines. If the residual data distribution is
normal, then the line that describes the real data would follow
the diagonal line.
2) Statistical Analysis
Simple statistical test can be done by looking at the value
of the kurtosis and Z-values of skewness. Another statistical test
41
that can be used to test the normality of residuals is non-
parametric statistical test of Kolmogorov-Smirnov (KS), if the
significance level> 0.05, then the data is normally distributed
and can be performed multiple regression models. Guidelines
for decision-making about the data close to or a normal
distribution by Kolmogorov Smirnov can be seen from:
a) Sig. or significantly or probability <0.05, then the data
distribution is not normal.
b) Sig. Or significantly or probability> 0.05, then the data
distribution is normal.
b. Multicollinearity Test
Multicollinearity test means between the independent
variables included in the regression model has a linear relationship is
perfect or near-perfect (or even a high correlation coefficient of 1).
The Regression model should appear as neither perfect nor near-
perfect correlation between the independent variables. The
consequence is the correlation coefficient multicollinearity particular
variable, and the error becomes very large or infinite.
Multicollinearity can also be seen from (1) the value of
tolerance and the opponent (2) variation inflation factor (VIF). Cut-
off value commonly used to indicate the presence of
multicollinearity is tolerance value <0.10 or equal to the value of
VIF> 10
42
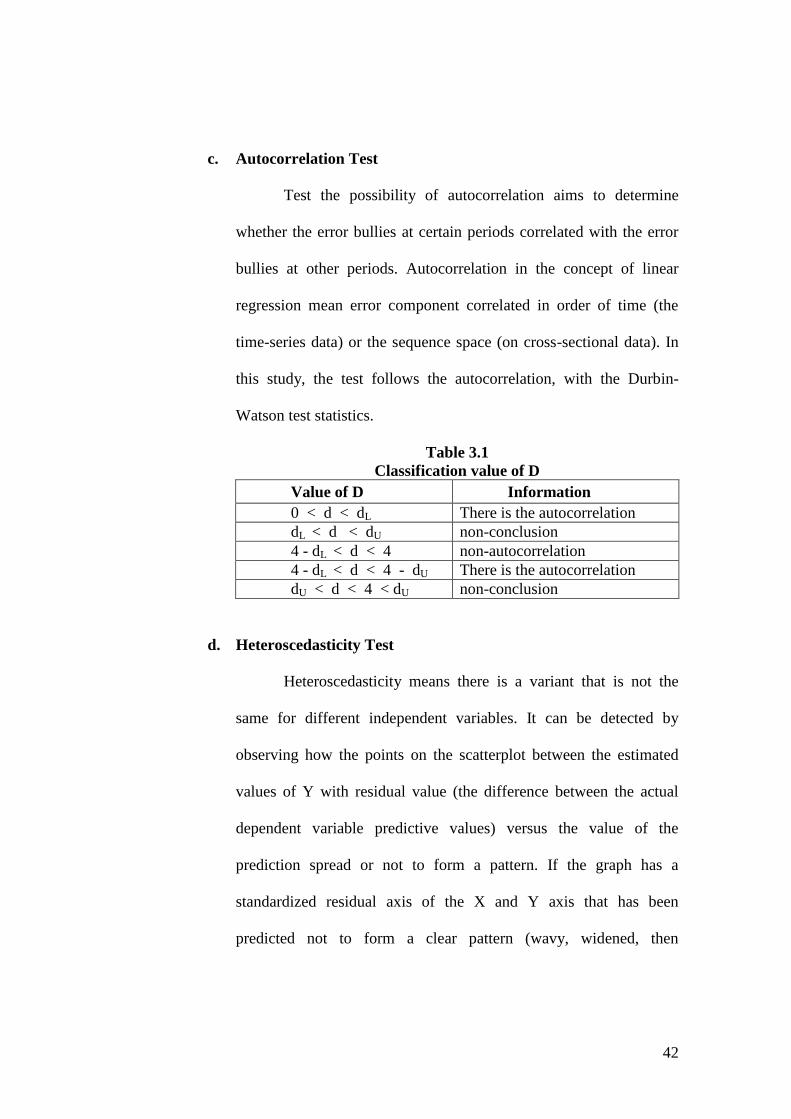
c. Autocorrelation Test
Test the possibility of autocorrelation aims to determine
whether the error bullies at certain periods correlated with the error
bullies at other periods. Autocorrelation in the concept of linear
regression mean error component correlated in order of time (the
time-series data) or the sequence space (on cross-sectional data). In
this study, the test follows the autocorrelation, with the Durbin-
Watson test statistics.
Table 3.1
Classification value of D
Value of D Information
0 < d < dL There is the autocorrelation
dL < d < dU non-conclusion
4 - dL < d < 4 non-autocorrelation
4 - dL < d < 4 - dU There is the autocorrelation
dU < d < 4 < dU non-conclusion
d. Heteroscedasticity Test
Heteroscedasticity means there is a variant that is not the
same for different independent variables. It can be detected by
observing how the points on the scatterplot between the estimated
values of Y with residual value (the difference between the actual
dependent variable predictive values) versus the value of the
prediction spread or not to form a pattern. If the graph has a
standardized residual axis of the X and Y axis that has been
predicted not to form a clear pattern (wavy, widened, then
43
narrowed), as well as scattered both above and below the 0 on the Y
axis Heteroscedasticity it did not happen.
Some ways to detect the presence or absence of
heteroscedasticity:
1) If there is a specific pattern, such that there are points that form
a regular pattern (wavy, widened and then narrowed), it has
been indicated heteroscedasticity.
2) If there is no clear pattern, and the points spread above and
below the 0 on the Y axis, then it does not happen
heteroscedasticity.
2. Hypothesis Testing
The analysis tools are the simple and the multiple regression.
Both are used in order to see the effects of income on government
expenditures. Simple regression is used to see the influence of each
variable to the prediction of expenditures separately, whereas multiple
regression is used to see the influence of all these variables
simultaneously.
a. Multiple Regression
To test the hypothesis (Ha), the method of analysis used is
multiple regression, because it involves three independent variables
and one dependent variable. Regression equation model to test the
hypothesis with the following formulation:
Yi = α + b1 DAU1i + b2 PAD2i + e
44
b. Test Coefficient of Determination ( R2)
According to Wihandaru S. P., coefficient of determination
(R2) test is used to measure proportion of dependent variable
variance which is explained by independent variable. Steel, R. G. D.
and Torrie, J. H, 1960, had opinion regarding coefficient of
determination (R2). Coefficient of determination R2, according to
them, is used in the context of statistical models whose main purpose
is the prediction of future outcomes on the basis of other related
information. R2 is most often seen as a number between 0 and 1.0,
used to describe how well a regression line fits a set of data.
An R2 near 1.0 indicates that a regression line fits the data well,
while an R2
closer to 0 indicates a regression line does not fit the data
very well. It is the proportion of variability in a data set that is
accounted for by the statistical model.
c. Simultaneous Significance Testing ( F- Test)
Essentially, F- test has purpose to know whether among
independent variables simultaneously have significant influence
toward dependent variable. Independent variables in this research are
Original Local Government Revenue (PAD) and General Allocation
Fund (DAU) whereas dependent variable is Local Government
Expenditure (BD). So, F- test has a function to know the influence
Original Local Government Revenue (PAD) and General Allocation
Fund (DAU) whereas dependent variable is Local Government
45
Expenditure (BD).. α used for this research is 0.05 ( 5%) with
assumption:
1.) Ftest < Ftable, independent variables simultaneously not influence
towards dependent variable or hypothesis is rejected.
2.) Ftest > Ftable, independent variables simultaneously influence
significantly towards dependent variables or hypothesis is
accepted.
d. Partial Significance Test ( t- Test)
Partial Significance Test or t- test basically has purpose to
know how far and how much the influence independent variables
toward dependent variables partially. In this research, t- test is done
to know the influence of Original Local Government Revenue (PAD)
and General Allocation Fund (DAU) as independent variables
towards Local Government Expenditure (BD) as dependent variable.
Assumption used for this test are if the significance value of t
more than α (significance value > α), then hypothesis is rejected but
if on contrary the significance value of t less than α (significance
value < α), so hypothesis is accepted. Level of significance (α) use in
this research is 0.05 (5%).
46
E. Operational Variable
1. Original Local Government Revenues (Variable X1)
According to Bastian (2002) Original Local Government Revenue
(PAD) are revenues consisting of regional tax results, local levies,
revenues from the regional corporate income and other legal incomes.
PAD in this study can be ascertained from Local Government
Expenditures in the realization of the consolidated government budget of
10 districts / cities in Lampung from 2008 to 2010.
The formula for calculating the PAD, is the following:
PAD = Local Tax + Local Retribution + The results of management local
separated wealth + other Legal Revenues.
2. General Allocation Funds (Variable X2)
General Allocation Funds (DAU) is a general transfer from
central government to local governments to address horizontal inequality
with the primary purpose is financial equalization capability between
regions (Halim, 2009). DAU is obtained by looking at the General
Allocation Funds (DAU) account in the realized budget reports of the 10
districts / cities in the Lampung province.
3. Local Government Expenditures (Variable Y)
Local Government Expenditures are government expenditures
within a certain budget period (one year). In order to facilitate the
assessment of the reasonability of the costs of programs or activities,
expenditures are summarized into expenditure groups, which consist of
47
indirect expenditures and direct spending (Halim, 2009). Expenditures in
this study can be ascertained from Local Government Expenditures in the
consolidated budget realization of district / city governments in Lampung
province from 2008 to 2010.
The allocation of expenditures consists of indirect expenditures
and direct expenditures. Indirect expenditures are expenditures that do
not have a direct effect to the implementation of government programs
and activities and are composed of personnel expenditures, interest
expenditures, subsidies, and grants, expenditures for social assistance,
financial assistance expenditures and unexpected expenditures. The
formula for calculating the allocation of indirect expenditures (ABTL) is
the following:
ABTL = office expenditures + interest expenditures + subsidy
expenditures + grant expenditures + social assistance + financial
assistance expenditures + unexpected expenditures
Direct expenditures are expenditures that have a direct effect to
programs and activities that include government expenditures,
expenditures on goods and services and capital expenditures (Puspita
sari, 2009). The formula for calculating the allocation of direct
expenditures (ABL) is the following:
ABL = office expenditures + goods and services expenditures + capital
expenditures.

48
CHAPTER IV
ANALYSIS AND DISCUSSION
A. General Description
This, chapter will discuss the results of the analysis in detail along
with the steps of the data analysis. This study aimed to determine the effect of
the General Allocation Funds (DAU) and the Original Local Government
Revenues (PAD) for Local Government Expenditures (BD). The research
objects are 10 districts / cities in Lampung Province, for the period of 2008-
2010. The data, which is processed in this study is the realization report of
Local Government Revenue and Expenditure Budget (APBD).
The Local Governments which are the object in this research is 10
districts / cities in Lampung Province, as follows:
1. Lampung Barat district.
2. Tanggamus district.
3. Lampung Selatan district
4. Lampung Timut district
5. Lampung Tengah district
6. Lampung Utara district
7. Way Kanan district
8. Tulang Bawang district
9. Bandar Lampung city
10. Metro city
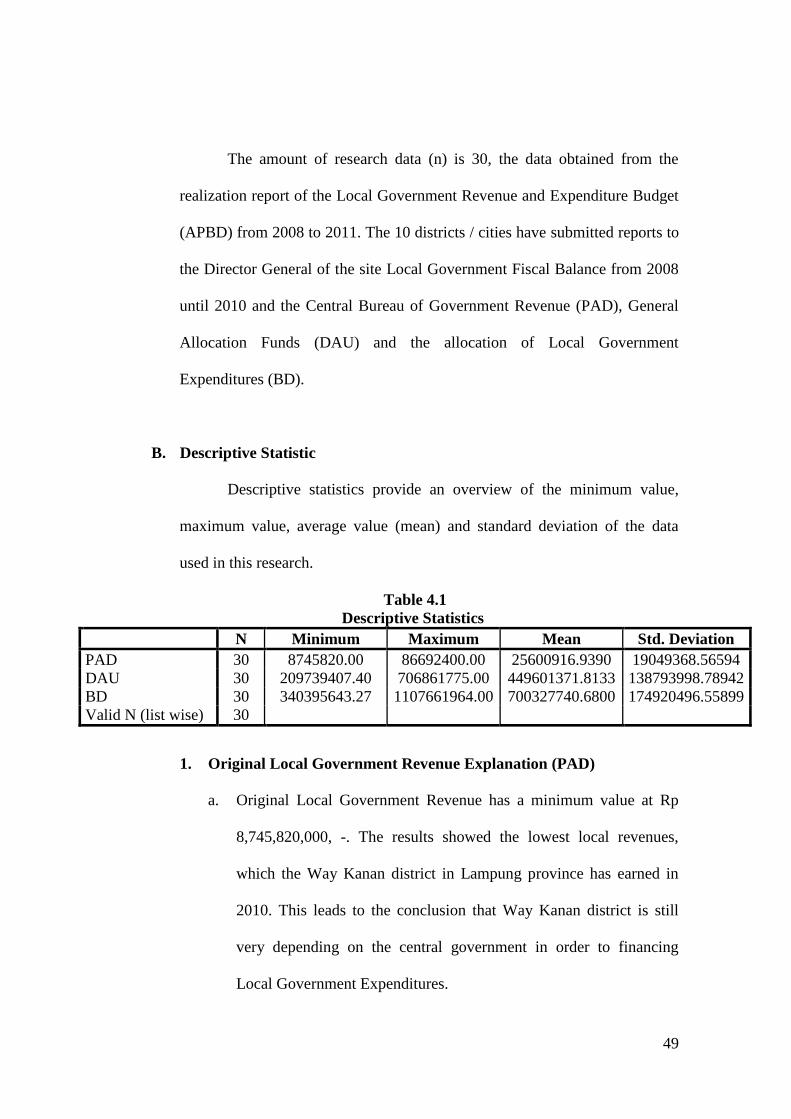
49
The amount of research data (n) is 30, the data obtained from the
realization report of the Local Government Revenue and Expenditure Budget
(APBD) from 2008 to 2011. The 10 districts / cities have submitted reports to
the Director General of the site Local Government Fiscal Balance from 2008
until 2010 and the Central Bureau of Government Revenue (PAD), General
Allocation Funds (DAU) and the allocation of Local Government
Expenditures (BD).
B. Descriptive Statistic
Descriptive statistics provide an overview of the minimum value,
maximum value, average value (mean) and standard deviation of the data
used in this research.
Table 4.1
Descriptive Statistics
N Minimum Maximum Mean Std. Deviation
PAD 30 8745820.00 86692400.00 25600916.9390 19049368.56594
DAU 30 209739407.40 706861775.00 449601371.8133 138793998.78942
BD 30 340395643.27 1107661964.00 700327740.6800 174920496.55899
Valid N (list wise) 30
1. Original Local Government Revenue Explanation (PAD)
a. Original Local Government Revenue has a minimum value at Rp
8,745,820,000, -. The results showed the lowest local revenues,
which the Way Kanan district in Lampung province has earned in
2010. This leads to the conclusion that Way Kanan district is still
very depending on the central government in order to financing
Local Government Expenditures.
50
b. Original Local Government Revenues (PAD) have a maximum value
of Rp.86.692.400.000, The results show the highest revenues in
Lampung Province, which obtained from Bandar Lampung city in
2010. Although with highest revenues in Lampung province, Bandar
Lampung city still dependent on the funds from the central
government in financing it Local Government Expenditures.
c. Original Local Government Revenues (PAD) have an average value
(mean) for three years amounting to Rp 25.600.916.939.0
d. Original Local Government Revenues (PAD) have a standard
deviation value of Rp. 19,049,368,565.94 smaller than the mean
value of Original local government revenues Rp 25,600,916,939. It's
show the data normally distributed.
2. Explanation of General Allocation Funds (DAU)
a. General Allocation Funds have a minimum value of
Rp209.739.407.400. The results show the lowest General Allocation
Funds in Lampung Province, which obtained from Metro City in
2008. This result proves even Metro City area as not broad as
Bandar Lampung but Metro city able to be independent in financing
the implementation of regional autonomy.
b. General Allocation Funds have a maximum value of Rp. 706 861
775 000. The results showed the highest General Allocation Funds in
Lampung Province obtained by Lampung Tengah district in 2010.
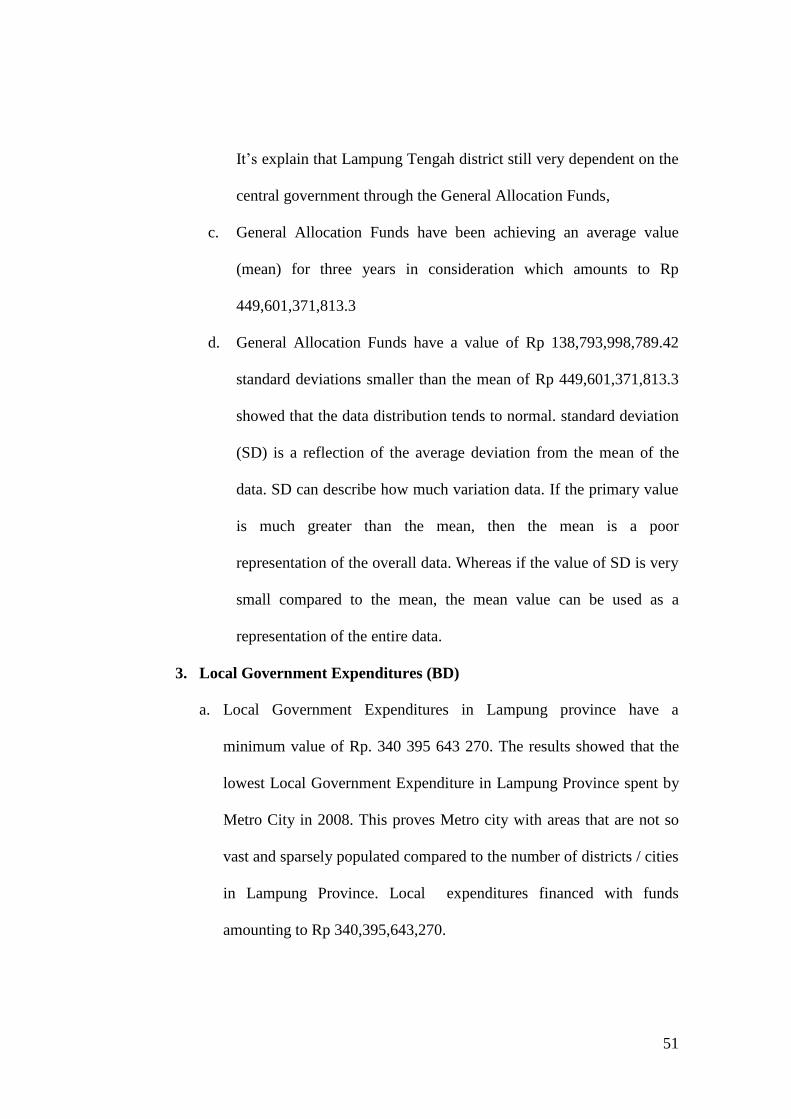
51
It’s explain that Lampung Tengah district still very dependent on the
central government through the General Allocation Funds,
c. General Allocation Funds have been achieving an average value
(mean) for three years in consideration which amounts to Rp
449,601,371,813.3
d. General Allocation Funds have a value of Rp 138,793,998,789.42
standard deviations smaller than the mean of Rp 449,601,371,813.3
showed that the data distribution tends to normal. standard deviation
(SD) is a reflection of the average deviation from the mean of the
data. SD can describe how much variation data. If the primary value
is much greater than the mean, then the mean is a poor
representation of the overall data. Whereas if the value of SD is very
small compared to the mean, the mean value can be used as a
representation of the entire data.
3. Local Government Expenditures (BD)
a. Local Government Expenditures in Lampung province have a
minimum value of Rp. 340 395 643 270. The results showed that the
lowest Local Government Expenditure in Lampung Province spent by
Metro City in 2008. This proves Metro city with areas that are not so
vast and sparsely populated compared to the number of districts / cities
in Lampung Province. Local expenditures financed with funds
amounting to Rp 340,395,643,270.

52
b. Expenditures have a maximum value of Rp 1,107,661,964,000. The
research results has shown that the highest Local Government
Expenditures in Lampung province has been spent by the Lampung
Selatan district in 2010. This proves the Lampung Selatan has the
highest expenditures compared to other districts / cities.
c. Expenditures in the Lampung Province have an average value (mean)
for three years amounting to Rp 700.327.740.680.0
d. Local Government Expenditures have a standard deviation value of
Rp. 174.920.496.558.99 smaller than the mean of Rp
700.327.740.680.0 shows that the distribution of the data tends to be
normal.
C. Analysis and Discussion
1. Classic Assumption Test
Classic assumption test consists of normality test,
multicollinearity test, autocolleration test, heterocedacity test.
a. Normality Test
This test is used to produce a more detailed figures, whether a
regression equation that used escape normality test. A regression
equation is said to escape normality if the value of the Kolmogorov-
Smirnov significance greater than 0.05.
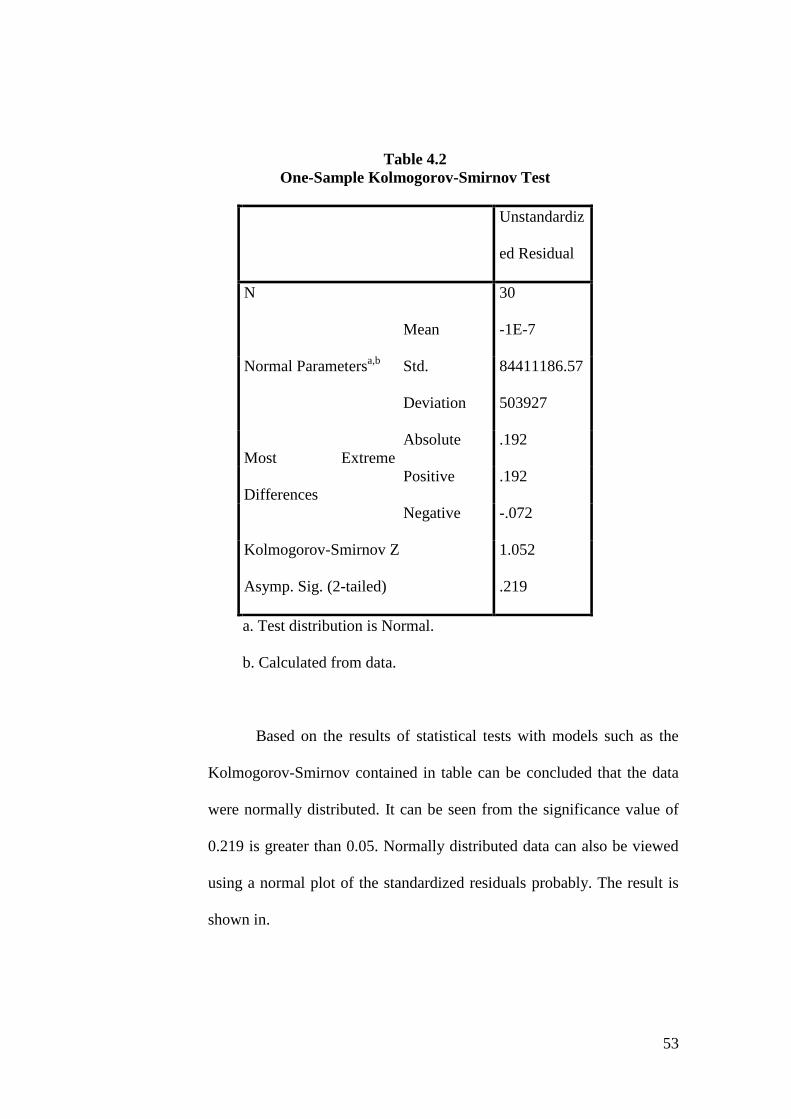
53
Table 4.2
One-Sample Kolmogorov-Smirnov Test
Unstandardiz
ed Residual
N 30
Normal Parametersa,b
Mean -1E-7
Std.
Deviation
84411186.57
503927
Most Extreme
Differences
Absolute .192
Positive .192
Negative -.072
Kolmogorov-Smirnov Z 1.052
Asymp. Sig. (2-tailed) .219
a. Test distribution is Normal.
b. Calculated from data.
Based on the results of statistical tests with models such as the
Kolmogorov-Smirnov contained in table can be concluded that the data
were normally distributed. It can be seen from the significance value of
0.219 is greater than 0.05. Normally distributed data can also be viewed
using a normal plot of the standardized residuals probably. The result is
shown in.
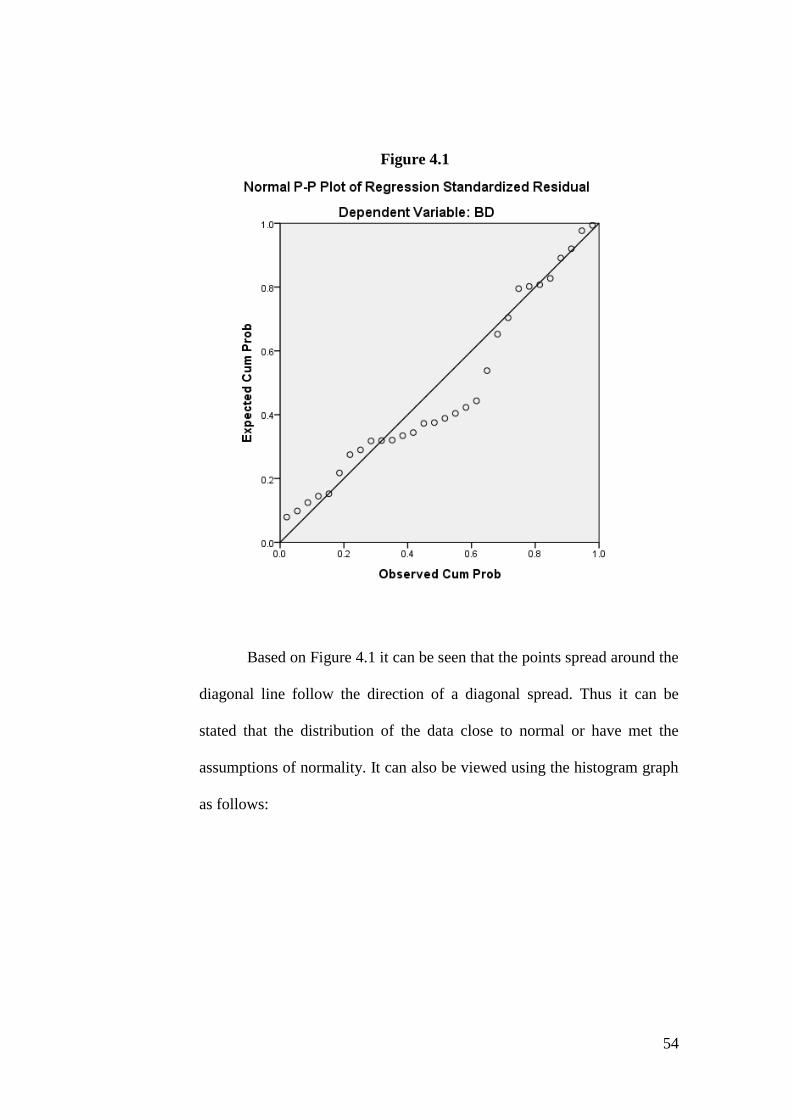
54
Figure 4.1
Based on Figure 4.1 it can be seen that the points spread around the
diagonal line follow the direction of a diagonal spread. Thus it can be
stated that the distribution of the data close to normal or have met the
assumptions of normality. It can also be viewed using the histogram graph
as follows:
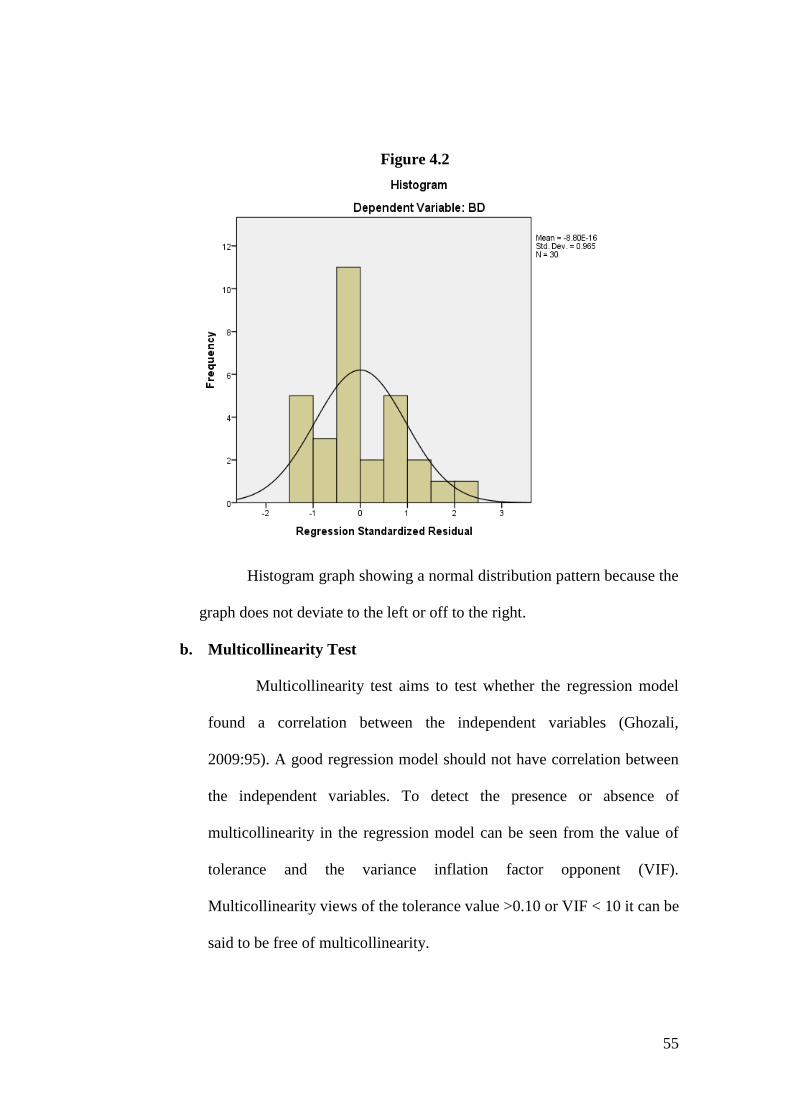
55
Figure 4.2
Histogram graph showing a normal distribution pattern because the
graph does not deviate to the left or off to the right.
b. Multicollinearity Test
Multicollinearity test aims to test whether the regression model
found a correlation between the independent variables (Ghozali,
2009:95). A good regression model should not have correlation between
the independent variables. To detect the presence or absence of
multicollinearity in the regression model can be seen from the value of
tolerance and the variance inflation factor opponent (VIF).
Multicollinearity views of the tolerance value >0.10 or VIF < 10 it can be
said to be free of multicollinearity.
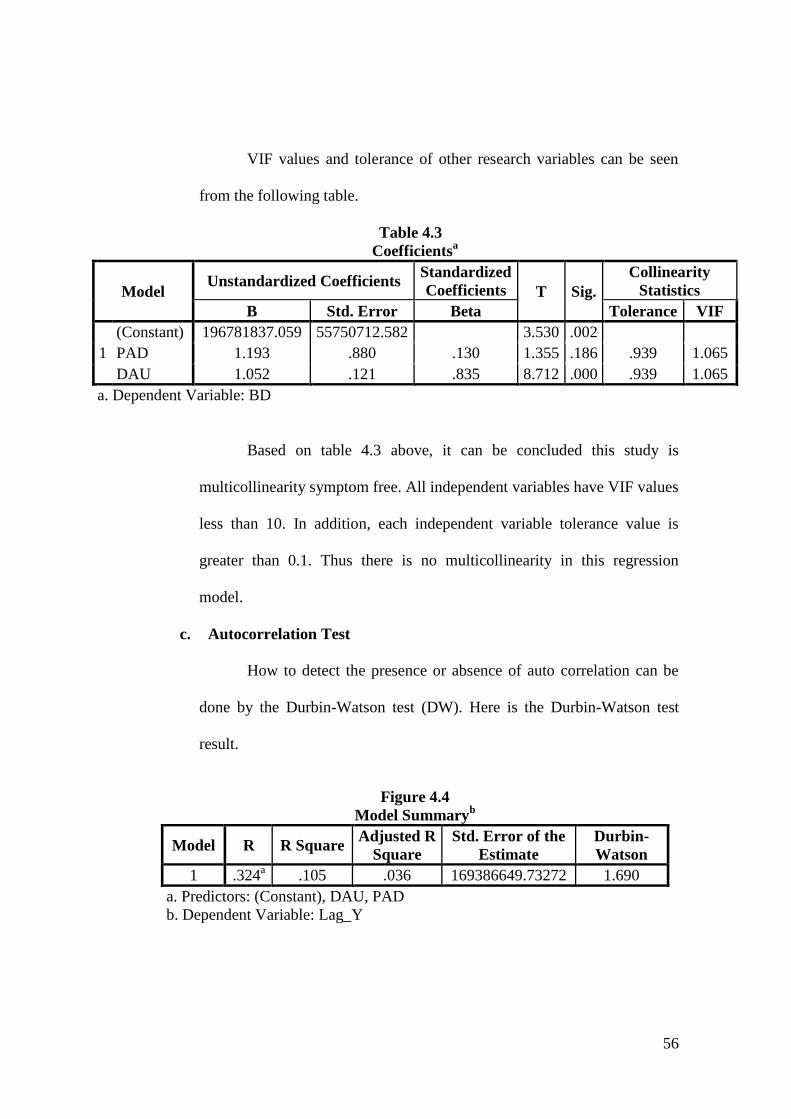
56
VIF values and tolerance of other research variables can be seen
from the following table.
Table 4.3
Coefficientsa
Model Unstandardized Coefficients
Standardized
Coefficients T Sig.
Collinearity
Statistics
B Std. Error Beta Tolerance VIF
1
(Constant) 196781837.059 55750712.582 3.530 .002
PAD 1.193 .880 .130 1.355 .186 .939 1.065
DAU 1.052 .121 .835 8.712 .000 .939 1.065
a. Dependent Variable: BD
Based on table 4.3 above, it can be concluded this study is
multicollinearity symptom free. All independent variables have VIF values
less than 10. In addition, each independent variable tolerance value is
greater than 0.1. Thus there is no multicollinearity in this regression
model.
c. Autocorrelation Test
How to detect the presence or absence of auto correlation can be
done by the Durbin-Watson test (DW). Here is the Durbin-Watson test
result.
Figure 4.4
Model Summaryb
Model R R Square Adjusted R
Square
Std. Error of the
Estimate
Durbin-
Watson
1 .324a .105 .036 169386649.73272 1.690
a. Predictors: (Constant), DAU, PAD
b. Dependent Variable: Lag_Y
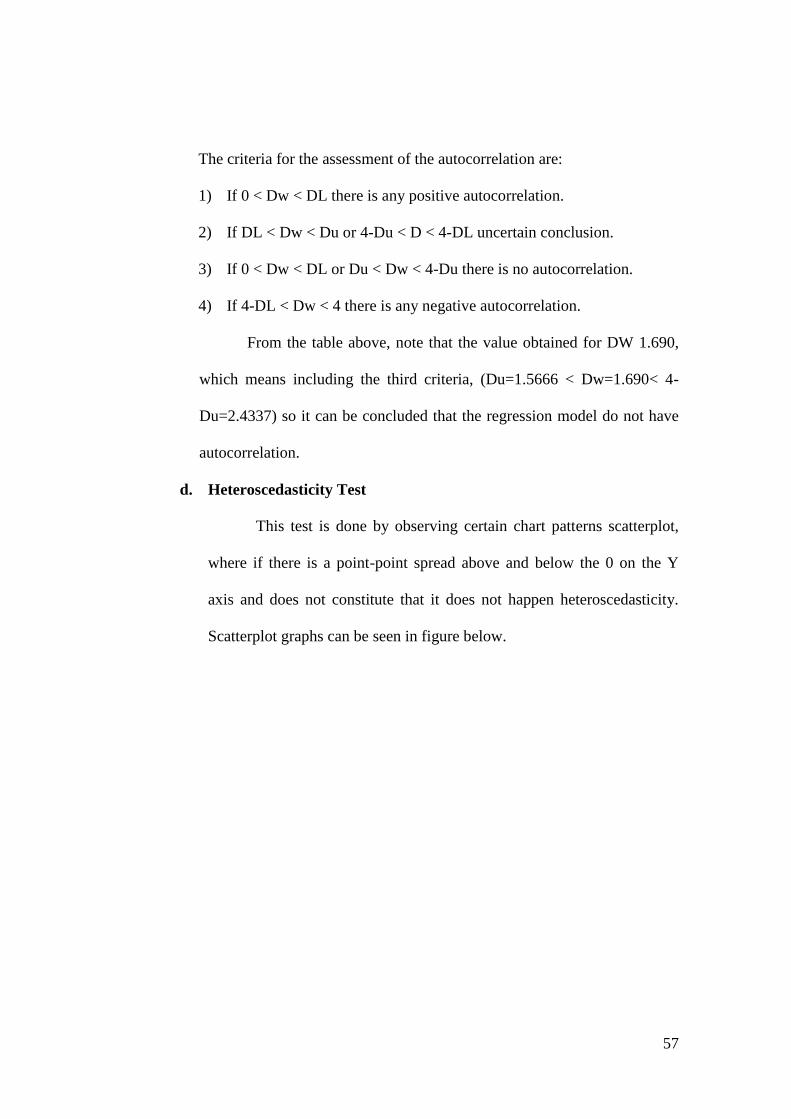
57
The criteria for the assessment of the autocorrelation are:
1) If 0 < Dw < DL there is any positive autocorrelation.
2) If DL < Dw < Du or 4-Du < D < 4-DL uncertain conclusion.
3) If 0 < Dw < DL or Du < Dw < 4-Du there is no autocorrelation.
4) If 4-DL < Dw < 4 there is any negative autocorrelation.
From the table above, note that the value obtained for DW 1.690,
which means including the third criteria, (Du=1.5666 < Dw=1.690< 4-
Du=2.4337) so it can be concluded that the regression model do not have
autocorrelation.
d. Heteroscedasticity Test
This test is done by observing certain chart patterns scatterplot,
where if there is a point-point spread above and below the 0 on the Y
axis and does not constitute that it does not happen heteroscedasticity.
Scatterplot graphs can be seen in figure below.
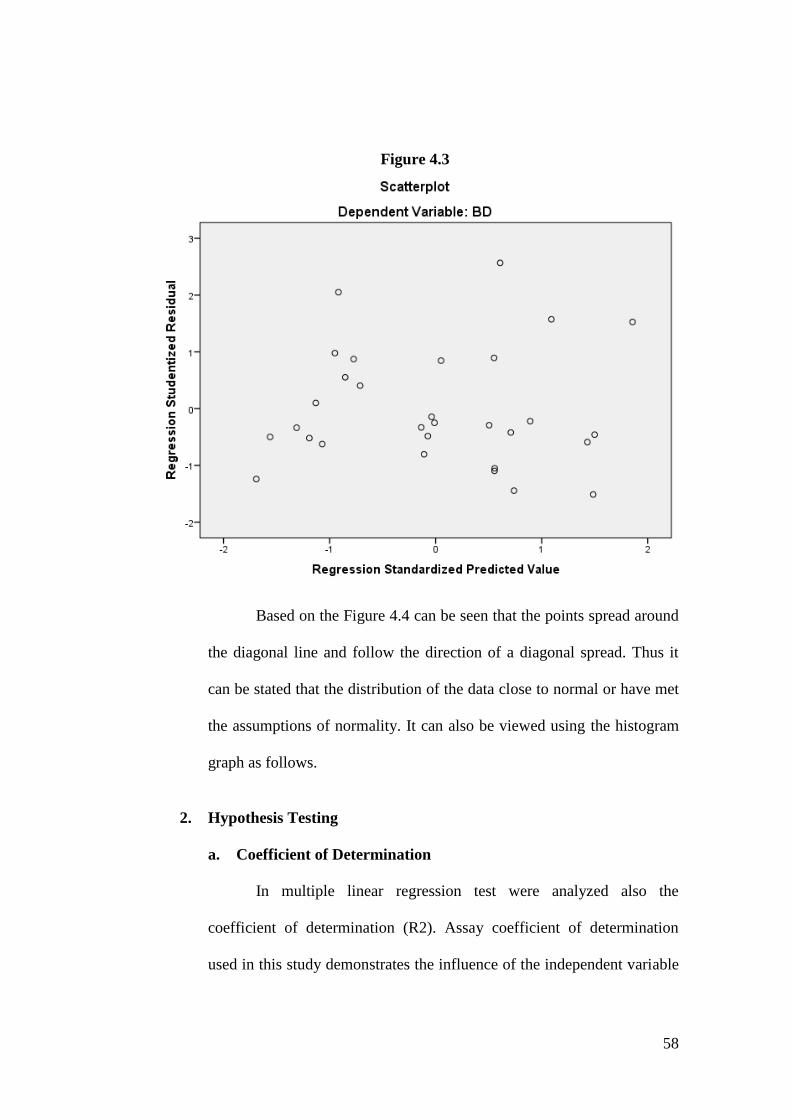
58
Figure 4.3
Based on the Figure 4.4 can be seen that the points spread around
the diagonal line and follow the direction of a diagonal spread. Thus it
can be stated that the distribution of the data close to normal or have met
the assumptions of normality. It can also be viewed using the histogram
graph as follows.
2. Hypothesis Testing
a. Coefficient of Determination
In multiple linear regression test were analyzed also the
coefficient of determination (R2). Assay coefficient of determination
used in this study demonstrates the influence of the independent variable
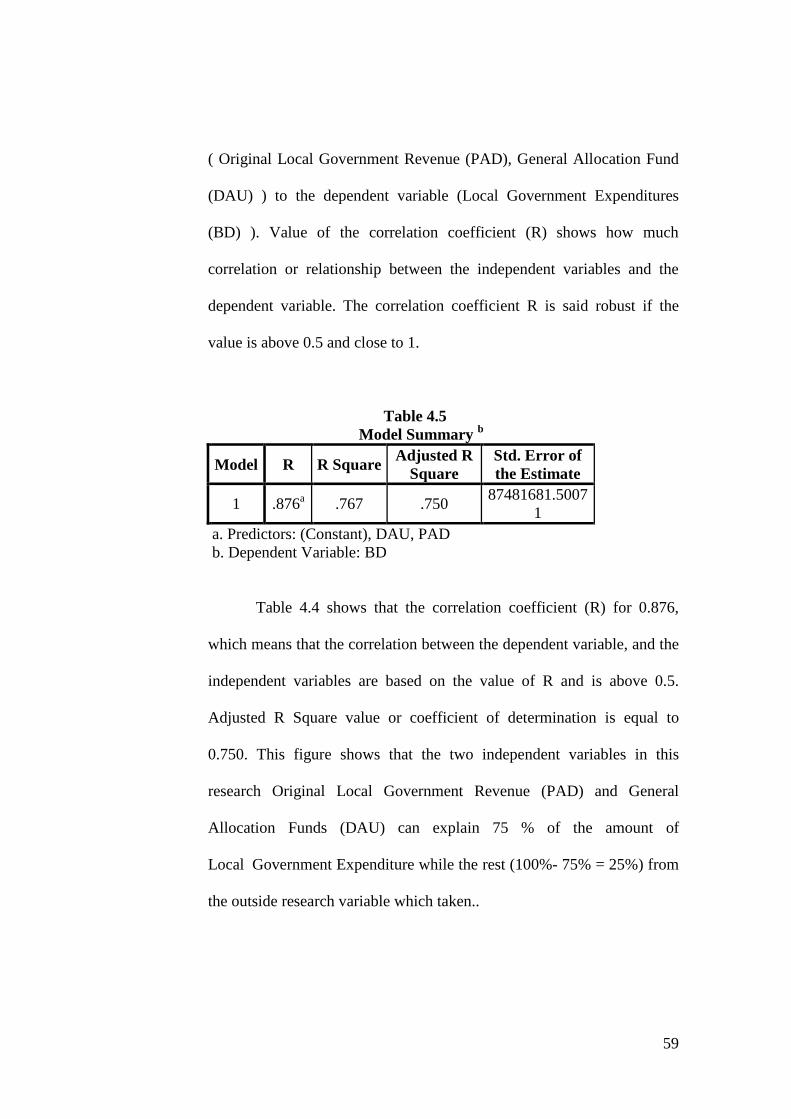
59
( Original Local Government Revenue (PAD), General Allocation Fund
(DAU) ) to the dependent variable (Local Government Expenditures
(BD) ). Value of the correlation coefficient (R) shows how much
correlation or relationship between the independent variables and the
dependent variable. The correlation coefficient R is said robust if the
value is above 0.5 and close to 1.
Table 4.5
Model Summary b
Model R R Square Adjusted R
Square
Std. Error of
the Estimate
1 .876a .767 .750
87481681.5007
1
a. Predictors: (Constant), DAU, PAD
b. Dependent Variable: BD
Table 4.4 shows that the correlation coefficient (R) for 0.876,
which means that the correlation between the dependent variable, and the
independent variables are based on the value of R and is above 0.5.
Adjusted R Square value or coefficient of determination is equal to
0.750. This figure shows that the two independent variables in this
research Original Local Government Revenue (PAD) and General
Allocation Funds (DAU) can explain 75 % of the amount of
Local Government Expenditure while the rest (100%- 75% = 25%) from
the outside research variable which taken..
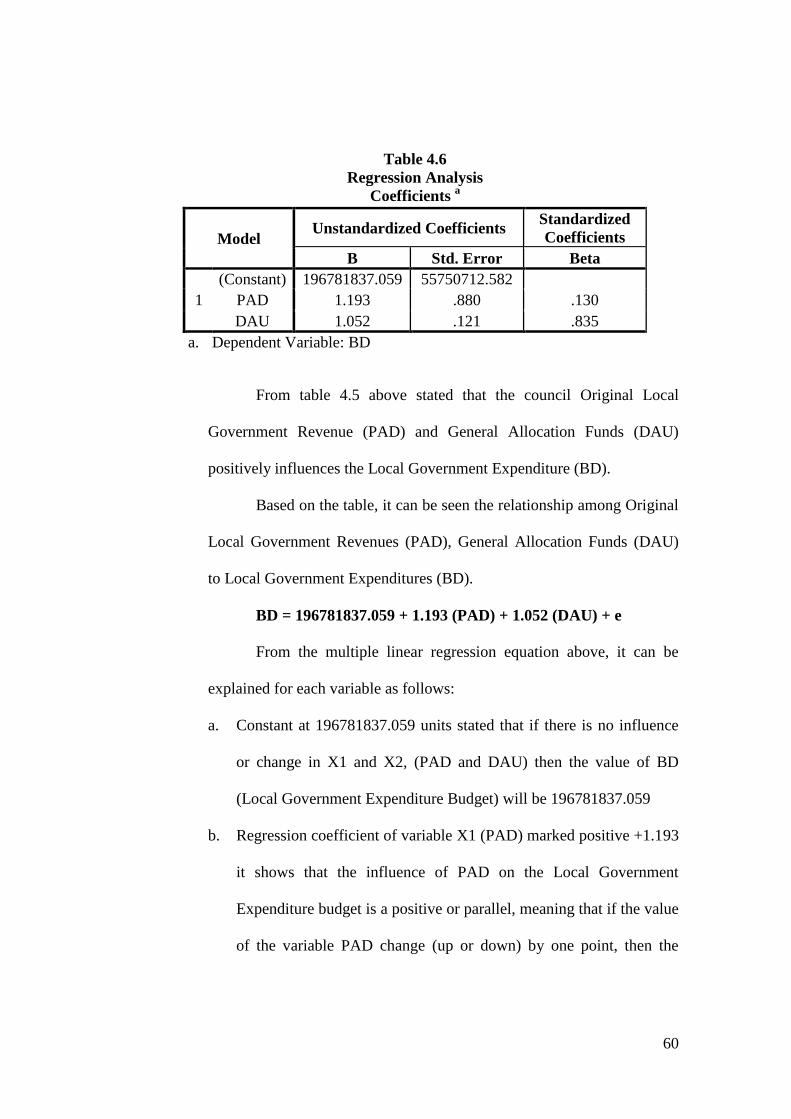
60
Table 4.6
Regression Analysis
Coefficients a
Model Unstandardized Coefficients
Standardized
Coefficients
B Std. Error Beta
1
(Constant) 196781837.059 55750712.582
PAD 1.193 .880 .130
DAU 1.052 .121 .835
a. Dependent Variable: BD
From table 4.5 above stated that the council Original Local
Government Revenue (PAD) and General Allocation Funds (DAU)
positively influences the Local Government Expenditure (BD).
Based on the table, it can be seen the relationship among Original
Local Government Revenues (PAD), General Allocation Funds (DAU)
to Local Government Expenditures (BD).
BD = 196781837.059 + 1.193 (PAD) + 1.052 (DAU) + e
From the multiple linear regression equation above, it can be
explained for each variable as follows:
a. Constant at 196781837.059 units stated that if there is no influence
or change in X1 and X2, (PAD and DAU) then the value of BD
(Local Government Expenditure Budget) will be 196781837.059
b. Regression coefficient of variable X1 (PAD) marked positive +1.193
it shows that the influence of PAD on the Local Government
Expenditure budget is a positive or parallel, meaning that if the value
of the variable PAD change (up or down) by one point, then the
61
value of Local Government Expenditure budget would up or down
by +1.193 assuming variables X2 remain or unchanged.
c. Regression coefficient of variable X2 (DAU) marked positive
+1.052 it shows that the influence of DAU on the Local Government
Expenditure budget is a positive or parallel, meaning that if the value
of the variable DAU change (up or down) by one point, then the
value of Local Government Expenditure budget would up or down
by +1.052 assuming variables X1 remain or unchanged.
b. Simultaneous Significant Test (F-Test)
The significance of the regression model simultaneously was
tested by looking at the significant value (sig). Significance value (sig)
would be seen, whereby if a significance value below 0.05 then the
independent variables influence the dependent variable is declared. The
test is performed with the following conditions: If the Significant value
(sig) > 0.05, then H3 is rejected, if the Significant value (sig) < 0.05, then
H3 is accepted.

62
Table 4.7
F – Test
ANOVA a
Model Sum of
Squares Df
Mean
Square F Sig.
1
Regression 680686019225
658370.000 2
34034300961
2829180.000 44.472 .000
b
Residual 206632204151
176512.000 27
76530445981
91723.000
Total 887318223376
834820.000 29
a. Dependent Variable: BD
b. Predictors: (Constant), DAU, PAD
The third hypothesis states that the "Original Local Government
Revenue (PAD) and the General Allocation Funds (DAU), has a
simultaneous significant imply to Local Government Expenditures".
There are two ways to test the third hypothesis: 1. Statistical tests show a
significance level of 0.000. The General Allocation Funds are less than
the significance level of 0.05 in order to prove that the PAD and DAU
affects significantly to the Local Government Expenditures. 2. We
compare the statistic result to F table from the table we can see that Ftest
44.472> Ftable 33.541 from the data prove that the PAD and DAU
affects significantly to the Local Government Expenditures so the third
hypothesis is accepted.
The results are consistent with Mangkukusumo (2012), who
claimed to have shown that the simultaneous Original Local Government
Revenues and General Allocation Funds have a significant positive effect
on the allocation of expenditures. District / City Government with high
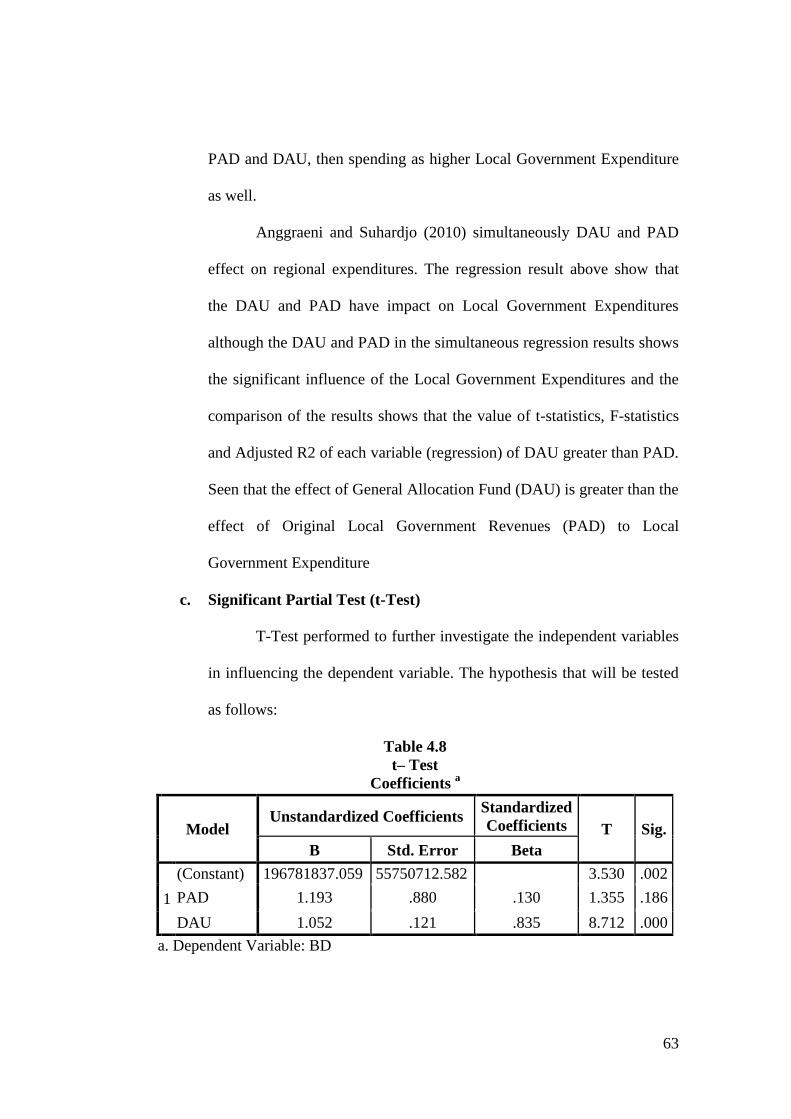
63
PAD and DAU, then spending as higher Local Government Expenditure
as well.
Anggraeni and Suhardjo (2010) simultaneously DAU and PAD
effect on regional expenditures. The regression result above show that
the DAU and PAD have impact on Local Government Expenditures
although the DAU and PAD in the simultaneous regression results shows
the significant influence of the Local Government Expenditures and the
comparison of the results shows that the value of t-statistics, F-statistics
and Adjusted R2 of each variable (regression) of DAU greater than PAD.
Seen that the effect of General Allocation Fund (DAU) is greater than the
effect of Original Local Government Revenues (PAD) to Local
Government Expenditure
c. Significant Partial Test (t-Test)
T-Test performed to further investigate the independent variables
in influencing the dependent variable. The hypothesis that will be tested
as follows:
Table 4.8
t– Test
Coefficients a
Model Unstandardized Coefficients
Standardized
Coefficients T Sig.
B Std. Error Beta
1
(Constant) 196781837.059 55750712.582 3.530 .002
PAD 1.193 .880 .130 1.355 .186
DAU 1.052 .121 .835 8.712 .000
a. Dependent Variable: BD
64
a. Original Local Government Revenues (H1) variable has a
significance level 0.186 larger than the significance standard level
0.05. This indicated that there is no significant Original Local
Government Revenues on the Local Government Expenditures (BD).
Thus, the first hypothesis (H1), which states Original Local
Government Revenues (PAD) have no a significant effect Local
Government Expenditures can be accepted. The result is consistent
with research Maemunah (2006) and Anggraeni, Suhardjo (2010)
states that the Original Local Government Revenue has no
significant influence to Local Government Expenditure.
Mangkukusumo (2012) stated that the Original Local
Government positive influence on the allocation of expenditures.
The number of districts / city governments with PAD are high, then
the expenditures same with the high Local Government Expenditures
as well. Friedman (1978) in Bambang Prakosa (2004) states that the
increase in taxes will also raise the expenditures and original local
government revenues increase as well.
This is due to the fact that Original Local Government
Revenues are earned from the region itself, for example, results
Local Taxes, Retribution, Income Results Separated Regions Wealth
Management, Revenue of Regional Income and Other Income, Legal
(Mardiasmo, 2002) Accordance with the result above, if there is an
increase in the number of PAD, there will be an increase also in the
65
number of Local Government Expenditures that will be issued by the
Provincial Governments, Districts / Cities.
b. The second hypothesis states that "the General Allocation Funds
(DAU) was significantly positive for Local Government
Expenditures (BD)". Statistical test results show a significant level of
0.000 General Allocation Funds is less than the significant level of
0.05 in order to prove that the DAU significant effect on Local
Government Expenditures. The results are consistent with research
Anggraeni and Suhardjo (2010) which states affect the General Fund
Expenditure Allocation District / town in Central Java Province. If
there is an increase in the number of DAU, there will be an increase
also in the number of Local Government Expenditures that will be
issued by the Provincial Government, District / City.
Mangkukusumo (2012) stated that the General Allocation
Funds have a significant positive effect on the allocation of Local
Government Expenditures. District / city that has a high DAU, the
spending as higher Local Government Expenditure as well.
Statement of Abdul Halim (2009) states that the General
Allocation Funds are general transfers from the central government
to local governments to solving horizontal inequalities problem, the
main objective is equalization financial capabilities among local
government (provinces, districts and cities). In accordance with the
above results, the higher the General Allocation Funds obtained from
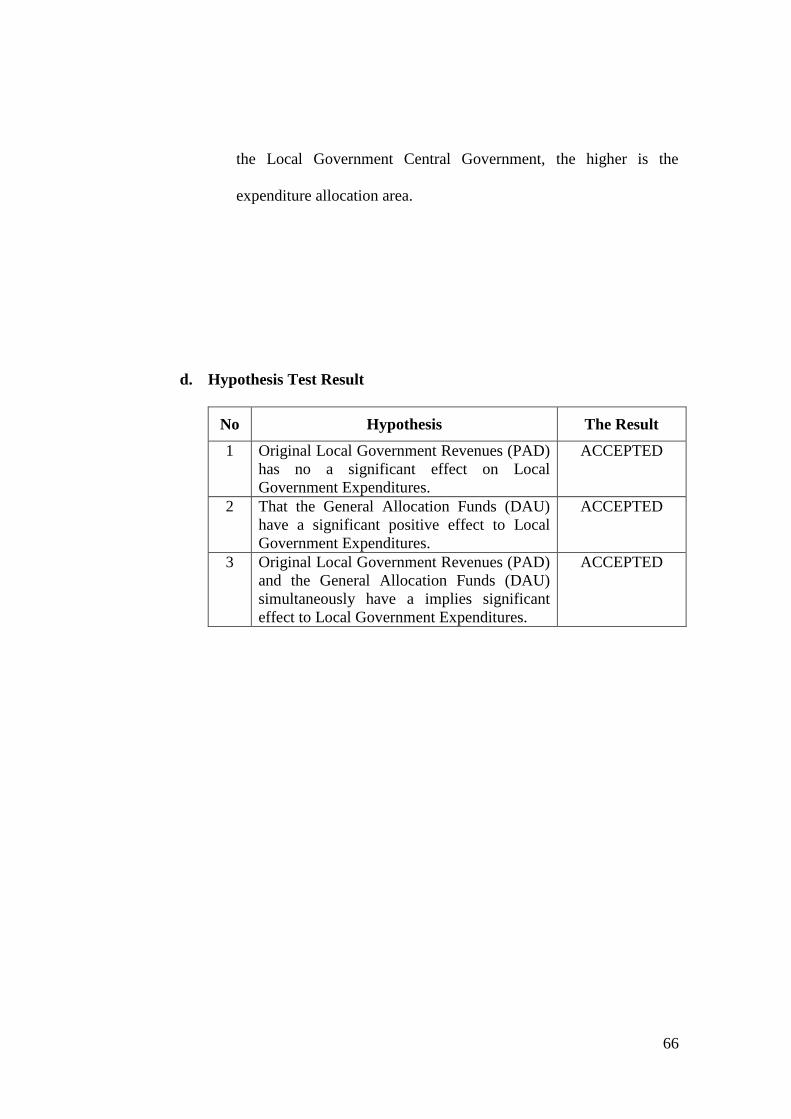
66
the Local Government Central Government, the higher is the
expenditure allocation area.
d. Hypothesis Test Result
No Hypothesis The Result
1 Original Local Government Revenues (PAD)
has no a significant effect on Local
Government Expenditures.
ACCEPTED
2 That the General Allocation Funds (DAU)
have a significant positive effect to Local
Government Expenditures.
ACCEPTED
3 Original Local Government Revenues (PAD)
and the General Allocation Funds (DAU)
simultaneously have a implies significant
effect to Local Government Expenditures.
ACCEPTED
67
CHAPTER V
CONCLUSIONS AND RECOMENDATIONS
A. Conclusions
It has been described in the previous chapters that this research
analyze have effects on the General Allocation Funds (DAU), the Original
Local Government Revenues (PAD) and Local Government Expenditures in
10 Districts/cities in Lampung province during 2008 until 2010. Local
Government Expenditures are local government expenditures within a budget
period included in the Local Government Revenue and Expenditure Budget
(APBD).
1. This research founds that local government revenues (PAD) has no a
significant effect to Local Government Expenditures. The higher the
PAD in Local Government Revenue and Expenditure Budget (APBD)
the allocation of local government expenditures is higher as well. The
General Allocation Funds (DAU) has a significant effect on the Local
Expenditures (BD). Local Government Revenue and Expenditure budget
(APBD) Local Government Revenue and Expenditure budget (APBD)
with higher DAU will have higher Local Government Expenditures
(BD). This research has discovered that Original Local Government
Revenues (PAD) and the General Allocation Funds (DAU) have a
simultaneously impact on Local Government Expenditures (BD).
68
2. Flypaper effects were found in 10 districts / cities in the Lampung
province by analyzing the composition of the Local Government
Revenue and Expenditure Budget (APBD) between the PAD, and the
Balanced Budget.
B. Recommendations
1. Local Government
Since there could be found a Flypaper effect in 10 districts /
cities in the Lampung province by analyzing the composition of the
Local Government Revenue and Expenditure Budget (APBD) between
the PAD, and the Balanced Budget. The basic function of Balanced
Budget serves as a transfer of funds from the central government from
the state budget to cover the fiscal gap, but in fact it has become the
main source of local government revenues. It is suggested that local
governments should get enabled to identify area potential in order to find
their opportunities for revenues, they are able to exploit.
a. Improving PAD strategy
Original Local Government Revenues (PAD) are
spearheading the organization of local governments, various
government activities both principal and co-administration tasks
must be balanced by the sufficient amount of PAD as the locomotive
for local government programs. In order to the presence of PAD the
amount of local government expenditures need to not excess the
69
original local government revenues, management strategies are
required. Special focus should be paid to the increase of Original
Local Government Revenues (PAD) and could be stated as follows:
1). Local taxes
a). give taxes and retributions which are still held by the
Central government to local government by considering the
factors of economic efficiency, mobility and object tax
stabilization and distribution functions of the tax itself. The
taxes include:
i. The land and building tax (PBB) and Tax on Acquisition
of Land & Buildings (BPHTB) can be diverted to areas
where the foundation is authorized to establish taxes rate
and tariffs at a certain level though its administration
still done by the Centre.
ii. Income Tax (PPH) can be transferred in the form of
piggy back where the local government has the rights to
set their tax policy according to regional consideration (
economic situation ) ,under supervision of central
government.
iii. Re-collecting taxpayer's data and the tax object in the
framework of exploring the potential of the region as
well as improve services or facilities that can be enjoyed
by the citizen and government. For a example, by
70
providing online services in the tax system in order to
improving efficiency and decreasing collection tax cost .
We expect cost of tax collection not exceed the amount
of tax itself.
iv. The local government should try the new type of Local
Tax and Retributions in order to local government
increase the Original Local Government Revenue
(PAD).
2). Regional Owned Enterprise (BUMD)
Besides optimising local tax and retribution revenues,
the local government should be more creative in maximizing
the original local government revenues. Regional Owned
Enterprise (BUMD) is one of solutions due to providing benefit
to local governments in the form of tax and dividend.
a. Regional Owned Enterprises (BUMD) should be
empowered to act as supporters for the local government
income in the form of taxes or dividends and should
encourage the growth of the regional economy through the
multiplier effect in view of efficiency in business activities
as well as in increasing employment and social care
b. steps to improve the performance of enterprises,
introducing or changing control mechanism, licensing,
regulations. This means the Local Government as
71
shareholder could determine quantitative and qualitative
targets by setting performance indicators such as Return On
Equity (ROE).
c. Empowering enterprises to generate profit or income as
well as to contribute to the local government that can be
done as follows:
i. Perform the process of restructuring the company as a
whole by improving the competence and quality
management of Human Resources.
ii. Directing enterprises to do business in a focused
transparent and professional way;
iii. Empowering the Board of Directors and the Supervisory
Board d through the fit and proper test.
iv. Formulate policies directed to a reasonable increase of
rates and product price (at least adjusting for inflation,
electricity, fuel, etc.).
3). Policy Side of User
a). Empower the society and respective NGOs to control the
the financial management of the local government by
implementation of principles of transparency and fiscal
accountability.
b). Provide clear guidance regarding the budget allocation of
the revenues source either PAD or transfer center. The role
72
of central government is limited in giving guidance
regarding the action that local government should do. All
decisions concerning the implementation of budget
allocation mechanism become the local government
authority based on the regional autonomy concept. The
budget allocation guidance given by the central government
is the guideline for Local Government Revenue (PAD) in
the field of salary payments of local government officials
throughout Indonesia. When there is an excess amount
from PAD, it can be used for regional wealth. Meanwhile,
General Allocation Funds (DAU) is spent for the local
government official allowance, public services, and short-
term development projects. In the other hand, the main
purpose of DAK is to support the national programs and to
achieve minimum service standard in each region. The
long-term development programs use the sources from
deconcentration funds and provincial assistance and
technical secretary
c). This research was expected to be a critic for local
government’s regional autonomy concept implementation
on original local government revenue (PAD) as the main
source local government revenue, so local government can
73
maximize their local economic potential and become
independent from central government transferred fund.
2. For the Further Research:
a. Future researchers need to extend the sample size to other provinces
in order to get a representative result for all Indonesia.
b. Extending the independent variables in terms of size and type of
Original Local Government Revenues (PAD), or adding non-
financial variables such as government policy, macroeconomics
condition, etc.
c. The next research should apply the other variables that might also
affect local government expenditures such as local tax, special
allocation funds (DAK), etc.
74
REFERENCES
Abdullah, Syukriy dan Halim Abdul, 2004. “Pengaruh Dana Alokasi Umum
(DAU) dan Pendapatan Asli Daerah (PAD) terhadap Belanja Pemerintah
Daerah : Studi Kasus Kabupaten/ Kota di Jawa dan Bali”, Proceeding
Simposium Nasional Akuntansi VI, 16-17 Oktober 2003, Surabaya.
Bastian, Indra. (2002), Sistem Akuntansi Sektor Publik, Jakarta : Salemba Empat
Ghozali, Imam, 2005. Aplikasi Analisis Multivariate dengan Program SPSS.,
Badan penerbit Universitas Dipnegoro, Semarang
Ghozali, Imam, Arifin Sabeni, 1997. Pokok-pokok Akuntansi Pemerintahan. Edisi
4. Penerbit BPFE: Yogyakarta.
Halim, Abdul, 2004. Akuntansi Keuangan Daerah, Edisi Revisi, Salemba Empat,
Jakarta.
Halim, Abdul & Syukriy Abdullah. 2006. Hubungan dan masalah keagenan di
pemerintahan daerah: sebuah peluang penelitian anggaran dan akuntansi.
Jurnal Akuntansi Pemerintah 2(1): 53-64.
Kawedar, Warsito, Abdul Rohman, dan Sri Handayani. 2007. Akuntansi Sektor
Publik: Pendekatan Penganggaran Daerah dan Akuntansi Keuangan
Daerah. Penerbit UNDIP: Semarang.
Maimunah, Mutiara, Flypaper Effect pada Dana Alokasi Umum (DAU) dan
Pendapatan Asli Daerah (PAD) terhadap Belanja Daerah Pada
Kabupaten/Kota Di Pulau Sumatra, Simposium Nasional Akuntansi IX,
Padang 23-26 Agustus 2006.
Mardiasmo. 2002. Akuntansi sector publik. Yogyakarta: Penerbit Andi.
McCandless, Henry. 2009. Public Accountability and Holding to Account Article.
http://www.centreforpublicaccountability.org/holding-to-account/
Oates, Wallace. 1999. An essay of fiscal federalism. Journal of Economics
Literature37: 1120-1149.
Prakosa, Kesit Bambang. (Desember 2004), Jurnal Ilmiah “Analisis Pengaruh
Dana Alokasi Umum (DAU) dan Pendapatan Asli Daerah (PAD)
terhadap Prediksi Belanja Daerah (Studi Empirs di Wilayah Propinsi
Jawa Tengah dan DIY)”, JAAI Vol 08 No 2
Puspita Sari, Noni dan Idhar Yahya. (2009), Jurnal Ilmiah “Pengaruh Dana
Alokasi Umum (DAU) dan Pendaptan Asli Daerah (PAD) Terhadap
Belanja Langsung”, Sumatera Utara : Universitas Sumatera Utara
75
Pratiwi, Noni. (2007), jurnal ilmiah “Pengaruh Dana Alokasi Umum (DAU) Dan
Pendapatan Asli Daerah (PAD) Terhadap Prediksi Belanja Daerah Pada
Kabupaten/Kota di Indonesia”, Yogyakarta : Universitas Islam
Indonesia
Jurusan Akuntansi Fakultas Ekonomi dan Bisnis UIN Syarif Hidayatullah, 2012.
Pedoman Penulisan Skripsi FEB 2012 Fakultas Ekonomi dan Bisnis UIN
Syarif Hidayatullah.
Badan Pusat Statistik Provinsi Lampung dan Badan Perencanaan Pembangunan
Daerah Provinsi Lampung, 2011, www.lampung.bps.go.id
Departemen Keuangan Republik Indonesia Direktorat Jenderal Perimbangan
Keuangan, Laporan Realisasi APBD, 2011, www.djpk.depkeu.go.id
Republik Indonesia, Keputusan Menteri Dalam Negeri Nomor 29 Tahun 2002
tentang Pedoman Pengurusan, Pertanggungjawaban dan Pengawasan
Keuangan Daerah Serta Tata Cara Penyusunan Anggaran Pendapatan
dan Belanja Daerah, Pelaksanaan Tata Usaha Keuangan Daerah dan
Penyusunan Perhitungan Anggaran Pendapatan dan Belanja Daerah.
----------------------, Peraturan Menteri Dalam Negeri Nomor 13 Tahun 2006
tentang Pedoman Pengelolaan Keuangan Daerah.
----------------------, Undang-Undang Nomor 32 Tahun 2004 tentang
Pemerintahan Daerah.
----------------------, Undang-Undang Nomor 33 Tahun 2004 tentang Perimbangan
antara Keuangan Pemerintahan Pusat dan Pemerintahan Daerah.
----------------------,Undang-Undang Republik Indonesia No.34 Tahun 2000
Tentang Perubahan Atas Undang-Undang Republik Indonesia No.18
Tahun 1997 Tentang Pajak Daerah dan Retribusi Daerah.
----------------------, Keputusan Dalam Negeri Nomor 29 Tahun 2002 tentang
Anggran Pendapatan dan Belanja Daerah (APBD).
----------------------, Peraturan Pemerintah pasal 26 No.58 Tahun 2005 tentang
Pengelolaan Keuangan Daerah bagian keempat tentang Belanja Daerah.

(IN THOUSAND)
APPENDIX I
76
KABUPATEN 2008 2009 2010
PAD DAU BD PAD DAU BD PAD DAU BD
lampungbarat 17,198,782.45 325,662,015.00 733,642,004.71 16,812,754.00 335,364,166.00 616,489,595.00 16,302,984.00 347,589,688.00 656,168,735.00
tanggamus 15,314,297.54 542,094,963.00 692,677,878.30 12,812,473.00 567,317,219.00 773,757,294.00 11,633,514.00 361,776,940.00 625,563,804.00
Lampung selatan 25,572,135.00 658,043,647.00 871,109,512.00 25,030,107.00 444,670,385.00 682,003,880.00 40,784,192.00 505,873,706.00 752,893,454.00
lampungtimur 26,645,226.53 529,485,333.00 695,722,623.31 18,821,941.00 537,536,893.00 860,731,706.00 20,669,866.00 543,770,666.00 1,011,710,551.00
Lampung tengah 22,837,755.00 669,102,531.00 804,566,734.00 24,471,465.00 669,111,784.00 892,417,355.00 37,086,491.00 706,861,775.00 1,107,661,964.00
lampungutara 16,531,831.00 440,124,311.00 651,148,936.00 11,794,023.00 454,517,555.00 647,894,469.00 13,499,496.00 470,729,922.00 780,201,162.00
way kanan 14,476,073.61 297,523,114.00 535,422,908.28 11,481,911.00 327,277,673.00 637,316,279.00 8,745,820.00 312,904,886.00 484,044,101.00
tulangbawang 10,437,542.07 450,771,000.00 615,158,413.14 11,396,155.00 464,051,063.00 677,329,678.00 44,498,196.00 254,712,839.00 476,366,718.00
bandarlampung 67,661,519.02 509,474,017.00 700,489,687.39 70,432,317.00 528,629,513.00 819,919,060.00 86,692,400.00 539,267,568.00 975,120,789.00
metro 19,980,632.95 209,739,407.40 340,395,643.27 21,060,410.00 227,345,552.00 420,257,503.00 27,345,198.00 256,711,023.00 471,649,783.00
total 224113556
76
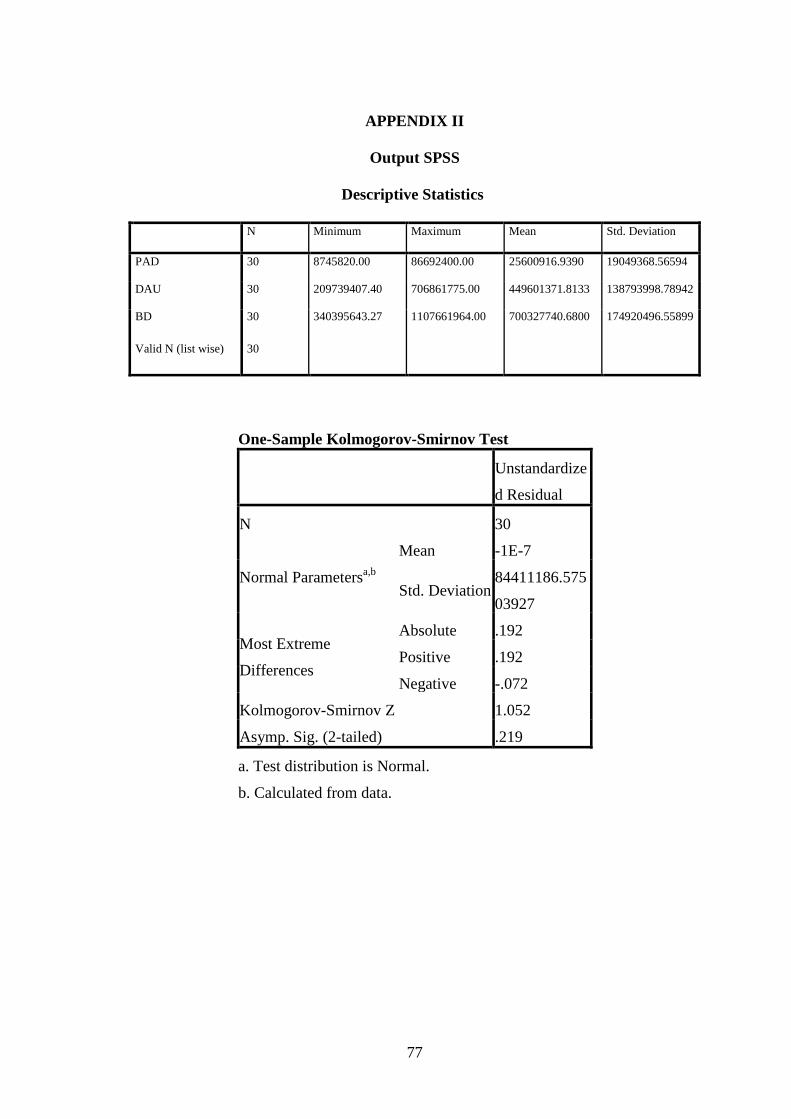
77
APPENDIX II
Output SPSS
Descriptive Statistics
N Minimum Maximum Mean Std. Deviation
PAD 30 8745820.00 86692400.00 25600916.9390 19049368.56594
DAU 30 209739407.40 706861775.00 449601371.8133 138793998.78942
BD 30 340395643.27 1107661964.00 700327740.6800 174920496.55899
Valid N (list wise) 30
One-Sample Kolmogorov-Smirnov Test
Unstandardize
d Residual
N 30
Normal Parametersa,b
Mean -1E-7
Std. Deviation 84411186.575
03927
Most Extreme
Differences
Absolute .192
Positive .192
Negative -.072
Kolmogorov-Smirnov Z 1.052
Asymp. Sig. (2-tailed) .219
a. Test distribution is Normal.
b. Calculated from data.

78
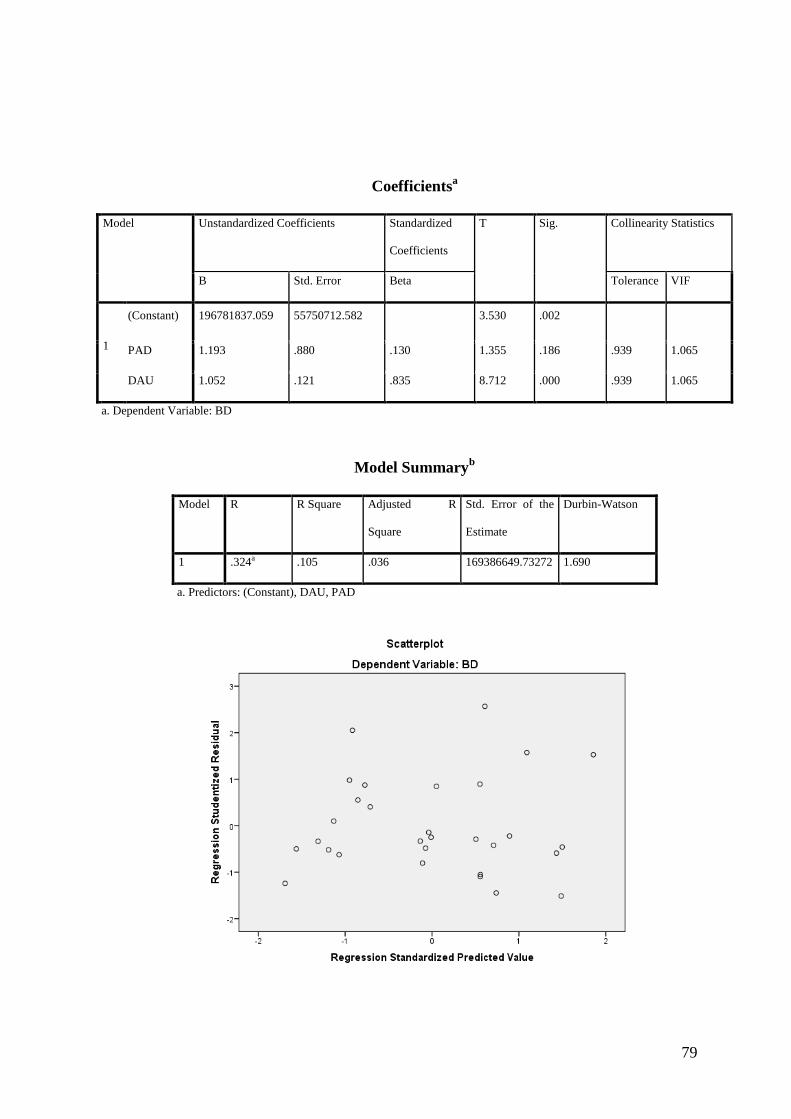
79
Model Summaryb
Model R R Square Adjusted R
Square
Std. Error of the
Estimate
Durbin-Watson
1 .324a .105 .036 169386649.73272 1.690
a. Predictors: (Constant), DAU, PAD
Coefficientsa
Model Unstandardized Coefficients Standardized
Coefficients
T Sig. Collinearity Statistics
B Std. Error Beta Tolerance VIF
1
(Constant) 196781837.059 55750712.582 3.530 .002
PAD 1.193 .880 .130 1.355 .186 .939 1.065
DAU 1.052 .121 .835 8.712 .000 .939 1.065
a. Dependent Variable: BD
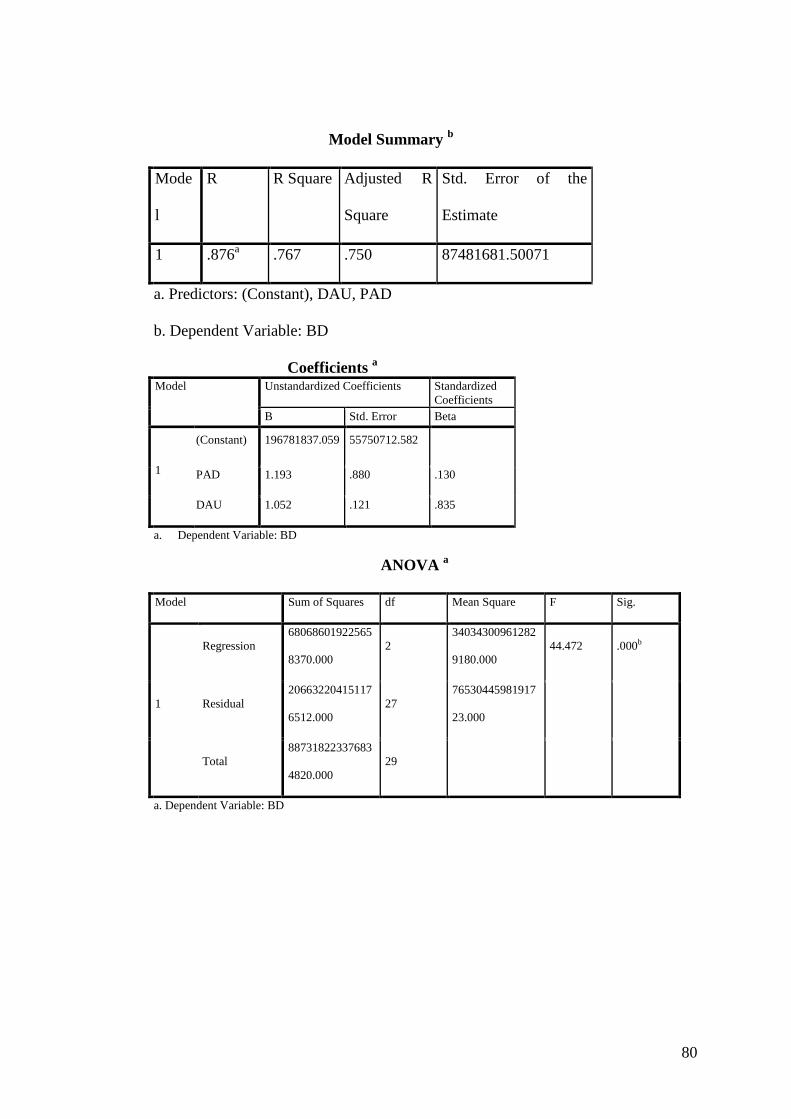
80
Model Summary b
Mode
l
R R Square Adjusted R
Square
Std. Error of the
Estimate
1 .876a .767 .750 87481681.50071
a. Predictors: (Constant), DAU, PAD
b. Dependent Variable: BD
Coefficients a
Model Unstandardized Coefficients Standardized
Coefficients
B Std. Error Beta
1
(Constant) 196781837.059 55750712.582
PAD 1.193 .880 .130
DAU 1.052 .121 .835
a. Dependent Variable: BD
ANOVA a
Model Sum of Squares df Mean Square F Sig.
1
Regression
68068601922565
8370.000
2
34034300961282
9180.000
44.472 .000b
Residual
20663220415117
6512.000
27
76530445981917
23.000
Total
88731822337683
4820.000
29
a. Dependent Variable: BD
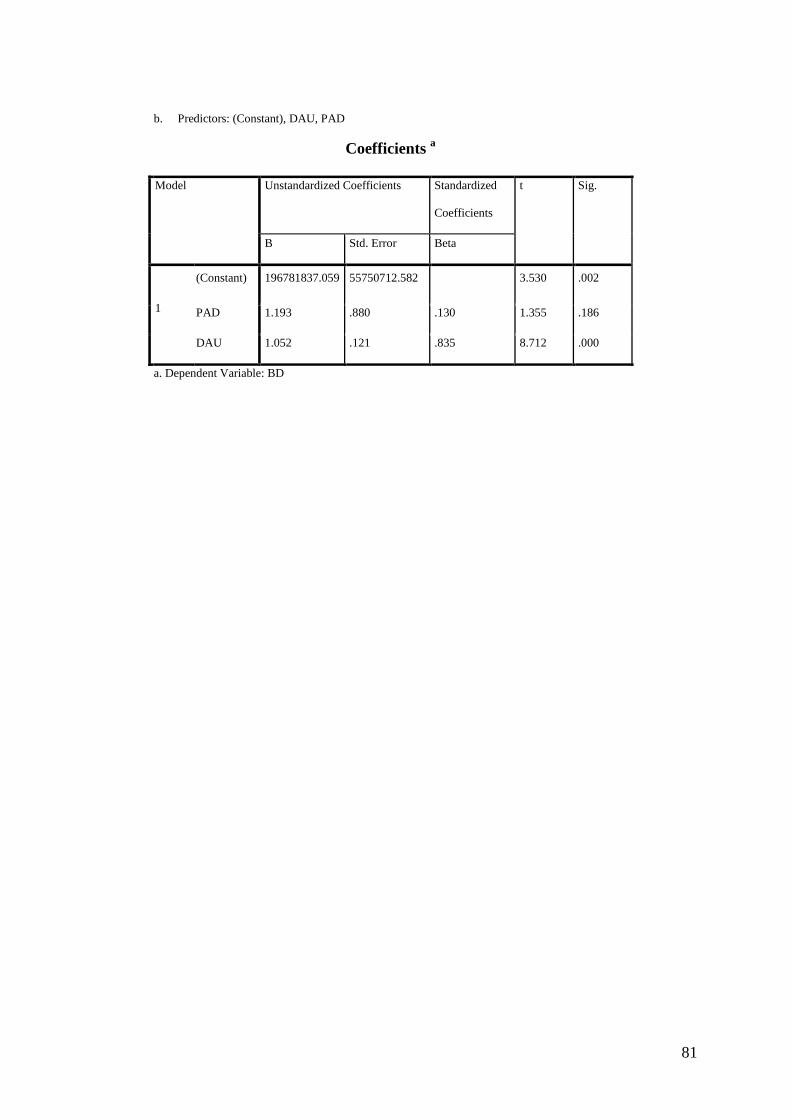
81
b. Predictors: (Constant), DAU, PAD
Coefficients a
Model Unstandardized Coefficients Standardized
Coefficients
t Sig.
B Std. Error Beta
1
(Constant) 196781837.059 55750712.582 3.530 .002
PAD 1.193 .880 .130 1.355 .186
DAU 1.052 .121 .835 8.712 .000
a. Dependent Variable: BD